content - Ministry of Petroleum and Natural Gas
222
-
Upload
khangminh22 -
Category
Documents
-
view
2 -
download
0
Transcript of content - Ministry of Petroleum and Natural Gas

Government of India


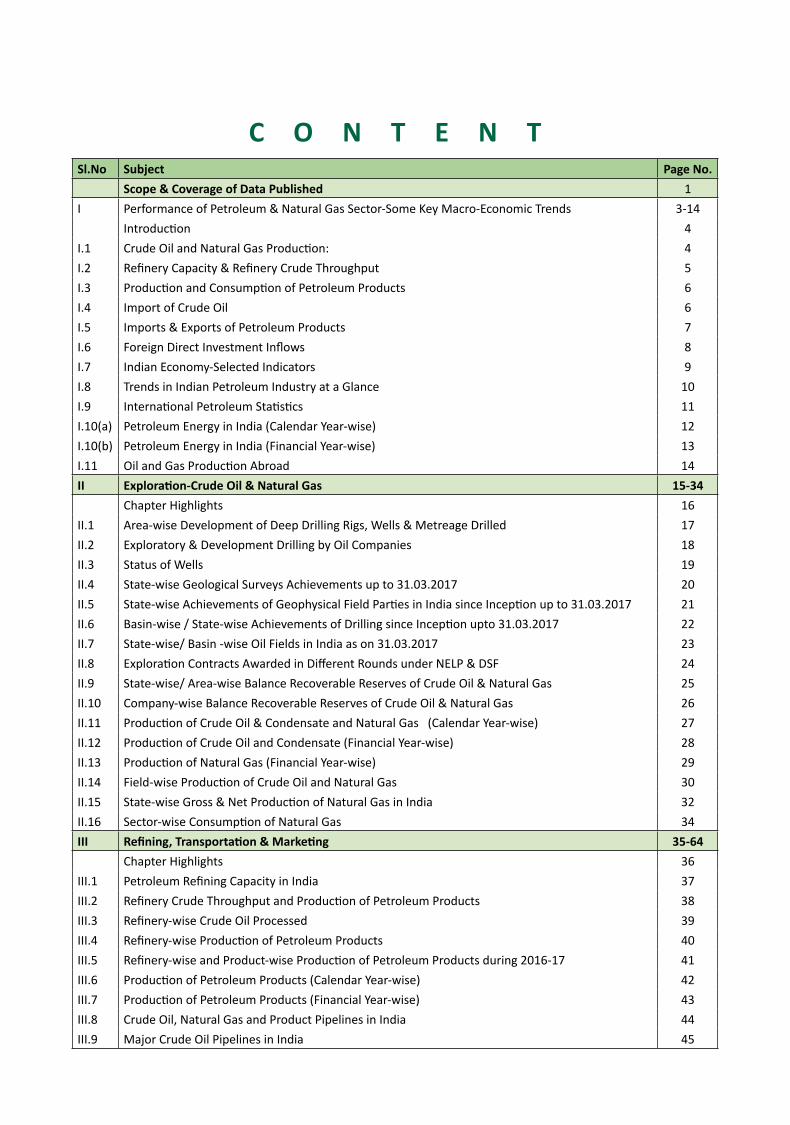
C O N T E N TSl.No Subject Page No.
Scope & Coverage of Data Published 1I Performance of Petroleum & Natural Gas Sector-Some Key Macro-Economic Trends 3-14
Introduction 4I.1 Crude Oil and Natural Gas Production: 4I.2 Refinery Capacity & Refinery Crude Throughput 5I.3 Production and Consumption of Petroleum Products 6I.4 Import of Crude Oil 6I.5 Imports & Exports of Petroleum Products 7I.6 Foreign Direct Investment Inflows 8I.7 Indian Economy-Selected Indicators 9I.8 Trends in Indian Petroleum Industry at a Glance 10I.9 International Petroleum Statistics 11I.10(a) Petroleum Energy in India (Calendar Year-wise) 12I.10(b) Petroleum Energy in India (Financial Year-wise) 13I.11 Oil and Gas Production Abroad 14II Exploration-Crude Oil & Natural Gas 15-34
Chapter Highlights 16II.1 Area-wise Development of Deep Drilling Rigs, Wells & Metreage Drilled 17II.2 Exploratory & Development Drilling by Oil Companies 18II.3 Status of Wells 19II.4 State-wise Geological Surveys Achievements up to 31.03.2017 20II.5 State-wise Achievements of Geophysical Field Parties in India since Inception up to 31.03.2017 21II.6 Basin-wise / State-wise Achievements of Drilling since Inception upto 31.03.2017 22II.7 State-wise/ Basin -wise Oil Fields in India as on 31.03.2017 23II.8 Exploration Contracts Awarded in Different Rounds under NELP & DSF 24II.9 State-wise/ Area-wise Balance Recoverable Reserves of Crude Oil & Natural Gas 25II.10 Company-wise Balance Recoverable Reserves of Crude Oil & Natural Gas 26II.11 Production of Crude Oil & Condensate and Natural Gas (Calendar Year-wise) 27II.12 Production of Crude Oil and Condensate (Financial Year-wise) 28II.13 Production of Natural Gas (Financial Year-wise) 29II.14 Field-wise Production of Crude Oil and Natural Gas 30II.15 State-wise Gross & Net Production of Natural Gas in India 32II.16 Sector-wise Consumption of Natural Gas 34III Refining, Transportation & Marketing 35-64
Chapter Highlights 36III.1 Petroleum Refining Capacity in India 37III.2 Refinery Crude Throughput and Production of Petroleum Products 38III.3 Refinery-wise Crude Oil Processed 39III.4 Refinery-wise Production of Petroleum Products 40III.5 Refinery-wise and Product-wise Production of Petroleum Products during 2016-17 41III.6 Production of Petroleum Products (Calendar Year-wise) 42III.7 Production of Petroleum Products (Financial Year-wise) 43III.8 Crude Oil, Natural Gas and Product Pipelines in India 44III.9 Major Crude Oil Pipelines in India 45
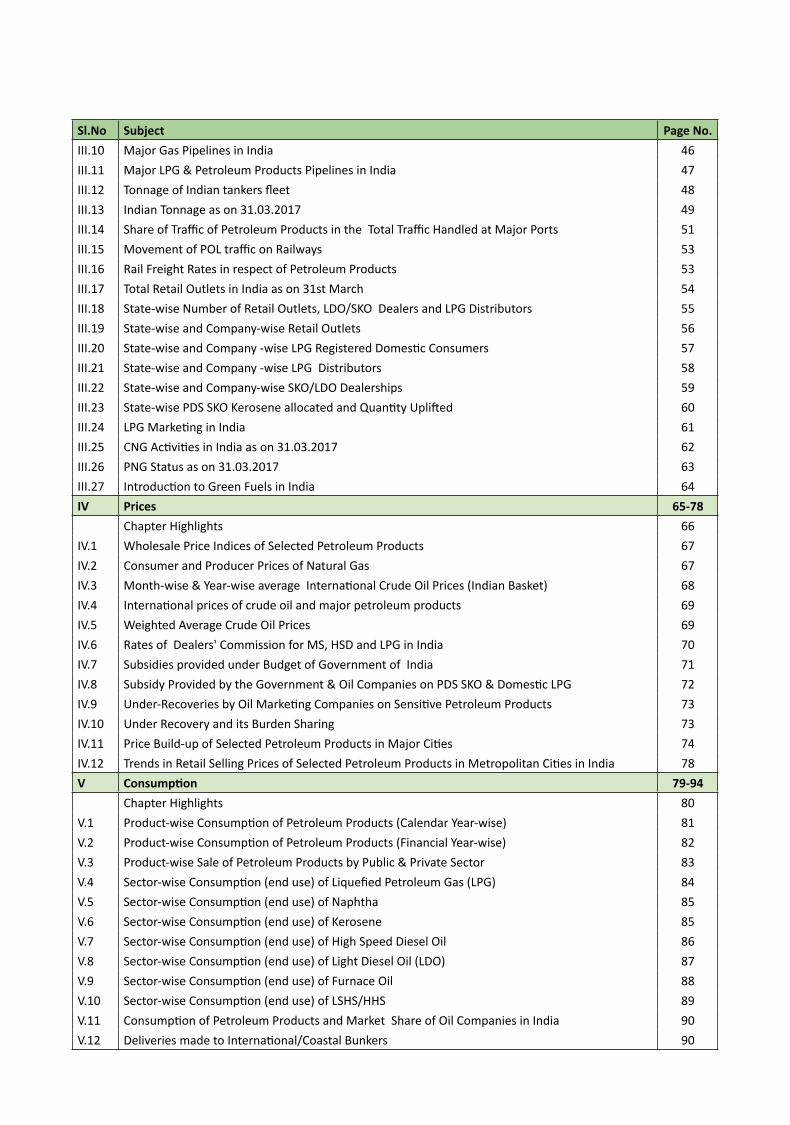
Sl.No Subject Page No.III.10 Major Gas Pipelines in India 46III.11 Major LPG & Petroleum Products Pipelines in India 47III.12 Tonnage of Indian tankers fleet 48III.13 Indian Tonnage as on 31.03.2017 49III.14 Share of Traffic of Petroleum Products in the Total Traffic Handled at Major Ports 51III.15 Movement of POL traffic on Railways 53III.16 Rail Freight Rates in respect of Petroleum Products 53III.17 Total Retail Outlets in India as on 31st March 54III.18 State-wise Number of Retail Outlets, LDO/SKO Dealers and LPG Distributors 55III.19 State-wise and Company-wise Retail Outlets 56III.20 State-wise and Company -wise LPG Registered Domestic Consumers 57III.21 State-wise and Company -wise LPG Distributors 58III.22 State-wise and Company-wise SKO/LDO Dealerships 59III.23 State-wise PDS SKO Kerosene allocated and Quantity Uplifted 60III.24 LPG Marketing in India 61III.25 CNG Activities in India as on 31.03.2017 62III.26 PNG Status as on 31.03.2017 63III.27 Introduction to Green Fuels in India 64IV Prices 65-78
Chapter Highlights 66IV.1 Wholesale Price Indices of Selected Petroleum Products 67IV.2 Consumer and Producer Prices of Natural Gas 67IV.3 Month-wise & Year-wise average International Crude Oil Prices (Indian Basket) 68IV.4 International prices of crude oil and major petroleum products 69IV.5 Weighted Average Crude Oil Prices 69IV.6 Rates of Dealers' Commission for MS, HSD and LPG in India 70IV.7 Subsidies provided under Budget of Government of India 71IV.8 Subsidy Provided by the Government & Oil Companies on PDS SKO & Domestic LPG 72IV.9 Under-Recoveries by Oil Marketing Companies on Sensitive Petroleum Products 73IV.10 Under Recovery and its Burden Sharing 73IV.11 Price Build-up of Selected Petroleum Products in Major Cities 74IV.12 Trends in Retail Selling Prices of Selected Petroleum Products in Metropolitan Cities in India 78V Consumption 79-94
Chapter Highlights 80V.1 Product-wise Consumption of Petroleum Products (Calendar Year-wise) 81V.2 Product-wise Consumption of Petroleum Products (Financial Year-wise) 82V.3 Product-wise Sale of Petroleum Products by Public & Private Sector 83V.4 Sector-wise Consumption (end use) of Liquefied Petroleum Gas (LPG) 84V.5 Sector-wise Consumption (end use) of Naphtha 85V.6 Sector-wise Consumption (end use) of Kerosene 85V.7 Sector-wise Consumption (end use) of High Speed Diesel Oil 86V.8 Sector-wise Consumption (end use) of Light Diesel Oil (LDO) 87V.9 Sector-wise Consumption (end use) of Furnace Oil 88V.10 Sector-wise Consumption (end use) of LSHS/HHS 89V.11 Consumption of Petroleum Products and Market Share of Oil Companies in India 90V.12 Deliveries made to International/Coastal Bunkers 90

Sl.No Subject Page No.V.13 State-wise Sales of Major Petroleum Products during 2016-17 91V.14 State-wise Per Capita Sales of Petroleum Products 92V.15 Per Capita Sales of Selected Petroleum Products 93V.16 Average Compound Annual Growth Rates (CAGR) of Consumption of Petroleum Products 93V.17 Major End use of Petroleum Products 94VI Trade 95-104
Chapter Highlights 96VI.1 Import/Export of Crude Oil, LNG and Petroleum Products 97VI.2 Availability of Crude Oil and Petroleum Products 98VI.3 Import/ Export of Crude Oil and Petroleum Products (Calendar Year-wise) 99VI.4 Import/ Export of Crude Oil and Petroleum Products (in Quantity Terms) 100VI.5 Import/ Export of Crude Oil and Petroleum Products (in ₹ Value Terms) 101VI.6 Import / Export of Crude Oil and Petroleum Products (in US$ Value Terms) 102VI.7 Trends in India's overall Trade balance and Trade balance with OPEC Countries 103VI.8 Import Dependency 104VI.9 Annual Growth of Foreign Direct Investment Equity Inflows 104VII Taxes and Duties 105-114
Chapter Highlights 106VII.1 Realisation of Excise and Customs Duties from Crude Oil and Petroleum Products 107VII.2 Royalty and Oil Development Cess Paid by Oil Companies on Production of Crude Oil and Natural
Gas108
VII.3 Sales Tax Rates Applicable on Crude Oil, Natural Gas and Petroleum Products 109VII.4 Sales Tax Payments on Crude Oil, Natural Gas and Petroleum Products: State-wise details 113VII.5 Central Excise and Customs Tariff as on 01.04.2017 114VIII Manpower 115-120
Chapter Highlights 116VIII.1 Sector-wise Manpower Employed in Oil & Gas CPSEs in India 117VIII.2 Category-wise Manpower Employed in Oil & Gas CPSEs in India 118VIII.3 Category-wise Manpower Employed in Select Sectors of Oil & Gas CPSEs in India 119VIII.4 Sector-wise and Category-wise Manpower Employed in Oil & Gas CPSEs as on 31.03.2017 120IX Energy 121-124
Chapter Highlights 122IX.1 Gross Production of Energy by Various Sources in India 123IX.2 Gross Value Added at Basic Prices by Economic Activity 124X Plan Performance 125-136
Chapter Highlights 126X.1 12th Five Year Plan Outlay & Actual Expenditure for P&NG Sector 127X.2 Performance of CPSEs under the Ministry of Petroleum and Natural Gas during 2016-17 128X.3 Dividend paid/payable by CPSEs under the Ministry of Petroleum and Natural Gas 129X.4 Profit earned after tax by CPSEs under the Ministry of Petroleum and Natural Gas 130X.5 Projection of Crude Oil Production in 12th Plan (2012-17) 131X.6 Projection of Natural Gas Production in 12th Plan (2012-17) 131X.7 Projection of Total Gas Availability during 12th Plan (2012-17) 132X.8 Oil and Natural Gas Projection & Actual Production Target of OVL from Assets abroad in 12th Plan 133X.9 Projection of Refining Capacity in 12th Plan (2012-17) 134X.10 Projection of Demand for Petroleum Products in 12th Plan (2012-17) 135X.11 Projection for Production of Petroleum Products in 12th Plan (2012-17) 136
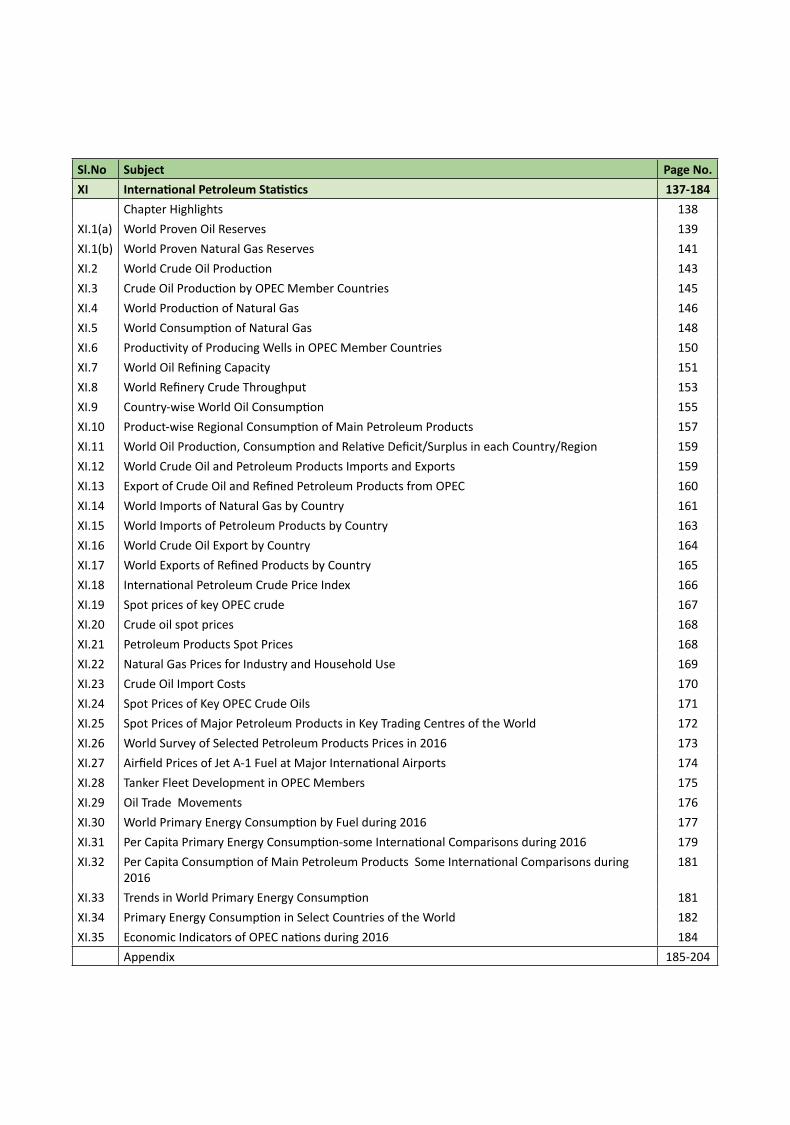
Sl.No Subject Page No.XI International Petroleum Statistics 137-184
Chapter Highlights 138XI.1(a) World Proven Oil Reserves 139XI.1(b) World Proven Natural Gas Reserves 141XI.2 World Crude Oil Production 143XI.3 Crude Oil Production by OPEC Member Countries 145XI.4 World Production of Natural Gas 146XI.5 World Consumption of Natural Gas 148XI.6 Productivity of Producing Wells in OPEC Member Countries 150XI.7 World Oil Refining Capacity 151XI.8 World Refinery Crude Throughput 153XI.9 Country-wise World Oil Consumption 155XI.10 Product-wise Regional Consumption of Main Petroleum Products 157XI.11 World Oil Production, Consumption and Relative Deficit/Surplus in each Country/Region 159XI.12 World Crude Oil and Petroleum Products Imports and Exports 159XI.13 Export of Crude Oil and Refined Petroleum Products from OPEC 160XI.14 World Imports of Natural Gas by Country 161XI.15 World Imports of Petroleum Products by Country 163XI.16 World Crude Oil Export by Country 164XI.17 World Exports of Refined Products by Country 165XI.18 International Petroleum Crude Price Index 166XI.19 Spot prices of key OPEC crude 167XI.20 Crude oil spot prices 168XI.21 Petroleum Products Spot Prices 168XI.22 Natural Gas Prices for Industry and Household Use 169XI.23 Crude Oil Import Costs 170XI.24 Spot Prices of Key OPEC Crude Oils 171XI.25 Spot Prices of Major Petroleum Products in Key Trading Centres of the World 172XI.26 World Survey of Selected Petroleum Products Prices in 2016 173XI.27 Airfield Prices of Jet A-1 Fuel at Major International Airports 174XI.28 Tanker Fleet Development in OPEC Members 175XI.29 Oil Trade Movements 176XI.30 World Primary Energy Consumption by Fuel during 2016 177XI.31 Per Capita Primary Energy Consumption-some International Comparisons during 2016 179XI.32 Per Capita Consumption of Main Petroleum Products Some International Comparisons during
2016181
XI.33 Trends in World Primary Energy Consumption 181XI.34 Primary Energy Consumption in Select Countries of the World 182XI.35 Economic Indicators of OPEC nations during 2016 184
Appendix 185-204
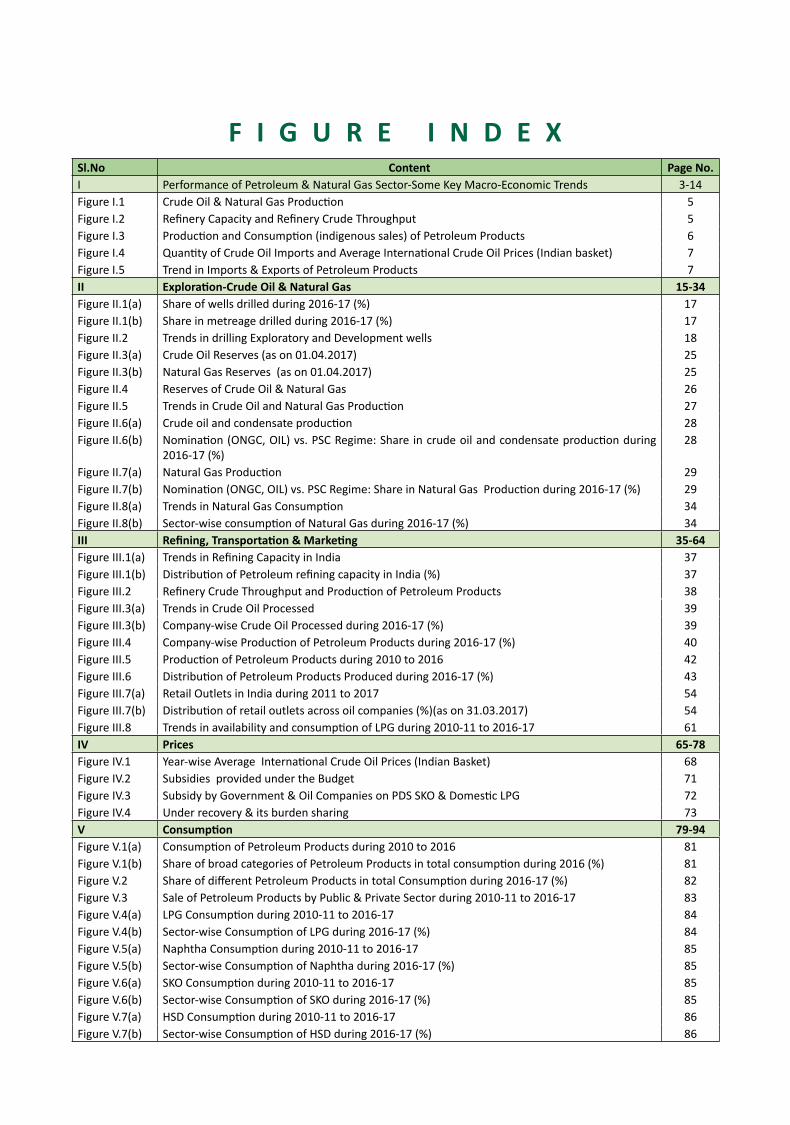
F I G U R E I N D E XSl.No Content Page No.I Performance of Petroleum & Natural Gas Sector-Some Key Macro-Economic Trends 3-14Figure I.1 Crude Oil & Natural Gas Production 5Figure I.2 Refinery Capacity and Refinery Crude Throughput 5Figure I.3 Production and Consumption (indigenous sales) of Petroleum Products 6Figure I.4 Quantity of Crude Oil Imports and Average International Crude Oil Prices (Indian basket) 7Figure I.5 Trend in Imports & Exports of Petroleum Products 7II Exploration-Crude Oil & Natural Gas 15-34Figure II.1(a) Share of wells drilled during 2016-17 (%) 17Figure II.1(b) Share in metreage drilled during 2016-17 (%) 17Figure II.2 Trends in drilling Exploratory and Development wells 18Figure II.3(a) Crude Oil Reserves (as on 01.04.2017) 25Figure II.3(b) Natural Gas Reserves (as on 01.04.2017) 25Figure II.4 Reserves of Crude Oil & Natural Gas 26Figure II.5 Trends in Crude Oil and Natural Gas Production 27Figure II.6(a) Crude oil and condensate production 28Figure II.6(b) Nomination (ONGC, OIL) vs. PSC Regime: Share in crude oil and condensate production during
2016-17 (%)28
Figure II.7(a) Natural Gas Production 29Figure II.7(b) Nomination (ONGC, OIL) vs. PSC Regime: Share in Natural Gas Production during 2016-17 (%) 29Figure II.8(a) Trends in Natural Gas Consumption 34Figure II.8(b) Sector-wise consumption of Natural Gas during 2016-17 (%) 34III Refining, Transportation & Marketing 35-64Figure III.1(a) Trends in Refining Capacity in India 37Figure III.1(b) Distribution of Petroleum refining capacity in India (%) 37Figure III.2 Refinery Crude Throughput and Production of Petroleum Products 38Figure III.3(a) Trends in Crude Oil Processed 39Figure III.3(b) Company-wise Crude Oil Processed during 2016-17 (%) 39Figure III.4 Company-wise Production of Petroleum Products during 2016-17 (%) 40Figure III.5 Production of Petroleum Products during 2010 to 2016 42Figure III.6 Distribution of Petroleum Products Produced during 2016-17 (%) 43Figure III.7(a) Retail Outlets in India during 2011 to 2017 54Figure III.7(b) Distribution of retail outlets across oil companies (%)(as on 31.03.2017) 54Figure III.8 Trends in availability and consumption of LPG during 2010-11 to 2016-17 61IV Prices 65-78Figure IV.1 Year-wise Average International Crude Oil Prices (Indian Basket) 68Figure IV.2 Subsidies provided under the Budget 71Figure IV.3 Subsidy by Government & Oil Companies on PDS SKO & Domestic LPG 72Figure IV.4 Under recovery & its burden sharing 73V Consumption 79-94Figure V.1(a) Consumption of Petroleum Products during 2010 to 2016 81Figure V.1(b) Share of broad categories of Petroleum Products in total consumption during 2016 (%) 81Figure V.2 Share of different Petroleum Products in total Consumption during 2016-17 (%) 82Figure V.3 Sale of Petroleum Products by Public & Private Sector during 2010-11 to 2016-17 83Figure V.4(a) LPG Consumption during 2010-11 to 2016-17 84Figure V.4(b) Sector-wise Consumption of LPG during 2016-17 (%) 84Figure V.5(a) Naphtha Consumption during 2010-11 to 2016-17 85Figure V.5(b) Sector-wise Consumption of Naphtha during 2016-17 (%) 85Figure V.6(a) SKO Consumption during 2010-11 to 2016-17 85Figure V.6(b) Sector-wise Consumption of SKO during 2016-17 (%) 85Figure V.7(a) HSD Consumption during 2010-11 to 2016-17 86Figure V.7(b) Sector-wise Consumption of HSD during 2016-17 (%) 86
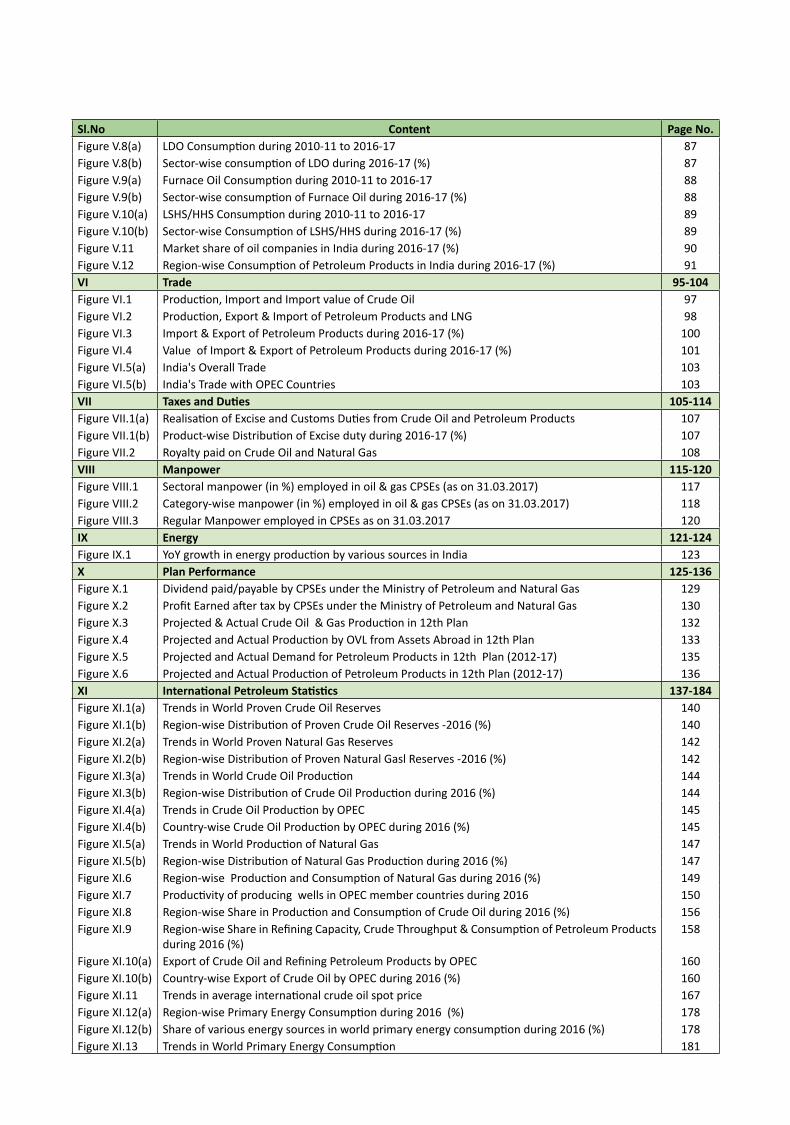
Sl.No Content Page No.Figure V.8(a) LDO Consumption during 2010-11 to 2016-17 87Figure V.8(b) Sector-wise consumption of LDO during 2016-17 (%) 87Figure V.9(a) Furnace Oil Consumption during 2010-11 to 2016-17 88Figure V.9(b) Sector-wise consumption of Furnace Oil during 2016-17 (%) 88Figure V.10(a) LSHS/HHS Consumption during 2010-11 to 2016-17 89Figure V.10(b) Sector-wise Consumption of LSHS/HHS during 2016-17 (%) 89Figure V.11 Market share of oil companies in India during 2016-17 (%) 90Figure V.12 Region-wise Consumption of Petroleum Products in India during 2016-17 (%) 91VI Trade 95-104Figure VI.1 Production, Import and Import value of Crude Oil 97Figure VI.2 Production, Export & Import of Petroleum Products and LNG 98Figure VI.3 Import & Export of Petroleum Products during 2016-17 (%) 100Figure VI.4 Value of Import & Export of Petroleum Products during 2016-17 (%) 101Figure VI.5(a) India's Overall Trade 103Figure VI.5(b) India's Trade with OPEC Countries 103VII Taxes and Duties 105-114Figure VII.1(a) Realisation of Excise and Customs Duties from Crude Oil and Petroleum Products 107Figure VII.1(b) Product-wise Distribution of Excise duty during 2016-17 (%) 107Figure VII.2 Royalty paid on Crude Oil and Natural Gas 108VIII Manpower 115-120Figure VIII.1 Sectoral manpower (in %) employed in oil & gas CPSEs (as on 31.03.2017) 117Figure VIII.2 Category-wise manpower (in %) employed in oil & gas CPSEs (as on 31.03.2017) 118Figure VIII.3 Regular Manpower employed in CPSEs as on 31.03.2017 120IX Energy 121-124Figure IX.1 YoY growth in energy production by various sources in India 123X Plan Performance 125-136Figure X.1 Dividend paid/payable by CPSEs under the Ministry of Petroleum and Natural Gas 129Figure X.2 Profit Earned after tax by CPSEs under the Ministry of Petroleum and Natural Gas 130Figure X.3 Projected & Actual Crude Oil & Gas Production in 12th Plan 132Figure X.4 Projected and Actual Production by OVL from Assets Abroad in 12th Plan 133Figure X.5 Projected and Actual Demand for Petroleum Products in 12th Plan (2012-17) 135Figure X.6 Projected and Actual Production of Petroleum Products in 12th Plan (2012-17) 136XI International Petroleum Statistics 137-184Figure XI.1(a) Trends in World Proven Crude Oil Reserves 140Figure XI.1(b) Region-wise Distribution of Proven Crude Oil Reserves -2016 (%) 140Figure XI.2(a) Trends in World Proven Natural Gas Reserves 142Figure XI.2(b) Region-wise Distribution of Proven Natural Gasl Reserves -2016 (%) 142Figure XI.3(a) Trends in World Crude Oil Production 144Figure XI.3(b) Region-wise Distribution of Crude Oil Production during 2016 (%) 144Figure XI.4(a) Trends in Crude Oil Production by OPEC 145Figure XI.4(b) Country-wise Crude Oil Production by OPEC during 2016 (%) 145Figure XI.5(a) Trends in World Production of Natural Gas 147Figure XI.5(b) Region-wise Distribution of Natural Gas Production during 2016 (%) 147Figure XI.6 Region-wise Production and Consumption of Natural Gas during 2016 (%) 149Figure XI.7 Productivity of producing wells in OPEC member countries during 2016 150Figure XI.8 Region-wise Share in Production and Consumption of Crude Oil during 2016 (%) 156Figure XI.9 Region-wise Share in Refining Capacity, Crude Throughput & Consumption of Petroleum Products
during 2016 (%)158
Figure XI.10(a) Export of Crude Oil and Refining Petroleum Products by OPEC 160Figure XI.10(b) Country-wise Export of Crude Oil by OPEC during 2016 (%) 160Figure XI.11 Trends in average international crude oil spot price 167Figure XI.12(a) Region-wise Primary Energy Consumption during 2016 (%) 178Figure XI.12(b) Share of various energy sources in world primary energy consumption during 2016 (%) 178Figure XI.13 Trends in World Primary Energy Consumption 181

1
1. Scope: The “Indian Petroleum & Natural Gas Statistics” presents updated comprehensive statistics on various aspects of Indian Petroleum & Natural Gas sector. The data on international developments in respect of the key parameters of Petroleum and Natural Gas sector have also been captured in the publication.
2. Coverage: The Statistics presented in the current publication cover the exploration, production, refining, marketing activities, etc. of Oil and Gas sector.
3. Source: The primary statistics in respect of petroleum and natural gas industries included in the publication are based on various returns, submitted by the Oil& Gas Central Public Sector Enterprises (CPSEs), Joint Venture companies and Private companies under the Ministry of Petroleum & Natural Gas.
The sources of all the secondary data, including international statistics, incorporated in the publication, have been indicated at the bottom of relevant tables.
4. Limitations: The data in respect of sales/consumption of petroleum products reflect dispatches of various petroleum products from the sales depots of different oil companies to the bulk consumers/retail outlets. The state-wise sales/consumption of such products show dispatches to direct consumers / retail outlets meant for consumption / sales in a particular state.
5. Reference Period: Key statistics for the domestic petroleum and natural gas industries have been presented on calendar (January-December) as well as on financial year (April-March) basis.
6. Natural Gas: The gross production of natural gas reflects gross withdrawals of natural gas from reservoir. On the other hand, the net production of natural gas show gross withdrawal of natural gas from reservoirs less gas used for reinjection into reservoirs for pressuring gas which is flared and / or vented.
The utilization data for natural gas includes gas marketed, gas used for LPG extraction and gas consumed for field operations by the companies engaged in hydrocarbons exploration / production activities.
7. Petroleum Imports: The crude oil and product import figures given in the publication includes crude oil / petroleum products imported by the oil PSUs, private and parallel marketers on behalf of Nepal for processing of crude oil in Indian refineries and arranging supplies of desired products to Nepal. Petroleum products actually brought into the country from processing of Indian and International crudes at foreign refineries for Indian oil companies have also been included under the product import figures.
8. Value of Import/Export: The value data in respect of exports of petroleum included in the publication show F.O.B. value of exports whereas similar value figures for imports reflect C.I.F. value of imports.
9. Revision / Modification / Updation: The statistics provided in this publication for the current year is provisional in view of the time lag involved in receipt of actual figures. In view of this, some information based on provisional data may undergo change as and when the actual data are available.
Necessary revision / updation in the past data has been made in the light of latest available figures. To illustrate:
• Data on exploration and production (wells, reserves, meterage) may not be strictly comparable with earlier issues of publication prior to 2015-16 due to change in nomenclature, rationalization and classification of reporting.
• Data on international statistics of certain parameters like world crude oil exports taken from different sources viz. OPEC Bulletins and BP Statistical Review may not tally due to difference in coverage and methodology used.
SCOPE AND COVERAGE OF DATA PUBLISHED
2
• Dividend paid/payable by oil & gas sector CPSEs to the Government has been reconciled, which now includes dividend distribution tax also.
• Oil Development Cess data reported in table VII.2 is on accrual basis.
• Category-wise distribution total manpower employed in oil & gas CPSEs has been given in table VIII.3.
10. Definitions: Definitions of common Crude oil and Gas products and terminologies have been compiled based on ‘Manual on Infrastructure Statistics’ of Ministry of Statistics & Programme Implementation.
11. Abbreviations: Details of abbreviations used have been provided in Appendix.
12. Conversion factor: The conversion factors generally used in the Oil & Gas sector are also given in the Appendix.
Errors of Omissions and Commissions, if any, detected may kindly be brought to the notice of the Assistant Director, Economic & Statistics Division, Ministry of Petroleum & Natural Gas for rectification in the subsequent issue.
3
CHAPTER ICHAPTER II
CHAPTER IIICHAPTER IV
CHAPTER VCHAPTER VI
CHAPTER VIICHAPTER VIII
CHAPTER IXCHAPTER X
CHAPTER XIAPPEN
DIX
4
Chapter I: Performance of Petroleum & Natural Gas Sector-Some Key
Macro-Economic Trends
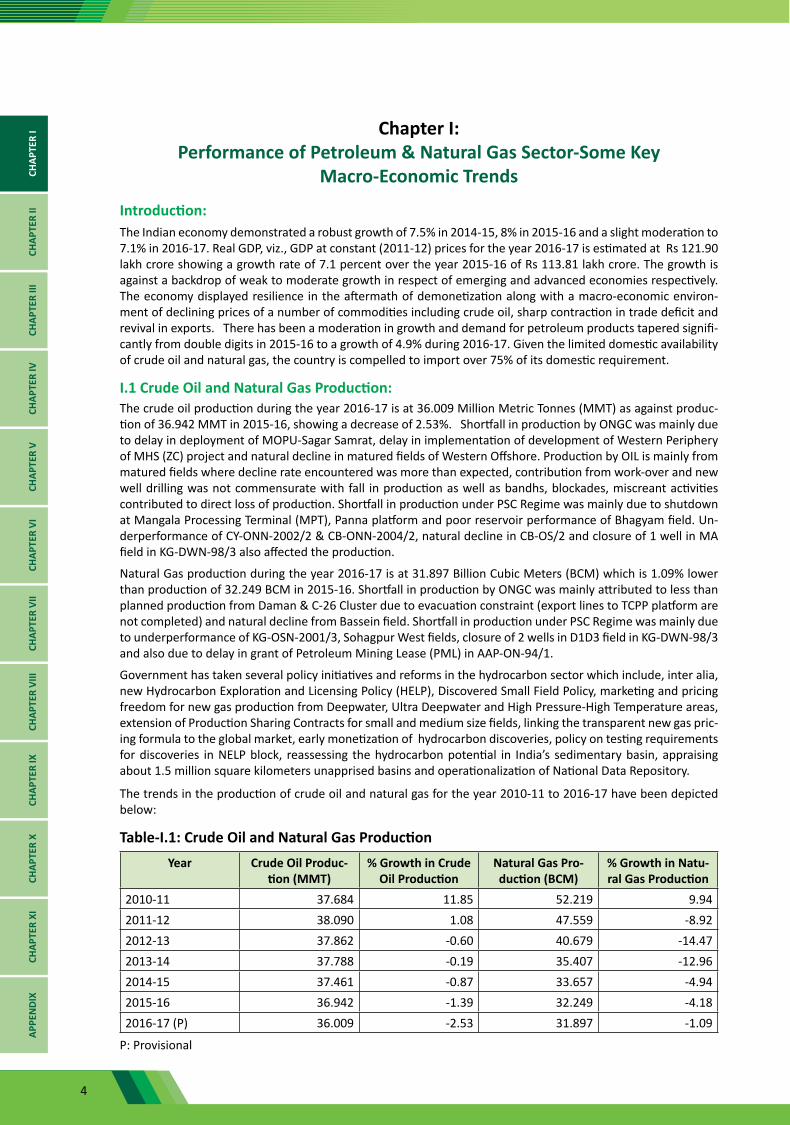
Introduction: The Indian economy demonstrated a robust growth of 7.5% in 2014-15, 8% in 2015-16 and a slight moderation to 7.1% in 2016-17. Real GDP, viz., GDP at constant (2011-12) prices for the year 2016-17 is estimated at Rs 121.90 lakh crore showing a growth rate of 7.1 percent over the year 2015-16 of Rs 113.81 lakh crore. The growth is against a backdrop of weak to moderate growth in respect of emerging and advanced economies respectively. The economy displayed resilience in the aftermath of demonetization along with a macro-economic environ-ment of declining prices of a number of commodities including crude oil, sharp contraction in trade deficit and revival in exports. There has been a moderation in growth and demand for petroleum products tapered signifi-cantly from double digits in 2015-16 to a growth of 4.9% during 2016-17. Given the limited domestic availability of crude oil and natural gas, the country is compelled to import over 75% of its domestic requirement.
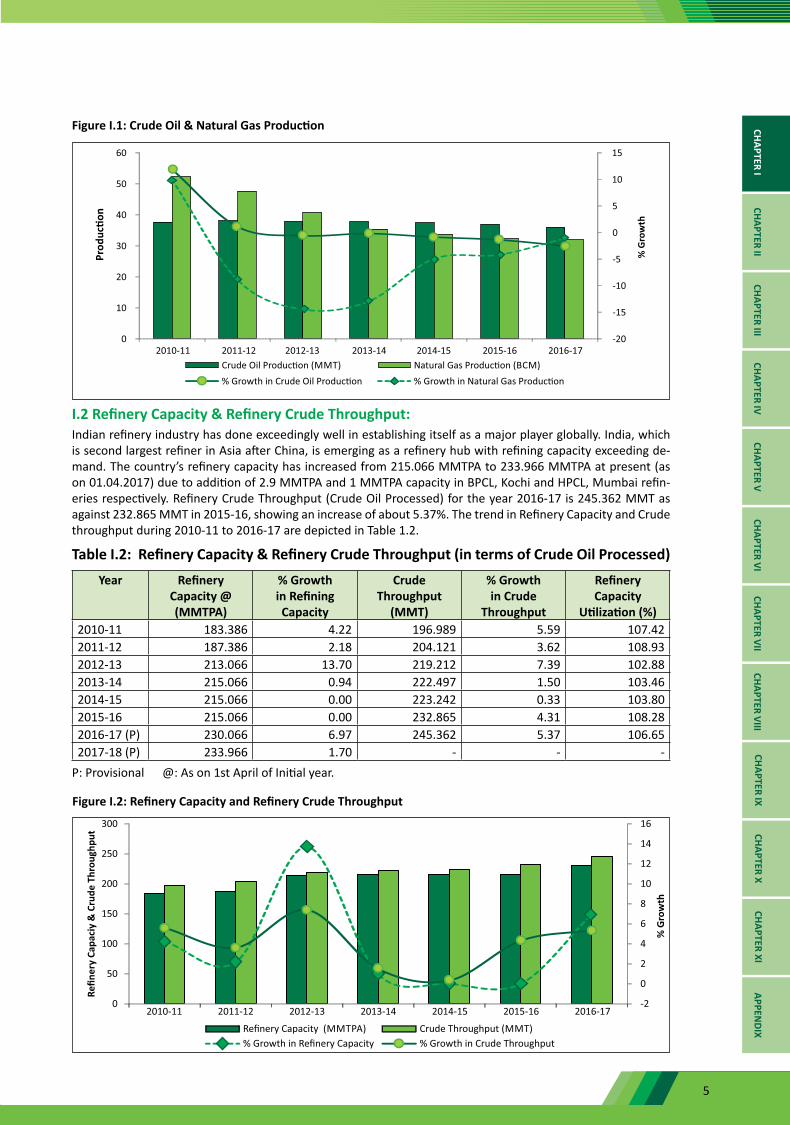
I.1 Crude Oil and Natural Gas Production:The crude oil production during the year 2016-17 is at 36.009 Million Metric Tonnes (MMT) as against produc-tion of 36.942 MMT in 2015-16, showing a decrease of 2.53%. Shortfall in production by ONGC was mainly due to delay in deployment of MOPU-Sagar Samrat, delay in implementation of development of Western Periphery of MHS (ZC) project and natural decline in matured fields of Western Offshore. Production by OIL is mainly from matured fields where decline rate encountered was more than expected, contribution from work-over and new well drilling was not commensurate with fall in production as well as bandhs, blockades, miscreant activities contributed to direct loss of production. Shortfall in production under PSC Regime was mainly due to shutdown at Mangala Processing Terminal (MPT), Panna platform and poor reservoir performance of Bhagyam field. Un-derperformance of CY-ONN-2002/2 & CB-ONN-2004/2, natural decline in CB-OS/2 and closure of 1 well in MA field in KG-DWN-98/3 also affected the production.
Natural Gas production during the year 2016-17 is at 31.897 Billion Cubic Meters (BCM) which is 1.09% lower than production of 32.249 BCM in 2015-16. Shortfall in production by ONGC was mainly attributed to less than planned production from Daman & C-26 Cluster due to evacuation constraint (export lines to TCPP platform are not completed) and natural decline from Bassein field. Shortfall in production under PSC Regime was mainly due to underperformance of KG-OSN-2001/3, Sohagpur West fields, closure of 2 wells in D1D3 field in KG-DWN-98/3 and also due to delay in grant of Petroleum Mining Lease (PML) in AAP-ON-94/1.
Government has taken several policy initiatives and reforms in the hydrocarbon sector which include, inter alia, new Hydrocarbon Exploration and Licensing Policy (HELP), Discovered Small Field Policy, marketing and pricing freedom for new gas production from Deepwater, Ultra Deepwater and High Pressure-High Temperature areas, extension of Production Sharing Contracts for small and medium size fields, linking the transparent new gas pric-ing formula to the global market, early monetization of hydrocarbon discoveries, policy on testing requirements for discoveries in NELP block, reassessing the hydrocarbon potential in India’s sedimentary basin, appraising about 1.5 million square kilometers unapprised basins and operationalization of National Data Repository.
The trends in the production of crude oil and natural gas for the year 2010-11 to 2016-17 have been depicted below:
Table-I.1: Crude Oil and Natural Gas ProductionYear Crude Oil Produc-
tion (MMT)% Growth in Crude
Oil ProductionNatural Gas Pro-duction (BCM)
% Growth in Natu-ral Gas Production
2010-11 37.684 11.85 52.219 9.942011-12 38.090 1.08 47.559 -8.922012-13 37.862 -0.60 40.679 -14.472013-14 37.788 -0.19 35.407 -12.962014-15 37.461 -0.87 33.657 -4.942015-16 36.942 -1.39 32.249 -4.182016-17 (P) 36.009 -2.53 31.897 -1.09
P: Provisional
CHAP
TER
ICH
APTE
R II
CHAP
TER
IIICH
APTE
R IV
CHAP
TER
VCH
APTE
R VI
CHAP
TER
VII
CHAP
TER
VIII
CHAP
TER
IXCH
APTE
R X
CHAP
TER
XIAP
PEN
DIX
5
I.2 Refinery Capacity & Refinery Crude Throughput:Indian refinery industry has done exceedingly well in establishing itself as a major player globally. India, which is second largest refiner in Asia after China, is emerging as a refinery hub with refining capacity exceeding de-mand. The country’s refinery capacity has increased from 215.066 MMTPA to 233.966 MMTPA at present (as on 01.04.2017) due to addition of 2.9 MMTPA and 1 MMTPA capacity in BPCL, Kochi and HPCL, Mumbai refin-eries respectively. Refinery Crude Throughput (Crude Oil Processed) for the year 2016-17 is 245.362 MMT as against 232.865 MMT in 2015-16, showing an increase of about 5.37%. The trend in Refinery Capacity and Crude throughput during 2010-11 to 2016-17 are depicted in Table 1.2.
Table I.2: Refinery Capacity & Refinery Crude Throughput (in terms of Crude Oil Processed)Year Refinery
Capacity @ (MMTPA)
% Growth in Refining Capacity
Crude Throughput
(MMT)
% Growth in Crude
Throughput
Refinery Capacity
Utilization (%)2010-11 183.386 4.22 196.989 5.59 107.422011-12 187.386 2.18 204.121 3.62 108.932012-13 213.066 13.70 219.212 7.39 102.882013-14 215.066 0.94 222.497 1.50 103.462014-15 215.066 0.00 223.242 0.33 103.802015-16 215.066 0.00 232.865 4.31 108.282016-17 (P) 230.066 6.97 245.362 5.37 106.652017-18 (P) 233.966 1.70 - - -
P: Provisional @: As on 1st April of Initial year.
Figure I.1: Crude Oil & Natural Gas Production
Figure I.2: Refinery Capacity and Refinery Crude Throughput
CHAPTER ICHAPTER II
CHAPTER IIICHAPTER IV
CHAPTER VCHAPTER VI
CHAPTER VIICHAPTER VIII
CHAPTER IXCHAPTER X
CHAPTER XIAPPEN
DIX
6
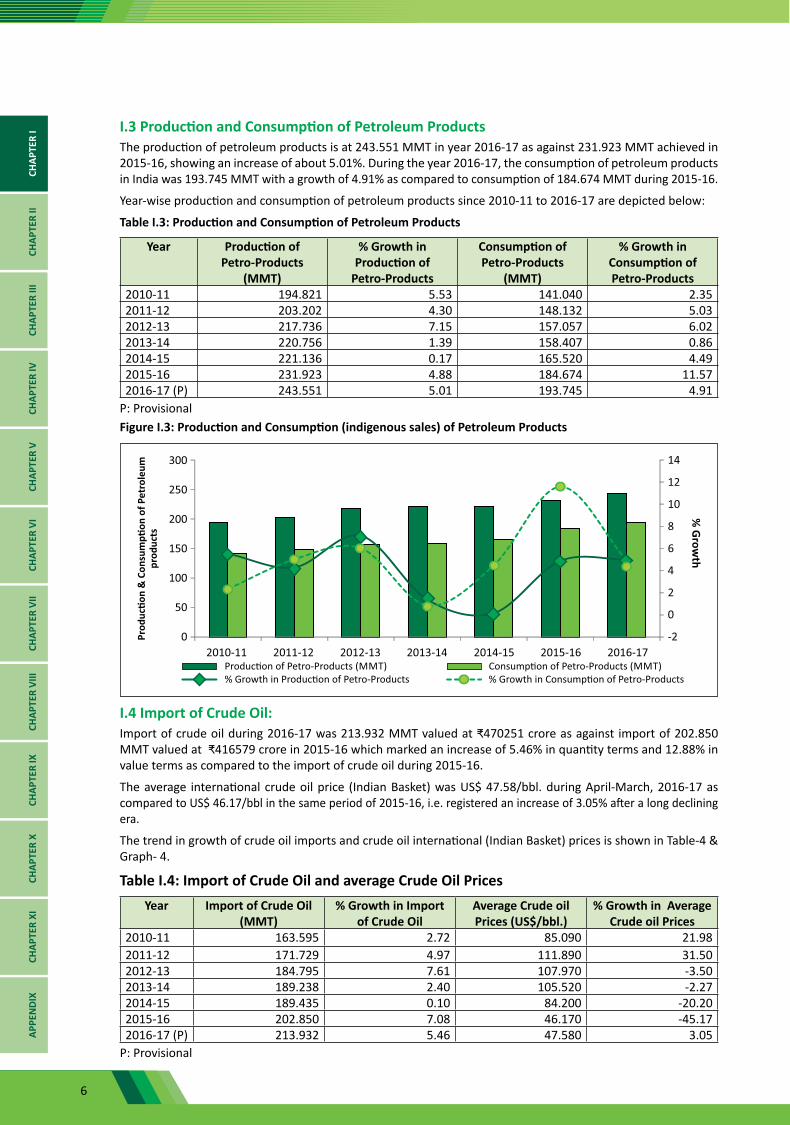
I.3 Production and Consumption of Petroleum ProductsThe production of petroleum products is at 243.551 MMT in year 2016-17 as against 231.923 MMT achieved in 2015-16, showing an increase of about 5.01%. During the year 2016-17, the consumption of petroleum products in India was 193.745 MMT with a growth of 4.91% as compared to consumption of 184.674 MMT during 2015-16.
Year-wise production and consumption of petroleum products since 2010-11 to 2016-17 are depicted below:
Table I.3: Production and Consumption of Petroleum Products
Year Production of Petro-Products
(MMT)
% Growth in Production of
Petro-Products
Consumption of Petro-Products
(MMT)
% Growth in Consumption of Petro-Products
2010-11 194.821 5.53 141.040 2.352011-12 203.202 4.30 148.132 5.032012-13 217.736 7.15 157.057 6.022013-14 220.756 1.39 158.407 0.862014-15 221.136 0.17 165.520 4.492015-16 231.923 4.88 184.674 11.572016-17 (P) 243.551 5.01 193.745 4.91
P: ProvisionalFigure I.3: Production and Consumption (indigenous sales) of Petroleum Products
I.4 Import of Crude Oil:Import of crude oil during 2016-17 was 213.932 MMT valued at ₹470251 crore as against import of 202.850 MMT valued at ₹416579 crore in 2015-16 which marked an increase of 5.46% in quantity terms and 12.88% in value terms as compared to the import of crude oil during 2015-16.
The average international crude oil price (Indian Basket) was US$ 47.58/bbl. during April-March, 2016-17 as compared to US$ 46.17/bbl in the same period of 2015-16, i.e. registered an increase of 3.05% after a long declining era.
The trend in growth of crude oil imports and crude oil international (Indian Basket) prices is shown in Table-4 & Graph- 4.
Table I.4: Import of Crude Oil and average Crude Oil PricesYear Import of Crude Oil
(MMT)% Growth in Import
of Crude OilAverage Crude oil Prices (US$/bbl.)
% Growth in Average Crude oil Prices
2010-11 163.595 2.72 85.090 21.982011-12 171.729 4.97 111.890 31.502012-13 184.795 7.61 107.970 -3.502013-14 189.238 2.40 105.520 -2.272014-15 189.435 0.10 84.200 -20.202015-16 202.850 7.08 46.170 -45.172016-17 (P) 213.932 5.46 47.580 3.05
P: Provisional
CHAP
TER
ICH
APTE
R II
CHAP
TER
IIICH
APTE
R IV
CHAP
TER
VCH
APTE
R VI
CHAP
TER
VII
CHAP
TER
VIII
CHAP
TER
IXCH
APTE
R X
CHAP
TER
XIAP
PEN
DIX
7
Figure I.4: Quantity of Crude Oil Imports and Average International Crude Oil Prices (Indian basket)
Figure I.5: Trend in Imports & Exports of Petroleum Products
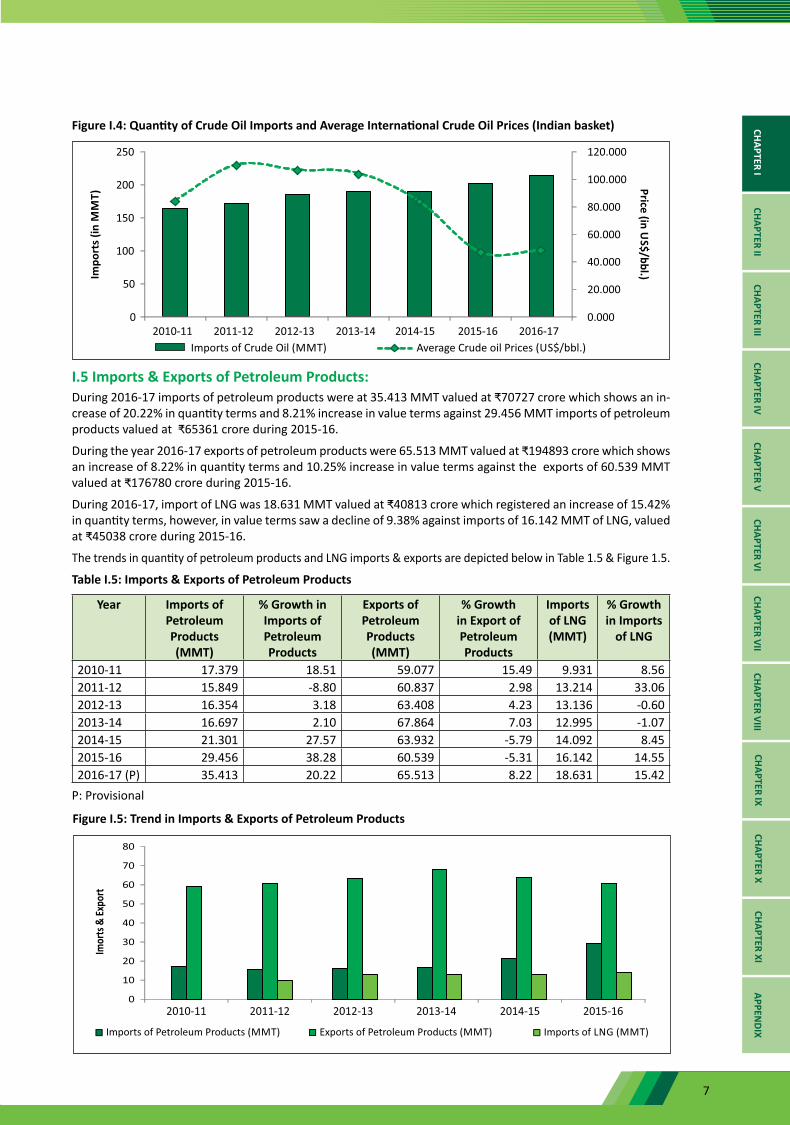
I.5 Imports & Exports of Petroleum Products:During 2016-17 imports of petroleum products were at 35.413 MMT valued at ₹70727 crore which shows an in-crease of 20.22% in quantity terms and 8.21% increase in value terms against 29.456 MMT imports of petroleum products valued at ₹65361 crore during 2015-16.
During the year 2016-17 exports of petroleum products were 65.513 MMT valued at ₹194893 crore which shows an increase of 8.22% in quantity terms and 10.25% increase in value terms against the exports of 60.539 MMT valued at ₹176780 crore during 2015-16.
During 2016-17, import of LNG was 18.631 MMT valued at ₹40813 crore which registered an increase of 15.42% in quantity terms, however, in value terms saw a decline of 9.38% against imports of 16.142 MMT of LNG, valued at ₹45038 crore during 2015-16.
The trends in quantity of petroleum products and LNG imports & exports are depicted below in Table 1.5 & Figure 1.5.
Table I.5: Imports & Exports of Petroleum Products
Year Imports of Petroleum Products (MMT)
% Growth in Imports of Petroleum Products
Exports of Petroleum Products (MMT)
% Growth in Export of Petroleum Products
Imports of LNG (MMT)
% Growth in Imports
of LNG
2010-11 17.379 18.51 59.077 15.49 9.931 8.562011-12 15.849 -8.80 60.837 2.98 13.214 33.062012-13 16.354 3.18 63.408 4.23 13.136 -0.602013-14 16.697 2.10 67.864 7.03 12.995 -1.072014-15 21.301 27.57 63.932 -5.79 14.092 8.452015-16 29.456 38.28 60.539 -5.31 16.142 14.552016-17 (P) 35.413 20.22 65.513 8.22 18.631 15.42
P: Provisional
CHAPTER ICHAPTER II
CHAPTER IIICHAPTER IV
CHAPTER VCHAPTER VI
CHAPTER VIICHAPTER VIII
CHAPTER IXCHAPTER X
CHAPTER XIAPPEN
DIX
8
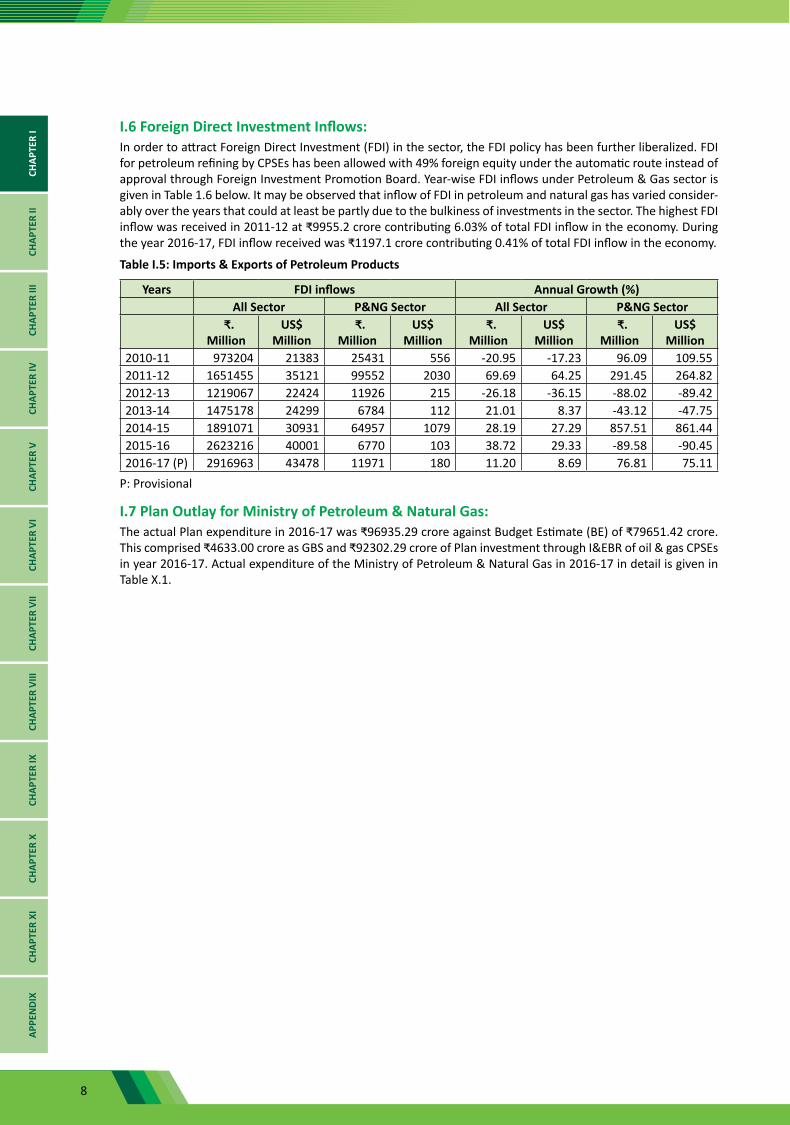
I.6 Foreign Direct Investment Inflows:In order to attract Foreign Direct Investment (FDI) in the sector, the FDI policy has been further liberalized. FDI for petroleum refining by CPSEs has been allowed with 49% foreign equity under the automatic route instead of approval through Foreign Investment Promotion Board. Year-wise FDI inflows under Petroleum & Gas sector is given in Table 1.6 below. It may be observed that inflow of FDI in petroleum and natural gas has varied consider-ably over the years that could at least be partly due to the bulkiness of investments in the sector. The highest FDI inflow was received in 2011-12 at ₹9955.2 crore contributing 6.03% of total FDI inflow in the economy. During the year 2016-17, FDI inflow received was ₹1197.1 crore contributing 0.41% of total FDI inflow in the economy.
Table I.5: Imports & Exports of Petroleum Products
Years FDI inflows Annual Growth (%)All Sector P&NG Sector All Sector P&NG Sector
₹. Million
US$ Million
₹. Million
US$ Million
₹. Million
US$ Million
₹. Million
US$ Million
2010-11 973204 21383 25431 556 -20.95 -17.23 96.09 109.552011-12 1651455 35121 99552 2030 69.69 64.25 291.45 264.822012-13 1219067 22424 11926 215 -26.18 -36.15 -88.02 -89.422013-14 1475178 24299 6784 112 21.01 8.37 -43.12 -47.752014-15 1891071 30931 64957 1079 28.19 27.29 857.51 861.442015-16 2623216 40001 6770 103 38.72 29.33 -89.58 -90.452016-17 (P) 2916963 43478 11971 180 11.20 8.69 76.81 75.11
P: Provisional
I.7 Plan Outlay for Ministry of Petroleum & Natural Gas:The actual Plan expenditure in 2016-17 was ₹96935.29 crore against Budget Estimate (BE) of ₹79651.42 crore. This comprised ₹4633.00 crore as GBS and ₹92302.29 crore of Plan investment through I&EBR of oil & gas CPSEs in year 2016-17. Actual expenditure of the Ministry of Petroleum & Natural Gas in 2016-17 in detail is given in Table X.1.
CHAP
TER
ICH
APTE
R II
CHAP
TER
IIICH
APTE
R IV
CHAP
TER
VCH
APTE
R VI
CHAP
TER
VII
CHAP
TER
VIII
CHAP
TER
IXCH
APTE
R X
CHAP
TER
XIAP
PEN
DIX
9
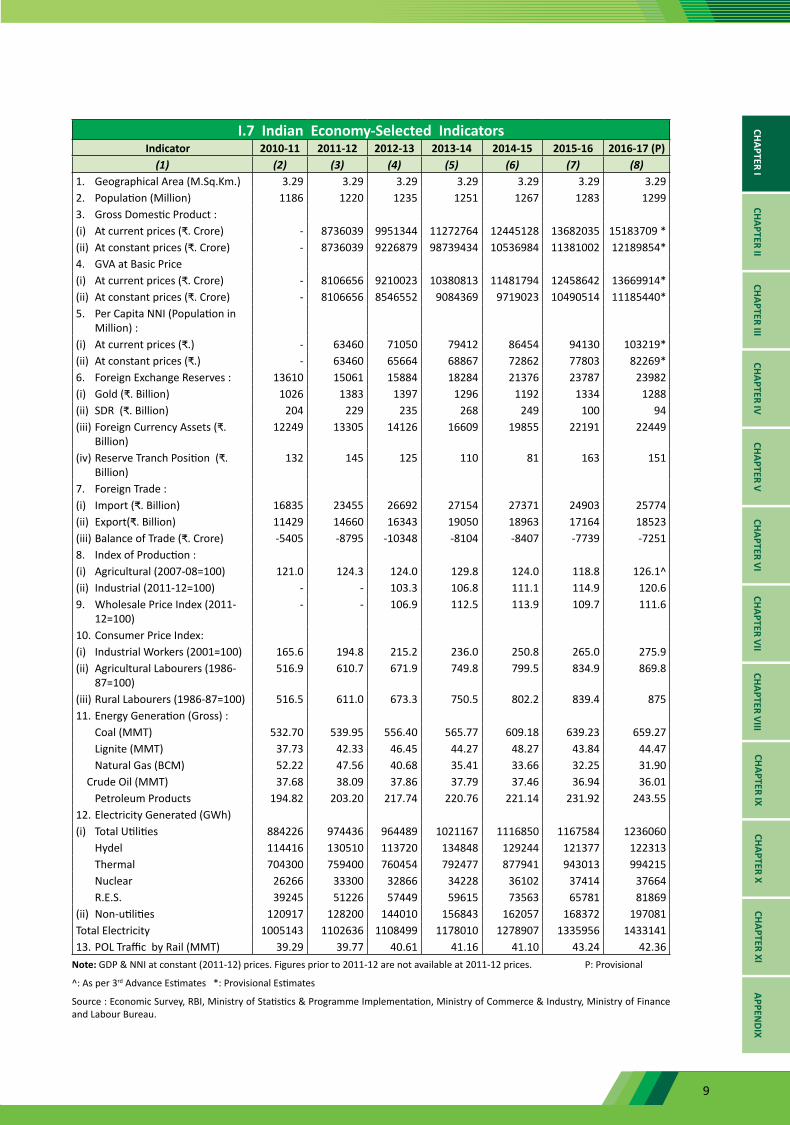
I.7 Indian Economy-Selected Indicators Indicator 2010-11 2011-12 2012-13 2013-14 2014-15 2015-16 2016-17 (P)
(1) (2) (3) (4) (5) (6) (7) (8)1. Geographical Area (M.Sq.Km.) 3.29 3.29 3.29 3.29 3.29 3.29 3.292. Population (Million) 1186 1220 1235 1251 1267 1283 12993. Gross Domestic Product :(i) At current prices (₹. Crore) - 8736039 9951344 11272764 12445128 13682035 15183709 *(ii) At constant prices (₹. Crore) - 8736039 9226879 98739434 10536984 11381002 12189854*4. GVA at Basic Price(i) At current prices (₹. Crore) - 8106656 9210023 10380813 11481794 12458642 13669914*(ii) At constant prices (₹. Crore) - 8106656 8546552 9084369 9719023 10490514 11185440*5. Per Capita NNI (Population in
Million) :(i) At current prices (₹.) - 63460 71050 79412 86454 94130 103219*(ii) At constant prices (₹.) - 63460 65664 68867 72862 77803 82269*6. Foreign Exchange Reserves : 13610 15061 15884 18284 21376 23787 23982(i) Gold (₹. Billion) 1026 1383 1397 1296 1192 1334 1288(ii) SDR (₹. Billion) 204 229 235 268 249 100 94(iii) Foreign Currency Assets (₹.
Billion)12249 13305 14126 16609 19855 22191 22449
(iv) Reserve Tranch Position (₹. Billion)
132 145 125 110 81 163 151
7. Foreign Trade :(i) Import (₹. Billion) 16835 23455 26692 27154 27371 24903 25774(ii) Export(₹. Billion) 11429 14660 16343 19050 18963 17164 18523(iii) Balance of Trade (₹. Crore) -5405 -8795 -10348 -8104 -8407 -7739 -72518. Index of Production :(i) Agricultural (2007-08=100) 121.0 124.3 124.0 129.8 124.0 118.8 126.1^(ii) Industrial (2011-12=100) - - 103.3 106.8 111.1 114.9 120.69. Wholesale Price Index (2011-
12=100)- - 106.9 112.5 113.9 109.7 111.6
10. Consumer Price Index:(i) Industrial Workers (2001=100) 165.6 194.8 215.2 236.0 250.8 265.0 275.9(ii) Agricultural Labourers (1986-
87=100)516.9 610.7 671.9 749.8 799.5 834.9 869.8
(iii) Rural Labourers (1986-87=100) 516.5 611.0 673.3 750.5 802.2 839.4 87511. Energy Generation (Gross) : Coal (MMT) 532.70 539.95 556.40 565.77 609.18 639.23 659.27 Lignite (MMT) 37.73 42.33 46.45 44.27 48.27 43.84 44.47 Natural Gas (BCM) 52.22 47.56 40.68 35.41 33.66 32.25 31.90 Crude Oil (MMT) 37.68 38.09 37.86 37.79 37.46 36.94 36.01 Petroleum Products 194.82 203.20 217.74 220.76 221.14 231.92 243.5512. Electricity Generated (GWh)(i) Total Utilities 884226 974436 964489 1021167 1116850 1167584 1236060 Hydel 114416 130510 113720 134848 129244 121377 122313 Thermal 704300 759400 760454 792477 877941 943013 994215 Nuclear 26266 33300 32866 34228 36102 37414 37664 R.E.S. 39245 51226 57449 59615 73563 65781 81869(ii) Non-utilities 120917 128200 144010 156843 162057 168372 197081Total Electricity 1005143 1102636 1108499 1178010 1278907 1335956 143314113. POL Traffic by Rail (MMT) 39.29 39.77 40.61 41.16 41.10 43.24 42.36
Note: GDP & NNI at constant (2011-12) prices. Figures prior to 2011-12 are not available at 2011-12 prices. P: Provisional
^: As per 3rd Advance Estimates *: Provisional Estimates
Source : Economic Survey, RBI, Ministry of Statistics & Programme Implementation, Ministry of Commerce & Industry, Ministry of Finance and Labour Bureau.
CHAPTER ICHAPTER II
CHAPTER IIICHAPTER IV
CHAPTER VCHAPTER VI
CHAPTER VIICHAPTER VIII
CHAPTER IXCHAPTER X
CHAPTER XIAPPEN
DIX
10
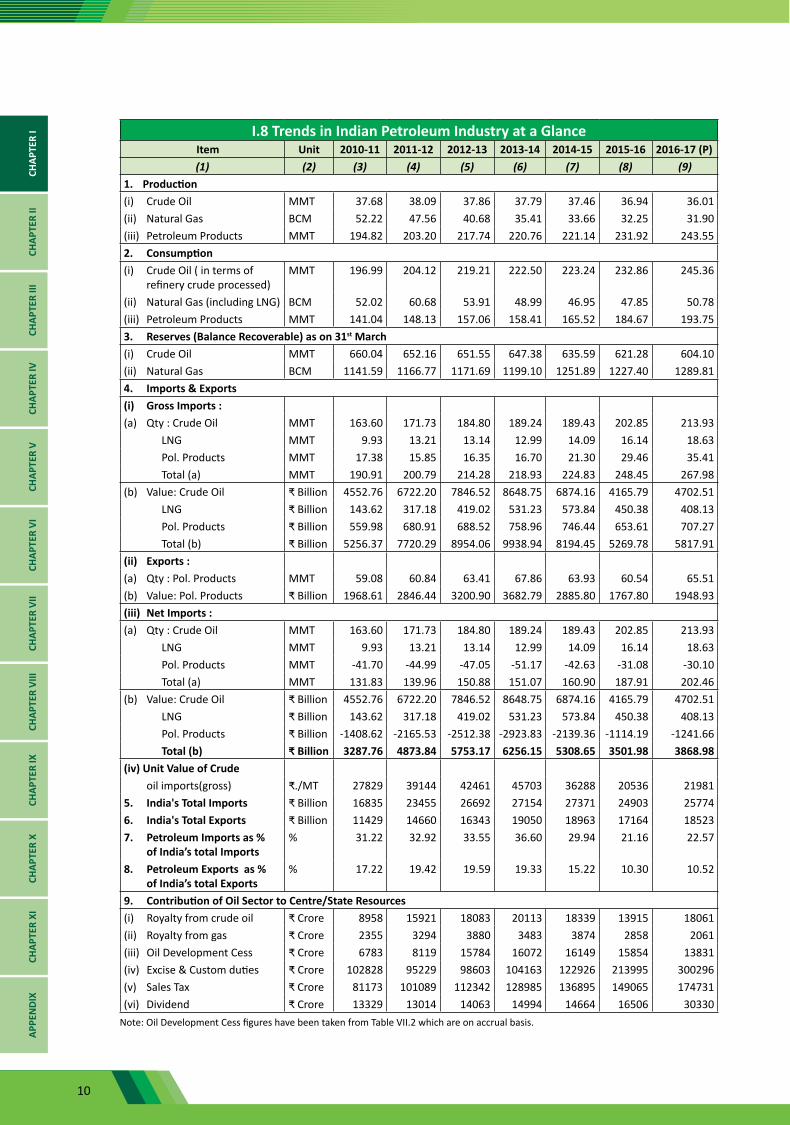
I.8 Trends in Indian Petroleum Industry at a Glance Item Unit 2010-11 2011-12 2012-13 2013-14 2014-15 2015-16 2016-17 (P)
(1) (2) (3) (4) (5) (6) (7) (8) (9)1. Production (i) Crude Oil MMT 37.68 38.09 37.86 37.79 37.46 36.94 36.01(ii) Natural Gas BCM 52.22 47.56 40.68 35.41 33.66 32.25 31.90(iii) Petroleum Products MMT 194.82 203.20 217.74 220.76 221.14 231.92 243.552. Consumption(i) Crude Oil ( in terms of
refinery crude processed)MMT 196.99 204.12 219.21 222.50 223.24 232.86 245.36
(ii) Natural Gas (including LNG) BCM 52.02 60.68 53.91 48.99 46.95 47.85 50.78(iii) Petroleum Products MMT 141.04 148.13 157.06 158.41 165.52 184.67 193.753. Reserves (Balance Recoverable) as on 31st March(i) Crude Oil MMT 660.04 652.16 651.55 647.38 635.59 621.28 604.10(ii) Natural Gas BCM 1141.59 1166.77 1171.69 1199.10 1251.89 1227.40 1289.814. Imports & Exports(i) Gross Imports :(a) Qty : Crude Oil MMT 163.60 171.73 184.80 189.24 189.43 202.85 213.93
LNG MMT 9.93 13.21 13.14 12.99 14.09 16.14 18.63Pol. Products MMT 17.38 15.85 16.35 16.70 21.30 29.46 35.41Total (a) MMT 190.91 200.79 214.28 218.93 224.83 248.45 267.98
(b) Value: Crude Oil ₹ Billion 4552.76 6722.20 7846.52 8648.75 6874.16 4165.79 4702.51LNG ₹ Billion 143.62 317.18 419.02 531.23 573.84 450.38 408.13Pol. Products ₹ Billion 559.98 680.91 688.52 758.96 746.44 653.61 707.27Total (b) ₹ Billion 5256.37 7720.29 8954.06 9938.94 8194.45 5269.78 5817.91
(ii) Exports :(a) Qty : Pol. Products MMT 59.08 60.84 63.41 67.86 63.93 60.54 65.51(b) Value: Pol. Products ₹ Billion 1968.61 2846.44 3200.90 3682.79 2885.80 1767.80 1948.93(iii) Net Imports :(a) Qty : Crude Oil MMT 163.60 171.73 184.80 189.24 189.43 202.85 213.93
LNG MMT 9.93 13.21 13.14 12.99 14.09 16.14 18.63Pol. Products MMT -41.70 -44.99 -47.05 -51.17 -42.63 -31.08 -30.10Total (a) MMT 131.83 139.96 150.88 151.07 160.90 187.91 202.46
(b) Value: Crude Oil ₹ Billion 4552.76 6722.20 7846.52 8648.75 6874.16 4165.79 4702.51LNG ₹ Billion 143.62 317.18 419.02 531.23 573.84 450.38 408.13Pol. Products ₹ Billion -1408.62 -2165.53 -2512.38 -2923.83 -2139.36 -1114.19 -1241.66Total (b) ₹ Billion 3287.76 4873.84 5753.17 6256.15 5308.65 3501.98 3868.98
(iv) Unit Value of Crudeoil imports(gross) ₹./MT 27829 39144 42461 45703 36288 20536 21981
5. India's Total Imports ₹ Billion 16835 23455 26692 27154 27371 24903 257746. India's Total Exports ₹ Billion 11429 14660 16343 19050 18963 17164 185237. Petroleum Imports as %
of India’s total Imports% 31.22 32.92 33.55 36.60 29.94 21.16 22.57
8. Petroleum Exports as % of India’s total Exports
% 17.22 19.42 19.59 19.33 15.22 10.30 10.52
9. Contribution of Oil Sector to Centre/State Resources (i) Royalty from crude oil ₹ Crore 8958 15921 18083 20113 18339 13915 18061(ii) Royalty from gas ₹ Crore 2355 3294 3880 3483 3874 2858 2061(iii) Oil Development Cess ₹ Crore 6783 8119 15784 16072 16149 15854 13831(iv) Excise & Custom duties ₹ Crore 102828 95229 98603 104163 122926 213995 300296(v) Sales Tax ₹ Crore 81173 101089 112342 128985 136895 149065 174731(vi) Dividend ₹ Crore 13329 13014 14063 14994 14664 16506 30330
Note: Oil Development Cess figures have been taken from Table VII.2 which are on accrual basis.
CHAP
TER
ICH
APTE
R II
CHAP
TER
IIICH
APTE
R IV
CHAP
TER
VCH
APTE
R VI
CHAP
TER
VII
CHAP
TER
VIII
CHAP
TER
IXCH
APTE
R X
CHAP
TER
XIAP
PEN
DIX
11
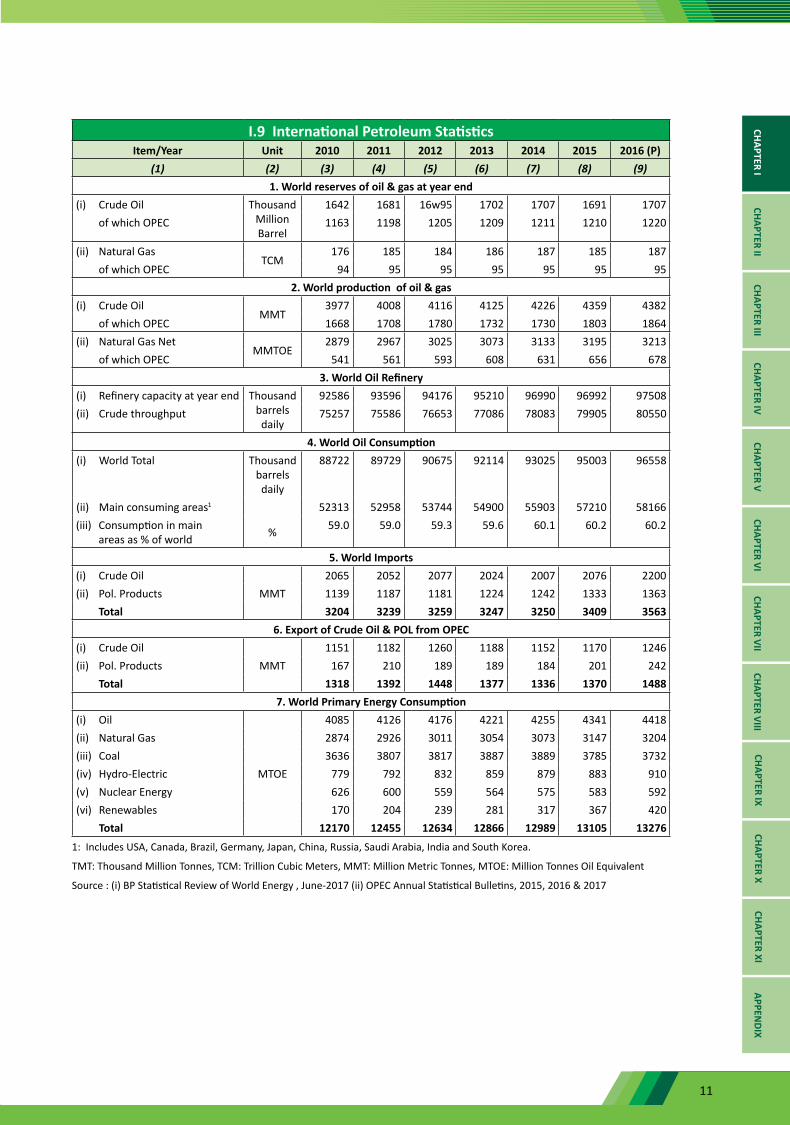
I.9 International Petroleum StatisticsItem/Year Unit 2010 2011 2012 2013 2014 2015 2016 (P)
(1) (2) (3) (4) (5) (6) (7) (8) (9)1. World reserves of oil & gas at year end
(i) Crude Oil Thousand Million Barrel
1642 1681 16w95 1702 1707 1691 1707 of which OPEC 1163 1198 1205 1209 1211 1210 1220
(ii) Natural GasTCM
176 185 184 186 187 185 187 of which OPEC 94 95 95 95 95 95 95
2. World production of oil & gas(i) Crude Oil
MMT3977 4008 4116 4125 4226 4359 4382
of which OPEC 1668 1708 1780 1732 1730 1803 1864(ii) Natural Gas Net
MMTOE2879 2967 3025 3073 3133 3195 3213
of which OPEC 541 561 593 608 631 656 6783. World Oil Refinery
(i) Refinery capacity at year end Thousand barrels daily
92586 93596 94176 95210 96990 96992 97508(ii) Crude throughput 75257 75586 76653 77086 78083 79905 80550
4. World Oil Consumption(i) World Total Thousand
barrels daily
88722 89729 90675 92114 93025 95003 96558
(ii) Main consuming areas1 52313 52958 53744 54900 55903 57210 58166(iii) Consumption in main
areas as % of world % 59.0 59.0 59.3 59.6 60.1 60.2 60.2
5. World Imports(i) Crude Oil
MMT2065 2052 2077 2024 2007 2076 2200
(ii) Pol. Products 1139 1187 1181 1224 1242 1333 1363 Total 3204 3239 3259 3247 3250 3409 3563
6. Export of Crude Oil & POL from OPEC(i) Crude Oil
MMT1151 1182 1260 1188 1152 1170 1246
(ii) Pol. Products 167 210 189 189 184 201 242 Total 1318 1392 1448 1377 1336 1370 1488
7. World Primary Energy Consumption(i) Oil
MTOE
4085 4126 4176 4221 4255 4341 4418(ii) Natural Gas 2874 2926 3011 3054 3073 3147 3204(iii) Coal 3636 3807 3817 3887 3889 3785 3732(iv) Hydro-Electric 779 792 832 859 879 883 910(v) Nuclear Energy 626 600 559 564 575 583 592(vi) Renewables 170 204 239 281 317 367 420 Total 12170 12455 12634 12866 12989 13105 13276
1: Includes USA, Canada, Brazil, Germany, Japan, China, Russia, Saudi Arabia, India and South Korea.
TMT: Thousand Million Tonnes, TCM: Trillion Cubic Meters, MMT: Million Metric Tonnes, MTOE: Million Tonnes Oil Equivalent
Source : (i) BP Statistical Review of World Energy , June-2017 (ii) OPEC Annual Statistical Bulletins, 2015, 2016 & 2017
CHAPTER ICHAPTER II
CHAPTER IIICHAPTER IV
CHAPTER VCHAPTER VI
CHAPTER VIICHAPTER VIII
CHAPTER IXCHAPTER X
CHAPTER XIAPPEN
DIX

12
I. 10(a) Petroleum Energy in India (Calendar Year-wise)Products 2010 2011 2012 2013 2014 2015 2016 (P)
(1) (2) (3) (4) (5) (6) (7) (8)Availability
In Original Units (Million Tonnes)Kerosene 9.20 8.61 7.98 7.37 7.62 7.46 6.53ATF 4.95 5.45 5.37 5.48 5.63 6.10 6.77Diesel 60.66 63.10 69.27 67.53 69.38 73.71 76.32Fuel Oils 14.70 12.41 10.32 8.83 7.63 8.07 9.00Others1 37.66 43.06 45.69 45.72 51.49 56.48 59.79Total 127.16 132.64 138.63 134.93 141.76 151.83 158.41In Million Tonnes of Coal Equivalent Unit2
Kerosene 18.40 17.22 15.96 14.74 15.24 14.92 13.06ATF 9.90 10.90 10.74 10.96 11.26 12.20 13.54Diesel 121.32 126.20 138.54 135.06 138.76 147.42 152.64Fuel Oils 29.40 24.82 20.64 17.66 15.26 16.14 18.00Others1 75.32 86.12 91.38 91.44 102.98 112.96 119.58Total 254.34 265.26 277.26 269.86 283.50 303.64 316.82In Million Tonnes of Coal Replacement Unit2
Kerosene 73.60 68.88 63.84 58.96 60.96 59.68 52.24ATF 37.13 40.88 40.28 41.10 42.23 45.75 50.78Diesel 545.94 567.90 623.43 607.77 624.42 663.39 686.88Fuel Oils 29.40 24.82 20.64 17.66 15.26 16.14 18.00Others1 124.74 124.74 126.37 126.37 126.37 126.37 126.37Total 810.81 827.22 874.56 851.86 869.24 911.33 934.27
Consumption3
In Original Units (Million Tonnes)Kerosene 9.00 8.43 7.65 7.25 7.13 6.89 5.93ATF 4.82 5.32 5.14 5.26 5.68 6.10 6.81Diesel 58.05 63.50 68.58 68.88 69.38 73.07 77.19Fuel Oils 9.81 8.47 7.00 5.34 5.88 6.23 7.51Others1 42.96 46.28 48.70 49.56 53.59 58.48 65.03Total 124.64 132.01 137.07 136.28 141.65 150.76 162.47In Million Tonnes of Coal Equivalent Unit2
Kerosene 18.00 16.87 15.31 14.50 14.25 13.77 11.86ATF 9.64 10.65 10.27 10.52 11.36 12.19 13.61Diesel 116.09 127.01 137.16 137.76 138.75 146.14 154.37Fuel Oils 19.62 16.95 14.00 10.67 11.76 12.45 15.02Others1 85.92 92.55 97.40 99.11 107.18 116.96 130.07Total 249.27 264.02 274.15 272.56 283.30 301.51 324.94In Million Tonnes of Coal Replacement Unit2
Kerosene 72.00 67.47 61.24 58.00 57.02 55.10 47.45ATF 36.16 39.93 38.51 39.44 42.59 45.71 51.05Diesel 522.42 571.54 617.23 619.93 624.38 657.61 694.67Fuel Oils 19.62 16.95 14.00 10.67 11.76 12.45 15.02Others1 128.94 128.94 128.94 128.94 128.94 128.94 128.94Total 779.14 824.83 859.93 856.98 864.68 899.82 937.13
Note: P: Provisional
1. Others excludes Naphtha, Lube, Bitumen, Petroleum coke, Paraffin wax & other petroleum products and includes LPG Gasoline, Refinery Boiler Fuel.
2. Based on conversion factors adopted by FPC, 1974
3. Includes Petroleum Products used for power generation.
CHAP
TER
ICH
APTE
R II
CHAP
TER
IIICH
APTE
R IV
CHAP
TER
VCH
APTE
R VI
CHAP
TER
VII
CHAP
TER
VIII
CHAP
TER
IXCH
APTE
R X
CHAP
TER
XIAP
PEN
DIX
13
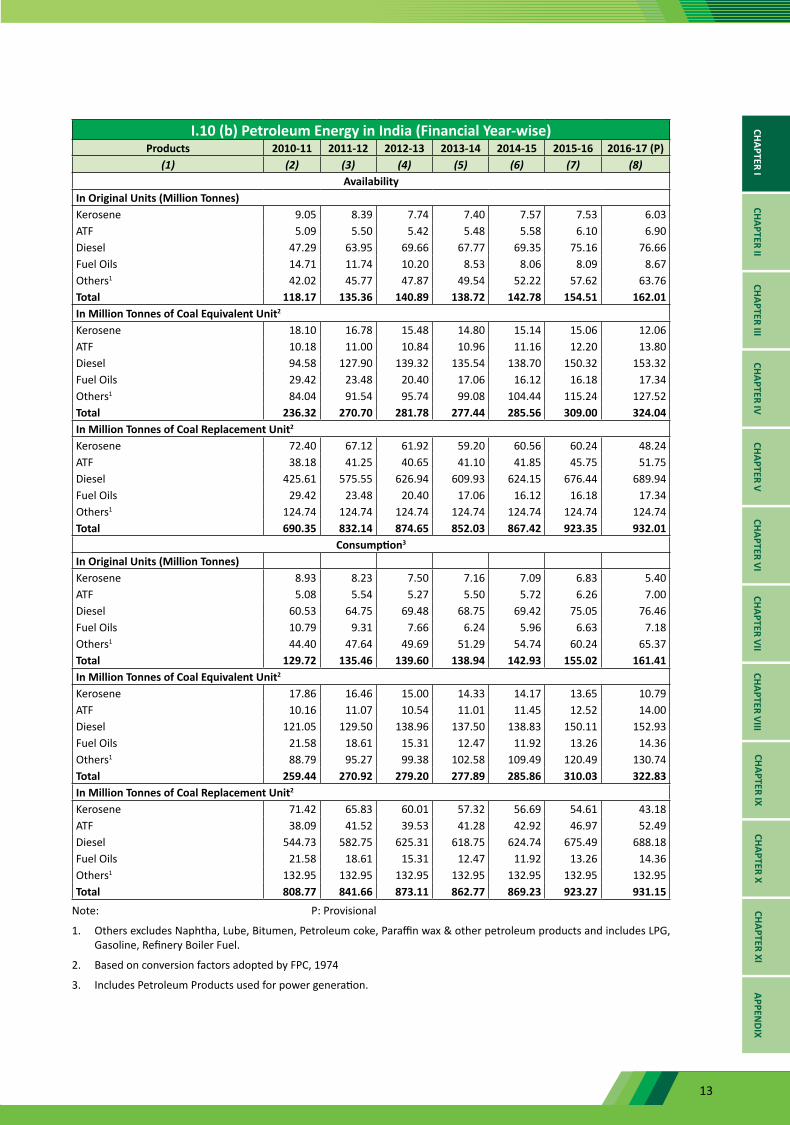
I.10 (b) Petroleum Energy in India (Financial Year-wise)Products 2010-11 2011-12 2012-13 2013-14 2014-15 2015-16 2016-17 (P)
(1) (2) (3) (4) (5) (6) (7) (8)Availability
In Original Units (Million Tonnes)Kerosene 9.05 8.39 7.74 7.40 7.57 7.53 6.03ATF 5.09 5.50 5.42 5.48 5.58 6.10 6.90Diesel 47.29 63.95 69.66 67.77 69.35 75.16 76.66Fuel Oils 14.71 11.74 10.20 8.53 8.06 8.09 8.67Others1 42.02 45.77 47.87 49.54 52.22 57.62 63.76Total 118.17 135.36 140.89 138.72 142.78 154.51 162.01In Million Tonnes of Coal Equivalent Unit2
Kerosene 18.10 16.78 15.48 14.80 15.14 15.06 12.06ATF 10.18 11.00 10.84 10.96 11.16 12.20 13.80Diesel 94.58 127.90 139.32 135.54 138.70 150.32 153.32Fuel Oils 29.42 23.48 20.40 17.06 16.12 16.18 17.34Others1 84.04 91.54 95.74 99.08 104.44 115.24 127.52Total 236.32 270.70 281.78 277.44 285.56 309.00 324.04In Million Tonnes of Coal Replacement Unit2
Kerosene 72.40 67.12 61.92 59.20 60.56 60.24 48.24ATF 38.18 41.25 40.65 41.10 41.85 45.75 51.75Diesel 425.61 575.55 626.94 609.93 624.15 676.44 689.94Fuel Oils 29.42 23.48 20.40 17.06 16.12 16.18 17.34Others1 124.74 124.74 124.74 124.74 124.74 124.74 124.74Total 690.35 832.14 874.65 852.03 867.42 923.35 932.01
Consumption3
In Original Units (Million Tonnes)Kerosene 8.93 8.23 7.50 7.16 7.09 6.83 5.40ATF 5.08 5.54 5.27 5.50 5.72 6.26 7.00Diesel 60.53 64.75 69.48 68.75 69.42 75.05 76.46Fuel Oils 10.79 9.31 7.66 6.24 5.96 6.63 7.18Others1 44.40 47.64 49.69 51.29 54.74 60.24 65.37Total 129.72 135.46 139.60 138.94 142.93 155.02 161.41In Million Tonnes of Coal Equivalent Unit2
Kerosene 17.86 16.46 15.00 14.33 14.17 13.65 10.79ATF 10.16 11.07 10.54 11.01 11.45 12.52 14.00Diesel 121.05 129.50 138.96 137.50 138.83 150.11 152.93Fuel Oils 21.58 18.61 15.31 12.47 11.92 13.26 14.36Others1 88.79 95.27 99.38 102.58 109.49 120.49 130.74Total 259.44 270.92 279.20 277.89 285.86 310.03 322.83In Million Tonnes of Coal Replacement Unit2
Kerosene 71.42 65.83 60.01 57.32 56.69 54.61 43.18ATF 38.09 41.52 39.53 41.28 42.92 46.97 52.49Diesel 544.73 582.75 625.31 618.75 624.74 675.49 688.18Fuel Oils 21.58 18.61 15.31 12.47 11.92 13.26 14.36Others1 132.95 132.95 132.95 132.95 132.95 132.95 132.95Total 808.77 841.66 873.11 862.77 869.23 923.27 931.15
Note: P: Provisional
1. Others excludes Naphtha, Lube, Bitumen, Petroleum coke, Paraffin wax & other petroleum products and includes LPG, Gasoline, Refinery Boiler Fuel.
2. Based on conversion factors adopted by FPC, 1974
3. Includes Petroleum Products used for power generation.
CHAPTER ICHAPTER II
CHAPTER IIICHAPTER IV
CHAPTER VCHAPTER VI
CHAPTER VIICHAPTER VIII
CHAPTER IXCHAPTER X
CHAPTER XIAPPEN
DIX
14
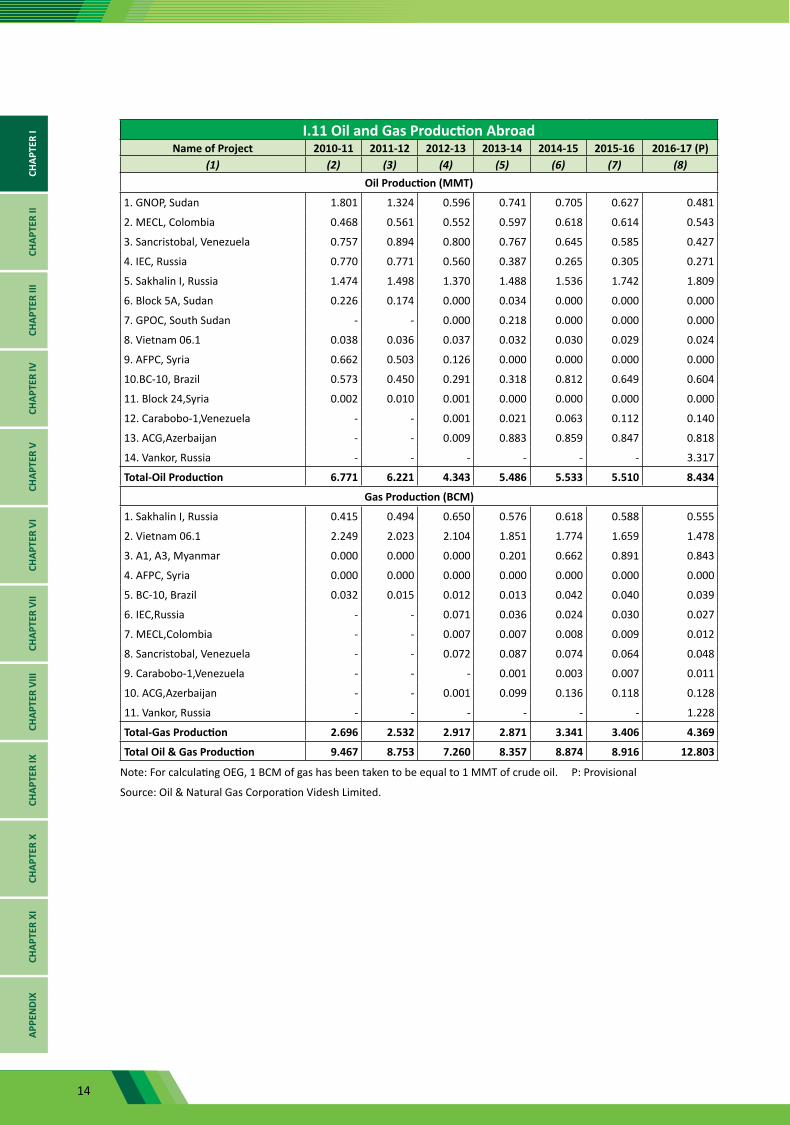
I.11 Oil and Gas Production AbroadName of Project 2010-11 2011-12 2012-13 2013-14 2014-15 2015-16 2016-17 (P)
(1) (2) (3) (4) (5) (6) (7) (8)Oil Production (MMT)
1. GNOP, Sudan 1.801 1.324 0.596 0.741 0.705 0.627 0.481
2. MECL, Colombia 0.468 0.561 0.552 0.597 0.618 0.614 0.543
3. Sancristobal, Venezuela 0.757 0.894 0.800 0.767 0.645 0.585 0.427
4. IEC, Russia 0.770 0.771 0.560 0.387 0.265 0.305 0.271
5. Sakhalin I, Russia 1.474 1.498 1.370 1.488 1.536 1.742 1.809
6. Block 5A, Sudan 0.226 0.174 0.000 0.034 0.000 0.000 0.000
7. GPOC, South Sudan - - 0.000 0.218 0.000 0.000 0.000
8. Vietnam 06.1 0.038 0.036 0.037 0.032 0.030 0.029 0.024
9. AFPC, Syria 0.662 0.503 0.126 0.000 0.000 0.000 0.000
10.BC-10, Brazil 0.573 0.450 0.291 0.318 0.812 0.649 0.604
11. Block 24,Syria 0.002 0.010 0.001 0.000 0.000 0.000 0.000
12. Carabobo-1,Venezuela - - 0.001 0.021 0.063 0.112 0.140
13. ACG,Azerbaijan - - 0.009 0.883 0.859 0.847 0.818
14. Vankor, Russia - - - - - - 3.317
Total-Oil Production 6.771 6.221 4.343 5.486 5.533 5.510 8.434
Gas Production (BCM)
1. Sakhalin I, Russia 0.415 0.494 0.650 0.576 0.618 0.588 0.555
2. Vietnam 06.1 2.249 2.023 2.104 1.851 1.774 1.659 1.478
3. A1, A3, Myanmar 0.000 0.000 0.000 0.201 0.662 0.891 0.843
4. AFPC, Syria 0.000 0.000 0.000 0.000 0.000 0.000 0.000
5. BC-10, Brazil 0.032 0.015 0.012 0.013 0.042 0.040 0.039
6. IEC,Russia - - 0.071 0.036 0.024 0.030 0.027
7. MECL,Colombia - - 0.007 0.007 0.008 0.009 0.012
8. Sancristobal, Venezuela - - 0.072 0.087 0.074 0.064 0.048
9. Carabobo-1,Venezuela - - - 0.001 0.003 0.007 0.011
10. ACG,Azerbaijan - - 0.001 0.099 0.136 0.118 0.128
11. Vankor, Russia - - - - - - 1.228
Total-Gas Production 2.696 2.532 2.917 2.871 3.341 3.406 4.369
Total Oil & Gas Production 9.467 8.753 7.260 8.357 8.874 8.916 12.803
Note: For calculating OEG, 1 BCM of gas has been taken to be equal to 1 MMT of crude oil. P: Provisional
Source: Oil & Natural Gas Corporation Videsh Limited.
CHAP
TER
ICH
APTE
R II
CHAP
TER
IIICH
APTE
R IV
CHAP
TER
VCH
APTE
R VI
CHAP
TER
VII
CHAP
TER
VIII
CHAP
TER
IXCH
APTE
R X
CHAP
TER
XIAP
PEN
DIX
15
CHAPTER ICHAPTER II
CHAPTER IIICHAPTER IV
CHAPTER VCHAPTER VI
CHAPTER VIICHAPTER VIII
CHAPTER IXCHAPTER X
CHAPTER XIAPPEN
DIX
16
Chapter Highlights• With a view to explore oil and gas finds, over 4.91 lakh geological surveys have been
conducted in India and 540 wells (of which 74% are development wells) with 12.45 lakh meterage area drilled by Oil Companies up to 31.03.2017.
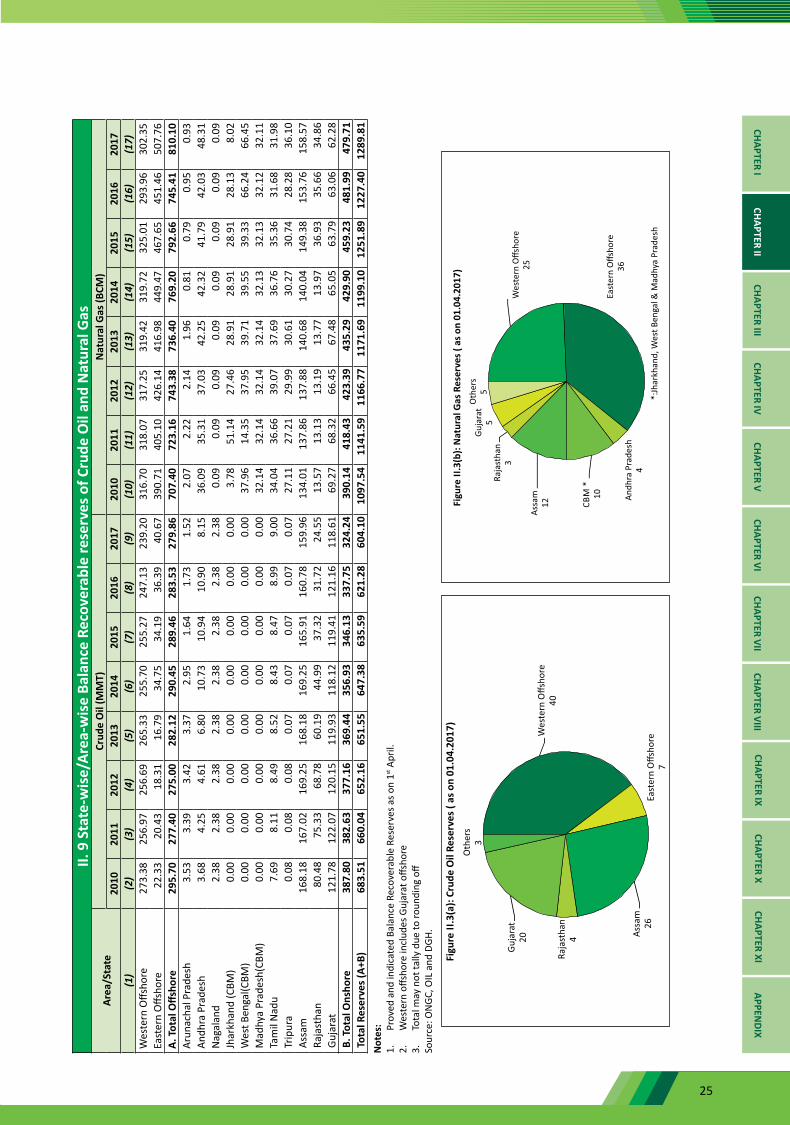
• Balance recoverable reserves of crude oil as on 01.04.2017 are at 604.10 MMT, out of which 279.86 MMT (46%) are in offshore. ONGC (nomination) has the largest share of 72% in reserves of crude oil with OIL (nomination) and PSC regime contributing 13% and 15% respectively.
• Balance recoverable reserves of natural gas as on 01.04.2017 were 1289.81 BCM, out of which 810.10 BCM (62%) are in offshore. PSC regime has the largest share of 49% in natural gas reserves with ONGC (nomination) and OIL (nomination) at 41% and 10% respectively.
• Out of total crude oil & condensate production of 31.01 MMT in 2016-17, 62% (22.218 MMT) is from ONGC (nomination), 9% (3.258 MMT) from OIL (nomination) and 29% (10.532 MMT) from PSC regime
• Out of total natural gas production of 31.897 BCM in 2016-17, 69% (22.088 BCM) is from ONGC (nomination), 9% (2.937 BCM) from OIL (nomination) and 22% (6.872 BCM)) from PSC regime.
• Maximum production of crude Oil (9.678 MMT) occurred in Mumbai High asset of ONGC and maximum production of natural gas (10.131 BCM) occurred in Bassein & Satellite fields of ONGC in 2016-17.
• Total consumption of natural gas in 2016-17 stands at 50.777 BCM as against 47.849 BCM in 2015-16. Out of 50.777 BCM, 29.534 BCM (58%) is consumed for energy purpose as fuel and the balance 42% is used for non-energy purpose as feedstock for various industries.
• In 2016-17 highest consumption of natural gas under energy purpose was in power sector at 11.616 BCM (39%) followed by City or Local Natural Gas Distribution Network at 7.350 BCM (25%). Under non-energy purpose, maximum consumption was seen in fertilizer industry at 15.428 BCM (73%) followed by petrochemical sector at 4.170 BCM (20%).
CHAP
TER
ICH
APTE
R II
CHAP
TER
IIICH
APTE
R IV
CHAP
TER
VCH
APTE
R VI
CHAP
TER
VII
CHAP
TER
VIII
CHAP
TER
IXCH
APTE
R X
CHAP
TER
XIAP
PEN
DIX

17
II.1 Area-wise Development of Deep Drilling Rigs, Wells & Metreage Drilled
YearOnshore Offshore Total
Rigs Wells Metreage Rigs Wells Metreage Rigs Wells Metreage(Numbers) ('000') (Numbers) ('000') (Numbers) ('000')
(1) (2) (3) (4) (5) (6) (7) (8) (9) (10) (A) Oil & Natural Gas Corporation Ltd. (Nomination)
2010-11 88 300 632 36 64 180 124 364 8122011-12 84 323 655 31 62 175 115 385 8292012-13 81 304 638 40 93 269 121 397 9072013-14 73 273 587 39 82 222 112 355 8092014-15 69 259 495 36 84 215 105 343 7102015-16 71 271 556 34 54 134 105 325 6892016-17 (P) 69 319 636 36 117 316 105 436 951
(B) Oil India Limited (Nomination)2010-11 20 35 114 - - - 20 35 1142011-12 16 34 117 - - - 16 34 1172012-13 17 37 128 - - - 17 37 1282013-14 15 34 105 - - - 15 34 1052014-15 17 36 131 - - - 17 36 1312015-16 20 44 143 - - - 20 44 1432016-17 (P) 19 56 169 - - - 19 56 169
(C ) PSC Regime2010-11 15 166 276 7 35 111 22 201 3872011-12 19 116 215 7 34 111 26 150 3262012-13 13 69 140 10 31 116 23 100 2562013-14 34 210 344 20 45 156 54 255 5002014-15 36 201 370 20 34 109 56 235 4782015-16 27 110 209 12 27 78 39 137 2862016-17 (P) 23 39 100 9 9 25 32 48 125
Total (A+B+C)2010-11 123 501 1022 43 99 291 166 600 13132011-12 119 473 987 38 96 285 157 569 12722012-13 111 410 906 50 124 385 161 534 12912013-14 122 517 1037 59 127 378 181 644 14152014-15 122 496 995 56 118 324 178 614 13192015-16 118 425 907 46 81 211 164 506 11182016-17 (P) 111 414 904 45 126 341 156 540 1245
Note: P: Provisional1. Number of rigs of ONGC and OIL may overlap in nomination and PSC regime blocks 2. Total may not tally due to rounding off Source: Oil & Natural Gas Corporation Ltd., Oil India Ltd & DGH
CHAPTER ICHAPTER II
CHAPTER IIICHAPTER IV
CHAPTER VCHAPTER VI
CHAPTER VIICHAPTER VIII
CHAPTER IXCHAPTER X
CHAPTER XIAPPEN
DIX
18
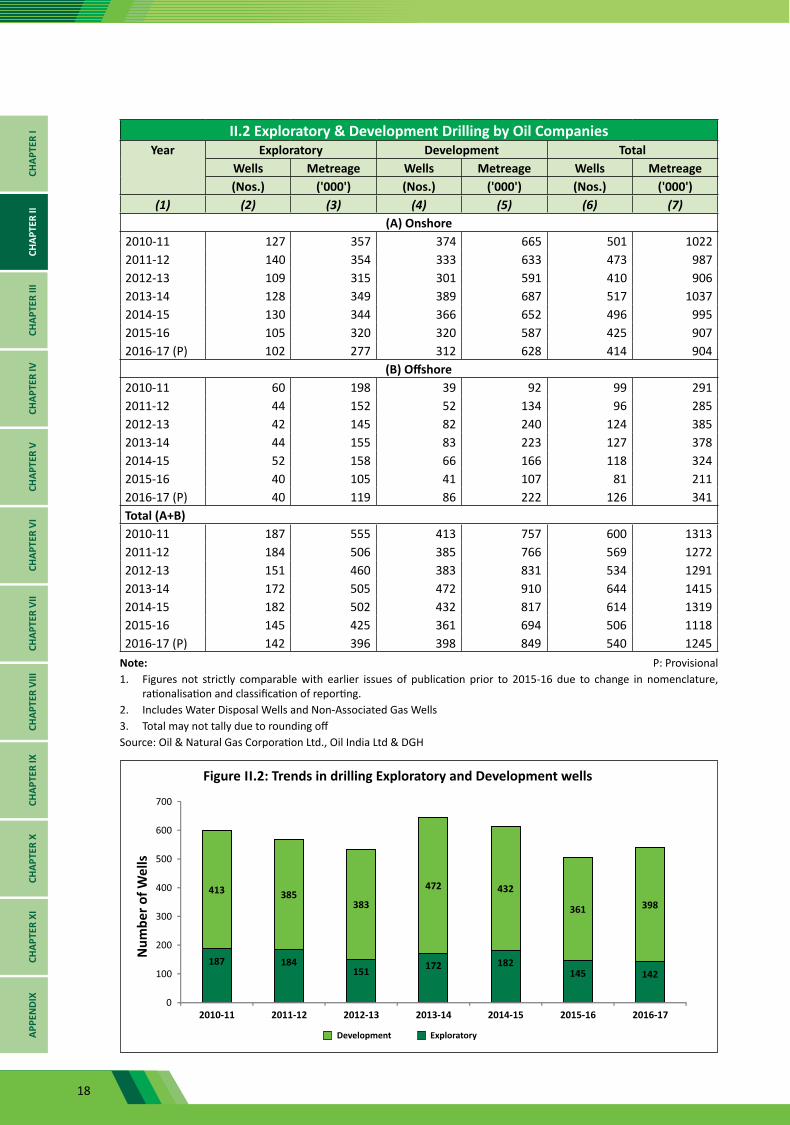
II.2 Exploratory & Development Drilling by Oil CompaniesYear Exploratory Development Total
Wells Metreage Wells Metreage Wells Metreage(Nos.) ('000') (Nos.) ('000') (Nos.) ('000')
(1) (2) (3) (4) (5) (6) (7)(A) Onshore
2010-11 127 357 374 665 501 10222011-12 140 354 333 633 473 9872012-13 109 315 301 591 410 9062013-14 128 349 389 687 517 10372014-15 130 344 366 652 496 9952015-16 105 320 320 587 425 9072016-17 (P) 102 277 312 628 414 904
(B) Offshore2010-11 60 198 39 92 99 2912011-12 44 152 52 134 96 2852012-13 42 145 82 240 124 3852013-14 44 155 83 223 127 3782014-15 52 158 66 166 118 3242015-16 40 105 41 107 81 2112016-17 (P) 40 119 86 222 126 341Total (A+B)2010-11 187 555 413 757 600 13132011-12 184 506 385 766 569 12722012-13 151 460 383 831 534 12912013-14 172 505 472 910 644 14152014-15 182 502 432 817 614 13192015-16 145 425 361 694 506 11182016-17 (P) 142 396 398 849 540 1245
Note: P: Provisional1. Figures not strictly comparable with earlier issues of publication prior to 2015-16 due to change in nomenclature,
rationalisation and classification of reporting. 2. Includes Water Disposal Wells and Non-Associated Gas Wells 3. Total may not tally due to rounding off Source: Oil & Natural Gas Corporation Ltd., Oil India Ltd & DGH
CHAP
TER
ICH
APTE
R II
CHAP
TER
IIICH
APTE
R IV
CHAP
TER
VCH
APTE
R VI
CHAP
TER
VII
CHAP
TER
VIII
CHAP
TER
IXCH
APTE
R X
CHAP
TER
XIAP
PEN
DIX
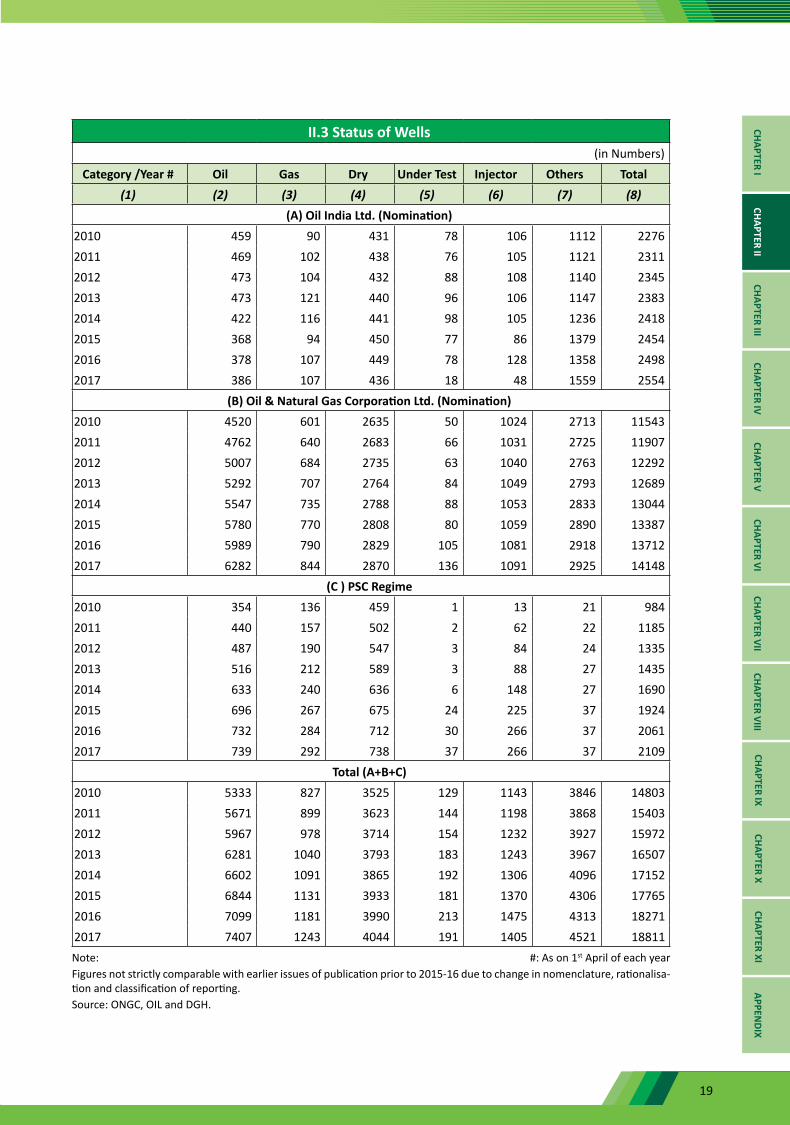
19
II.3 Status of Wells(in Numbers)
Category /Year # Oil Gas Dry Under Test Injector Others Total (1) (2) (3) (4) (5) (6) (7) (8)
(A) Oil India Ltd. (Nomination)2010 459 90 431 78 106 1112 22762011 469 102 438 76 105 1121 23112012 473 104 432 88 108 1140 23452013 473 121 440 96 106 1147 23832014 422 116 441 98 105 1236 24182015 368 94 450 77 86 1379 24542016 378 107 449 78 128 1358 24982017 386 107 436 18 48 1559 2554
(B) Oil & Natural Gas Corporation Ltd. (Nomination)2010 4520 601 2635 50 1024 2713 115432011 4762 640 2683 66 1031 2725 119072012 5007 684 2735 63 1040 2763 122922013 5292 707 2764 84 1049 2793 126892014 5547 735 2788 88 1053 2833 130442015 5780 770 2808 80 1059 2890 133872016 5989 790 2829 105 1081 2918 137122017 6282 844 2870 136 1091 2925 14148
(C ) PSC Regime2010 354 136 459 1 13 21 9842011 440 157 502 2 62 22 11852012 487 190 547 3 84 24 13352013 516 212 589 3 88 27 14352014 633 240 636 6 148 27 16902015 696 267 675 24 225 37 19242016 732 284 712 30 266 37 20612017 739 292 738 37 266 37 2109
Total (A+B+C)2010 5333 827 3525 129 1143 3846 148032011 5671 899 3623 144 1198 3868 154032012 5967 978 3714 154 1232 3927 159722013 6281 1040 3793 183 1243 3967 165072014 6602 1091 3865 192 1306 4096 171522015 6844 1131 3933 181 1370 4306 177652016 7099 1181 3990 213 1475 4313 182712017 7407 1243 4044 191 1405 4521 18811Note: #: As on 1st April of each yearFigures not strictly comparable with earlier issues of publication prior to 2015-16 due to change in nomenclature, rationalisa-tion and classification of reporting.Source: ONGC, OIL and DGH.
CHAPTER ICHAPTER II
CHAPTER IIICHAPTER IV
CHAPTER VCHAPTER VI
CHAPTER VIICHAPTER VIII
CHAPTER IXCHAPTER X
CHAPTER XIAPPEN
DIX
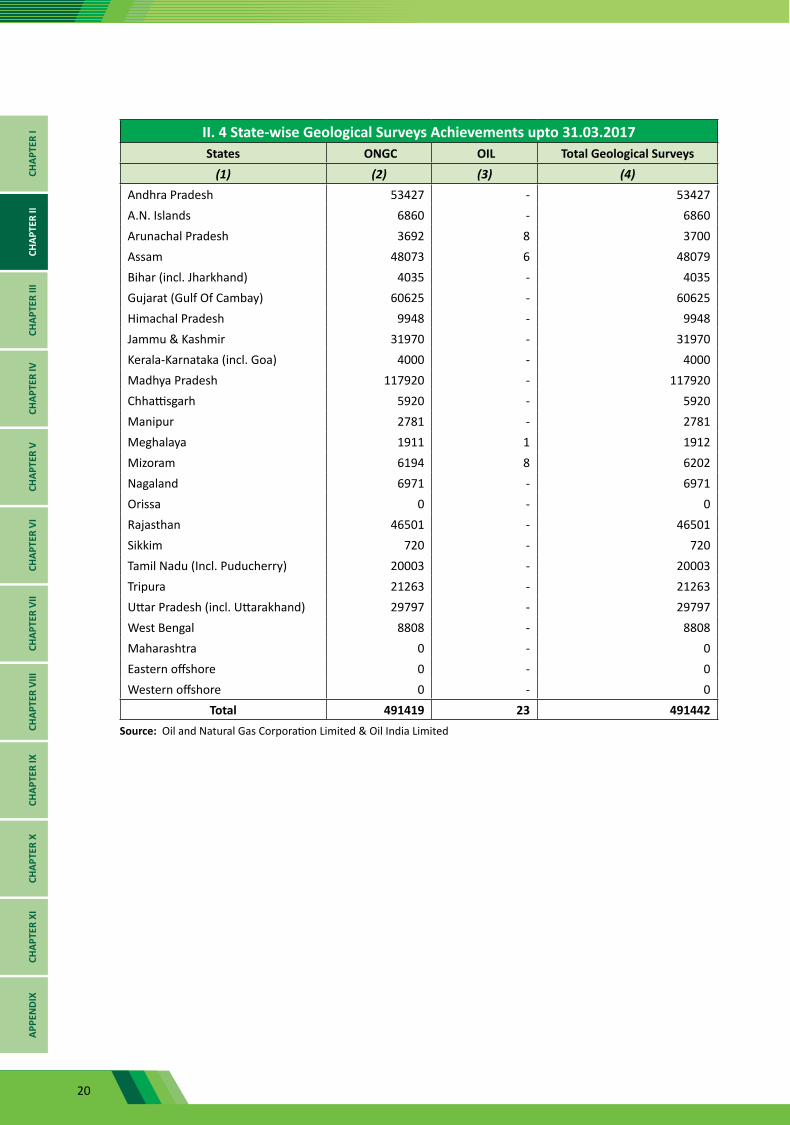
20
II. 4 State-wise Geological Surveys Achievements upto 31.03.2017States ONGC OIL Total Geological Surveys
(1) (2) (3) (4)Andhra Pradesh 53427 - 53427A.N. Islands 6860 - 6860Arunachal Pradesh 3692 8 3700Assam 48073 6 48079Bihar (incl. Jharkhand) 4035 - 4035Gujarat (Gulf Of Cambay) 60625 - 60625Himachal Pradesh 9948 - 9948Jammu & Kashmir 31970 - 31970Kerala-Karnataka (incl. Goa) 4000 - 4000Madhya Pradesh 117920 - 117920Chhattisgarh 5920 - 5920Manipur 2781 - 2781Meghalaya 1911 1 1912Mizoram 6194 8 6202Nagaland 6971 - 6971Orissa 0 - 0Rajasthan 46501 - 46501Sikkim 720 - 720Tamil Nadu (Incl. Puducherry) 20003 - 20003Tripura 21263 - 21263Uttar Pradesh (incl. Uttarakhand) 29797 - 29797West Bengal 8808 - 8808Maharashtra 0 - 0Eastern offshore 0 - 0Western offshore 0 - 0
Total 491419 23 491442Source: Oil and Natural Gas Corporation Limited & Oil India Limited
CHAP
TER
ICH
APTE
R II
CHAP
TER
IIICH
APTE
R IV
CHAP
TER
VCH
APTE
R VI
CHAP
TER
VII
CHAP
TER
VIII
CHAP
TER
IXCH
APTE
R X
CHAP
TER
XIAP
PEN
DIX
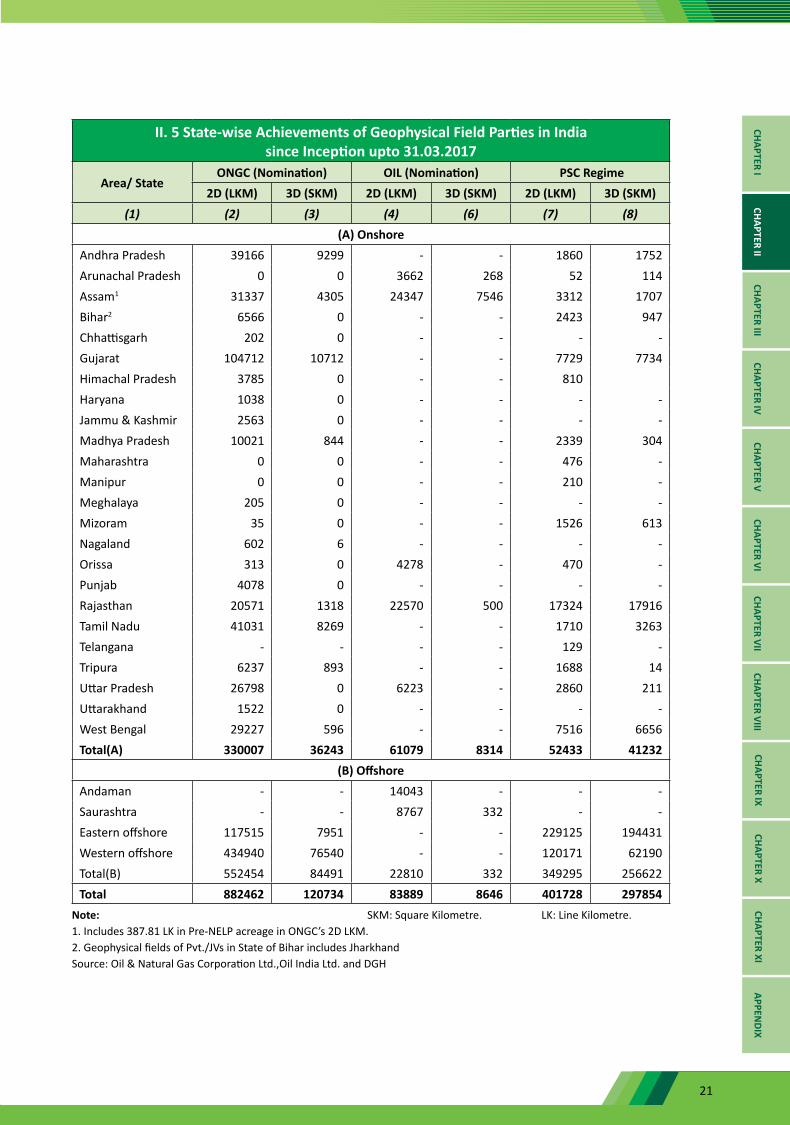
21
II. 5 State-wise Achievements of Geophysical Field Parties in India since Inception upto 31.03.2017
Area/ StateONGC (Nomination) OIL (Nomination) PSC Regime
2D (LKM) 3D (SKM) 2D (LKM) 3D (SKM) 2D (LKM) 3D (SKM)(1) (2) (3) (4) (6) (7) (8)
(A) OnshoreAndhra Pradesh 39166 9299 - - 1860 1752Arunachal Pradesh 0 0 3662 268 52 114Assam1 31337 4305 24347 7546 3312 1707Bihar2 6566 0 - - 2423 947Chhattisgarh 202 0 - - - -Gujarat 104712 10712 - - 7729 7734Himachal Pradesh 3785 0 - - 810Haryana 1038 0 - - - -Jammu & Kashmir 2563 0 - - - -Madhya Pradesh 10021 844 - - 2339 304Maharashtra 0 0 - - 476 -Manipur 0 0 - - 210 -Meghalaya 205 0 - - - -Mizoram 35 0 - - 1526 613Nagaland 602 6 - - - -Orissa 313 0 4278 - 470 -Punjab 4078 0 - - - -Rajasthan 20571 1318 22570 500 17324 17916Tamil Nadu 41031 8269 - - 1710 3263Telangana - - - - 129 -Tripura 6237 893 - - 1688 14Uttar Pradesh 26798 0 6223 - 2860 211Uttarakhand 1522 0 - - - -West Bengal 29227 596 - - 7516 6656Total(A) 330007 36243 61079 8314 52433 41232
(B) OffshoreAndaman - - 14043 - - -Saurashtra - - 8767 332 - -Eastern offshore 117515 7951 - - 229125 194431Western offshore 434940 76540 - - 120171 62190Total(B) 552454 84491 22810 332 349295 256622Total 882462 120734 83889 8646 401728 297854
Note: SKM: Square Kilometre. LK: Line Kilometre.1. Includes 387.81 LK in Pre-NELP acreage in ONGC’s 2D LKM.2. Geophysical fields of Pvt./JVs in State of Bihar includes JharkhandSource: Oil & Natural Gas Corporation Ltd.,Oil India Ltd. and DGH
CHAPTER ICHAPTER II
CHAPTER IIICHAPTER IV
CHAPTER VCHAPTER VI
CHAPTER VIICHAPTER VIII
CHAPTER IXCHAPTER X
CHAPTER XIAPPEN
DIX
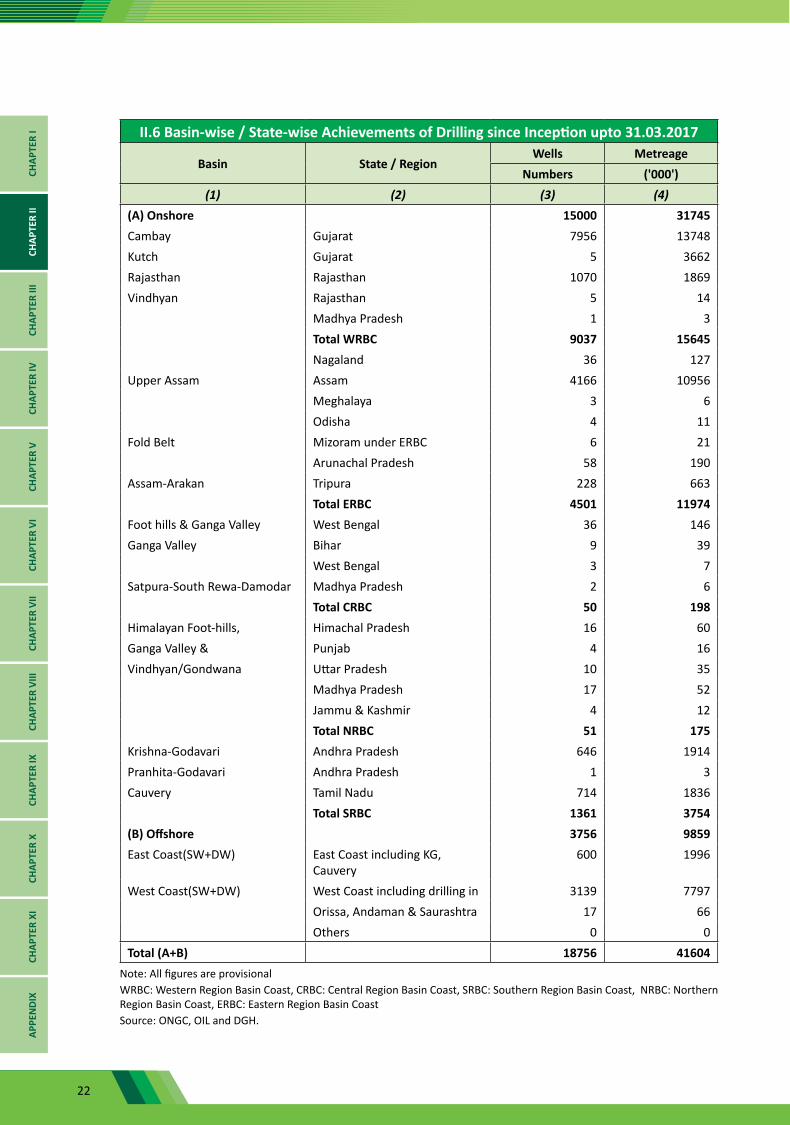
22
II.6 Basin-wise / State-wise Achievements of Drilling since Inception upto 31.03.2017
Basin State / RegionWells Metreage
Numbers ('000')(1) (2) (3) (4)
(A) Onshore 15000 31745Cambay Gujarat 7956 13748Kutch Gujarat 5 3662Rajasthan Rajasthan 1070 1869Vindhyan Rajasthan 5 14
Madhya Pradesh 1 3Total WRBC 9037 15645Nagaland 36 127
Upper Assam Assam 4166 10956Meghalaya 3 6Odisha 4 11
Fold Belt Mizoram under ERBC 6 21Arunachal Pradesh 58 190
Assam-Arakan Tripura 228 663 Total ERBC 4501 11974Foot hills & Ganga Valley West Bengal 36 146Ganga Valley Bihar 9 39
West Bengal 3 7Satpura-South Rewa-Damodar Madhya Pradesh 2 6
Total CRBC 50 198Himalayan Foot-hills, Himachal Pradesh 16 60Ganga Valley & Punjab 4 16Vindhyan/Gondwana Uttar Pradesh 10 35
Madhya Pradesh 17 52Jammu & Kashmir 4 12Total NRBC 51 175
Krishna-Godavari Andhra Pradesh 646 1914Pranhita-Godavari Andhra Pradesh 1 3Cauvery Tamil Nadu 714 1836
Total SRBC 1361 3754(B) Offshore 3756 9859East Coast(SW+DW) East Coast including KG,
Cauvery600 1996
West Coast(SW+DW) West Coast including drilling in 3139 7797Orissa, Andaman & Saurashtra 17 66Others 0 0
Total (A+B) 18756 41604Note: All figures are provisionalWRBC: Western Region Basin Coast, CRBC: Central Region Basin Coast, SRBC: Southern Region Basin Coast, NRBC: Northern Region Basin Coast, ERBC: Eastern Region Basin CoastSource: ONGC, OIL and DGH.
CHAP
TER
ICH
APTE
R II
CHAP
TER
IIICH
APTE
R IV
CHAP
TER
VCH
APTE
R VI
CHAP
TER
VII
CHAP
TER
VIII
CHAP
TER
IXCH
APTE
R X
CHAP
TER
XIAP
PEN
DIX
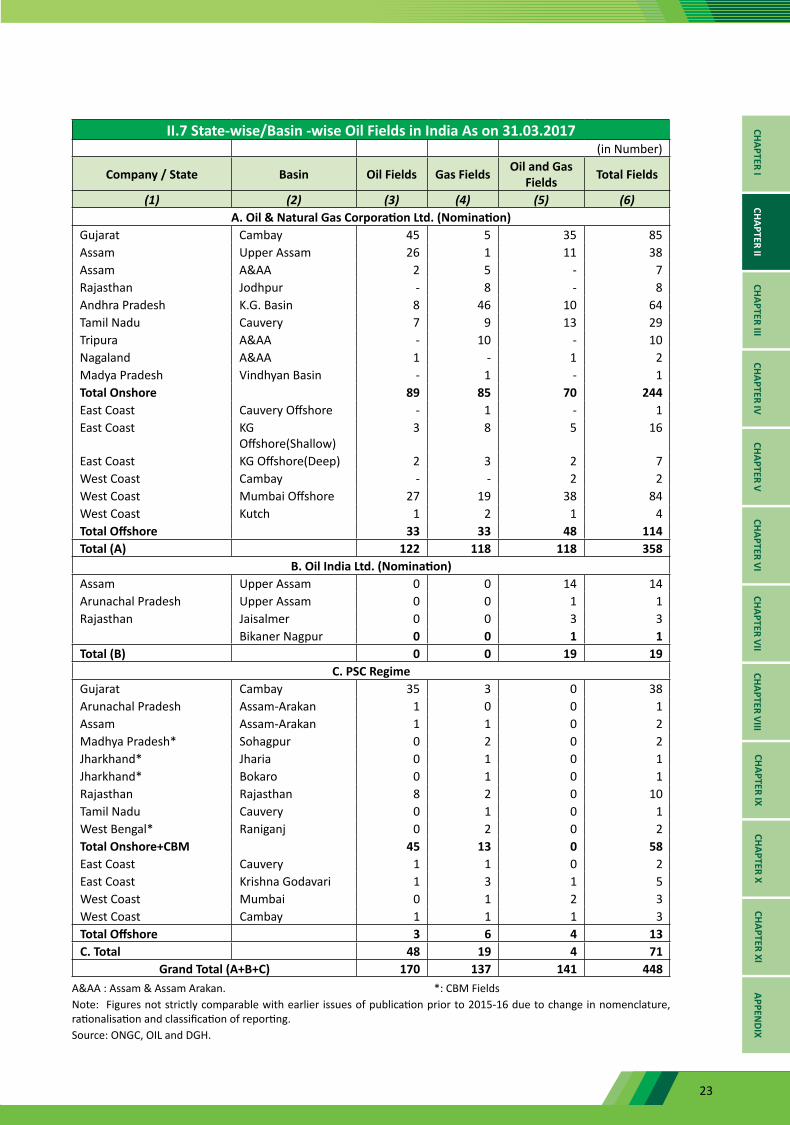
23
II.7 State-wise/Basin -wise Oil Fields in India As on 31.03.2017(in Number)
Company / State Basin Oil Fields Gas Fields Oil and Gas Fields Total Fields
(1) (2) (3) (4) (5) (6)A. Oil & Natural Gas Corporation Ltd. (Nomination)
Gujarat Cambay 45 5 35 85Assam Upper Assam 26 1 11 38Assam A&AA 2 5 - 7Rajasthan Jodhpur - 8 - 8Andhra Pradesh K.G. Basin 8 46 10 64Tamil Nadu Cauvery 7 9 13 29Tripura A&AA - 10 - 10Nagaland A&AA 1 - 1 2Madya Pradesh Vindhyan Basin - 1 - 1Total Onshore 89 85 70 244East Coast Cauvery Offshore - 1 - 1East Coast KG
Offshore(Shallow)3 8 5 16
East Coast KG Offshore(Deep) 2 3 2 7West Coast Cambay - - 2 2West Coast Mumbai Offshore 27 19 38 84West Coast Kutch 1 2 1 4Total Offshore 33 33 48 114Total (A) 122 118 118 358
B. Oil India Ltd. (Nomination)Assam Upper Assam 0 0 14 14Arunachal Pradesh Upper Assam 0 0 1 1Rajasthan Jaisalmer 0 0 3 3
Bikaner Nagpur 0 0 1 1Total (B) 0 0 19 19
C. PSC RegimeGujarat Cambay 35 3 0 38Arunachal Pradesh Assam-Arakan 1 0 0 1Assam Assam-Arakan 1 1 0 2Madhya Pradesh* Sohagpur 0 2 0 2Jharkhand* Jharia 0 1 0 1Jharkhand* Bokaro 0 1 0 1Rajasthan Rajasthan 8 2 0 10Tamil Nadu Cauvery 0 1 0 1West Bengal* Raniganj 0 2 0 2Total Onshore+CBM 45 13 0 58East Coast Cauvery 1 1 0 2East Coast Krishna Godavari 1 3 1 5West Coast Mumbai 0 1 2 3West Coast Cambay 1 1 1 3Total Offshore 3 6 4 13C. Total 48 19 4 71
Grand Total (A+B+C) 170 137 141 448A&AA : Assam & Assam Arakan. *: CBM FieldsNote: Figures not strictly comparable with earlier issues of publication prior to 2015-16 due to change in nomenclature, rationalisation and classification of reporting.Source: ONGC, OIL and DGH.
CHAPTER ICHAPTER II
CHAPTER IIICHAPTER IV
CHAPTER VCHAPTER VI
CHAPTER VIICHAPTER VIII
CHAPTER IXCHAPTER X
CHAPTER XIAPPEN
DIX
24
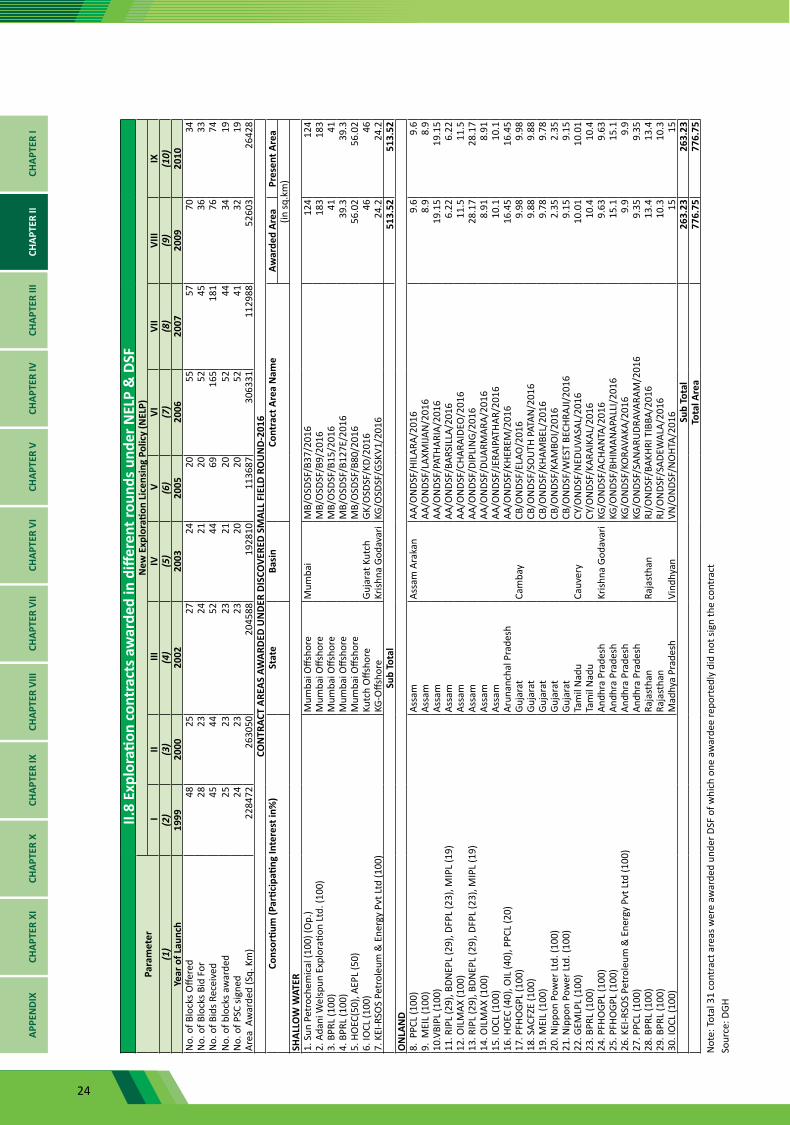
II.8
Expl
orati
on c
ontr
acts
aw
arde
d in
diff
eren
t rou
nds u
nder
NEL
P &
DSF
Para
met
erN
ew E
xplo
ratio
n Li
cens
ing
Polic
y (N
ELP)
III
III
IV V
VIVI
IVI
IIIX
(1)
(2)
(3)
(4)
(5)
(6)
(7)
(8)
(9)
(10)
Year
of L
aunc
h19
9920
0020
0220
0320
0520
0620
0720
0920
10N
o. o
f Blo
cks O
ffere
d48
2527
2420
5557
7034
No.
of B
lock
s Bid
For
2823
2421
2052
4536
33N
o. o
f Bid
s Rec
eive
d45
4452
4469
165
181
7674
No.
of b
lock
s aw
arde
d25
2323
2120
5244
3419
No.
of P
SC si
gned
2423
2320
2052
4132
19Ar
ea A
war
ded
(Sq.
Km
)22
8472
2630
5020
4588
1928
1011
3687
3063
3111
2988
5260
326
428
CON
TRAC
T AR
EAS
AWAR
DED
UN
DER
DISC
OVE
RED
SMAL
L FI
ELD
ROU
ND-
2016
Cons
ortiu
m (P
artic
ipati
ng In
tere
st in
%)
Stat
eBa
sin
Cont
ract
Are
a N
ame
Awar
ded
Area
Pres
ent A
rea
(in sq
.km
)SH
ALLO
W W
ATER
1. S
un P
etro
chem
ical
(100
) (O
p.)
Mum
bai O
ffsho
reM
umba
iM
B/O
SDSF
/B37
/201
612
412
42.
Ada
ni W
elsp
un E
xplo
ratio
n Lt
d. (1
00)
Mum
bai O
ffsho
reM
B/O
SDSF
/B9/
2016
183
183
3. B
PRL
(100
)M
umba
i Offs
hore
MB/
OSD
SF/B
15/2
016
4141
4. B
PRL
(100
)M
umba
i Offs
hore
MB/
OSD
SF/B
127E
/201
639
.339
.35.
HO
EC(5
0), A
EPL
(50)
M
umba
i Offs
hore
MB/
OSD
SF/B
80/2
016
56.0
256
.02
6. IO
CL (1
00)
Kutc
h O
ffsho
reGu
jara
t Kut
chGK
/OSD
SF/K
D/20
1646
467.
KEI
-RSO
S Pe
trol
eum
& E
nerg
y Pv
t Ltd
(100
)KG
-Offs
hore
Krish
na G
odav
ari
KG/O
SDSF
/GSK
V1/2
016
24.2
24.2
Sub
Tota
l51
3.52
513.
52O
NLA
ND
8. P
PCL
(100
)As
sam
Assa
m A
raka
nAA
/ON
DSF/
HILA
RA/2
016
9.6
9.6
9. M
EIL
(100
)As
sam
AA/O
NDS
F/LA
XMIJA
N/2
016
8.9
8.9
10.V
BIPL
(100
)As
sam
AA/O
NDS
F/PA
THAR
IA/2
016
19.1
519
.15
11. R
IPL
(29)
, BDN
EPL
(29)
, DFP
L (2
3), M
IPL
(19)
Assa
mAA
/ON
DSF/
BARS
ILLA
/201
66.
226.
2212
. OIL
MAX
(100
)As
sam
AA/O
NDS
F/CH
ARAI
DEO
/201
611
.511
.513
. RIP
L (2
9), B
DNEP
L (2
9), D
FPL
(23)
, MIP
L (1
9)As
sam
AA/O
NDS
F/DI
PLIN
G/20
1628
.17
28.1
714
. OIL
MAX
(100
)As
sam
AA/O
NDS
F/DU
ARM
ARA/
2016
8.91
8.91
15. I
OCL
(100
)As
sam
AA/O
NDS
F/JE
RAIP
ATHA
R/20
1610
.110
.116
. HO
EC (4
0), O
IL (4
0), P
PCL
(20)
Arun
anch
al P
rade
shAA
/ON
DSF/
KHER
EM/2
016
16.4
516
.45
17. P
FHO
GPL
(100
)Gu
jara
tCa
mba
yCB
/ON
DSF/
ELAO
/201
69.
989.
9818
. SAC
FZE
(100
)Gu
jara
tCB
/ON
DSF/
SOU
TH P
ATAN
/201
69.
889.
8819
. MEI
L (1
00)
Guja
rat
CB/O
NDS
F/KH
AMBE
L/20
169.
789.
7820
. Nip
pon
Pow
er Lt
d. (1
00)
Guja
rat
CB/O
NDS
F/KA
MBO
I/20
162.
352.
3521
. Nip
pon
Pow
er Lt
d. (1
00)
Guja
rat
CB/O
NDS
F/W
EST
BECH
RAJI/
2016
9.15
9.15
22. G
EMLP
L (1
00)
Tam
il N
adu
Cauv
ery
CY/O
NDS
F/N
EDU
VASA
L/20
1610
.01
10.0
123
. BPR
L (1
00)
Tam
il N
adu
CY/O
NDS
F/KA
RAIK
AL/2
016
10.4
10.4
24. P
FHO
GPL
(100
)An
dhra
Pra
desh
Krish
na G
odav
ari
KG/O
NDS
F/AC
HAN
TA/2
016
9.63
9.63
25. P
FHO
GPL
(100
)An
dhra
Pra
desh
KG/O
NDS
F/BH
IMAN
APAL
LI/2
016
15.1
15.1
26. K
EI-R
SOS
Petr
oleu
m &
Ene
rgy
Pvt L
td (1
00)
Andh
ra P
rade
shKG
/ON
DSF/
KORA
VAKA
/201
69.
99.
927
. PPC
L (1
00)
Andh
ra P
rade
shKG
/ON
DSF/
SAN
ARU
DRAV
ARAM
/201
69.
359.
3528
. BPR
L (1
00)
Raja
stha
nRa
jast
han
RJ/O
NDS
F/BA
KHRI
TIB
BA/2
016
13.4
13.4
29. B
PRL
(100
)Ra
jast
han
RJ/O
NDS
F/SA
DEW
ALA/
2016
10.3
10.3
30. I
OCL
(100
)M
adhy
a Pr
ades
hVi
ndhy
anVN
/ON
DSF/
NO
HTA/
2016
1515
Sub
Tota
l26
3.23
263.
23To
tal A
rea
776.
7577
6.75
Not
e: To
tal 3
1 co
ntra
ct a
reas
wer
e aw
arde
d un
der D
SF o
f whi
ch o
ne a
war
dee
repo
rted
ly d
id n
ot si
gn th
e co
ntra
ctSo
urce
: DGH
CHAP
TER
ICH
APTE
R II
CHAP
TER
IIICH
APTE
R IV
CHAP
TER
VCH
APTE
R VI
CHAP
TER
VII
CHAP
TER
VIII
CHAP
TER
IXCH
APTE
R X
CHAP
TER
XIAP
PEN
DIX
25
II. 9
Sta
te-w
ise/
Area
-wis
e Ba
lanc
e Re
cove
rabl
e re
serv
es o
f Cru
de O
il an
d N
atur
al G
asAr
ea/S
tate
Crud
e O
il (M
MT)
Nat
ural
Gas
(BCM
)20
1020
1120
1220
1320
1420
1520
1620
1720
1020
1120
1220
1320
1420
1520
1620
17(1
)(2
)(3
)(4
)(5
)(6
)(7
)(8
)(9
)(1
0)(1
1)(1
2)(1
3)(1
4)(1
5)(1
6)(1
7)W
este
rn O
ffsho
re27
3.38
256.
9725
6.69
265.
3325
5.70
255.
2724
7.13
239.
2031
6.70
318.
0731
7.25
319.
4231
9.72
325.
0129
3.96
302.
35Ea
ster
n O
ffsho
re22
.33
20.4
318
.31
16.7
934
.75
34.1
936
.39
40.6
739
0.71
405.
1042
6.14
416.
9844
9.47
467.
6545
1.46
507.
76A.
Tot
al O
ffsho
re29
5.70
277.
4027
5.00
282.
1229
0.45
289.
4628
3.53
279.
8670
7.40
723.
1674
3.38
736.
4076
9.20
792.
6674
5.41
810.
10Ar
unac
hal P
rade
sh3.
533.
393.
423.
372.
951.
641.
731.
522.
072.
222.
141.
960.
810.
790.
950.
93An
dhra
Pra
desh
3.68
4.25
4.61
6.80
10.7
310
.94
10.9
08.
1536
.09
35.3
137
.03
42.2
542
.32
41.7
942
.03
48.3
1N
agal
and
2.38
2.38
2.38
2.38
2.38
2.38
2.38
2.38
0.09
0.09
0.09
0.09
0.09
0.09
0.09
0.09
Jhar
khan
d (C
BM)
0.00
0.00
0.00
0.00
0.00
0.00
0.00
0.00
3.78
51.1
427
.46
28.9
128
.91
28.9
128
.13
8.02
Wes
t Ben
gal(C
BM)
0.00
0.00
0.00
0.00
0.00
0.00
0.00
0.00
37.9
614
.35
37.9
539
.71
39.5
539
.33
66.2
466
.45
Mad
hya
Prad
esh(
CBM
)0.
000.
000.
000.
000.
000.
000.
000.
0032
.14
32.1
432
.14
32.1
432
.13
32.1
332
.12
32.1
1Ta
mil
Nad
u7.
698.
118.
498.
528.
438.
478.
999.
0034
.04
36.6
639
.07
37.6
936
.76
35.3
631
.68
31.9
8Tr
ipur
a0.
080.
080.
080.
070.
070.
070.
070.
0727
.11
27.2
129
.99
30.6
130
.27
30.7
428
.28
36.1
0As
sam
168.
1816
7.02
169.
2516
8.18
169.
2516
5.91
160.
7815
9.96
134.
0113
7.86
137.
8814
0.68
140.
0414
9.38
153.
7615
8.57
Raja
stha
n80
.48
75.3
368
.78
60.1
944
.99
37.3
231
.72
24.5
513
.57
13.1
313
.19
13.7
713
.97
36.9
335
.66
34.8
6Gu
jara
t12
1.78
122.
0712
0.15
119.
9311
8.12
119.
4112
1.16
118.
6169
.27
68.3
266
.45
67.4
865
.05
63.7
963
.06
62.2
8B.
Tot
al O
nsho
re38
7.80
382.
6337
7.16
369.
4435
6.93
346.
1333
7.75
324.
2439
0.14
418.
4342
3.39
435.
2942
9.90
459.
2348
1.99
479.
71To
tal R
eser
ves (
A+B)
683.
5166
0.04
652.
1665
1.55
647.
3863
5.59
621.
2860
4.10
1097
.54
1141
.59
1166
.77
1171
.69
1199
.10
1251
.89
1227
.40
1289
.81
Not
es:
1.
Prov
ed a
nd in
dica
ted
Bala
nce
Reco
vera
ble
Rese
rves
as o
n 1st
Apr
il.2.
W
este
rn o
ffsho
re in
clud
es G
ujar
at o
ffsho
re3.
To
tal m
ay n
ot ta
lly d
ue to
roun
ding
off
Sour
ce: O
NGC
, OIL
and
DGH
.
CHAPTER ICHAPTER II
CHAPTER IIICHAPTER IV
CHAPTER VCHAPTER VI
CHAPTER VIICHAPTER VIII
CHAPTER IXCHAPTER X
CHAPTER XIAPPEN
DIX
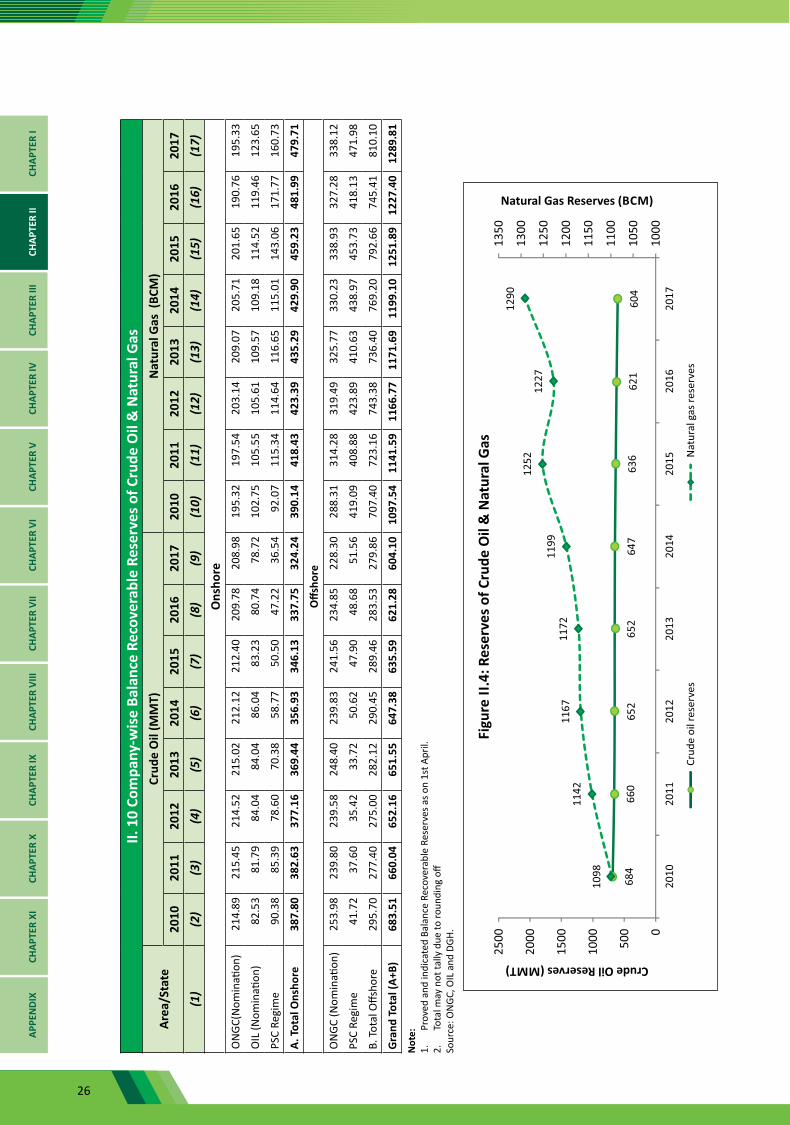
26
II. 1
0 Co
mpa
ny-w
ise
Bala
nce
Reco
vera
ble
Rese
rves
of C
rude
Oil
& N
atur
al G
as
Area
/Sta
teCr
ude
Oil
(MM
T)N
atur
al G
as (
BCM
)20
1020
1120
1220
1320
1420
1520
1620
1720
1020
1120
1220
1320
1420
1520
1620
17(1
)(2
)(3
)(4
)(5
)(6
)(7
)(8
)(9
)(1
0)(1
1)(1
2)(1
3)(1
4)(1
5)(1
6)(1
7)O
nsho
reO
NGC
(Nom
inati
on)
214.
8921
5.45
214.
5221
5.02
212.
1221
2.40
209.
7820
8.98
195.
3219
7.54
203.
1420
9.07
205.
7120
1.65
190.
7619
5.33
OIL
(Nom
inati
on)
82.5
381
.79
84.0
484
.04
86.0
483
.23
80.7
478
.72
102.
7510
5.55
105.
6110
9.57
109.
1811
4.52
119.
4612
3.65
PSC
Regi
me
90.3
885
.39
78.6
070
.38
58.7
750
.50
47.2
236
.54
92.0
711
5.34
114.
6411
6.65
115.
0114
3.06
171.
7716
0.73
A. T
otal
Ons
hore
387.
8038
2.63
377.
1636
9.44
356.
9334
6.13
337.
7532
4.24
390.
1441
8.43
423.
3943
5.29
429.
9045
9.23
481.
9947
9.71
Offs
hore
ON
GC (N
omin
ation
)25
3.98
239.
8023
9.58
248.
4023
9.83
241.
5623
4.85
228.
3028
8.31
314.
2831
9.49
325.
7733
0.23
338.
9332
7.28
338.
12
PSC
Regi
me
41.7
237
.60
35.4
233
.72
50.6
247
.90
48.6
851
.56
419.
0940
8.88
423.
8941
0.63
438.
9745
3.73
418.
1347
1.98
B. To
tal O
ffsho
re29
5.70
277.
4027
5.00
282.
1229
0.45
289.
4628
3.53
279.
8670
7.40
723.
1674
3.38
736.
4076
9.20
792.
6674
5.41
810.
10
Gra
nd T
otal
(A+B
)68
3.51
660.
0465
2.16
651.
5564
7.38
635.
5962
1.28
604.
1010
97.5
411
41.5
911
66.7
711
71.6
911
99.1
012
51.8
912
27.4
012
89.8
1N
ote:
1.
Prov
ed a
nd in
dica
ted
Bala
nce
Reco
vera
ble
Rese
rves
as o
n 1s
t Apr
il.2.
To
tal m
ay n
ot ta
lly d
ue to
roun
ding
off
Sour
ce: O
NGC
, OIL
and
DGH
.
CHAP
TER
ICH
APTE
R II
CHAP
TER
IIICH
APTE
R IV
CHAP
TER
VCH
APTE
R VI
CHAP
TER
VII
CHAP
TER
VIII
CHAP
TER
IXCH
APTE
R X
CHAP
TER
XIAP
PEN
DIX
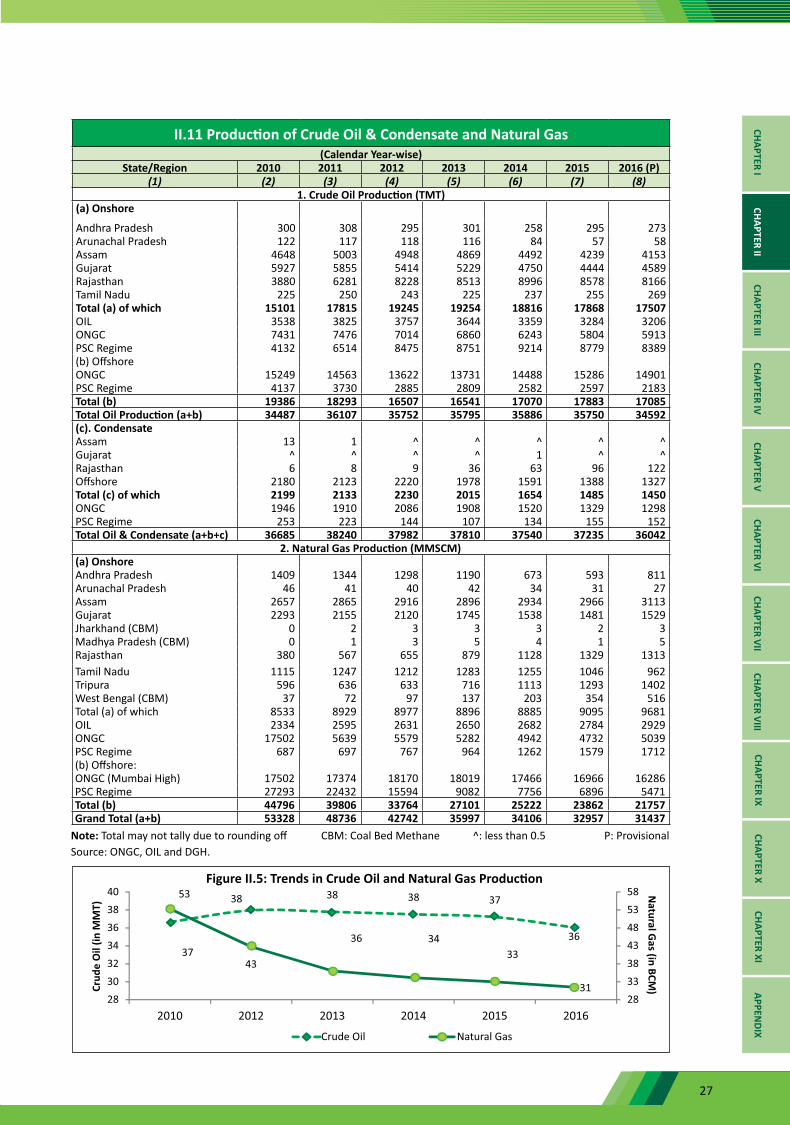
27
II.11 Production of Crude Oil & Condensate and Natural Gas(Calendar Year-wise)
State/Region 2010 2011 2012 2013 2014 2015 2016 (P)(1) (2) (3) (4) (5) (6) (7) (8)
1. Crude Oil Production (TMT)(a) Onshore
Andhra Pradesh 300 308 295 301 258 295 273Arunachal Pradesh 122 117 118 116 84 57 58Assam 4648 5003 4948 4869 4492 4239 4153Gujarat 5927 5855 5414 5229 4750 4444 4589Rajasthan 3880 6281 8228 8513 8996 8578 8166Tamil Nadu 225 250 243 225 237 255 269Total (a) of which 15101 17815 19245 19254 18816 17868 17507OIL 3538 3825 3757 3644 3359 3284 3206ONGC 7431 7476 7014 6860 6243 5804 5913PSC Regime 4132 6514 8475 8751 9214 8779 8389(b) OffshoreONGC 15249 14563 13622 13731 14488 15286 14901PSC Regime 4137 3730 2885 2809 2582 2597 2183Total (b) 19386 18293 16507 16541 17070 17883 17085Total Oil Production (a+b) 34487 36107 35752 35795 35886 35750 34592(c). CondensateAssam 13 1 ^ ^ ^ ^ ^Gujarat ^ ^ ^ ^ 1 ^ ^Rajasthan 6 8 9 36 63 96 122Offshore 2180 2123 2220 1978 1591 1388 1327Total (c) of which 2199 2133 2230 2015 1654 1485 1450ONGC 1946 1910 2086 1908 1520 1329 1298PSC Regime 253 223 144 107 134 155 152Total Oil & Condensate (a+b+c) 36685 38240 37982 37810 37540 37235 36042
2. Natural Gas Production (MMSCM)(a) OnshoreAndhra Pradesh 1409 1344 1298 1190 673 593 811Arunachal Pradesh 46 41 40 42 34 31 27Assam 2657 2865 2916 2896 2934 2966 3113Gujarat 2293 2155 2120 1745 1538 1481 1529Jharkhand (CBM) 0 2 3 3 3 2 3Madhya Pradesh (CBM) 0 1 3 5 4 1 5Rajasthan 380 567 655 879 1128 1329 1313Tamil Nadu 1115 1247 1212 1283 1255 1046 962Tripura 596 636 633 716 1113 1293 1402West Bengal (CBM) 37 72 97 137 203 354 516Total (a) of which 8533 8929 8977 8896 8885 9095 9681OIL 2334 2595 2631 2650 2682 2784 2929ONGC 17502 5639 5579 5282 4942 4732 5039PSC Regime 687 697 767 964 1262 1579 1712(b) Offshore:ONGC (Mumbai High) 17502 17374 18170 18019 17466 16966 16286PSC Regime 27293 22432 15594 9082 7756 6896 5471Total (b) 44796 39806 33764 27101 25222 23862 21757Grand Total (a+b) 53328 48736 42742 35997 34106 32957 31437
Note: Total may not tally due to rounding off CBM: Coal Bed Methane ^: less than 0.5 P: ProvisionalSource: ONGC, OIL and DGH.
CHAPTER ICHAPTER II
CHAPTER IIICHAPTER IV
CHAPTER VCHAPTER VI
CHAPTER VIICHAPTER VIII
CHAPTER IXCHAPTER X
CHAPTER XIAPPEN
DIX
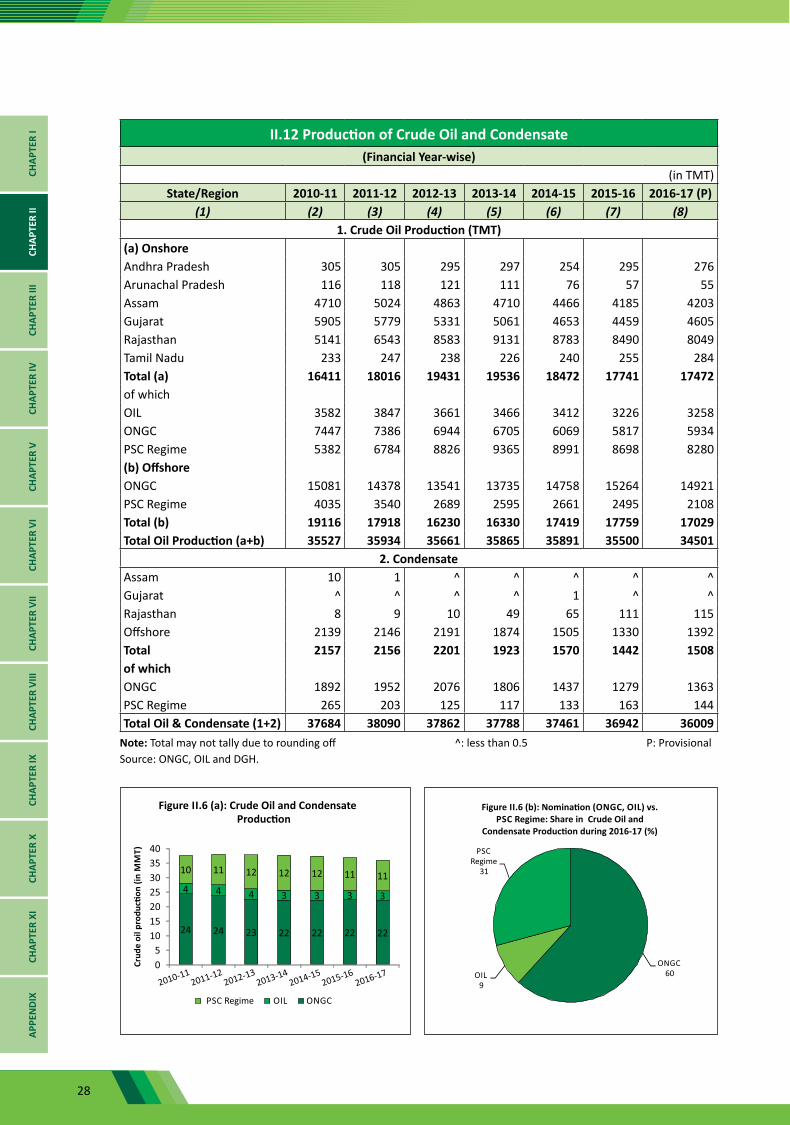
28
II.12 Production of Crude Oil and Condensate(Financial Year-wise)
(in TMT)State/Region 2010-11 2011-12 2012-13 2013-14 2014-15 2015-16 2016-17 (P)
(1) (2) (3) (4) (5) (6) (7) (8)1. Crude Oil Production (TMT)
(a) OnshoreAndhra Pradesh 305 305 295 297 254 295 276Arunachal Pradesh 116 118 121 111 76 57 55Assam 4710 5024 4863 4710 4466 4185 4203Gujarat 5905 5779 5331 5061 4653 4459 4605Rajasthan 5141 6543 8583 9131 8783 8490 8049Tamil Nadu 233 247 238 226 240 255 284Total (a) 16411 18016 19431 19536 18472 17741 17472of whichOIL 3582 3847 3661 3466 3412 3226 3258ONGC 7447 7386 6944 6705 6069 5817 5934PSC Regime 5382 6784 8826 9365 8991 8698 8280(b) OffshoreONGC 15081 14378 13541 13735 14758 15264 14921PSC Regime 4035 3540 2689 2595 2661 2495 2108Total (b) 19116 17918 16230 16330 17419 17759 17029Total Oil Production (a+b) 35527 35934 35661 35865 35891 35500 34501
2. Condensate Assam 10 1 ^ ^ ^ ^ ^Gujarat ^ ^ ^ ^ 1 ^ ^Rajasthan 8 9 10 49 65 111 115Offshore 2139 2146 2191 1874 1505 1330 1392Total 2157 2156 2201 1923 1570 1442 1508of whichONGC 1892 1952 2076 1806 1437 1279 1363PSC Regime 265 203 125 117 133 163 144Total Oil & Condensate (1+2) 37684 38090 37862 37788 37461 36942 36009
Note: Total may not tally due to rounding off ^: less than 0.5 P: ProvisionalSource: ONGC, OIL and DGH.
CHAP
TER
ICH
APTE
R II
CHAP
TER
IIICH
APTE
R IV
CHAP
TER
VCH
APTE
R VI
CHAP
TER
VII
CHAP
TER
VIII
CHAP
TER
IXCH
APTE
R X
CHAP
TER
XIAP
PEN
DIX
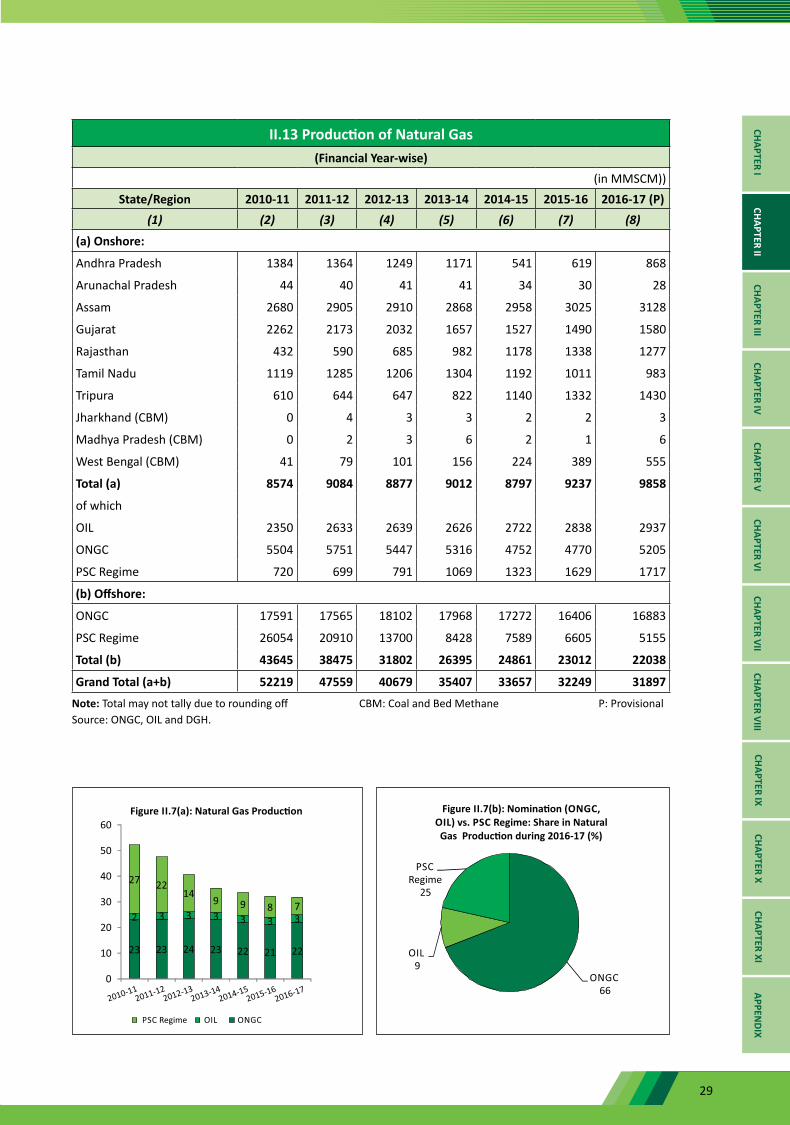
29
II.13 Production of Natural Gas(Financial Year-wise)
(in MMSCM))State/Region 2010-11 2011-12 2012-13 2013-14 2014-15 2015-16 2016-17 (P)
(1) (2) (3) (4) (5) (6) (7) (8)
(a) Onshore:
Andhra Pradesh 1384 1364 1249 1171 541 619 868
Arunachal Pradesh 44 40 41 41 34 30 28
Assam 2680 2905 2910 2868 2958 3025 3128
Gujarat 2262 2173 2032 1657 1527 1490 1580
Rajasthan 432 590 685 982 1178 1338 1277
Tamil Nadu 1119 1285 1206 1304 1192 1011 983
Tripura 610 644 647 822 1140 1332 1430
Jharkhand (CBM) 0 4 3 3 2 2 3
Madhya Pradesh (CBM) 0 2 3 6 2 1 6
West Bengal (CBM) 41 79 101 156 224 389 555
Total (a) 8574 9084 8877 9012 8797 9237 9858
of which
OIL 2350 2633 2639 2626 2722 2838 2937
ONGC 5504 5751 5447 5316 4752 4770 5205
PSC Regime 720 699 791 1069 1323 1629 1717
(b) Offshore:
ONGC 17591 17565 18102 17968 17272 16406 16883
PSC Regime 26054 20910 13700 8428 7589 6605 5155
Total (b) 43645 38475 31802 26395 24861 23012 22038
Grand Total (a+b) 52219 47559 40679 35407 33657 32249 31897
Note: Total may not tally due to rounding off CBM: Coal and Bed Methane P: ProvisionalSource: ONGC, OIL and DGH.
CHAPTER ICHAPTER II
CHAPTER IIICHAPTER IV
CHAPTER VCHAPTER VI
CHAPTER VIICHAPTER VIII
CHAPTER IXCHAPTER X
CHAPTER XIAPPEN
DIX
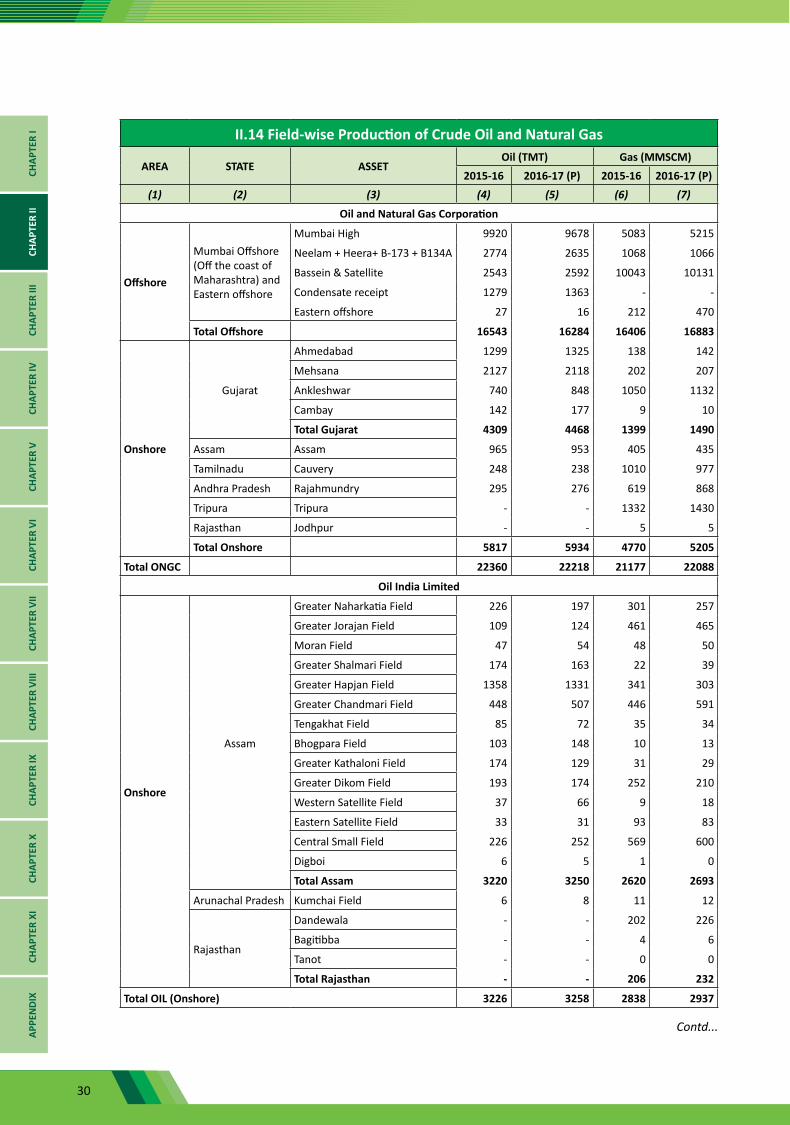
30
II.14 Field-wise Production of Crude Oil and Natural Gas
AREA STATE ASSETOil (TMT) Gas (MMSCM)
2015-16 2016-17 (P) 2015-16 2016-17 (P)(1) (2) (3) (4) (5) (6) (7)
Oil and Natural Gas Corporation
Offshore
Mumbai Offshore (Off the coast of Maharashtra) and Eastern offshore
Mumbai High 9920 9678 5083 5215
Neelam + Heera+ B-173 + B134A 2774 2635 1068 1066
Bassein & Satellite 2543 2592 10043 10131
Condensate receipt 1279 1363 - -
Eastern offshore 27 16 212 470
Total Offshore 16543 16284 16406 16883
Onshore
Gujarat
Ahmedabad 1299 1325 138 142
Mehsana 2127 2118 202 207
Ankleshwar 740 848 1050 1132
Cambay 142 177 9 10
Total Gujarat 4309 4468 1399 1490
Assam Assam 965 953 405 435
Tamilnadu Cauvery 248 238 1010 977
Andhra Pradesh Rajahmundry 295 276 619 868
Tripura Tripura - - 1332 1430
Rajasthan Jodhpur - - 5 5
Total Onshore 5817 5934 4770 5205
Total ONGC 22360 22218 21177 22088
Oil India Limited
Onshore
Assam
Greater Naharkatia Field 226 197 301 257
Greater Jorajan Field 109 124 461 465
Moran Field 47 54 48 50
Greater Shalmari Field 174 163 22 39
Greater Hapjan Field 1358 1331 341 303
Greater Chandmari Field 448 507 446 591
Tengakhat Field 85 72 35 34
Bhogpara Field 103 148 10 13
Greater Kathaloni Field 174 129 31 29
Greater Dikom Field 193 174 252 210
Western Satellite Field 37 66 9 18
Eastern Satellite Field 33 31 93 83
Central Small Field 226 252 569 600
Digboi 6 5 1 0
Total Assam 3220 3250 2620 2693
Arunachal Pradesh Kumchai Field 6 8 11 12
Rajasthan
Dandewala - - 202 226
Bagitibba - - 4 6
Tanot - - 0 0
Total Rajasthan - - 206 232
Total OIL (Onshore) 3226 3258 2838 2937
CHAP
TER
ICH
APTE
R II
CHAP
TER
IIICH
APTE
R IV
CHAP
TER
VCH
APTE
R VI
CHAP
TER
VII
CHAP
TER
VIII
CHAP
TER
IXCH
APTE
R X
CHAP
TER
XIAP
PEN
DIX
Contd...
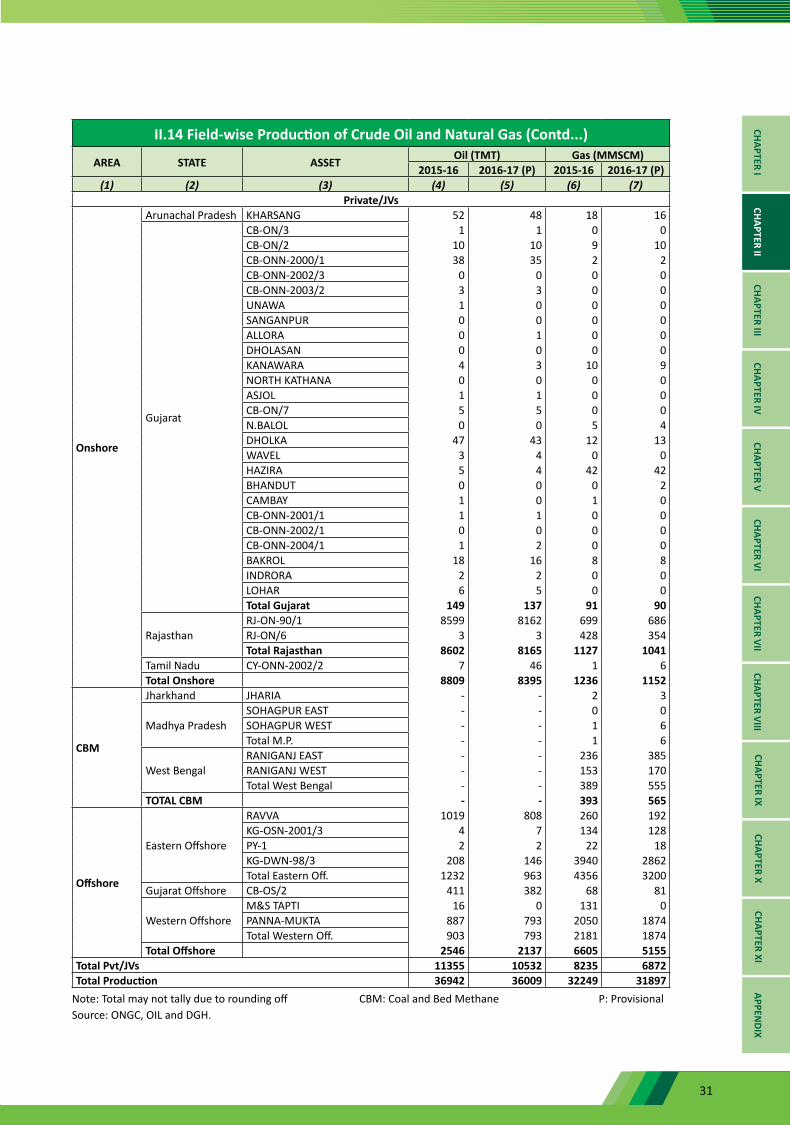
31
II.14 Field-wise Production of Crude Oil and Natural Gas (Contd...)
AREA STATE ASSET Oil (TMT) Gas (MMSCM)2015-16 2016-17 (P) 2015-16 2016-17 (P)
(1) (2) (3) (4) (5) (6) (7)Private/JVs
Onshore
Arunachal Pradesh KHARSANG 52 48 18 16
Gujarat
CB-ON/3 1 1 0 0CB-ON/2 10 10 9 10CB-ONN-2000/1 38 35 2 2CB-ONN-2002/3 0 0 0 0CB-ONN-2003/2 3 3 0 0UNAWA 1 0 0 0SANGANPUR 0 0 0 0ALLORA 0 1 0 0DHOLASAN 0 0 0 0KANAWARA 4 3 10 9NORTH KATHANA 0 0 0 0ASJOL 1 1 0 0CB-ON/7 5 5 0 0N.BALOL 0 0 5 4DHOLKA 47 43 12 13WAVEL 3 4 0 0HAZIRA 5 4 42 42BHANDUT 0 0 0 2CAMBAY 1 0 1 0CB-ONN-2001/1 1 1 0 0CB-ONN-2002/1 0 0 0 0CB-ONN-2004/1 1 2 0 0BAKROL 18 16 8 8INDRORA 2 2 0 0LOHAR 6 5 0 0Total Gujarat 149 137 91 90
RajasthanRJ-ON-90/1 8599 8162 699 686RJ-ON/6 3 3 428 354Total Rajasthan 8602 8165 1127 1041
Tamil Nadu CY-ONN-2002/2 7 46 1 6Total Onshore 8809 8395 1236 1152
CBM
Jharkhand JHARIA - - 2 3
Madhya PradeshSOHAGPUR EAST - - 0 0SOHAGPUR WEST - - 1 6Total M.P. - - 1 6
West BengalRANIGANJ EAST - - 236 385RANIGANJ WEST - - 153 170Total West Bengal - - 389 555
TOTAL CBM - - 393 565
Offshore
Eastern Offshore
RAVVA 1019 808 260 192KG-OSN-2001/3 4 7 134 128PY-1 2 2 22 18KG-DWN-98/3 208 146 3940 2862Total Eastern Off. 1232 963 4356 3200
Gujarat Offshore CB-OS/2 411 382 68 81
Western OffshoreM&S TAPTI 16 0 131 0PANNA-MUKTA 887 793 2050 1874Total Western Off. 903 793 2181 1874
Total Offshore 2546 2137 6605 5155Total Pvt/JVs 11355 10532 8235 6872Total Production 36942 36009 32249 31897
Note: Total may not tally due to rounding off CBM: Coal and Bed Methane P: ProvisionalSource: ONGC, OIL and DGH.
CHAPTER ICHAPTER II
CHAPTER IIICHAPTER IV
CHAPTER VCHAPTER VI
CHAPTER VIICHAPTER VIII
CHAPTER IXCHAPTER X
CHAPTER XIAPPEN
DIX
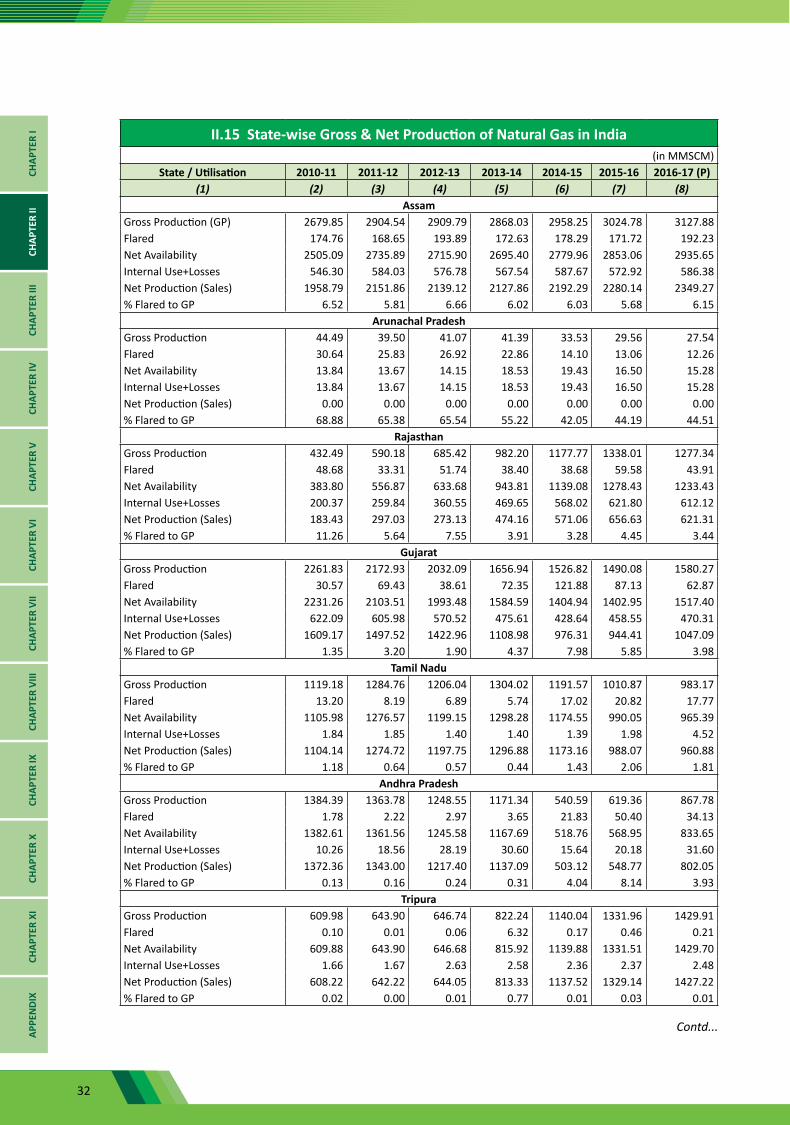
32
II.15 State-wise Gross & Net Production of Natural Gas in India(in MMSCM)
State / Utilisation 2010-11 2011-12 2012-13 2013-14 2014-15 2015-16 2016-17 (P)(1) (2) (3) (4) (5) (6) (7) (8)
Assam Gross Production (GP) 2679.85 2904.54 2909.79 2868.03 2958.25 3024.78 3127.88Flared 174.76 168.65 193.89 172.63 178.29 171.72 192.23Net Availability 2505.09 2735.89 2715.90 2695.40 2779.96 2853.06 2935.65Internal Use+Losses 546.30 584.03 576.78 567.54 587.67 572.92 586.38Net Production (Sales) 1958.79 2151.86 2139.12 2127.86 2192.29 2280.14 2349.27% Flared to GP 6.52 5.81 6.66 6.02 6.03 5.68 6.15
Arunachal PradeshGross Production 44.49 39.50 41.07 41.39 33.53 29.56 27.54Flared 30.64 25.83 26.92 22.86 14.10 13.06 12.26Net Availability 13.84 13.67 14.15 18.53 19.43 16.50 15.28Internal Use+Losses 13.84 13.67 14.15 18.53 19.43 16.50 15.28Net Production (Sales) 0.00 0.00 0.00 0.00 0.00 0.00 0.00% Flared to GP 68.88 65.38 65.54 55.22 42.05 44.19 44.51
RajasthanGross Production 432.49 590.18 685.42 982.20 1177.77 1338.01 1277.34Flared 48.68 33.31 51.74 38.40 38.68 59.58 43.91Net Availability 383.80 556.87 633.68 943.81 1139.08 1278.43 1233.43Internal Use+Losses 200.37 259.84 360.55 469.65 568.02 621.80 612.12Net Production (Sales) 183.43 297.03 273.13 474.16 571.06 656.63 621.31% Flared to GP 11.26 5.64 7.55 3.91 3.28 4.45 3.44
GujaratGross Production 2261.83 2172.93 2032.09 1656.94 1526.82 1490.08 1580.27Flared 30.57 69.43 38.61 72.35 121.88 87.13 62.87Net Availability 2231.26 2103.51 1993.48 1584.59 1404.94 1402.95 1517.40Internal Use+Losses 622.09 605.98 570.52 475.61 428.64 458.55 470.31Net Production (Sales) 1609.17 1497.52 1422.96 1108.98 976.31 944.41 1047.09% Flared to GP 1.35 3.20 1.90 4.37 7.98 5.85 3.98
Tamil Nadu Gross Production 1119.18 1284.76 1206.04 1304.02 1191.57 1010.87 983.17Flared 13.20 8.19 6.89 5.74 17.02 20.82 17.77Net Availability 1105.98 1276.57 1199.15 1298.28 1174.55 990.05 965.39Internal Use+Losses 1.84 1.85 1.40 1.40 1.39 1.98 4.52Net Production (Sales) 1104.14 1274.72 1197.75 1296.88 1173.16 988.07 960.88% Flared to GP 1.18 0.64 0.57 0.44 1.43 2.06 1.81
Andhra PradeshGross Production 1384.39 1363.78 1248.55 1171.34 540.59 619.36 867.78Flared 1.78 2.22 2.97 3.65 21.83 50.40 34.13Net Availability 1382.61 1361.56 1245.58 1167.69 518.76 568.95 833.65Internal Use+Losses 10.26 18.56 28.19 30.60 15.64 20.18 31.60Net Production (Sales) 1372.36 1343.00 1217.40 1137.09 503.12 548.77 802.05% Flared to GP 0.13 0.16 0.24 0.31 4.04 8.14 3.93
TripuraGross Production 609.98 643.90 646.74 822.24 1140.04 1331.96 1429.91Flared 0.10 0.01 0.06 6.32 0.17 0.46 0.21Net Availability 609.88 643.90 646.68 815.92 1139.88 1331.51 1429.70Internal Use+Losses 1.66 1.67 2.63 2.58 2.36 2.37 2.48Net Production (Sales) 608.22 642.22 644.05 813.33 1137.52 1329.14 1427.22% Flared to GP 0.02 0.00 0.01 0.77 0.01 0.03 0.01
CHAP
TER
ICH
APTE
R II
CHAP
TER
IIICH
APTE
R IV
CHAP
TER
VCH
APTE
R VI
CHAP
TER
VII
CHAP
TER
VIII
CHAP
TER
IXCH
APTE
R X
CHAP
TER
XIAP
PEN
DIX
Contd...
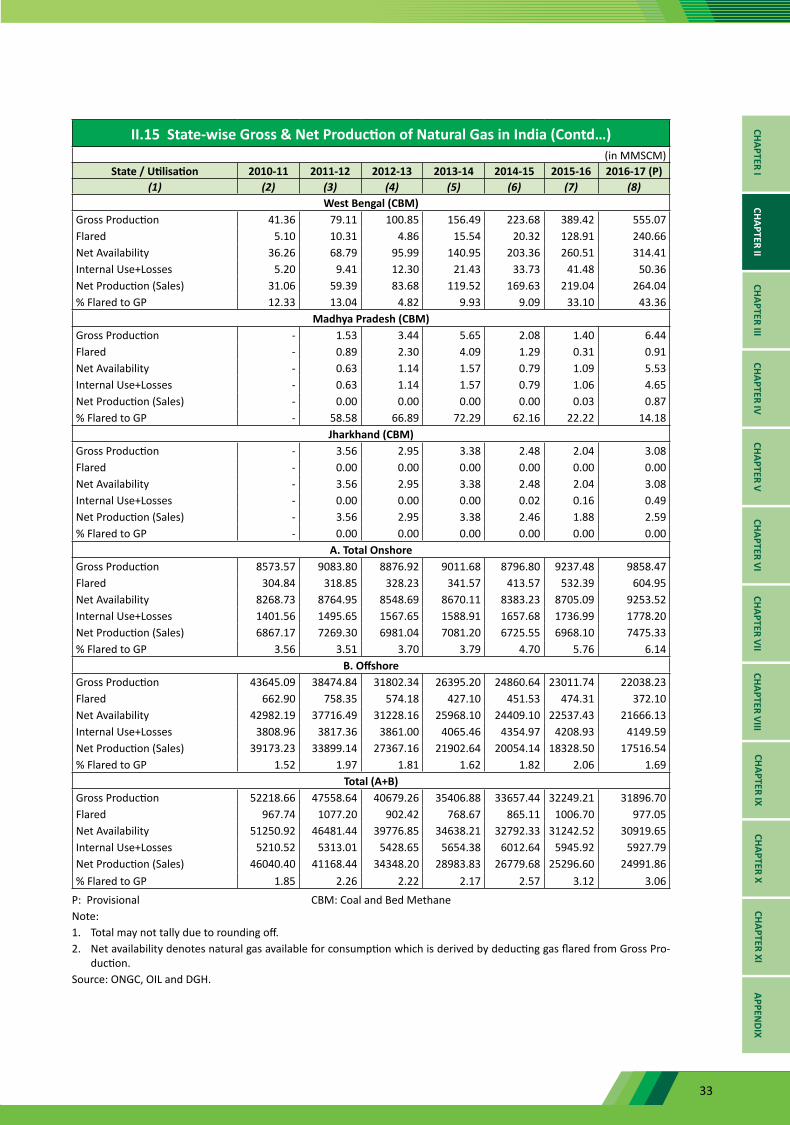
33
II.15 State-wise Gross & Net Production of Natural Gas in India (Contd…)(in MMSCM)
State / Utilisation 2010-11 2011-12 2012-13 2013-14 2014-15 2015-16 2016-17 (P)(1) (2) (3) (4) (5) (6) (7) (8)
West Bengal (CBM) Gross Production 41.36 79.11 100.85 156.49 223.68 389.42 555.07Flared 5.10 10.31 4.86 15.54 20.32 128.91 240.66Net Availability 36.26 68.79 95.99 140.95 203.36 260.51 314.41Internal Use+Losses 5.20 9.41 12.30 21.43 33.73 41.48 50.36Net Production (Sales) 31.06 59.39 83.68 119.52 169.63 219.04 264.04% Flared to GP 12.33 13.04 4.82 9.93 9.09 33.10 43.36
Madhya Pradesh (CBM)Gross Production - 1.53 3.44 5.65 2.08 1.40 6.44Flared - 0.89 2.30 4.09 1.29 0.31 0.91Net Availability - 0.63 1.14 1.57 0.79 1.09 5.53Internal Use+Losses - 0.63 1.14 1.57 0.79 1.06 4.65Net Production (Sales) - 0.00 0.00 0.00 0.00 0.03 0.87% Flared to GP - 58.58 66.89 72.29 62.16 22.22 14.18
Jharkhand (CBM)Gross Production - 3.56 2.95 3.38 2.48 2.04 3.08Flared - 0.00 0.00 0.00 0.00 0.00 0.00Net Availability - 3.56 2.95 3.38 2.48 2.04 3.08Internal Use+Losses - 0.00 0.00 0.00 0.02 0.16 0.49Net Production (Sales) - 3.56 2.95 3.38 2.46 1.88 2.59% Flared to GP - 0.00 0.00 0.00 0.00 0.00 0.00
A. Total OnshoreGross Production 8573.57 9083.80 8876.92 9011.68 8796.80 9237.48 9858.47Flared 304.84 318.85 328.23 341.57 413.57 532.39 604.95Net Availability 8268.73 8764.95 8548.69 8670.11 8383.23 8705.09 9253.52Internal Use+Losses 1401.56 1495.65 1567.65 1588.91 1657.68 1736.99 1778.20Net Production (Sales) 6867.17 7269.30 6981.04 7081.20 6725.55 6968.10 7475.33% Flared to GP 3.56 3.51 3.70 3.79 4.70 5.76 6.14
B. OffshoreGross Production 43645.09 38474.84 31802.34 26395.20 24860.64 23011.74 22038.23Flared 662.90 758.35 574.18 427.10 451.53 474.31 372.10Net Availability 42982.19 37716.49 31228.16 25968.10 24409.10 22537.43 21666.13Internal Use+Losses 3808.96 3817.36 3861.00 4065.46 4354.97 4208.93 4149.59Net Production (Sales) 39173.23 33899.14 27367.16 21902.64 20054.14 18328.50 17516.54% Flared to GP 1.52 1.97 1.81 1.62 1.82 2.06 1.69
Total (A+B)Gross Production 52218.66 47558.64 40679.26 35406.88 33657.44 32249.21 31896.70Flared 967.74 1077.20 902.42 768.67 865.11 1006.70 977.05Net Availability 51250.92 46481.44 39776.85 34638.21 32792.33 31242.52 30919.65Internal Use+Losses 5210.52 5313.01 5428.65 5654.38 6012.64 5945.92 5927.79Net Production (Sales) 46040.40 41168.44 34348.20 28983.83 26779.68 25296.60 24991.86% Flared to GP 1.85 2.26 2.22 2.17 2.57 3.12 3.06
P: Provisional CBM: Coal and Bed MethaneNote:1. Total may not tally due to rounding off. 2. Net availability denotes natural gas available for consumption which is derived by deducting gas flared from Gross Pro-
duction. Source: ONGC, OIL and DGH.
CHAPTER ICHAPTER II
CHAPTER IIICHAPTER IV
CHAPTER VCHAPTER VI
CHAPTER VIICHAPTER VIII
CHAPTER IXCHAPTER X
CHAPTER XIAPPEN
DIX
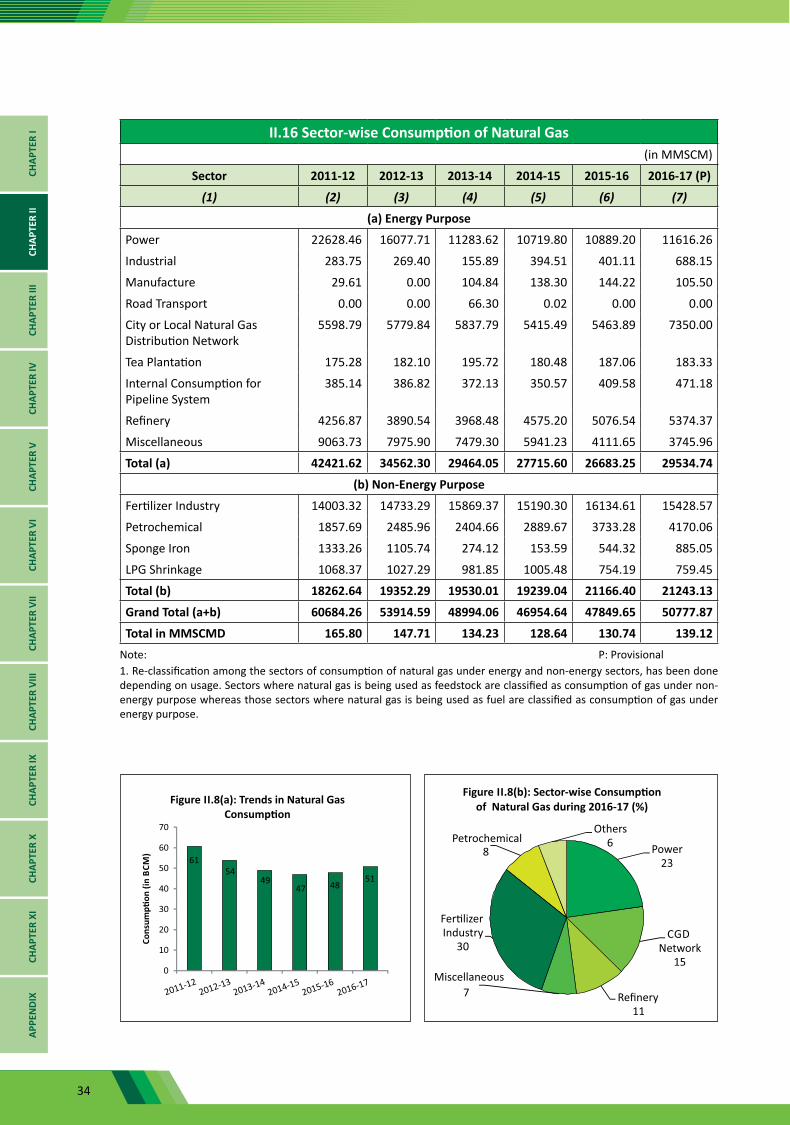
34
II.16 Sector-wise Consumption of Natural Gas(in MMSCM)
Sector 2011-12 2012-13 2013-14 2014-15 2015-16 2016-17 (P)
(1) (2) (3) (4) (5) (6) (7)
(a) Energy Purpose
Power 22628.46 16077.71 11283.62 10719.80 10889.20 11616.26
Industrial 283.75 269.40 155.89 394.51 401.11 688.15
Manufacture 29.61 0.00 104.84 138.30 144.22 105.50
Road Transport 0.00 0.00 66.30 0.02 0.00 0.00
City or Local Natural Gas Distribution Network
5598.79 5779.84 5837.79 5415.49 5463.89 7350.00
Tea Plantation 175.28 182.10 195.72 180.48 187.06 183.33
Internal Consumption for Pipeline System
385.14 386.82 372.13 350.57 409.58 471.18
Refinery 4256.87 3890.54 3968.48 4575.20 5076.54 5374.37
Miscellaneous 9063.73 7975.90 7479.30 5941.23 4111.65 3745.96
Total (a) 42421.62 34562.30 29464.05 27715.60 26683.25 29534.74
(b) Non-Energy Purpose
Fertilizer Industry 14003.32 14733.29 15869.37 15190.30 16134.61 15428.57
Petrochemical 1857.69 2485.96 2404.66 2889.67 3733.28 4170.06
Sponge Iron 1333.26 1105.74 274.12 153.59 544.32 885.05
LPG Shrinkage 1068.37 1027.29 981.85 1005.48 754.19 759.45
Total (b) 18262.64 19352.29 19530.01 19239.04 21166.40 21243.13
Grand Total (a+b) 60684.26 53914.59 48994.06 46954.64 47849.65 50777.87
Total in MMSCMD 165.80 147.71 134.23 128.64 130.74 139.12Note: P: Provisional 1. Re-classification among the sectors of consumption of natural gas under energy and non-energy sectors, has been done depending on usage. Sectors where natural gas is being used as feedstock are classified as consumption of gas under non-energy purpose whereas those sectors where natural gas is being used as fuel are classified as consumption of gas under energy purpose.
CHAP
TER
ICH
APTE
R II
CHAP
TER
IIICH
APTE
R IV
CHAP
TER
VCH
APTE
R VI
CHAP
TER
VII
CHAP
TER
VIII
CHAP
TER
IXCH
APTE
R X
CHAP
TER
XIAP
PEN
DIX
35
CHAPTER ICHAPTER II
CHAPTER IIICHAPTER IV
CHAPTER VCHAPTER VI
CHAPTER VIICHAPTER VIII
CHAPTER IXCHAPTER X
CHAPTER XIAPPEN
DIX
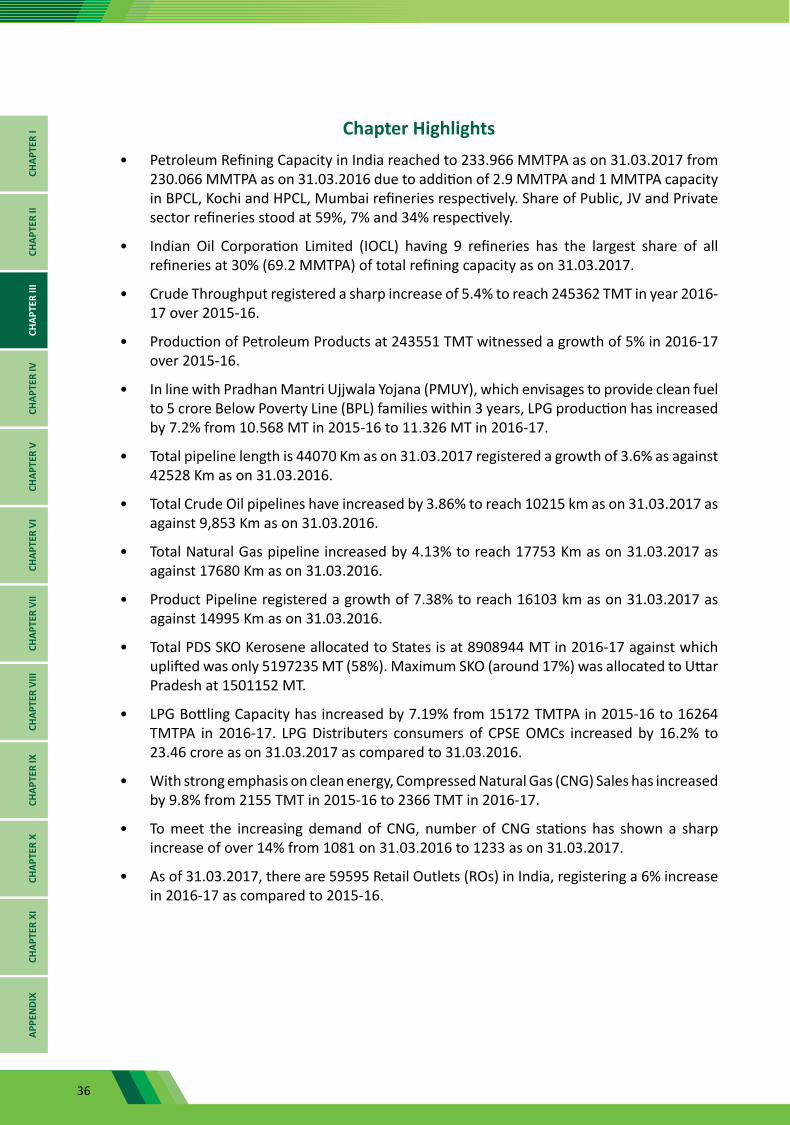
36
Chapter Highlights• Petroleum Refining Capacity in India reached to 233.966 MMTPA as on 31.03.2017 from
230.066 MMTPA as on 31.03.2016 due to addition of 2.9 MMTPA and 1 MMTPA capacity in BPCL, Kochi and HPCL, Mumbai refineries respectively. Share of Public, JV and Private sector refineries stood at 59%, 7% and 34% respectively.
• Indian Oil Corporation Limited (IOCL) having 9 refineries has the largest share of all refineries at 30% (69.2 MMTPA) of total refining capacity as on 31.03.2017.
• Crude Throughput registered a sharp increase of 5.4% to reach 245362 TMT in year 2016-17 over 2015-16.
• Production of Petroleum Products at 243551 TMT witnessed a growth of 5% in 2016-17 over 2015-16.
• In line with Pradhan Mantri Ujjwala Yojana (PMUY), which envisages to provide clean fuel to 5 crore Below Poverty Line (BPL) families within 3 years, LPG production has increased by 7.2% from 10.568 MT in 2015-16 to 11.326 MT in 2016-17.
• Total pipeline length is 44070 Km as on 31.03.2017 registered a growth of 3.6% as against 42528 Km as on 31.03.2016.
• Total Crude Oil pipelines have increased by 3.86% to reach 10215 km as on 31.03.2017 as against 9,853 Km as on 31.03.2016.
• Total Natural Gas pipeline increased by 4.13% to reach 17753 Km as on 31.03.2017 as against 17680 Km as on 31.03.2016.
• Product Pipeline registered a growth of 7.38% to reach 16103 km as on 31.03.2017 as against 14995 Km as on 31.03.2016.
• Total PDS SKO Kerosene allocated to States is at 8908944 MT in 2016-17 against which uplifted was only 5197235 MT (58%). Maximum SKO (around 17%) was allocated to Uttar Pradesh at 1501152 MT.
• LPG Bottling Capacity has increased by 7.19% from 15172 TMTPA in 2015-16 to 16264 TMTPA in 2016-17. LPG Distributers consumers of CPSE OMCs increased by 16.2% to 23.46 crore as on 31.03.2017 as compared to 31.03.2016.
• With strong emphasis on clean energy, Compressed Natural Gas (CNG) Sales has increased by 9.8% from 2155 TMT in 2015-16 to 2366 TMT in 2016-17.
• To meet the increasing demand of CNG, number of CNG stations has shown a sharp increase of over 14% from 1081 on 31.03.2016 to 1233 as on 31.03.2017.
• As of 31.03.2017, there are 59595 Retail Outlets (ROs) in India, registering a 6% increase in 2016-17 as compared to 2015-16.
CHAP
TER
ICH
APTE
R II
CHAP
TER
IIICH
APTE
R IV
CHAP
TER
VCH
APTE
R VI
CHAP
TER
VII
CHAP
TER
VIII
CHAP
TER
IXCH
APTE
R X
CHAP
TER
XIAP
PEN
DIX

37
III.1 Petroleum Refining Capacity in India(in MMTPA)
SI. No.
Refinery Location & Year of Commissioning
Capacity as on 1st April2011 2012 2013 2014 2015 2016 2017
(1) (2) (3) (4) (5) (6) (7) (8) (9)A Public Sector 116.886 120.066 120.066 120.066 120.066 135.066 138.966
Indian Oil Corporation Ltd. 54.200 54.200 54.200 54.200 54.200 69.200 69.2001 Digboi, Assam - 1901 0.650 0.650 0.650 0.650 0.650 0.650 0.6502 Guwahati, Assam - 1962 1.000 1.000 1.000 1.000 1.000 1.000 1.0003 Barauni, Bihar - 1964 6.000 6.000 6.000 6.000 6.000 6.000 6.0004 Koyali, Gujarat - 1965 13.700 13.700 13.700 13.700 13.700 13.700 13.7005 Haldia, West Bengal - 1975 7.500 7.500 7.500 7.500 7.500 7.500 7.5006 Mathura, Uttar Pradesh - 1982 8.000 8.000 8.000 8.000 8.000 8.000 8.0007 Panipat, Haryana - 1998 15.000 15.000 15.000 15.000 15.000 15.000 15.0008 Bongaigaon, Assam - 1974 2.350 2.350 2.350 2.350 2.350 2.350 2.3509 Paradip, Odisha-2016 - - - - - 15.000 15.000
Bharat Petroleum Corporation Ltd. 21.500 21.500 21.500 21.500 21.500 21.500 24.40010 Mumbai, Maharashtra - 1955 12.000 12.000 12.000 12.000 12.000 12.000 12.00011 Kochi, Kerala - 1963 9.500 9.500 9.500 9.500 9.500 9.500 12.400
Hindustan Petroleum Corporation Ltd. 14.800 14.800 14.800 14.800 14.800 14.800 15.80012 Mumbai, Maharashtra - 1954 6.500 6.500 6.500 6.500 6.500 6.500 7.50013 Visakh, Andhra Pradesh - 1957 8.300 8.300 8.300 8.300 8.300 8.300 8.300
Chennai Petroleum Corporation Ltd. 11.500 11.500 11.500 11.500 11.500 11.500 11.50014 Manali, Tamil Nadu - 1965 10.500 10.500 10.500 10.500 10.500 10.500 10.50015 Narimanam, Tamil Nadu - 1993 1.000 1.000 1.000 1.000 1.000 1.000 1.000
Numaligarh Refinery Ltd. 3.000 3.000 3.000 3.000 3.000 3.000 3.00016 Numaligarh, Assam-1999 3.000 3.000 3.000 3.000 3.000 3.000 3.000
Oil & Natural Gas Corporation Ltd. 0.066 0.066 0.066 0.066 0.066 0.066 0.06617 Tatipaka, Andhra Pradesh - 2001 0.066 0.066 0.066 0.066 0.066 0.066 0.066
Mangalore Refinery & Petrochemical Ltd. 11.820 15.000 15.000 15.000 15.000 15.000 15.00018 Mangalore, Karnataka- 1996 11.820 15.000 15.000 15.000 15.000 15.000 15.000B Private Sector 70.500 78.000 80.000 80.000 80.000 80.000 80.000
Reliance Industries Ltd. 60.000 60.000 60.000 60.000 60.000 60.000 60.00019 Jamnagar, Gujarat - 1999 33.000 33.000 33.000 33.000 33.000 33.000 33.00020 Jamnagar ( SEZ), Gujarat - 2008 27.000 27.000 27.000 27.000 27.000 27.000 27.000
Essar Oil Ltd. 10.500 18.000 20.000 20.000 20.000 20.000 20.00021 Vadinar, Gujarat - 2006 10.500 18.000 20.000 20.000 20.000 20.000 20.000C Joint Venture (JV) - 15.000 15.000 15.000 15.000 15.000 15.000
Bharat Oman Refinery Ltd. - 6.000 6.000 6.000 6.000 6.000 6.00022 Bina, Madhya Pradesh - 2011 - 6.000 6.000 6.000 6.000 6.000 6.000
HPCL Mittal Energy Ltd. - 9.000 9.000 9.000 9.000 9.000 9.00023 Bathinda, Punjab - 2012 - 9.000 9.000 9.000 9.000 9.000 9.000
Total Refinery Capacity 187.386 213.066 215.066 215.066 215.066 230.066 233.966Source: Oil Companies
CHAPTER ICHAPTER II
CHAPTER IIICHAPTER IV
CHAPTER VCHAPTER VI
CHAPTER VIICHAPTER VIII
CHAPTER IXCHAPTER X
CHAPTER XIAPPEN
DIX
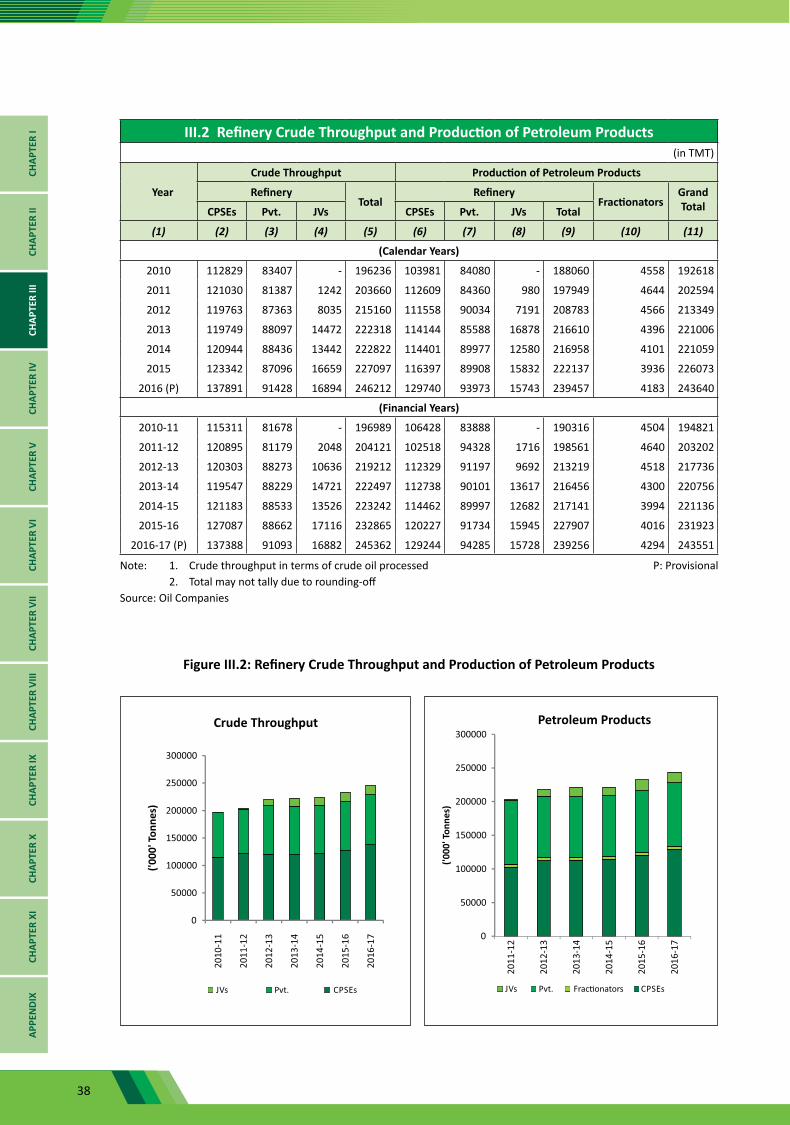
38
III.2 Refinery Crude Throughput and Production of Petroleum Products(in TMT)
Year
Crude Throughput Production of Petroleum Products
RefineryTotal
RefineryFractionators
Grand TotalCPSEs Pvt. JVs CPSEs Pvt. JVs Total
(1) (2) (3) (4) (5) (6) (7) (8) (9) (10) (11)
(Calendar Years)
2010 112829 83407 - 196236 103981 84080 - 188060 4558 192618
2011 121030 81387 1242 203660 112609 84360 980 197949 4644 202594
2012 119763 87363 8035 215160 111558 90034 7191 208783 4566 213349
2013 119749 88097 14472 222318 114144 85588 16878 216610 4396 221006
2014 120944 88436 13442 222822 114401 89977 12580 216958 4101 221059
2015 123342 87096 16659 227097 116397 89908 15832 222137 3936 226073
2016 (P) 137891 91428 16894 246212 129740 93973 15743 239457 4183 243640
(Financial Years)
2010-11 115311 81678 - 196989 106428 83888 - 190316 4504 194821
2011-12 120895 81179 2048 204121 102518 94328 1716 198561 4640 203202
2012-13 120303 88273 10636 219212 112329 91197 9692 213219 4518 217736
2013-14 119547 88229 14721 222497 112738 90101 13617 216456 4300 220756
2014-15 121183 88533 13526 223242 114462 89997 12682 217141 3994 221136
2015-16 127087 88662 17116 232865 120227 91734 15945 227907 4016 231923
2016-17 (P) 137388 91093 16882 245362 129244 94285 15728 239256 4294 243551
Note: 1. Crude throughput in terms of crude oil processed P: Provisional 2. Total may not tally due to rounding-offSource: Oil Companies
Figure III.2: Refinery Crude Throughput and Production of Petroleum Products
CHAP
TER
ICH
APTE
R II
CHAP
TER
IIICH
APTE
R IV
CHAP
TER
VCH
APTE
R VI
CHAP
TER
VII
CHAP
TER
VIII
CHAP
TER
IXCH
APTE
R X
CHAP
TER
XIAP
PEN
DIX
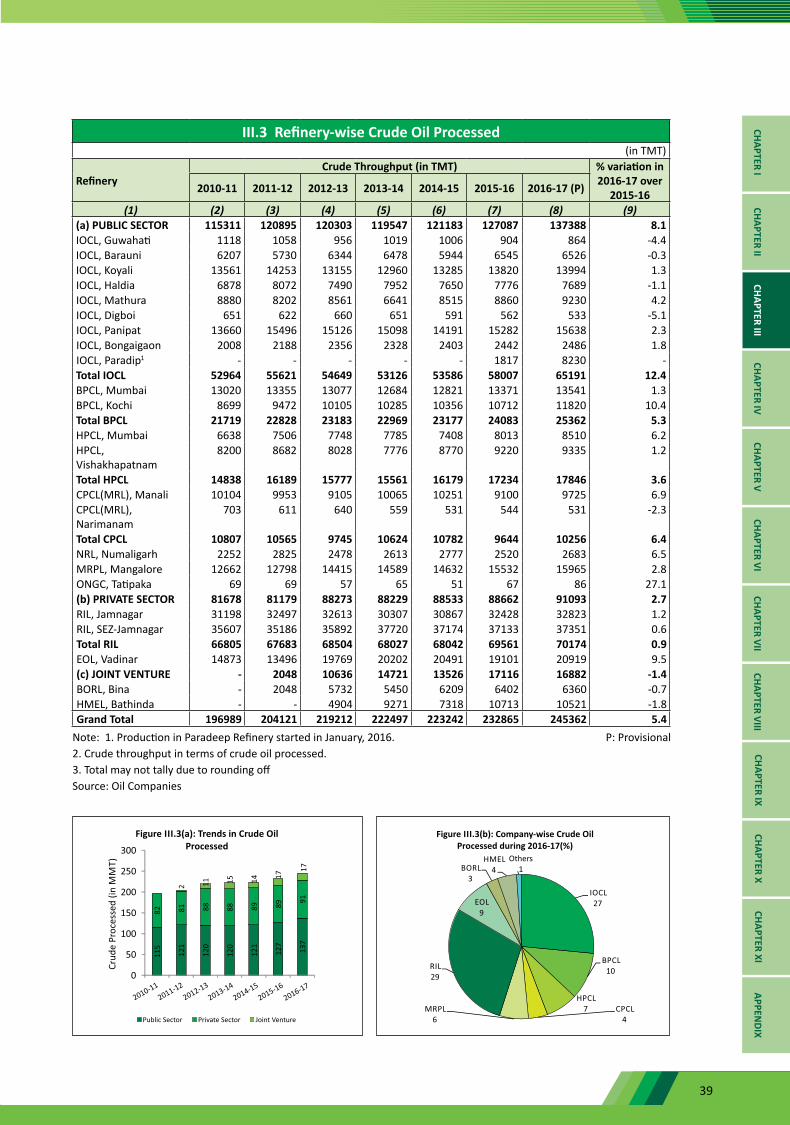
39
III.3 Refinery-wise Crude Oil Processed (in TMT)
RefineryCrude Throughput (in TMT) % variation in
2016-17 over 2015-162010-11 2011-12 2012-13 2013-14 2014-15 2015-16 2016-17 (P)
(1) (2) (3) (4) (5) (6) (7) (8) (9)(a) PUBLIC SECTOR 115311 120895 120303 119547 121183 127087 137388 8.1IOCL, Guwahati 1118 1058 956 1019 1006 904 864 -4.4IOCL, Barauni 6207 5730 6344 6478 5944 6545 6526 -0.3IOCL, Koyali 13561 14253 13155 12960 13285 13820 13994 1.3IOCL, Haldia 6878 8072 7490 7952 7650 7776 7689 -1.1IOCL, Mathura 8880 8202 8561 6641 8515 8860 9230 4.2IOCL, Digboi 651 622 660 651 591 562 533 -5.1IOCL, Panipat 13660 15496 15126 15098 14191 15282 15638 2.3IOCL, Bongaigaon 2008 2188 2356 2328 2403 2442 2486 1.8IOCL, Paradip1 - - - - - 1817 8230 -Total IOCL 52964 55621 54649 53126 53586 58007 65191 12.4BPCL, Mumbai 13020 13355 13077 12684 12821 13371 13541 1.3BPCL, Kochi 8699 9472 10105 10285 10356 10712 11820 10.4Total BPCL 21719 22828 23183 22969 23177 24083 25362 5.3HPCL, Mumbai 6638 7506 7748 7785 7408 8013 8510 6.2HPCL, Vishakhapatnam
8200 8682 8028 7776 8770 9220 9335 1.2
Total HPCL 14838 16189 15777 15561 16179 17234 17846 3.6CPCL(MRL), Manali 10104 9953 9105 10065 10251 9100 9725 6.9CPCL(MRL), Narimanam
703 611 640 559 531 544 531 -2.3
Total CPCL 10807 10565 9745 10624 10782 9644 10256 6.4NRL, Numaligarh 2252 2825 2478 2613 2777 2520 2683 6.5MRPL, Mangalore 12662 12798 14415 14589 14632 15532 15965 2.8ONGC, Tatipaka 69 69 57 65 51 67 86 27.1(b) PRIVATE SECTOR 81678 81179 88273 88229 88533 88662 91093 2.7RIL, Jamnagar 31198 32497 32613 30307 30867 32428 32823 1.2RIL, SEZ-Jamnagar 35607 35186 35892 37720 37174 37133 37351 0.6Total RIL 66805 67683 68504 68027 68042 69561 70174 0.9EOL, Vadinar 14873 13496 19769 20202 20491 19101 20919 9.5(c) JOINT VENTURE - 2048 10636 14721 13526 17116 16882 -1.4BORL, Bina - 2048 5732 5450 6209 6402 6360 -0.7HMEL, Bathinda - - 4904 9271 7318 10713 10521 -1.8Grand Total 196989 204121 219212 222497 223242 232865 245362 5.4
Note: 1. Production in Paradeep Refinery started in January, 2016. P: Provisional2. Crude throughput in terms of crude oil processed.3. Total may not tally due to rounding offSource: Oil Companies
CHAPTER ICHAPTER II
CHAPTER IIICHAPTER IV
CHAPTER VCHAPTER VI
CHAPTER VIICHAPTER VIII
CHAPTER IXCHAPTER X
CHAPTER XIAPPEN
DIX
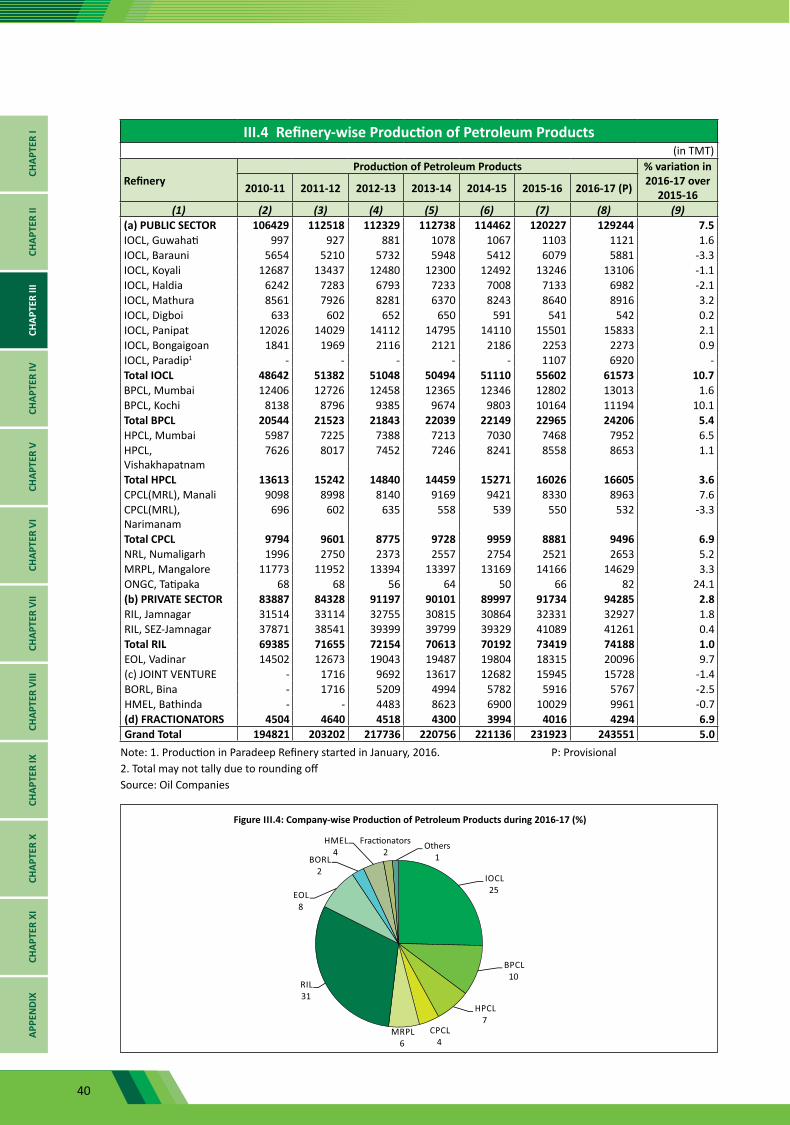
40
III.4 Refinery-wise Production of Petroleum Products(in TMT)
RefineryProduction of Petroleum Products % variation in
2016-17 over 2015-162010-11 2011-12 2012-13 2013-14 2014-15 2015-16 2016-17 (P)
(1) (2) (3) (4) (5) (6) (7) (8) (9)(a) PUBLIC SECTOR 106429 112518 112329 112738 114462 120227 129244 7.5IOCL, Guwahati 997 927 881 1078 1067 1103 1121 1.6IOCL, Barauni 5654 5210 5732 5948 5412 6079 5881 -3.3IOCL, Koyali 12687 13437 12480 12300 12492 13246 13106 -1.1IOCL, Haldia 6242 7283 6793 7233 7008 7133 6982 -2.1IOCL, Mathura 8561 7926 8281 6370 8243 8640 8916 3.2IOCL, Digboi 633 602 652 650 591 541 542 0.2IOCL, Panipat 12026 14029 14112 14795 14110 15501 15833 2.1IOCL, Bongaigoan 1841 1969 2116 2121 2186 2253 2273 0.9IOCL, Paradip1 - - - - - 1107 6920 -Total IOCL 48642 51382 51048 50494 51110 55602 61573 10.7BPCL, Mumbai 12406 12726 12458 12365 12346 12802 13013 1.6BPCL, Kochi 8138 8796 9385 9674 9803 10164 11194 10.1Total BPCL 20544 21523 21843 22039 22149 22965 24206 5.4HPCL, Mumbai 5987 7225 7388 7213 7030 7468 7952 6.5HPCL, Vishakhapatnam
7626 8017 7452 7246 8241 8558 8653 1.1
Total HPCL 13613 15242 14840 14459 15271 16026 16605 3.6CPCL(MRL), Manali 9098 8998 8140 9169 9421 8330 8963 7.6CPCL(MRL), Narimanam
696 602 635 558 539 550 532 -3.3
Total CPCL 9794 9601 8775 9728 9959 8881 9496 6.9NRL, Numaligarh 1996 2750 2373 2557 2754 2521 2653 5.2MRPL, Mangalore 11773 11952 13394 13397 13169 14166 14629 3.3ONGC, Tatipaka 68 68 56 64 50 66 82 24.1(b) PRIVATE SECTOR 83887 84328 91197 90101 89997 91734 94285 2.8RIL, Jamnagar 31514 33114 32755 30815 30864 32331 32927 1.8RIL, SEZ-Jamnagar 37871 38541 39399 39799 39329 41089 41261 0.4Total RIL 69385 71655 72154 70613 70192 73419 74188 1.0EOL, Vadinar 14502 12673 19043 19487 19804 18315 20096 9.7(c) JOINT VENTURE - 1716 9692 13617 12682 15945 15728 -1.4BORL, Bina - 1716 5209 4994 5782 5916 5767 -2.5HMEL, Bathinda - - 4483 8623 6900 10029 9961 -0.7(d) FRACTIONATORS 4504 4640 4518 4300 3994 4016 4294 6.9Grand Total 194821 203202 217736 220756 221136 231923 243551 5.0
Note: 1. Production in Paradeep Refinery started in January, 2016. P: Provisional2. Total may not tally due to rounding offSource: Oil Companies
CHAP
TER
ICH
APTE
R II
CHAP
TER
IIICH
APTE
R IV
CHAP
TER
VCH
APTE
R VI
CHAP
TER
VII
CHAP
TER
VIII
CHAP
TER
IXCH
APTE
R X
CHAP
TER
XIAP
PEN
DIX
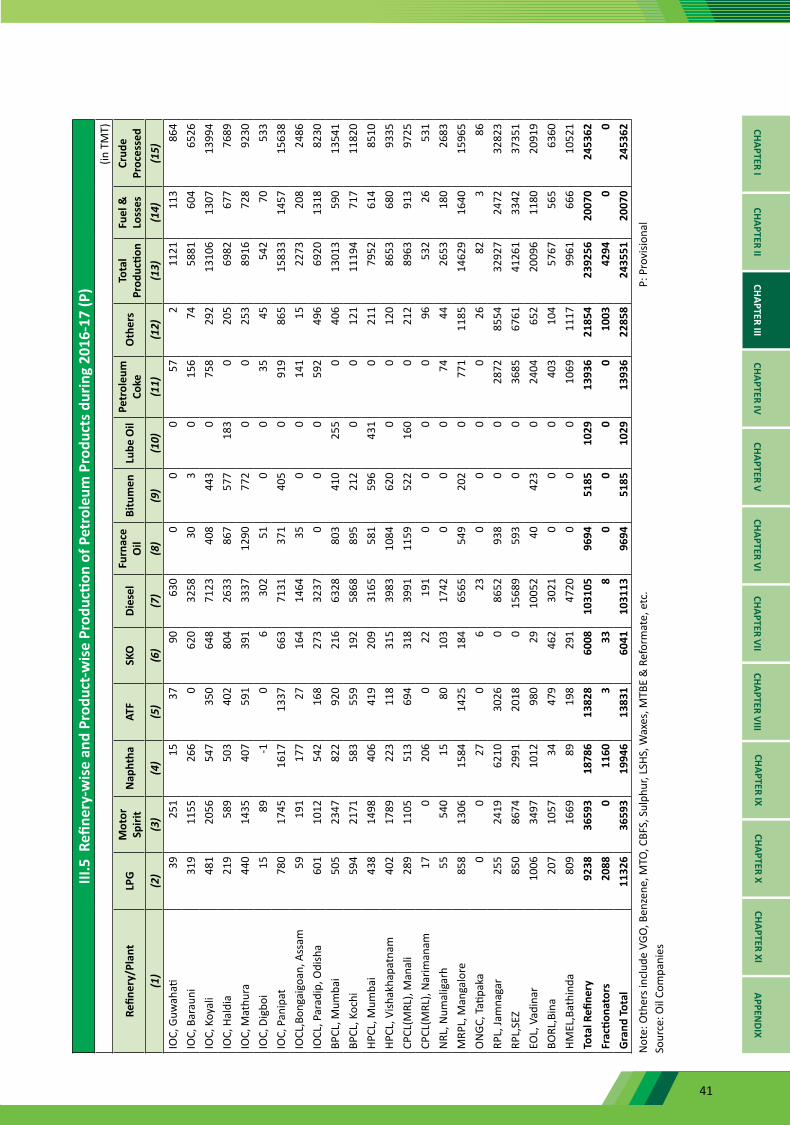
41
III.5
Refi
nery
-wis
e an
d Pr
oduc
t-wis
e Pr
oduc
tion
of P
etro
leum
Pro
duct
s dur
ing
2016
-17
(P)
(in T
MT)
Refin
ery/
Plan
tLP
GM
otor
Sp
irit
Nap
htha
ATF
SKO
Dies
elFu
rnac
e O
ilBi
tum
enLu
be O
ilPe
trol
eum
Co
keO
ther
sTo
tal
Prod
uctio
nFu
el &
Lo
sses
Crud
e Pr
oces
sed
(1)
(2)
(3)
(4)
(5)
(6)
(7)
(8)
(9)
(10)
(11)
(12)
(13)
(14)
(15)
IOC,
Guw
ahati
3925
115
3790
630
00
057
211
2111
386
4IO
C, B
arau
ni31
911
5526
60
620
3258
303
015
674
5881
604
6526
IOC,
Koy
ali
481
2056
547
350
648
7123
408
443
075
829
213
106
1307
1399
4IO
C, H
aldi
a21
958
950
340
280
426
3386
757
718
30
205
6982
677
7689
IOC,
Mat
hura
440
1435
407
591
391
3337
1290
772
00
253
8916
728
9230
IOC,
Dig
boi
1589
-10
630
251
00
3545
542
7053
3IO
C, P
anip
at78
017
4516
1713
3766
371
3137
140
50
919
865
1583
314
5715
638
IOCL
,Bon
gaig
oan,
Ass
am59
191
177
2716
414
6435
00
141
1522
7320
824
86IO
CL, P
arad
ip, O
dish
a60
110
1254
216
827
332
370
00
592
496
6920
1318
8230
BPCL
, Mum
bai
505
2347
822
920
216
6328
803
410
255
040
613
013
590
1354
1BP
CL, K
ochi
594
2171
583
559
192
5868
895
212
00
121
1119
471
711
820
HPCL
, Mum
bai
438
1498
406
419
209
3165
581
596
431
021
179
5261
485
10HP
CL, V
ishak
hapa
tnam
402
1789
223
118
315
3983
1084
620
00
120
8653
680
9335
CPCL
(MRL
), M
anal
i28
911
0551
369
431
839
9111
5952
216
00
212
8963
913
9725
CPCL
(MRL
), N
arim
anam
170
206
022
191
00
00
9653
226
531
NRL
, Num
alig
arh
5554
015
8010
317
420
00
7444
2653
180
2683
MRP
L, M
anga
lore
858
1306
1584
1425
184
6565
549
202
077
111
8514
629
1640
1596
5O
NGC
, Tati
paka
00
270
623
00
00
2682
386
RPL,
Jam
naga
r25
524
1962
1030
260
8652
938
00
2872
8554
3292
724
7232
823
RPL,
SEZ
850
8674
2991
2018
015
689
593
00
3685
6761
4126
133
4237
351
EOL,
Vad
inar
1006
3497
1012
980
2910
052
4042
30
2404
652
2009
611
8020
919
BORL
,Bin
a20
710
5734
479
462
3021
00
040
310
457
6756
563
60HM
EL,B
athi
nda
809
1669
8919
829
147
200
00
1069
1117
9961
666
1052
1To
tal R
efine
ry92
3836
593
1878
613
828
6008
1031
0596
9451
8510
2913
936
2185
423
9256
2007
024
5362
Frac
tiona
tors
2088
011
603
338
00
00
1003
4294
00
Gra
nd T
otal
1132
636
593
1994
613
831
6041
1031
1396
9451
8510
2913
936
2285
824
3551
2007
024
5362
Not
e: O
ther
s inc
lude
VGO
, Ben
zene
, MTO
, CBF
S, S
ulph
ur, L
SHS,
Wax
es, M
TBE
& R
efor
mat
e, e
tc.
P: P
rovi
siona
lSo
urce
: Oil
Com
pani
es
CHAPTER ICHAPTER II
CHAPTER IIICHAPTER IV
CHAPTER VCHAPTER VI
CHAPTER VIICHAPTER VIII
CHAPTER IXCHAPTER X
CHAPTER XIAPPEN
DIX
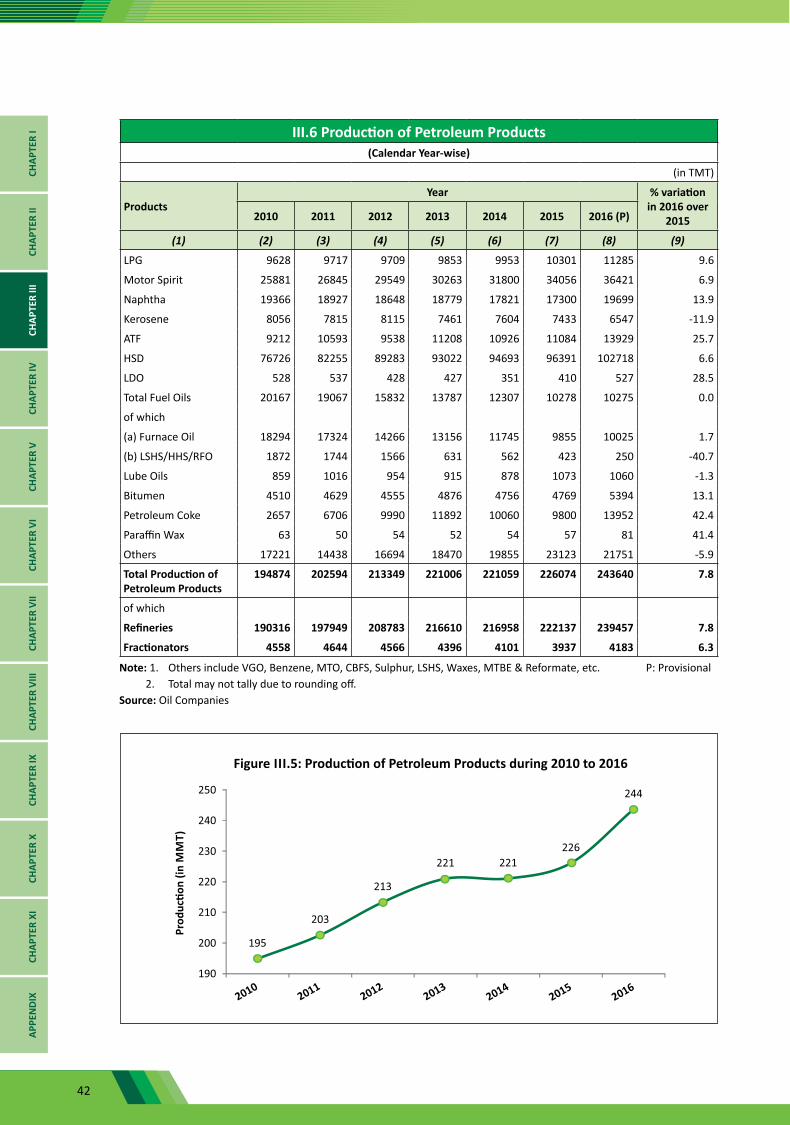
42
III.6 Production of Petroleum Products(Calendar Year-wise)
(in TMT)
ProductsYear % variation
in 2016 over 20152010 2011 2012 2013 2014 2015 2016 (P)
(1) (2) (3) (4) (5) (6) (7) (8) (9)
LPG 9628 9717 9709 9853 9953 10301 11285 9.6
Motor Spirit 25881 26845 29549 30263 31800 34056 36421 6.9
Naphtha 19366 18927 18648 18779 17821 17300 19699 13.9
Kerosene 8056 7815 8115 7461 7604 7433 6547 -11.9
ATF 9212 10593 9538 11208 10926 11084 13929 25.7
HSD 76726 82255 89283 93022 94693 96391 102718 6.6
LDO 528 537 428 427 351 410 527 28.5
Total Fuel Oils 20167 19067 15832 13787 12307 10278 10275 0.0
of which
(a) Furnace Oil 18294 17324 14266 13156 11745 9855 10025 1.7
(b) LSHS/HHS/RFO 1872 1744 1566 631 562 423 250 -40.7
Lube Oils 859 1016 954 915 878 1073 1060 -1.3
Bitumen 4510 4629 4555 4876 4756 4769 5394 13.1
Petroleum Coke 2657 6706 9990 11892 10060 9800 13952 42.4
Paraffin Wax 63 50 54 52 54 57 81 41.4
Others 17221 14438 16694 18470 19855 23123 21751 -5.9
Total Production of Petroleum Products
194874 202594 213349 221006 221059 226074 243640 7.8
of which
Refineries 190316 197949 208783 216610 216958 222137 239457 7.8
Fractionators 4558 4644 4566 4396 4101 3937 4183 6.3
Note: 1. Others include VGO, Benzene, MTO, CBFS, Sulphur, LSHS, Waxes, MTBE & Reformate, etc. P: Provisional 2. Total may not tally due to rounding off.Source: Oil Companies
CHAP
TER
ICH
APTE
R II
CHAP
TER
IIICH
APTE
R IV
CHAP
TER
VCH
APTE
R VI
CHAP
TER
VII
CHAP
TER
VIII
CHAP
TER
IXCH
APTE
R X
CHAP
TER
XIAP
PEN
DIX
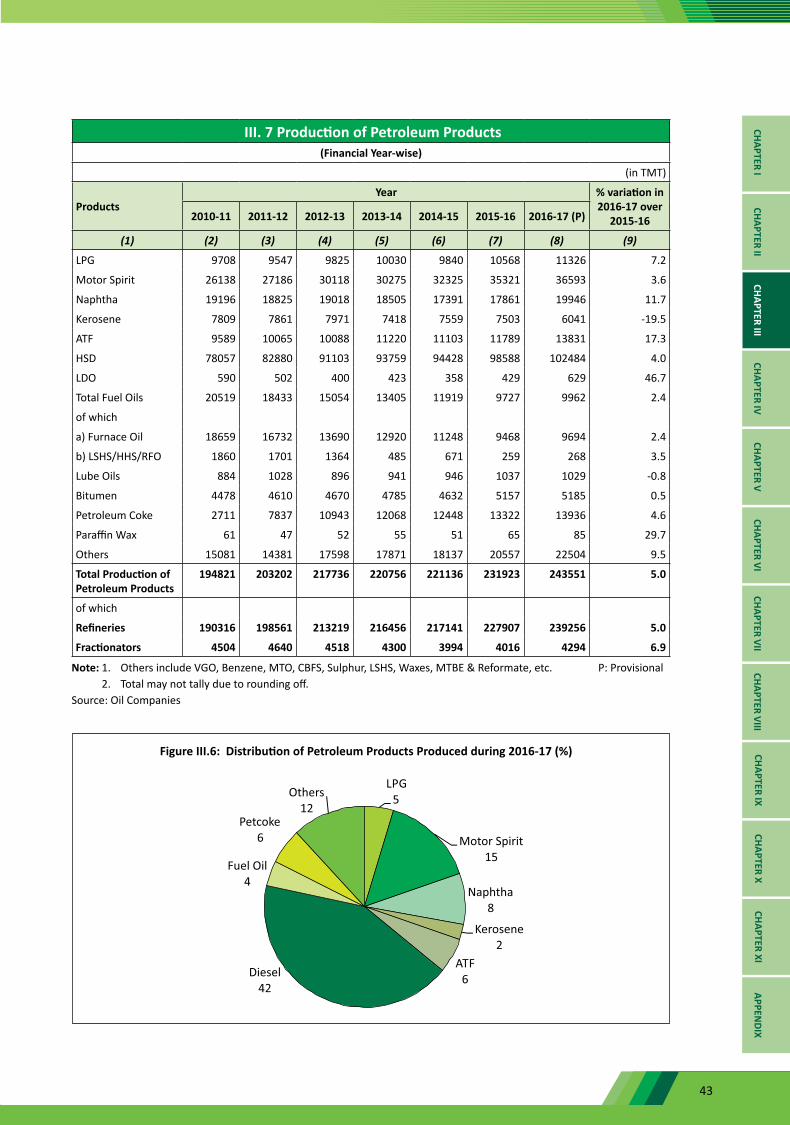
43
III. 7 Production of Petroleum Products(Financial Year-wise)
(in TMT)
ProductsYear % variation in
2016-17 over 2015-162010-11 2011-12 2012-13 2013-14 2014-15 2015-16 2016-17 (P)
(1) (2) (3) (4) (5) (6) (7) (8) (9)
LPG 9708 9547 9825 10030 9840 10568 11326 7.2
Motor Spirit 26138 27186 30118 30275 32325 35321 36593 3.6
Naphtha 19196 18825 19018 18505 17391 17861 19946 11.7
Kerosene 7809 7861 7971 7418 7559 7503 6041 -19.5
ATF 9589 10065 10088 11220 11103 11789 13831 17.3
HSD 78057 82880 91103 93759 94428 98588 102484 4.0
LDO 590 502 400 423 358 429 629 46.7
Total Fuel Oils 20519 18433 15054 13405 11919 9727 9962 2.4
of which
a) Furnace Oil 18659 16732 13690 12920 11248 9468 9694 2.4
b) LSHS/HHS/RFO 1860 1701 1364 485 671 259 268 3.5
Lube Oils 884 1028 896 941 946 1037 1029 -0.8
Bitumen 4478 4610 4670 4785 4632 5157 5185 0.5
Petroleum Coke 2711 7837 10943 12068 12448 13322 13936 4.6
Paraffin Wax 61 47 52 55 51 65 85 29.7
Others 15081 14381 17598 17871 18137 20557 22504 9.5
Total Production of Petroleum Products
194821 203202 217736 220756 221136 231923 243551 5.0
of which
Refineries 190316 198561 213219 216456 217141 227907 239256 5.0
Fractionators 4504 4640 4518 4300 3994 4016 4294 6.9
Note: 1. Others include VGO, Benzene, MTO, CBFS, Sulphur, LSHS, Waxes, MTBE & Reformate, etc. P: Provisional 2. Total may not tally due to rounding off.Source: Oil Companies
CHAPTER ICHAPTER II
CHAPTER IIICHAPTER IV
CHAPTER VCHAPTER VI
CHAPTER VIICHAPTER VIII
CHAPTER IXCHAPTER X
CHAPTER XIAPPEN
DIX
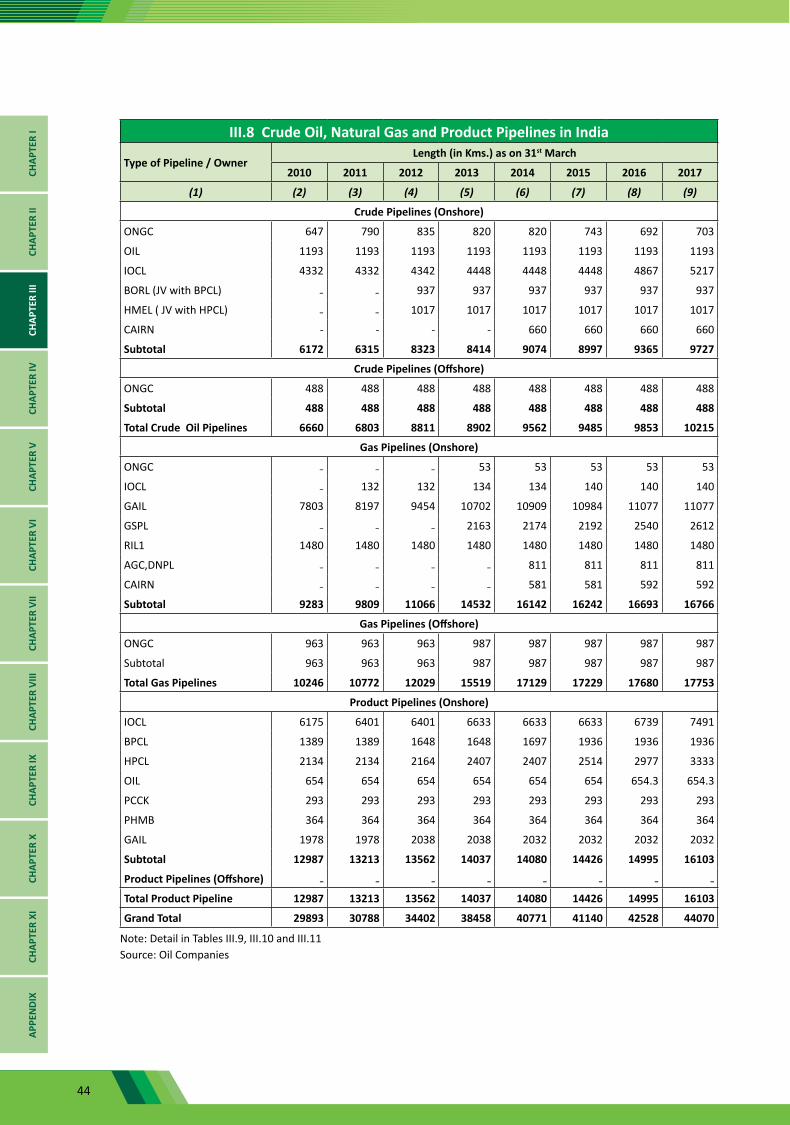
44
III.8 Crude Oil, Natural Gas and Product Pipelines in India
Type of Pipeline / OwnerLength (in Kms.) as on 31st March
2010 2011 2012 2013 2014 2015 2016 2017
(1) (2) (3) (4) (5) (6) (7) (8) (9)
Crude Pipelines (Onshore)
ONGC 647 790 835 820 820 743 692 703
OIL 1193 1193 1193 1193 1193 1193 1193 1193
IOCL 4332 4332 4342 4448 4448 4448 4867 5217
BORL (JV with BPCL) ₋ ₋ 937 937 937 937 937 937
HMEL ( JV with HPCL) ₋ ₋ 1017 1017 1017 1017 1017 1017
CAIRN - - - - 660 660 660 660
Subtotal 6172 6315 8323 8414 9074 8997 9365 9727
Crude Pipelines (Offshore)
ONGC 488 488 488 488 488 488 488 488
Subtotal 488 488 488 488 488 488 488 488
Total Crude Oil Pipelines 6660 6803 8811 8902 9562 9485 9853 10215
Gas Pipelines (Onshore)
ONGC ₋ ₋ ₋ 53 53 53 53 53
IOCL ₋ 132 132 134 134 140 140 140
GAIL 7803 8197 9454 10702 10909 10984 11077 11077
GSPL ₋ ₋ ₋ 2163 2174 2192 2540 2612
RIL1 1480 1480 1480 1480 1480 1480 1480 1480
AGC,DNPL ₋ ₋ ₋ ₋ 811 811 811 811
CAIRN ₋ ₋ ₋ ₋ 581 581 592 592
Subtotal 9283 9809 11066 14532 16142 16242 16693 16766
Gas Pipelines (Offshore)
ONGC 963 963 963 987 987 987 987 987
Subtotal 963 963 963 987 987 987 987 987
Total Gas Pipelines 10246 10772 12029 15519 17129 17229 17680 17753
Product Pipelines (Onshore)
IOCL 6175 6401 6401 6633 6633 6633 6739 7491
BPCL 1389 1389 1648 1648 1697 1936 1936 1936
HPCL 2134 2134 2164 2407 2407 2514 2977 3333
OIL 654 654 654 654 654 654 654.3 654.3
PCCK 293 293 293 293 293 293 293 293
PHMB 364 364 364 364 364 364 364 364
GAIL 1978 1978 2038 2038 2032 2032 2032 2032
Subtotal 12987 13213 13562 14037 14080 14426 14995 16103
Product Pipelines (Offshore) ₋ ₋ ₋ ₋ ₋ ₋ ₋ ₋
Total Product Pipeline 12987 13213 13562 14037 14080 14426 14995 16103
Grand Total 29893 30788 34402 38458 40771 41140 42528 44070
Note: Detail in Tables III.9, III.10 and III.11 Source: Oil Companies
CHAP
TER
ICH
APTE
R II
CHAP
TER
IIICH
APTE
R IV
CHAP
TER
VCH
APTE
R VI
CHAP
TER
VII
CHAP
TER
VIII
CHAP
TER
IXCH
APTE
R X
CHAP
TER
XIAP
PEN
DIX

45
III.9 Major Crude Oil Pipelines in IndiaType of Pipeline / Owner/Name of Pipeline
Capacity (TMT) Length (KM) Throughput (TMT) Utilization (%)
1.03.2015 31.03.2016 31.03.2017 31.03.2016 31.03.2017 2015-16 2016-17(P) 2015-16 2016-17
(1) (2) (3) (4) (5) (6) (7) (8) (9) (10)
Onshore
IOCL 40400 40400 48600 4867.0 5217.0 50542 51337 125.1 127.1
Salaya Mathura Pipeline 21000 21000 25000 2226.0 2576.0 25142 26124 119.7 124.4
Mundra Panipat Pipeline 8400 8400 8400 1194.0 1194.0 8726 8618 103.9 102.6
Paradip Haldia Barauni Pipeline 11000 11000 15200 1447.0 1447.0 16674 16595 151.6 150.9
ONGC 23587 23497 24997 691.8 702.9 9525 9676 40.4 41.2
14" MHN-NGM Trunk pipeline 2265 2265 2265 77.0 77.0 2107 2072 93.0 91.5
14" Kalol-Nawagam-New 3140 3140 3140 62.5 62.5 1037 1029 33.0 32.8
18" Nawagam-Koyali pipeline 5400 5400 5400 78.4 78.4 2255 2225 41.8 41.2
14" Nawagam-Koyali pipeline1 3300 3300 3300 78.4 78.4 1378 1360 41.8 41.2
16" CTF, Ankl to Koyali Pipeline2 2199 2199 2199 94.8 94.8 743 854 33.8 38.8
8" CTF, Ankl to CPF, Gandhar 394 394 394 44.3 44.3 0 0 0.0 0.0
12" CPF, Gandhar to Saraswani 'T' point
1805 1805 1805 56.7 56.7 589 673 32.6 37.3
10" Akholjuni to Laxmipura 'T' point
481 481 481 65.5 65.5 124 162 25.8 33.8
12" Lakwa-Moran pipeline 1500 1500 1500 17.5 14.6 303 221 20.2 14.7
12" Lakwa-Moran pipeline (New)3 0 0 1500 0.0 17.5 0 111 - -
14" Geleki-Jorhat pipeline 1500 1500 1500 48.5 48.5 494 472 32.9 31.4
12" Borholla-Jorhat pipeline 600 600 600 42.8 42.8 146 139 24.3 23.2
4" Kesnapalli-WGGS to Tatipaka Refinery
83 83 83 13.5 13.5 21 16 25.3 19.3
4" GMAA EPT to S. Yanam unloading terminal (1st Line)4
90 - - 3.5 - - - - -
4" GMAA EPT to S. Yanam unloading terminal (New line)
90 90 90 3.5 3.5 83 63 92.2 70.0
8" Narimanam to CPCL refinery pipeline
740 740 740 4.9 4.9 245 280 33.1 37.8
OIL: Duliajan-Digboi-Barauni-Bongaigaon Pipeline
8400 8400 8400 1192.6 1192.6 6426 6604 76.5 78.6
HMEL: Mundra - Bhatinda Pipeline
9000 9000 9000 1017.0 1017.0 10710 10520 119.0 116.9
BORL: Vadinar - Bina Pipeline 6000 6000 6000 937.0 937.0 6422 6377 107.0 106.3
Cairn: Mangala- Bhogat Pipeline 8714 8714 8714 660.0 660.0 8700 8100 99.8 93.0
Total Onshore Crude Pipeline 96101 96011 105711 9365.4 9726.5 92325 92614 96.1 96.5
Offshore
ONGC 45134 45134 45134 488.0 488.0 13067 12884 29.0 28.5
Mumbai High - Uran Trunk Pipeline
15634 15634 15634 204.0 204.0 8829 9322 56.5 59.6
Heera-Uran Trunk Pipeline 11500 11500 11500 81.0 81.0 4238 3552 36.9 30.9
Bombay-Uran Trunk 30" Pipeline 18000 18000 18000 203.0 203.0 0 10 0.0 0.1
Total Offshore Crude Pipeline 45134 45134 45134 488.0 488.0 13067 12884 29.0 28.5
Total Crude pipeline 141235 141145 150845 9853.4 10214.5 105392 105498 74.6 74.7
Source: Oil Companies P: ProvisionalNote:1. 78 km X 14” Nawagam-Koyali line was given on lease to IOC in 2000 and was handed back to ONGC on 1st Apr.’10. The line was
restored and re-commissioned in Oct.’12 2. CTF Ankleshwar to Makan ‘T’ point section i.e. HOEC Junction (about 47.51 km) of CTF Ankleshwar – Koyali Refinery Trunk pipeline
was not in use up to 31.08.2013. After damage / rupture of 8” CTF to CPF line on 25.08.2013, CTF to Koyali Trunk pipeline is in use from 31.08.2013 for dispatch of Ankleshwar Crude oil including PSC & JV. CTF, Ankleshwar to Koyali Oil Pipeline (AKCL) actual quantity includes Ankleshwar, PSC, JV and Cambay crude oil also.
3. New 12” Lakwa-Moran Oil Line commissioned on 22.08.16.4. Pipeline is not under use due to multiple leakages and required repair on account of RoU issues.
CHAPTER ICHAPTER II
CHAPTER IIICHAPTER IV
CHAPTER VCHAPTER VI
CHAPTER VIICHAPTER VIII
CHAPTER IXCHAPTER X
CHAPTER XIAPPEN
DIX
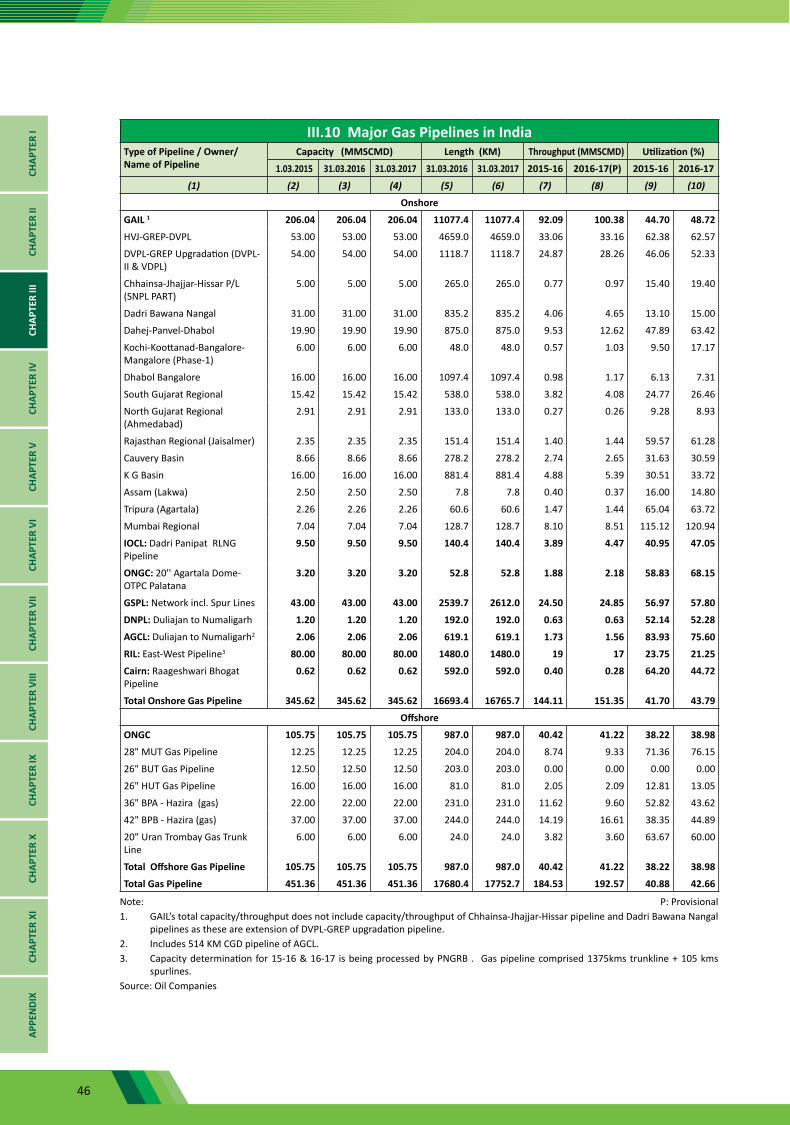
46
III.10 Major Gas Pipelines in IndiaType of Pipeline / Owner/Name of Pipeline
Capacity (MMSCMD) Length (KM) Throughput (MMSCMD) Utilization (%)
1.03.2015 31.03.2016 31.03.2017 31.03.2016 31.03.2017 2015-16 2016-17(P) 2015-16 2016-17
(1) (2) (3) (4) (5) (6) (7) (8) (9) (10)
Onshore
GAIL 1 206.04 206.04 206.04 11077.4 11077.4 92.09 100.38 44.70 48.72
HVJ-GREP-DVPL 53.00 53.00 53.00 4659.0 4659.0 33.06 33.16 62.38 62.57
DVPL-GREP Upgradation (DVPL-II & VDPL)
54.00 54.00 54.00 1118.7 1118.7 24.87 28.26 46.06 52.33
Chhainsa-Jhajjar-Hissar P/L (SNPL PART)
5.00 5.00 5.00 265.0 265.0 0.77 0.97 15.40 19.40
Dadri Bawana Nangal 31.00 31.00 31.00 835.2 835.2 4.06 4.65 13.10 15.00
Dahej-Panvel-Dhabol 19.90 19.90 19.90 875.0 875.0 9.53 12.62 47.89 63.42
Kochi-Koottanad-Bangalore- Mangalore (Phase-1)
6.00 6.00 6.00 48.0 48.0 0.57 1.03 9.50 17.17
Dhabol Bangalore 16.00 16.00 16.00 1097.4 1097.4 0.98 1.17 6.13 7.31
South Gujarat Regional 15.42 15.42 15.42 538.0 538.0 3.82 4.08 24.77 26.46
North Gujarat Regional (Ahmedabad)
2.91 2.91 2.91 133.0 133.0 0.27 0.26 9.28 8.93
Rajasthan Regional (Jaisalmer) 2.35 2.35 2.35 151.4 151.4 1.40 1.44 59.57 61.28
Cauvery Basin 8.66 8.66 8.66 278.2 278.2 2.74 2.65 31.63 30.59
K G Basin 16.00 16.00 16.00 881.4 881.4 4.88 5.39 30.51 33.72
Assam (Lakwa) 2.50 2.50 2.50 7.8 7.8 0.40 0.37 16.00 14.80
Tripura (Agartala) 2.26 2.26 2.26 60.6 60.6 1.47 1.44 65.04 63.72
Mumbai Regional 7.04 7.04 7.04 128.7 128.7 8.10 8.51 115.12 120.94
IOCL: Dadri Panipat RLNG Pipeline
9.50 9.50 9.50 140.4 140.4 3.89 4.47 40.95 47.05
ONGC: 20'' Agartala Dome-OTPC Palatana
3.20 3.20 3.20 52.8 52.8 1.88 2.18 58.83 68.15
GSPL: Network incl. Spur Lines 43.00 43.00 43.00 2539.7 2612.0 24.50 24.85 56.97 57.80
DNPL: Duliajan to Numaligarh 1.20 1.20 1.20 192.0 192.0 0.63 0.63 52.14 52.28
AGCL: Duliajan to Numaligarh2 2.06 2.06 2.06 619.1 619.1 1.73 1.56 83.93 75.60
RIL: East-West Pipeline3 80.00 80.00 80.00 1480.0 1480.0 19 17 23.75 21.25
Cairn: Raageshwari Bhogat Pipeline
0.62 0.62 0.62 592.0 592.0 0.40 0.28 64.20 44.72
Total Onshore Gas Pipeline 345.62 345.62 345.62 16693.4 16765.7 144.11 151.35 41.70 43.79
Offshore
ONGC 105.75 105.75 105.75 987.0 987.0 40.42 41.22 38.22 38.98
28" MUT Gas Pipeline 12.25 12.25 12.25 204.0 204.0 8.74 9.33 71.36 76.15
26" BUT Gas Pipeline 12.50 12.50 12.50 203.0 203.0 0.00 0.00 0.00 0.00
26" HUT Gas Pipeline 16.00 16.00 16.00 81.0 81.0 2.05 2.09 12.81 13.05
36" BPA - Hazira (gas) 22.00 22.00 22.00 231.0 231.0 11.62 9.60 52.82 43.62
42" BPB - Hazira (gas) 37.00 37.00 37.00 244.0 244.0 14.19 16.61 38.35 44.89
20" Uran Trombay Gas Trunk Line
6.00 6.00 6.00 24.0 24.0 3.82 3.60 63.67 60.00
Total Offshore Gas Pipeline 105.75 105.75 105.75 987.0 987.0 40.42 41.22 38.22 38.98
Total Gas Pipeline 451.36 451.36 451.36 17680.4 17752.7 184.53 192.57 40.88 42.66
Note: P: Provisional1. GAIL’s total capacity/throughput does not include capacity/throughput of Chhainsa-Jhajjar-Hissar pipeline and Dadri Bawana Nangal
pipelines as these are extension of DVPL-GREP upgradation pipeline.2. Includes 514 KM CGD pipeline of AGCL.3. Capacity determination for 15-16 & 16-17 is being processed by PNGRB . Gas pipeline comprised 1375kms trunkline + 105 kms
spurlines.Source: Oil Companies
CHAP
TER
ICH
APTE
R II
CHAP
TER
IIICH
APTE
R IV
CHAP
TER
VCH
APTE
R VI
CHAP
TER
VII
CHAP
TER
VIII
CHAP
TER
IXCH
APTE
R X
CHAP
TER
XIAP
PEN
DIX
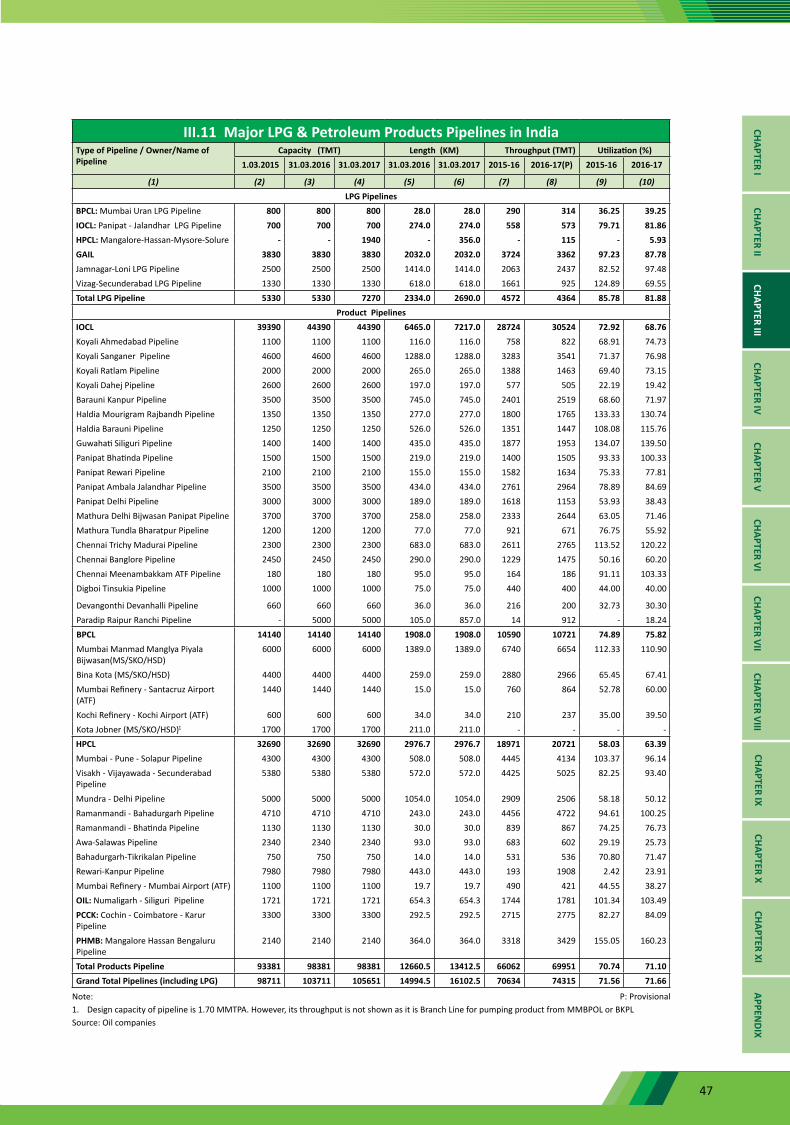
47
III.11 Major LPG & Petroleum Products Pipelines in IndiaType of Pipeline / Owner/Name of Pipeline
Capacity (TMT) Length (KM) Throughput (TMT) Utilization (%) 1.03.2015 31.03.2016 31.03.2017 31.03.2016 31.03.2017 2015-16 2016-17(P) 2015-16 2016-17
(1) (2) (3) (4) (5) (6) (7) (8) (9) (10)LPG Pipelines
BPCL: Mumbai Uran LPG Pipeline 800 800 800 28.0 28.0 290 314 36.25 39.25IOCL: Panipat - Jalandhar LPG Pipeline 700 700 700 274.0 274.0 558 573 79.71 81.86HPCL: Mangalore-Hassan-Mysore-Solure - - 1940 - 356.0 - 115 - 5.93GAIL 3830 3830 3830 2032.0 2032.0 3724 3362 97.23 87.78Jamnagar-Loni LPG Pipeline 2500 2500 2500 1414.0 1414.0 2063 2437 82.52 97.48Vizag-Secunderabad LPG Pipeline 1330 1330 1330 618.0 618.0 1661 925 124.89 69.55Total LPG Pipeline 5330 5330 7270 2334.0 2690.0 4572 4364 85.78 81.88
Product PipelinesIOCL 39390 44390 44390 6465.0 7217.0 28724 30524 72.92 68.76Koyali Ahmedabad Pipeline 1100 1100 1100 116.0 116.0 758 822 68.91 74.73Koyali Sanganer Pipeline 4600 4600 4600 1288.0 1288.0 3283 3541 71.37 76.98Koyali Ratlam Pipeline 2000 2000 2000 265.0 265.0 1388 1463 69.40 73.15Koyali Dahej Pipeline 2600 2600 2600 197.0 197.0 577 505 22.19 19.42Barauni Kanpur Pipeline 3500 3500 3500 745.0 745.0 2401 2519 68.60 71.97Haldia Mourigram Rajbandh Pipeline 1350 1350 1350 277.0 277.0 1800 1765 133.33 130.74Haldia Barauni Pipeline 1250 1250 1250 526.0 526.0 1351 1447 108.08 115.76Guwahati Siliguri Pipeline 1400 1400 1400 435.0 435.0 1877 1953 134.07 139.50Panipat Bhatinda Pipeline 1500 1500 1500 219.0 219.0 1400 1505 93.33 100.33Panipat Rewari Pipeline 2100 2100 2100 155.0 155.0 1582 1634 75.33 77.81Panipat Ambala Jalandhar Pipeline 3500 3500 3500 434.0 434.0 2761 2964 78.89 84.69Panipat Delhi Pipeline 3000 3000 3000 189.0 189.0 1618 1153 53.93 38.43Mathura Delhi Bijwasan Panipat Pipeline 3700 3700 3700 258.0 258.0 2333 2644 63.05 71.46Mathura Tundla Bharatpur Pipeline 1200 1200 1200 77.0 77.0 921 671 76.75 55.92Chennai Trichy Madurai Pipeline 2300 2300 2300 683.0 683.0 2611 2765 113.52 120.22Chennai Banglore Pipeline 2450 2450 2450 290.0 290.0 1229 1475 50.16 60.20Chennai Meenambakkam ATF Pipeline 180 180 180 95.0 95.0 164 186 91.11 103.33Digboi Tinsukia Pipeline 1000 1000 1000 75.0 75.0 440 400 44.00 40.00
Devangonthi Devanhalli Pipeline 660 660 660 36.0 36.0 216 200 32.73 30.30Paradip Raipur Ranchi Pipeline - 5000 5000 105.0 857.0 14 912 - 18.24BPCL 14140 14140 14140 1908.0 1908.0 10590 10721 74.89 75.82Mumbai Manmad Manglya Piyala Bijwasan(MS/SKO/HSD)
6000 6000 6000 1389.0 1389.0 6740 6654 112.33 110.90
Bina Kota (MS/SKO/HSD) 4400 4400 4400 259.0 259.0 2880 2966 65.45 67.41Mumbai Refinery - Santacruz Airport (ATF)
1440 1440 1440 15.0 15.0 760 864 52.78 60.00
Kochi Refinery - Kochi Airport (ATF) 600 600 600 34.0 34.0 210 237 35.00 39.50Kota Jobner (MS/SKO/HSD)1 1700 1700 1700 211.0 211.0 - - - -HPCL 32690 32690 32690 2976.7 2976.7 18971 20721 58.03 63.39Mumbai - Pune - Solapur Pipeline 4300 4300 4300 508.0 508.0 4445 4134 103.37 96.14Visakh - Vijayawada - Secunderabad Pipeline
5380 5380 5380 572.0 572.0 4425 5025 82.25 93.40
Mundra - Delhi Pipeline 5000 5000 5000 1054.0 1054.0 2909 2506 58.18 50.12Ramanmandi - Bahadurgarh Pipeline 4710 4710 4710 243.0 243.0 4456 4722 94.61 100.25Ramanmandi - Bhatinda Pipeline 1130 1130 1130 30.0 30.0 839 867 74.25 76.73Awa-Salawas Pipeline 2340 2340 2340 93.0 93.0 683 602 29.19 25.73Bahadurgarh-Tikrikalan Pipeline 750 750 750 14.0 14.0 531 536 70.80 71.47Rewari-Kanpur Pipeline 7980 7980 7980 443.0 443.0 193 1908 2.42 23.91Mumbai Refinery - Mumbai Airport (ATF) 1100 1100 1100 19.7 19.7 490 421 44.55 38.27OIL: Numaligarh - Siliguri Pipeline 1721 1721 1721 654.3 654.3 1744 1781 101.34 103.49PCCK: Cochin - Coimbatore - Karur Pipeline
3300 3300 3300 292.5 292.5 2715 2775 82.27 84.09
PHMB: Mangalore Hassan Bengaluru Pipeline
2140 2140 2140 364.0 364.0 3318 3429 155.05 160.23
Total Products Pipeline 93381 98381 98381 12660.5 13412.5 66062 69951 70.74 71.10Grand Total Pipelines (including LPG) 98711 103711 105651 14994.5 16102.5 70634 74315 71.56 71.66
Note: P: Provisional1. Design capacity of pipeline is 1.70 MMTPA. However, its throughput is not shown as it is Branch Line for pumping product from MMBPOL or BKPLSource: Oil companies
CHAPTER ICHAPTER II
CHAPTER IIICHAPTER IV
CHAPTER VCHAPTER VI
CHAPTER VIICHAPTER VIII
CHAPTER IXCHAPTER X
CHAPTER XIAPPEN
DIX
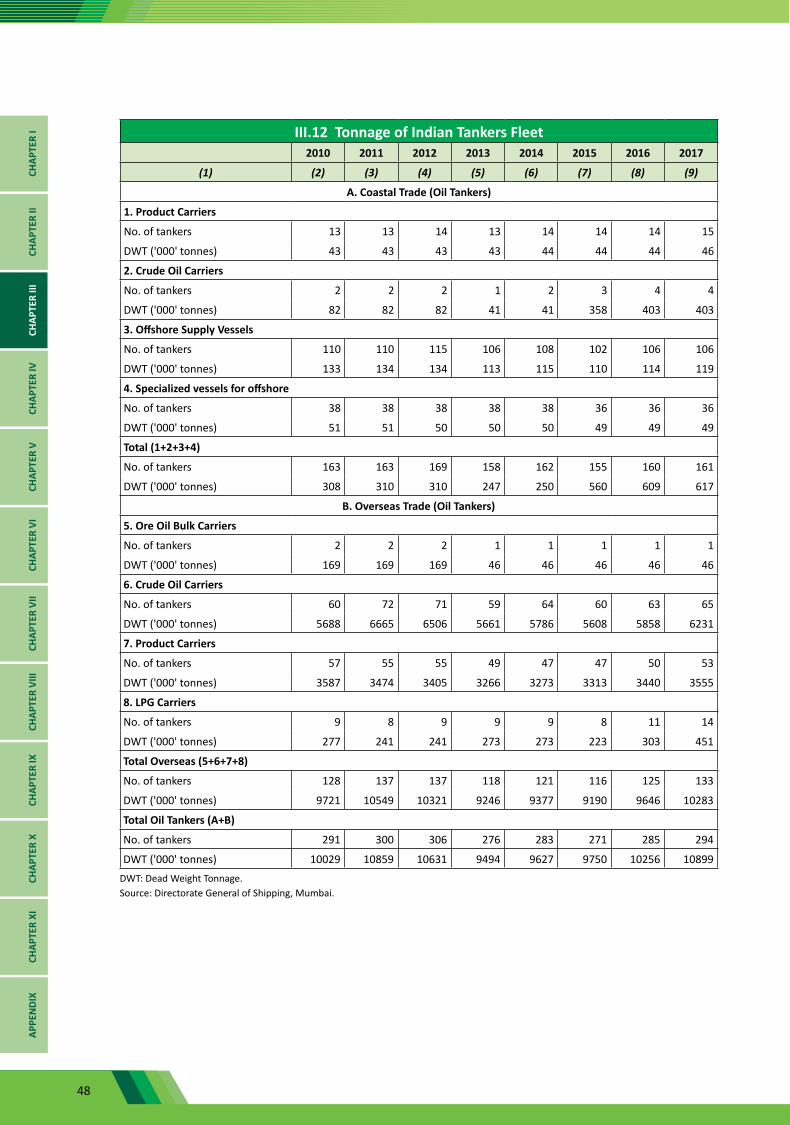
48
III.12 Tonnage of Indian Tankers Fleet2010 2011 2012 2013 2014 2015 2016 2017
(1) (2) (3) (4) (5) (6) (7) (8) (9)
A. Coastal Trade (Oil Tankers)
1. Product Carriers
No. of tankers 13 13 14 13 14 14 14 15
DWT ('000' tonnes) 43 43 43 43 44 44 44 46
2. Crude Oil Carriers
No. of tankers 2 2 2 1 2 3 4 4
DWT ('000' tonnes) 82 82 82 41 41 358 403 403
3. Offshore Supply Vessels
No. of tankers 110 110 115 106 108 102 106 106
DWT ('000' tonnes) 133 134 134 113 115 110 114 119
4. Specialized vessels for offshore
No. of tankers 38 38 38 38 38 36 36 36
DWT ('000' tonnes) 51 51 50 50 50 49 49 49
Total (1+2+3+4)
No. of tankers 163 163 169 158 162 155 160 161
DWT ('000' tonnes) 308 310 310 247 250 560 609 617
B. Overseas Trade (Oil Tankers)
5. Ore Oil Bulk Carriers
No. of tankers 2 2 2 1 1 1 1 1
DWT ('000' tonnes) 169 169 169 46 46 46 46 46
6. Crude Oil Carriers
No. of tankers 60 72 71 59 64 60 63 65
DWT ('000' tonnes) 5688 6665 6506 5661 5786 5608 5858 6231
7. Product Carriers
No. of tankers 57 55 55 49 47 47 50 53
DWT ('000' tonnes) 3587 3474 3405 3266 3273 3313 3440 3555
8. LPG Carriers
No. of tankers 9 8 9 9 9 8 11 14
DWT ('000' tonnes) 277 241 241 273 273 223 303 451
Total Overseas (5+6+7+8)
No. of tankers 128 137 137 118 121 116 125 133
DWT ('000' tonnes) 9721 10549 10321 9246 9377 9190 9646 10283
Total Oil Tankers (A+B)
No. of tankers 291 300 306 276 283 271 285 294
DWT ('000' tonnes) 10029 10859 10631 9494 9627 9750 10256 10899DWT: Dead Weight Tonnage.Source: Directorate General of Shipping, Mumbai.
CHAP
TER
ICH
APTE
R II
CHAP
TER
IIICH
APTE
R IV
CHAP
TER
VCH
APTE
R VI
CHAP
TER
VII
CHAP
TER
VIII
CHAP
TER
IXCH
APTE
R X
CHAP
TER
XIAP
PEN
DIX

49
III.13 Indian Tonnage as on 31.03.2017(in Tonnes)
SI. No. Owner of the ship Gross Registered Tonnage Dead Weight TonnageCoastal Trade
Tankers (Product Carriers)1 Associated Maritime Pvt.Ltd. 1090 20522 Atlantic Shipping Pvt. Ltd. 2814 36173 Blue Ocean Sea Transport Ltd. 396 5964 Castle Ships Pvt.Ltd. 1332 21275 Coast Line Services (India)Pvt. Ltd. 493 8726 Jaisu Shipping (P) Ltd. 1873 28087 K. Raghupathi Rao (Raghu) 65 08 M.Gangadhar Rao 36 09 Marine Blue Shipping Pvt. Ltd. 708 0
10 Pratibha Shipping Co.Ltd. 30565 2861011 Shiny Shipping & Logistics Pvt. Ltd. 2153 273412 Vamsee Shipping Carrier Pvt.Ltd. 1495 2238
Total 43020 45654Tankers (Crude Oil Carriers)
1 Jadwet Trading Company 40 02 Seven Islands Shipping Ltd. 29083 449703 The Shipping Corpn.of India Ltd. 190359 357757
Total 219482 402727Offshore Supply Vessels
1 Administration of U.T. of Lakshadweep 10721 9602 Albatross Shipping Agencies 2893 37983 ARC Maritime Pvt. Ltd. 1591 19214 Asian Marine Supplier 104 05 Atlas Offshore Services Pvt. Ltd. 297 10186 Bhambhani Shipping Ltd. 1788 20857 Chandra Ship Management Pvt. Ltd. 285 08 Coastal Marine Const. & Engg. Ltd. 2101 12049 Damodar Marine Services Pvt. Ltd. 487 737
10 Daniel Engineering Works & Ship Repairs 850 100011 Diplomat Marine 1221 114912 Dolphin Offshore Shipping Ltd. 1008 49113 Dolphin Offshore Shipping Ltd. 363 27214 Dunnimaa Engineers & Divers Ent. P.Ltd. 639 62715 First Oil & Gas Servives Pvt. Ltd. 2568 210516 Fugro Survey (India) Pvt. Ltd. 494 50917 GAL Offshore Shipping 640 018 Glory Ship Management Pvt. Ltd. 495 019 GOL Offshore Ltd. 10342 1384820 Greatship (India) Ltd. 4983 241621 Hal Offshore Ltd. 1085 83222 Hede Ferrominas(P) Ltd. 1332 168623 Hind Offshore Pvt. Ltd. 6908 544224 ITT Lines Pvt. Ltd. 1042 120725 Jayesh Shipping P. Ltd. 69 026 KEI-RSOS Maritime Ltd. 2779 291427 Lewek Alter Shipping Pvt. Ltd. 3601 028 Mathew Meenathethil George 322 50029 Mr. Nikhil Kumar Dhali 189 030 Mrs. Ishrat Johan W/o. Mr. Riaz Khan 140 1531 Mustan Tahderbhai Khanbhai 1310 181732 Netincon Logistics Pvt. Ltd. 2419 033 Ocean Sparkle Ltd. 9255 714234 Oil & Natural Gas Corporation 16592 1997835 PFS Shipping (India)Ltd. 3844 384236 Prince Marine Transport Services 3634 117237 Raj Shipping Agencies Ltd. 4337 475938 S. S. Offshore Pvt. Ltd. 1310 181239 S.R.Offshore Pvt. Ltd. 417 040 Sambhulingam Marine Services 317 041 Samson Maritime Ltd. 5375 594542 Samudrika Logistics Pvt. Ltd. 275 29043 Sun Marine 1310 175844 Synergy Offshore Services 189 12545 TAG Offshore Ltd. 9217 760546 TAG Sea Logistics Ltd. 3939 495247 Tarun Shipping & Industries Ltd. 1978 217248 The Shipping Corpn. Of India Ltd. 7841 691749 Transtar Marine & Offshore Services 1078 050 Tulshyan Shipping & Offshore Services Pvt. Ltd. 2095 2374
Total 138069 119396
CHAPTER ICHAPTER II
CHAPTER IIICHAPTER IV
CHAPTER VCHAPTER VI
CHAPTER VIICHAPTER VIII
CHAPTER IXCHAPTER X
CHAPTER XIAPPEN
DIX
Contd...
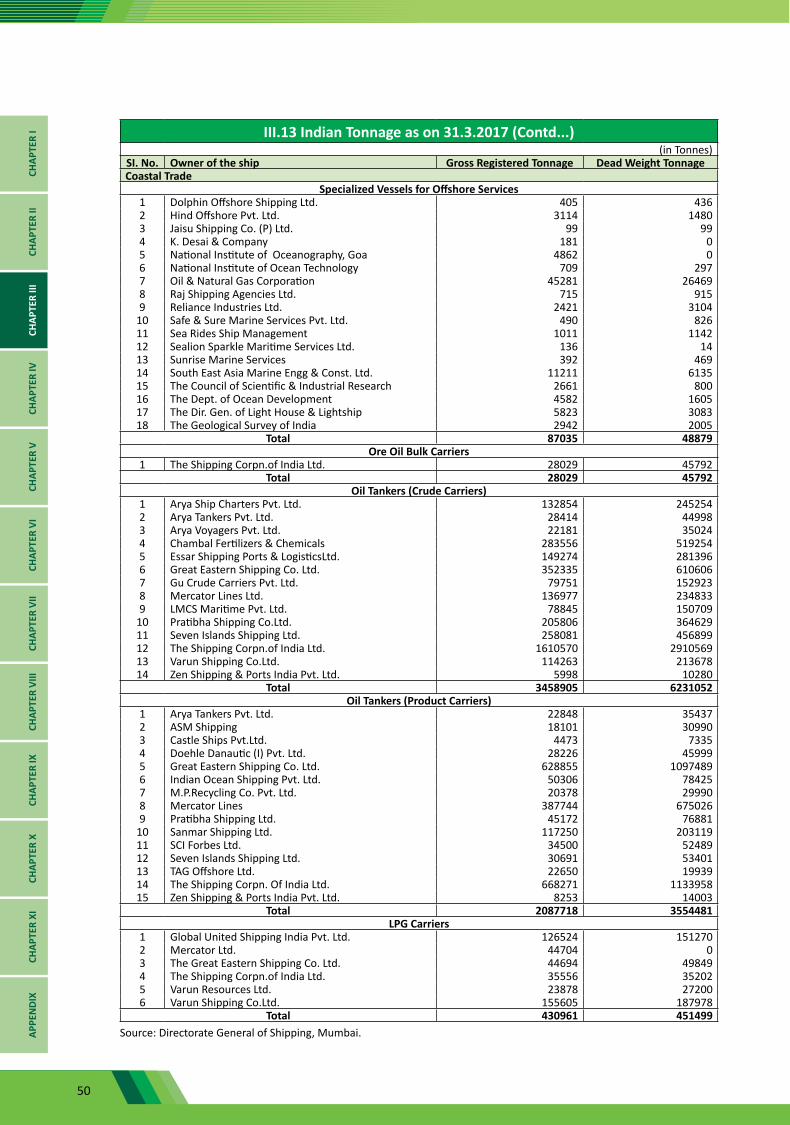
50
III.13 Indian Tonnage as on 31.3.2017 (Contd...)(in Tonnes)
SI. No. Owner of the ship Gross Registered Tonnage Dead Weight TonnageCoastal Trade
Specialized Vessels for Offshore Services1 Dolphin Offshore Shipping Ltd. 405 4362 Hind Offshore Pvt. Ltd. 3114 14803 Jaisu Shipping Co. (P) Ltd. 99 994 K. Desai & Company 181 05 National Institute of Oceanography, Goa 4862 06 National Institute of Ocean Technology 709 2977 Oil & Natural Gas Corporation 45281 264698 Raj Shipping Agencies Ltd. 715 9159 Reliance Industries Ltd. 2421 3104
10 Safe & Sure Marine Services Pvt. Ltd. 490 82611 Sea Rides Ship Management 1011 114212 Sealion Sparkle Maritime Services Ltd. 136 1413 Sunrise Marine Services 392 46914 South East Asia Marine Engg & Const. Ltd. 11211 613515 The Council of Scientific & Industrial Research 2661 80016 The Dept. of Ocean Development 4582 160517 The Dir. Gen. of Light House & Lightship 5823 308318 The Geological Survey of India 2942 2005
Total 87035 48879Ore Oil Bulk Carriers
1 The Shipping Corpn.of India Ltd. 28029 45792Total 28029 45792
Oil Tankers (Crude Carriers)1 Arya Ship Charters Pvt. Ltd. 132854 2452542 Arya Tankers Pvt. Ltd. 28414 449983 Arya Voyagers Pvt. Ltd. 22181 350244 Chambal Fertilizers & Chemicals 283556 5192545 Essar Shipping Ports & LogisticsLtd. 149274 2813966 Great Eastern Shipping Co. Ltd. 352335 6106067 Gu Crude Carriers Pvt. Ltd. 79751 1529238 Mercator Lines Ltd. 136977 2348339 LMCS Maritime Pvt. Ltd. 78845 150709
10 Pratibha Shipping Co.Ltd. 205806 36462911 Seven Islands Shipping Ltd. 258081 45689912 The Shipping Corpn.of India Ltd. 1610570 291056913 Varun Shipping Co.Ltd. 114263 21367814 Zen Shipping & Ports India Pvt. Ltd. 5998 10280
Total 3458905 6231052Oil Tankers (Product Carriers)
1 Arya Tankers Pvt. Ltd. 22848 354372 ASM Shipping 18101 309903 Castle Ships Pvt.Ltd. 4473 73354 Doehle Danautic (I) Pvt. Ltd. 28226 459995 Great Eastern Shipping Co. Ltd. 628855 10974896 Indian Ocean Shipping Pvt. Ltd. 50306 784257 M.P.Recycling Co. Pvt. Ltd. 20378 299908 Mercator Lines 387744 6750269 Pratibha Shipping Ltd. 45172 76881
10 Sanmar Shipping Ltd. 117250 20311911 SCI Forbes Ltd. 34500 5248912 Seven Islands Shipping Ltd. 30691 5340113 TAG Offshore Ltd. 22650 1993914 The Shipping Corpn. Of India Ltd. 668271 113395815 Zen Shipping & Ports India Pvt. Ltd. 8253 14003
Total 2087718 3554481LPG Carriers
1 Global United Shipping India Pvt. Ltd. 126524 1512702 Mercator Ltd. 44704 03 The Great Eastern Shipping Co. Ltd. 44694 498494 The Shipping Corpn.of India Ltd. 35556 352025 Varun Resources Ltd. 23878 272006 Varun Shipping Co.Ltd. 155605 187978
Total 430961 451499Source: Directorate General of Shipping, Mumbai.
CHAP
TER
ICH
APTE
R II
CHAP
TER
IIICH
APTE
R IV
CHAP
TER
VCH
APTE
R VI
CHAP
TER
VII
CHAP
TER
VIII
CHAP
TER
IXCH
APTE
R X
CHAP
TER
XIAP
PEN
DIX
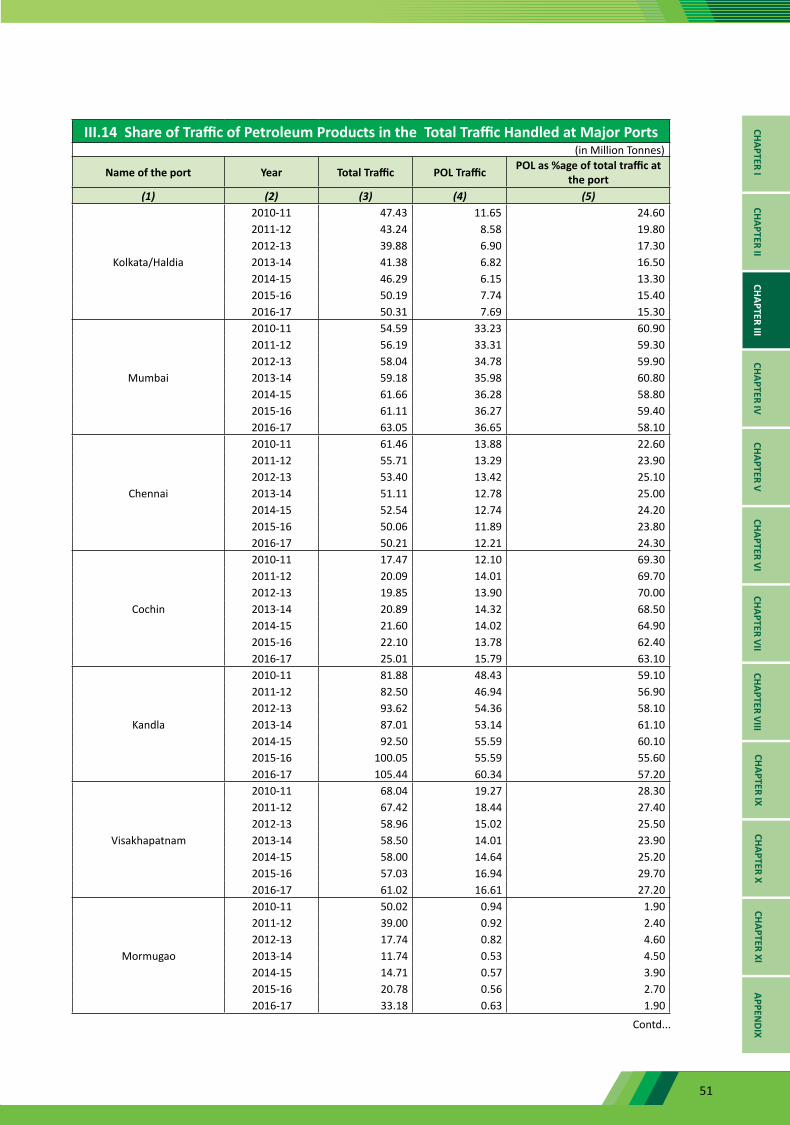
51
III.14 Share of Traffic of Petroleum Products in the Total Traffic Handled at Major Ports(in Million Tonnes)
Name of the port Year Total Traffic POL Traffic POL as %age of total traffic at the port
(1) (2) (3) (4) (5)
Kolkata/Haldia
2010-11 47.43 11.65 24.602011-12 43.24 8.58 19.802012-13 39.88 6.90 17.302013-14 41.38 6.82 16.502014-15 46.29 6.15 13.302015-16 50.19 7.74 15.402016-17 50.31 7.69 15.30
Mumbai
2010-11 54.59 33.23 60.902011-12 56.19 33.31 59.302012-13 58.04 34.78 59.902013-14 59.18 35.98 60.802014-15 61.66 36.28 58.802015-16 61.11 36.27 59.402016-17 63.05 36.65 58.10
Chennai
2010-11 61.46 13.88 22.602011-12 55.71 13.29 23.902012-13 53.40 13.42 25.102013-14 51.11 12.78 25.002014-15 52.54 12.74 24.202015-16 50.06 11.89 23.802016-17 50.21 12.21 24.30
Cochin
2010-11 17.47 12.10 69.302011-12 20.09 14.01 69.702012-13 19.85 13.90 70.002013-14 20.89 14.32 68.502014-15 21.60 14.02 64.902015-16 22.10 13.78 62.402016-17 25.01 15.79 63.10
Kandla
2010-11 81.88 48.43 59.102011-12 82.50 46.94 56.902012-13 93.62 54.36 58.102013-14 87.01 53.14 61.102014-15 92.50 55.59 60.102015-16 100.05 55.59 55.602016-17 105.44 60.34 57.20
Visakhapatnam
2010-11 68.04 19.27 28.302011-12 67.42 18.44 27.402012-13 58.96 15.02 25.502013-14 58.50 14.01 23.902014-15 58.00 14.64 25.202015-16 57.03 16.94 29.702016-17 61.02 16.61 27.20
Mormugao
2010-11 50.02 0.94 1.902011-12 39.00 0.92 2.402012-13 17.74 0.82 4.602013-14 11.74 0.53 4.502014-15 14.71 0.57 3.902015-16 20.78 0.56 2.702016-17 33.18 0.63 1.90
Contd...
CHAPTER ICHAPTER II
CHAPTER IIICHAPTER IV
CHAPTER VCHAPTER VI
CHAPTER VIICHAPTER VIII
CHAPTER IXCHAPTER X
CHAPTER XIAPPEN
DIX
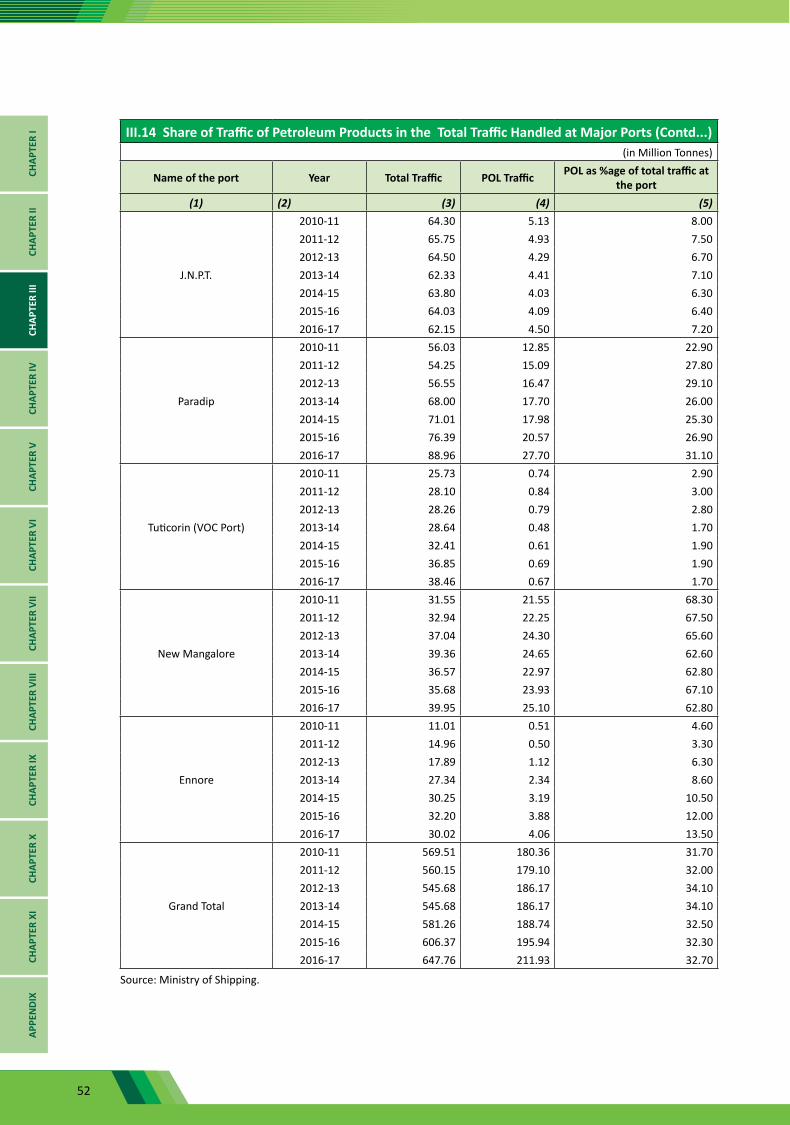
52
III.14 Share of Traffic of Petroleum Products in the Total Traffic Handled at Major Ports (Contd...)(in Million Tonnes)
Name of the port Year Total Traffic POL Traffic POL as %age of total traffic at the port
(1) (2) (3) (4) (5)
J.N.P.T.
2010-11 64.30 5.13 8.002011-12 65.75 4.93 7.502012-13 64.50 4.29 6.702013-14 62.33 4.41 7.102014-15 63.80 4.03 6.302015-16 64.03 4.09 6.402016-17 62.15 4.50 7.20
Paradip
2010-11 56.03 12.85 22.902011-12 54.25 15.09 27.802012-13 56.55 16.47 29.102013-14 68.00 17.70 26.002014-15 71.01 17.98 25.302015-16 76.39 20.57 26.902016-17 88.96 27.70 31.10
Tuticorin (VOC Port)
2010-11 25.73 0.74 2.902011-12 28.10 0.84 3.002012-13 28.26 0.79 2.802013-14 28.64 0.48 1.702014-15 32.41 0.61 1.902015-16 36.85 0.69 1.902016-17 38.46 0.67 1.70
New Mangalore
2010-11 31.55 21.55 68.302011-12 32.94 22.25 67.502012-13 37.04 24.30 65.602013-14 39.36 24.65 62.602014-15 36.57 22.97 62.802015-16 35.68 23.93 67.102016-17 39.95 25.10 62.80
Ennore
2010-11 11.01 0.51 4.602011-12 14.96 0.50 3.302012-13 17.89 1.12 6.302013-14 27.34 2.34 8.602014-15 30.25 3.19 10.502015-16 32.20 3.88 12.002016-17 30.02 4.06 13.50
Grand Total
2010-11 569.51 180.36 31.702011-12 560.15 179.10 32.002012-13 545.68 186.17 34.102013-14 545.68 186.17 34.102014-15 581.26 188.74 32.502015-16 606.37 195.94 32.302016-17 647.76 211.93 32.70
Source: Ministry of Shipping.
CHAP
TER
ICH
APTE
R II
CHAP
TER
IIICH
APTE
R IV
CHAP
TER
VCH
APTE
R VI
CHAP
TER
VII
CHAP
TER
VIII
CHAP
TER
IXCH
APTE
R X
CHAP
TER
XIAP
PEN
DIX
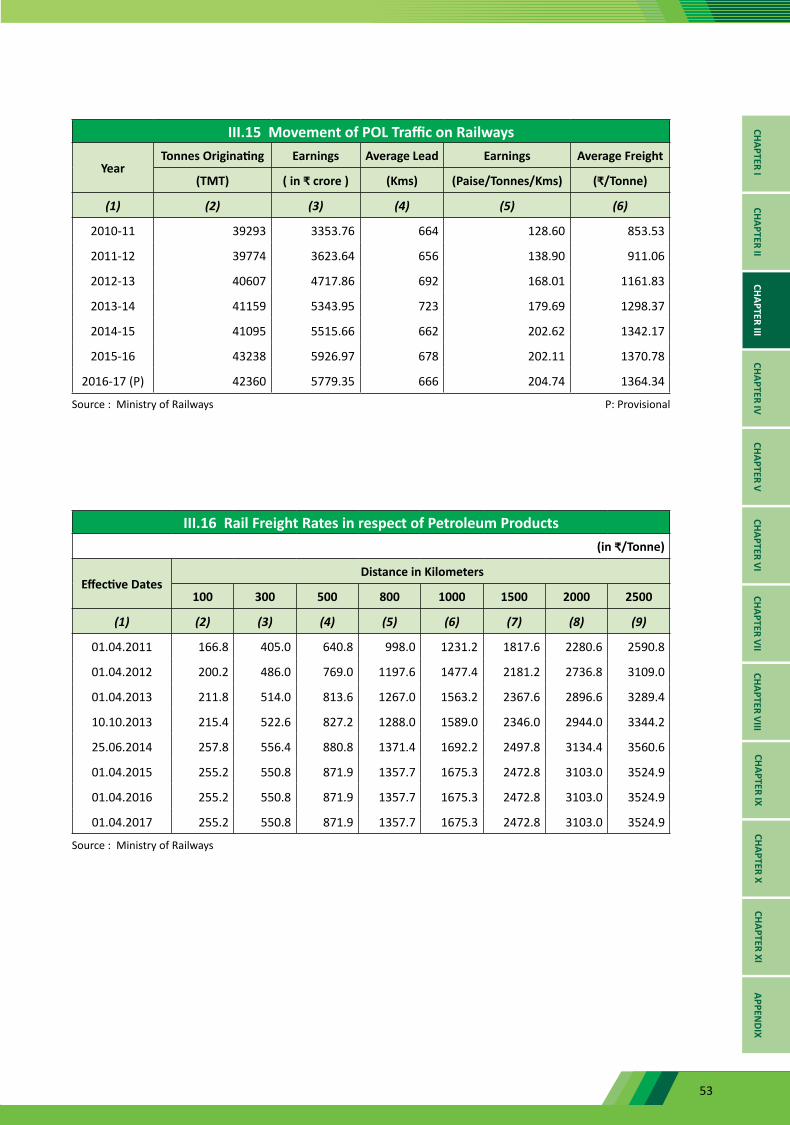
53
III.15 Movement of POL Traffic on Railways
YearTonnes Originating Earnings Average Lead Earnings Average Freight
(TMT) ( in ₹ crore ) (Kms) (Paise/Tonnes/Kms) (₹/Tonne)
(1) (2) (3) (4) (5) (6)
2010-11 39293 3353.76 664 128.60 853.53
2011-12 39774 3623.64 656 138.90 911.06
2012-13 40607 4717.86 692 168.01 1161.83
2013-14 41159 5343.95 723 179.69 1298.37
2014-15 41095 5515.66 662 202.62 1342.17
2015-16 43238 5926.97 678 202.11 1370.78
2016-17 (P) 42360 5779.35 666 204.74 1364.34
Source : Ministry of Railways P: Provisional
III.16 Rail Freight Rates in respect of Petroleum Products (in ₹/Tonne)
Effective Dates Distance in Kilometers
100 300 500 800 1000 1500 2000 2500
(1) (2) (3) (4) (5) (6) (7) (8) (9)
01.04.2011 166.8 405.0 640.8 998.0 1231.2 1817.6 2280.6 2590.8
01.04.2012 200.2 486.0 769.0 1197.6 1477.4 2181.2 2736.8 3109.0
01.04.2013 211.8 514.0 813.6 1267.0 1563.2 2367.6 2896.6 3289.4
10.10.2013 215.4 522.6 827.2 1288.0 1589.0 2346.0 2944.0 3344.2
25.06.2014 257.8 556.4 880.8 1371.4 1692.2 2497.8 3134.4 3560.6
01.04.2015 255.2 550.8 871.9 1357.7 1675.3 2472.8 3103.0 3524.9
01.04.2016 255.2 550.8 871.9 1357.7 1675.3 2472.8 3103.0 3524.9
01.04.2017 255.2 550.8 871.9 1357.7 1675.3 2472.8 3103.0 3524.9
Source : Ministry of Railways
CHAPTER ICHAPTER II
CHAPTER IIICHAPTER IV
CHAPTER VCHAPTER VI
CHAPTER VIICHAPTER VIII
CHAPTER IXCHAPTER X
CHAPTER XIAPPEN
DIX

54
III.17 Total Retail Outlets in India as on 31st March(in Number)
Year Unit BPCL HPCL IOCL Others TOTAL
(1) (2) (3) (4) (5) (6) (7)
2011Nos. 9289 10212 19463 2983 41947
% 22.1 24.3 46.4 7.1 100
2012Nos. 10310 11253 20575 2966 45104
% 22.9 24.9 45.6 6.6 100
2013Nos. 11637 12173 22372 2487 48669
% 23.9 25.0 46.0 5.1 100
2014Nos. 12123 12869 23993 2883 51868
% 23.4 24.8 46.3 5.6 100
2015Nos. 12809 13233 24405 2972 53419
% 24.0 24.8 45.7 5.6 100
2016Nos. 13439 13802 25363 3586 56190
% 23.9 24.6 45.1 6.4 100
2017Nos. 13983 14412 26212 4988 59595
% 23.5 24.2 44.0 8.4 100
Source: Oil Companies
CHAP
TER
ICH
APTE
R II
CHAP
TER
IIICH
APTE
R IV
CHAP
TER
VCH
APTE
R VI
CHAP
TER
VII
CHAP
TER
VIII
CHAP
TER
IXCH
APTE
R X
CHAP
TER
XIAP
PEN
DIX
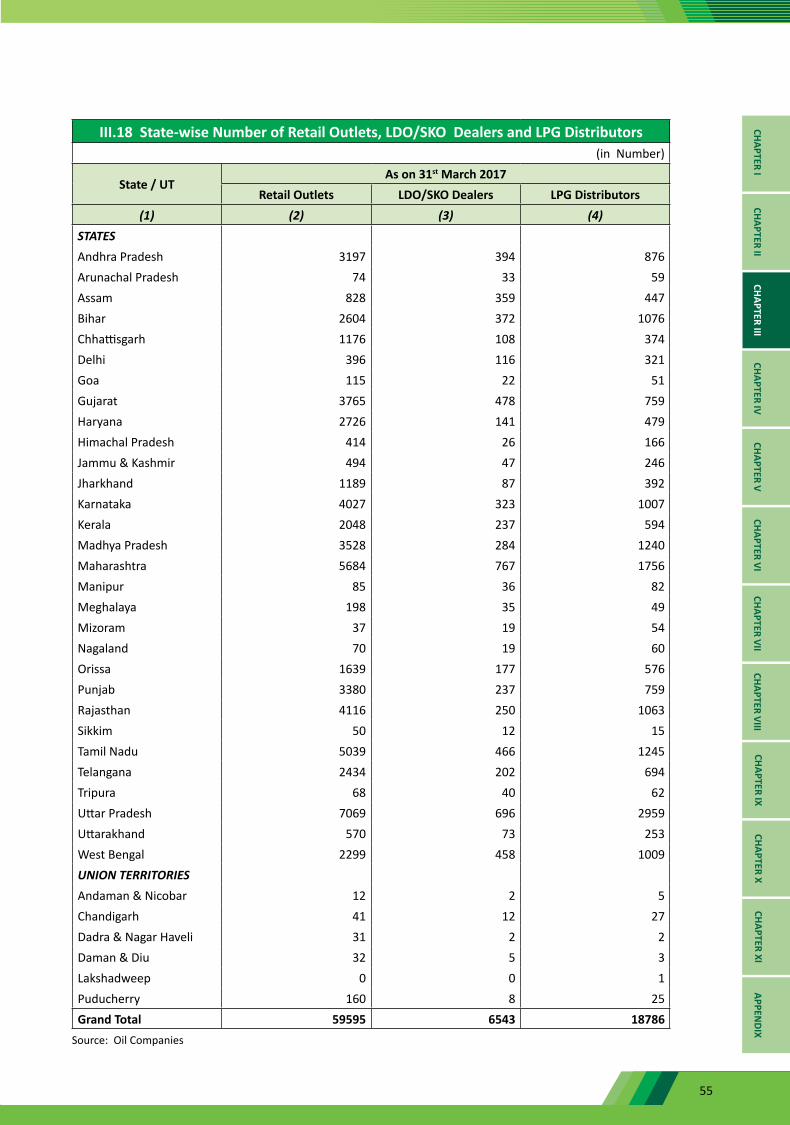
55
III.18 State-wise Number of Retail Outlets, LDO/SKO Dealers and LPG Distributors(in Number)
State / UTAs on 31st March 2017
Retail Outlets LDO/SKO Dealers LPG Distributors(1) (2) (3) (4)
STATESAndhra Pradesh 3197 394 876Arunachal Pradesh 74 33 59Assam 828 359 447Bihar 2604 372 1076Chhattisgarh 1176 108 374Delhi 396 116 321Goa 115 22 51Gujarat 3765 478 759Haryana 2726 141 479Himachal Pradesh 414 26 166Jammu & Kashmir 494 47 246Jharkhand 1189 87 392Karnataka 4027 323 1007Kerala 2048 237 594Madhya Pradesh 3528 284 1240Maharashtra 5684 767 1756Manipur 85 36 82Meghalaya 198 35 49Mizoram 37 19 54Nagaland 70 19 60Orissa 1639 177 576Punjab 3380 237 759Rajasthan 4116 250 1063Sikkim 50 12 15Tamil Nadu 5039 466 1245Telangana 2434 202 694Tripura 68 40 62Uttar Pradesh 7069 696 2959Uttarakhand 570 73 253West Bengal 2299 458 1009UNION TERRITORIESAndaman & Nicobar 12 2 5Chandigarh 41 12 27Dadra & Nagar Haveli 31 2 2Daman & Diu 32 5 3Lakshadweep 0 0 1Puducherry 160 8 25Grand Total 59595 6543 18786
Source: Oil Companies
CHAPTER ICHAPTER II
CHAPTER IIICHAPTER IV
CHAPTER VCHAPTER VI
CHAPTER VIICHAPTER VIII
CHAPTER IXCHAPTER X
CHAPTER XIAPPEN
DIX
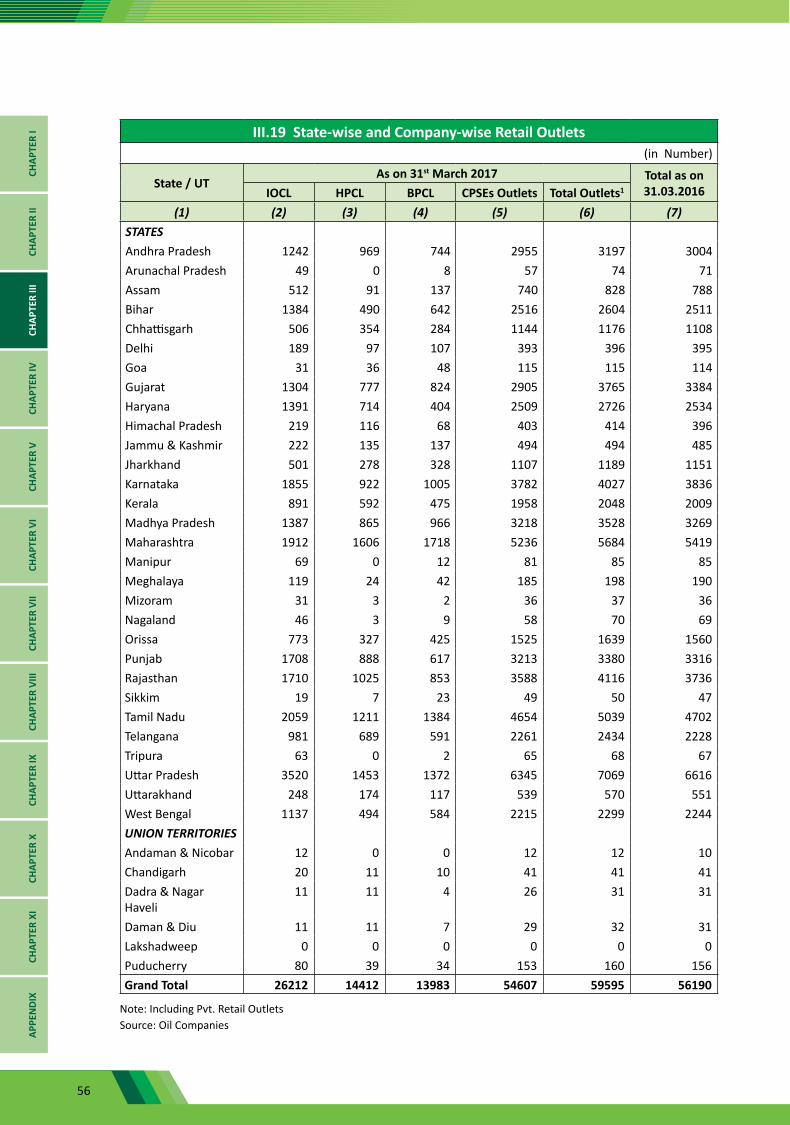
56
III.19 State-wise and Company-wise Retail Outlets(in Number)
State / UTAs on 31st March 2017 Total as on
31.03.2016IOCL HPCL BPCL CPSEs Outlets Total Outlets1
(1) (2) (3) (4) (5) (6) (7)STATESAndhra Pradesh 1242 969 744 2955 3197 3004Arunachal Pradesh 49 0 8 57 74 71Assam 512 91 137 740 828 788Bihar 1384 490 642 2516 2604 2511Chhattisgarh 506 354 284 1144 1176 1108Delhi 189 97 107 393 396 395Goa 31 36 48 115 115 114Gujarat 1304 777 824 2905 3765 3384Haryana 1391 714 404 2509 2726 2534Himachal Pradesh 219 116 68 403 414 396Jammu & Kashmir 222 135 137 494 494 485Jharkhand 501 278 328 1107 1189 1151Karnataka 1855 922 1005 3782 4027 3836Kerala 891 592 475 1958 2048 2009Madhya Pradesh 1387 865 966 3218 3528 3269Maharashtra 1912 1606 1718 5236 5684 5419Manipur 69 0 12 81 85 85Meghalaya 119 24 42 185 198 190Mizoram 31 3 2 36 37 36Nagaland 46 3 9 58 70 69Orissa 773 327 425 1525 1639 1560Punjab 1708 888 617 3213 3380 3316Rajasthan 1710 1025 853 3588 4116 3736Sikkim 19 7 23 49 50 47Tamil Nadu 2059 1211 1384 4654 5039 4702Telangana 981 689 591 2261 2434 2228Tripura 63 0 2 65 68 67Uttar Pradesh 3520 1453 1372 6345 7069 6616Uttarakhand 248 174 117 539 570 551West Bengal 1137 494 584 2215 2299 2244UNION TERRITORIESAndaman & Nicobar 12 0 0 12 12 10Chandigarh 20 11 10 41 41 41Dadra & Nagar Haveli
11 11 4 26 31 31
Daman & Diu 11 11 7 29 32 31Lakshadweep 0 0 0 0 0 0Puducherry 80 39 34 153 160 156Grand Total 26212 14412 13983 54607 59595 56190
Note: Including Pvt. Retail Outlets Source: Oil Companies
CHAP
TER
ICH
APTE
R II
CHAP
TER
IIICH
APTE
R IV
CHAP
TER
VCH
APTE
R VI
CHAP
TER
VII
CHAP
TER
VIII
CHAP
TER
IXCH
APTE
R X
CHAP
TER
XIAP
PEN
DIX
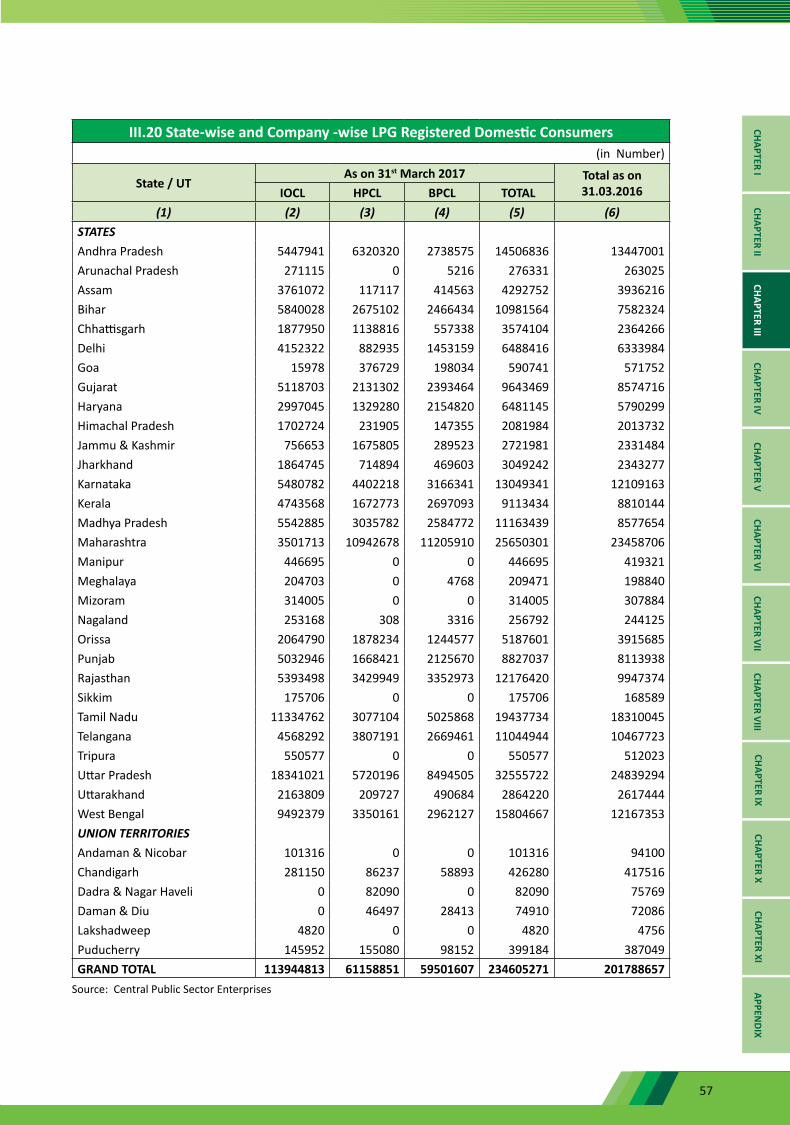
57
III.20 State-wise and Company -wise LPG Registered Domestic Consumers(in Number)
State / UTAs on 31st March 2017 Total as on
31.03.2016IOCL HPCL BPCL TOTAL(1) (2) (3) (4) (5) (6)
STATESAndhra Pradesh 5447941 6320320 2738575 14506836 13447001Arunachal Pradesh 271115 0 5216 276331 263025Assam 3761072 117117 414563 4292752 3936216Bihar 5840028 2675102 2466434 10981564 7582324Chhattisgarh 1877950 1138816 557338 3574104 2364266Delhi 4152322 882935 1453159 6488416 6333984Goa 15978 376729 198034 590741 571752Gujarat 5118703 2131302 2393464 9643469 8574716Haryana 2997045 1329280 2154820 6481145 5790299Himachal Pradesh 1702724 231905 147355 2081984 2013732Jammu & Kashmir 756653 1675805 289523 2721981 2331484Jharkhand 1864745 714894 469603 3049242 2343277Karnataka 5480782 4402218 3166341 13049341 12109163Kerala 4743568 1672773 2697093 9113434 8810144Madhya Pradesh 5542885 3035782 2584772 11163439 8577654Maharashtra 3501713 10942678 11205910 25650301 23458706Manipur 446695 0 0 446695 419321Meghalaya 204703 0 4768 209471 198840Mizoram 314005 0 0 314005 307884Nagaland 253168 308 3316 256792 244125Orissa 2064790 1878234 1244577 5187601 3915685Punjab 5032946 1668421 2125670 8827037 8113938Rajasthan 5393498 3429949 3352973 12176420 9947374Sikkim 175706 0 0 175706 168589Tamil Nadu 11334762 3077104 5025868 19437734 18310045Telangana 4568292 3807191 2669461 11044944 10467723Tripura 550577 0 0 550577 512023Uttar Pradesh 18341021 5720196 8494505 32555722 24839294Uttarakhand 2163809 209727 490684 2864220 2617444West Bengal 9492379 3350161 2962127 15804667 12167353UNION TERRITORIESAndaman & Nicobar 101316 0 0 101316 94100Chandigarh 281150 86237 58893 426280 417516Dadra & Nagar Haveli 0 82090 0 82090 75769Daman & Diu 0 46497 28413 74910 72086Lakshadweep 4820 0 0 4820 4756Puducherry 145952 155080 98152 399184 387049GRAND TOTAL 113944813 61158851 59501607 234605271 201788657
Source: Central Public Sector Enterprises
CHAPTER ICHAPTER II
CHAPTER IIICHAPTER IV
CHAPTER VCHAPTER VI
CHAPTER VIICHAPTER VIII
CHAPTER IXCHAPTER X
CHAPTER XIAPPEN
DIX
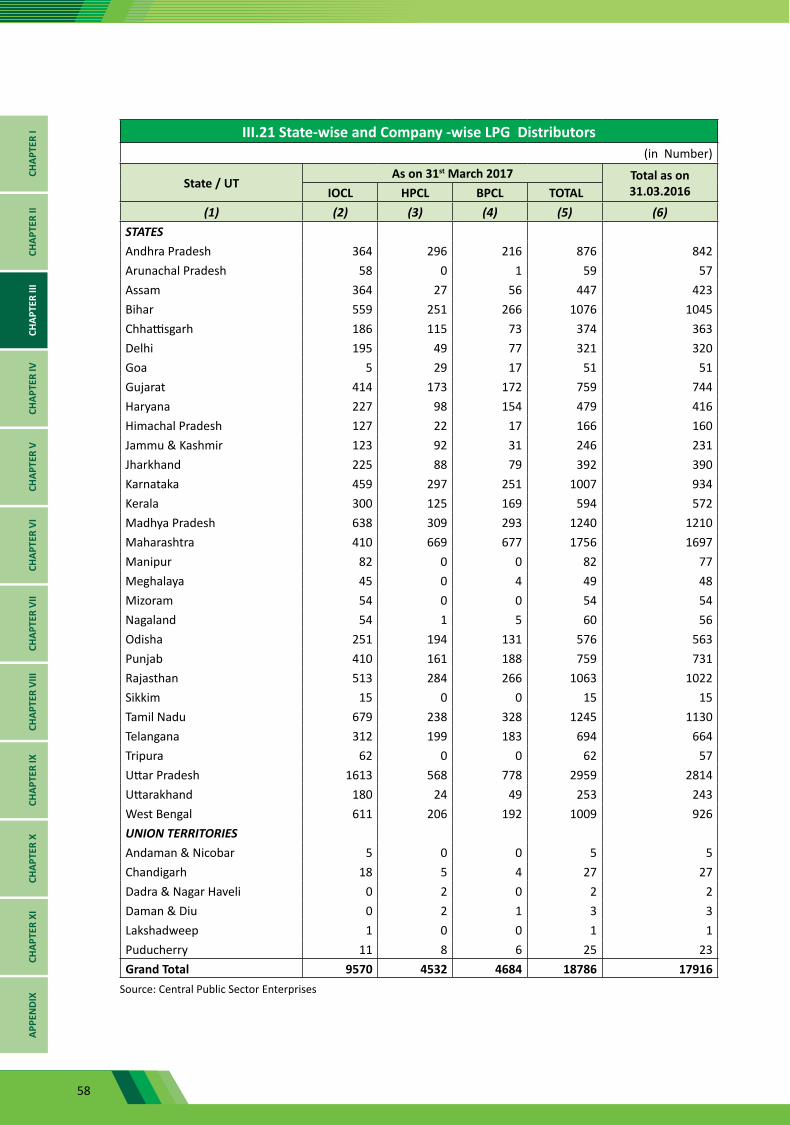
58
III.21 State-wise and Company -wise LPG Distributors(in Number)
State / UTAs on 31st March 2017 Total as on
31.03.2016IOCL HPCL BPCL TOTAL(1) (2) (3) (4) (5) (6)
STATESAndhra Pradesh 364 296 216 876 842Arunachal Pradesh 58 0 1 59 57Assam 364 27 56 447 423Bihar 559 251 266 1076 1045Chhattisgarh 186 115 73 374 363Delhi 195 49 77 321 320Goa 5 29 17 51 51Gujarat 414 173 172 759 744Haryana 227 98 154 479 416Himachal Pradesh 127 22 17 166 160Jammu & Kashmir 123 92 31 246 231Jharkhand 225 88 79 392 390Karnataka 459 297 251 1007 934Kerala 300 125 169 594 572Madhya Pradesh 638 309 293 1240 1210Maharashtra 410 669 677 1756 1697Manipur 82 0 0 82 77Meghalaya 45 0 4 49 48Mizoram 54 0 0 54 54Nagaland 54 1 5 60 56Odisha 251 194 131 576 563Punjab 410 161 188 759 731Rajasthan 513 284 266 1063 1022Sikkim 15 0 0 15 15Tamil Nadu 679 238 328 1245 1130Telangana 312 199 183 694 664Tripura 62 0 0 62 57Uttar Pradesh 1613 568 778 2959 2814Uttarakhand 180 24 49 253 243West Bengal 611 206 192 1009 926UNION TERRITORIESAndaman & Nicobar 5 0 0 5 5Chandigarh 18 5 4 27 27Dadra & Nagar Haveli 0 2 0 2 2Daman & Diu 0 2 1 3 3Lakshadweep 1 0 0 1 1Puducherry 11 8 6 25 23Grand Total 9570 4532 4684 18786 17916
Source: Central Public Sector Enterprises
CHAP
TER
ICH
APTE
R II
CHAP
TER
IIICH
APTE
R IV
CHAP
TER
VCH
APTE
R VI
CHAP
TER
VII
CHAP
TER
VIII
CHAP
TER
IXCH
APTE
R X
CHAP
TER
XIAP
PEN
DIX
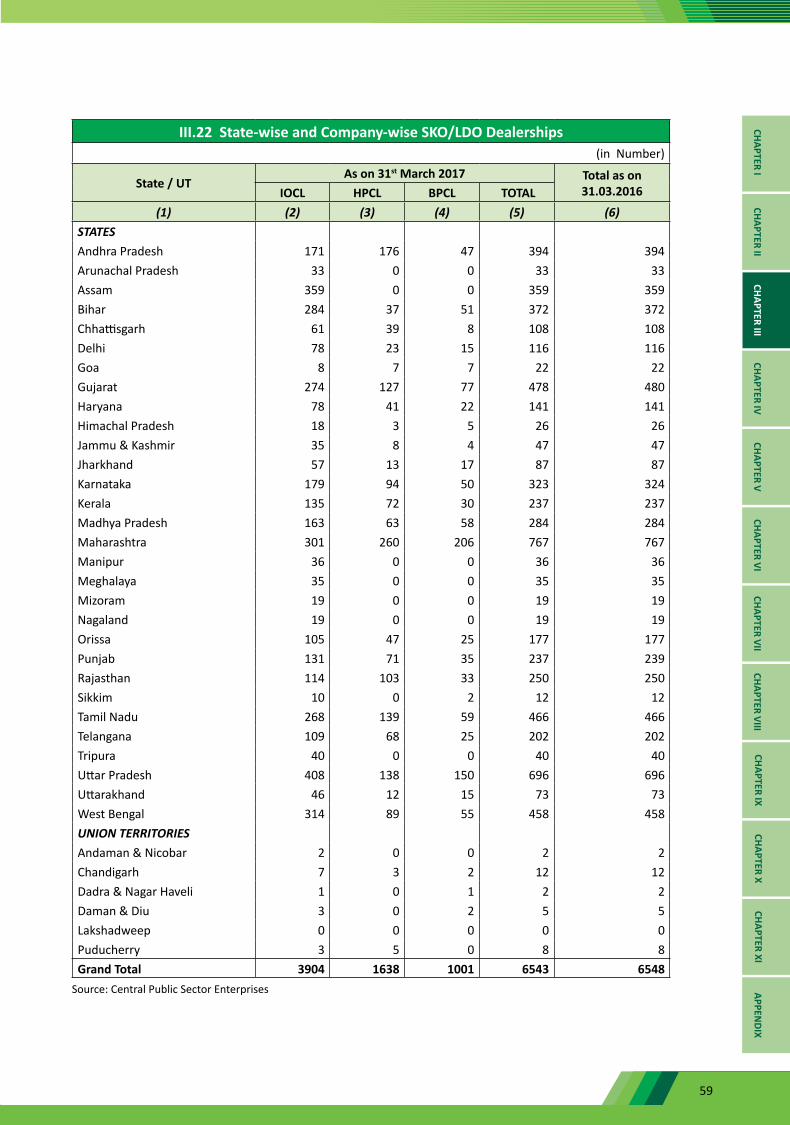
59
III.22 State-wise and Company-wise SKO/LDO Dealerships(in Number)
State / UTAs on 31st March 2017 Total as on
31.03.2016IOCL HPCL BPCL TOTAL(1) (2) (3) (4) (5) (6)
STATESAndhra Pradesh 171 176 47 394 394Arunachal Pradesh 33 0 0 33 33Assam 359 0 0 359 359Bihar 284 37 51 372 372Chhattisgarh 61 39 8 108 108Delhi 78 23 15 116 116Goa 8 7 7 22 22Gujarat 274 127 77 478 480Haryana 78 41 22 141 141Himachal Pradesh 18 3 5 26 26Jammu & Kashmir 35 8 4 47 47Jharkhand 57 13 17 87 87Karnataka 179 94 50 323 324Kerala 135 72 30 237 237Madhya Pradesh 163 63 58 284 284Maharashtra 301 260 206 767 767Manipur 36 0 0 36 36Meghalaya 35 0 0 35 35Mizoram 19 0 0 19 19Nagaland 19 0 0 19 19Orissa 105 47 25 177 177Punjab 131 71 35 237 239Rajasthan 114 103 33 250 250Sikkim 10 0 2 12 12Tamil Nadu 268 139 59 466 466Telangana 109 68 25 202 202Tripura 40 0 0 40 40Uttar Pradesh 408 138 150 696 696Uttarakhand 46 12 15 73 73West Bengal 314 89 55 458 458UNION TERRITORIESAndaman & Nicobar 2 0 0 2 2Chandigarh 7 3 2 12 12Dadra & Nagar Haveli 1 0 1 2 2Daman & Diu 3 0 2 5 5Lakshadweep 0 0 0 0 0Puducherry 3 5 0 8 8Grand Total 3904 1638 1001 6543 6548
Source: Central Public Sector Enterprises
CHAPTER ICHAPTER II
CHAPTER IIICHAPTER IV
CHAPTER VCHAPTER VI
CHAPTER VIICHAPTER VIII
CHAPTER IXCHAPTER X
CHAPTER XIAPPEN
DIX
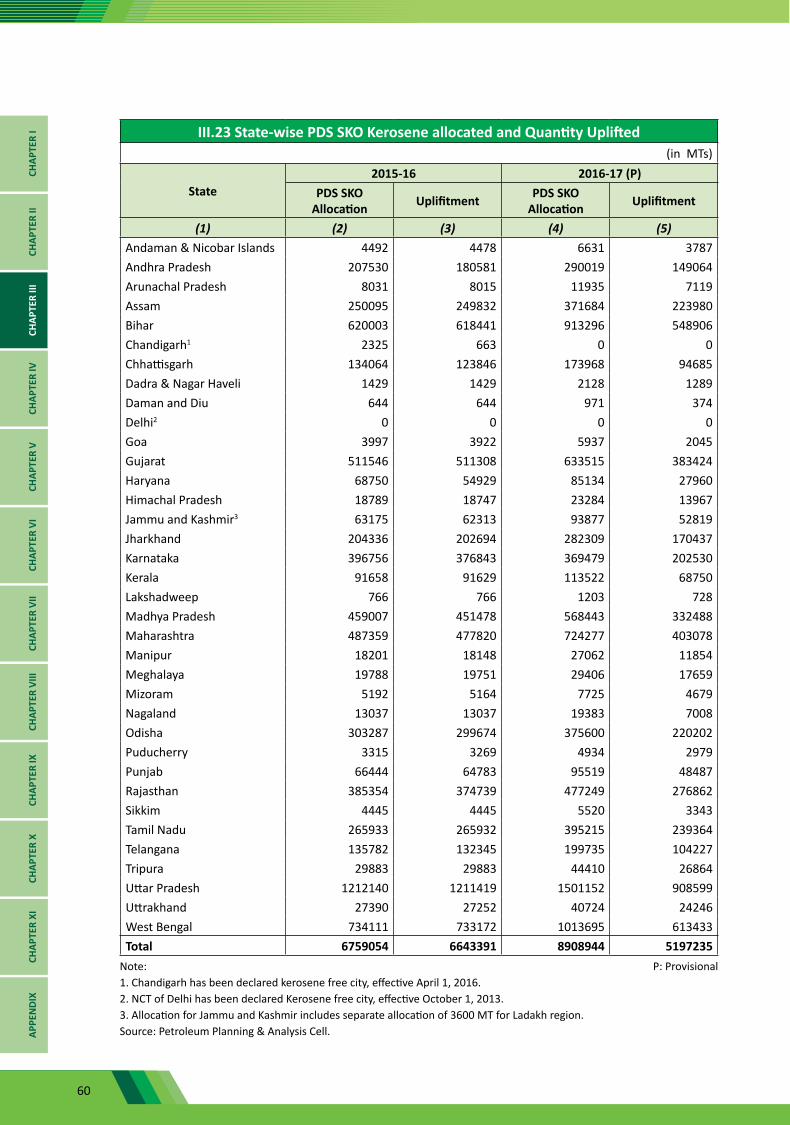
60
III.23 State-wise PDS SKO Kerosene allocated and Quantity Uplifted(in MTs)
State2015-16 2016-17 (P)
PDS SKO Allocation Uplifitment PDS SKO
Allocation Uplifitment
(1) (2) (3) (4) (5)Andaman & Nicobar Islands 4492 4478 6631 3787Andhra Pradesh 207530 180581 290019 149064Arunachal Pradesh 8031 8015 11935 7119Assam 250095 249832 371684 223980Bihar 620003 618441 913296 548906Chandigarh1 2325 663 0 0Chhattisgarh 134064 123846 173968 94685Dadra & Nagar Haveli 1429 1429 2128 1289Daman and Diu 644 644 971 374Delhi2 0 0 0 0Goa 3997 3922 5937 2045Gujarat 511546 511308 633515 383424Haryana 68750 54929 85134 27960Himachal Pradesh 18789 18747 23284 13967Jammu and Kashmir3 63175 62313 93877 52819Jharkhand 204336 202694 282309 170437Karnataka 396756 376843 369479 202530Kerala 91658 91629 113522 68750Lakshadweep 766 766 1203 728Madhya Pradesh 459007 451478 568443 332488Maharashtra 487359 477820 724277 403078Manipur 18201 18148 27062 11854Meghalaya 19788 19751 29406 17659Mizoram 5192 5164 7725 4679Nagaland 13037 13037 19383 7008Odisha 303287 299674 375600 220202Puducherry 3315 3269 4934 2979Punjab 66444 64783 95519 48487Rajasthan 385354 374739 477249 276862Sikkim 4445 4445 5520 3343Tamil Nadu 265933 265932 395215 239364Telangana 135782 132345 199735 104227Tripura 29883 29883 44410 26864Uttar Pradesh 1212140 1211419 1501152 908599Uttrakhand 27390 27252 40724 24246West Bengal 734111 733172 1013695 613433Total 6759054 6643391 8908944 5197235
Note: P: Provisional1. Chandigarh has been declared kerosene free city, effective April 1, 2016. 2. NCT of Delhi has been declared Kerosene free city, effective October 1, 2013. 3. Allocation for Jammu and Kashmir includes separate allocation of 3600 MT for Ladakh region. Source: Petroleum Planning & Analysis Cell.
CHAP
TER
ICH
APTE
R II
CHAP
TER
IIICH
APTE
R IV
CHAP
TER
VCH
APTE
R VI
CHAP
TER
VII
CHAP
TER
VIII
CHAP
TER
IXCH
APTE
R X
CHAP
TER
XIAP
PEN
DIX
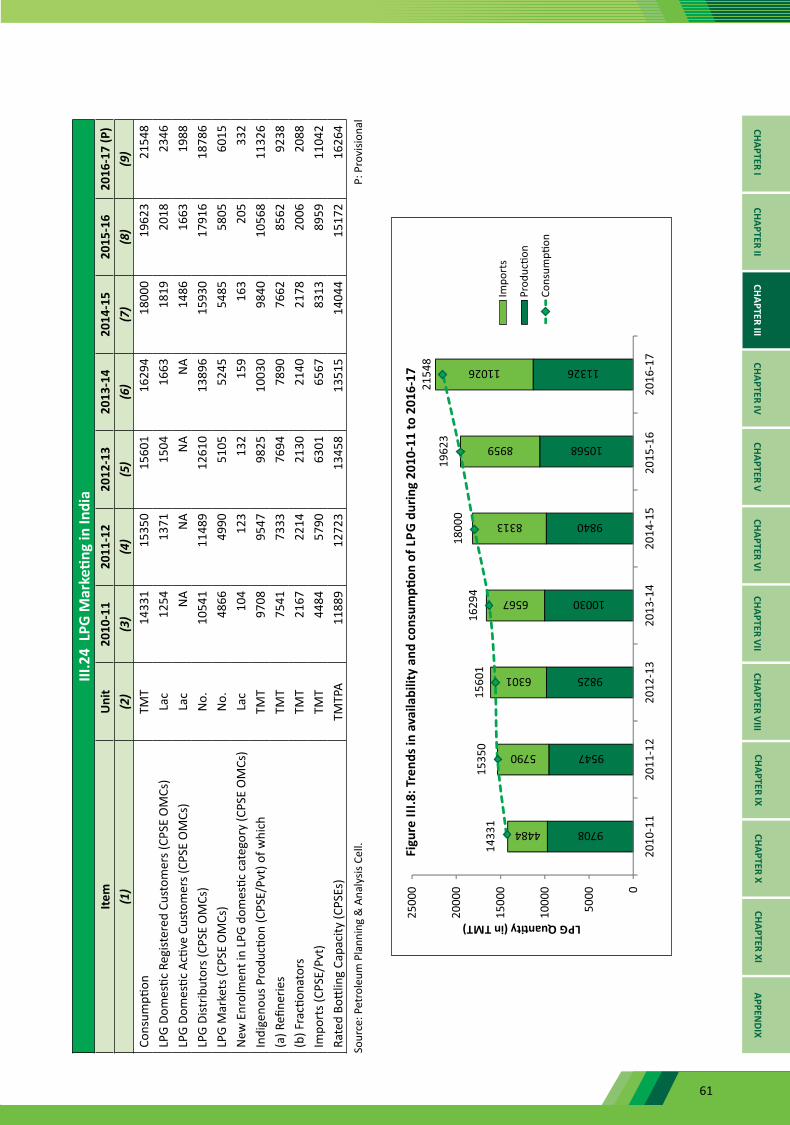
61
III.2
4 L
PG M
arke
ting
in In
dia
Item
Uni
t20
10-1
120
11-1
220
12-1
320
13-1
420
14-1
520
15-1
6 20
16-1
7 (P
)(1
)(2
)(3
)(4
)(5
)(6
)(7
)(8
)(9
)Co
nsum
ption
TMT
1433
115
350
1560
116
294
1800
019
623
2154
8LP
G Do
mes
tic R
egist
ered
Cus
tom
ers (
CPSE
OM
Cs)
Lac
1254
1371
1504
1663
1819
2018
2346
LPG
Dom
estic
Acti
ve C
usto
mer
s (CP
SE O
MCs
)La
cN
AN
AN
AN
A14
8616
6319
88LP
G Di
strib
utor
s (CP
SE O
MCs
)N
o.10
541
1148
912
610
1389
615
930
1791
618
786
LPG
Mar
kets
(CPS
E O
MCs
) N
o.48
6649
9051
0552
4554
8558
0560
15N
ew E
nrol
men
t in
LPG
dom
estic
cat
egor
y (C
PSE
OM
Cs)
Lac
104
123
132
159
163
205
332
Indi
geno
us P
rodu
ction
(CPS
E/Pv
t) o
f whi
chTM
T97
0895
4798
2510
030
9840
1056
811
326
(a) R
efine
ries
TMT
7541
7333
7694
7890
7662
8562
9238
(b) F
racti
onat
ors
TMT
2167
2214
2130
2140
2178
2006
2088
Impo
rts (
CPSE
/Pvt
)TM
T44
8457
9063
0165
6783
1389
5911
042
Rate
d Bo
ttlin
g Ca
paci
ty (C
PSEs
) TM
TPA
1188
912
723
1345
813
515
1404
415
172
1626
4So
urce
: Pet
role
um P
lann
ing
& A
naly
sis C
ell.
P: P
rovi
siona
l
CHAPTER ICHAPTER II
CHAPTER IIICHAPTER IV
CHAPTER VCHAPTER VI
CHAPTER VIICHAPTER VIII
CHAPTER IXCHAPTER X
CHAPTER XIAPPEN
DIX
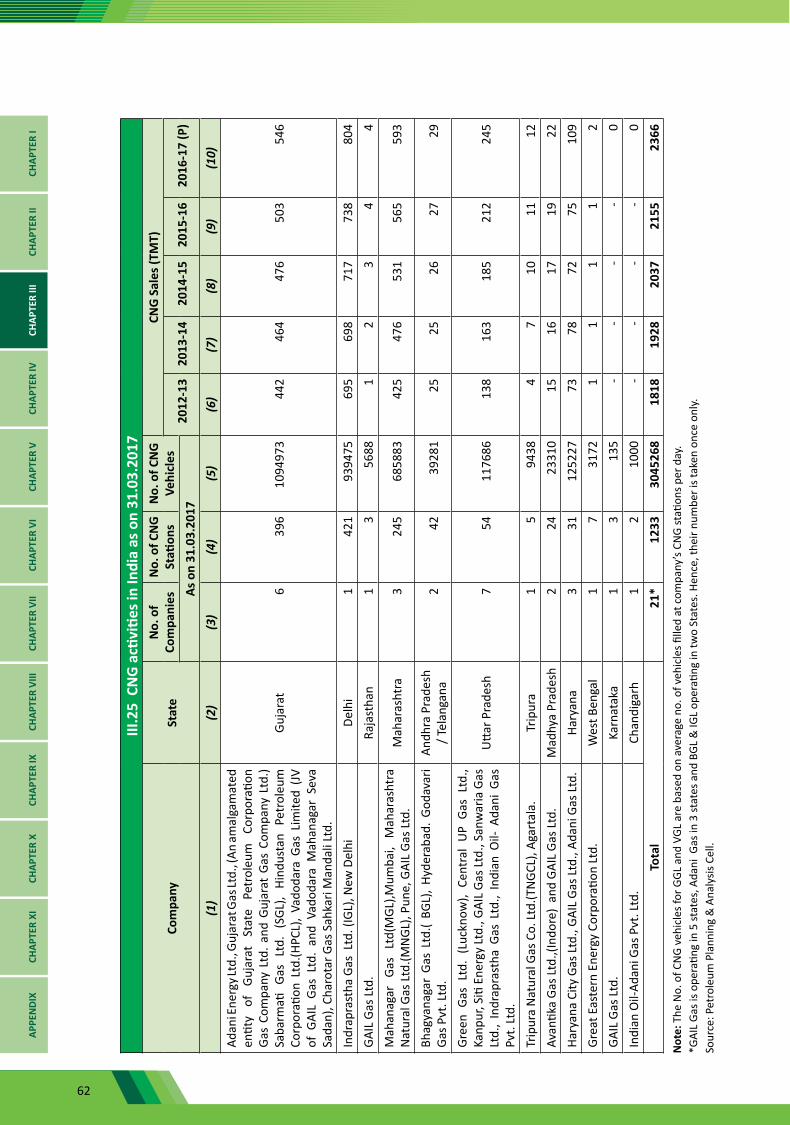
62
III.2
5 C
NG
acti
vitie
s in
Indi
a as
on
31.0
3.20
17
Com
pany
Stat
eN
o. o
f Co
mpa
nies
No.
of C
NG
St
ation
sN
o. o
f CN
G
Vehi
cles
CNG
Sal
es (T
MT)
2012
-13
2013
-14
2014
-15
2015
-16
2016
-17
(P)
As o
n 31
.03.
2017
(1)
(2)
(3)
(4)
(5)
(6)
(7)
(8)
(9)
(10)
Adan
i Ene
rgy L
td., G
ujar
at G
as Lt
d., (
An am
alga
mat
ed
entit
y of
Gu
jara
t St
ate
Petr
oleu
m
Corp
orati
on
Gas
Com
pany
Ltd
. and
Guj
arat
Gas
Com
pany
Ltd
.) Sa
barm
ati G
as L
td.
(SGL
), Hi
ndus
tan
Petr
oleu
m
Corp
orati
on L
td.(H
PCL)
, Va
doda
ra G
as L
imite
d (JV
of
GAI
L Ga
s Lt
d. a
nd V
adod
ara
Mah
anag
ar S
eva
Sada
n), C
haro
tar G
as S
ahka
ri M
anda
li Lt
d.
Guja
rat
639
610
9497
344
246
447
650
354
6
Indr
apra
stha
Gas
Ltd
. (IG
L), N
ew D
elhi
Delh
i1
421
9394
7569
569
871
773
880
4GA
IL G
as Lt
d.Ra
jast
han
13
5688
12
34
4M
ahan
agar
Ga
s Lt
d(M
GL),M
umba
i, M
ahar
asht
ra
Nat
ural
Gas
Ltd.
(MN
GL),
Pune
, GAI
L Ga
s Ltd
.M
ahar
asht
ra3
245
6858
8342
547
653
156
559
3
Bhag
yana
gar
Gas
Ltd.
( BG
L),
Hyde
raba
d. G
odav
ari
Gas P
vt. L
td.
Andh
ra P
rade
sh
/ Tel
anga
na2
4239
281
2525
2627
29
Gree
n Ga
s Lt
d. (
Luck
now
), Ce
ntra
l U
P Ga
s Lt
d.,
Kanp
ur, S
iti E
nerg
y Lt
d., G
AIL
Gas L
td.,
Sanw
aria
Gas
Lt
d.,
Indr
apra
stha
Gas
Ltd
., In
dian
Oil-
Ada
ni G
as
Pvt.
Ltd.
Utta
r Pra
desh
754
1176
8613
816
318
521
224
5
Trip
ura
Nat
ural
Gas
Co.
Ltd.
(TN
GCL)
, Aga
rtal
a.Tr
ipur
a1
594
384
710
1112
Avan
tika
Gas L
td.,(
Indo
re)
and
GAIL
Gas
Ltd.
Mad
hya
Prad
esh
224
2331
015
1617
1922
Hary
ana
City
Gas
Ltd.
, GAI
L Ga
s Ltd
., Ad
ani G
as Lt
d.Ha
ryan
a3
3112
5227
7378
7275
109
Grea
t Eas
tern
Ene
rgy
Corp
orati
on Lt
d.W
est B
enga
l1
731
721
11
12
GAIL
Gas
Ltd.
Karn
atak
a1
313
5-
--
-0
Indi
an O
il-Ad
ani G
as P
vt. L
td.
Chan
diga
rh1
210
00-
--
-0
Tota
l21
*12
3330
4526
818
1819
2820
3721
5523
66
Not
e: T
he N
o. o
f CN
G ve
hicl
es fo
r GGL
and
VGL
are
bas
ed o
n av
erag
e no
. of v
ehic
les fi
lled
at c
ompa
ny’s
CNG
stati
ons p
er d
ay.
*GAI
L Ga
s is o
pera
ting
in 5
stat
es, A
dani
Gas
in 3
stat
es a
nd B
GL &
IGL
oper
ating
in tw
o St
ates
. Hen
ce, t
heir
num
ber i
s tak
en o
nce
only.
Sour
ce: P
etro
leum
Pla
nnin
g &
Ana
lysis
Cel
l.
CHAP
TER
ICH
APTE
R II
CHAP
TER
IIICH
APTE
R IV
CHAP
TER
VCH
APTE
R VI
CHAP
TER
VII
CHAP
TER
VIII
CHAP
TER
IXCH
APTE
R X
CHAP
TER
XIAP
PEN
DIX
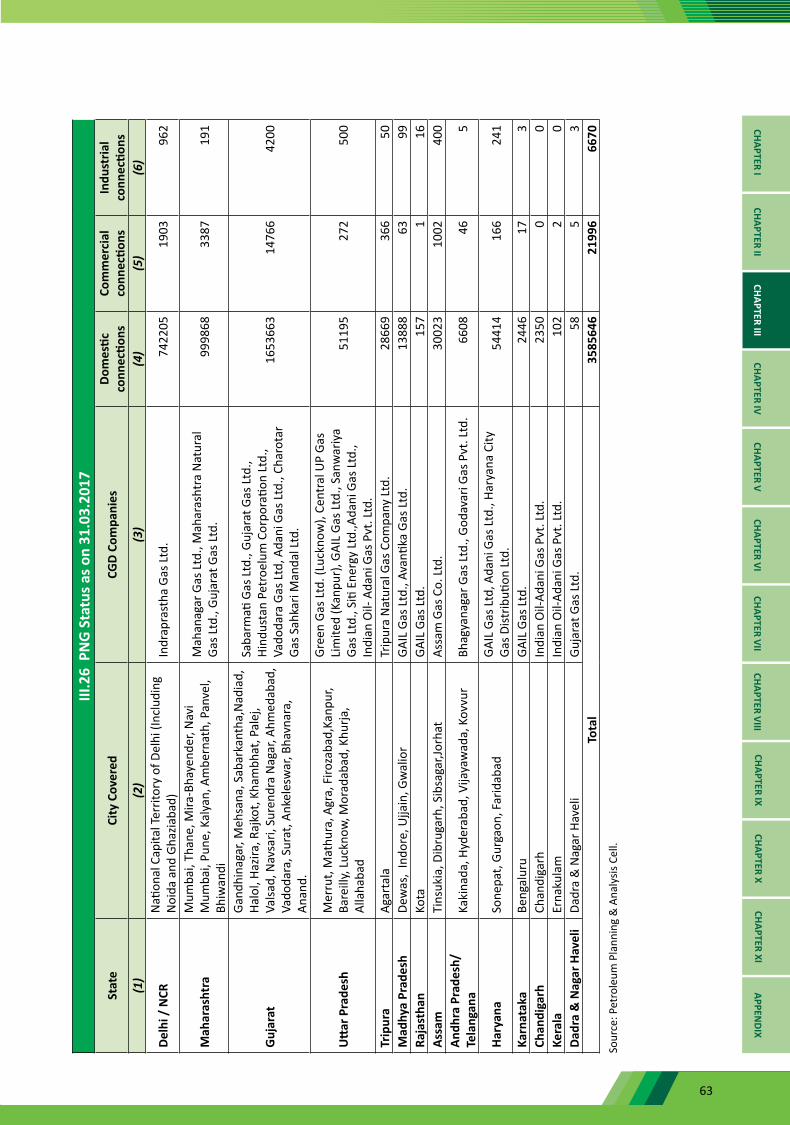
63
III.2
6 P
NG
Sta
tus a
s on
31.0
3.20
17
Stat
eCi
ty C
over
edCG
D Co
mpa
nies
Do
mes
tic
conn
ectio
ns
Com
mer
cial
co
nnec
tions
In
dust
rial
conn
ectio
ns(1
)(2
)(3
)(4
)(5
)(6
)
Delh
i / N
CRN
ation
al C
apita
l Ter
ritor
y of
Del
hi (I
nclu
ding
N
oida
and
Gha
ziaba
d)In
drap
rast
ha G
as Lt
d.74
2205
1903
962
Mah
aras
htra
Mum
bai,
Than
e, M
ira-B
haye
nder
, Nav
i M
umba
i, Pu
ne, K
alya
n, A
mbe
rnat
h, P
anve
l, Bh
iwan
di
Mah
anag
ar G
as Lt
d., M
ahar
asht
ra N
atur
al
Gas L
td.,
Guja
rat G
as Lt
d.99
9868
3387
191
Guj
arat
Gand
hina
gar,
Meh
sana
, Sab
arka
ntha
,Nad
iad,
Ha
lol,
Hazir
a, R
ajko
t, Kh
ambh
at, P
alej
, Va
lsad,
Nav
sari,
Sur
endr
a N
agar
, Ahm
edab
ad,
Vado
dara
, Sur
at, A
nkel
esw
ar, B
havn
ara,
An
and.
Saba
rmati
Gas
Ltd.
, Guj
arat
Gas
Ltd.
, Hi
ndus
tan
Petr
oelu
m C
orpo
ratio
n Lt
d.,
Vado
dara
Gas
Ltd,
Ada
ni G
as Lt
d., C
haro
tar
Gas S
ahka
ri M
anda
l Ltd
.
1653
663
1476
642
00
Utt
ar P
rade
shM
erru
t, M
athu
ra, A
gra,
Firo
zaba
d,Ka
npur
, Ba
reill
y, Lu
ckno
w, M
orad
abad
, Khu
rja,
Alla
haba
d
Gree
n Ga
s Ltd
. (Lu
ckno
w),
Cent
ral U
P Ga
s Li
mite
d (K
anpu
r), G
AIL
Gas L
td.,
Sanw
ariy
a Ga
s Ltd
., Si
ti En
ergy
Ltd.
,Ada
ni G
as Lt
d.,
Indi
an O
il- A
dani
Gas
Pvt
. Ltd
.
5119
527
250
0
Trip
ura
Agar
tala
Trip
ura
Nat
ural
Gas
Com
pany
Ltd.
2866
936
650
Mad
hya
Prad
esh
Dew
as,
Indo
re, U
jjain
, Gw
alio
rGA
IL G
as Lt
d., A
vanti
ka G
as Lt
d.13
888
6399
Raja
stha
nKo
taGA
IL G
as Lt
d.15
71
16As
sam
Tins
ukia
, Dib
ruga
rh, S
ibsa
gar,J
orha
tAs
sam
Gas
Co.
Ltd.
3002
310
0240
0An
dhra
Pra
desh
/Te
lang
ana
Kaki
nada
, Hyd
erab
ad, V
ijaya
wad
a, K
ovvu
rBh
agya
naga
r Gas
Ltd.
, God
avar
i Gas
Pvt
. Ltd
.66
0846
5
Hary
ana
Sone
pat,
Gurg
aon,
Far
idab
adGA
IL G
as Lt
d, A
dani
Gas
Ltd.
, Har
yana
City
Ga
s Dist
ributi
on Lt
d.54
414
166
241
Karn
atak
aBe
ngal
uru
GAIL
Gas
Ltd.
2446
173
Chan
diga
rhCh
andi
garh
Indi
an O
il-Ad
ani G
as P
vt. L
td.
2350
00
Kera
laEr
naku
lam
Indi
an O
il-Ad
ani G
as P
vt. L
td.
102
20
Dadr
a &
Nag
ar H
avel
iDa
dra
& N
agar
Hav
eli
Guja
rat G
as Lt
d.58
53
Tota
l35
8564
621
996
6670
Sour
ce: P
etro
leum
Pla
nnin
g &
Ana
lysis
Cel
l.
CHAPTER ICHAPTER II
CHAPTER IIICHAPTER IV
CHAPTER VCHAPTER VI
CHAPTER VIICHAPTER VIII
CHAPTER IXCHAPTER X
CHAPTER XIAPPEN
DIX
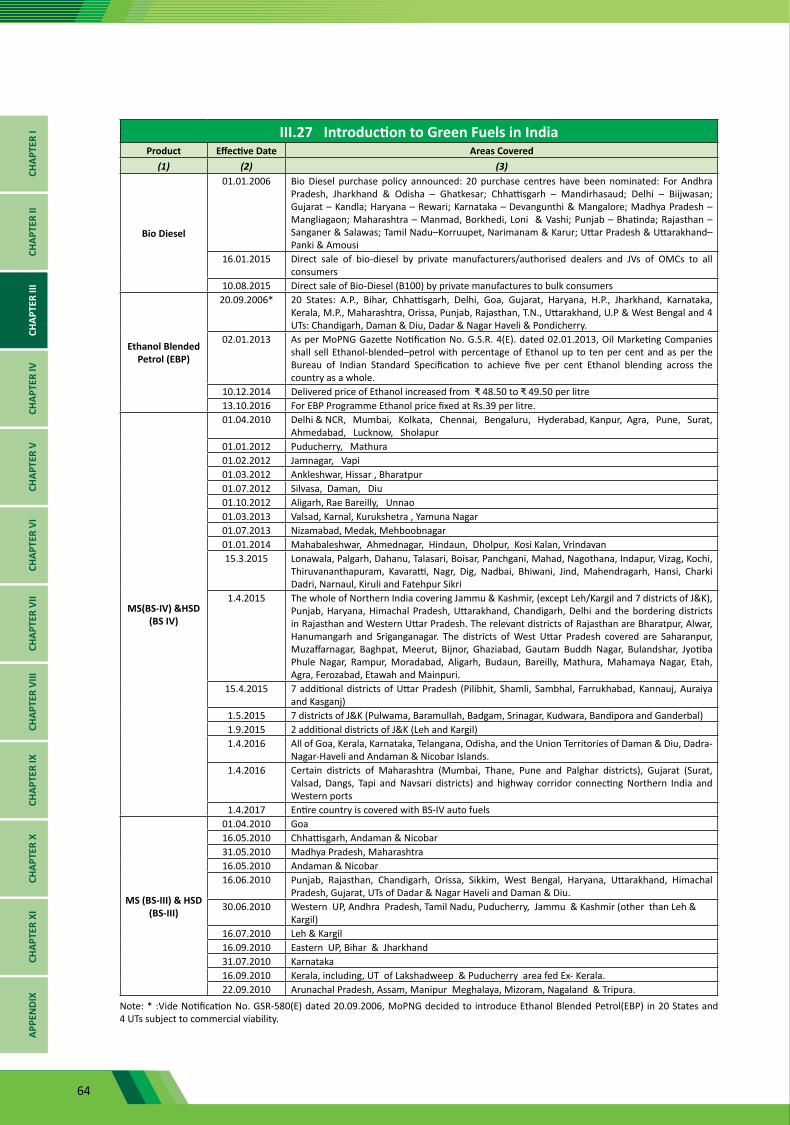
64
III.27 Introduction to Green Fuels in IndiaProduct Effective Date Areas Covered
(1) (2) (3)
Bio Diesel
01.01.2006 Bio Diesel purchase policy announced: 20 purchase centres have been nominated: For Andhra Pradesh, Jharkhand & Odisha – Ghatkesar; Chhattisgarh – Mandirhasaud; Delhi – Biijwasan; Gujarat – Kandla; Haryana – Rewari; Karnataka – Devangunthi & Mangalore; Madhya Pradesh – Mangliagaon; Maharashtra – Manmad, Borkhedi, Loni & Vashi; Punjab – Bhatinda; Rajasthan – Sanganer & Salawas; Tamil Nadu–Korruupet, Narimanam & Karur; Uttar Pradesh & Uttarakhand–Panki & Amousi
16.01.2015 Direct sale of bio-diesel by private manufacturers/authorised dealers and JVs of OMCs to all consumers
10.08.2015 Direct sale of Bio-Diesel (B100) by private manufactures to bulk consumers
Ethanol Blended Petrol (EBP)
20.09.2006* 20 States: A.P., Bihar, Chhattisgarh, Delhi, Goa, Gujarat, Haryana, H.P., Jharkhand, Karnataka, Kerala, M.P., Maharashtra, Orissa, Punjab, Rajasthan, T.N., Uttarakhand, U.P & West Bengal and 4 UTs: Chandigarh, Daman & Diu, Dadar & Nagar Haveli & Pondicherry.
02.01.2013 As per MoPNG Gazette Notification No. G.S.R. 4(E). dated 02.01.2013, Oil Marketing Companies shall sell Ethanol-blended–petrol with percentage of Ethanol up to ten per cent and as per the Bureau of Indian Standard Specification to achieve five per cent Ethanol blending across the country as a whole.
10.12.2014 Delivered price of Ethanol increased from ₹ 48.50 to ₹ 49.50 per litre13.10.2016 For EBP Programme Ethanol price fixed at Rs.39 per litre.
MS(BS-IV) &HSD (BS IV)
01.04.2010 Delhi & NCR, Mumbai, Kolkata, Chennai, Bengaluru, Hyderabad, Kanpur, Agra, Pune, Surat, Ahmedabad, Lucknow, Sholapur
01.01.2012 Puducherry, Mathura01.02.2012 Jamnagar, Vapi01.03.2012 Ankleshwar, Hissar , Bharatpur01.07.2012 Silvasa, Daman, Diu01.10.2012 Aligarh, Rae Bareilly, Unnao01.03.2013 Valsad, Karnal, Kurukshetra , Yamuna Nagar01.07.2013 Nizamabad, Medak, Mehboobnagar01.01.2014 Mahabaleshwar, Ahmednagar, Hindaun, Dholpur, Kosi Kalan, Vrindavan15.3.2015 Lonawala, Palgarh, Dahanu, Talasari, Boisar, Panchgani, Mahad, Nagothana, Indapur, Vizag, Kochi,
Thiruvananthapuram, Kavaratti, Nagr, Dig, Nadbai, Bhiwani, Jind, Mahendragarh, Hansi, Charki Dadri, Narnaul, Kiruli and Fatehpur Sikri
1.4.2015 The whole of Northern India covering Jammu & Kashmir, (except Leh/Kargil and 7 districts of J&K), Punjab, Haryana, Himachal Pradesh, Uttarakhand, Chandigarh, Delhi and the bordering districts in Rajasthan and Western Uttar Pradesh. The relevant districts of Rajasthan are Bharatpur, Alwar, Hanumangarh and Sriganganagar. The districts of West Uttar Pradesh covered are Saharanpur, Muzaffarnagar, Baghpat, Meerut, Bijnor, Ghaziabad, Gautam Buddh Nagar, Bulandshar, Jyotiba Phule Nagar, Rampur, Moradabad, Aligarh, Budaun, Bareilly, Mathura, Mahamaya Nagar, Etah, Agra, Ferozabad, Etawah and Mainpuri.
15.4.2015 7 additional districts of Uttar Pradesh (Pilibhit, Shamli, Sambhal, Farrukhabad, Kannauj, Auraiya and Kasganj)
1.5.2015 7 districts of J&K (Pulwama, Baramullah, Badgam, Srinagar, Kudwara, Bandipora and Ganderbal)1.9.2015 2 additional districts of J&K (Leh and Kargil)1.4.2016 All of Goa, Kerala, Karnataka, Telangana, Odisha, and the Union Territories of Daman & Diu, Dadra-
Nagar-Haveli and Andaman & Nicobar Islands. 1.4.2016 Certain districts of Maharashtra (Mumbai, Thane, Pune and Palghar districts), Gujarat (Surat,
Valsad, Dangs, Tapi and Navsari districts) and highway corridor connecting Northern India and Western ports
1.4.2017 Entire country is covered with BS-IV auto fuels
MS (BS-III) & HSD (BS-III)
01.04.2010 Goa16.05.2010 Chhattisgarh, Andaman & Nicobar31.05.2010 Madhya Pradesh, Maharashtra16.05.2010 Andaman & Nicobar16.06.2010 Punjab, Rajasthan, Chandigarh, Orissa, Sikkim, West Bengal, Haryana, Uttarakhand, Himachal
Pradesh, Gujarat, UTs of Dadar & Nagar Haveli and Daman & Diu.30.06.2010 Western UP, Andhra Pradesh, Tamil Nadu, Puducherry, Jammu & Kashmir (other than Leh &
Kargil)16.07.2010 Leh & Kargil16.09.2010 Eastern UP, Bihar & Jharkhand31.07.2010 Karnataka16.09.2010 Kerala, including, UT of Lakshadweep & Puducherry area fed Ex- Kerala.22.09.2010 Arunachal Pradesh, Assam, Manipur Meghalaya, Mizoram, Nagaland & Tripura.
Note: * :Vide Notification No. GSR-580(E) dated 20.09.2006, MoPNG decided to introduce Ethanol Blended Petrol(EBP) in 20 States and 4 UTs subject to commercial viability.
CHAP
TER
ICH
APTE
R II
CHAP
TER
IIICH
APTE
R IV
CHAP
TER
VCH
APTE
R VI
CHAP
TER
VII
CHAP
TER
VIII
CHAP
TER
IXCH
APTE
R X
CHAP
TER
XIAP
PEN
DIX
65
CHAPTER ICHAPTER II
CHAPTER IIICHAPTER IV
CHAPTER VCHAPTER VI
CHAPTER VIICHAPTER VIII
CHAPTER IXCHAPTER X
CHAPTER XIAPPEN
DIX
66
Chapter Highlights
• Wholesale Price Index (WPI) inflation for all commodities increased by around 2% in 2016-17 as compared to 2015-16. Increase in crude oil WPI stood at 5% whereas the same registered a negative growth of 1% and 21% for petroleum products and natural gas respectively.
• Inflation was observed in Kerosene (7%), High Speed Diesel Oil (1%), Furnace Oil (7%) and Petroleum Coke (19%) whereas deflation was observed in LPG (6%), Petrol (4%), Naphtha (1%), Lube Oil (3%) and Bitumen (12%).
• The international crude oil price (Indian basket) dipped to 28.08 US $/bbl in January, 2016 and started increasing thereafter ad reached at 54.86 US $/bbl in February, 2017. However, the price remained below US $55/bbl during 2016-17.
• Share of petroleum sector in total subsidies has declined from 11.36% (₹ 29999 crore (actual) in 2015-16 to 10.57 % [₹ 27532 crore (RE)] in 2016-17 and is budgeted at 9.18% [₹ 25000 crore (B.E)] in 2017-18.
• Total under recovery on sensitive petroleum products during 2016-17 at ₹ 27570 crore, which is 18% less than the under recovery in 2015-16 (₹ 27570 crore).
• Under recovery of CPSEs on PDS SKO reduced by 33.83% from ₹ 11496 crore in 2015-16 to ₹7606 crore in 2016-17 whereas that on Domestic LPG reduced by 5.86% from ₹16074 crore in 2015-16 to ₹15132 crore in 2016-17.
CHAP
TER
ICH
APTE
R II
CHAP
TER
IIICH
APTE
R IV
CHAP
TER
VCH
APTE
R VI
CHAP
TER
VII
CHAP
TER
VIII
CHAP
TER
IXCH
APTE
R X
CHAP
TER
XIAP
PEN
DIX
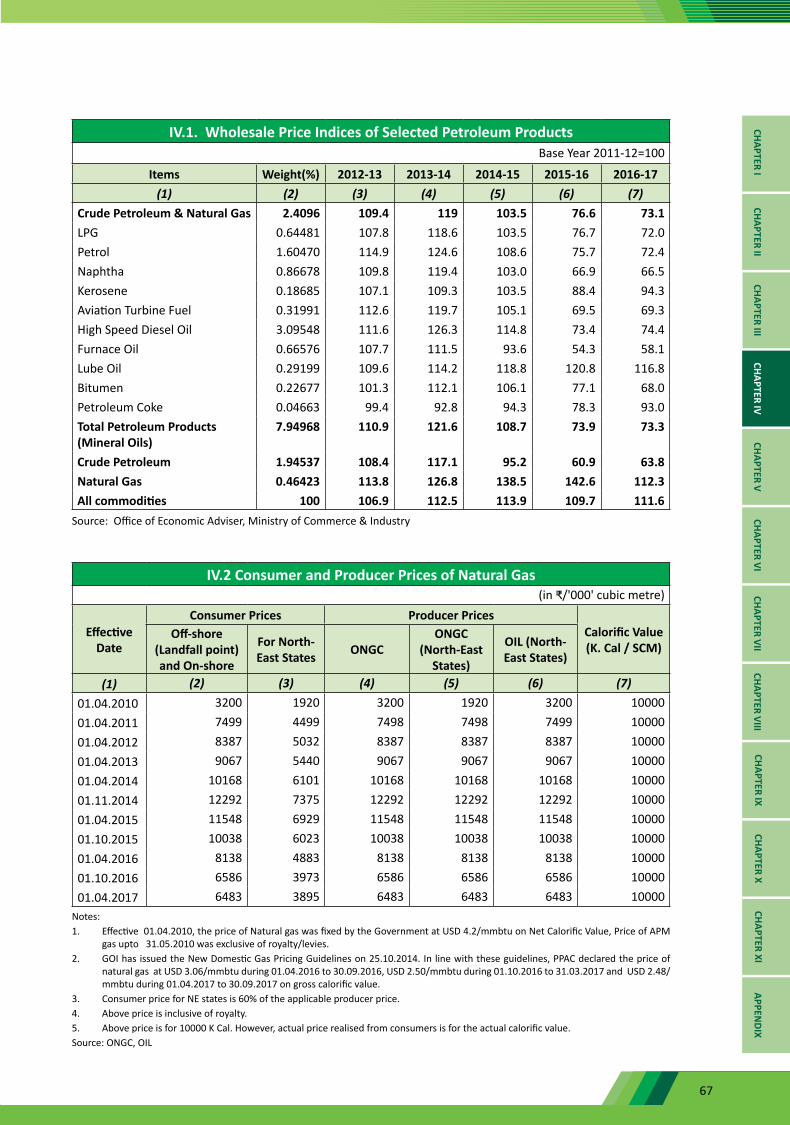
67
IV.1. Wholesale Price Indices of Selected Petroleum ProductsBase Year 2011-12=100
Items Weight(%) 2012-13 2013-14 2014-15 2015-16 2016-17(1) (2) (3) (4) (5) (6) (7)
Crude Petroleum & Natural Gas 2.4096 109.4 119 103.5 76.6 73.1LPG 0.64481 107.8 118.6 103.5 76.7 72.0 Petrol 1.60470 114.9 124.6 108.6 75.7 72.4 Naphtha 0.86678 109.8 119.4 103.0 66.9 66.5 Kerosene 0.18685 107.1 109.3 103.5 88.4 94.3 Aviation Turbine Fuel 0.31991 112.6 119.7 105.1 69.5 69.3 High Speed Diesel Oil 3.09548 111.6 126.3 114.8 73.4 74.4 Furnace Oil 0.66576 107.7 111.5 93.6 54.3 58.1 Lube Oil 0.29199 109.6 114.2 118.8 120.8 116.8 Bitumen 0.22677 101.3 112.1 106.1 77.1 68.0 Petroleum Coke 0.04663 99.4 92.8 94.3 78.3 93.0 Total Petroleum Products (Mineral Oils)
7.94968 110.9 121.6 108.7 73.9 73.3
Crude Petroleum 1.94537 108.4 117.1 95.2 60.9 63.8 Natural Gas 0.46423 113.8 126.8 138.5 142.6 112.3 All commodities 100 106.9 112.5 113.9 109.7 111.6
Source: Office of Economic Adviser, Ministry of Commerce & Industry
IV.2 Consumer and Producer Prices of Natural Gas(in ₹/'000' cubic metre)
Effective Date
Consumer Prices Producer PricesCalorific Value (K. Cal / SCM)
Off-shore (Landfall point) and On-shore
For North-East States ONGC
ONGC (North-East
States)
OIL (North-East States)
(1) (2) (3) (4) (5) (6) (7)01.04.2010 3200 1920 3200 1920 3200 1000001.04.2011 7499 4499 7498 7498 7499 1000001.04.2012 8387 5032 8387 8387 8387 1000001.04.2013 9067 5440 9067 9067 9067 1000001.04.2014 10168 6101 10168 10168 10168 1000001.11.2014 12292 7375 12292 12292 12292 1000001.04.2015 11548 6929 11548 11548 11548 1000001.10.2015 10038 6023 10038 10038 10038 1000001.04.2016 8138 4883 8138 8138 8138 1000001.10.2016 6586 3973 6586 6586 6586 1000001.04.2017 6483 3895 6483 6483 6483 10000
Notes:1. Effective 01.04.2010, the price of Natural gas was fixed by the Government at USD 4.2/mmbtu on Net Calorific Value, Price of APM
gas upto 31.05.2010 was exclusive of royalty/levies. 2. GOI has issued the New Domestic Gas Pricing Guidelines on 25.10.2014. In line with these guidelines, PPAC declared the price of
natural gas at USD 3.06/mmbtu during 01.04.2016 to 30.09.2016, USD 2.50/mmbtu during 01.10.2016 to 31.03.2017 and USD 2.48/mmbtu during 01.04.2017 to 30.09.2017 on gross calorific value.
3. Consumer price for NE states is 60% of the applicable producer price. 4. Above price is inclusive of royalty. 5. Above price is for 10000 K Cal. However, actual price realised from consumers is for the actual calorific value. Source: ONGC, OIL
CHAPTER ICHAPTER II
CHAPTER IIICHAPTER IV
CHAPTER VCHAPTER VI
CHAPTER VIICHAPTER VIII
CHAPTER IXCHAPTER X
CHAPTER XIAPPEN
DIX
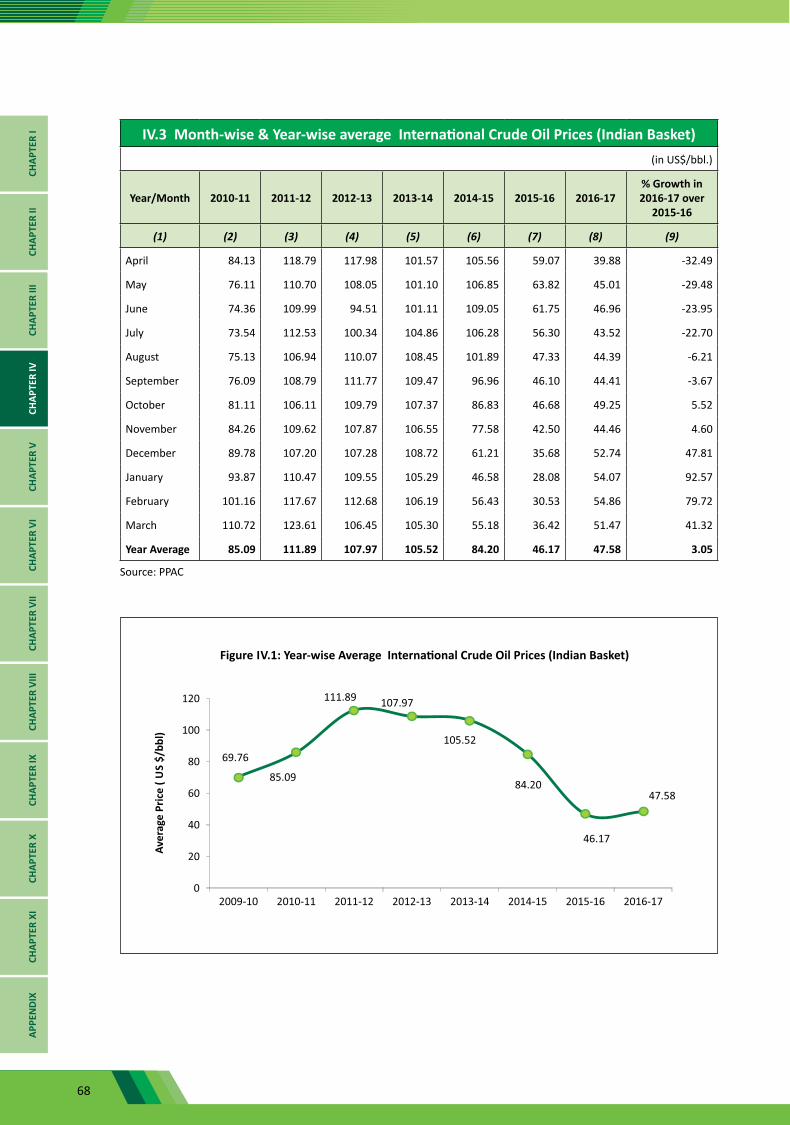
68
IV.3 Month-wise & Year-wise average International Crude Oil Prices (Indian Basket)(in US$/bbl.)
Year/Month 2010-11 2011-12 2012-13 2013-14 2014-15 2015-16 2016-17% Growth in 2016-17 over
2015-16
(1) (2) (3) (4) (5) (6) (7) (8) (9)
April 84.13 118.79 117.98 101.57 105.56 59.07 39.88 -32.49
May 76.11 110.70 108.05 101.10 106.85 63.82 45.01 -29.48
June 74.36 109.99 94.51 101.11 109.05 61.75 46.96 -23.95
July 73.54 112.53 100.34 104.86 106.28 56.30 43.52 -22.70
August 75.13 106.94 110.07 108.45 101.89 47.33 44.39 -6.21
September 76.09 108.79 111.77 109.47 96.96 46.10 44.41 -3.67
October 81.11 106.11 109.79 107.37 86.83 46.68 49.25 5.52
November 84.26 109.62 107.87 106.55 77.58 42.50 44.46 4.60
December 89.78 107.20 107.28 108.72 61.21 35.68 52.74 47.81
January 93.87 110.47 109.55 105.29 46.58 28.08 54.07 92.57
February 101.16 117.67 112.68 106.19 56.43 30.53 54.86 79.72
March 110.72 123.61 106.45 105.30 55.18 36.42 51.47 41.32
Year Average 85.09 111.89 107.97 105.52 84.20 46.17 47.58 3.05
Source: PPAC
CHAP
TER
ICH
APTE
R II
CHAP
TER
IIICH
APTE
R IV
CHAP
TER
VCH
APTE
R VI
CHAP
TER
VII
CHAP
TER
VIII
CHAP
TER
IXCH
APTE
R X
CHAP
TER
XIAP
PEN
DIX
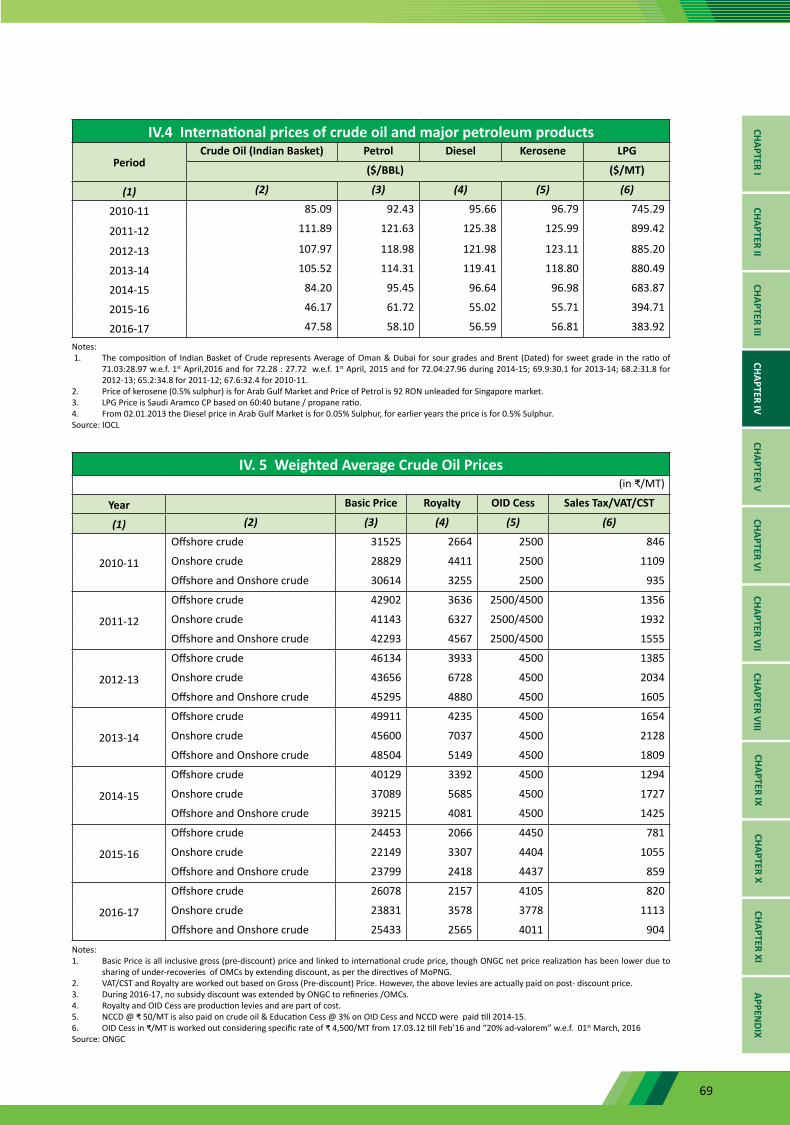
69
IV.4 International prices of crude oil and major petroleum products
PeriodCrude Oil (Indian Basket) Petrol Diesel Kerosene LPG
($/BBL) ($/MT)
(1) (2) (3) (4) (5) (6)
2010-11 85.09 92.43 95.66 96.79 745.29
2011-12 111.89 121.63 125.38 125.99 899.42
2012-13 107.97 118.98 121.98 123.11 885.20
2013-14 105.52 114.31 119.41 118.80 880.49
2014-15 84.20 95.45 96.64 96.98 683.87
2015-16 46.17 61.72 55.02 55.71 394.71
2016-17 47.58 58.10 56.59 56.81 383.92
Notes: 1. The composition of Indian Basket of Crude represents Average of Oman & Dubai for sour grades and Brent (Dated) for sweet grade in the ratio of
71.03:28.97 w.e.f. 1st April,2016 and for 72.28 : 27.72 w.e.f. 1st April, 2015 and for 72.04:27.96 during 2014-15; 69.9:30.1 for 2013-14; 68.2:31.8 for 2012-13; 65.2:34.8 for 2011-12; 67.6:32.4 for 2010-11.
2. Price of kerosene (0.5% sulphur) is for Arab Gulf Market and Price of Petrol is 92 RON unleaded for Singapore market.3. LPG Price is Saudi Aramco CP based on 60:40 butane / propane ratio.4. From 02.01.2013 the Diesel price in Arab Gulf Market is for 0.05% Sulphur, for earlier years the price is for 0.5% Sulphur. Source: IOCL
IV. 5 Weighted Average Crude Oil Prices(in ₹/MT)
Year Basic Price Royalty OID Cess Sales Tax/VAT/CST
(1) (2) (3) (4) (5) (6)
2010-11
Offshore crude 31525 2664 2500 846
Onshore crude 28829 4411 2500 1109
Offshore and Onshore crude 30614 3255 2500 935
2011-12
Offshore crude 42902 3636 2500/4500 1356
Onshore crude 41143 6327 2500/4500 1932
Offshore and Onshore crude 42293 4567 2500/4500 1555
2012-13
Offshore crude 46134 3933 4500 1385
Onshore crude 43656 6728 4500 2034
Offshore and Onshore crude 45295 4880 4500 1605
2013-14
Offshore crude 49911 4235 4500 1654
Onshore crude 45600 7037 4500 2128
Offshore and Onshore crude 48504 5149 4500 1809
2014-15
Offshore crude 40129 3392 4500 1294
Onshore crude 37089 5685 4500 1727
Offshore and Onshore crude 39215 4081 4500 1425
2015-16
Offshore crude 24453 2066 4450 781
Onshore crude 22149 3307 4404 1055
Offshore and Onshore crude 23799 2418 4437 859
2016-17
Offshore crude 26078 2157 4105 820
Onshore crude 23831 3578 3778 1113
Offshore and Onshore crude 25433 2565 4011 904
Notes:1. Basic Price is all inclusive gross (pre-discount) price and linked to international crude price, though ONGC net price realization has been lower due to
sharing of under-recoveries of OMCs by extending discount, as per the directives of MoPNG.2. VAT/CST and Royalty are worked out based on Gross (Pre-discount) Price. However, the above levies are actually paid on post- discount price.3. During 2016-17, no subsidy discount was extended by ONGC to refineries /OMCs.4. Royalty and OID Cess are production levies and are part of cost.5. NCCD @ ₹ 50/MT is also paid on crude oil & Education Cess @ 3% on OID Cess and NCCD were paid till 2014-15.6. OID Cess in ₹/MT is worked out considering specific rate of ₹ 4,500/MT from 17.03.12 till Feb’16 and “20% ad-valorem” w.e.f. 01st March, 2016Source: ONGC
CHAPTER ICHAPTER II
CHAPTER IIICHAPTER IV
CHAPTER VCHAPTER VI
CHAPTER VIICHAPTER VIII
CHAPTER IXCHAPTER X
CHAPTER XIAPPEN
DIX
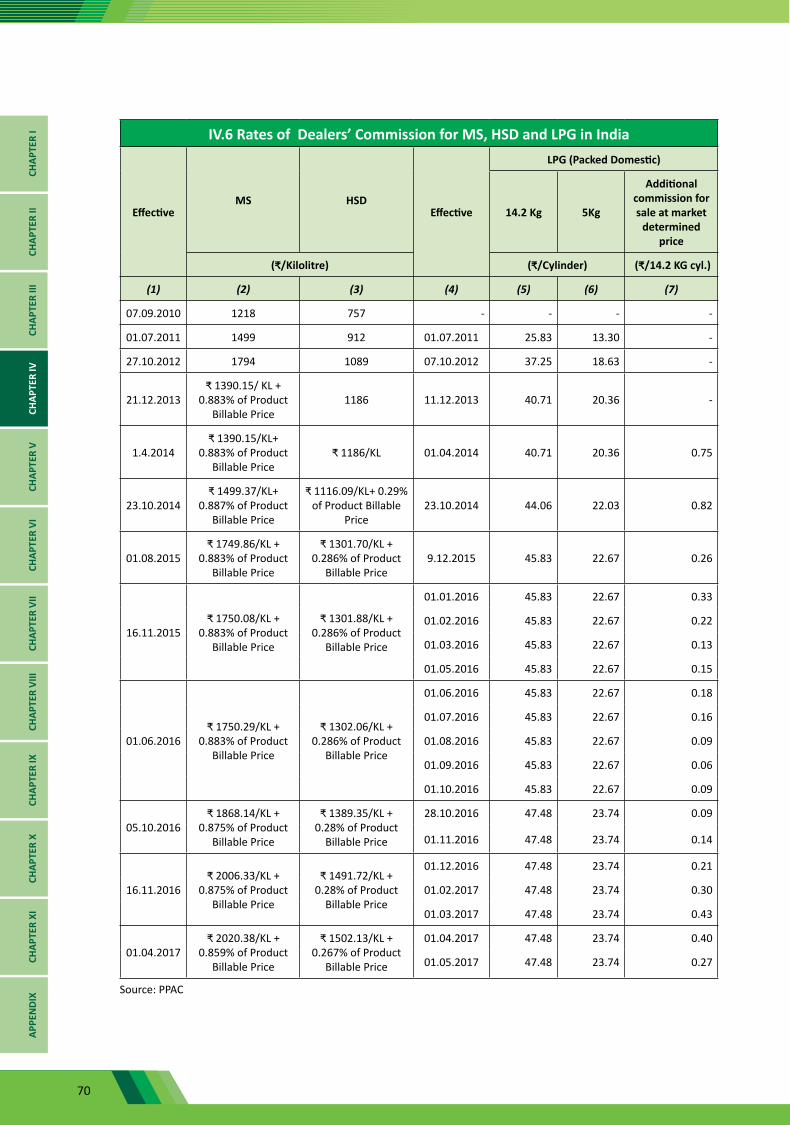
70
IV.6 Rates of Dealers’ Commission for MS, HSD and LPG in India
EffectiveMS HSD
Effective
LPG (Packed Domestic)
14.2 Kg 5Kg
Additional commission for sale at market
determined price
(₹/Kilolitre) (₹/Cylinder) (₹/14.2 KG cyl.)
(1) (2) (3) (4) (5) (6) (7)
07.09.2010 1218 757 - - - -
01.07.2011 1499 912 01.07.2011 25.83 13.30 -
27.10.2012 1794 1089 07.10.2012 37.25 18.63 -
21.12.2013₹ 1390.15/ KL +
0.883% of Product Billable Price
1186 11.12.2013 40.71 20.36 -
1.4.2014₹ 1390.15/KL+
0.883% of Product Billable Price
₹ 1186/KL 01.04.2014 40.71 20.36 0.75
23.10.2014₹ 1499.37/KL+
0.887% of Product Billable Price
₹ 1116.09/KL+ 0.29% of Product Billable
Price23.10.2014 44.06 22.03 0.82
01.08.2015₹ 1749.86/KL +
0.883% of Product Billable Price
₹ 1301.70/KL + 0.286% of Product
Billable Price9.12.2015 45.83 22.67 0.26
16.11.2015₹ 1750.08/KL +
0.883% of Product Billable Price
₹ 1301.88/KL + 0.286% of Product
Billable Price
01.01.2016 45.83 22.67 0.33
01.02.2016 45.83 22.67 0.22
01.03.2016 45.83 22.67 0.13
01.05.2016 45.83 22.67 0.15
01.06.2016₹ 1750.29/KL +
0.883% of Product Billable Price
₹ 1302.06/KL + 0.286% of Product
Billable Price
01.06.2016 45.83 22.67 0.18
01.07.2016 45.83 22.67 0.16
01.08.2016 45.83 22.67 0.09
01.09.2016 45.83 22.67 0.06
01.10.2016 45.83 22.67 0.09
05.10.2016₹ 1868.14/KL +
0.875% of Product Billable Price
₹ 1389.35/KL + 0.28% of Product
Billable Price
28.10.2016 47.48 23.74 0.09
01.11.2016 47.48 23.74 0.14
16.11.2016₹ 2006.33/KL +
0.875% of Product Billable Price
₹ 1491.72/KL + 0.28% of Product
Billable Price
01.12.2016 47.48 23.74 0.21
01.02.2017 47.48 23.74 0.30
01.03.2017 47.48 23.74 0.43
01.04.2017₹ 2020.38/KL +
0.859% of Product Billable Price
₹ 1502.13/KL + 0.267% of Product
Billable Price
01.04.2017 47.48 23.74 0.40
01.05.2017 47.48 23.74 0.27
Source: PPAC
CHAP
TER
ICH
APTE
R II
CHAP
TER
IIICH
APTE
R IV
CHAP
TER
VCH
APTE
R VI
CHAP
TER
VII
CHAP
TER
VIII
CHAP
TER
IXCH
APTE
R X
CHAP
TER
XIAP
PEN
DIX
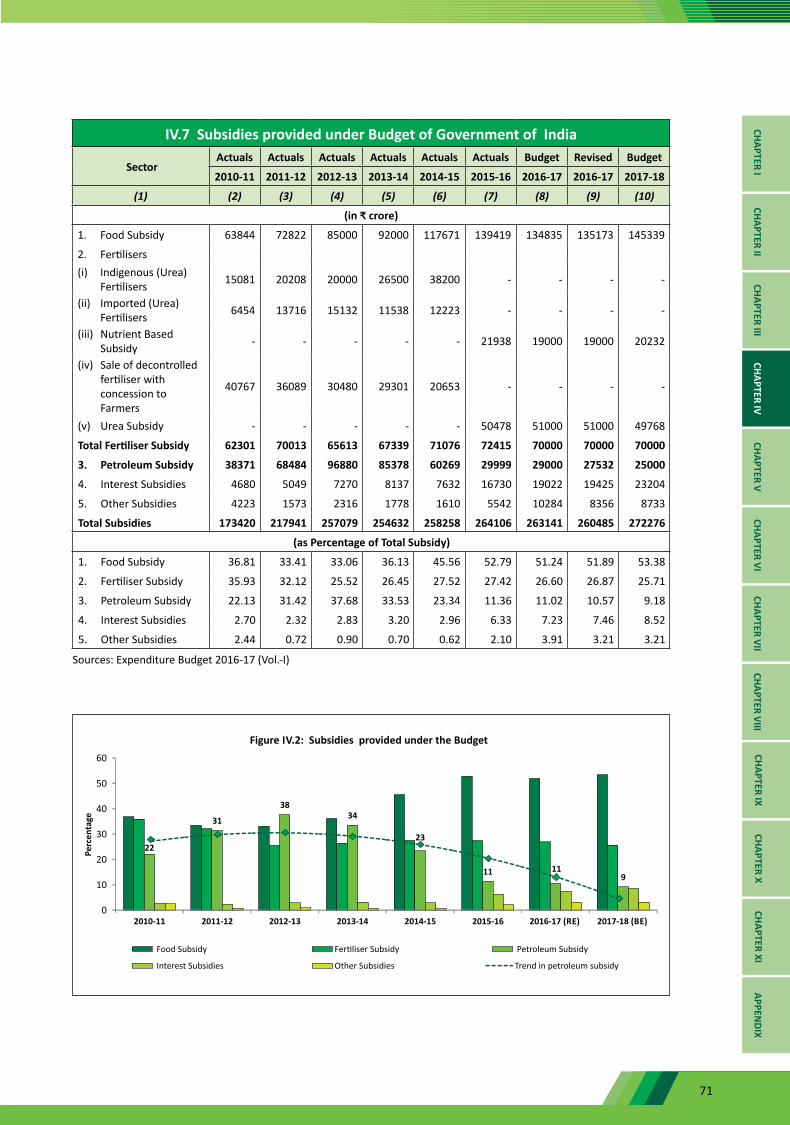
71
IV.7 Subsidies provided under Budget of Government of India
SectorActuals Actuals Actuals Actuals Actuals Actuals Budget Revised Budget
2010-11 2011-12 2012-13 2013-14 2014-15 2015-16 2016-17 2016-17 2017-18
(1) (2) (3) (4) (5) (6) (7) (8) (9) (10)
(in ₹ crore)
1. Food Subsidy 63844 72822 85000 92000 117671 139419 134835 135173 145339
2. Fertilisers (i) Indigenous (Urea)
Fertilisers 15081 20208 20000 26500 38200 - - - -
(ii) Imported (Urea) Fertilisers 6454 13716 15132 11538 12223 - - - -
(iii) Nutrient Based Subsidy - - - - - 21938 19000 19000 20232
(iv) Sale of decontrolled fertiliser with concession to Farmers
40767 36089 30480 29301 20653 - - - -
(v) Urea Subsidy - - - - - 50478 51000 51000 49768
Total Fertiliser Subsidy 62301 70013 65613 67339 71076 72415 70000 70000 70000
3. Petroleum Subsidy 38371 68484 96880 85378 60269 29999 29000 27532 25000
4. Interest Subsidies 4680 5049 7270 8137 7632 16730 19022 19425 23204
5. Other Subsidies 4223 1573 2316 1778 1610 5542 10284 8356 8733
Total Subsidies 173420 217941 257079 254632 258258 264106 263141 260485 272276
(as Percentage of Total Subsidy)
1. Food Subsidy 36.81 33.41 33.06 36.13 45.56 52.79 51.24 51.89 53.38
2. Fertiliser Subsidy 35.93 32.12 25.52 26.45 27.52 27.42 26.60 26.87 25.71
3. Petroleum Subsidy 22.13 31.42 37.68 33.53 23.34 11.36 11.02 10.57 9.18
4. Interest Subsidies 2.70 2.32 2.83 3.20 2.96 6.33 7.23 7.46 8.52
5. Other Subsidies 2.44 0.72 0.90 0.70 0.62 2.10 3.91 3.21 3.21
Sources: Expenditure Budget 2016-17 (Vol.-I)
CHAPTER ICHAPTER II
CHAPTER IIICHAPTER IV
CHAPTER VCHAPTER VI
CHAPTER VIICHAPTER VIII
CHAPTER IXCHAPTER X
CHAPTER XIAPPEN
DIX
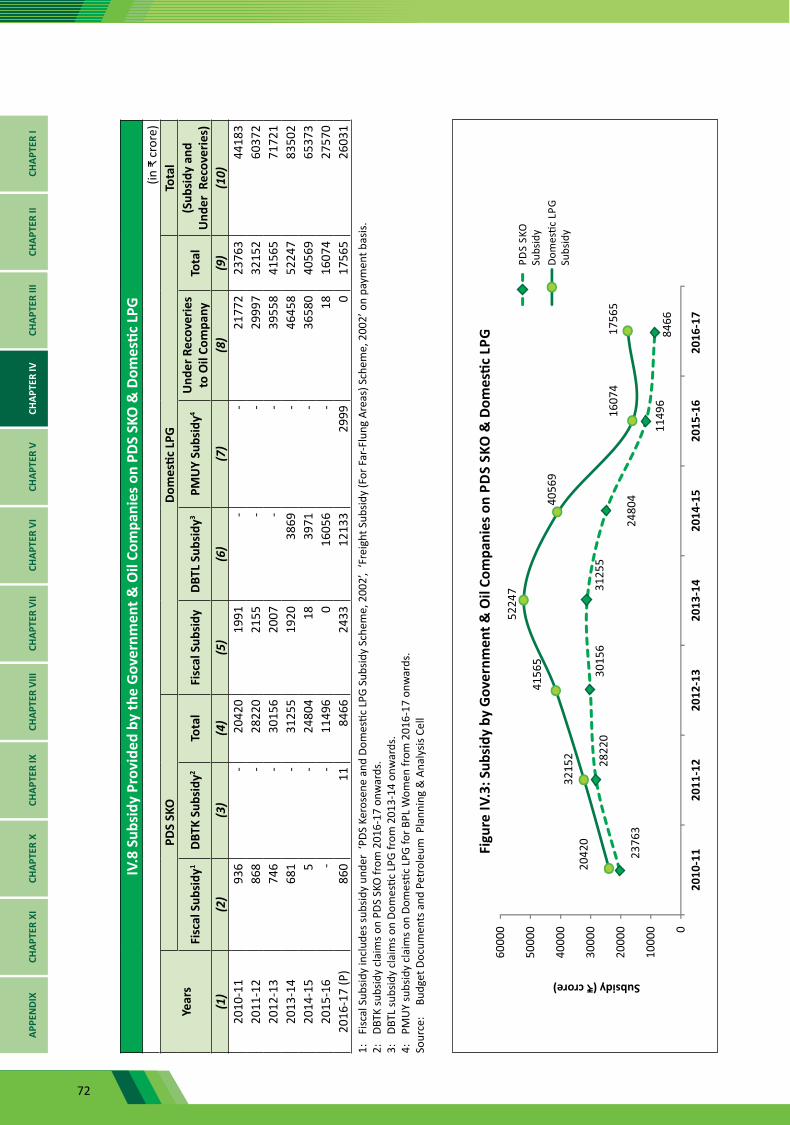
72
IV.8
Sub
sidy
Pro
vide
d by
the
Gov
ernm
ent &
Oil
Com
pani
es o
n PD
S SK
O &
Dom
estic
LPG
(in
₹ c
rore
)
Year
sPD
S SK
ODo
mes
tic L
PGTo
tal
Fisc
al S
ubsi
dy1
DBTK
Sub
sidy
2To
tal
Fisc
al S
ubsi
dyDB
TL S
ubsi
dy3
PMU
Y Su
bsid
y4U
nder
Rec
over
ies
to O
il Co
mpa
nyTo
tal
(Sub
sidy
and
U
nder
Rec
over
ies)
(1)
(2)
(3)
(4)
(5)
(6)
(7)
(8)
(9)
(10)
2010
-11
936
-20
420
1991
--
2177
223
763
4418
320
11-1
286
8-
2822
021
55-
-29
997
3215
260
372
2012
-13
746
-30
156
2007
--
3955
841
565
7172
120
13-1
468
1-
3125
519
2038
69-
4645
852
247
8350
220
14-1
55
-24
804
1839
71-
3658
040
569
6537
320
15-1
6-
-11
496
016
056
-18
1607
427
570
2016
-17
(P)
860
1184
6624
3312
133
2999
017
565
2603
11:
Fi
scal
Sub
sidy
incl
udes
subs
idy
unde
r ‘P
DS K
eros
ene
and
Dom
estic
LPG
Sub
sidy
Sche
me,
200
2’,
‘Fre
ight
Sub
sidy
(For
Far
-Flu
ng A
reas
) Sch
eme,
200
2’ o
n pa
ymen
t bas
is.2:
DB
TK su
bsid
y cl
aim
s on
PDS
SKO
from
201
6-17
onw
ards
.3:
DB
TL su
bsid
y cl
aim
s on
Dom
estic
LPG
from
201
3-14
onw
ards
.4:
PM
UY
subs
idy
clai
ms o
n Do
mes
tic L
PG fo
r BPL
Wom
en fr
om 2
016-
17 o
nwar
ds.
Sour
ce:
Budg
et D
ocum
ents
and
Pet
role
um P
lann
ing
& A
naly
sis C
ell
CHAP
TER
ICH
APTE
R II
CHAP
TER
IIICH
APTE
R IV
CHAP
TER
VCH
APTE
R VI
CHAP
TER
VII
CHAP
TER
VIII
CHAP
TER
IXCH
APTE
R X
CHAP
TER
XIAP
PEN
DIX
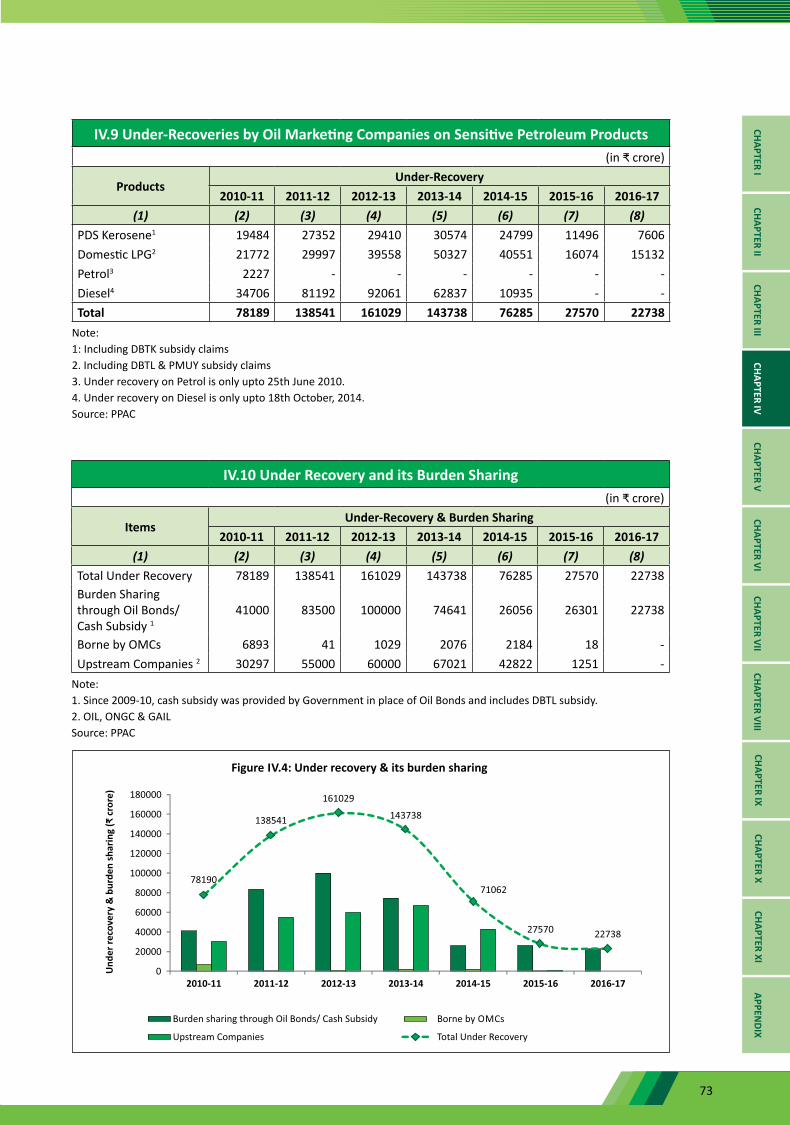
73
IV.9 Under-Recoveries by Oil Marketing Companies on Sensitive Petroleum Products(in ₹ crore)
ProductsUnder-Recovery
2010-11 2011-12 2012-13 2013-14 2014-15 2015-16 2016-17(1) (2) (3) (4) (5) (6) (7) (8)
PDS Kerosene1 19484 27352 29410 30574 24799 11496 7606Domestic LPG2 21772 29997 39558 50327 40551 16074 15132Petrol3 2227 - - - - - -Diesel4 34706 81192 92061 62837 10935 - -Total 78189 138541 161029 143738 76285 27570 22738
Note:1: Including DBTK subsidy claims2. Including DBTL & PMUY subsidy claims3. Under recovery on Petrol is only upto 25th June 2010.4. Under recovery on Diesel is only upto 18th October, 2014.Source: PPAC
IV.10 Under Recovery and its Burden Sharing(in ₹ crore)
ItemsUnder-Recovery & Burden Sharing
2010-11 2011-12 2012-13 2013-14 2014-15 2015-16 2016-17(1) (2) (3) (4) (5) (6) (7) (8)
Total Under Recovery 78189 138541 161029 143738 76285 27570 22738Burden Sharing through Oil Bonds/ Cash Subsidy 1
41000 83500 100000 74641 26056 26301 22738
Borne by OMCs 6893 41 1029 2076 2184 18 -Upstream Companies 2 30297 55000 60000 67021 42822 1251 -
Note:1. Since 2009-10, cash subsidy was provided by Government in place of Oil Bonds and includes DBTL subsidy.2. OIL, ONGC & GAILSource: PPAC
CHAPTER ICHAPTER II
CHAPTER IIICHAPTER IV
CHAPTER VCHAPTER VI
CHAPTER VIICHAPTER VIII
CHAPTER IXCHAPTER X
CHAPTER XIAPPEN
DIX
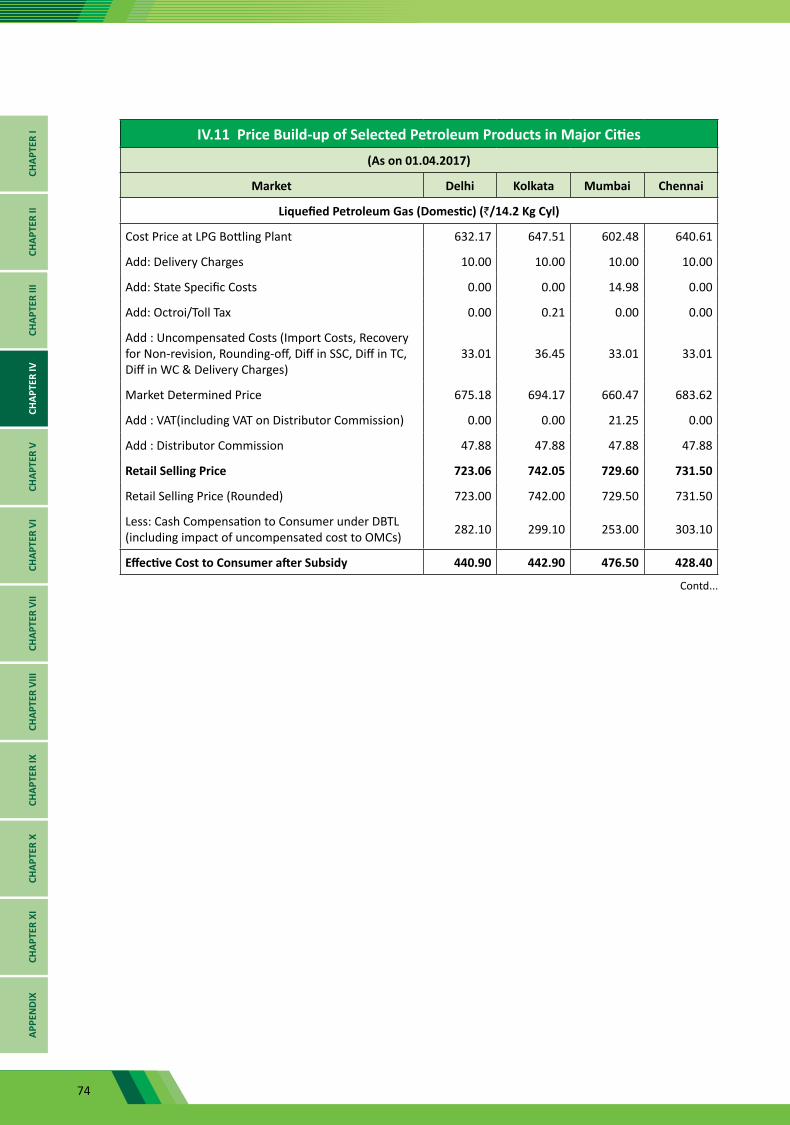
74
CHAP
TER
ICH
APTE
R II
CHAP
TER
IIICH
APTE
R IV
CHAP
TER
VCH
APTE
R VI
CHAP
TER
VII
CHAP
TER
VIII
CHAP
TER
IXCH
APTE
R X
CHAP
TER
XIAP
PEN
DIX
IV.11 Price Build-up of Selected Petroleum Products in Major Cities
(As on 01.04.2017)
Market Delhi Kolkata Mumbai Chennai
Liquefied Petroleum Gas (Domestic) (`/14.2 Kg Cyl)
Cost Price at LPG Bottling Plant 632.17 647.51 602.48 640.61
Add: Delivery Charges 10.00 10.00 10.00 10.00
Add: State Specific Costs 0.00 0.00 14.98 0.00
Add: Octroi/Toll Tax 0.00 0.21 0.00 0.00
Add : Uncompensated Costs (Import Costs, Recovery for Non-revision, Rounding-off, Diff in SSC, Diff in TC, Diff in WC & Delivery Charges)
33.01 36.45 33.01 33.01
Market Determined Price 675.18 694.17 660.47 683.62
Add : VAT(including VAT on Distributor Commission) 0.00 0.00 21.25 0.00
Add : Distributor Commission 47.88 47.88 47.88 47.88
Retail Selling Price 723.06 742.05 729.60 731.50
Retail Selling Price (Rounded) 723.00 742.00 729.50 731.50
Less: Cash Compensation to Consumer under DBTL (including impact of uncompensated cost to OMCs) 282.10 299.10 253.00 303.10
Effective Cost to Consumer after Subsidy 440.90 442.90 476.50 428.40
Contd...
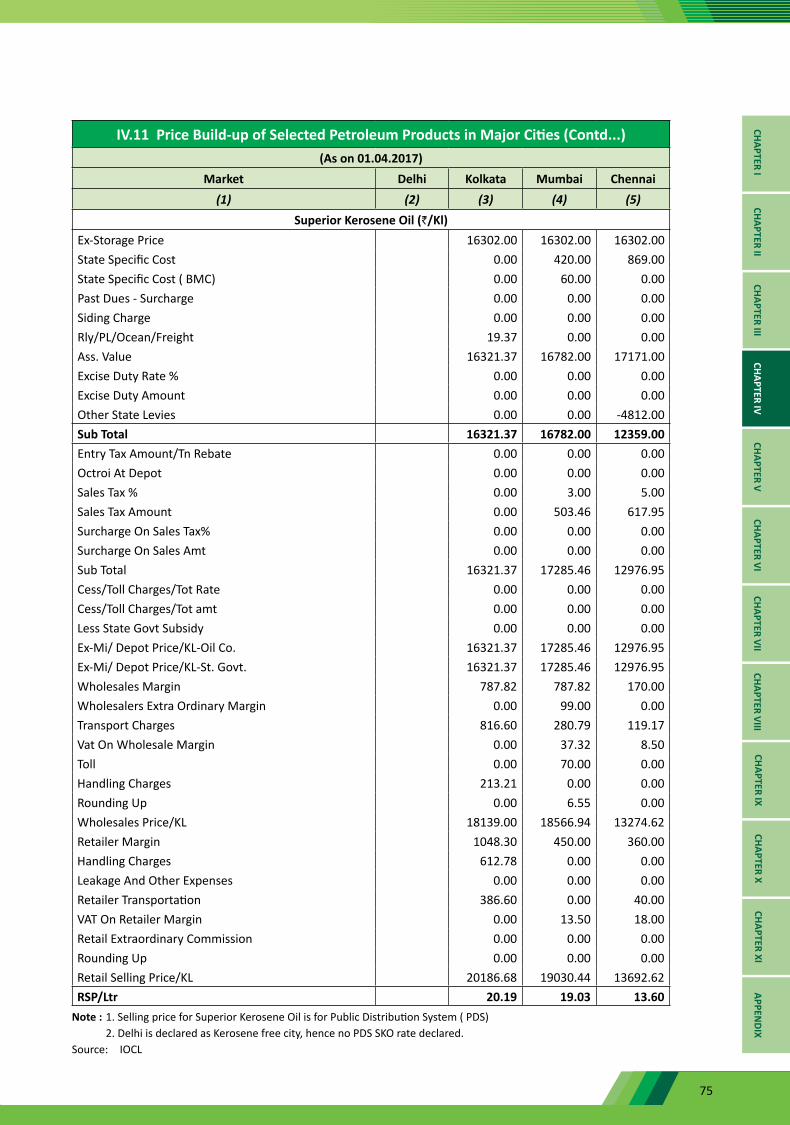
75
CHAPTER ICHAPTER II
CHAPTER IIICHAPTER IV
CHAPTER VCHAPTER VI
CHAPTER VIICHAPTER VIII
CHAPTER IXCHAPTER X
CHAPTER XIAPPEN
DIX
IV.11 Price Build-up of Selected Petroleum Products in Major Cities (Contd...)(As on 01.04.2017)
Market Delhi Kolkata Mumbai Chennai(1) (2) (3) (4) (5)
Superior Kerosene Oil (`/Kl)Ex-Storage Price 16302.00 16302.00 16302.00 State Specific Cost 0.00 420.00 869.00State Specific Cost ( BMC) 0.00 60.00 0.00Past Dues - Surcharge 0.00 0.00 0.00Siding Charge 0.00 0.00 0.00Rly/PL/Ocean/Freight 19.37 0.00 0.00Ass. Value 16321.37 16782.00 17171.00 Excise Duty Rate % 0.00 0.00 0.00Excise Duty Amount 0.00 0.00 0.00Other State Levies 0.00 0.00 -4812.00 Sub Total 16321.37 16782.00 12359.00 Entry Tax Amount/Tn Rebate 0.00 0.00 0.00Octroi At Depot 0.00 0.00 0.00Sales Tax % 0.00 3.00 5.00Sales Tax Amount 0.00 503.46 617.95Surcharge On Sales Tax% 0.00 0.00 0.00Surcharge On Sales Amt 0.00 0.00 0.00Sub Total 16321.37 17285.46 12976.95 Cess/Toll Charges/Tot Rate 0.00 0.00 0.00Cess/Toll Charges/Tot amt 0.00 0.00 0.00Less State Govt Subsidy 0.00 0.00 0.00Ex-Mi/ Depot Price/KL-Oil Co. 16321.37 17285.46 12976.95 Ex-Mi/ Depot Price/KL-St. Govt. 16321.37 17285.46 12976.95 Wholesales Margin 787.82 787.82 170.00Wholesalers Extra Ordinary Margin 0.00 99.00 0.00Transport Charges 816.60 280.79 119.17Vat On Wholesale Margin 0.00 37.32 8.50Toll 0.00 70.00 0.00Handling Charges 213.21 0.00 0.00Rounding Up 0.00 6.55 0.00Wholesales Price/KL 18139.00 18566.94 13274.62 Retailer Margin 1048.30 450.00 360.00 Handling Charges 612.78 0.00 0.00Leakage And Other Expenses 0.00 0.00 0.00Retailer Transportation 386.60 0.00 40.00VAT On Retailer Margin 0.00 13.50 18.00Retail Extraordinary Commission 0.00 0.00 0.00Rounding Up 0.00 0.00 0.00Retail Selling Price/KL 20186.68 19030.44 13692.62 RSP/Ltr 20.19 19.03 13.60
Note : 1. Selling price for Superior Kerosene Oil is for Public Distribution System ( PDS) 2. Delhi is declared as Kerosene free city, hence no PDS SKO rate declared.Source: IOCL
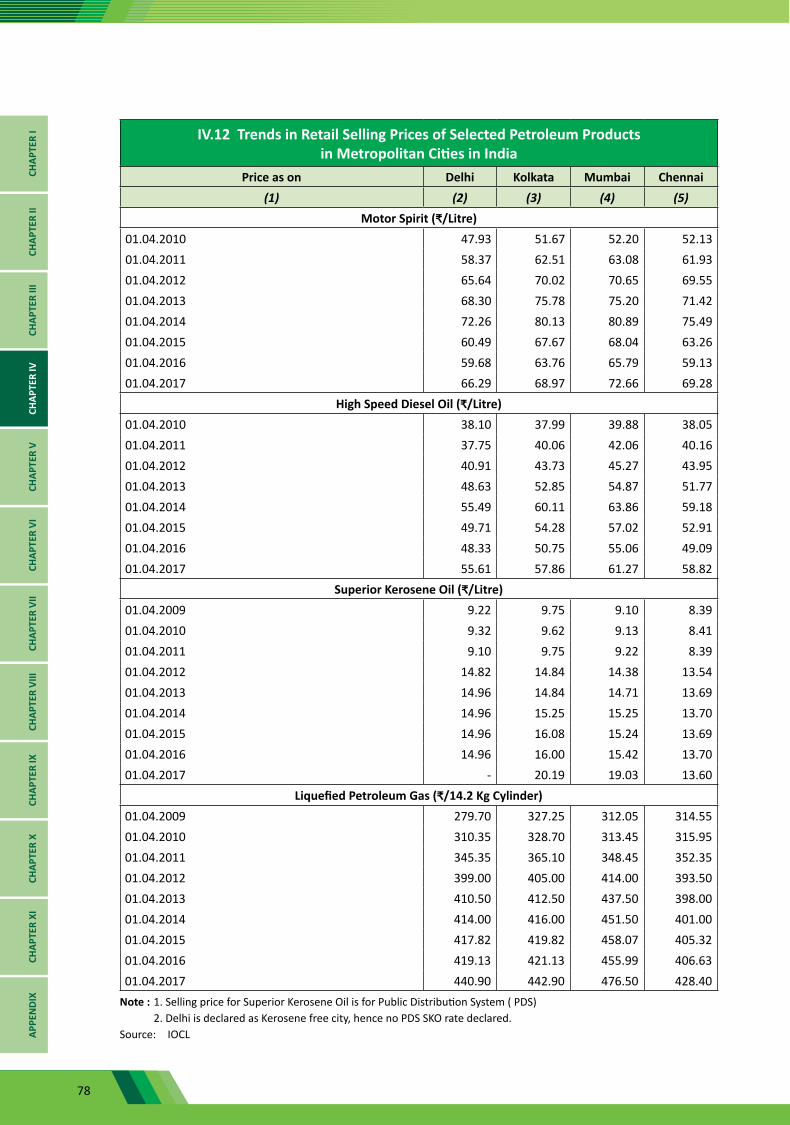
78
IV.12 Trends in Retail Selling Prices of Selected Petroleum Products in Metropolitan Cities in India
Price as on Delhi Kolkata Mumbai Chennai(1) (2) (3) (4) (5)
Motor Spirit (₹/Litre)01.04.2010 47.93 51.67 52.20 52.1301.04.2011 58.37 62.51 63.08 61.9301.04.2012 65.64 70.02 70.65 69.5501.04.2013 68.30 75.78 75.20 71.4201.04.2014 72.26 80.13 80.89 75.4901.04.2015 60.49 67.67 68.04 63.2601.04.2016 59.68 63.76 65.79 59.1301.04.2017 66.29 68.97 72.66 69.28
High Speed Diesel Oil (₹/Litre)01.04.2010 38.10 37.99 39.88 38.0501.04.2011 37.75 40.06 42.06 40.1601.04.2012 40.91 43.73 45.27 43.9501.04.2013 48.63 52.85 54.87 51.7701.04.2014 55.49 60.11 63.86 59.1801.04.2015 49.71 54.28 57.02 52.9101.04.2016 48.33 50.75 55.06 49.0901.04.2017 55.61 57.86 61.27 58.82
Superior Kerosene Oil (₹/Litre)01.04.2009 9.22 9.75 9.10 8.3901.04.2010 9.32 9.62 9.13 8.4101.04.2011 9.10 9.75 9.22 8.3901.04.2012 14.82 14.84 14.38 13.5401.04.2013 14.96 14.84 14.71 13.6901.04.2014 14.96 15.25 15.25 13.7001.04.2015 14.96 16.08 15.24 13.6901.04.2016 14.96 16.00 15.42 13.7001.04.2017 - 20.19 19.03 13.60
Liquefied Petroleum Gas (₹/14.2 Kg Cylinder)01.04.2009 279.70 327.25 312.05 314.5501.04.2010 310.35 328.70 313.45 315.9501.04.2011 345.35 365.10 348.45 352.3501.04.2012 399.00 405.00 414.00 393.5001.04.2013 410.50 412.50 437.50 398.0001.04.2014 414.00 416.00 451.50 401.0001.04.2015 417.82 419.82 458.07 405.3201.04.2016 419.13 421.13 455.99 406.6301.04.2017 440.90 442.90 476.50 428.40
Note : 1. Selling price for Superior Kerosene Oil is for Public Distribution System ( PDS) 2. Delhi is declared as Kerosene free city, hence no PDS SKO rate declared. Source: IOCL
CHAP
TER
ICH
APTE
R II
CHAP
TER
IIICH
APTE
R IV
CHAP
TER
VCH
APTE
R VI
CHAP
TER
VII
CHAP
TER
VIII
CHAP
TER
IXCH
APTE
R X
CHAP
TER
XIAP
PEN
DIX
79
CHAPTER ICHAPTER II
CHAPTER IIICHAPTER IV
CHAPTER VCHAPTER VI
CHAPTER VIICHAPTER VIII
CHAPTER IXCHAPTER X
CHAPTER XIAPPEN
DIX
80
Chapter Highlights
• Total consumption of petroleum products in the country during 2016-17 was 193.7 million metric tonnes (MMT) which marked a growth of 4.9% over the consumption of 184.7 MMT during 2015-16.
• Diesel (LDO+HSD) accounted for the highest consumption share (39%) followed by Petrol/Motor Spirit (12%), Petroleum Coke (12%), LPG (11%), Naphtha (7%) and Kerosene (3%).
• The share of public and private sector consumption in 2016-17 stood at 78% and 22% respectively as against 80% and 20% respectively in previous year.
• Highest consumption of LPG in 2016-17 was in domestic distribution sector (88%), naphtha in petrochemical sector (78%), kerosene mainly in domestic PDS (96%) and diesel in reseller/retail sector (86%).
• Highest market share in 2016-17 was captured by IOCL (40%) followed by BPCL (19%) and HPCL (18%). Market share of private companies stood at 22%.
CHAP
TER
ICH
APTE
R II
CHAP
TER
IIICH
APTE
R IV
CHAP
TER
VCH
APTE
R VI
CHAP
TER
VII
CHAP
TER
VIII
CHAP
TER
IXCH
APTE
R X
CHAP
TER
XIAP
PEN
DIX
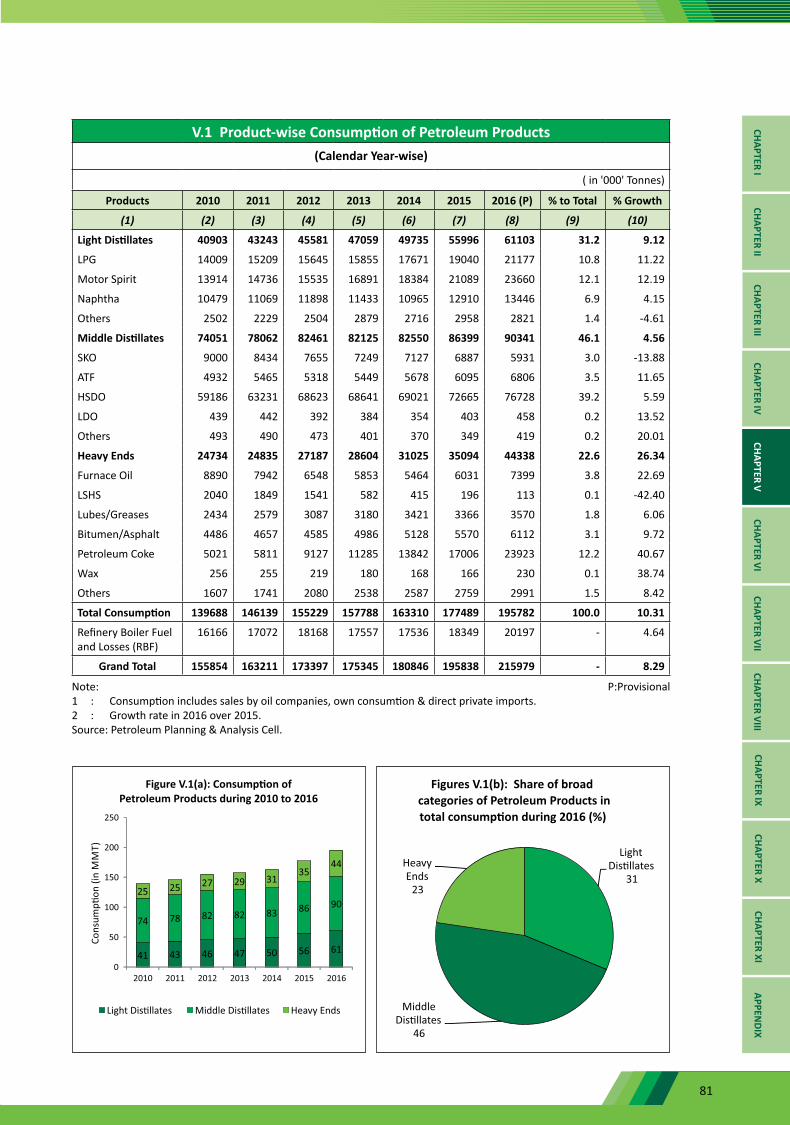
81
V.1 Product-wise Consumption of Petroleum Products(Calendar Year-wise)
( in '000' Tonnes)
Products 2010 2011 2012 2013 2014 2015 2016 (P) % to Total % Growth
(1) (2) (3) (4) (5) (6) (7) (8) (9) (10)
Light Distillates 40903 43243 45581 47059 49735 55996 61103 31.2 9.12
LPG 14009 15209 15645 15855 17671 19040 21177 10.8 11.22
Motor Spirit 13914 14736 15535 16891 18384 21089 23660 12.1 12.19
Naphtha 10479 11069 11898 11433 10965 12910 13446 6.9 4.15
Others 2502 2229 2504 2879 2716 2958 2821 1.4 -4.61
Middle Distillates 74051 78062 82461 82125 82550 86399 90341 46.1 4.56
SKO 9000 8434 7655 7249 7127 6887 5931 3.0 -13.88
ATF 4932 5465 5318 5449 5678 6095 6806 3.5 11.65
HSDO 59186 63231 68623 68641 69021 72665 76728 39.2 5.59
LDO 439 442 392 384 354 403 458 0.2 13.52
Others 493 490 473 401 370 349 419 0.2 20.01
Heavy Ends 24734 24835 27187 28604 31025 35094 44338 22.6 26.34
Furnace Oil 8890 7942 6548 5853 5464 6031 7399 3.8 22.69
LSHS 2040 1849 1541 582 415 196 113 0.1 -42.40
Lubes/Greases 2434 2579 3087 3180 3421 3366 3570 1.8 6.06
Bitumen/Asphalt 4486 4657 4585 4986 5128 5570 6112 3.1 9.72
Petroleum Coke 5021 5811 9127 11285 13842 17006 23923 12.2 40.67
Wax 256 255 219 180 168 166 230 0.1 38.74
Others 1607 1741 2080 2538 2587 2759 2991 1.5 8.42
Total Consumption 139688 146139 155229 157788 163310 177489 195782 100.0 10.31
Refinery Boiler Fuel and Losses (RBF)
16166 17072 18168 17557 17536 18349 20197 - 4.64
Grand Total 155854 163211 173397 175345 180846 195838 215979 - 8.29
Note: P:Provisional1 : Consumption includes sales by oil companies, own consumtion & direct private imports. 2 : Growth rate in 2016 over 2015. Source: Petroleum Planning & Analysis Cell.
CHAPTER ICHAPTER II
CHAPTER IIICHAPTER IV
CHAPTER VCHAPTER VI
CHAPTER VIICHAPTER VIII
CHAPTER IXCHAPTER X
CHAPTER XIAPPEN
DIX
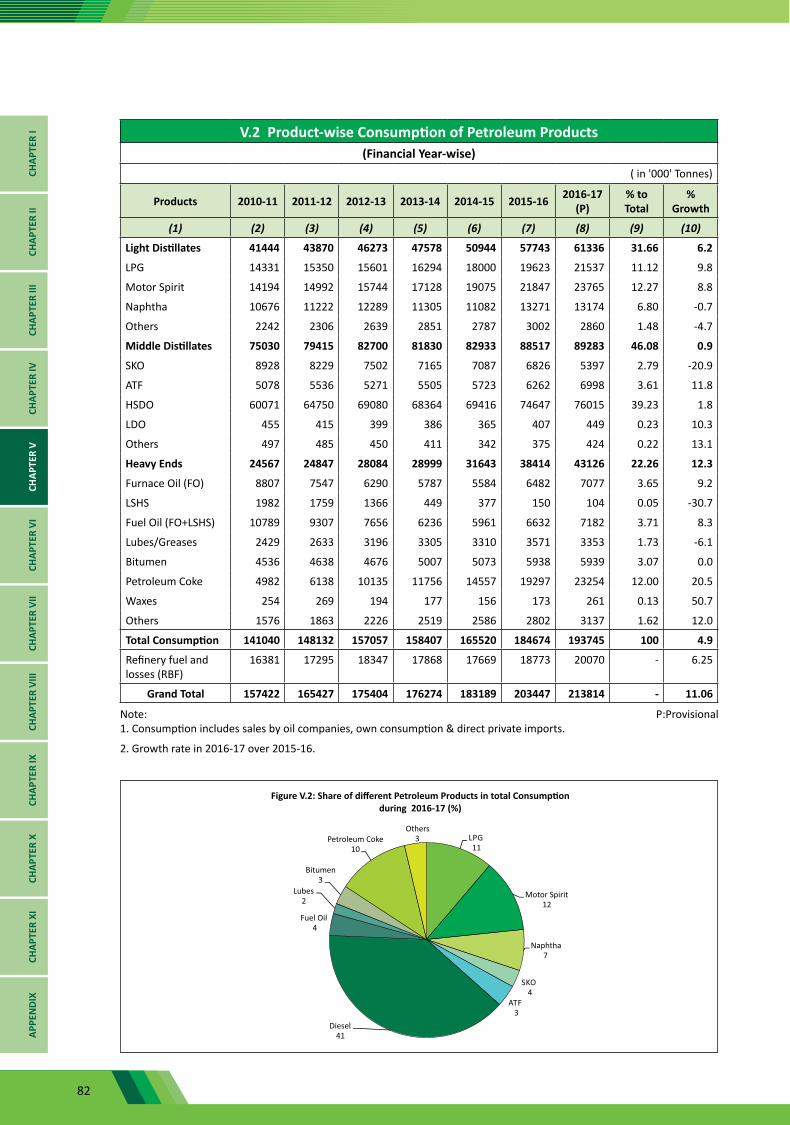
82
V.2 Product-wise Consumption of Petroleum Products(Financial Year-wise)
( in '000' Tonnes)
Products 2010-11 2011-12 2012-13 2013-14 2014-15 2015-16 2016-17 (P)
% to Total
% Growth
(1) (2) (3) (4) (5) (6) (7) (8) (9) (10)
Light Distillates 41444 43870 46273 47578 50944 57743 61336 31.66 6.2
LPG 14331 15350 15601 16294 18000 19623 21537 11.12 9.8
Motor Spirit 14194 14992 15744 17128 19075 21847 23765 12.27 8.8
Naphtha 10676 11222 12289 11305 11082 13271 13174 6.80 -0.7
Others 2242 2306 2639 2851 2787 3002 2860 1.48 -4.7
Middle Distillates 75030 79415 82700 81830 82933 88517 89283 46.08 0.9
SKO 8928 8229 7502 7165 7087 6826 5397 2.79 -20.9
ATF 5078 5536 5271 5505 5723 6262 6998 3.61 11.8
HSDO 60071 64750 69080 68364 69416 74647 76015 39.23 1.8
LDO 455 415 399 386 365 407 449 0.23 10.3
Others 497 485 450 411 342 375 424 0.22 13.1
Heavy Ends 24567 24847 28084 28999 31643 38414 43126 22.26 12.3
Furnace Oil (FO) 8807 7547 6290 5787 5584 6482 7077 3.65 9.2
LSHS 1982 1759 1366 449 377 150 104 0.05 -30.7
Fuel Oil (FO+LSHS) 10789 9307 7656 6236 5961 6632 7182 3.71 8.3
Lubes/Greases 2429 2633 3196 3305 3310 3571 3353 1.73 -6.1
Bitumen 4536 4638 4676 5007 5073 5938 5939 3.07 0.0
Petroleum Coke 4982 6138 10135 11756 14557 19297 23254 12.00 20.5
Waxes 254 269 194 177 156 173 261 0.13 50.7
Others 1576 1863 2226 2519 2586 2802 3137 1.62 12.0
Total Consumption 141040 148132 157057 158407 165520 184674 193745 100 4.9
Refinery fuel and losses (RBF)
16381 17295 18347 17868 17669 18773 20070 - 6.25
Grand Total 157422 165427 175404 176274 183189 203447 213814 - 11.06
Note: P:Provisional1. Consumption includes sales by oil companies, own consumption & direct private imports.
2. Growth rate in 2016-17 over 2015-16.
CHAP
TER
ICH
APTE
R II
CHAP
TER
IIICH
APTE
R IV
CHAP
TER
VCH
APTE
R VI
CHAP
TER
VII
CHAP
TER
VIII
CHAP
TER
IXCH
APTE
R X
CHAP
TER
XIAP
PEN
DIX
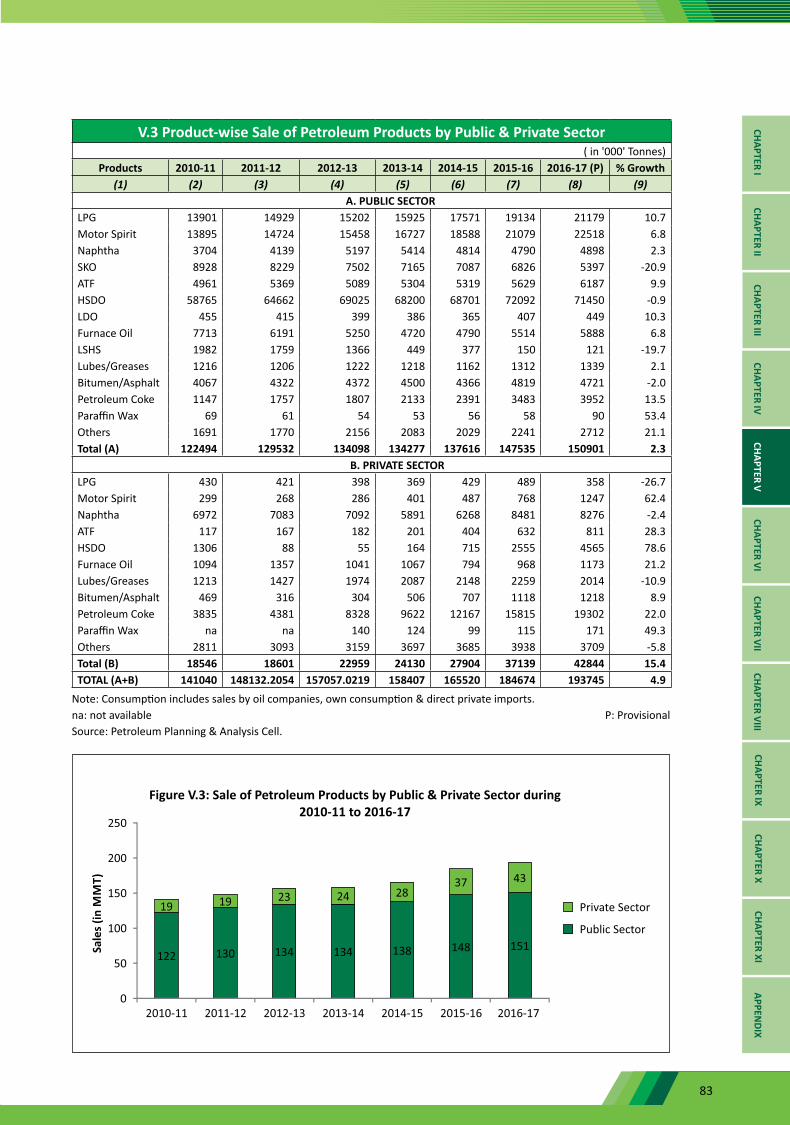
83
V.3 Product-wise Sale of Petroleum Products by Public & Private Sector( in '000' Tonnes)
Products 2010-11 2011-12 2012-13 2013-14 2014-15 2015-16 2016-17 (P) % Growth(1) (2) (3) (4) (5) (6) (7) (8) (9)
A. PUBLIC SECTORLPG 13901 14929 15202 15925 17571 19134 21179 10.7Motor Spirit 13895 14724 15458 16727 18588 21079 22518 6.8Naphtha 3704 4139 5197 5414 4814 4790 4898 2.3SKO 8928 8229 7502 7165 7087 6826 5397 -20.9ATF 4961 5369 5089 5304 5319 5629 6187 9.9HSDO 58765 64662 69025 68200 68701 72092 71450 -0.9LDO 455 415 399 386 365 407 449 10.3Furnace Oil 7713 6191 5250 4720 4790 5514 5888 6.8LSHS 1982 1759 1366 449 377 150 121 -19.7Lubes/Greases 1216 1206 1222 1218 1162 1312 1339 2.1Bitumen/Asphalt 4067 4322 4372 4500 4366 4819 4721 -2.0Petroleum Coke 1147 1757 1807 2133 2391 3483 3952 13.5Paraffin Wax 69 61 54 53 56 58 90 53.4Others 1691 1770 2156 2083 2029 2241 2712 21.1Total (A) 122494 129532 134098 134277 137616 147535 150901 2.3
B. PRIVATE SECTORLPG 430 421 398 369 429 489 358 -26.7Motor Spirit 299 268 286 401 487 768 1247 62.4Naphtha 6972 7083 7092 5891 6268 8481 8276 -2.4ATF 117 167 182 201 404 632 811 28.3HSDO 1306 88 55 164 715 2555 4565 78.6Furnace Oil 1094 1357 1041 1067 794 968 1173 21.2Lubes/Greases 1213 1427 1974 2087 2148 2259 2014 -10.9Bitumen/Asphalt 469 316 304 506 707 1118 1218 8.9Petroleum Coke 3835 4381 8328 9622 12167 15815 19302 22.0Paraffin Wax na na 140 124 99 115 171 49.3Others 2811 3093 3159 3697 3685 3938 3709 -5.8Total (B) 18546 18601 22959 24130 27904 37139 42844 15.4TOTAL (A+B) 141040 148132.2054 157057.0219 158407 165520 184674 193745 4.9
Note: Consumption includes sales by oil companies, own consumption & direct private imports. na: not available P: ProvisionalSource: Petroleum Planning & Analysis Cell.
CHAPTER ICHAPTER II
CHAPTER IIICHAPTER IV
CHAPTER VCHAPTER VI
CHAPTER VIICHAPTER VIII
CHAPTER IXCHAPTER X
CHAPTER XIAPPEN
DIX
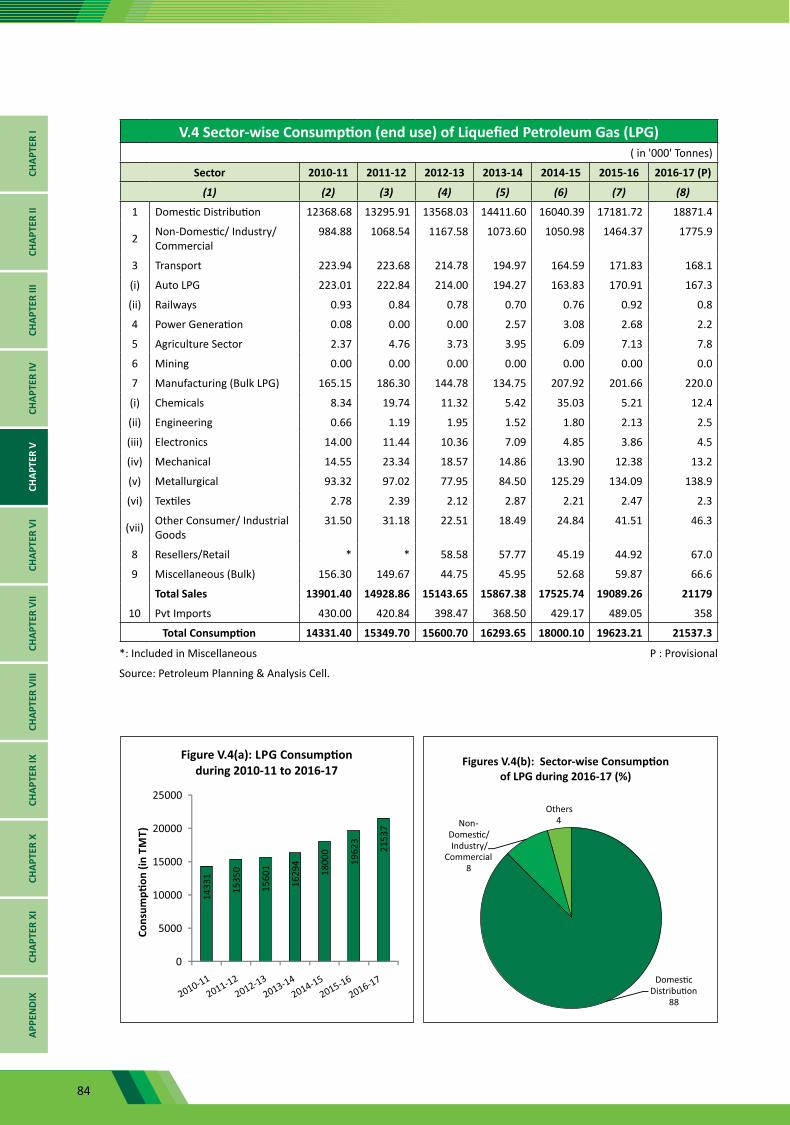
84
V.4 Sector-wise Consumption (end use) of Liquefied Petroleum Gas (LPG)( in '000' Tonnes)
Sector 2010-11 2011-12 2012-13 2013-14 2014-15 2015-16 2016-17 (P)
(1) (2) (3) (4) (5) (6) (7) (8)
1 Domestic Distribution 12368.68 13295.91 13568.03 14411.60 16040.39 17181.72 18871.4
2 Non-Domestic/ Industry/Commercial
984.88 1068.54 1167.58 1073.60 1050.98 1464.37 1775.9
3 Transport 223.94 223.68 214.78 194.97 164.59 171.83 168.1
(i) Auto LPG 223.01 222.84 214.00 194.27 163.83 170.91 167.3
(ii) Railways 0.93 0.84 0.78 0.70 0.76 0.92 0.8
4 Power Generation 0.08 0.00 0.00 2.57 3.08 2.68 2.2
5 Agriculture Sector 2.37 4.76 3.73 3.95 6.09 7.13 7.8
6 Mining 0.00 0.00 0.00 0.00 0.00 0.00 0.0
7 Manufacturing (Bulk LPG) 165.15 186.30 144.78 134.75 207.92 201.66 220.0
(i) Chemicals 8.34 19.74 11.32 5.42 35.03 5.21 12.4
(ii) Engineering 0.66 1.19 1.95 1.52 1.80 2.13 2.5
(iii) Electronics 14.00 11.44 10.36 7.09 4.85 3.86 4.5
(iv) Mechanical 14.55 23.34 18.57 14.86 13.90 12.38 13.2
(v) Metallurgical 93.32 97.02 77.95 84.50 125.29 134.09 138.9
(vi) Textiles 2.78 2.39 2.12 2.87 2.21 2.47 2.3
(vii) Other Consumer/ Industrial Goods
31.50 31.18 22.51 18.49 24.84 41.51 46.3
8 Resellers/Retail * * 58.58 57.77 45.19 44.92 67.0
9 Miscellaneous (Bulk) 156.30 149.67 44.75 45.95 52.68 59.87 66.6
Total Sales 13901.40 14928.86 15143.65 15867.38 17525.74 19089.26 21179
10 Pvt Imports 430.00 420.84 398.47 368.50 429.17 489.05 358
Total Consumption 14331.40 15349.70 15600.70 16293.65 18000.10 19623.21 21537.3
*: Included in Miscellaneous P : Provisional
Source: Petroleum Planning & Analysis Cell.
CHAP
TER
ICH
APTE
R II
CHAP
TER
IIICH
APTE
R IV
CHAP
TER
VCH
APTE
R VI
CHAP
TER
VII
CHAP
TER
VIII
CHAP
TER
IXCH
APTE
R X
CHAP
TER
XIAP
PEN
DIX
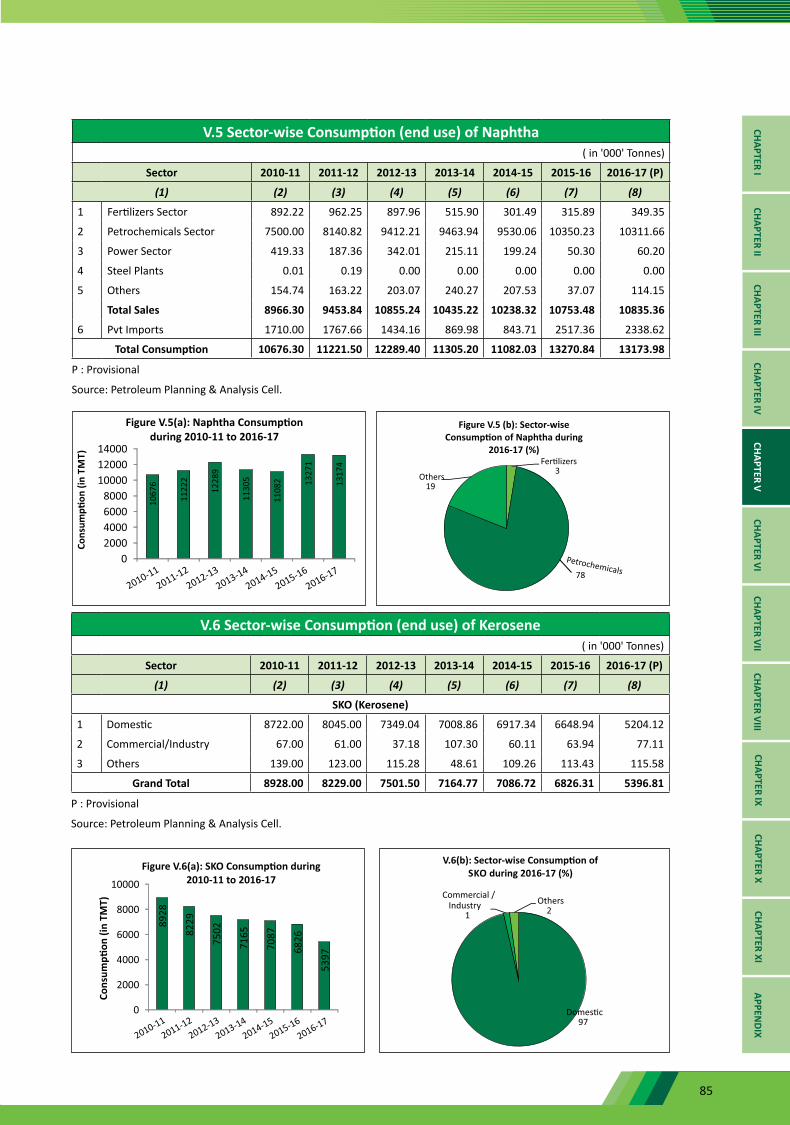
85
V.5 Sector-wise Consumption (end use) of Naphtha( in '000' Tonnes)
Sector 2010-11 2011-12 2012-13 2013-14 2014-15 2015-16 2016-17 (P)
(1) (2) (3) (4) (5) (6) (7) (8)
1 Fertilizers Sector 892.22 962.25 897.96 515.90 301.49 315.89 349.35
2 Petrochemicals Sector 7500.00 8140.82 9412.21 9463.94 9530.06 10350.23 10311.66
3 Power Sector 419.33 187.36 342.01 215.11 199.24 50.30 60.20
4 Steel Plants 0.01 0.19 0.00 0.00 0.00 0.00 0.00
5 Others 154.74 163.22 203.07 240.27 207.53 37.07 114.15
Total Sales 8966.30 9453.84 10855.24 10435.22 10238.32 10753.48 10835.36
6 Pvt Imports 1710.00 1767.66 1434.16 869.98 843.71 2517.36 2338.62
Total Consumption 10676.30 11221.50 12289.40 11305.20 11082.03 13270.84 13173.98
P : Provisional
Source: Petroleum Planning & Analysis Cell.
V.6 Sector-wise Consumption (end use) of Kerosene( in '000' Tonnes)
Sector 2010-11 2011-12 2012-13 2013-14 2014-15 2015-16 2016-17 (P)
(1) (2) (3) (4) (5) (6) (7) (8)
SKO (Kerosene)
1 Domestic 8722.00 8045.00 7349.04 7008.86 6917.34 6648.94 5204.12
2 Commercial/Industry 67.00 61.00 37.18 107.30 60.11 63.94 77.11
3 Others 139.00 123.00 115.28 48.61 109.26 113.43 115.58
Grand Total 8928.00 8229.00 7501.50 7164.77 7086.72 6826.31 5396.81
P : Provisional
Source: Petroleum Planning & Analysis Cell.
CHAPTER ICHAPTER II
CHAPTER IIICHAPTER IV
CHAPTER VCHAPTER VI
CHAPTER VIICHAPTER VIII
CHAPTER IXCHAPTER X
CHAPTER XIAPPEN
DIX
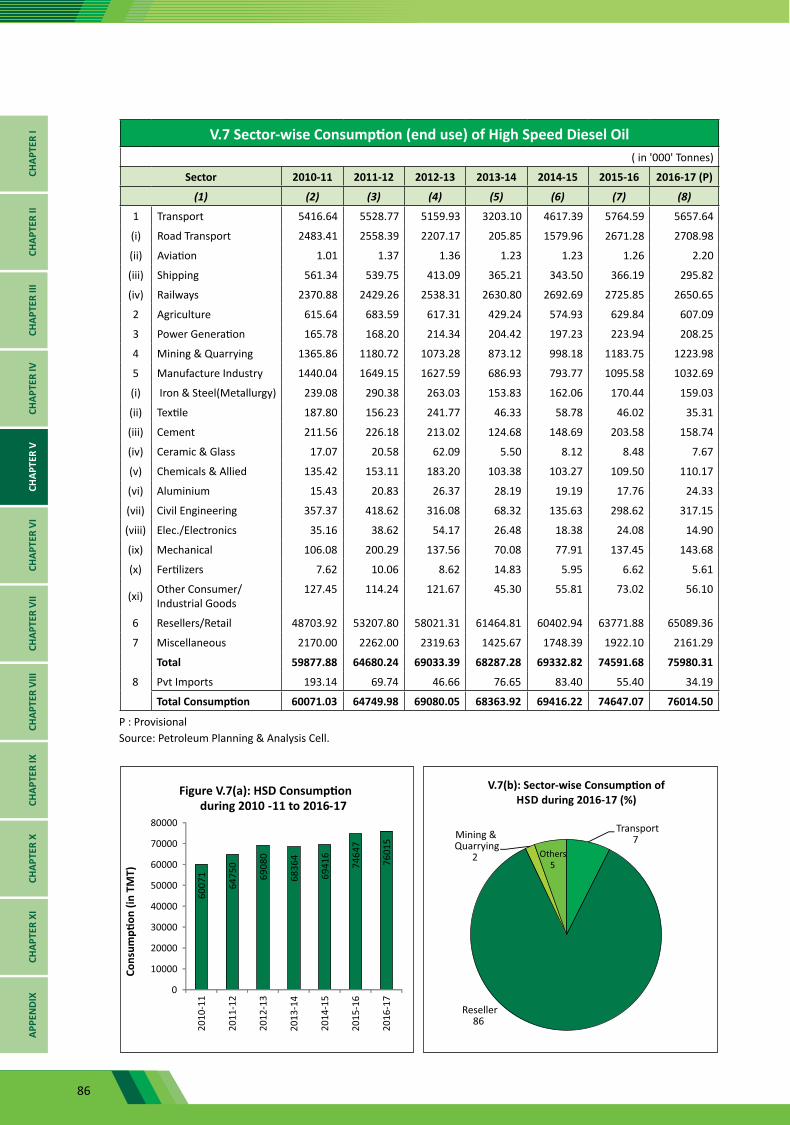
86
V.7 Sector-wise Consumption (end use) of High Speed Diesel Oil( in '000' Tonnes)
Sector 2010-11 2011-12 2012-13 2013-14 2014-15 2015-16 2016-17 (P)
(1) (2) (3) (4) (5) (6) (7) (8)
1 Transport 5416.64 5528.77 5159.93 3203.10 4617.39 5764.59 5657.64
(i) Road Transport 2483.41 2558.39 2207.17 205.85 1579.96 2671.28 2708.98
(ii) Aviation 1.01 1.37 1.36 1.23 1.23 1.26 2.20
(iii) Shipping 561.34 539.75 413.09 365.21 343.50 366.19 295.82
(iv) Railways 2370.88 2429.26 2538.31 2630.80 2692.69 2725.85 2650.65
2 Agriculture 615.64 683.59 617.31 429.24 574.93 629.84 607.09
3 Power Generation 165.78 168.20 214.34 204.42 197.23 223.94 208.25
4 Mining & Quarrying 1365.86 1180.72 1073.28 873.12 998.18 1183.75 1223.98
5 Manufacture Industry 1440.04 1649.15 1627.59 686.93 793.77 1095.58 1032.69
(i) Iron & Steel(Metallurgy) 239.08 290.38 263.03 153.83 162.06 170.44 159.03
(ii) Textile 187.80 156.23 241.77 46.33 58.78 46.02 35.31
(iii) Cement 211.56 226.18 213.02 124.68 148.69 203.58 158.74
(iv) Ceramic & Glass 17.07 20.58 62.09 5.50 8.12 8.48 7.67
(v) Chemicals & Allied 135.42 153.11 183.20 103.38 103.27 109.50 110.17
(vi) Aluminium 15.43 20.83 26.37 28.19 19.19 17.76 24.33
(vii) Civil Engineering 357.37 418.62 316.08 68.32 135.63 298.62 317.15
(viii) Elec./Electronics 35.16 38.62 54.17 26.48 18.38 24.08 14.90
(ix) Mechanical 106.08 200.29 137.56 70.08 77.91 137.45 143.68
(x) Fertilizers 7.62 10.06 8.62 14.83 5.95 6.62 5.61
(xi) Other Consumer/ Industrial Goods
127.45 114.24 121.67 45.30 55.81 73.02 56.10
6 Resellers/Retail 48703.92 53207.80 58021.31 61464.81 60402.94 63771.88 65089.36
7 Miscellaneous 2170.00 2262.00 2319.63 1425.67 1748.39 1922.10 2161.29
Total 59877.88 64680.24 69033.39 68287.28 69332.82 74591.68 75980.31
8 Pvt Imports 193.14 69.74 46.66 76.65 83.40 55.40 34.19
Total Consumption 60071.03 64749.98 69080.05 68363.92 69416.22 74647.07 76014.50
P : ProvisionalSource: Petroleum Planning & Analysis Cell.
CHAP
TER
ICH
APTE
R II
CHAP
TER
IIICH
APTE
R IV
CHAP
TER
VCH
APTE
R VI
CHAP
TER
VII
CHAP
TER
VIII
CHAP
TER
IXCH
APTE
R X
CHAP
TER
XIAP
PEN
DIX
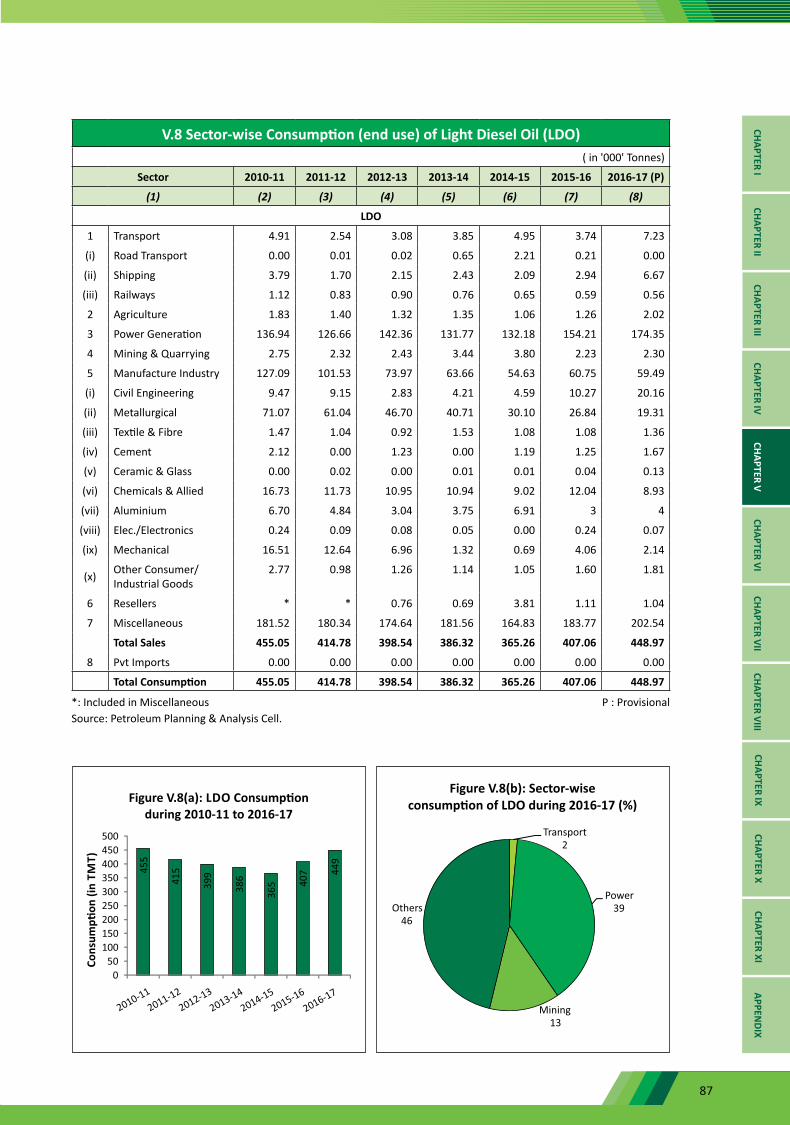
87
V.8 Sector-wise Consumption (end use) of Light Diesel Oil (LDO)( in '000' Tonnes)
Sector 2010-11 2011-12 2012-13 2013-14 2014-15 2015-16 2016-17 (P)
(1) (2) (3) (4) (5) (6) (7) (8)
LDO
1 Transport 4.91 2.54 3.08 3.85 4.95 3.74 7.23
(i) Road Transport 0.00 0.01 0.02 0.65 2.21 0.21 0.00
(ii) Shipping 3.79 1.70 2.15 2.43 2.09 2.94 6.67
(iii) Railways 1.12 0.83 0.90 0.76 0.65 0.59 0.56
2 Agriculture 1.83 1.40 1.32 1.35 1.06 1.26 2.02
3 Power Generation 136.94 126.66 142.36 131.77 132.18 154.21 174.35
4 Mining & Quarrying 2.75 2.32 2.43 3.44 3.80 2.23 2.30
5 Manufacture Industry 127.09 101.53 73.97 63.66 54.63 60.75 59.49
(i) Civil Engineering 9.47 9.15 2.83 4.21 4.59 10.27 20.16
(ii) Metallurgical 71.07 61.04 46.70 40.71 30.10 26.84 19.31
(iii) Textile & Fibre 1.47 1.04 0.92 1.53 1.08 1.08 1.36
(iv) Cement 2.12 0.00 1.23 0.00 1.19 1.25 1.67
(v) Ceramic & Glass 0.00 0.02 0.00 0.01 0.01 0.04 0.13
(vi) Chemicals & Allied 16.73 11.73 10.95 10.94 9.02 12.04 8.93
(vii) Aluminium 6.70 4.84 3.04 3.75 6.91 3 4
(viii) Elec./Electronics 0.24 0.09 0.08 0.05 0.00 0.24 0.07
(ix) Mechanical 16.51 12.64 6.96 1.32 0.69 4.06 2.14
(x) Other Consumer/ Industrial Goods
2.77 0.98 1.26 1.14 1.05 1.60 1.81
6 Resellers * * 0.76 0.69 3.81 1.11 1.04
7 Miscellaneous 181.52 180.34 174.64 181.56 164.83 183.77 202.54
Total Sales 455.05 414.78 398.54 386.32 365.26 407.06 448.97
8 Pvt Imports 0.00 0.00 0.00 0.00 0.00 0.00 0.00
Total Consumption 455.05 414.78 398.54 386.32 365.26 407.06 448.97
*: Included in Miscellaneous P : ProvisionalSource: Petroleum Planning & Analysis Cell.
CHAPTER ICHAPTER II
CHAPTER IIICHAPTER IV
CHAPTER VCHAPTER VI
CHAPTER VIICHAPTER VIII
CHAPTER IXCHAPTER X
CHAPTER XIAPPEN
DIX

88
V.9 Sector-wise Consumption (end use) of Furnace Oil( in '000' Tonnes)
Sector 2010-11 2011-12 2012-13 2013-14 2014-15 2015-16 2016-17 (P)
(1) (2) (3) (4) (5) (6) (7) (8)
1 Transport 780.13 370.96 276.66 315.34 346.45 379.50 444.15
(i) Road Transport 0.09 0.67 1.35 6.15 10.17 44.97 36.96
(ii) Shipping 776.15 366.92 272.70 306.74 334.48 332.63 407.17
(iii) Railways 3.89 3.38 2.60 2.45 1.80 1.90 0.02
(iv) Other Transport (incl. Agri. Retail Trade)
0.00 0.00 0.00 0.00 0.00 0.00 0.00
2 Agriculture 70.40 70.37 79.16 74.53 55.62 56.62 51.41
3 Power Generation 822.78 646.56 586.79 535.68 445.77 430.36 360.95
4 Mining & Quarrying 7.23 45.24 12.45 38.48 45.10 52.66 71.45
5 Manufacturing Industry 2773.48 2408.31 2018.99 1833.32 1748.42 2136.47 2491.75
(i) Civil Engineering 62.59 79.32 59.03 55.87 32.78 47.85 49.63
(ii) Metallurgical 1100.26 710.29 602.91 549.88 611.38 763.95 1240.00
(iii) Textile & Fibre 80.76 52.11 37.99 57.75 69.87 68.36 74.12
(iv) Cement 74.79 39.43 27.78 13.08 12.73 14.66 11.99
(v) Ceramic & Glass 236.83 221.54 145.67 123.25 87.91 142.72 171.04
(vi) Chemicals & Allied 310.67 287.42 221.83 201.29 165.86 193.13 238.88
(vii) Aluminium 0.00 219.56 233.09 231.61 232.26 218.48 0.00
(viii) Electrical 6.55 13.10 30.35 7.30 1.65 1.32 1.62
(ix) Mechanical 55.05 38.04 21.95 15.24 10.92 16.35 16.63
(x) Fertilizers 479.02 458.13 475.21 408.08 393.28 476.45 487.71
(xi) Other Consumer/ Industrial Goods)
366.96 289.38 163.17 169.99 129.78 193.19 200.11
6 Resellers * * 351.28 309.09 196.87 270.18 357.27
7 Miscellaneous 3978.85 3300.14 2356.88 1984.69 2175.37 2564.00 2485.35
Total Sales 8432.88 6841.58 5682.21 5091.14 5013.60 5889.81 6262.32
8 Pvt Imports 374.00 706.04 608.29 695.81 570.04 592.12 815.01
Total Consumption 8806.88 7547.62 6290.50 5786.95 5583.638 6481.93 7077.33
*: Included in Miscellaneous P: ProvisionalSource: Petroleum Planning & Analysis Cell.
CHAP
TER
ICH
APTE
R II
CHAP
TER
IIICH
APTE
R IV
CHAP
TER
VCH
APTE
R VI
CHAP
TER
VII
CHAP
TER
VIII
CHAP
TER
IXCH
APTE
R X
CHAP
TER
XIAP
PEN
DIX
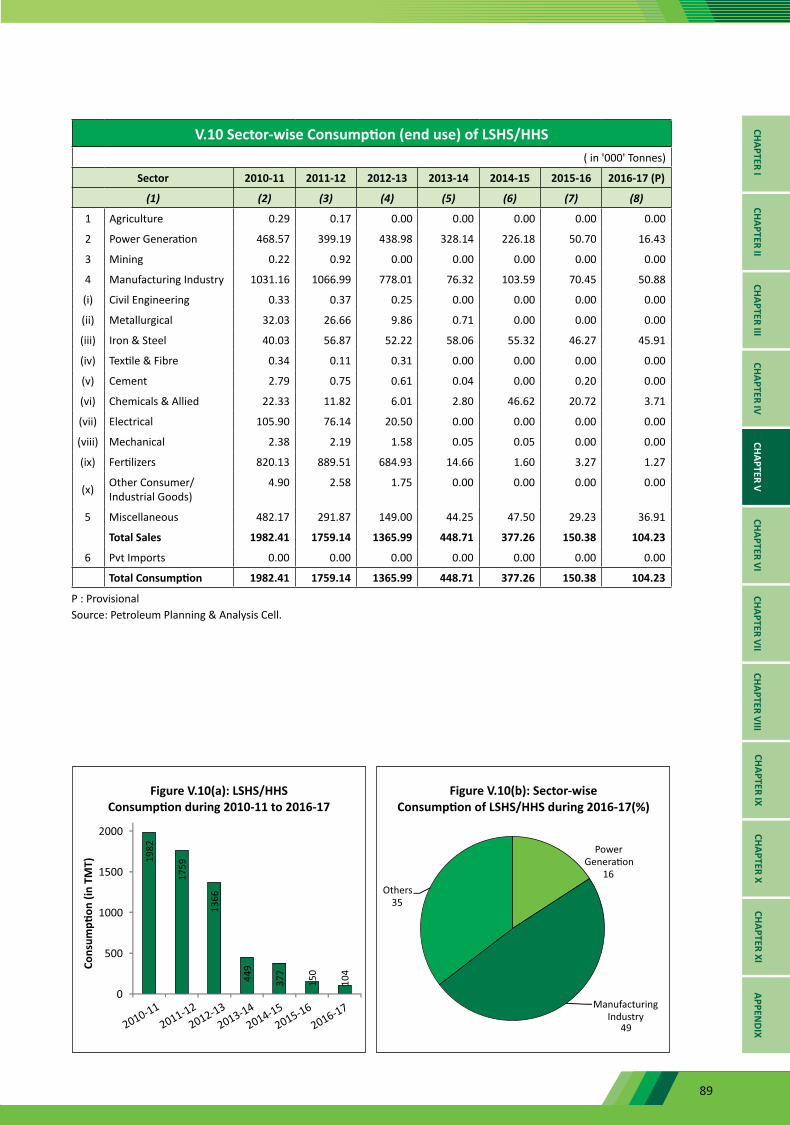
89
V.10 Sector-wise Consumption (end use) of LSHS/HHS( in '000' Tonnes)
Sector 2010-11 2011-12 2012-13 2013-14 2014-15 2015-16 2016-17 (P)
(1) (2) (3) (4) (5) (6) (7) (8)
1 Agriculture 0.29 0.17 0.00 0.00 0.00 0.00 0.00
2 Power Generation 468.57 399.19 438.98 328.14 226.18 50.70 16.43
3 Mining 0.22 0.92 0.00 0.00 0.00 0.00 0.00
4 Manufacturing Industry 1031.16 1066.99 778.01 76.32 103.59 70.45 50.88
(i) Civil Engineering 0.33 0.37 0.25 0.00 0.00 0.00 0.00
(ii) Metallurgical 32.03 26.66 9.86 0.71 0.00 0.00 0.00
(iii) Iron & Steel 40.03 56.87 52.22 58.06 55.32 46.27 45.91
(iv) Textile & Fibre 0.34 0.11 0.31 0.00 0.00 0.00 0.00
(v) Cement 2.79 0.75 0.61 0.04 0.00 0.20 0.00
(vi) Chemicals & Allied 22.33 11.82 6.01 2.80 46.62 20.72 3.71
(vii) Electrical 105.90 76.14 20.50 0.00 0.00 0.00 0.00
(viii) Mechanical 2.38 2.19 1.58 0.05 0.05 0.00 0.00
(ix) Fertilizers 820.13 889.51 684.93 14.66 1.60 3.27 1.27
(x) Other Consumer/ Industrial Goods)
4.90 2.58 1.75 0.00 0.00 0.00 0.00
5 Miscellaneous 482.17 291.87 149.00 44.25 47.50 29.23 36.91
Total Sales 1982.41 1759.14 1365.99 448.71 377.26 150.38 104.23
6 Pvt Imports 0.00 0.00 0.00 0.00 0.00 0.00 0.00
Total Consumption 1982.41 1759.14 1365.99 448.71 377.26 150.38 104.23
P : ProvisionalSource: Petroleum Planning & Analysis Cell.
CHAPTER ICHAPTER II
CHAPTER IIICHAPTER IV
CHAPTER VCHAPTER VI
CHAPTER VIICHAPTER VIII
CHAPTER IXCHAPTER X
CHAPTER XIAPPEN
DIX
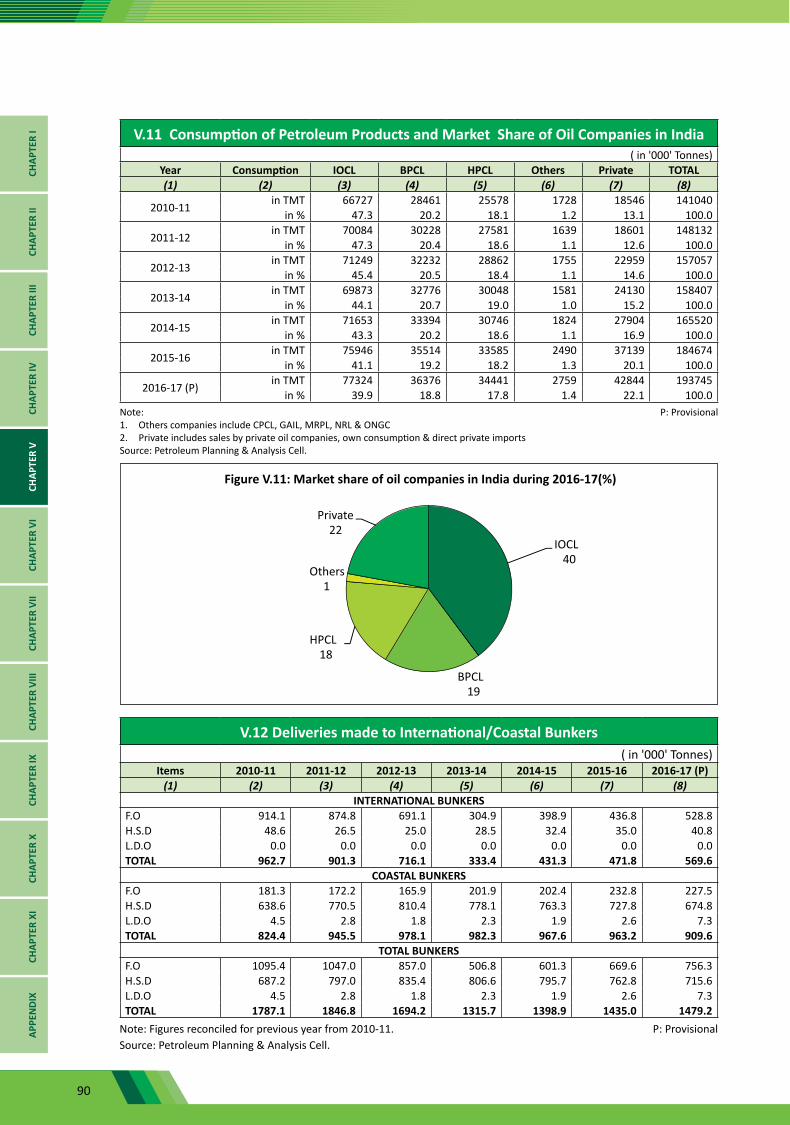
90
V.11 Consumption of Petroleum Products and Market Share of Oil Companies in India( in '000' Tonnes)
Year Consumption IOCL BPCL HPCL Others Private TOTAL(1) (2) (3) (4) (5) (6) (7) (8)
2010-11 in TMT 66727 28461 25578 1728 18546 141040in % 47.3 20.2 18.1 1.2 13.1 100.0
2011-12 in TMT 70084 30228 27581 1639 18601 148132in % 47.3 20.4 18.6 1.1 12.6 100.0
2012-13 in TMT 71249 32232 28862 1755 22959 157057in % 45.4 20.5 18.4 1.1 14.6 100.0
2013-14 in TMT 69873 32776 30048 1581 24130 158407in % 44.1 20.7 19.0 1.0 15.2 100.0
2014-15 in TMT 71653 33394 30746 1824 27904 165520in % 43.3 20.2 18.6 1.1 16.9 100.0
2015-16 in TMT 75946 35514 33585 2490 37139 184674in % 41.1 19.2 18.2 1.3 20.1 100.0
2016-17 (P) in TMT 77324 36376 34441 2759 42844 193745in % 39.9 18.8 17.8 1.4 22.1 100.0
Note: P: Provisional 1. Others companies include CPCL, GAIL, MRPL, NRL & ONGC2. Private includes sales by private oil companies, own consumption & direct private imports Source: Petroleum Planning & Analysis Cell.
V.12 Deliveries made to International/Coastal Bunkers( in '000' Tonnes)
Items 2010-11 2011-12 2012-13 2013-14 2014-15 2015-16 2016-17 (P)(1) (2) (3) (4) (5) (6) (7) (8)
INTERNATIONAL BUNKERSF.O 914.1 874.8 691.1 304.9 398.9 436.8 528.8H.S.D 48.6 26.5 25.0 28.5 32.4 35.0 40.8L.D.O 0.0 0.0 0.0 0.0 0.0 0.0 0.0TOTAL 962.7 901.3 716.1 333.4 431.3 471.8 569.6
COASTAL BUNKERSF.O 181.3 172.2 165.9 201.9 202.4 232.8 227.5H.S.D 638.6 770.5 810.4 778.1 763.3 727.8 674.8L.D.O 4.5 2.8 1.8 2.3 1.9 2.6 7.3TOTAL 824.4 945.5 978.1 982.3 967.6 963.2 909.6
TOTAL BUNKERS F.O 1095.4 1047.0 857.0 506.8 601.3 669.6 756.3H.S.D 687.2 797.0 835.4 806.6 795.7 762.8 715.6L.D.O 4.5 2.8 1.8 2.3 1.9 2.6 7.3TOTAL 1787.1 1846.8 1694.2 1315.7 1398.9 1435.0 1479.2
Note: Figures reconciled for previous year from 2010-11. P: ProvisionalSource: Petroleum Planning & Analysis Cell.
CHAP
TER
ICH
APTE
R II
CHAP
TER
IIICH
APTE
R IV
CHAP
TER
VCH
APTE
R VI
CHAP
TER
VII
CHAP
TER
VIII
CHAP
TER
IXCH
APTE
R X
CHAP
TER
XIAP
PEN
DIX
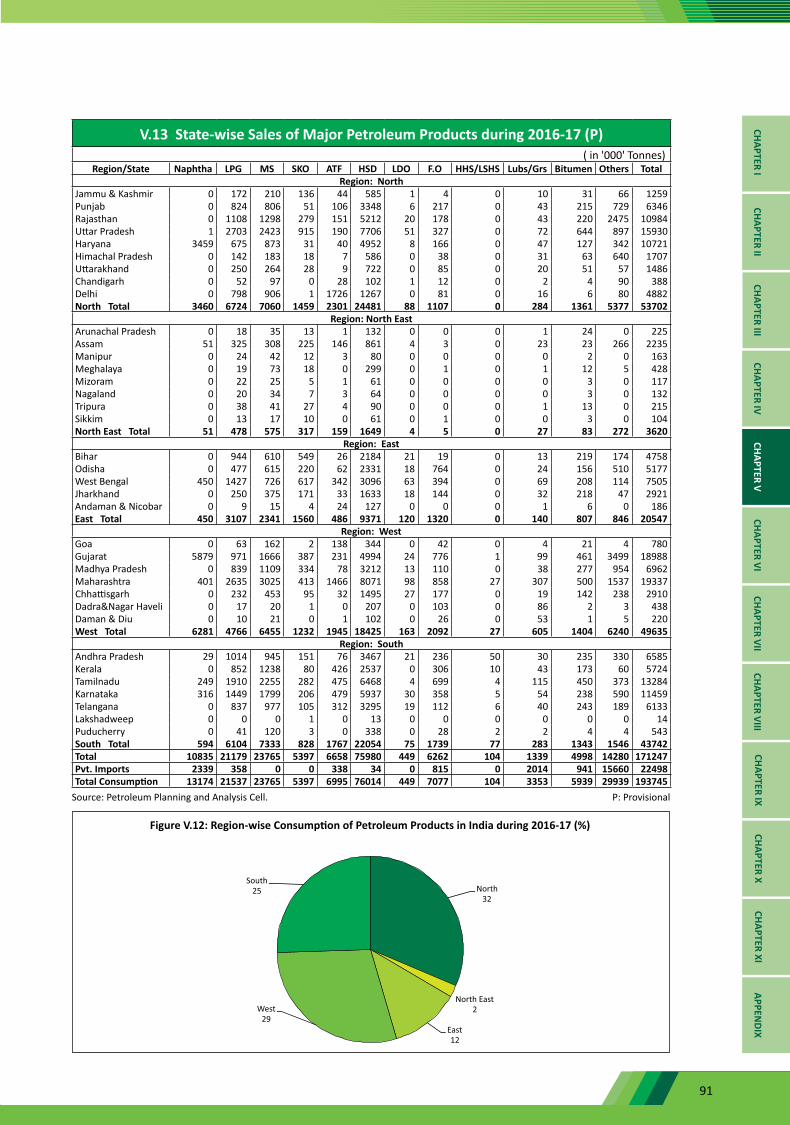
91
V.13 State-wise Sales of Major Petroleum Products during 2016-17 (P)( in '000' Tonnes)
Region/State Naphtha LPG MS SKO ATF HSD LDO F.O HHS/LSHS Lubs/Grs Bitumen Others TotalRegion: North
Jammu & Kashmir 0 172 210 136 44 585 1 4 0 10 31 66 1259Punjab 0 824 806 51 106 3348 6 217 0 43 215 729 6346Rajasthan 0 1108 1298 279 151 5212 20 178 0 43 220 2475 10984Uttar Pradesh 1 2703 2423 915 190 7706 51 327 0 72 644 897 15930Haryana 3459 675 873 31 40 4952 8 166 0 47 127 342 10721Himachal Pradesh 0 142 183 18 7 586 0 38 0 31 63 640 1707Uttarakhand 0 250 264 28 9 722 0 85 0 20 51 57 1486Chandigarh 0 52 97 0 28 102 1 12 0 2 4 90 388Delhi 0 798 906 1 1726 1267 0 81 0 16 6 80 4882North Total 3460 6724 7060 1459 2301 24481 88 1107 0 284 1361 5377 53702
Region: North EastArunachal Pradesh 0 18 35 13 1 132 0 0 0 1 24 0 225Assam 51 325 308 225 146 861 4 3 0 23 23 266 2235Manipur 0 24 42 12 3 80 0 0 0 0 2 0 163Meghalaya 0 19 73 18 0 299 0 1 0 1 12 5 428Mizoram 0 22 25 5 1 61 0 0 0 0 3 0 117Nagaland 0 20 34 7 3 64 0 0 0 0 3 0 132Tripura 0 38 41 27 4 90 0 0 0 1 13 0 215Sikkim 0 13 17 10 0 61 0 1 0 0 3 0 104North East Total 51 478 575 317 159 1649 4 5 0 27 83 272 3620
Region: EastBihar 0 944 610 549 26 2184 21 19 0 13 219 174 4758Odisha 0 477 615 220 62 2331 18 764 0 24 156 510 5177West Bengal 450 1427 726 617 342 3096 63 394 0 69 208 114 7505Jharkhand 0 250 375 171 33 1633 18 144 0 32 218 47 2921Andaman & Nicobar 0 9 15 4 24 127 0 0 0 1 6 0 186East Total 450 3107 2341 1560 486 9371 120 1320 0 140 807 846 20547
Region: WestGoa 0 63 162 2 138 344 0 42 0 4 21 4 780Gujarat 5879 971 1666 387 231 4994 24 776 1 99 461 3499 18988Madhya Pradesh 0 839 1109 334 78 3212 13 110 0 38 277 954 6962Maharashtra 401 2635 3025 413 1466 8071 98 858 27 307 500 1537 19337Chhattisgarh 0 232 453 95 32 1495 27 177 0 19 142 238 2910Dadra&Nagar Haveli 0 17 20 1 0 207 0 103 0 86 2 3 438Daman & Diu 0 10 21 0 1 102 0 26 0 53 1 5 220West Total 6281 4766 6455 1232 1945 18425 163 2092 27 605 1404 6240 49635
Region: SouthAndhra Pradesh 29 1014 945 151 76 3467 21 236 50 30 235 330 6585Kerala 0 852 1238 80 426 2537 0 306 10 43 173 60 5724Tamilnadu 249 1910 2255 282 475 6468 4 699 4 115 450 373 13284Karnataka 316 1449 1799 206 479 5937 30 358 5 54 238 590 11459Telangana 0 837 977 105 312 3295 19 112 6 40 243 189 6133Lakshadweep 0 0 0 1 0 13 0 0 0 0 0 0 14Puducherry 0 41 120 3 0 338 0 28 2 2 4 4 543South Total 594 6104 7333 828 1767 22054 75 1739 77 283 1343 1546 43742Total 10835 21179 23765 5397 6658 75980 449 6262 104 1339 4998 14280 171247Pvt. Imports 2339 358 0 0 338 34 0 815 0 2014 941 15660 22498Total Consumption 13174 21537 23765 5397 6995 76014 449 7077 104 3353 5939 29939 193745
Source: Petroleum Planning and Analysis Cell. P: Provisional
CHAPTER ICHAPTER II
CHAPTER IIICHAPTER IV
CHAPTER VCHAPTER VI
CHAPTER VIICHAPTER VIII
CHAPTER IXCHAPTER X
CHAPTER XIAPPEN
DIX
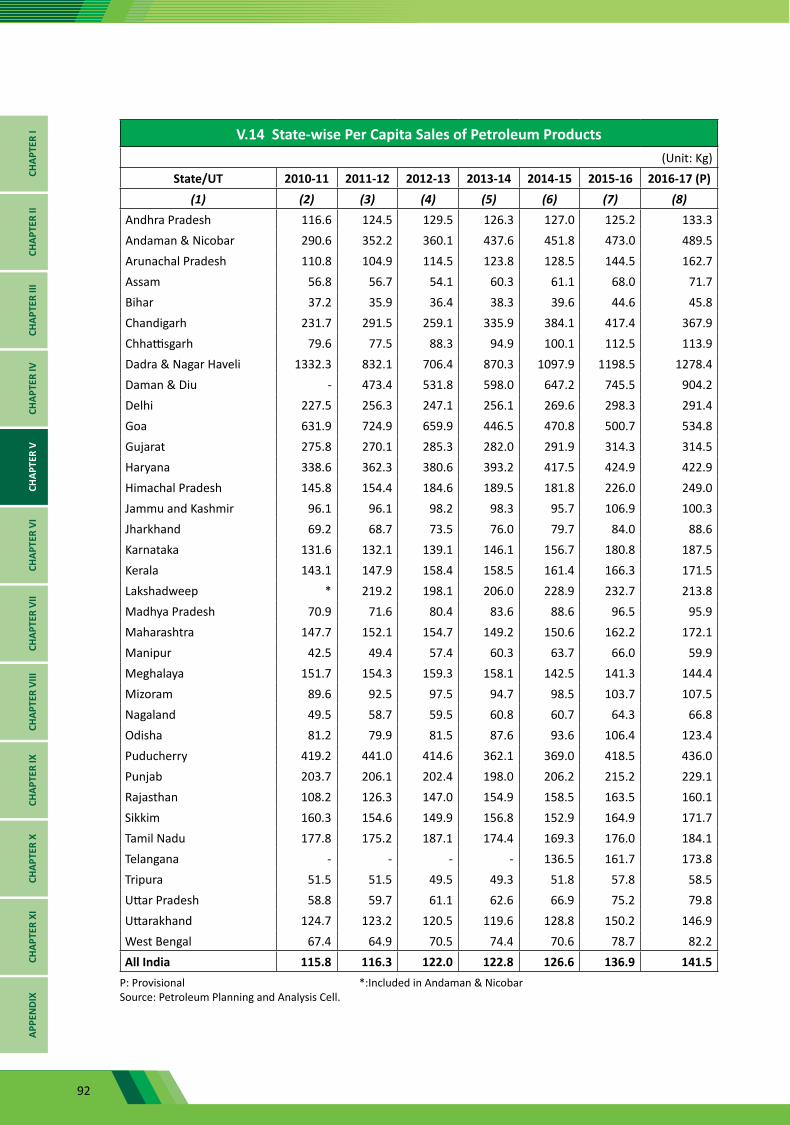
92
V.14 State-wise Per Capita Sales of Petroleum Products (Unit: Kg)
State/UT 2010-11 2011-12 2012-13 2013-14 2014-15 2015-16 2016-17 (P)(1) (2) (3) (4) (5) (6) (7) (8)
Andhra Pradesh 116.6 124.5 129.5 126.3 127.0 125.2 133.3Andaman & Nicobar 290.6 352.2 360.1 437.6 451.8 473.0 489.5Arunachal Pradesh 110.8 104.9 114.5 123.8 128.5 144.5 162.7Assam 56.8 56.7 54.1 60.3 61.1 68.0 71.7Bihar 37.2 35.9 36.4 38.3 39.6 44.6 45.8Chandigarh 231.7 291.5 259.1 335.9 384.1 417.4 367.9Chhattisgarh 79.6 77.5 88.3 94.9 100.1 112.5 113.9Dadra & Nagar Haveli 1332.3 832.1 706.4 870.3 1097.9 1198.5 1278.4Daman & Diu - 473.4 531.8 598.0 647.2 745.5 904.2Delhi 227.5 256.3 247.1 256.1 269.6 298.3 291.4Goa 631.9 724.9 659.9 446.5 470.8 500.7 534.8Gujarat 275.8 270.1 285.3 282.0 291.9 314.3 314.5Haryana 338.6 362.3 380.6 393.2 417.5 424.9 422.9Himachal Pradesh 145.8 154.4 184.6 189.5 181.8 226.0 249.0Jammu and Kashmir 96.1 96.1 98.2 98.3 95.7 106.9 100.3Jharkhand 69.2 68.7 73.5 76.0 79.7 84.0 88.6Karnataka 131.6 132.1 139.1 146.1 156.7 180.8 187.5Kerala 143.1 147.9 158.4 158.5 161.4 166.3 171.5Lakshadweep * 219.2 198.1 206.0 228.9 232.7 213.8Madhya Pradesh 70.9 71.6 80.4 83.6 88.6 96.5 95.9Maharashtra 147.7 152.1 154.7 149.2 150.6 162.2 172.1Manipur 42.5 49.4 57.4 60.3 63.7 66.0 59.9Meghalaya 151.7 154.3 159.3 158.1 142.5 141.3 144.4Mizoram 89.6 92.5 97.5 94.7 98.5 103.7 107.5Nagaland 49.5 58.7 59.5 60.8 60.7 64.3 66.8Odisha 81.2 79.9 81.5 87.6 93.6 106.4 123.4Puducherry 419.2 441.0 414.6 362.1 369.0 418.5 436.0Punjab 203.7 206.1 202.4 198.0 206.2 215.2 229.1Rajasthan 108.2 126.3 147.0 154.9 158.5 163.5 160.1Sikkim 160.3 154.6 149.9 156.8 152.9 164.9 171.7Tamil Nadu 177.8 175.2 187.1 174.4 169.3 176.0 184.1Telangana - - - - 136.5 161.7 173.8Tripura 51.5 51.5 49.5 49.3 51.8 57.8 58.5Uttar Pradesh 58.8 59.7 61.1 62.6 66.9 75.2 79.8Uttarakhand 124.7 123.2 120.5 119.6 128.8 150.2 146.9West Bengal 67.4 64.9 70.5 74.4 70.6 78.7 82.2All India 115.8 116.3 122.0 122.8 126.6 136.9 141.5
P: Provisional *:Included in Andaman & Nicobar Source: Petroleum Planning and Analysis Cell.
CHAP
TER
ICH
APTE
R II
CHAP
TER
IIICH
APTE
R IV
CHAP
TER
VCH
APTE
R VI
CHAP
TER
VII
CHAP
TER
VIII
CHAP
TER
IXCH
APTE
R X
CHAP
TER
XIAP
PEN
DIX
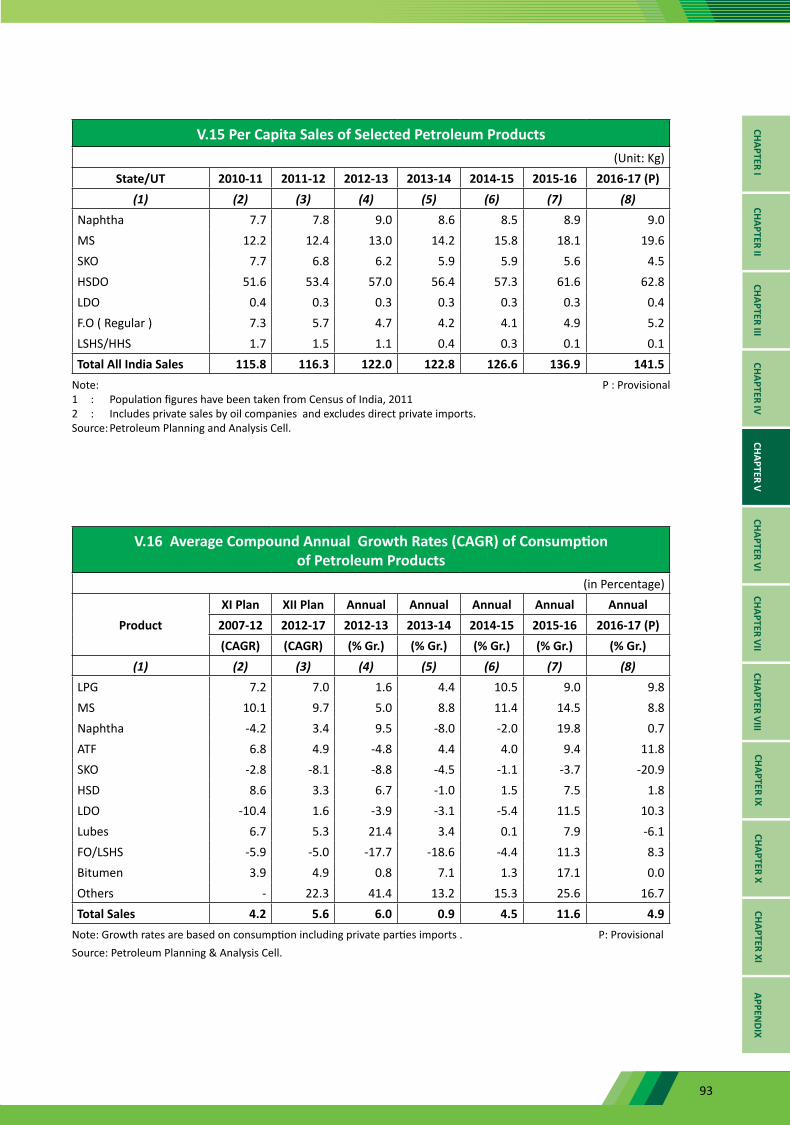
93
V.15 Per Capita Sales of Selected Petroleum Products (Unit: Kg)
State/UT 2010-11 2011-12 2012-13 2013-14 2014-15 2015-16 2016-17 (P)(1) (2) (3) (4) (5) (6) (7) (8)
Naphtha 7.7 7.8 9.0 8.6 8.5 8.9 9.0MS 12.2 12.4 13.0 14.2 15.8 18.1 19.6SKO 7.7 6.8 6.2 5.9 5.9 5.6 4.5HSDO 51.6 53.4 57.0 56.4 57.3 61.6 62.8LDO 0.4 0.3 0.3 0.3 0.3 0.3 0.4F.O ( Regular ) 7.3 5.7 4.7 4.2 4.1 4.9 5.2LSHS/HHS 1.7 1.5 1.1 0.4 0.3 0.1 0.1Total All India Sales 115.8 116.3 122.0 122.8 126.6 136.9 141.5
Note: P : Provisional1 : Population figures have been taken from Census of India, 20112 : Includes private sales by oil companies and excludes direct private imports.Source: Petroleum Planning and Analysis Cell.
V.16 Average Compound Annual Growth Rates (CAGR) of Consumption of Petroleum Products
(in Percentage)
ProductXI Plan XII Plan Annual Annual Annual Annual Annual
2007-12 2012-17 2012-13 2013-14 2014-15 2015-16 2016-17 (P)(CAGR) (CAGR) (% Gr.) (% Gr.) (% Gr.) (% Gr.) (% Gr.)
(1) (2) (3) (4) (5) (6) (7) (8)LPG 7.2 7.0 1.6 4.4 10.5 9.0 9.8MS 10.1 9.7 5.0 8.8 11.4 14.5 8.8Naphtha -4.2 3.4 9.5 -8.0 -2.0 19.8 0.7ATF 6.8 4.9 -4.8 4.4 4.0 9.4 11.8SKO -2.8 -8.1 -8.8 -4.5 -1.1 -3.7 -20.9HSD 8.6 3.3 6.7 -1.0 1.5 7.5 1.8LDO -10.4 1.6 -3.9 -3.1 -5.4 11.5 10.3Lubes 6.7 5.3 21.4 3.4 0.1 7.9 -6.1FO/LSHS -5.9 -5.0 -17.7 -18.6 -4.4 11.3 8.3Bitumen 3.9 4.9 0.8 7.1 1.3 17.1 0.0Others - 22.3 41.4 13.2 15.3 25.6 16.7Total Sales 4.2 5.6 6.0 0.9 4.5 11.6 4.9
Note: Growth rates are based on consumption including private parties imports . P: ProvisionalSource: Petroleum Planning & Analysis Cell.
CHAPTER ICHAPTER II
CHAPTER IIICHAPTER IV
CHAPTER VCHAPTER VI
CHAPTER VIICHAPTER VIII
CHAPTER IXCHAPTER X
CHAPTER XIAPPEN
DIX
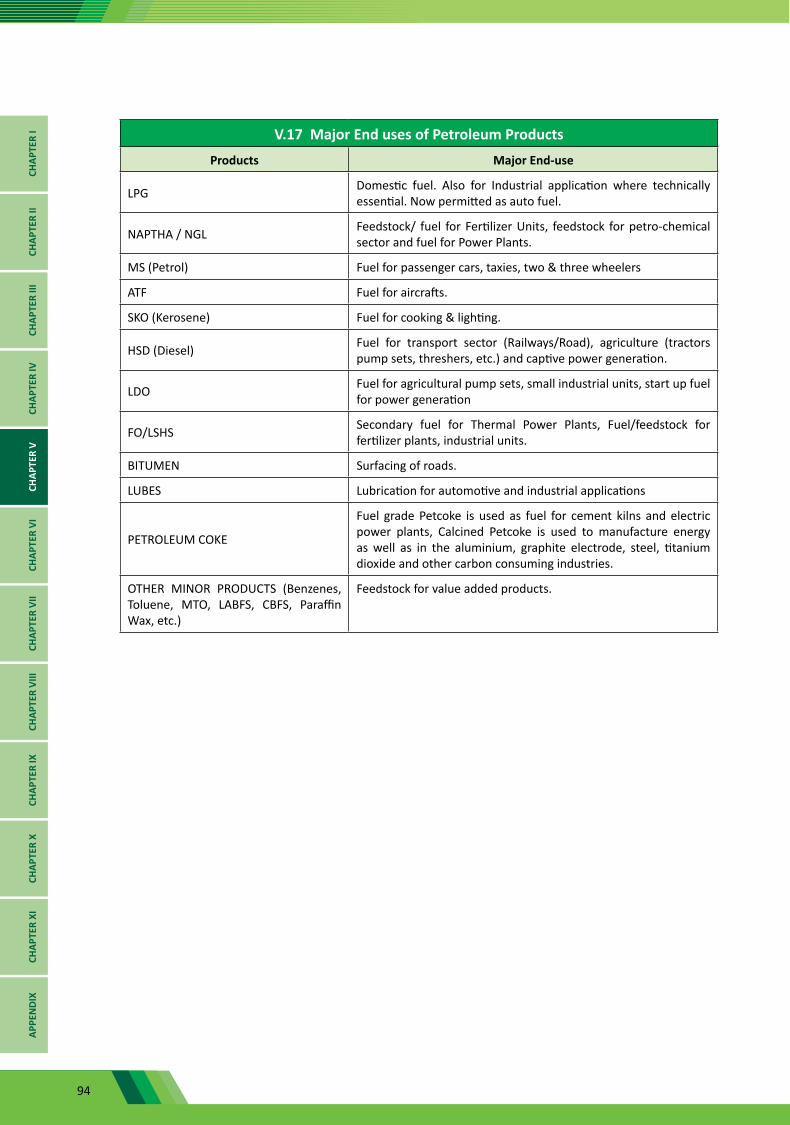
94
V.17 Major End uses of Petroleum ProductsProducts Major End-use
LPG Domestic fuel. Also for Industrial application where technically essential. Now permitted as auto fuel.
NAPTHA / NGL Feedstock/ fuel for Fertilizer Units, feedstock for petro-chemical sector and fuel for Power Plants.
MS (Petrol) Fuel for passenger cars, taxies, two & three wheelers
ATF Fuel for aircrafts.
SKO (Kerosene) Fuel for cooking & lighting.
HSD (Diesel) Fuel for transport sector (Railways/Road), agriculture (tractors pump sets, threshers, etc.) and captive power generation.
LDO Fuel for agricultural pump sets, small industrial units, start up fuel for power generation
FO/LSHS Secondary fuel for Thermal Power Plants, Fuel/feedstock for fertilizer plants, industrial units.
BITUMEN Surfacing of roads.
LUBES Lubrication for automotive and industrial applications
PETROLEUM COKE
Fuel grade Petcoke is used as fuel for cement kilns and electric power plants, Calcined Petcoke is used to manufacture energy as well as in the aluminium, graphite electrode, steel, titanium dioxide and other carbon consuming industries.
OTHER MINOR PRODUCTS (Benzenes, Toluene, MTO, LABFS, CBFS, Paraffin Wax, etc.)
Feedstock for value added products.
CHAP
TER
ICH
APTE
R II
CHAP
TER
IIICH
APTE
R IV
CHAP
TER
VCH
APTE
R VI
CHAP
TER
VII
CHAP
TER
VIII
CHAP
TER
IXCH
APTE
R X
CHAP
TER
XIAP
PEN
DIX
95
CHAPTER ICHAPTER II
CHAPTER IIICHAPTER IV
CHAPTER VCHAPTER VI
CHAPTER VIICHAPTER VIII
CHAPTER IXCHAPTER X
CHAPTER XIAPPEN
DIX
96
Chapter Highlights
• India’s import bill on import of Crude Oil, LNG, and Petroleum Products increased by 10.40% in value terms from ₹ 526978 crore in 2015-16 to ₹ 581792 crore in 2016-17. Increase in import quantity of crude oil, LNG and petroleum products has been around 7.86% from 248.45 MMT in 2015-16 to 267.98 during 2016-17.
• Import of crude oil in the country during 2016-17 was 213.93 million metric tonnes (MMT) which marked a growth of 5.46% over the imports of crude oil of 202.850 MMT during 2015-16. However, the increase was 12.88% in value terms over the same period.
• Availability of Petroleum Products has increased by 6.51% from 200.84 MMT in 2015-16 to 213.45 MMT in 2016-17.
• India’s trade deficit was lower by 6.31% at ₹ 725082 crore in 2016-17 from ₹ 773920 crore during 2015-16.
• India’s trade deficit with OPEC Countries has increased by 34% from ₹ 285489 crore in 2015-16 to ₹ 382829 crore in 2016-17.
• Percentage of India’s OPEC imports to India’s total imports has reduced from 23.6% in 2015-16 to 27.6% in 2016-17.
• Import dependency in India during 2016-17 is 81.68%.
• Foreign Direct Investment inflow was received in oil & gas sector was ₹ 1197.06 crore contributing almost 0.41% of total FDI inflow in the economy during 2016-17.
CHAP
TER
ICH
APTE
R II
CHAP
TER
IIICH
APTE
R IV
CHAP
TER
VCH
APTE
R VI
CHAP
TER
VII
CHAP
TER
VIII
CHAP
TER
IXCH
APTE
R X
CHAP
TER
XIAP
PEN
DIX
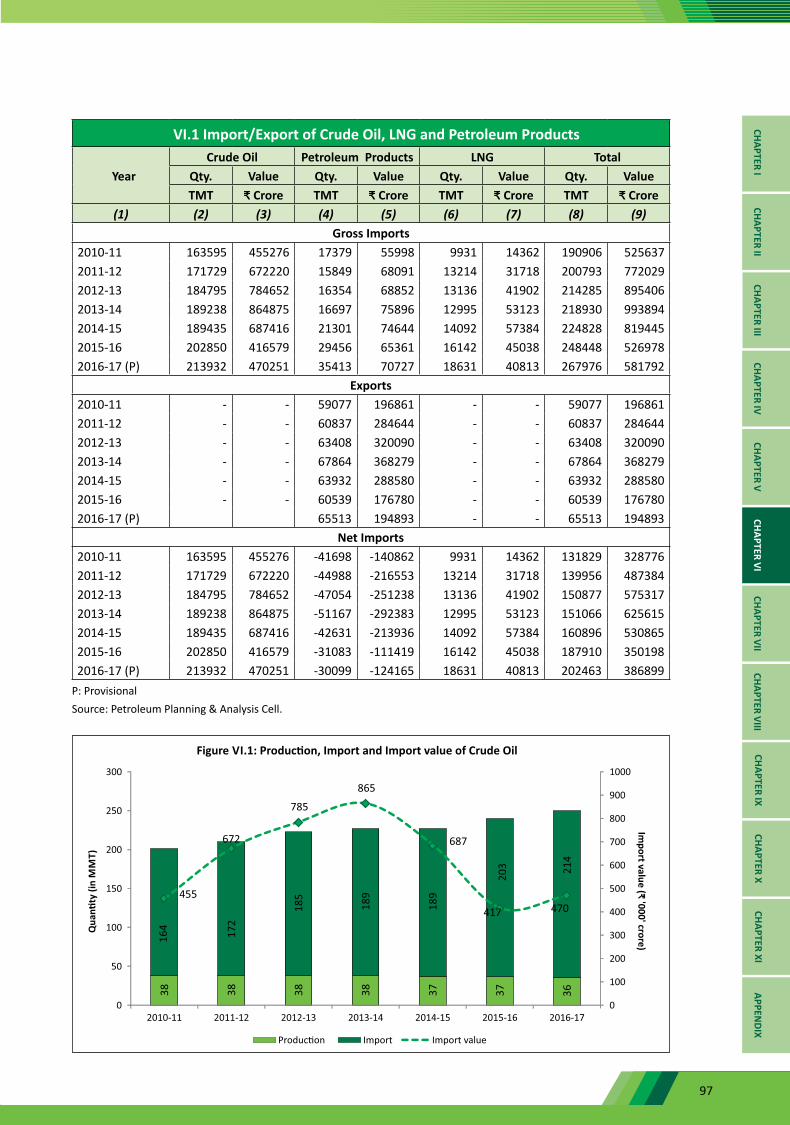
97
VI.1 Import/Export of Crude Oil, LNG and Petroleum Products
YearCrude Oil Petroleum Products LNG Total
Qty. Value Qty. Value Qty. Value Qty. ValueTMT ₹ Crore TMT ₹ Crore TMT ₹ Crore TMT ₹ Crore
(1) (2) (3) (4) (5) (6) (7) (8) (9)Gross Imports
2010-11 163595 455276 17379 55998 9931 14362 190906 5256372011-12 171729 672220 15849 68091 13214 31718 200793 7720292012-13 184795 784652 16354 68852 13136 41902 214285 8954062013-14 189238 864875 16697 75896 12995 53123 218930 9938942014-15 189435 687416 21301 74644 14092 57384 224828 8194452015-16 202850 416579 29456 65361 16142 45038 248448 5269782016-17 (P) 213932 470251 35413 70727 18631 40813 267976 581792
Exports2010-11 - - 59077 196861 - - 59077 1968612011-12 - - 60837 284644 - - 60837 2846442012-13 - - 63408 320090 - - 63408 3200902013-14 - - 67864 368279 - - 67864 3682792014-15 - - 63932 288580 - - 63932 2885802015-16 - - 60539 176780 - - 60539 1767802016-17 (P) 65513 194893 - - 65513 194893
Net Imports2010-11 163595 455276 -41698 -140862 9931 14362 131829 3287762011-12 171729 672220 -44988 -216553 13214 31718 139956 4873842012-13 184795 784652 -47054 -251238 13136 41902 150877 5753172013-14 189238 864875 -51167 -292383 12995 53123 151066 6256152014-15 189435 687416 -42631 -213936 14092 57384 160896 5308652015-16 202850 416579 -31083 -111419 16142 45038 187910 3501982016-17 (P) 213932 470251 -30099 -124165 18631 40813 202463 386899
P: ProvisionalSource: Petroleum Planning & Analysis Cell.
CHAPTER ICHAPTER II
CHAPTER IIICHAPTER IV
CHAPTER VCHAPTER VI
CHAPTER VIICHAPTER VIII
CHAPTER IXCHAPTER X
CHAPTER XIAPPEN
DIX
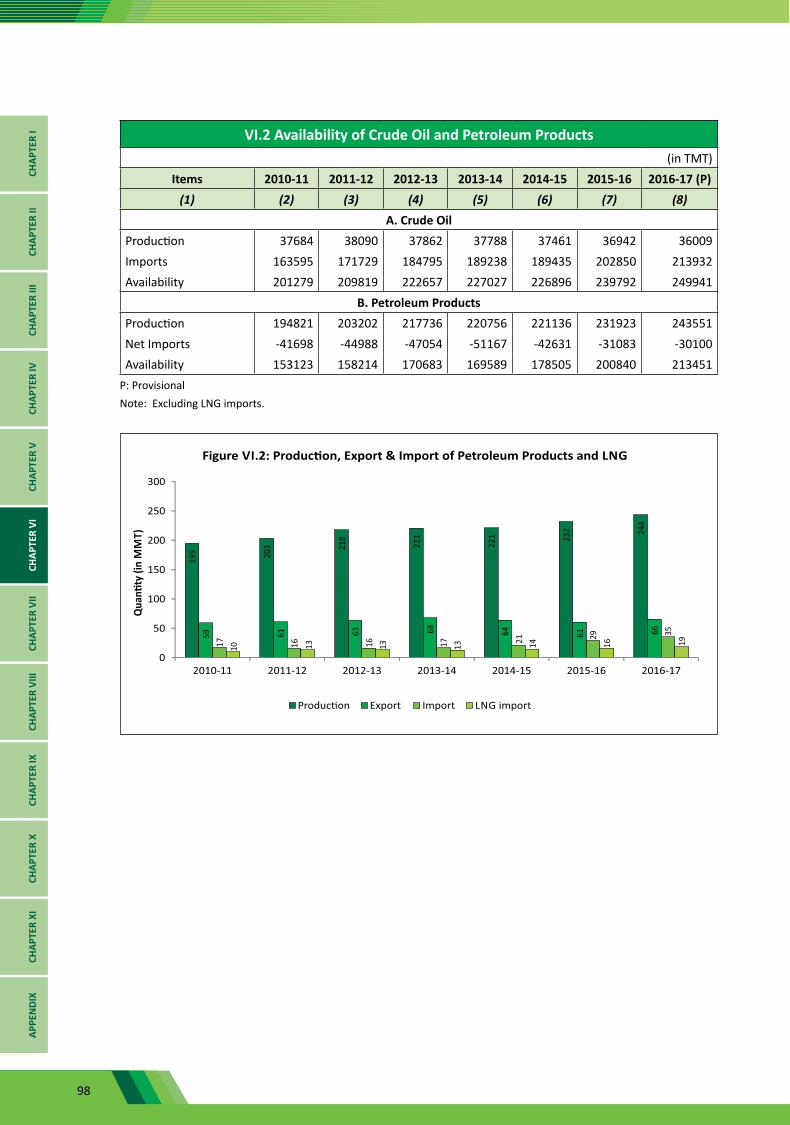
98
CHAP
TER
ICH
APTE
R II
CHAP
TER
IIICH
APTE
R IV
CHAP
TER
VCH
APTE
R VI
CHAP
TER
VII
CHAP
TER
VIII
CHAP
TER
IXCH
APTE
R X
CHAP
TER
XIAP
PEN
DIX
VI.2 Availability of Crude Oil and Petroleum Products(in TMT)
Items 2010-11 2011-12 2012-13 2013-14 2014-15 2015-16 2016-17 (P)(1) (2) (3) (4) (5) (6) (7) (8)
A. Crude OilProduction 37684 38090 37862 37788 37461 36942 36009Imports 163595 171729 184795 189238 189435 202850 213932Availability 201279 209819 222657 227027 226896 239792 249941
B. Petroleum Products Production 194821 203202 217736 220756 221136 231923 243551Net Imports -41698 -44988 -47054 -51167 -42631 -31083 -30100Availability 153123 158214 170683 169589 178505 200840 213451
P: ProvisionalNote: Excluding LNG imports.

99
VI.3
Im
port
/ E
xpor
t of C
rude
Oil
and
Petr
oleu
m P
rodu
cts
(Cal
enda
r Yea
r-w
ise)
(Qua
ntity
in T
MT
& V
alue
in ₹
cro
re)
ITEM
2011
20
12
2013
20
14
2015
20
16 (P
)Q
ty.
Valu
eQ
ty.
Valu
eQ
ty.
Valu
eQ
ty.
Valu
eQ
ty.
Valu
eQ
ty.
Valu
e(1
)(2
)(3
)(4
)(5
)(6
)(7
)(8
)(9
)(1
0)(1
1)(1
2)(1
3)Im
port
sCr
ude
Oil
Impo
rt16
7813
61
3677
18
4173
78
3418
18
9351
84
6591
18
8772
79
8637
19
6490
44
6469
21
5376
41
5672
Pr
oduc
t Im
port
LPG
5535
2381
465
5633
266
6016
3280
280
5041
177
8901
2711
010
143
2598
6 M
S/ P
etro
l95
446
3214
789
123
514
8132
821
1598
441
5754
9 18
54
Nap
htha
/ NGL
2137
9720
1861
9731
1177
6789
623
3665
2797
9624
2857
81
07
Avia
tion
Turb
ine
Fuel
00
00
00
9051
327
391
933
3 10
09
SKO
/ Ker
osen
e90
541
790
00
030
172
4115
80
0 HS
D/ D
iese
l13
9063
3078
340
2981
453
108
637
7240
696
3 26
50
LOBS
/ Lub
e oi
l14
0172
8418
8510
892
1927
1166
423
2914
514
2086
9480
2163
82
08
Fuel
Oil/
LSHS
1150
3866
972
3939
1332
5622
1049
4546
948
2422
1167
20
21
Bitu
men
6014
210
026
317
152
843
315
0685
619
7989
1 14
45
Oth
ers1
2992
7688
4172
7898
4826
1030
870
9212
206
1001
210
664
1631
4 12
086
Prod
uct I
mpo
rt16
524
6765
516
477
7090
915
765
6964
820
131
8105
026
971
6691
835
379
6336
6To
tal I
mpo
rt18
4337
6813
3120
0649
8543
2820
5116
9162
3920
8903
8796
8722
3461
5133
8725
0755
4790
39Pr
oduc
t Exp
ort
LPG
165
856
195
1231
213
1393
239
1640
217
918
291
1023
MS/
Pet
rol
1401
167
059
1609
891
260
1587
495
263
1594
291
334
1589
359
681
1615
051
224
Nap
htha
/ NGL
1060
945
544
9035
4476
584
9645
965
7397
3829
967
0820
160
8417
2168
3Av
iatio
n Tu
rbin
e Fu
el52
2323
996
4153
2222
557
1632
482
5300
2810
852
5316
792
7489
2081
3SK
O/ K
eros
ene
3317
629
173
1698
1490
1250
1548
HSD/
Die
sel
2143
010
2486
2129
411
1708
2599
714
2665
2575
613
0712
2316
071
693
2789
273
678
LDO
8932
826
115
2210
214
630
020
52LO
BS/ L
ube
Oil
3016
775
470
1915
012
9319
130
1311
0Fu
el O
il/LS
HS79
3723
768
6480
2258
362
8122
573
5187
1737
831
5455
9224
3937
86Bi
tum
en18
5965
215
108
363
7421
610
720
657
52O
ther
s228
9710
847
4097
1606
259
5323
259
4402
1980
140
8710
655
3158
7460
Tota
l Pro
duct
Exp
ort
6244
027
5285
6154
831
0805
6869
636
4314
6433
732
7734
5861
118
5878
6594
117
9930
Net
Impo
rt12
1897
4060
4613
9102
5435
2213
6419
5519
2514
4566
5519
5316
4850
3275
0918
4814
2991
091:
O
ther
impo
rts i
nclu
de P
et c
oke,
Par
affin
Wax
, Pet
role
um Je
lly, L
SWR,
Avi
ation
Gas
, MTB
E &
Ref
orm
ate.
P:
Pro
visio
nal
2:
Oth
er e
xpor
ts in
clud
e VG
O, B
enze
ne, M
TO, P
et c
oke,
CBF
S &
Sul
phur
.
Sour
ce: P
etro
leum
Pla
nnin
g &
Ana
lysis
Cel
l.
CHAPTER ICHAPTER II
CHAPTER IIICHAPTER IV
CHAPTER VCHAPTER VI
CHAPTER VIICHAPTER VIII
CHAPTER IXCHAPTER X
CHAPTER XIAPPEN
DIX
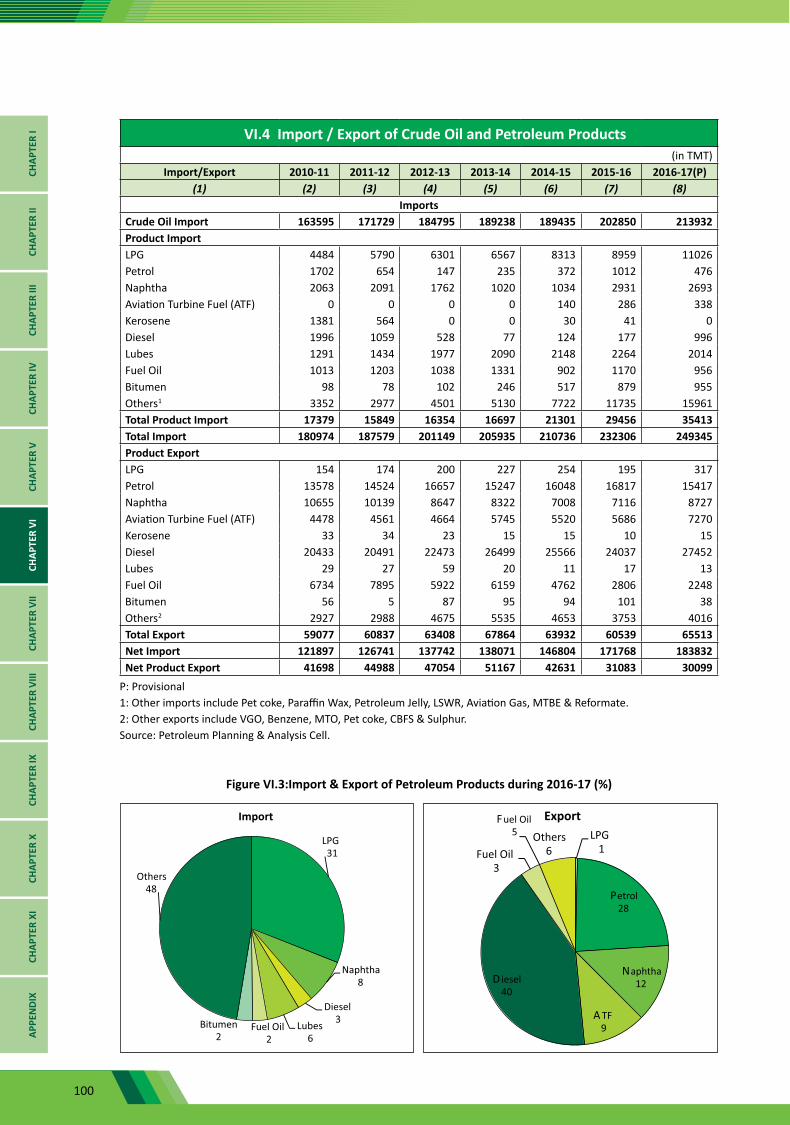
100
CHAP
TER
ICH
APTE
R II
CHAP
TER
IIICH
APTE
R IV
CHAP
TER
VCH
APTE
R VI
CHAP
TER
VII
CHAP
TER
VIII
CHAP
TER
IXCH
APTE
R X
CHAP
TER
XIAP
PEN
DIX
VI.4 Import / Export of Crude Oil and Petroleum Products(in TMT)
Import/Export 2010-11 2011-12 2012-13 2013-14 2014-15 2015-16 2016-17(P)(1) (2) (3) (4) (5) (6) (7) (8)
ImportsCrude Oil Import 163595 171729 184795 189238 189435 202850 213932Product ImportLPG 4484 5790 6301 6567 8313 8959 11026Petrol 1702 654 147 235 372 1012 476Naphtha 2063 2091 1762 1020 1034 2931 2693Aviation Turbine Fuel (ATF) 0 0 0 0 140 286 338Kerosene 1381 564 0 0 30 41 0Diesel 1996 1059 528 77 124 177 996Lubes 1291 1434 1977 2090 2148 2264 2014Fuel Oil 1013 1203 1038 1331 902 1170 956Bitumen 98 78 102 246 517 879 955Others1 3352 2977 4501 5130 7722 11735 15961Total Product Import 17379 15849 16354 16697 21301 29456 35413Total Import 180974 187579 201149 205935 210736 232306 249345Product Export LPG 154 174 200 227 254 195 317Petrol 13578 14524 16657 15247 16048 16817 15417Naphtha 10655 10139 8647 8322 7008 7116 8727Aviation Turbine Fuel (ATF) 4478 4561 4664 5745 5520 5686 7270Kerosene 33 34 23 15 15 10 15Diesel 20433 20491 22473 26499 25566 24037 27452Lubes 29 27 59 20 11 17 13Fuel Oil 6734 7895 5922 6159 4762 2806 2248Bitumen 56 5 87 95 94 101 38Others2 2927 2988 4675 5535 4653 3753 4016Total Export 59077 60837 63408 67864 63932 60539 65513Net Import 121897 126741 137742 138071 146804 171768 183832Net Product Export 41698 44988 47054 51167 42631 31083 30099
P: Provisional 1: Other imports include Pet coke, Paraffin Wax, Petroleum Jelly, LSWR, Aviation Gas, MTBE & Reformate.2: Other exports include VGO, Benzene, MTO, Pet coke, CBFS & Sulphur.Source: Petroleum Planning & Analysis Cell.
Figure VI.3:Import & Export of Petroleum Products during 2016-17 (%)
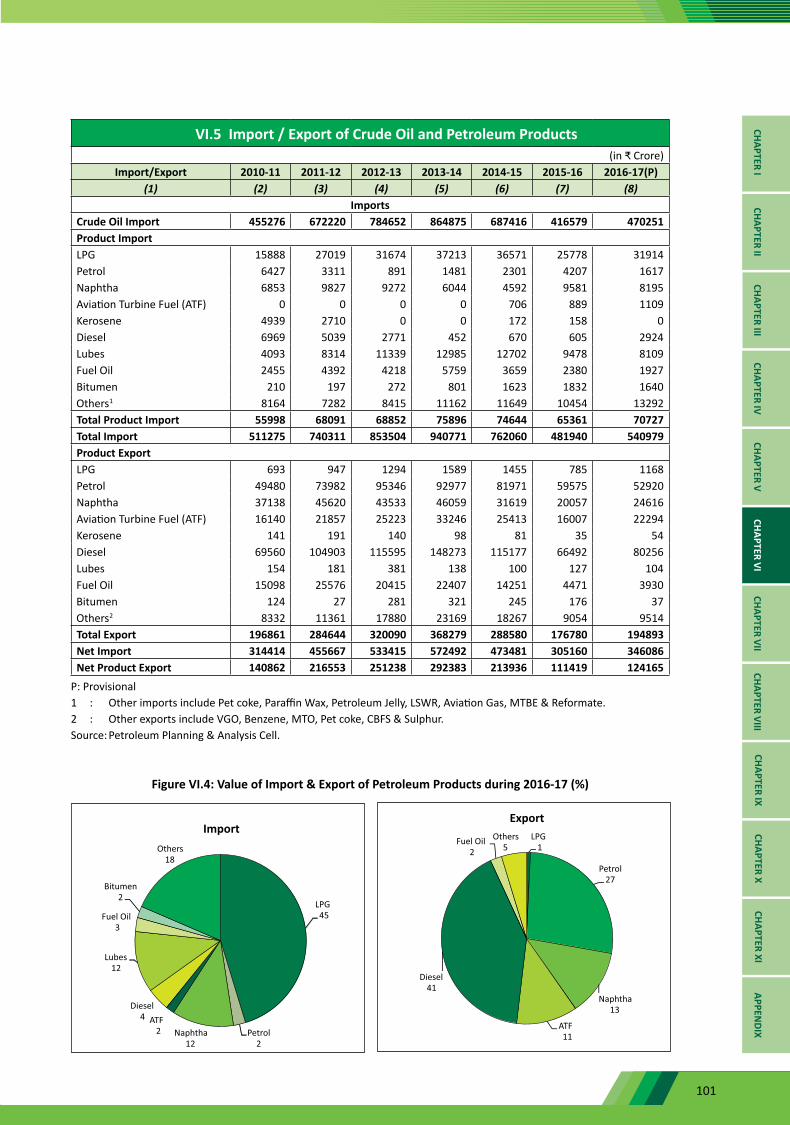
101
VI.5 Import / Export of Crude Oil and Petroleum Products(in ₹ Crore)
Import/Export 2010-11 2011-12 2012-13 2013-14 2014-15 2015-16 2016-17(P)(1) (2) (3) (4) (5) (6) (7) (8)
ImportsCrude Oil Import 455276 672220 784652 864875 687416 416579 470251Product ImportLPG 15888 27019 31674 37213 36571 25778 31914Petrol 6427 3311 891 1481 2301 4207 1617Naphtha 6853 9827 9272 6044 4592 9581 8195Aviation Turbine Fuel (ATF) 0 0 0 0 706 889 1109Kerosene 4939 2710 0 0 172 158 0Diesel 6969 5039 2771 452 670 605 2924Lubes 4093 8314 11339 12985 12702 9478 8109Fuel Oil 2455 4392 4218 5759 3659 2380 1927Bitumen 210 197 272 801 1623 1832 1640Others1 8164 7282 8415 11162 11649 10454 13292Total Product Import 55998 68091 68852 75896 74644 65361 70727Total Import 511275 740311 853504 940771 762060 481940 540979Product ExportLPG 693 947 1294 1589 1455 785 1168Petrol 49480 73982 95346 92977 81971 59575 52920Naphtha 37138 45620 43533 46059 31619 20057 24616Aviation Turbine Fuel (ATF) 16140 21857 25223 33246 25413 16007 22294Kerosene 141 191 140 98 81 35 54Diesel 69560 104903 115595 148273 115177 66492 80256Lubes 154 181 381 138 100 127 104Fuel Oil 15098 25576 20415 22407 14251 4471 3930Bitumen 124 27 281 321 245 176 37Others2 8332 11361 17880 23169 18267 9054 9514Total Export 196861 284644 320090 368279 288580 176780 194893Net Import 314414 455667 533415 572492 473481 305160 346086Net Product Export 140862 216553 251238 292383 213936 111419 124165
P: Provisional 1 : Other imports include Pet coke, Paraffin Wax, Petroleum Jelly, LSWR, Aviation Gas, MTBE & Reformate.2 : Other exports include VGO, Benzene, MTO, Pet coke, CBFS & Sulphur. Source: Petroleum Planning & Analysis Cell.
Figure VI.4: Value of Import & Export of Petroleum Products during 2016-17 (%)
CHAPTER ICHAPTER II
CHAPTER IIICHAPTER IV
CHAPTER VCHAPTER VI
CHAPTER VIICHAPTER VIII
CHAPTER IXCHAPTER X
CHAPTER XIAPPEN
DIX
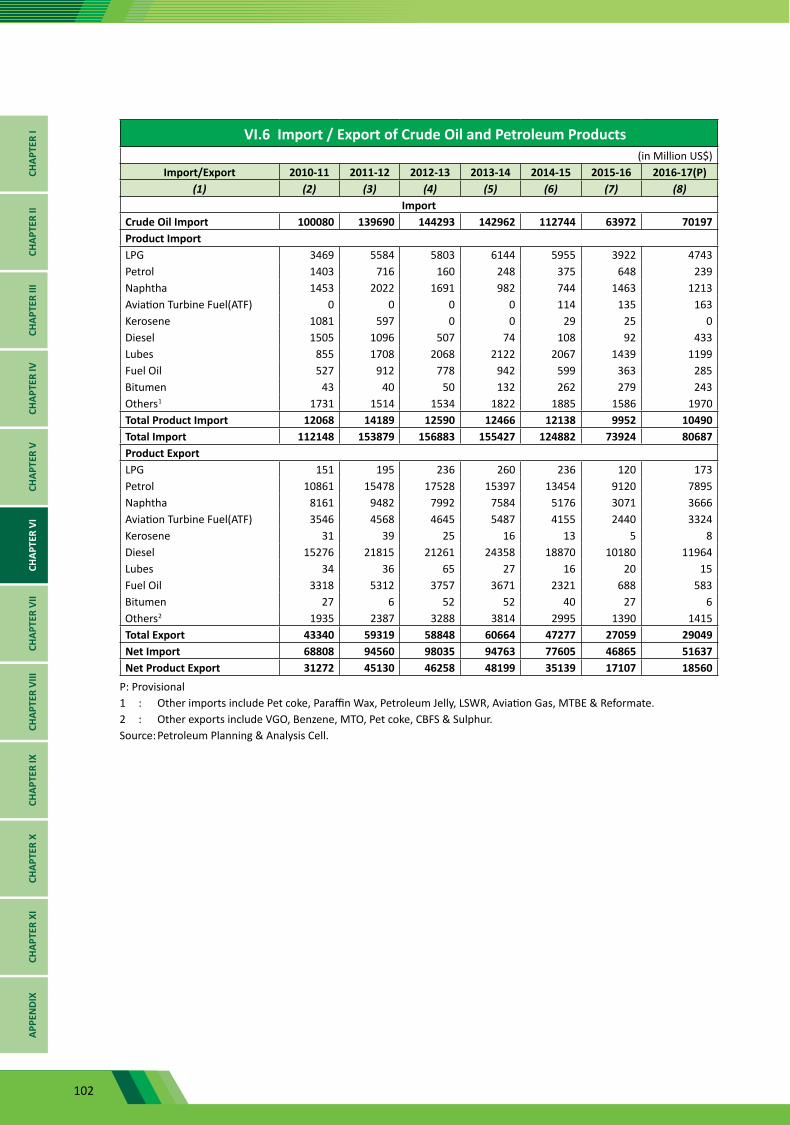
102
CHAP
TER
ICH
APTE
R II
CHAP
TER
IIICH
APTE
R IV
CHAP
TER
VCH
APTE
R VI
CHAP
TER
VII
CHAP
TER
VIII
CHAP
TER
IXCH
APTE
R X
CHAP
TER
XIAP
PEN
DIX
VI.6 Import / Export of Crude Oil and Petroleum Products(in Million US$)
Import/Export 2010-11 2011-12 2012-13 2013-14 2014-15 2015-16 2016-17(P)(1) (2) (3) (4) (5) (6) (7) (8)
ImportCrude Oil Import 100080 139690 144293 142962 112744 63972 70197Product ImportLPG 3469 5584 5803 6144 5955 3922 4743Petrol 1403 716 160 248 375 648 239Naphtha 1453 2022 1691 982 744 1463 1213Aviation Turbine Fuel(ATF) 0 0 0 0 114 135 163Kerosene 1081 597 0 0 29 25 0Diesel 1505 1096 507 74 108 92 433Lubes 855 1708 2068 2122 2067 1439 1199Fuel Oil 527 912 778 942 599 363 285Bitumen 43 40 50 132 262 279 243Others1 1731 1514 1534 1822 1885 1586 1970Total Product Import 12068 14189 12590 12466 12138 9952 10490Total Import 112148 153879 156883 155427 124882 73924 80687Product ExportLPG 151 195 236 260 236 120 173Petrol 10861 15478 17528 15397 13454 9120 7895Naphtha 8161 9482 7992 7584 5176 3071 3666Aviation Turbine Fuel(ATF) 3546 4568 4645 5487 4155 2440 3324Kerosene 31 39 25 16 13 5 8Diesel 15276 21815 21261 24358 18870 10180 11964Lubes 34 36 65 27 16 20 15Fuel Oil 3318 5312 3757 3671 2321 688 583Bitumen 27 6 52 52 40 27 6Others2 1935 2387 3288 3814 2995 1390 1415Total Export 43340 59319 58848 60664 47277 27059 29049Net Import 68808 94560 98035 94763 77605 46865 51637Net Product Export 31272 45130 46258 48199 35139 17107 18560
P: Provisional 1 : Other imports include Pet coke, Paraffin Wax, Petroleum Jelly, LSWR, Aviation Gas, MTBE & Reformate.2 : Other exports include VGO, Benzene, MTO, Pet coke, CBFS & Sulphur. Source: Petroleum Planning & Analysis Cell.

103
VI.7
Tre
nds i
n In
dia’
s ove
rall
Trad
e ba
lanc
e an
d Tr
ade
bala
nce
with
OPE
C Co
untr
ies
(in ₹
Cro
re)
Ye
ar
Indi
a's O
vera
ll Tr
ade
Indi
a's T
rade
with
OPE
C Co
untr
ies
% o
f Ind
ia's
trad
e w
ith
OPE
C to
Indi
a's t
otal
tr
ade
Expo
rts
Impo
rts
Trad
e Ba
lanc
e%
var
iatio
n ov
er
prec
edin
g ye
arEx
port
sIm
port
sTr
ade
Bala
nce
% v
aria
tion
over
pr
eced
ing
year
Expo
rts
Impo
rts
Expo
rts
Impo
rts
Expo
rts
Impo
rts
(1)
(2)
(3)
(4)
(5)
(6)
(7)
(8)
(9)
(10)
(11)
(12)
(13)
2010
-11
1142
922
1683
467
-540
545
35.2
23.4
2437
6956
5285
-321
516
36.5
29.0
21.3
33.6
2011
-12
1465
959
2345
463
-879
504
28.3
39.3
2782
9183
2230
-553
939
14.2
47.2
19.0
35.5
2012
-13
1634
318
2669
162
-103
4844
11
.513
.834
2219
1021
645
-679
426
23.0
22.8
20.9
38.3
2013
-14
1905
011
2715
434
-810
423
16.6
1.7
3554
0098
2126
-626
726
3.9
-3.9
18.7
36.2
2014
-15
1896
348
2737
087
-840
738
-0.5
0.8
3444
7983
6138
-491
660
-3.1
-14.
918
.230
.520
15-1
617
1637
824
9029
8-7
7392
0-9
.5-9
.030
2488
5879
77-2
8548
9-1
2.2
-29.
717
.623
.620
16-1
7 (P
)18
5234
025
7742
2-7
2508
27.
93.
532
7977
7108
06-3
8282
98.
420
.917
.727
.6P:
Pro
visio
nal
Sour
ce:
Min
istry
of C
omm
erce
& In
dust
ry
CHAPTER ICHAPTER II
CHAPTER IIICHAPTER IV
CHAPTER VCHAPTER VI
CHAPTER VIICHAPTER VIII
CHAPTER IXCHAPTER X
CHAPTER XIAPPEN
DIX
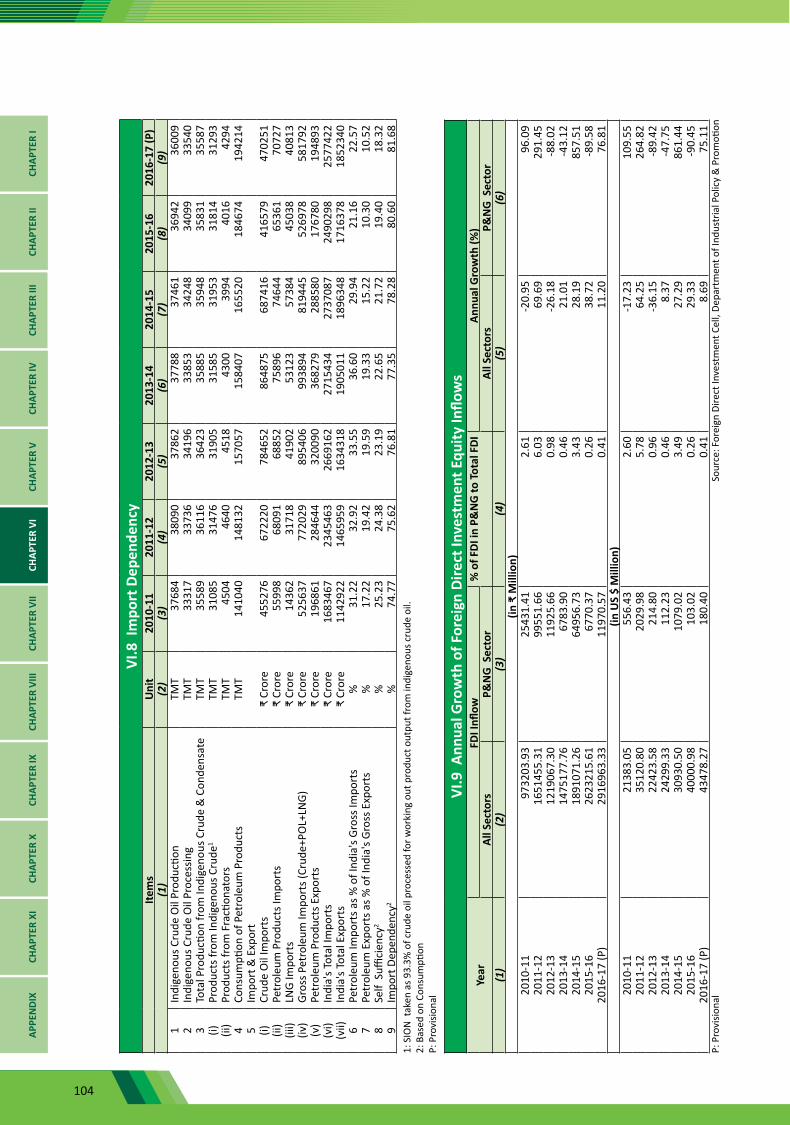
104
CHAP
TER
ICH
APTE
R II
CHAP
TER
IIICH
APTE
R IV
CHAP
TER
VCH
APTE
R VI
CHAP
TER
VII
CHAP
TER
VIII
CHAP
TER
IXCH
APTE
R X
CHAP
TER
XIAP
PEN
DIX
VI.8
Im
port
Dep
ende
ncy
Item
sU
nit
2010
-11
2011
-12
2012
-13
2013
-14
2014
-15
2015
-16
2016
-17
(P)
(1)
(2)
(3)
(4)
(5)
(6)
(7)
(8)
(9)
1 In
dige
nous
Cru
de O
il Pr
oduc
tion
TMT
3768
438
090
3786
237
788
3746
136
942
3600
92
Indi
geno
us C
rude
Oil
Proc
essin
gTM
T33
317
3373
634
196
3385
334
248
3409
933
540
3 To
tal P
rodu
ction
from
Indi
geno
us C
rude
& C
onde
nsat
eTM
T35
589
3611
636
423
3588
535
948
3583
135
587
(i)Pr
oduc
ts fr
om In
dige
nous
Cru
de1
TMT
3108
531
476
3190
531
585
3195
331
814
3129
3(ii
)Pr
oduc
ts fr
om F
racti
onat
ors
TMT
4504
4640
4518
4300
3994
4016
4294
4 Co
nsum
ption
of P
etro
leum
Pro
duct
sTM
T14
1040
1481
3215
7057
1584
0716
5520
1846
7419
4214
5 Im
port
& E
xpor
t(i)
Crud
e O
il Im
port
s₹
Cror
e45
5276
6722
2078
4652
8648
7568
7416
4165
7947
0251
(ii)
Petr
oleu
m P
rodu
cts I
mpo
rts
₹ Cr
ore
5599
868
091
6885
275
896
7464
465
361
7072
7(ii
i)LN
G Im
port
s₹
Cror
e14
362
3171
841
902
5312
357
384
4503
840
813
(iv)
Gros
s Pet
role
um Im
port
s (Cr
ude+
POL+
LNG)
₹ Cr
ore
5256
3777
2029
8954
0699
3894
8194
4552
6978
5817
92(v
)Pe
trol
eum
Pro
duct
s Exp
orts
₹ Cr
ore
1968
6128
4644
3200
9036
8279
2885
8017
6780
1948
93(v
i)In
dia'
s Tot
al Im
port
s₹
Cror
e16
8346
723
4546
326
6916
227
1543
427
3708
724
9029
825
7742
2(v
ii)In
dia'
s Tot
al E
xpor
ts₹
Cror
e11
4292
214
6595
916
3431
819
0501
118
9634
817
1637
818
5234
06
Petr
oleu
m Im
port
s as %
of I
ndia
's Gr
oss I
mpo
rts
%31
.22
32.9
233
.55
36.6
029
.94
21.1
622
.57
7 Pe
trol
eum
Exp
orts
as %
of I
ndia
's Gr
oss E
xpor
ts%
17.2
219
.42
19.5
919
.33
15.2
210
.30
10.5
28
Self
Suffi
cien
cy2
%25
.23
24.3
823
.19
22.6
521
.72
19.4
018
.32
9 Im
port
Dep
ende
ncy2
%74
.77
75.6
276
.81
77.3
578
.28
80.6
081
.68
1: S
ION
tak
en a
s 93.
3% o
f cru
de o
il pr
oces
sed
for w
orki
ng o
ut p
rodu
ct o
utpu
t fro
m in
dige
nous
cru
de o
il.2:
Bas
ed o
n Co
nsum
ption
P: P
rovi
siona
l
VI.9
Ann
ual G
row
th o
f For
eign
Dire
ct In
vest
men
t Equ
ity In
flow
sYe
ar
F
DI In
flow
%
of F
DI in
P&
NG
to T
otal
FDI
An
nual
Gro
wth
(%)
All S
ecto
rs
P&N
G S
ecto
rAl
l Sec
tors
P&
NG
Sec
tor
(1)
(2)
(3)
(4)
(5)
(6)
(in ₹
Mill
ion)
2010
-11
9732
03.9
325
431.
412.
61-2
0.95
96.0
920
11-1
216
5145
5.31
9955
1.66
6.03
69.6
929
1.45
2012
-13
1219
067.
3011
925.
660.
98-2
6.18
-88.
0220
13-1
414
7517
7.76
6783
.90
0.46
21.0
1-4
3.12
2014
-15
1891
071.
2664
956.
733.
4328
.19
857.
5120
15-1
626
2321
5.61
6770
.37
0.26
38.7
2-8
9.58
2016
-17
(P)
2916
963.
3311
970.
570.
4111
.20
76.8
1(in
US
$ M
illio
n)20
10-1
121
383.
0555
6.43
2.60
-17.
2310
9.55
2011
-12
3512
0.80
2029
.98
5.78
64.2
526
4.82
2012
-13
2242
3.58
214.
800.
96-3
6.15
-89.
4220
13-1
424
299.
3311
2.23
0.46
8.37
-47.
7520
14-1
530
930.
5010
79.0
23.
4927
.29
861.
4420
15-1
640
000.
9810
3.02
0.26
29.3
3-9
0.45
2016
-17
(P)
4347
8.27
180.
400.
418.
6975
.11
P: P
rovi
siona
l So
urce
: For
eign
Dire
ct In
vest
men
t Cel
l, De
part
men
t of I
ndus
tria
l Pol
icy
& P
rom
otion
105
CHAPTER ICHAPTER II
CHAPTER IIICHAPTER IV
CHAPTER VCHAPTER VI
CHAPTER VIICHAPTER VIII
CHAPTER IXCHAPTER X
CHAPTER XIAPPEN
DIX
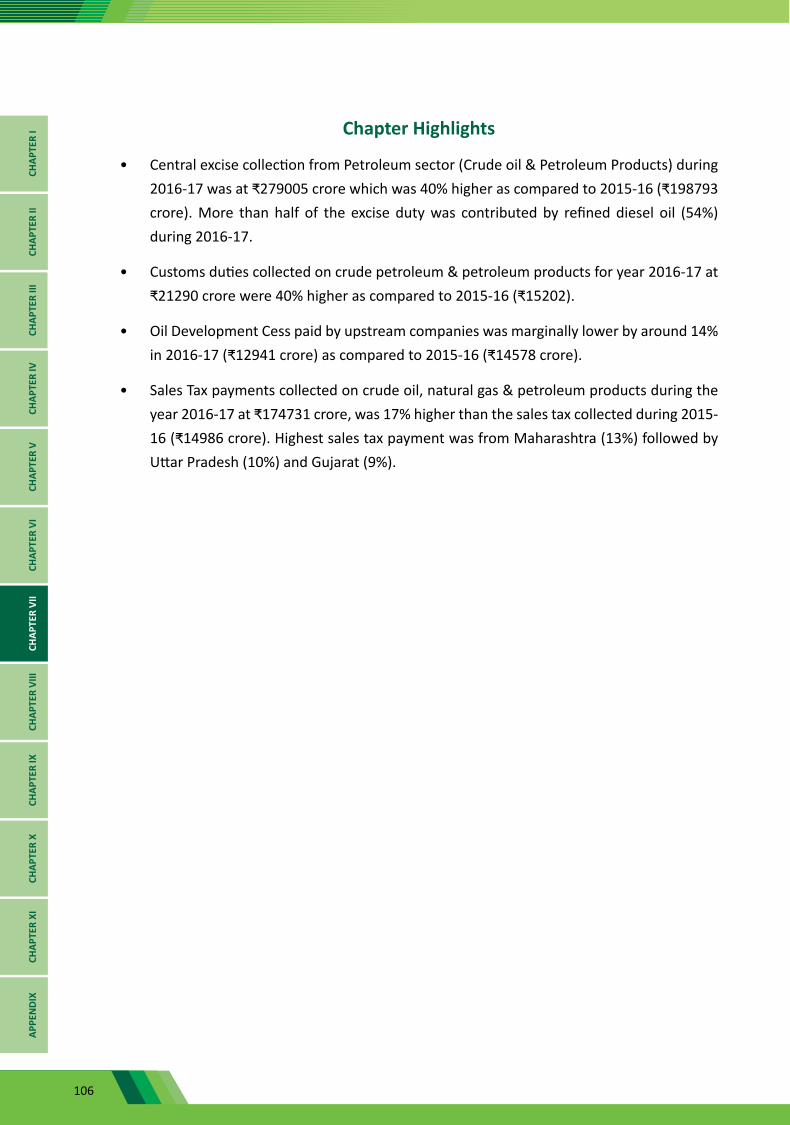
106
Chapter Highlights
• Central excise collection from Petroleum sector (Crude oil & Petroleum Products) during 2016-17 was at ₹279005 crore which was 40% higher as compared to 2015-16 (₹198793 crore). More than half of the excise duty was contributed by refined diesel oil (54%) during 2016-17.
• Customs duties collected on crude petroleum & petroleum products for year 2016-17 at ₹21290 crore were 40% higher as compared to 2015-16 (₹15202).
• Oil Development Cess paid by upstream companies was marginally lower by around 14% in 2016-17 (₹12941 crore) as compared to 2015-16 (₹14578 crore).
• Sales Tax payments collected on crude oil, natural gas & petroleum products during the year 2016-17 at ₹174731 crore, was 17% higher than the sales tax collected during 2015-16 (₹14986 crore). Highest sales tax payment was from Maharashtra (13%) followed by Uttar Pradesh (10%) and Gujarat (9%).
CHAP
TER
ICH
APTE
R II
CHAP
TER
IIICH
APTE
R IV
CHAP
TER
VCH
APTE
R VI
CHAP
TER
VII
CHAP
TER
VIII
CHAP
TER
IXCH
APTE
R X
CHAP
TER
XIAP
PEN
DIX
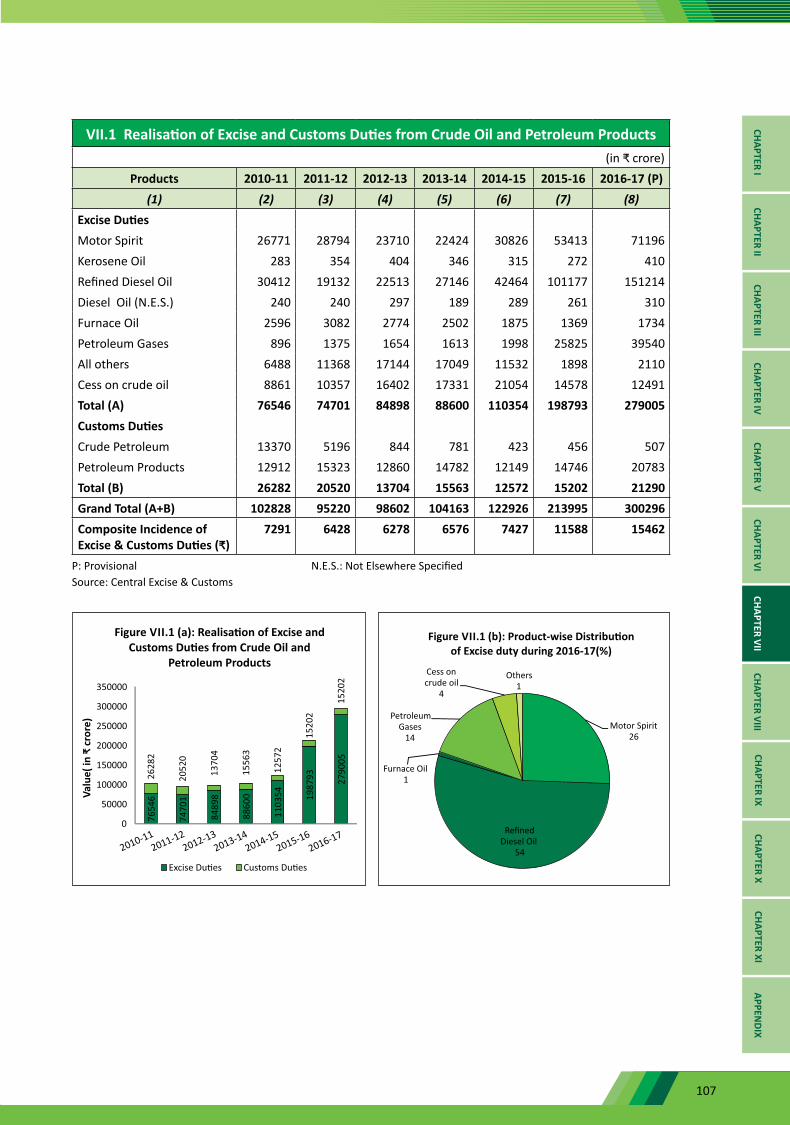
107
VII.1 Realisation of Excise and Customs Duties from Crude Oil and Petroleum Products(in ₹ crore)
Products 2010-11 2011-12 2012-13 2013-14 2014-15 2015-16 2016-17 (P)(1) (2) (3) (4) (5) (6) (7) (8)
Excise DutiesMotor Spirit 26771 28794 23710 22424 30826 53413 71196Kerosene Oil 283 354 404 346 315 272 410Refined Diesel Oil 30412 19132 22513 27146 42464 101177 151214Diesel Oil (N.E.S.) 240 240 297 189 289 261 310Furnace Oil 2596 3082 2774 2502 1875 1369 1734Petroleum Gases 896 1375 1654 1613 1998 25825 39540All others 6488 11368 17144 17049 11532 1898 2110Cess on crude oil 8861 10357 16402 17331 21054 14578 12491Total (A) 76546 74701 84898 88600 110354 198793 279005Customs DutiesCrude Petroleum 13370 5196 844 781 423 456 507Petroleum Products 12912 15323 12860 14782 12149 14746 20783Total (B) 26282 20520 13704 15563 12572 15202 21290Grand Total (A+B) 102828 95220 98602 104163 122926 213995 300296Composite Incidence of Excise & Customs Duties (₹)
7291 6428 6278 6576 7427 11588 15462
P: Provisional N.E.S.: Not Elsewhere SpecifiedSource: Central Excise & Customs
CHAPTER ICHAPTER II
CHAPTER IIICHAPTER IV
CHAPTER VCHAPTER VI
CHAPTER VIICHAPTER VIII
CHAPTER IXCHAPTER X
CHAPTER XIAPPEN
DIX
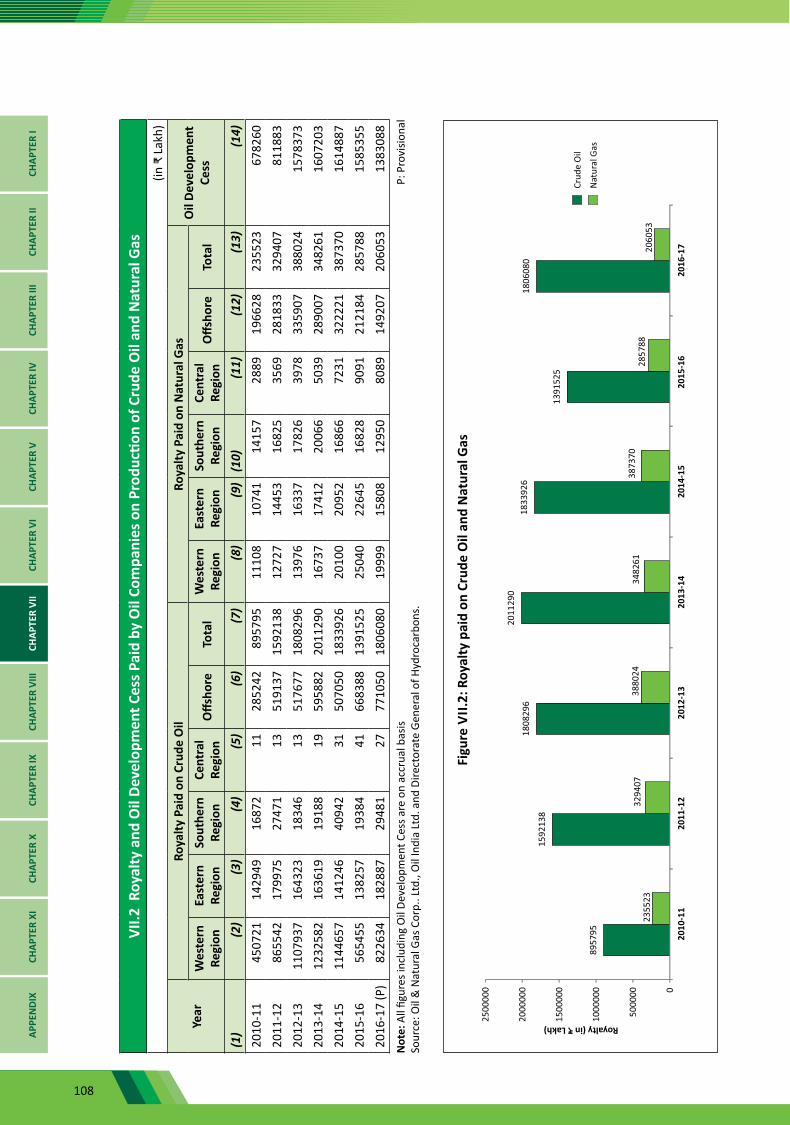
108
VII.2
Roy
alty
and
Oil
Deve
lopm
ent C
ess P
aid
by O
il Co
mpa
nies
on
Prod
uctio
n of
Cru
de O
il an
d N
atur
al G
as(in
₹ L
akh)
Year
Roya
lty P
aid
on C
rude
Oil
Roya
lty P
aid
on N
atur
al G
asO
il De
velo
pmen
t Ce
ssW
este
rn
Regi
onEa
ster
n
Regi
onSo
uthe
rn
Regi
onCe
ntra
l Re
gion
Offs
hore
Tota
lW
este
rn
Regi
onEa
ster
n
Regi
onSo
uthe
rn
Regi
onCe
ntra
l Re
gion
Offs
hore
Tota
l
(1)
(2)
(3)
(4)
(5)
(6)
(7)
(8)
(9)
(10)
(11)
(12)
(13)
(14)
2010
-11
4507
2114
2949
1687
211
2852
4289
5795
1110
810
741
1415
728
8919
6628
2355
2367
8260
2011
-12
8655
4217
9975
2747
113
5191
3715
9213
812
727
1445
316
825
3569
2818
3332
9407
8118
8320
12-1
311
0793
716
4323
1834
613
5176
7718
0829
613
976
1633
717
826
3978
3359
0738
8024
1578
373
2013
-14
1232
582
1636
1919
188
1959
5882
2011
290
1673
717
412
2006
650
3928
9007
3482
6116
0720
320
14-1
511
4465
714
1246
4094
231
5070
5018
3392
620
100
2095
216
866
7231
3222
2138
7370
1614
887
2015
-16
5654
5513
8257
1938
441
6683
8813
9152
525
040
2264
516
828
9091
2121
8428
5788
1585
355
2016
-17
(P)
8226
3418
2887
2948
127
7710
5018
0608
019
999
1580
812
950
8089
1492
0720
6053
1383
088
Not
e: A
ll fig
ures
incl
udin
g O
il De
velo
pmen
t Ces
s are
on
accr
ual b
asis
P:
Pro
visio
nal
Sour
ce: O
il &
Nat
ural
Gas
Cor
p.. L
td.,
Oil
Indi
a Lt
d. a
nd D
irect
orat
e Ge
nera
l of H
ydro
carb
ons.
CHAP
TER
ICH
APTE
R II
CHAP
TER
IIICH
APTE
R IV
CHAP
TER
VCH
APTE
R VI
CHAP
TER
VII
CHAP
TER
VIII
CHAP
TER
IXCH
APTE
R X
CHAP
TER
XIAP
PEN
DIX
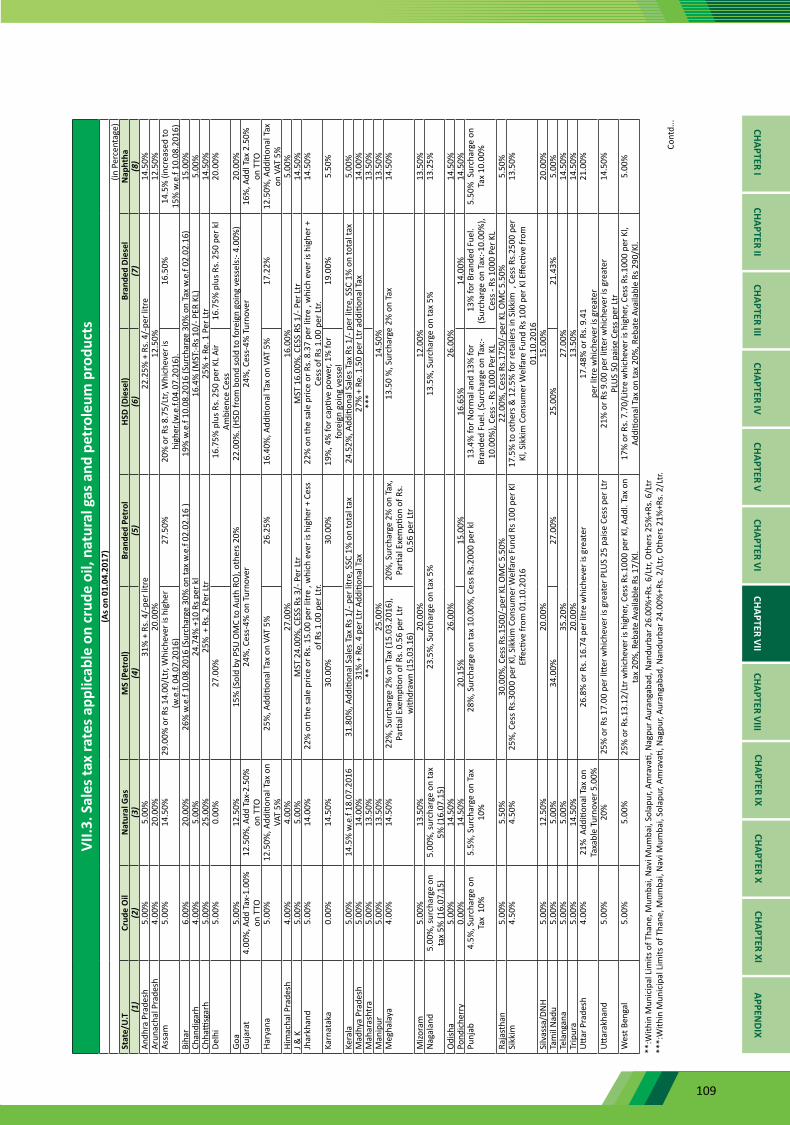
109
VII.3
. Sal
es ta
x ra
tes a
pplic
able
on
crud
e oi
l, na
tura
l gas
and
pet
role
um p
rodu
cts
(As o
n 01
.04.
2017
)(in
Per
cent
age)
Stat
e/U
.TCr
ude
Oil
Nat
ural
Gas
MS
(Pet
rol)
Bran
ded
Petr
olHS
D (D
iese
l)Br
ande
d Di
esel
Nap
htha
(1)
(2)
(3)
(4)
(5)
(6)
(7)
(8)
Andh
ra P
rade
sh5.
00%
5.00
%31
% +
Rs.
4/-
per l
itre
22.2
5% +
Rs.
4/-
per l
itre
14.5
0%Ar
unac
hal P
rade
sh4.
00%
20.0
0%20
.00%
12.5
0%12
.50%
Assa
m5.
00%
14.5
0%29
.00%
or R
s 14.
00/L
tr, W
hich
ever
is h
ighe
r (w
.e.f.
04.
07.2
016)
27.5
0%20
% o
r Rs 8
.75/
Ltr,
Whi
chev
er is
hi
gher
.(w.e
.f.04
.07.
2016
).16
.50%
14.5
% (i
ncre
ased
to
15%
w.e
.f 10
.08.
2016
)Bi
har
6.00
%20
.00%
26%
w.e
.f 10
.08.
2016
(Sur
char
ge 3
0% o
n ta
x w
.e.f
02.0
2.16
)19
% w
.e.f
10.0
8.20
16 (S
urch
arge
30%
on
Tax
w.e
.f 02
.02.
16)
15.0
0%Ch
andi
garh
4.00
%5.
00%
24.7
4% +
10 R
s per
kl
16.4
% (M
ST:-R
s 10/
- PER
KL)
5.00
%Ch
hatti
sgar
h5.
00%
25.0
0%25
% +
Rs.
2 P
er Lt
r25
% +
Re.
1 P
er Lt
r14
.50%
Delh
i5.
00%
0.00
%27
.00%
16.7
5% p
lus R
s. 2
50 p
er K
L Ai
r Am
bien
ce C
ess
16.7
5% p
lus R
s. 2
50 p
er k
l20
.00%
Goa
5.00
%12
.50%
15%
(Sol
d by
PSU
OM
C to
Aut
h RO
), ot
hers
20%
22.0
0%. (
HSD
from
bon
d so
ld to
fore
ign
goin
g ve
ssel
s:- 4
.00%
)20
.00%
Guja
rat
4.00
%, A
dd T
ax-1
.00%
on
TTO
12.5
0%, A
dd T
ax-2
.50%
on
TTO
24%
, Ces
s-4%
on
Turn
over
24%
, Ces
s-4%
Tur
nove
r16
%, A
ddl T
ax 2
.50%
on
TTO
Hary
ana
5.00
%12
.50%
, Add
ition
al T
ax o
n VA
T 5%
25%
, Add
ition
al T
ax o
n VA
T 5%
26.2
5%16
.40%
, Add
ition
al T
ax o
n VA
T 5%
17
.22%
12.5
0%, A
dditi
onal
Tax
on
VAT
5%
Him
acha
l Pra
desh
4.00
%4.
00%
27.0
0%16
.00%
5.00
%J &
K5.
00%
5.00
%M
ST 2
4.00
%, C
ESS
Rs 3
/- P
er Lt
rM
ST 1
6.00
%, C
ESS
RS 1
/- P
er Lt
r14
.50%
Jhar
khan
d5.
00%
14.0
0% 2
2% o
n th
e sa
le p
rice
or R
s. 1
5.00
per
litr
e , w
hich
eve
r is h
ighe
r + C
ess
of R
s 1.0
0 pe
r Ltr.
22%
on
the
sale
pric
e or
Rs.
8.3
7 pe
r litr
e , w
hich
eve
r is h
ighe
r +
Cess
of R
s 1.0
0 pe
r Ltr.
14.5
0%
Karn
atak
a0.
00%
14.5
0%30
.00%
30.0
0%19
%, 4
% fo
r cap
tive
pow
er, 1
% fo
r fo
reig
n go
ing
vess
el19
.00%
5.50
%
Kera
la
5.00
%14
.5%
w.e
.f 18
.07.
2016
31.8
0%, A
dditi
onal
Sal
es T
ax R
s 1/-
per
litr
e, S
SC 1
% o
n to
tal t
ax24
.52%
, Add
ition
al S
ales
Tax
Rs 1
/- p
er li
tre,
SSC
1%
on
tota
l tax
5.00
%M
adhy
a Pr
ades
h5.
00%
14.0
0%31
% +
Re.
4 p
er Lt
r Add
ition
al T
ax27
% +
Re.
1.5
0 pe
r Ltr
add
ition
al T
ax14
.00%
Mah
aras
htra
5.00
%13
.50%
****
*13
.50%
Man
ipur
5.00
%13
.50%
25.0
0%14
.50%
13.5
0%M
egha
laya
4.00
%14
.50%
22%
, Sur
char
ge 2
% o
n Ta
x (1
5.03
.201
6),
Parti
al E
xem
ption
of R
s. 0
.56
per L
tr
with
draw
n (1
5.03
.16)
20%
, Sur
char
ge 2
% o
n Ta
x,
Parti
al E
xem
ption
of R
s.
0.56
per
Ltr
13.5
0 %
, Sur
char
ge 2
% o
n Ta
x14
.50%
Mizo
ram
5.00
%13
.50%
20.0
0%12
.00%
13.5
0%N
agal
and
5.00
%, s
urch
arge
on
tax
5% (1
6.07
.15)
5.00
%, s
urch
arge
on
tax
5% (1
6.07
.15)
23.5
%, S
urch
arge
on
tax
5%
13.5
%, S
urch
arge
on
tax
5%
13.2
5%
Odi
sha
5.00
%14
.50%
26.0
0%26
.00%
14.5
0%Po
ndic
herr
y0.
00%
14.5
0%20
.15%
15.0
0%16
.65%
14.0
0%14
.50%
Punj
ab4.
5%, S
urch
arge
on
Tax
10%
5.5%
, Sur
char
ge o
n Ta
x
10%
28%
, Sur
char
ge o
n ta
x 10
.00%
, Ces
s Rs.
2000
per
kl
13.4
% fo
r Nor
mal
and
13%
for
Bran
ded
Fuel
. (Su
rcha
rge
on T
ax:-
10.0
0%),
Cess
- Rs
100
0 Pe
r KL
13%
for B
rand
ed F
uel.
(Sur
char
ge o
n Ta
x:-1
0.00
%),
Cess
- Rs
100
0 Pe
r KL
5.50
% S
urch
arge
on
Tax
10.0
0%
Raja
stha
n5.
00%
5.50
%30
.00%
, Ces
s Rs.
1500
/-pe
r KL
OM
C 5.
50%
22
.00%
, Ces
s Rs.
1750
/-pe
r KL
OM
C 5.
50%
5.50
%Si
kkim
4.50
%4.
50%
25%
, Ces
s Rs.
3000
per
Kl,
Sikk
im C
onsu
mer
Wel
fare
Fun
d Rs
100
per
Kl
Effec
tive
from
01.
10.2
016
17.5
% to
oth
ers &
12.
5% fo
r ret
aile
rs in
Sik
kim
, C
ess R
s.25
00 p
er
Kl, S
ikki
m C
onsu
mer
Wel
fare
Fun
d Rs
100
per
Kl E
ffecti
ve fr
om
01.1
0.20
16
13.5
0%
Silv
assa
/DN
H5.
00%
12.5
0%20
.00%
15.0
0%20
.00%
Tam
il N
adu
5.00
%5.
00%
34.0
0%27
.00%
25.0
0%21
.43%
5.00
%Te
lang
ana
5.00
%5.
00%
35.2
0%27
.00%
14.5
0%Tr
ipur
a5.
00%
14.5
0%20
.00%
13.5
0%14
.50%
Utta
r Pra
desh
4.00
%21
% A
dditi
onal
Tax
on
Taxa
ble
Turn
over
5.0
0%26
.8%
or R
s. 1
6.74
per
litr
e w
hich
ever
is g
reat
er17
.48%
or R
s. 9
.41
per l
itre
whi
chev
er is
gre
ater
21.0
0%
Utta
rakh
and
5.00
%20
%
25%
or R
s 17.
00 p
er li
tter w
hich
ever
is g
reat
er P
LUS
25 p
aise
Ces
s per
Ltr
21%
or R
s 9.0
0 pe
r litt
er w
hich
ever
is g
reat
er
PLU
S 50
pai
se C
ess p
er Lt
r14
.50%
Wes
t Ben
gal
5.00
%5.
00%
25%
or R
s.13
.12/
Ltr w
hich
ever
is h
ighe
r, Ce
ss R
s.10
00 p
er K
l, Ad
dl. T
ax o
n ta
x 20
%, R
ebat
e Av
aila
ble
Rs 1
7/Kl
. 17
% o
r Rs.
7.7
0/Li
tre
whi
chev
er is
hig
her,
Cess
Rs.
1000
per
Kl,
Addi
tiona
l Tax
on
tax
20%
, Reb
ate
Avai
labl
e Rs
290
/Kl.
5.
00%
**:W
ithin
Mun
icip
al L
imits
of T
hane
, Mum
bai,
Nav
i Mum
bai,
Sola
pur,
Amra
vati,
Nag
pur A
uran
gaba
d, N
andu
rbar
26.
00%
+Rs.
6/L
tr, O
ther
s 25%
+Rs.
6/L
tr
**
*:W
ithin
Mun
icip
al L
imits
of T
hane
, Mum
bai,
Nav
i Mum
bai,
Sola
pur,
Amra
vati,
Nag
pur,
Aura
ngab
ad, N
andu
rbar
24.
00%
+Rs.
2/L
tr, O
ther
s 21%
+Rs.
2/L
tr.
Cont
d... CHAPTER I
CHAPTER IICHAPTER III
CHAPTER IVCHAPTER V
CHAPTER VICHAPTER VII
CHAPTER VIIICHAPTER IX
CHAPTER XCHAPTER XI
APPENDIX
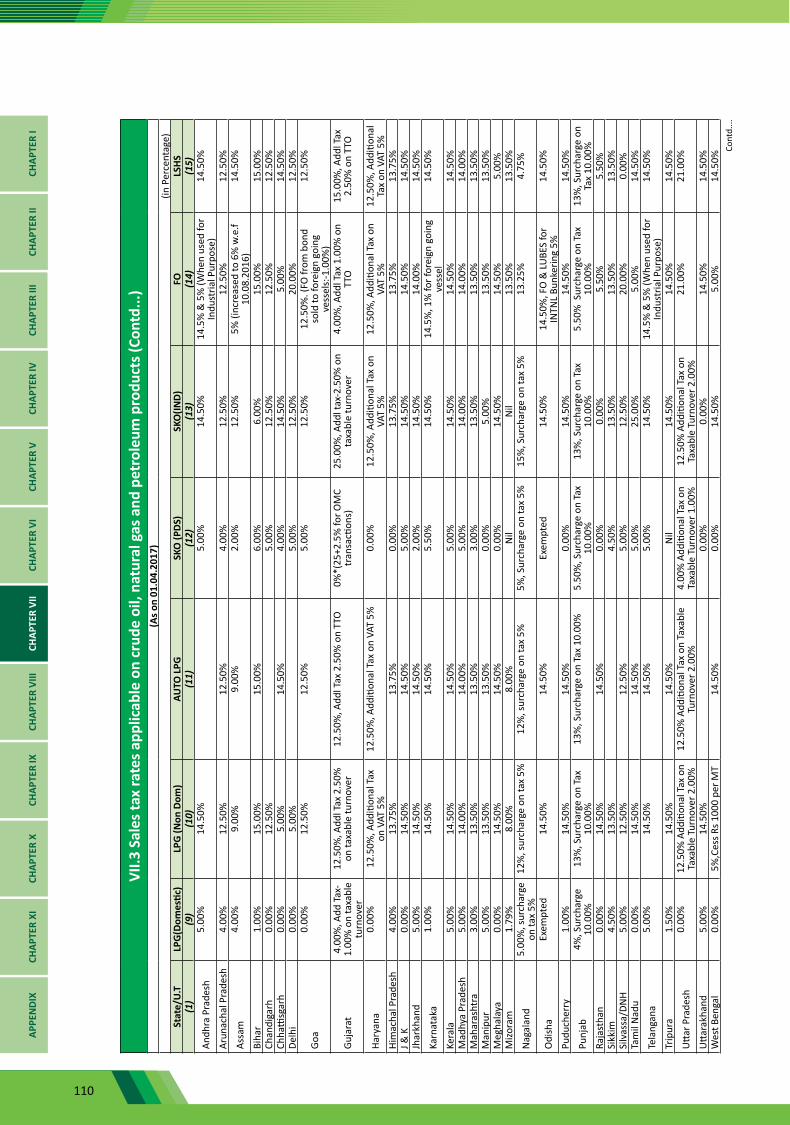
110
VII.3
Sal
es ta
x ra
tes a
pplic
able
on
crud
e oi
l, na
tura
l gas
and
pet
role
um p
rodu
cts (
Cont
d...)
(As o
n 01
.04.
2017
)(in
Per
cent
age)
Stat
e/U
.TLP
G(D
omes
tic)
LPG
(Non
Dom
)AU
TO L
PGSK
O (P
DS)
SKO
(IND)
FOLS
HS(1
)(9
)(1
0)(1
1)(1
2)(1
3)(1
4)(1
5)
Andh
ra P
rade
sh5.
00%
14.5
0%5.
00%
14.5
0%14
.5%
& 5
% (W
hen
used
for
Indu
stria
l Pur
pose
)14
.50%
Arun
acha
l Pra
desh
4.00
%12
.50%
12.5
0%4.
00%
12.5
0%12
.50%
12.5
0%
Assa
m4.
00%
9.00
%9.
00%
2.00
%12
.50%
5% (i
ncre
ased
to 6
% w
.e.f
10.0
8.20
16)
14.5
0%
Biha
r1.
00%
15.0
0%15
.00%
6.00
%6.
00%
15.0
0%15
.00%
Chan
diga
rh0.
00%
12.5
0%5.
00%
12.5
0%12
.50%
12.5
0%Ch
hatti
sgar
h0.
00%
5.00
%14
.50%
4.00
%14
.50%
5.00
%14
.50%
Delh
i0.
00%
5.00
%5.
00%
12.5
0%20
.00%
12.5
0%
Goa
0.00
%12
.50%
12.5
0%5.
00%
12.5
0%12
.50%
. (FO
from
bon
d so
ld to
fore
ign
goin
g ve
ssel
s:-1
.00%
)
12.5
0%
Guja
rat
4.00
%, A
dd T
ax-
1.00
% o
n ta
xabl
e tu
rnov
er
12.5
0%, A
ddl T
ax 2
.50%
on
taxa
ble
turn
over
12.5
0%, A
ddl T
ax 2
.50%
on
TTO
0%*(
25+2
.5%
for O
MC
tran
sacti
ons)
25.0
0%, A
ddl t
ax-2
.50%
on
taxa
ble
turn
over
4.00
%, A
ddl T
ax 1
.00%
on
TTO
15.0
0%, A
ddl T
ax
2.50
% o
n TT
O
Hary
ana
0.00
%12
.50%
, Add
ition
al T
ax
on V
AT 5
%12
.50%
, Add
ition
al T
ax o
n VA
T 5%
0.00
%12
.50%
, Add
ition
al T
ax o
n VA
T 5%
12.5
0%, A
dditi
onal
Tax
on
VAT
5%12
.50%
, Add
ition
al
Tax
on V
AT 5
%Hi
mac
hal P
rade
sh4.
00%
13.7
5%13
.75%
0.00
%13
.75%
13.7
5%13
.75%
J & K
0.00
%14
.50%
14.5
0%5.
00%
14.5
0%14
.50%
14.5
0%Jh
arkh
and
5.00
%14
.50%
14.5
0%2.
00%
14.5
0%14
.00%
14.5
0%
Karn
atak
a1.
00%
14.5
0%14
.50%
5.50
%14
.50%
14.5
%, 1
% fo
r for
eign
goi
ng
vess
el14
.50%
Kera
la
5.00
%14
.50%
14.5
0%5.
00%
14.5
0%14
.50%
14.5
0%M
adhy
a Pr
ades
h5.
00%
14.0
0%14
.00%
5.00
%14
.00%
14.0
0%14
.00%
Mah
aras
htra
3.00
%13
.50%
13.5
0%3.
00%
13.5
0%13
.50%
13.5
0%M
anip
ur5.
00%
13.5
0%13
.50%
0.00
%5.
00%
13.5
0%13
.50%
Meg
hala
ya0.
00%
14.5
0%14
.50%
0.00
%14
.50%
14.5
0%5.
00%
Mizo
ram
1.79
%8.
00%
8.00
%N
ilN
il13
.50%
13.5
0%
Nag
alan
d5.
00%
, sur
char
ge
on ta
x 5%
12
%, s
urch
arge
on
tax
5%
12%
, sur
char
ge o
n ta
x 5%
5%
, Sur
char
ge o
n ta
x 5%
15%
, Sur
char
ge o
n ta
x 5%
13.2
5%4.
75%
Odi
sha
Exem
pted
14.5
0%14
.50%
Exem
pted
14.5
0%14
.50%
, FO
& LU
BES
for
INTN
L Bu
nker
ing
5%14
.50%
Pudu
cher
ry1.
00%
14.5
0%14
.50%
0.00
%14
.50%
14.5
0%14
.50%
Punj
ab4%
, Sur
char
ge
10.0
0%13
%, S
urch
arge
on
Tax
10.0
0%13
%, S
urch
arge
on
Tax
10.0
0%5.
50%
, Sur
char
ge o
n Ta
x 10
.00%
13%
, Sur
char
ge o
n Ta
x 10
.00%
5.50
% S
urch
arge
on
Tax
10.0
0%13
%, S
urch
arge
on
Tax
10.0
0%Ra
jast
han
0.00
%14
.50%
14.5
0%0.
00%
0.00
%5.
50%
5.50
%Si
kkim
4.50
%13
.50%
4.50
%13
.50%
13.5
0%13
.50%
Silv
assa
/DN
H5.
00%
12.5
0%12
.50%
5.00
%12
.50%
20.0
0%0.
00%
Tam
il N
adu
0.00
%14
.50%
14.5
0%5.
00%
25.0
0%5.
00%
14.5
0%
Tela
ngan
a5.
00%
14.5
0%14
.50%
5.00
%14
.50%
14.5
% &
5%
(Whe
n us
ed fo
r In
dust
rial P
urpo
se)
14.5
0%
Trip
ura
1.50
%14
.50%
14.5
0%N
il14
.50%
14.5
0%14
.50%
Utta
r Pra
desh
0.00
%12
.50%
Add
ition
al T
ax o
n Ta
xabl
e Tu
rnov
er 2
.00%
12.5
0% A
dditi
onal
Tax
on
Taxa
ble
Turn
over
2.0
0%4.
00%
Add
ition
al T
ax o
n Ta
xabl
e Tu
rnov
er 1
.00%
12.5
0% A
dditi
onal
Tax
on
Taxa
ble
Turn
over
2.0
0%21
.00%
21.0
0%
Utta
rakh
and
5.00
%14
.50%
0.00
%0.
00%
14.5
0%14
.50%
Wes
t Ben
gal
0.00
%5%
,Ces
s Rs 1
000
per M
T14
.50%
0.00
%14
.50%
5.00
%14
.50%
Cont
d....
CHAP
TER
ICH
APTE
R II
CHAP
TER
IIICH
APTE
R IV
CHAP
TER
VCH
APTE
R VI
CHAP
TER
VII
CHAP
TER
VIII
CHAP
TER
IXCH
APTE
R X
CHAP
TER
XIAP
PEN
DIX
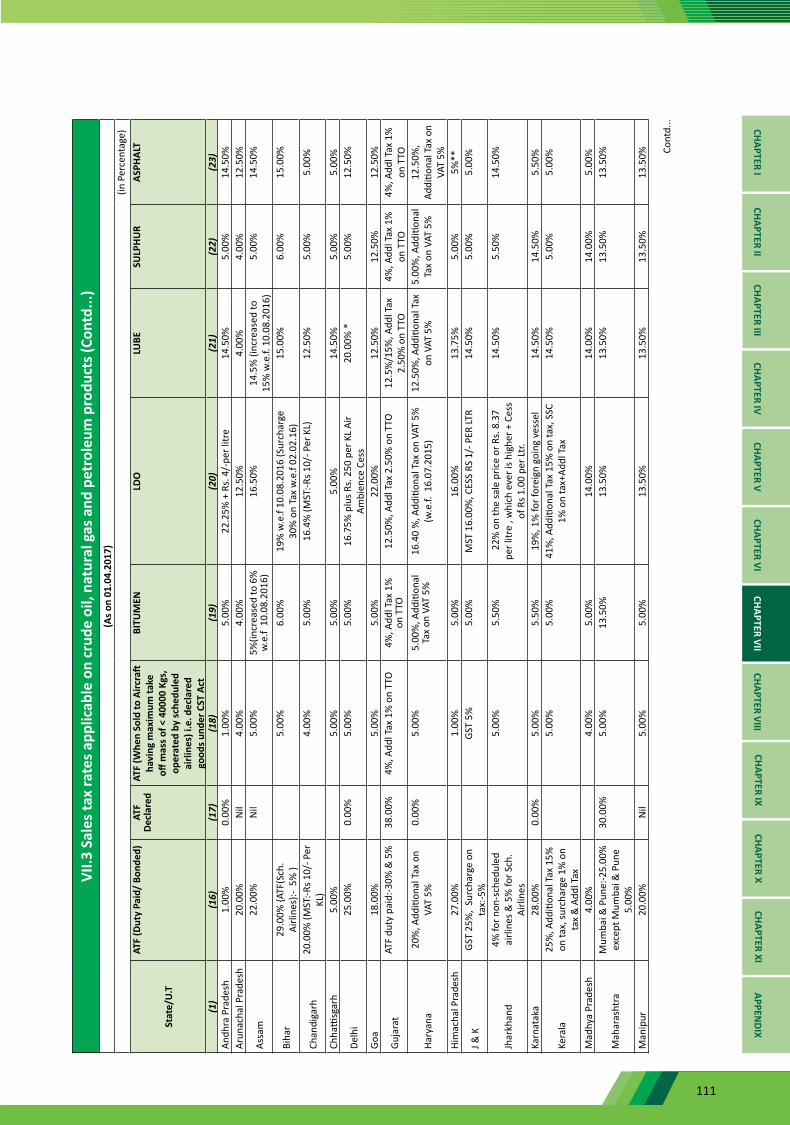
111
VII.3
Sal
es ta
x ra
tes a
pplic
able
on
crud
e oi
l, na
tura
l gas
and
pet
role
um p
rodu
cts (
Cont
d...)
(As o
n 01
.04.
2017
)(in
Per
cent
age)
Stat
e/U
.T
ATF
(Dut
y Pa
id/
Bond
ed)
ATF
Decl
ared
ATF
(Whe
n So
ld to
Airc
raft
havi
ng m
axim
um ta
ke
off m
ass o
f < 4
0000
Kgs
, op
erat
ed b
y sc
hedu
led
airli
nes)
i.e.
dec
lare
d go
ods u
nder
CST
Act
BITU
MEN
LDO
LUBE
SU
LPHU
RAS
PHAL
T
(1)
(16)
(17)
(18)
(19)
(20)
(21)
(22)
(23)
Andh
ra P
rade
sh1.
00%
0.00
%1.
00%
5.00
%22
.25%
+ R
s. 4
/-pe
r litr
e14
.50%
5.00
%14
.50%
Arun
acha
l Pra
desh
20.0
0%N
il4.
00%
4.00
%12
.50%
4.00
%4.
00%
12.5
0%
Assa
m22
.00%
Nil
5.00
%5%
(incr
ease
d to
6%
w
.e.f
10.
08.2
016)
16.5
0%14
.5%
(inc
reas
ed to
15
% w
.e.f.
10.
08.2
016)
5.00
%14
.50%
Biha
r29
.00%
{ATF
(Sch
.Ai
rline
s):-
5%
}5.
00%
6.00
%19
% w
.e.f
10.0
8.20
16 (S
urch
arge
30
% o
n Ta
x w
.e.f
02.0
2.16
) 15
.00%
6.00
%15
.00%
Chan
diga
rh20
.00%
(MST
:-Rs 1
0/- P
er
KL)
4.00
%5.
00%
16.4
% (M
ST:-R
s 10/
- Per
KL)
12.5
0%5.
00%
5.00
%
Chha
ttisg
arh
5.00
%5.
00%
5.00
%5.
00%
14.5
0%5.
00%
5.00
%
Delh
i25
.00%
0.00
%5.
00%
5.00
%16
.75%
plu
s Rs.
250
per
KL
Air
Ambi
ence
Ces
s20
.00%
*
5.00
%12
.50%
Goa
18.0
0%5.
00%
5.00
%22
.00%
12.5
0%12
.50%
12.5
0%
Guja
rat
ATF
duty
pai
d:-3
0% &
5%
38.0
0%4%
, Add
l Tax
1%
on
TTO
4%, A
ddl T
ax 1
%
on T
TO12
.50%
, Add
l Tax
2.5
0% o
n TT
O12
.5%
/15%
, Add
l Tax
2.
50%
on
TTO
4%, A
ddl T
ax 1
%
on T
TO4%
, Add
l Tax
1%
on
TTO
Hary
ana
20%
, Add
ition
al T
ax o
n VA
T 5%
0.00
%5.
00%
5.00
%, A
dditi
onal
Ta
x on
VAT
5%
16.4
0 %
, Add
ition
al T
ax o
n VA
T 5%
(w
.e.f.
16.
07.2
015)
12.5
0%, A
dditi
onal
Tax
on
VAT
5%
5.00
%, A
dditi
onal
Ta
x on
VAT
5%
12.5
0%,
Addi
tiona
l Tax
on
VAT
5%Hi
mac
hal P
rade
sh27
.00%
1.00
%5.
00%
16.0
0%13
.75%
5.00
%5%
**
J & K
GST
25%
, Su
rcha
rge
on
tax:
-5%
GST
5%
5.00
%M
ST 1
6.00
%, C
ESS
RS 1
/- P
ER LT
R14
.50%
5.00
%5.
00%
Jhar
khan
d4%
for n
on-s
ched
uled
ai
rline
s & 5
% fo
r Sch
.Ai
rline
s
5.00
%5.
50%
22%
on
the
sale
pric
e or
Rs.
8.3
7 pe
r litr
e , w
hich
eve
r is h
ighe
r + C
ess
of R
s 1.0
0 pe
r Ltr.
14.5
0%5.
50%
14.5
0%
Karn
atak
a28
.00%
0.00
%5.
00%
5.50
%19
%, 1
% fo
r for
eign
goi
ng v
esse
l14
.50%
14.5
0%5.
50%
Kera
la
25%
, Add
ition
al T
ax 1
5%
on ta
x, su
rcha
rge
1% o
n ta
x &
Add
l Tax
5.00
%5.
00%
41%
, Add
ition
al T
ax 1
5% o
n ta
x, S
SC
1% o
n ta
x+Ad
dl T
ax
14.5
0%5.
00%
5.00
%
Mad
hya
Prad
esh
4.00
%4.
00%
5.00
%14
.00%
14.0
0%14
.00%
5.00
%
Mah
aras
htra
Mum
bai &
Pun
e:-2
5.00
%
exce
pt M
umba
i & P
une
5.00
%
30.0
0%5.
00%
13.5
0%13
.50%
13.5
0%13
.50%
13.5
0%
Man
ipur
20.0
0%N
il5.
00%
5.00
%13
.50%
13.5
0%13
.50%
13.5
0%
CHAPTER ICHAPTER II
CHAPTER IIICHAPTER IV
CHAPTER VCHAPTER VI
CHAPTER VIICHAPTER VIII
CHAPTER IXCHAPTER X
CHAPTER XIAPPEN
DIX
Cont
d...
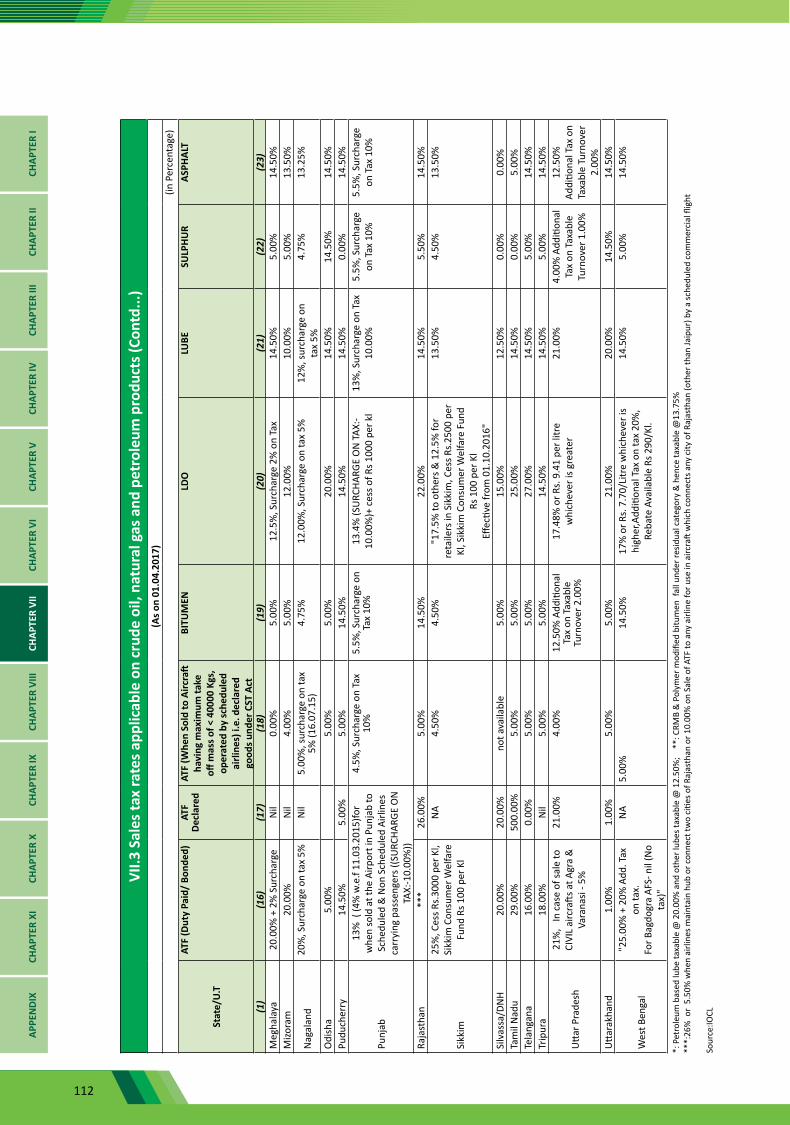
112
VII.3
Sal
es ta
x ra
tes a
pplic
able
on
crud
e oi
l, na
tura
l gas
and
pet
role
um p
rodu
cts (
Cont
d...)
(As o
n 01
.04.
2017
)(in
Per
cent
age)
Stat
e/U
.T
ATF
(Dut
y Pa
id/
Bond
ed)
ATF
Decl
ared
ATF
(Whe
n So
ld to
Airc
raft
havi
ng m
axim
um ta
ke
off m
ass o
f < 4
0000
Kgs
, op
erat
ed b
y sc
hedu
led
airli
nes)
i.e.
dec
lare
d go
ods u
nder
CST
Act
BITU
MEN
LDO
LUBE
SU
LPHU
RAS
PHAL
T
(1)
(16)
(17)
(18)
(19)
(20)
(21)
(22)
(23)
Meg
hala
ya20
.00%
+ 2
% S
urch
arge
Nil
0.00
%5.
00%
12.5
%, S
urch
arge
2%
on
Tax
14.5
0%5.
00%
14.5
0%M
izora
m20
.00%
Nil
4.00
%5.
00%
12.0
0%10
.00%
5.00
%13
.50%
Nag
alan
d20
%, S
urch
arge
on
tax
5%N
il5.
00%
, sur
char
ge o
n ta
x 5%
(16.
07.1
5)4.
75%
12.0
0%, S
urch
arge
on
tax
5%12
%, s
urch
arge
on
tax
5%
4.75
%13
.25%
Odi
sha
5.00
%5.
00%
5.00
%20
.00%
14.5
0%14
.50%
14.5
0%Pu
duch
erry
14.5
0%5.
00%
5.00
%14
.50%
14.5
0%14
.50%
0.00
%14
.50%
Punj
ab
13%
( (4
% w
.e.f
11.0
3.20
15)fo
r w
hen
sold
at t
he A
irpor
t in
Punj
ab to
Sc
hedu
led
& N
on S
ched
uled
Airl
ines
ca
rryi
ng p
asse
nger
s ((S
URC
HARG
E O
N
TAX:
-10.
00%
))
4.5%
, Sur
char
ge o
n Ta
x 10
%5.
5%, S
urch
arge
on
Tax
10%
13.4
% (S
URC
HARG
E O
N T
AX:-
10.0
0%)+
ces
s of R
s 100
0 pe
r kl
13%
, Sur
char
ge o
n Ta
x 10
.00%
5.5%
, Sur
char
ge
on T
ax 1
0%5.
5%, S
urch
arge
on
Tax
10%
Raja
stha
n**
*26
.00%
5.00
%14
.50%
22.0
0%14
.50%
5.50
%14
.50%
Sikk
im
25%
, Ces
s Rs.
3000
per
Kl,
Sikk
im C
onsu
mer
Wel
fare
Fu
nd R
s 100
per
Kl
NA
4.50
%4.
50%
"17.
5% to
oth
ers &
12.
5% fo
r re
taile
rs in
Sik
kim
, Ces
s Rs.
2500
per
Kl
, Sik
kim
Con
sum
er W
elfa
re F
und
Rs 1
00 p
er K
l Eff
ectiv
e fr
om 0
1.10
.201
6"
13.5
0%4.
50%
13.5
0%
Silv
assa
/DN
H20
.00%
20.0
0%no
t ava
ilabl
e5.
00%
15.0
0%12
.50%
0.00
%0.
00%
Tam
il N
adu
29.0
0%50
0.00
%5.
00%
5.00
%25
.00%
14.5
0%0.
00%
5.00
%Te
lang
ana
16.0
0%0.
00%
5.00
%5.
00%
27.0
0%14
.50%
5.00
%14
.50%
Trip
ura
18.0
0%N
il5.
00%
5.00
%14
.50%
14.5
0%5.
00%
14.5
0%
Utta
r Pra
desh
21%
, In
cas
e of
sale
to
CIVI
L ai
rcra
fts a
t Agr
a &
Va
rana
si - 5
%
21.0
0%4.
00%
12.5
0% A
dditi
onal
Ta
x on
Tax
able
Tu
rnov
er 2
.00%
17.4
8% o
r Rs.
9.4
1 pe
r litr
e w
hich
ever
is g
reat
er21
.00%
4.00
% A
dditi
onal
Ta
x on
Tax
able
Tu
rnov
er 1
.00%
12.5
0%
Addi
tiona
l Tax
on
Taxa
ble
Turn
over
2.
00%
Utta
rakh
and
1.00
%1.
00%
5.00
%5.
00%
21.0
0%20
.00%
14.5
0%14
.50%
Wes
t Ben
gal
"25.
00%
+ 2
0% A
dd. T
ax
on ta
x.
For B
agdo
gra
AFS-
nil
(No
tax)
"
NA
5.00
%14
.50%
17%
or R
s. 7
.70/
Litr
e w
hich
ever
is
high
er,A
dditi
onal
Tax
on
tax
20%
, Re
bate
Ava
ilabl
e Rs
290
/Kl.
14.5
0%5.
00%
14.5
0%
*: P
etro
leum
bas
ed lu
be ta
xabl
e @
20.
00%
and
oth
er lu
bes t
axab
le @
12.
50%
; *
*: C
RMB
& P
olym
er m
odifi
ed b
itum
en f
all u
nder
resid
ual c
ateg
ory
& h
ence
taxa
ble
@13
.75%
***:
26%
or
5.50
% w
hen
airli
nes m
aint
ain
hub
or c
onne
ct tw
o ci
ties o
f Raj
asth
an o
r 10.
00%
on
Sale
of A
TF to
any
airl
ine
for u
se in
airc
raft
whi
ch c
onne
cts a
ny c
ity o
f Raj
asth
an (o
ther
than
Jaip
ur) b
y a
sche
dule
d co
mm
erci
al fl
ight
So
urce
:IOCL
CHAP
TER
ICH
APTE
R II
CHAP
TER
IIICH
APTE
R IV
CHAP
TER
VCH
APTE
R VI
CHAP
TER
VII
CHAP
TER
VIII
CHAP
TER
IXCH
APTE
R X
CHAP
TER
XIAP
PEN
DIX
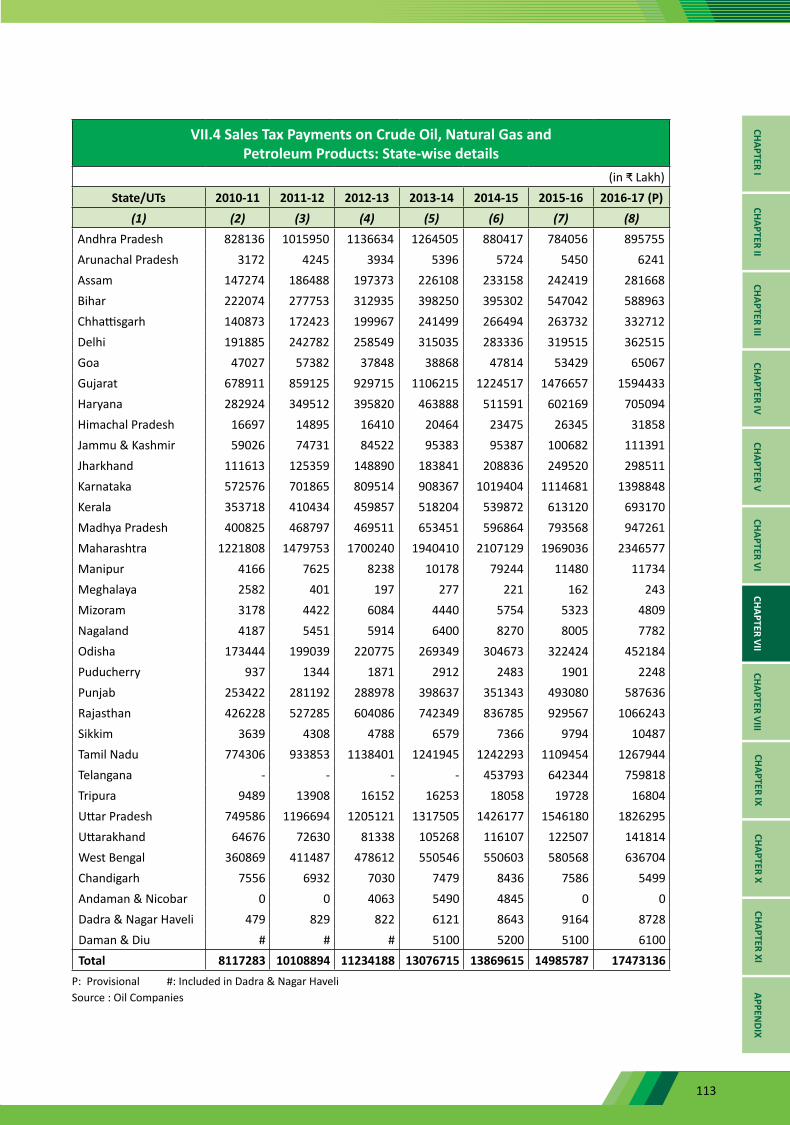
113
VII.4 Sales Tax Payments on Crude Oil, Natural Gas and Petroleum Products: State-wise details
(in ₹ Lakh)State/UTs 2010-11 2011-12 2012-13 2013-14 2014-15 2015-16 2016-17 (P)
(1) (2) (3) (4) (5) (6) (7) (8)Andhra Pradesh 828136 1015950 1136634 1264505 880417 784056 895755Arunachal Pradesh 3172 4245 3934 5396 5724 5450 6241Assam 147274 186488 197373 226108 233158 242419 281668Bihar 222074 277753 312935 398250 395302 547042 588963Chhattisgarh 140873 172423 199967 241499 266494 263732 332712Delhi 191885 242782 258549 315035 283336 319515 362515Goa 47027 57382 37848 38868 47814 53429 65067Gujarat 678911 859125 929715 1106215 1224517 1476657 1594433Haryana 282924 349512 395820 463888 511591 602169 705094Himachal Pradesh 16697 14895 16410 20464 23475 26345 31858Jammu & Kashmir 59026 74731 84522 95383 95387 100682 111391Jharkhand 111613 125359 148890 183841 208836 249520 298511Karnataka 572576 701865 809514 908367 1019404 1114681 1398848Kerala 353718 410434 459857 518204 539872 613120 693170Madhya Pradesh 400825 468797 469511 653451 596864 793568 947261Maharashtra 1221808 1479753 1700240 1940410 2107129 1969036 2346577Manipur 4166 7625 8238 10178 79244 11480 11734Meghalaya 2582 401 197 277 221 162 243Mizoram 3178 4422 6084 4440 5754 5323 4809Nagaland 4187 5451 5914 6400 8270 8005 7782Odisha 173444 199039 220775 269349 304673 322424 452184Puducherry 937 1344 1871 2912 2483 1901 2248Punjab 253422 281192 288978 398637 351343 493080 587636Rajasthan 426228 527285 604086 742349 836785 929567 1066243Sikkim 3639 4308 4788 6579 7366 9794 10487Tamil Nadu 774306 933853 1138401 1241945 1242293 1109454 1267944Telangana - - - - 453793 642344 759818Tripura 9489 13908 16152 16253 18058 19728 16804Uttar Pradesh 749586 1196694 1205121 1317505 1426177 1546180 1826295Uttarakhand 64676 72630 81338 105268 116107 122507 141814West Bengal 360869 411487 478612 550546 550603 580568 636704Chandigarh 7556 6932 7030 7479 8436 7586 5499Andaman & Nicobar 0 0 4063 5490 4845 0 0Dadra & Nagar Haveli 479 829 822 6121 8643 9164 8728Daman & Diu # # # 5100 5200 5100 6100Total 8117283 10108894 11234188 13076715 13869615 14985787 17473136
P: Provisional #: Included in Dadra & Nagar Haveli Source : Oil Companies
CHAPTER ICHAPTER II
CHAPTER IIICHAPTER IV
CHAPTER VCHAPTER VI
CHAPTER VIICHAPTER VIII
CHAPTER IXCHAPTER X
CHAPTER XIAPPEN
DIX
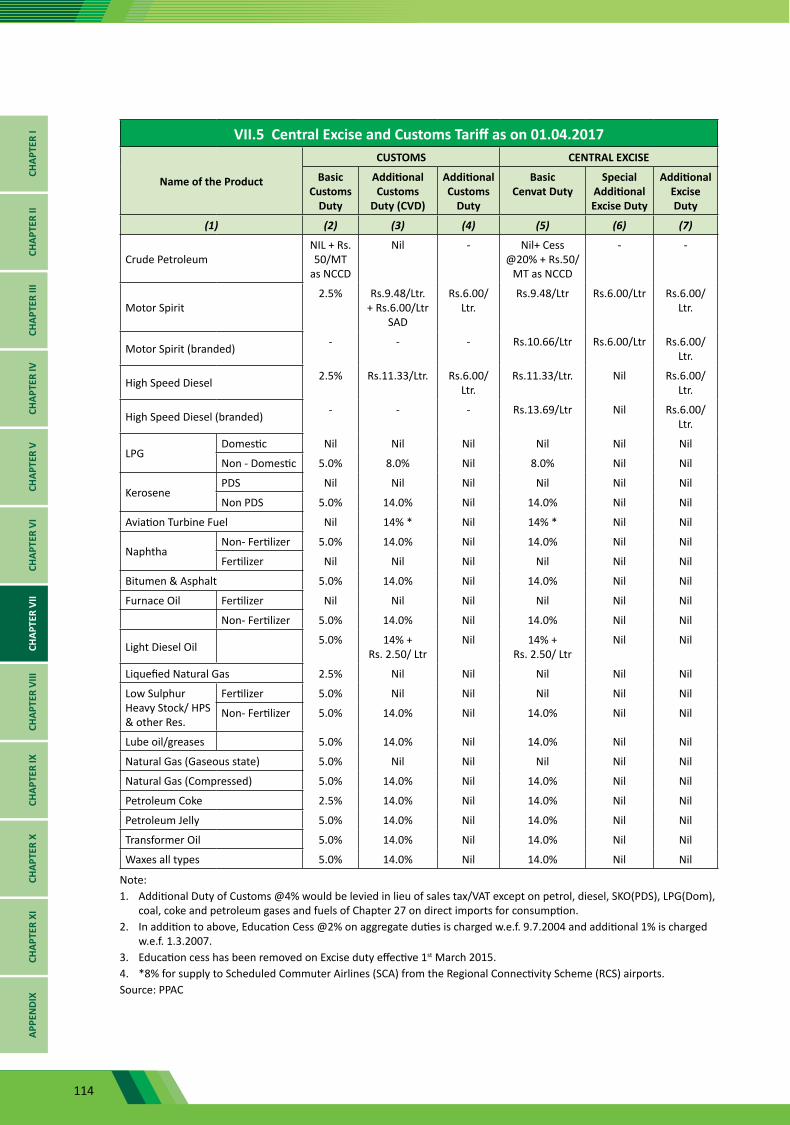
114
VII.5 Central Excise and Customs Tariff as on 01.04.2017
Name of the Product
CUSTOMS CENTRAL EXCISE
Basic Customs
Duty
Additional Customs
Duty (CVD)
Additional Customs
Duty
Basic Cenvat Duty
Special Additional Excise Duty
Additional Excise Duty
(1) (2) (3) (4) (5) (6) (7)
Crude PetroleumNIL + Rs. 50/MT
as NCCD
Nil - Nil+ Cess @20% + Rs.50/
MT as NCCD
- -
Motor Spirit2.5% Rs.9.48/Ltr.
+ Rs.6.00/Ltr SAD
Rs.6.00/Ltr.
Rs.9.48/Ltr Rs.6.00/Ltr Rs.6.00/Ltr.
Motor Spirit (branded) - - - Rs.10.66/Ltr Rs.6.00/Ltr Rs.6.00/Ltr.
High Speed Diesel 2.5% Rs.11.33/Ltr. Rs.6.00/Ltr.
Rs.11.33/Ltr. Nil Rs.6.00/Ltr.
High Speed Diesel (branded) - - - Rs.13.69/Ltr Nil Rs.6.00/Ltr.
LPGDomestic Nil Nil Nil Nil Nil Nil
Non - Domestic 5.0% 8.0% Nil 8.0% Nil Nil
KerosenePDS Nil Nil Nil Nil Nil Nil
Non PDS 5.0% 14.0% Nil 14.0% Nil Nil
Aviation Turbine Fuel Nil 14% * Nil 14% * Nil Nil
NaphthaNon- Fertilizer 5.0% 14.0% Nil 14.0% Nil Nil
Fertilizer Nil Nil Nil Nil Nil Nil
Bitumen & Asphalt 5.0% 14.0% Nil 14.0% Nil Nil
Furnace Oil Fertilizer Nil Nil Nil Nil Nil Nil
Non- Fertilizer 5.0% 14.0% Nil 14.0% Nil Nil
Light Diesel Oil 5.0% 14% + Rs. 2.50/ Ltr
Nil 14% + Rs. 2.50/ Ltr
Nil Nil
Liquefied Natural Gas 2.5% Nil Nil Nil Nil Nil
Low Sulphur Heavy Stock/ HPS & other Res.
Fertilizer 5.0% Nil Nil Nil Nil Nil
Non- Fertilizer 5.0% 14.0% Nil 14.0% Nil Nil
Lube oil/greases 5.0% 14.0% Nil 14.0% Nil Nil
Natural Gas (Gaseous state) 5.0% Nil Nil Nil Nil Nil
Natural Gas (Compressed) 5.0% 14.0% Nil 14.0% Nil Nil
Petroleum Coke 2.5% 14.0% Nil 14.0% Nil Nil
Petroleum Jelly 5.0% 14.0% Nil 14.0% Nil Nil
Transformer Oil 5.0% 14.0% Nil 14.0% Nil Nil
Waxes all types 5.0% 14.0% Nil 14.0% Nil Nil
Note: 1. Additional Duty of Customs @4% would be levied in lieu of sales tax/VAT except on petrol, diesel, SKO(PDS), LPG(Dom),
coal, coke and petroleum gases and fuels of Chapter 27 on direct imports for consumption. 2. In addition to above, Education Cess @2% on aggregate duties is charged w.e.f. 9.7.2004 and additional 1% is charged
w.e.f. 1.3.2007.3. Education cess has been removed on Excise duty effective 1st March 2015. 4. *8% for supply to Scheduled Commuter Airlines (SCA) from the Regional Connectivity Scheme (RCS) airports.Source: PPAC
CHAP
TER
ICH
APTE
R II
CHAP
TER
IIICH
APTE
R IV
CHAP
TER
VCH
APTE
R VI
CHAP
TER
VII
CHAP
TER
VIII
CHAP
TER
IXCH
APTE
R X
CHAP
TER
XIAP
PEN
DIX
115
CHAPTER ICHAPTER II
CHAPTER IIICHAPTER IV
CHAPTER VCHAPTER VI
CHAPTER VIICHAPTER VIII
CHAPTER IXCHAPTER X
CHAPTER XIAPPEN
DIX
116
Chapter Highlights
• Total manpower employed in oil and gas sector CPSEs at 1,10,058 (as on 31.03.2017) has been almost stagnant over the years.
• Exploration & production vertical accounted for the highest manpower deployment (30%) followed by marketing (28%) and refinery (23%) as on 31.03.2017.
• Executive/Managerial categories employed the highest proportion of manpower (54%) followed by Workmen (31%), Supervisory (9%) and Clerical (6%) accounted for the balance during 2016-17.
• ONGC and IOCL in 2016-17 together accounted for over 61% of the total manpower employed in the oil & gas CPSEs.
CHAP
TER
ICH
APTE
R II
CHAP
TER
IIICH
APTE
R IV
CHAP
TER
VCH
APTE
R VI
CHAP
TER
VII
CHAP
TER
VIII
CHAP
TER
IXCH
APTE
R X
CHAP
TER
XIAP
PEN
DIX
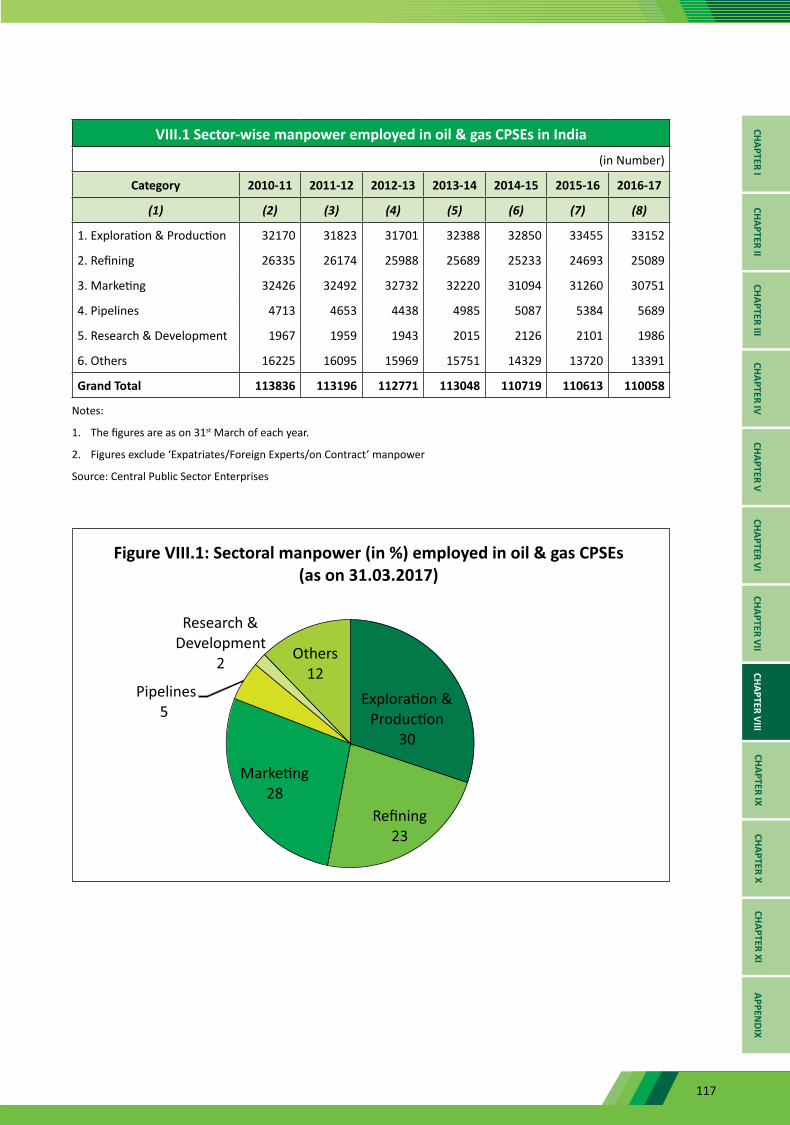
117
VIII.1 Sector-wise manpower employed in oil & gas CPSEs in India(in Number)
Category 2010-11 2011-12 2012-13 2013-14 2014-15 2015-16 2016-17
(1) (2) (3) (4) (5) (6) (7) (8)
1. Exploration & Production 32170 31823 31701 32388 32850 33455 33152
2. Refining 26335 26174 25988 25689 25233 24693 25089
3. Marketing 32426 32492 32732 32220 31094 31260 30751
4. Pipelines 4713 4653 4438 4985 5087 5384 5689
5. Research & Development 1967 1959 1943 2015 2126 2101 1986
6. Others 16225 16095 15969 15751 14329 13720 13391
Grand Total 113836 113196 112771 113048 110719 110613 110058
Notes:
1. The figures are as on 31st March of each year.
2. Figures exclude ‘Expatriates/Foreign Experts/on Contract’ manpower
Source: Central Public Sector Enterprises
CHAPTER ICHAPTER II
CHAPTER IIICHAPTER IV
CHAPTER VCHAPTER VI
CHAPTER VIICHAPTER VIII
CHAPTER IXCHAPTER X
CHAPTER XIAPPEN
DIX
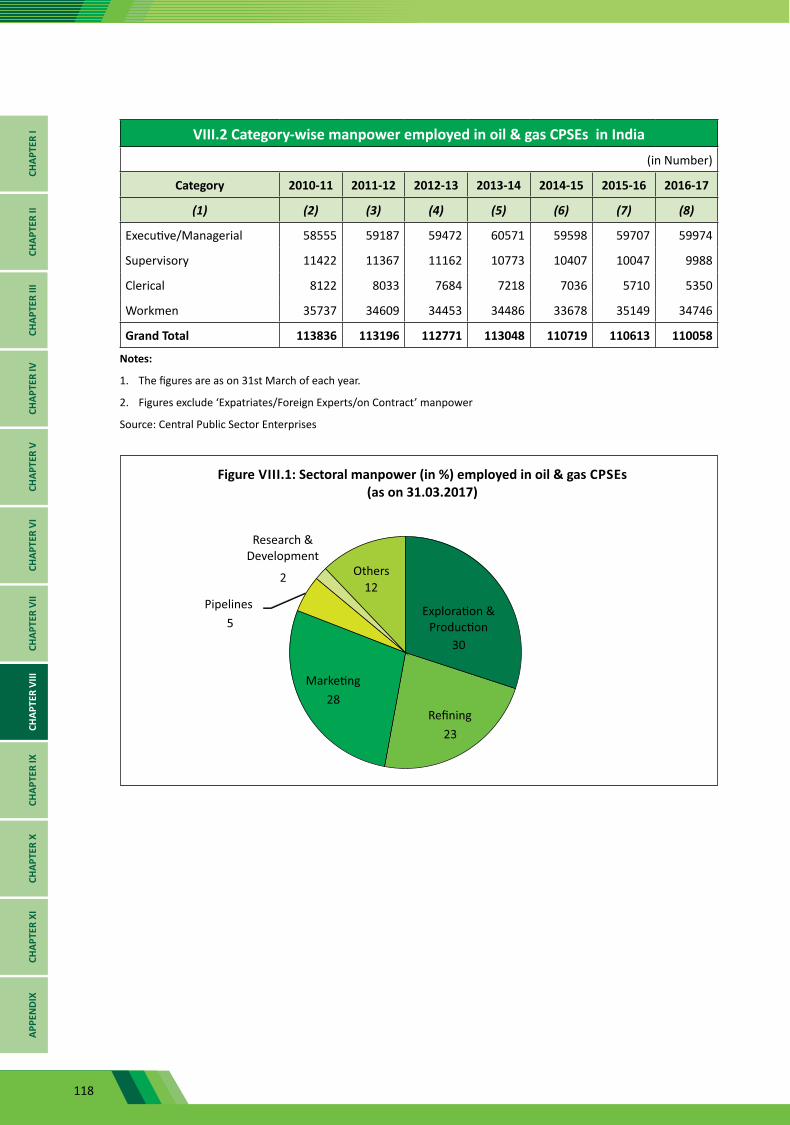
118
VIII.2 Category-wise manpower employed in oil & gas CPSEs in India(in Number)
Category 2010-11 2011-12 2012-13 2013-14 2014-15 2015-16 2016-17
(1) (2) (3) (4) (5) (6) (7) (8)
Executive/Managerial 58555 59187 59472 60571 59598 59707 59974
Supervisory 11422 11367 11162 10773 10407 10047 9988
Clerical 8122 8033 7684 7218 7036 5710 5350
Workmen 35737 34609 34453 34486 33678 35149 34746
Grand Total 113836 113196 112771 113048 110719 110613 110058
Notes:
1. The figures are as on 31st March of each year.
2. Figures exclude ‘Expatriates/Foreign Experts/on Contract’ manpower
Source: Central Public Sector Enterprises
CHAP
TER
ICH
APTE
R II
CHAP
TER
IIICH
APTE
R IV
CHAP
TER
VCH
APTE
R VI
CHAP
TER
VII
CHAP
TER
VIII
CHAP
TER
IXCH
APTE
R X
CHAP
TER
XIAP
PEN
DIX
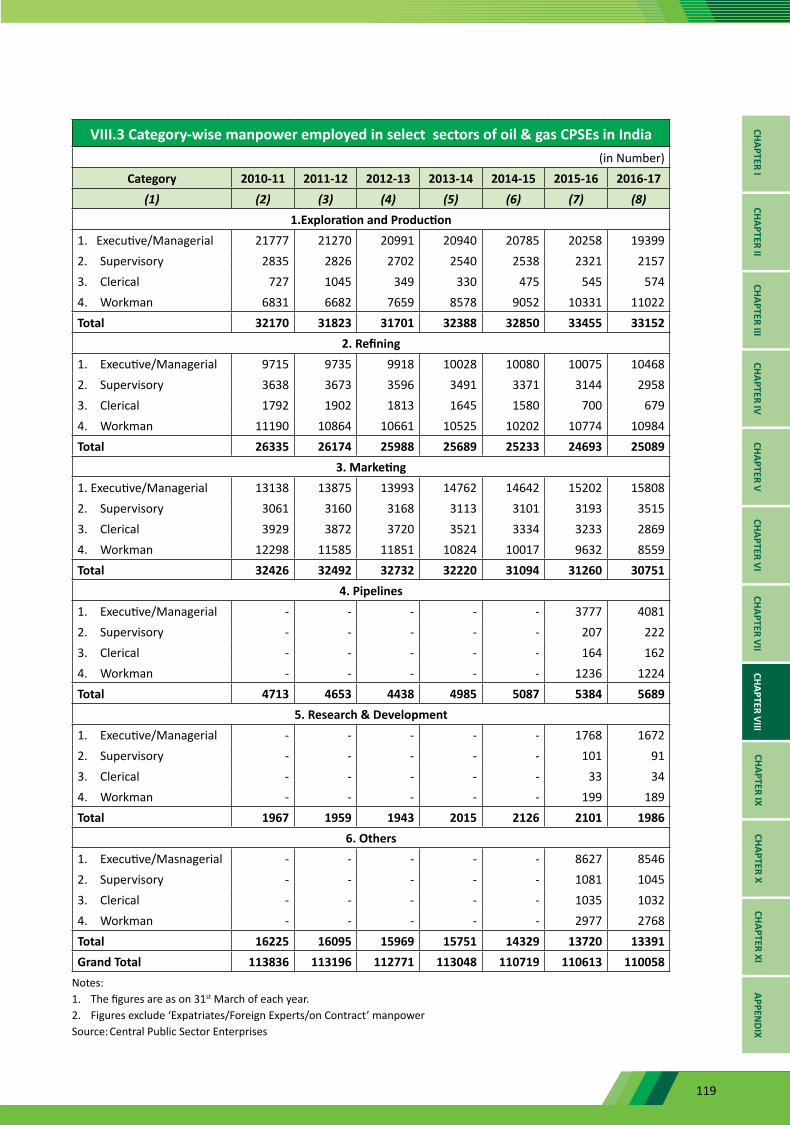
119
VIII.3 Category-wise manpower employed in select sectors of oil & gas CPSEs in India(in Number)
Category 2010-11 2011-12 2012-13 2013-14 2014-15 2015-16 2016-17(1) (2) (3) (4) (5) (6) (7) (8)
1.Exploration and Production1. Executive/Managerial 21777 21270 20991 20940 20785 20258 19399 2. Supervisory 2835 2826 2702 2540 2538 2321 2157 3. Clerical 727 1045 349 330 475 545 574 4. Workman 6831 6682 7659 8578 9052 10331 11022 Total 32170 31823 31701 32388 32850 33455 33152
2. Refining1. Executive/Managerial 9715 9735 9918 10028 10080 10075 10468 2. Supervisory 3638 3673 3596 3491 3371 3144 2958 3. Clerical 1792 1902 1813 1645 1580 700 679 4. Workman 11190 10864 10661 10525 10202 10774 10984 Total 26335 26174 25988 25689 25233 24693 25089
3. Marketing1. Executive/Managerial 13138 13875 13993 14762 14642 15202 15808 2. Supervisory 3061 3160 3168 3113 3101 3193 3515 3. Clerical 3929 3872 3720 3521 3334 3233 2869 4. Workman 12298 11585 11851 10824 10017 9632 8559 Total 32426 32492 32732 32220 31094 31260 30751
4. Pipelines1. Executive/Managerial - - - - - 3777 4081 2. Supervisory - - - - - 207 222 3. Clerical - - - - - 164 162 4. Workman - - - - - 1236 1224 Total 4713 4653 4438 4985 5087 5384 5689
5. Research & Development1. Executive/Managerial - - - - - 1768 1672 2. Supervisory - - - - - 101 91 3. Clerical - - - - - 33 34 4. Workman - - - - - 199 189 Total 1967 1959 1943 2015 2126 2101 1986
6. Others1. Executive/Masnagerial - - - - - 8627 8546 2. Supervisory - - - - - 1081 1045 3. Clerical - - - - - 1035 1032 4. Workman - - - - - 2977 2768 Total 16225 16095 15969 15751 14329 13720 13391 Grand Total 113836 113196 112771 113048 110719 110613 110058
Notes: 1. The figures are as on 31st March of each year. 2. Figures exclude ‘Expatriates/Foreign Experts/on Contract’ manpower Source: Central Public Sector Enterprises
CHAPTER ICHAPTER II
CHAPTER IIICHAPTER IV
CHAPTER VCHAPTER VI
CHAPTER VIICHAPTER VIII
CHAPTER IXCHAPTER X
CHAPTER XIAPPEN
DIX
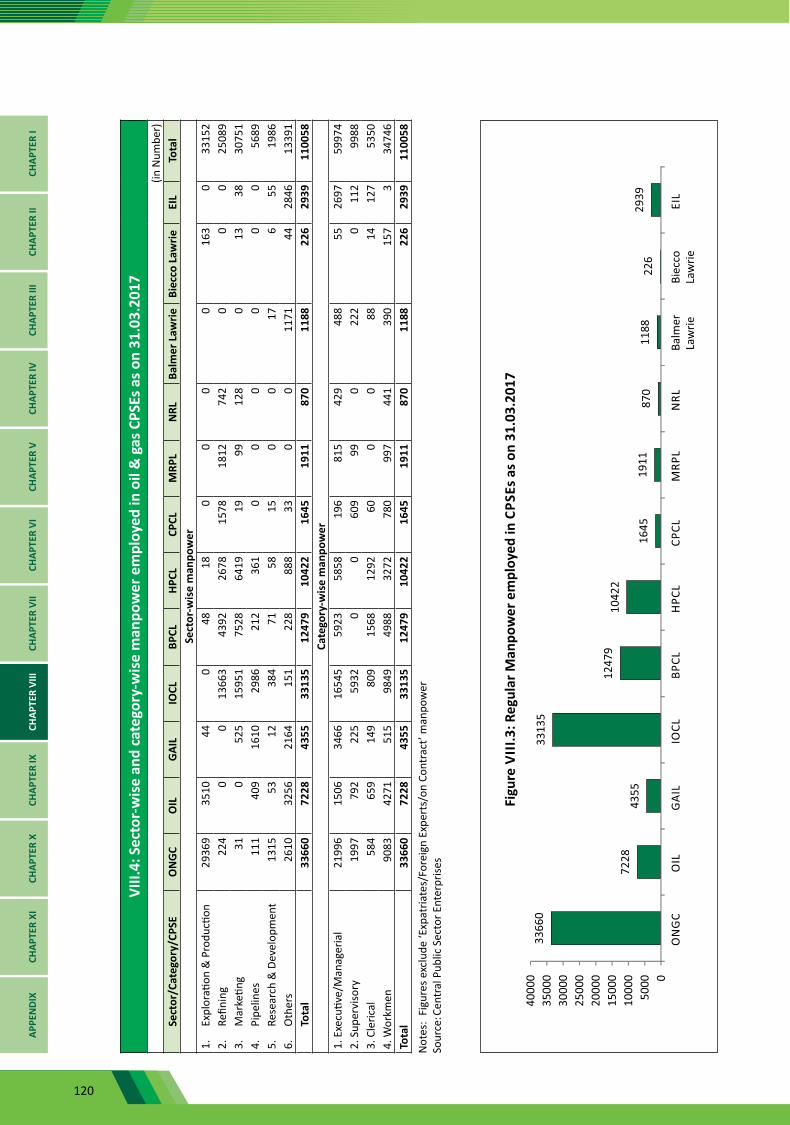
120
VIII.
4: S
ecto
r-w
ise
and
cate
gory
-wis
e m
anpo
wer
em
ploy
ed in
oil
& g
as C
PSEs
as o
n 31
.03.
2017
(in N
umbe
r)Se
ctor
/Cat
egor
y/CP
SEO
NG
CO
ILG
AIL
IOCL
BPCL
HPCL
CPCL
MRP
LN
RLBa
lmer
Law
rieBi
ecco
Law
rieEI
LTo
tal
Sect
or-w
ise
man
pow
er1.
Ex
plor
ation
& P
rodu
ction
2936
9 35
10
44
0 48
18
0
0 0
0 16
3 0
3315
2 2.
Re
finin
g 22
4 0
0 13
663
4392
26
78
1578
18
12
742
0 0
0 25
089
3.
Mar
ketin
g31
0
525
1595
1 75
28
6419
19
99
12
8 0
13
38
3075
1 4.
Pi
pelin
es11
1 40
9 16
10
2986
21
2 36
1 0
0 0
0 0
0 56
89
5.
Rese
arch
& D
evel
opm
ent
1315
53
12
38
4 71
58
15
0
0 17
6
55
1986
6.
O
ther
s26
10
3256
21
64
151
228
888
33
0 0
1171
44
28
46
1339
1
Tota
l33
660
7228
43
55
3313
5 12
479
1042
2 16
45
1911
87
0 11
88
226
2939
11
0058
Ca
tego
ry-w
ise
man
pow
er1.
Exe
cutiv
e/M
anag
eria
l21
996
1506
34
66
1654
5 59
23
5858
19
6 81
5 42
9 48
8 55
26
97
5997
4 2.
Sup
ervi
sory
1997
79
2 22
5 59
32
0 0
609
99
0 22
2 0
112
9988
3.
Cle
rical
584
659
149
809
1568
12
92
60
0 0
88
14
127
5350
4.
Wor
kmen
9083
42
71
515
9849
49
88
3272
78
0 99
7 44
1 39
0 15
7 3
3474
6 To
tal
3366
0 72
28
4355
33
135
1247
9 10
422
1645
19
11
870
1188
22
6 29
39
1100
58
Not
es:
Figu
res e
xclu
de ‘E
xpat
riate
s/Fo
reig
n Ex
pert
s/on
Con
trac
t’ m
anpo
wer
Sour
ce: C
entr
al P
ublic
Sec
tor E
nter
prise
s
CHAP
TER
ICH
APTE
R II
CHAP
TER
IIICH
APTE
R IV
CHAP
TER
VCH
APTE
R VI
CHAP
TER
VII
CHAP
TER
VIII
CHAP
TER
IXCH
APTE
R X
CHAP
TER
XIAP
PEN
DIX
121
CHAPTER ICHAPTER II
CHAPTER IIICHAPTER IV
CHAPTER VCHAPTER VI
CHAPTER VIICHAPTER VIII
CHAPTER IXCHAPTER X
CHAPTER XIAPPEN
DIX
122
Chapter Highlights
• Production of petroleum products was 243.55 MMT during 2016-17, which is 5.01% higher than the production in 2015-16 (231.92 MMT).
• Natural Gas Production during 2016-17 was 31.90 BCM, which is 1.09% less than the production in 2015-16 (32.25 BCM)
• Crude Oil Production during 2016-17 was 36.01 MMT, which is 2.53% less than the production in 2015-16 (36.94 BCM)
• Coal production in the country during the year 2016-17 was 659.27 MMT as compared to 639.23 MMT in 2015-16, registering a growth of 3.14%.
• Gross Electricity Generation which increased from 1.336 billion GWh in 2015-16 to 1.433 billion GWh in 2016-17, achieved a growth rate of 7.27%.
• Gross Value Added [at constant prices(2011-12)] by petroleum and natural gas in Economic activity was ₹4,04,040 crore in 2015-16 as compared to ₹3,25,746 crore in 2014-15, registering a growth of 24.04%.
• Contribution of petroleum and natural gas in total GVA at basic showed an increase from 3.35% in 2014-15 to 3.85 in 2015-16 [at constant prices (2011-12)].
CHAP
TER
ICH
APTE
R II
CHAP
TER
IIICH
APTE
R IV
CHAP
TER
VCH
APTE
R VI
CHAP
TER
VII
CHAP
TER
VIII
CHAP
TER
IXCH
APTE
R X
CHAP
TER
XIAP
PEN
DIX
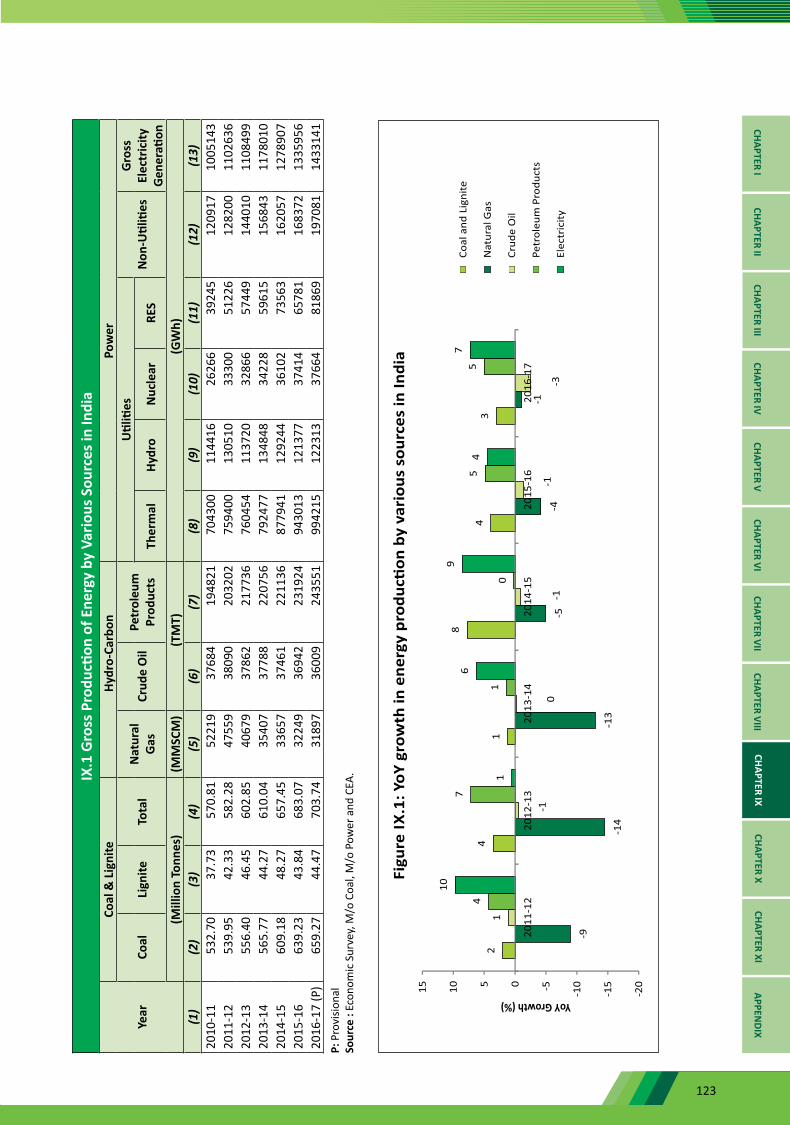
123
IX.1
Gro
ss P
rodu
ction
of E
nerg
y by
Var
ious
Sou
rces
in In
dia
Year
Coal
& L
igni
te
Hyd
ro-C
arbo
n
Po
wer
Coal
Lign
iteTo
tal
Nat
ural
G
asCr
ude
Oil
Petr
oleu
m
Prod
ucts
Util
ities
Non
-Util
ities
Gro
ss
Elec
tric
ity
Gen
erati
onTh
erm
alHy
dro
Nuc
lear
RES
(Mill
ion
Tonn
es)
(MM
SCM
)
(TM
T)
(GW
h)(1
)(2
)(3
)(4
)(5
)(6
)(7
)(8
)(9
)(1
0)(1
1)(1
2)(1
3)20
10-1
153
2.70
37.7
357
0.81
5221
937
684
1948
2170
4300
1144
1626
266
3924
512
0917
1005
143
2011
-12
539.
9542
.33
582.
2847
559
3809
020
3202
7594
0013
0510
3330
051
226
1282
0011
0263
620
12-1
355
6.40
46.4
560
2.85
4067
937
862
2177
3676
0454
1137
2032
866
5744
914
4010
1108
499
2013
-14
565.
7744
.27
610.
0435
407
3778
822
0756
7924
7713
4848
3422
859
615
1568
4311
7801
020
14-1
560
9.18
48.2
765
7.45
3365
737
461
2211
3687
7941
1292
4436
102
7356
316
2057
1278
907
2015
-16
639.
2343
.84
683.
0732
249
3694
223
1924
9430
1312
1377
3741
465
781
1683
7213
3595
620
16-1
7 (P
)65
9.27
44.4
770
3.74
3189
736
009
2435
5199
4215
1223
1337
664
8186
919
7081
1433
141
P: P
rovi
siona
lSo
urce
: Ec
onom
ic S
urve
y, M
/o C
oal,
M/o
Pow
er a
nd C
EA.
CHAPTER ICHAPTER II
CHAPTER IIICHAPTER IV
CHAPTER VCHAPTER VI
CHAPTER VIICHAPTER VIII
CHAPTER IXCHAPTER X
CHAPTER XIAPPEN
DIX

124
IX.2
Gro
ss V
alue
Add
ed a
t bas
ic p
rices
by
Econ
omic
Acti
vity
(in ₹
cro
re)
Sect
ors
2011
-12
2012
-13
2013
-14
2014
-15
2015
-16
(P)
2011
-12
2012
-13
2013
-14
2014
-15
2015
-16
(P)
at C
urre
nt P
rices
at C
onst
ant P
rices
(201
1-12
)(1
)(2
)(3
)(4
)(5
)(6
)(7
)(8
)(9
)(1
0)(1
1)1.
(a
) Pe
trol
eum
& N
atur
al G
as94
476
1114
2612
0334
1169
0010
3786
9447
610
1834
1012
9811
4433
1364
35
(b)
Man
ufac
ture
of c
oke
and
re
fined
pet
role
um p
rodu
cts
7846
214
8584
1687
4022
6768
2601
0078
462
1360
1114
2692
2113
1326
7605
(c
) To
tal
1729
3826
0010
2890
7434
3668
3638
8617
2938
2378
4524
3990
3257
4640
4040
2.
Railw
ays
6115
072
296
7872
491
946
1015
9661
150
6916
273
685
8064
786
294
3.
Tran
spor
t by
othe
r mea
ns33
7347
3880
2342
7352
4780
1851
7606
3373
4736
0142
3826
3140
8696
4362
974.
St
orag
e51
0861
6560
2665
5771
6251
0857
1552
0955
4461
425.
Co
mm
unic
ation
& S
ervi
ces r
elat
ed
to b
road
casti
ng12
5930
1429
6917
7804
2072
9824
2075
1259
3013
4504
1560
3017
6738
2050
68
6.
Elec
tric
ity14
5194
1681
9720
4852
2176
8325
1850
1451
9414
8517
1528
7316
3380
1683
027.
Ga
s14
666
1565
216
868
1531
714
548
1466
614
269
1413
112
829
1317
28.
W
ater
Sup
ply
1471
017
512
2206
228
129
3542
514
710
1593
418
343
2207
926
506
9.
Oth
er U
tility
Ser
vice
s12
098
1398
916
373
1850
219
829
1209
812
915
1425
315
455
1646
810
. GV
A at
bas
ic p
rices
8106
946
9202
692
1036
3153
1148
1794
1245
8642
8106
946
8546
275
9063
649
9719
023
1049
0514
.37
11.
Cont
ributi
on o
f P&
NG
in to
tal
GVA
at b
asic
pric
es (%
)2.
132.
832.
792.
992.
922.
132.
782.
693.
353.
85
Gro
wth
Rat
e (%
)1.
(a
) Pe
trol
eum
& N
atur
al G
as-
17.9
47.
99-2
.85
-11.
22-
7.79
-0.5
312
.97
19.2
3
(b)
Man
ufac
ture
of c
oke
and
Refin
ed P
etro
leum
pro
duct
s -
89.3
713
.57
34.3
914
.70
-73
.35
4.91
48.0
926
.64
(c
) To
tal
-50
.35
11.1
818
.89
5.88
-37
.53
2.58
33.5
124
.04
2.
Railw
ays
-18
.23
8.89
16.8
010
.50
-13
.10
6.54
9.45
7.00
3.
Tran
spor
t by
othe
r mea
ns-
15.0
210
.14
11.8
68.
28-
6.76
6.24
6.81
6.75
4.
Stor
age
-20
.69
-2.2
58.
819.
23-
11.8
8-8
.85
6.43
10.7
95.
Co
mm
unic
ation
& S
ervi
ces r
elat
ed
to b
road
casti
ng-
13.5
324
.37
16.5
916
.78
-6.
8116
.00
13.2
716
.03
6.
Elec
tric
ity-
15.8
421
.79
6.26
15.7
0-
2.29
2.93
6.87
3.01
7.
Gas
-6.
727.
77-9
.19
-5.0
2-
-2.7
1-0
.97
-9.2
22.
678.
W
ater
Sup
ply
-19
.04
25.9
827
.50
25.9
4-
8.32
15.1
220
.37
20.0
59.
O
ther
Util
ity S
ervi
ces
-15
.63
17.0
413
.00
7.17
-6.
7510
.36
8.43
6.55
10.
GVA
at b
asic
pric
es-
13.5
212
.61
10.7
98.
51-
5.42
6.05
7.23
7.94
P: P
rovi
siona
l So
urce
: Cen
tral
Sta
tistic
s Offi
ce, M
oSPI
CHAP
TER
ICH
APTE
R II
CHAP
TER
IIICH
APTE
R IV
CHAP
TER
VCH
APTE
R VI
CHAP
TER
VII
CHAP
TER
VIII
CHAP
TER
IXCH
APTE
R X
CHAP
TER
XIAP
PEN
DIX

125
CHAPTER ICHAPTER II
CHAPTER IIICHAPTER IV
CHAPTER VCHAPTER VI
CHAPTER VIICHAPTER VIII
CHAPTER IXCHAPTER X
CHAPTER XIAPPEN
DIX
126
Chapter Highlights
• Total Outlay from Internal and Extra Budgetary Resources (Budget Estimate) for petroleum and natural gas sector is at ₹86027.29 crore in 2017-18, which is 10.8% higher than that for the year 2016-17 (₹77600.42 crore).
• The dividend paid/payable by Oil & gas CPSEs under the Ministry of Petroleum and Natural Gas for the year 2016-17 (₹30330 crore), registered an increase of 84% over the dividend paid in 2015-16 (₹16506 crore).
• Net Profit earned by CPSEs during the year 2016-17 was ₹64264.30 crore which was substantially higher by 47% as compared to 2015-16 (₹43779.65 crore). IOCL earned highest profit (₹19106.40 crore) followed by ONGC (₹17900 crore) and BPCL (₹8039 crore).
CHAP
TER
ICH
APTE
R II
CHAP
TER
IIICH
APTE
R IV
CHAP
TER
VCH
APTE
R VI
CHAP
TER
VII
CHAP
TER
VIII
CHAP
TER
IXCH
APTE
R X
CHAP
TER
XIAP
PEN
DIX

127
X.1
12th
Fiv
e Ye
ar P
lan
Out
lay
& A
ctua
l Exp
endi
ture
for P
&N
G S
ecto
r(in
₹ c
rore
)
CPSE
s20
12-1
3 20
13-1
4
2014
-15
2015
-16
2016
-17
Tota
l Out
lay
(Act
ual)
2017
-18
BERE
Actu
al
BERE
Actu
al
B E
RE
Actu
al
BERE
Ac
tual
BE
RE
Actu
al
BE(1
)(2
)(3
)(4
)(5
)(6
)(7
)(8
)(9
)(1
0)(1
1)(1
2)(1
3)(1
4)(1
5)(1
6)(1
7)(1
8)O
VL79
09.9
013
140
1089
1.41
9491
.88
3611
7.46
3535
714
792
1014
771
71.5
510
402
8488
6782
.96
1484
3.00
1945
0.00
1761
6.99
7781
9.91
2996
7.82
ON
GC33
065.
3133
577
2950
7.91
3504
9.23
3504
9.06
3246
9.54
3605
9.07
3481
3.22
2999
7.46
3624
9.37
3146
7.45
3011
0.43
2930
7.20
2888
1.68
2800
6.41
1500
91.7
570
88.0
0O
IL33
78.2
930
69.5
228
90.0
335
80.9
910
439
9350
.97
3632
3529
.44
3773
.76
3917
.64
3537
.27
3622
.25
4019
.71
1040
3.11
1108
3.24
3072
0.25
9252
.34
GAIL
9447
.27
6738
.77
5962
7511
.50
5481
.93
4069
.78
3104
.62
2131
.52
1632
.18
2704
.51
1799
.17
1511
.75
1637
.03
2098
.00
1624
.65
1480
0.36
2053
.00
IOCL
1000
010
000
9378
.11
1127
6.76
1182
6.00
1666
0.61
1137
593
6714
313.
6810
540
1150
2.91
1148
4.74
1377
2.87
1780
1.86
1821
7.31
7005
4.45
2016
1.79
HPCL
3467
.43
3354
2883
.65
4081
.44
2754
.67
2641
.87
3773
.33
1801
.64
2669
.61
1791
.85
1539
.78
1430
.09
1974
.26
1212
.23
929.
7610
554.
9871
10.0
0BP
CL44
7935
4638
29.5
947
47.7
436
1843
73.5
852
5057
93.5
068
74.7
565
01.3
272
5082
8710
597.
0088
43.8
012
914.
0836
279.
0071
00.6
4M
RPL
6817
2847
.47
2248
.55
2524
.48
1542
.84
1448
.74
1300
.15
1880
2747
.36
1564
.00
1213
.77
1502
.03
169.
3539
6.59
412.
4183
59.0
911
37.7
5CP
CL78
5.68
279.
3826
0.56
299.
2719
222
8.60
1102
617
465.
9013
00.0
312
5012
7210
73.0
011
50.0
011
3433
61.0
684
5.00
NRL
272
225
160.
6036
8.88
293
372.
1417
7.65
111
102.
7711
510
470
.27
157.
0023
0.00
289.
6999
5.47
1260
.95
BALM
ER L
AWRI
E55
5567
.28
7070
119.
5562
158
79.7
910
010
045
.37
50.0
050
.50
73.7
538
5.74
50.0
0BI
ECCO
LAW
RIE
8.00
8.00
0.00
7.00
7.00
0.00
7.00
0.00
0.00
0.00
0.00
0.00
0.00
0.00
0.00
0.00
0.00
Tota
l (I&
EBR)
7968
4.88
7684
0.14
6807
9.69
7900
9.17
1073
90.9
610
7092
.38
8063
4.82
7034
9.32
6982
8.81
7518
5.72
6825
2.35
6611
8.89
7760
0.42
9051
7.77
9230
2.29
4034
22.0
686
027.
29G
ross
Bud
geta
ry S
uppo
rt S
chem
es (G
BS)
1. R
ajiv
Gan
dhi I
nstt
. of P
etro
leum
Te
chno
logy
(RGI
PT)
41.0
010
.00
0.00
41.0
015
.00
0.00
42.0
01.
000.
0048
.00
48.0
048
.00
47.0
010
0.00
100.
0014
8.00
135.
10
2. S
trat
egic
Sto
rage
Pro
gram
me
for
Stor
age
of C
rude
Oil
by IS
PRL
1.00
0.00
0.00
1.00
0.00
0.00
1.00
2400
.00
0.00
1.00
1153
.00
1153
.00
1.00
2001
.00
2001
.00
3154
.00
2499
.00
3. I
SPLR
Pha
se-II
(Con
stru
ction
of
cave
rns)
0.00
0.00
0.00
0.00
0.00
0.00
0.00
0.00
0.00
0.00
0.00
0.00
1.00
0.00
0.00
0.00
1.00
4. S
etting
up
Petr
oleu
m U
nive
rsity
in
Andh
ra P
rade
sh0.
000.
000.
000.
000.
000.
000.
001.
000.
001.
001.
000.
002.
0032
.00
32.0
032
.00
145.
20
5. L
PG C
onne
ction
s to
BPL
Hous
ehol
ds**
1.00
0.00
0.00
1.00
0.00
0.00
0.00
0.00
0.00
0.00
0.00
0.00
0.00
0.00
0.00
0.00
0.00
6. S
chem
e fo
r LPG
Con
necti
on to
Poo
r Ho
useh
olds
-PM
UY
(Ujjw
ala)
0.00
0.00
0.00
0.00
0.00
0.00
0.00
0.00
0.00
0.00
0.00
0.00
2000
.00
2500
.00
2500
.00
2500
.00
2500
.00
7. E
sttab
lishm
ent o
f RGI
PT C
entr
e, A
ssam
0.00
0.00
0.00
0.00
0.00
0.00
0.00
0.00
0.00
0.00
0.00
0.00
0.00
0.00
0.00
0.00
1.00
8. E
sttab
lishm
ent o
f Cen
tre
of E
xcel
lenc
e fo
r Ene
rgy,
Bang
alor
e0.
000.
000.
000.
000.
000.
000.
000.
000.
000.
000.
000.
000.
000.
000.
000.
001.
00
Tota
l (G
BS)
43.0
010
.00
0.00
43.0
015
.00
0.00
43.0
024
02.0
00.
0050
.00
1202
.00
1201
.00
2051
.00
4633
.00
4633
.00
5834
.00
5282
.30
Tota
l (I&
EBR
& G
BS)
7972
7.88
7685
0.14
6807
9.69
7905
2.17
1074
05.9
610
7092
.38
8067
7.82
7275
1.32
6982
8.81
7523
5.72
6945
4.35
6731
9.89
7965
1.42
9515
0.77
9693
5.29
4092
56.0
691
309.
59N
ote:
1
. Due
to p
rintin
g ty
pogr
aphi
c er
ror,
Plan
out
lay
for C
PCL
for 2
015-
16 w
as p
rinte
d as
₹22
30.9
0 cr
ore
in B
udge
t Doc
umen
t - 2
015-
16 a
gain
st th
eir p
ropo
sal o
f ₹1
300
cror
e. 2
. RE
for O
VL fo
r 201
4-15
pro
pose
d to
M/o
PN
G w
as 1
0147
cro
re in
stea
d of
₹12
387
cror
e, p
rinte
d in
Bud
get D
ocum
ent f
or 2
015-
16.
3. *
* It
has s
ince
bee
n de
cide
d (a
t RE
stag
e in
201
3-14
) tha
t the
sche
me
on L
PG C
onne
ction
s to
BPL
Fam
ilies
wou
ld n
ot b
e ta
ken
from
the
GBS
and
fund
s wou
ld b
e pr
ovid
ed fr
om C
SR fu
nds o
f CPS
Es in
th
e P&
NG
Sect
or.
4. G
AIL
for 2
016-
17, t
otal
Cap
ex ta
rget
for R
E 20
16-1
7 is
Rs 2
098
cror
e w
hich
incl
uded
₹90
0 cr
ore
prop
osed
as G
BS fo
r JHD
BP.
How
ever
, ₹45
0 cr
ore
has b
een
gran
ted
whi
ch in
clud
ed in
act
ual e
xpen
ditu
re.
5
. BPC
L fo
r 201
6-17
= BP
CL re
port
ed ₹
423.
79 c
rore
util
ised
for P
etro
chem
ical
s sec
tor.
How
ever
, the
re is
no
prov
ision
mad
e in
BE
& R
E fo
r the
sect
or. T
here
fore
, it i
s inc
lude
d in
Mar
ketin
g &
Refi
nery
Sec
tor.
6
.BPC
L fo
r 201
6-17
= B
E &
RE
and
act
ual r
epre
sent
onl
y Pl
an B
udge
t. N
on-P
lan
of ₹
2500
cro
re fo
r BE
& ₹
3464
cro
re fo
r RE
is no
t inc
lude
d in
the
abov
e am
ount
.
7. G
AIL
for 2
017-
18 =
Exc
lude
s ₹12
00 c
rore
GBS
with
this,
the
tota
l out
lay
of G
AIL
is ₹3
253.
00 c
rore
8
. OIL
for 2
017-
18 =
Out
of t
otal
IEBR
of ₹
9252
.34
cror
e, to
tal C
APEX
(inc
ludi
ng JV
/Sub
sidia
ries)
inve
stm
ent i
s ₹42
89.5
6 cr
ore.
9
. BPC
L fo
r 201
7-18
= D
ue to
prin
ting
erro
r ₹70
0 cr
ore
prop
osed
for p
etro
chem
ical
s has
not
bee
n ac
coun
ted
for i
n BE
201
7-18
. Nec
essa
ry re
ctific
ation
will
be
take
n at
the
RE st
age
2017
-18.
10
. Du
ring
the
curr
ent fi
nanc
ial y
ear 2
017-
18,th
e di
stinc
tion
betw
een
Plan
and
Non
-Pla
n ha
s bee
n do
ne a
way
with
. So
urce
: Min
istry
of P
etro
leum
and
Nat
ural
Gas
CHAPTER ICHAPTER II
CHAPTER IIICHAPTER IV
CHAPTER VCHAPTER VI
CHAPTER VIICHAPTER VIII
CHAPTER IXCHAPTER X
CHAPTER XIAPPEN
DIX
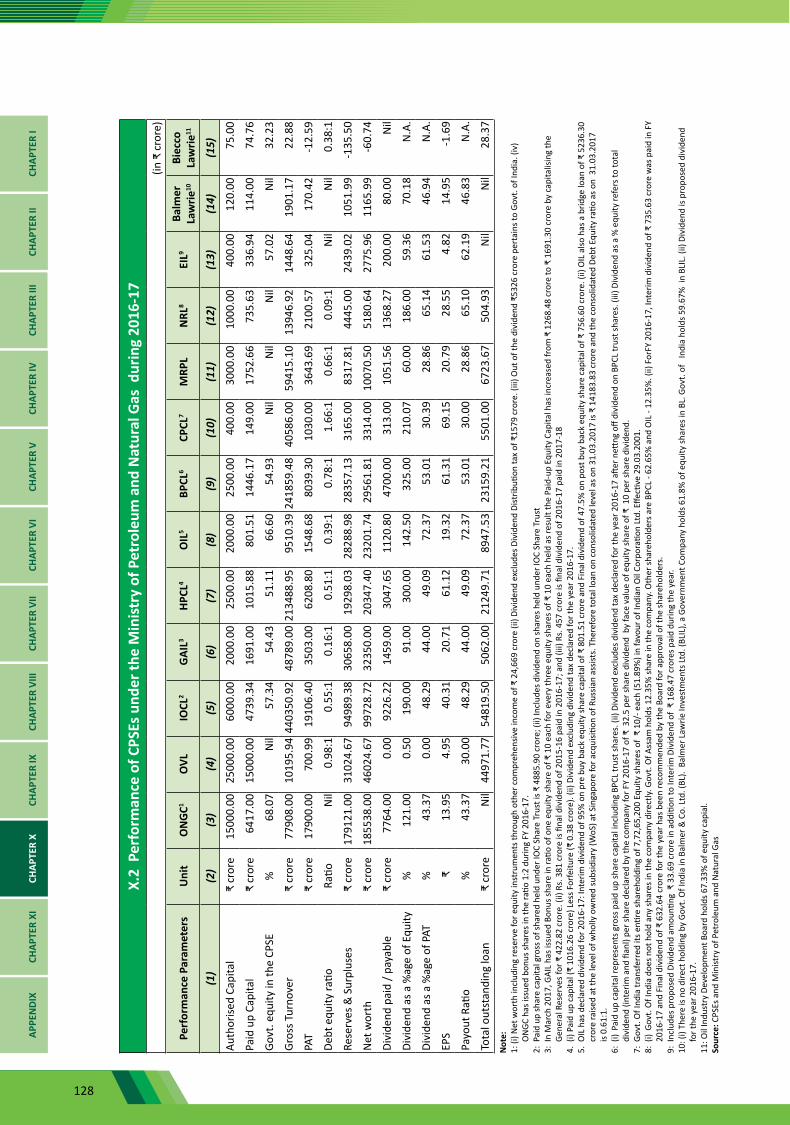
128
X.2
Per
form
ance
of C
PSEs
und
er th
e M
inis
try
of P
etro
leum
and
Nat
ural
Gas
dur
ing
2016
-17
(in ₹
cro
re)
Perf
orm
ance
Par
amet
ers
Uni
tO
NG
C1O
VLIO
CL2
GAI
L3HP
CL4
OIL
5BP
CL6
CPCL
7M
RPL
NRL
8EI
L9Ba
lmer
La
wrie
10Bi
ecco
La
wrie
11
(1)
(2)
(3)
(4)
(5)
(6)
(7)
(8)
(9)
(10)
(11)
(12)
(13)
(14)
(15)
Auth
orise
d Ca
pita
l ₹
cro
re15
000.
0025
000.
0060
00.0
020
00.0
025
00.0
020
00.0
025
00.0
040
0.00
3000
.00
1000
.00
400.
0012
0.00
75.0
0
Paid
up
Capi
tal
₹ c
rore
6417
.00
1500
0.00
4739
.34
1691
.00
1015
.88
801.
5114
46.1
714
9.00
1752
.66
735.
6333
6.94
114.
0074
.76
Govt
. equ
ity in
the
CPSE
%
68.0
7N
il57
.34
54.4
351
.11
66.6
054
.93
Nil
Nil
Nil
57.0
2N
il32
.23
Gros
s Tur
nove
r ₹
cro
re77
908.
0010
195.
9444
0350
.92
4878
9.00
2134
88.9
595
10.3
924
1859
.48
4058
6.00
5941
5.10
1394
6.92
1448
.64
1901
.17
22.8
8
PAT
₹ c
rore
1790
0.00
700.
9919
106.
4035
03.0
062
08.8
015
48.6
880
39.3
010
30.0
036
43.6
921
00.5
732
5.04
170.
42-1
2.59
Debt
equ
ity ra
tio
Ratio
N
il0.
98:1
0.55
:10.
16:1
0.51
:10.
39:1
0.78
:11.
66:1
0.66
:10.
09:1
Nil
Nil
0.38
:1
Rese
rves
& S
urpl
uses
₹ c
rore
1791
21.0
031
024.
6794
989.
3830
658.
0019
298.
0328
288.
9828
357.
1331
65.0
083
17.8
144
45.0
024
39.0
210
51.9
9-1
35.5
0
Net
wor
th
₹ c
rore
1855
38.0
046
024.
6799
728.
7232
350.
0020
347.
4023
201.
7429
561.
8133
14.0
010
070.
5051
80.6
427
75.9
611
65.9
9-6
0.74
Divi
dend
pai
d / p
ayab
le
₹ c
rore
7764
.00
0.00
9226
.22
1459
.00
3047
.65
1120
.80
4700
.00
313.
0010
51.5
613
68.2
720
0.00
80.0
0N
il
Divi
dend
as a
%ag
e of
Equ
ity
%
121.
000.
5019
0.00
91.0
030
0.00
142.
5032
5.00
210.
0760
.00
186.
0059
.36
70.1
8N
.A.
Divi
dend
as a
%ag
e of
PAT
%
43.3
70.
0048
.29
44.0
049
.09
72.3
753
.01
30.3
928
.86
65.1
461
.53
46.9
4N
.A.
EPS
₹13
.95
4.95
40.3
120
.71
61.1
219
.32
61.3
169
.15
20.7
928
.55
4.82
14.9
5-1
.69
Payo
ut R
atio
%
43.3
730
.00
48.2
944
.00
49.0
972
.37
53.0
130
.00
28.8
665
.10
62.1
946
.83
N.A
.
Tota
l out
stan
ding
loan
₹
cro
reN
il44
971.
7754
819.
5050
62.0
021
249.
7189
47.5
323
159.
2155
01.0
067
23.6
750
4.93
Nil
Nil
28.3
7N
ote:
1: (i
) Net
wor
th in
clud
ing
rese
rve
for e
quity
inst
rum
ents
thro
ugh
othe
r com
preh
ensiv
e in
com
e of
₹ 2
4,66
9 cr
ore
(ii) D
ivid
end
excl
udes
Div
iden
d Di
strib
ution
tax
of ₹
1579
cro
re. (
iii) O
ut o
f the
div
iden
d ₹5
326
cror
e pe
rtai
ns to
Gov
t. of
Indi
a. (i
v)
ON
GC h
as is
sued
bon
us sh
ares
in th
e ra
tio 1
:2 d
urin
g FY
201
6-17
.2:
Pai
d up
shar
e ca
pita
l gro
ss o
f sha
red
held
und
er IO
C Sh
are
Trus
t is ₹
488
5.90
cro
re; (
ii) In
clud
es d
ivid
end
on sh
ares
hel
d un
der I
OC
Shar
e Tr
ust
3:
In
Mar
ch 2
017,
GAI
L ha
s iss
ued
Bonu
s sha
re in
ratio
of o
ne e
quity
shar
e of
₹ 1
0 ea
ch fo
r eve
ry th
ree
equi
ty sh
ares
of ₹
10
each
hel
d as
resu
lt th
e Pa
id-u
p Eq
uity
Cap
ital h
as in
crea
sed
from
₹ 1
268.
48 c
rore
to ₹
169
1.30
cro
re b
y ca
pita
lisin
g th
e Ge
nera
l Res
erve
s for
₹ 4
22.8
2 cr
ore.
(ii)
Rs. 3
81 c
rore
is fi
nal d
ivid
end
of 2
015-
16 p
aid
in 2
016-
17; a
nd (i
ii) R
s. 4
57 c
rore
is fi
nal d
ivid
end
of 2
016-
17 p
aid
in 2
017-
184.
(i)
Paid
up
capi
tal (
₹ 10
16.2
6 cr
ore)
Les
s For
feitu
re (₹
0.3
8 cr
ore)
. (ii)
Div
iden
d ex
clud
ing
divi
dend
tax
decl
ared
for t
he y
ear 2
016-
17.
5. O
IL h
as d
ecla
red
divi
dend
for 2
016-
17: I
nter
im d
ivid
end
of 9
5% o
n pr
e bu
y ba
ck e
quity
shar
e ca
pita
l of ₹
801
.51
cror
e an
d Fi
nal d
ivid
end
of 4
7.5%
on
post
buy
bac
k eq
uity
shar
e ca
pita
l of ₹
756
.60
cror
e. (i
i) O
IL a
lso h
as a
brid
ge lo
an o
f ₹ 5
236.
30
cror
e ra
ised
at th
e le
vel o
f who
lly o
wne
d su
bsid
iary
(WoS
) at S
inga
pore
for a
cqui
sition
of R
ussia
n as
sists
. The
refo
re to
tal l
oan
on c
onso
lidat
ed le
vel a
s on
31.0
3.20
17 is
₹ 1
4183
.83
cror
e an
d th
e co
nsol
idat
ed D
ebt E
quity
ratio
as o
n 3
1.03
.201
7 is
0.61
:1.
6: (
i) Pa
id u
p ca
pita
l rep
rese
nts g
ross
pai
d up
shar
e ca
pita
l inc
ludi
ng B
PCL
trus
t sha
res.
(ii)
Divi
dend
exc
lude
s div
iden
d ta
x de
clar
ed fo
r the
yea
r 201
6-17
afte
r nett
ng o
ff di
vide
nd o
n BP
CL tr
ust s
hare
s. (i
ii) D
ivid
end
as a
% e
quity
refe
rs to
tota
l di
vide
nd (i
nter
im a
nd fi
anl)
per s
hare
dec
lare
d by
the
com
pany
for F
Y 20
16-1
7 of
₹ 3
2.5
per s
hare
div
iden
d b
y fa
ce v
alue
of e
quity
shar
e of
₹ 1
0 pe
r sha
re d
ivid
end.
7: G
ovt.
Of I
ndia
tran
sfer
red
its e
ntire
shar
ehol
ding
of 7
,72,
65,2
00 E
quity
shar
es o
f ₹
10/-
eac
h (5
1.89
%) i
n fa
vour
of I
ndia
n O
il Co
rpor
ation
Ltd.
Effe
ctive
29.
03.2
001.
8: (
i) Go
vt. O
f Ind
ia d
oes n
ot h
old
any
shar
es in
the
com
pany
dire
ctly.
Gov
t. O
f Ass
am h
olds
12.
35%
shar
e in
the
com
pany
. Oth
er sh
areh
olde
rs a
re B
PCL
- 62.
65%
and
OIL
- 12
.35%
. (ii)
For
FY 2
016-
17, I
nter
im d
ivid
end
of ₹
735
.63
cror
e w
as p
aid
in F
Y 20
16-1
7 an
d Fi
nal d
ivid
end
of ₹
632
.64
cror
e fo
r the
yea
r has
bee
n re
com
men
ded
by th
e Bo
ard
for a
ppro
val o
f the
shar
ehol
ders
.
9:
Inc
lude
s pro
pose
d Di
vide
nd a
mou
nting
₹ 3
3.69
cro
re in
add
ition
to In
terim
Div
iden
d of
₹ 1
68.4
7 cr
ores
pai
d du
ring
the
year
.
10
: (i)
Ther
e is
no d
irect
hol
ding
by
Govt
. Of I
ndia
in B
alm
er &
Co.
Ltd.
(BL)
. Ba
lmer
Law
rie In
vest
men
ts Lt
d. (B
LIL)
, a G
over
nmen
t Com
pany
hol
ds 6
1.8%
of e
quity
shar
es in
BL.
Gov
t. of
In
dia
hold
s 59.
67%
in
BLIL
. (ii)
Div
iden
d is
prop
osed
div
iden
d fo
r the
yea
r 201
6-17
.
11: O
il In
dust
ry D
evel
opm
ent B
oard
hol
ds 6
7.33
% o
f equ
ity c
apia
l.
So
urce
: CPS
Es a
nd M
inist
ry o
f Pet
role
um a
nd N
atur
al G
as
CHAP
TER
ICH
APTE
R II
CHAP
TER
IIICH
APTE
R IV
CHAP
TER
VCH
APTE
R VI
CHAP
TER
VII
CHAP
TER
VIII
CHAP
TER
IXCH
APTE
R X
CHAP
TER
XIAP
PEN
DIX
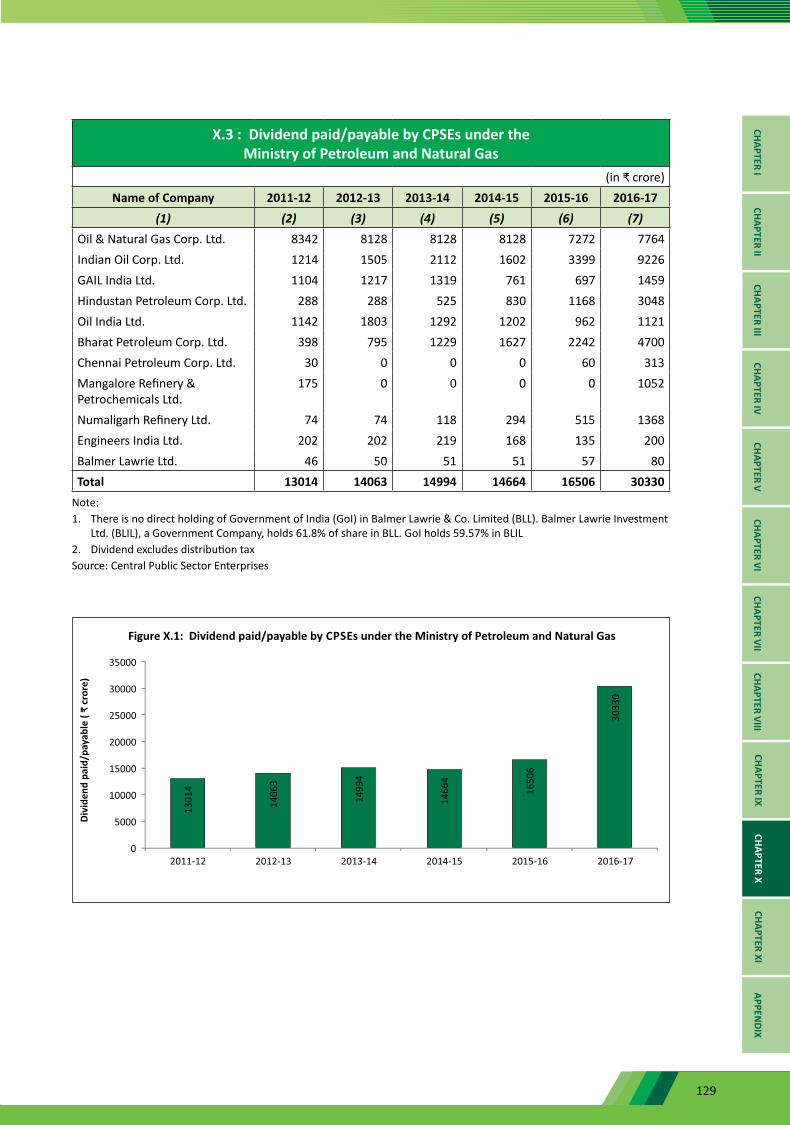
129
X.3 : Dividend paid/payable by CPSEs under the Ministry of Petroleum and Natural Gas
(in ₹ crore)Name of Company 2011-12 2012-13 2013-14 2014-15 2015-16 2016-17
(1) (2) (3) (4) (5) (6) (7)Oil & Natural Gas Corp. Ltd. 8342 8128 8128 8128 7272 7764Indian Oil Corp. Ltd. 1214 1505 2112 1602 3399 9226GAIL India Ltd. 1104 1217 1319 761 697 1459Hindustan Petroleum Corp. Ltd. 288 288 525 830 1168 3048Oil India Ltd. 1142 1803 1292 1202 962 1121Bharat Petroleum Corp. Ltd. 398 795 1229 1627 2242 4700Chennai Petroleum Corp. Ltd. 30 0 0 0 60 313Mangalore Refinery & Petrochemicals Ltd.
175 0 0 0 0 1052
Numaligarh Refinery Ltd. 74 74 118 294 515 1368Engineers India Ltd. 202 202 219 168 135 200Balmer Lawrie Ltd. 46 50 51 51 57 80Total 13014 14063 14994 14664 16506 30330
Note:1. There is no direct holding of Government of India (GoI) in Balmer Lawrie & Co. Limited (BLL). Balmer Lawrie Investment
Ltd. (BLIL), a Government Company, holds 61.8% of share in BLL. GoI holds 59.57% in BLIL 2. Dividend excludes distribution tax Source: Central Public Sector Enterprises
CHAPTER ICHAPTER II
CHAPTER IIICHAPTER IV
CHAPTER VCHAPTER VI
CHAPTER VIICHAPTER VIII
CHAPTER IXCHAPTER X
CHAPTER XIAPPEN
DIX
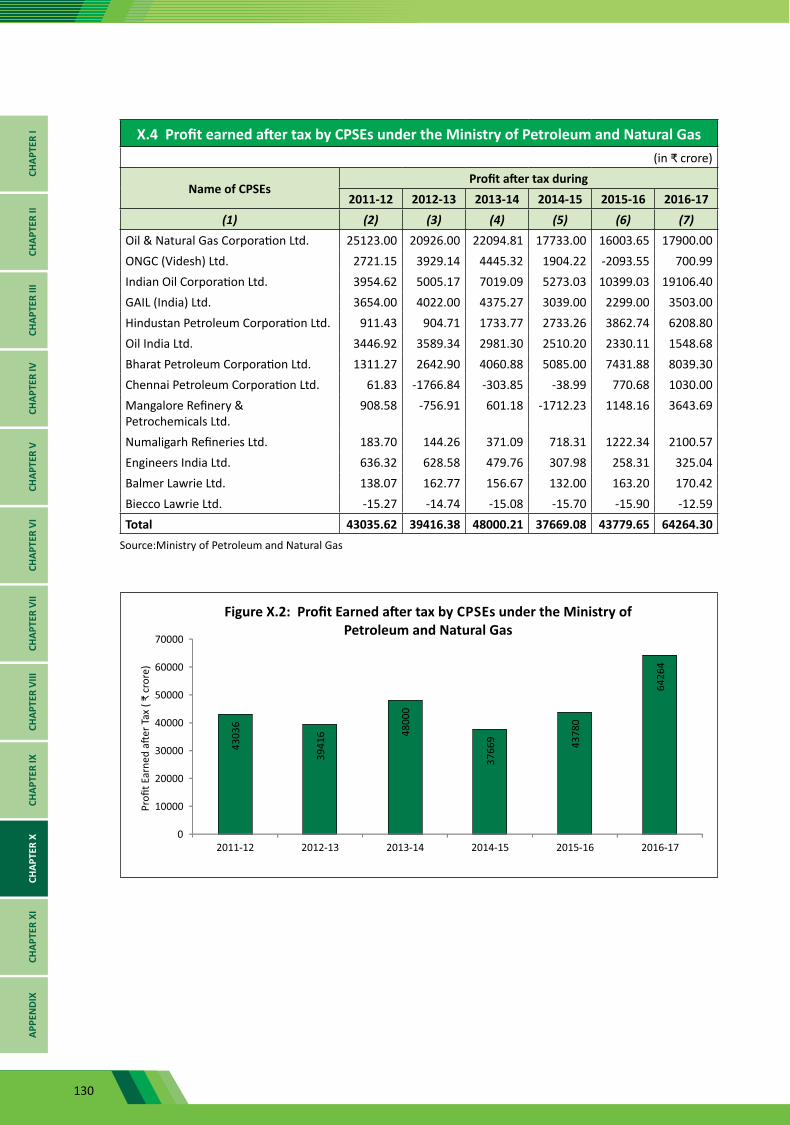
130
X.4 Profit earned after tax by CPSEs under the Ministry of Petroleum and Natural Gas(in ₹ crore)
Name of CPSEsProfit after tax during
2011-12 2012-13 2013-14 2014-15 2015-16 2016-17(1) (2) (3) (4) (5) (6) (7)
Oil & Natural Gas Corporation Ltd. 25123.00 20926.00 22094.81 17733.00 16003.65 17900.00ONGC (Videsh) Ltd. 2721.15 3929.14 4445.32 1904.22 -2093.55 700.99Indian Oil Corporation Ltd. 3954.62 5005.17 7019.09 5273.03 10399.03 19106.40GAIL (India) Ltd. 3654.00 4022.00 4375.27 3039.00 2299.00 3503.00Hindustan Petroleum Corporation Ltd. 911.43 904.71 1733.77 2733.26 3862.74 6208.80Oil India Ltd. 3446.92 3589.34 2981.30 2510.20 2330.11 1548.68Bharat Petroleum Corporation Ltd. 1311.27 2642.90 4060.88 5085.00 7431.88 8039.30Chennai Petroleum Corporation Ltd. 61.83 -1766.84 -303.85 -38.99 770.68 1030.00Mangalore Refinery & Petrochemicals Ltd.
908.58 -756.91 601.18 -1712.23 1148.16 3643.69
Numaligarh Refineries Ltd. 183.70 144.26 371.09 718.31 1222.34 2100.57Engineers India Ltd. 636.32 628.58 479.76 307.98 258.31 325.04Balmer Lawrie Ltd. 138.07 162.77 156.67 132.00 163.20 170.42Biecco Lawrie Ltd. -15.27 -14.74 -15.08 -15.70 -15.90 -12.59Total 43035.62 39416.38 48000.21 37669.08 43779.65 64264.30
Source:Ministry of Petroleum and Natural Gas
CHAP
TER
ICH
APTE
R II
CHAP
TER
IIICH
APTE
R IV
CHAP
TER
VCH
APTE
R VI
CHAP
TER
VII
CHAP
TER
VIII
CHAP
TER
IXCH
APTE
R X
CHAP
TER
XIAP
PEN
DIX
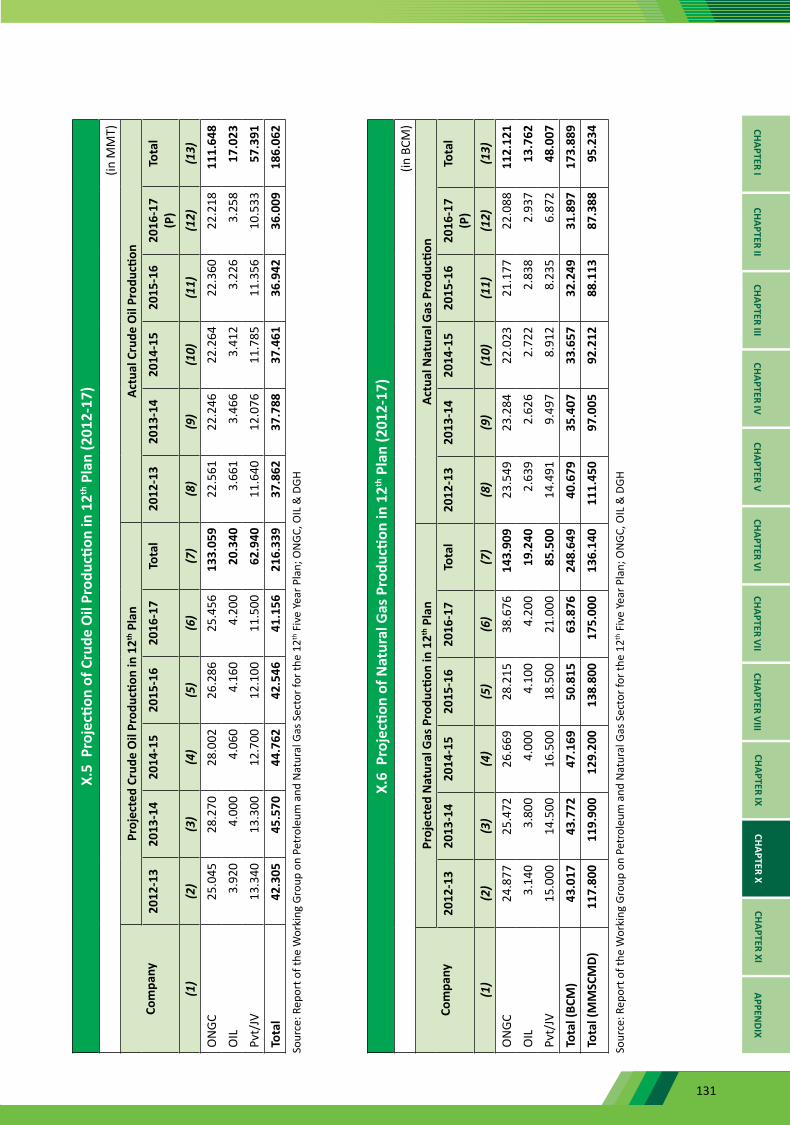
131
X.5
Pro
jecti
on o
f Cru
de O
il Pr
oduc
tion
in 1
2th P
lan
(201
2-17
)(in
MM
T)
Com
pany
Proj
ecte
d Cr
ude
Oil
Prod
uctio
n in
12th
Pla
nAc
tual
Cru
de O
il Pr
oduc
tion
2012
-13
2013
-14
2014
-15
2015
-16
2016
-17
Tota
l20
12-1
320
13-1
420
14-1
520
15-1
620
16-1
7 (P
)To
tal
(1)
(2)
(3)
(4)
(5)
(6)
(7)
(8)
(9)
(10)
(11)
(12)
(13)
ON
GC25
.045
28.2
7028
.002
26.2
8625
.456
133.
059
22.5
6122
.246
22.2
6422
.360
22.2
1811
1.64
8
OIL
3.92
04.
000
4.06
04.
160
4.20
020
.340
3.66
13.
466
3.41
23.
226
3.25
817
.023
Pvt/
JV13
.340
13.3
0012
.700
12.1
0011
.500
62.9
4011
.640
12.0
7611
.785
11.3
5610
.533
57.3
91
Tota
l42
.305
45.5
7044
.762
42.5
4641
.156
216.
339
37.8
6237
.788
37.4
6136
.942
36.0
0918
6.06
2So
urce
: Rep
ort o
f the
Wor
king
Gro
up o
n Pe
trol
eum
and
Nat
ural
Gas
Sec
tor f
or th
e 12
th F
ive
Year
Pla
n; O
NGC
, OIL
& D
GH
X.6
Pro
jecti
on o
f Nat
ural
Gas
Pro
ducti
on in
12th
Pla
n (2
012-
17)
(in B
CM)
Com
pany
Proj
ecte
d N
atur
al G
as P
rodu
ction
in 1
2th P
lan
Actu
al N
atur
al G
as P
rodu
ction
2012
-13
2013
-14
2014
-15
2015
-16
2016
-17
Tota
l20
12-1
320
13-1
420
14-1
520
15-1
620
16-1
7 (P
)To
tal
(1)
(2)
(3)
(4)
(5)
(6)
(7)
(8)
(9)
(10)
(11)
(12)
(13)
ON
GC24
.877
25.4
7226
.669
28.2
1538
.676
143.
909
23.5
4923
.284
22.0
2321
.177
22.0
8811
2.12
1
OIL
3.14
03.
800
4.00
04.
100
4.20
019
.240
2.63
92.
626
2.72
22.
838
2.93
713
.762
Pvt/
JV15
.000
14.5
0016
.500
18.5
0021
.000
85.5
0014
.491
9.49
78.
912
8.23
56.
872
48.0
07
Tota
l (BC
M)
43.0
1743
.772
47.1
6950
.815
63.8
7624
8.64
940
.679
35.4
0733
.657
32.2
4931
.897
173.
889
Tota
l (M
MSC
MD)
117.
800
119.
900
129.
200
138.
800
175.
000
136.
140
111.
450
97.0
0592
.212
88.1
1387
.388
95.2
34
Sour
ce: R
epor
t of t
he W
orki
ng G
roup
on
Petr
oleu
m a
nd N
atur
al G
as S
ecto
r for
the
12th
Fiv
e Ye
ar P
lan;
ON
GC, O
IL &
DGH
CHAPTER ICHAPTER II
CHAPTER IIICHAPTER IV
CHAPTER VCHAPTER VI
CHAPTER VIICHAPTER VIII
CHAPTER IXCHAPTER X
CHAPTER XIAPPEN
DIX
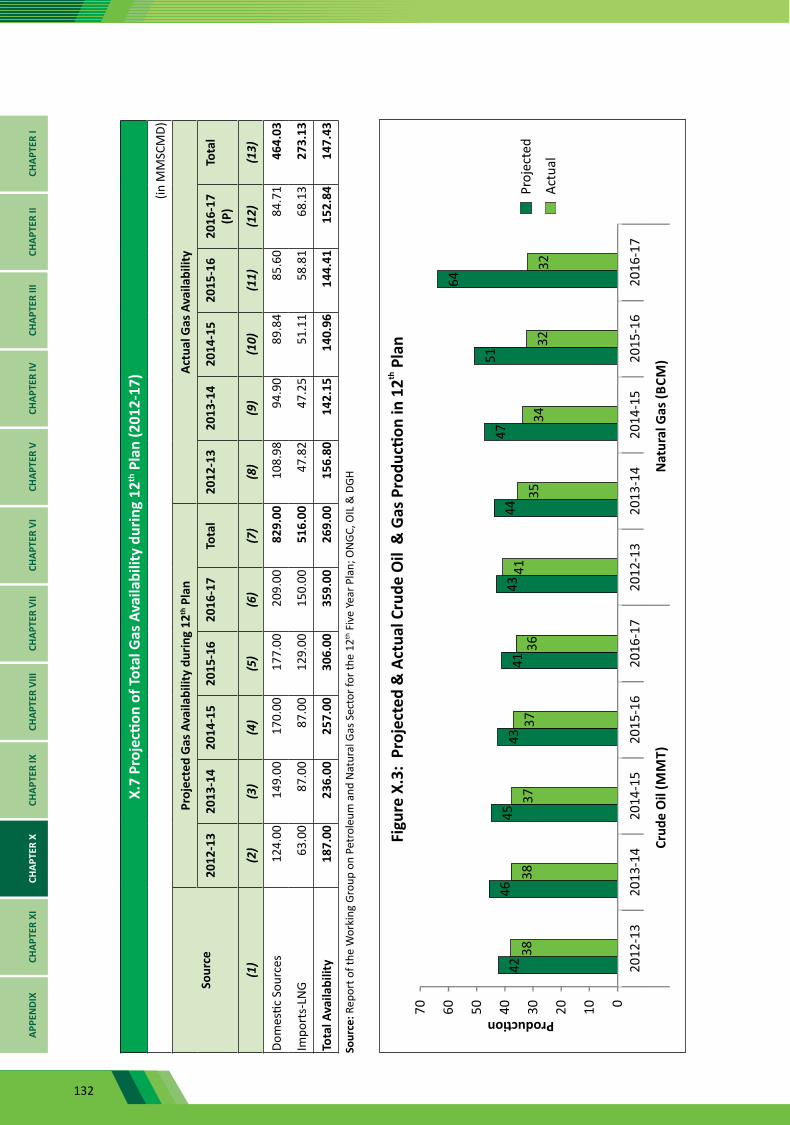
132
X.7
Proj
ectio
n of
Tot
al G
as A
vaila
bilit
y du
ring
12th
Pla
n (2
012-
17)
(in M
MSC
MD)
Sour
cePr
ojec
ted
Gas
Ava
ilabi
lity
durin
g 12
th P
lan
Actu
al G
as A
vaila
bilit
y
2012
-13
2013
-14
2014
-15
2015
-16
2016
-17
Tota
l20
12-1
320
13-1
420
14-1
520
15-1
620
16-1
7 (P
)To
tal
(1)
(2)
(3)
(4)
(5)
(6)
(7)
(8)
(9)
(10)
(11)
(12)
(13)
Dom
estic
Sou
rces
124.
0014
9.00
170.
0017
7.00
209.
0082
9.00
108.
9894
.90
89.8
485
.60
84.7
146
4.03
Impo
rts-
LNG
63.0
087
.00
87.0
012
9.00
150.
0051
6.00
47.8
247
.25
51.1
158
.81
68.1
327
3.13
Tota
l Ava
ilabi
lity
187.
0023
6.00
257.
0030
6.00
359.
0026
9.00
156.
8014
2.15
140.
9614
4.41
152.
8414
7.43
Sour
ce: R
epor
t of t
he W
orki
ng G
roup
on
Petr
oleu
m a
nd N
atur
al G
as S
ecto
r for
the
12th
Fiv
e Ye
ar P
lan;
ON
GC, O
IL &
DGH
CHAP
TER
ICH
APTE
R II
CHAP
TER
IIICH
APTE
R IV
CHAP
TER
VCH
APTE
R VI
CHAP
TER
VII
CHAP
TER
VIII
CHAP
TER
IXCH
APTE
R X
CHAP
TER
XIAP
PEN
DIX
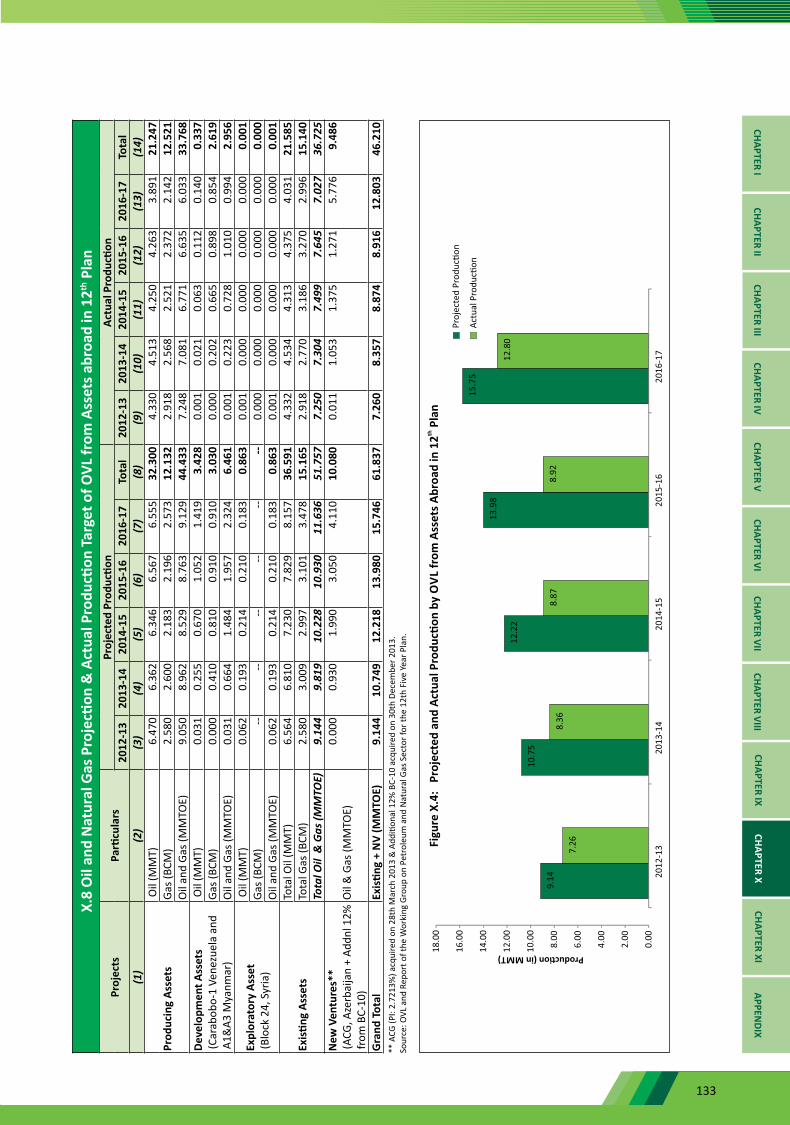
133
X.
8 O
il an
d N
atur
al G
as P
roje
ction
& A
ctua
l Pro
ducti
on T
arge
t of O
VL fr
om A
sset
s abr
oad
in 1
2th P
lan
Proj
ects
Parti
cula
rsPr
ojec
ted
Prod
uctio
nAc
tual
Pro
ducti
on20
12-1
320
13-1
420
14-1
520
15-1
620
16-1
7To
tal
2012
-13
2013
-14
2014
-15
2015
-16
2016
-17
Tota
l(1
)(2
)(3
)(4
)(5
)(6
)(7
)(8
)(9
)(1
0)(1
1)(1
2)(1
3)(1
4)
Prod
ucin
g As
sets
Oil
(MM
T)6.
470
6.36
26.
346
6.56
76.
555
32.3
004.
330
4.51
34.
250
4.26
33.
891
21.2
47Ga
s (BC
M)
2.58
02.
600
2.18
32.
196
2.57
312
.132
2.91
82.
568
2.52
12.
372
2.14
212
.521
Oil
and
Gas (
MM
TOE)
9.05
08.
962
8.52
98.
763
9.12
944
.433
7.24
87.
081
6.77
16.
635
6.03
333
.768
Deve
lopm
ent A
sset
s (C
arab
obo-
1 Ve
nezu
ela
and
A1&
A3 M
yanm
ar)
Oil
(MM
T)0.
031
0.25
50.
670
1.05
21.
419
3.42
80.
001
0.02
10.
063
0.11
20.
140
0.33
7Ga
s (BC
M)
0.00
00.
410
0.81
00.
910
0.91
03.
030
0.00
00.
202
0.66
50.
898
0.85
42.
619
Oil
and
Gas (
MM
TOE)
0.03
10.
664
1.48
41.
957
2.32
46.
461
0.00
10.
223
0.72
81.
010
0.99
42.
956
Expl
orat
ory
Asse
t (B
lock
24,
Syr
ia)
Oil
(MM
T)0.
062
0.19
30.
214
0.21
00.
183
0.86
30.
001
0.00
00.
000
0.00
00.
000
0.00
1Ga
s (BC
M)
----
----
----
0.00
00.
000
0.00
00.
000
0.00
00.
000
Oil
and
Gas (
MM
TOE)
0.06
20.
193
0.21
40.
210
0.18
30.
863
0.00
10.
000
0.00
00.
000
0.00
00.
001
Exis
ting
Asse
ts
Tota
l Oil
(MM
T)6.
564
6.81
07.
230
7.82
98.
157
36.5
914.
332
4.53
44.
313
4.37
54.
031
21.5
85To
tal G
as (B
CM)
2.58
03.
009
2.99
73.
101
3.47
815
.165
2.91
82.
770
3.18
63.
270
2.99
615
.140
Tota
l Oil
& G
as (M
MTO
E)9.
144
9.81
910
.228
10.9
3011
.636
51.7
577.
250
7.30
47.
499
7.64
57.
027
36.7
25N
ew V
entu
res*
* (A
CG, A
zerb
aija
n +
Addn
l 12%
fr
om B
C-10
)O
il &
Gas
(MM
TOE)
0.00
00.
930
1.99
03.
050
4.11
010
.080
0.01
11.
053
1.37
51.
271
5.77
69.
486
Gra
nd T
otal
Ex
istin
g +
NV
(MM
TOE)
9.14
410
.749
12.2
1813
.980
15.7
4661
.837
7.26
08.
357
8.87
48.
916
12.8
0346
.210
** A
CG (P
I: 2.
7213
%) a
cqui
red
on 2
8th
Mar
ch 2
013
& A
dditi
onal
12%
BC-
10 a
cqui
red
on 3
0th
Dece
mbe
r 201
3.So
urce
: OVL
and
Rep
ort o
f the
Wor
king
Gro
up o
n Pe
trol
eum
and
Nat
ural
Gas
Sec
tor f
or th
e 12
th F
ive
Year
Pla
n.
CHAPTER ICHAPTER II
CHAPTER IIICHAPTER IV
CHAPTER VCHAPTER VI
CHAPTER VIICHAPTER VIII
CHAPTER IXCHAPTER X
CHAPTER XIAPPEN
DIX
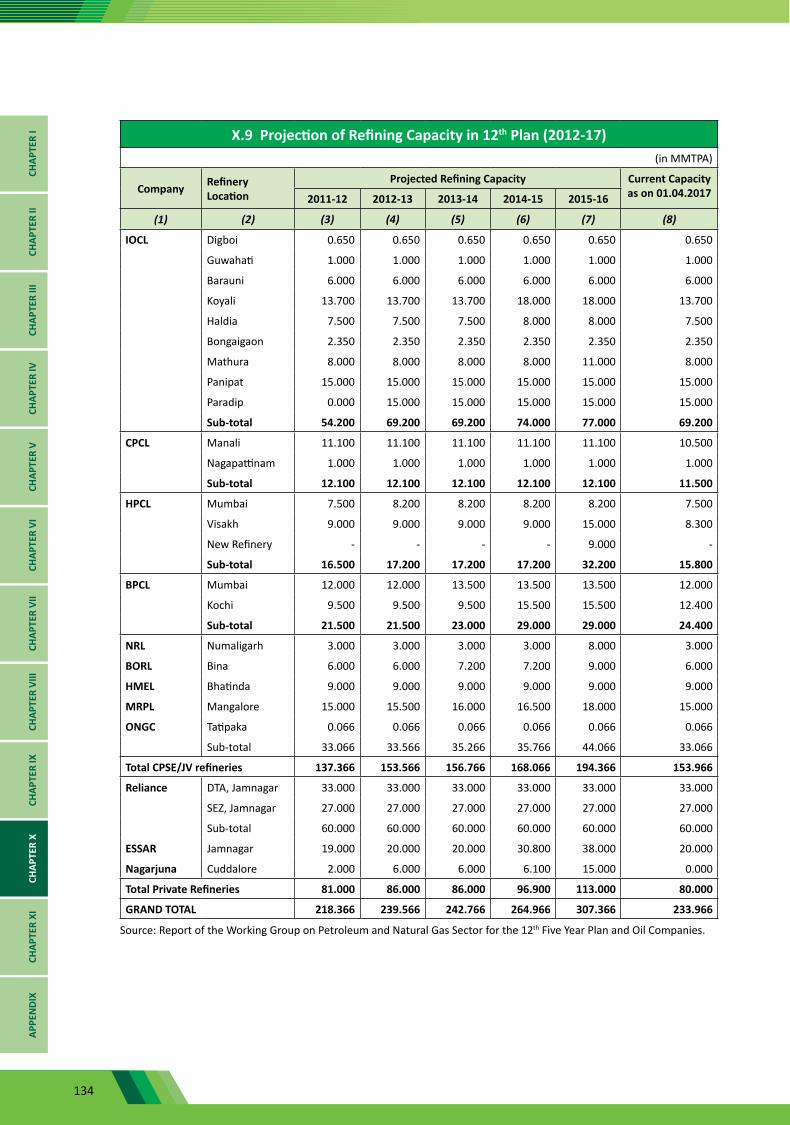
134
X.9 Projection of Refining Capacity in 12th Plan (2012-17) (in MMTPA)
Company Refinery Location
Projected Refining Capacity Current Capacity as on 01.04.20172011-12 2012-13 2013-14 2014-15 2015-16
(1) (2) (3) (4) (5) (6) (7) (8)
IOCL Digboi 0.650 0.650 0.650 0.650 0.650 0.650
Guwahati 1.000 1.000 1.000 1.000 1.000 1.000
Barauni 6.000 6.000 6.000 6.000 6.000 6.000
Koyali 13.700 13.700 13.700 18.000 18.000 13.700
Haldia 7.500 7.500 7.500 8.000 8.000 7.500
Bongaigaon 2.350 2.350 2.350 2.350 2.350 2.350
Mathura 8.000 8.000 8.000 8.000 11.000 8.000
Panipat 15.000 15.000 15.000 15.000 15.000 15.000
Paradip 0.000 15.000 15.000 15.000 15.000 15.000
Sub-total 54.200 69.200 69.200 74.000 77.000 69.200
CPCL Manali 11.100 11.100 11.100 11.100 11.100 10.500
Nagapattinam 1.000 1.000 1.000 1.000 1.000 1.000
Sub-total 12.100 12.100 12.100 12.100 12.100 11.500
HPCL Mumbai 7.500 8.200 8.200 8.200 8.200 7.500
Visakh 9.000 9.000 9.000 9.000 15.000 8.300
New Refinery - - - - 9.000 -
Sub-total 16.500 17.200 17.200 17.200 32.200 15.800
BPCL Mumbai 12.000 12.000 13.500 13.500 13.500 12.000
Kochi 9.500 9.500 9.500 15.500 15.500 12.400
Sub-total 21.500 21.500 23.000 29.000 29.000 24.400
NRL Numaligarh 3.000 3.000 3.000 3.000 8.000 3.000
BORL Bina 6.000 6.000 7.200 7.200 9.000 6.000
HMEL Bhatinda 9.000 9.000 9.000 9.000 9.000 9.000
MRPL Mangalore 15.000 15.500 16.000 16.500 18.000 15.000
ONGC Tatipaka 0.066 0.066 0.066 0.066 0.066 0.066
Sub-total 33.066 33.566 35.266 35.766 44.066 33.066
Total CPSE/JV refineries 137.366 153.566 156.766 168.066 194.366 153.966
Reliance DTA, Jamnagar 33.000 33.000 33.000 33.000 33.000 33.000
SEZ, Jamnagar 27.000 27.000 27.000 27.000 27.000 27.000
Sub-total 60.000 60.000 60.000 60.000 60.000 60.000
ESSAR Jamnagar 19.000 20.000 20.000 30.800 38.000 20.000
Nagarjuna Cuddalore 2.000 6.000 6.000 6.100 15.000 0.000
Total Private Refineries 81.000 86.000 86.000 96.900 113.000 80.000
GRAND TOTAL 218.366 239.566 242.766 264.966 307.366 233.966
Source: Report of the Working Group on Petroleum and Natural Gas Sector for the 12th Five Year Plan and Oil Companies.
CHAP
TER
ICH
APTE
R II
CHAP
TER
IIICH
APTE
R IV
CHAP
TER
VCH
APTE
R VI
CHAP
TER
VII
CHAP
TER
VIII
CHAP
TER
IXCH
APTE
R X
CHAP
TER
XIAP
PEN
DIX
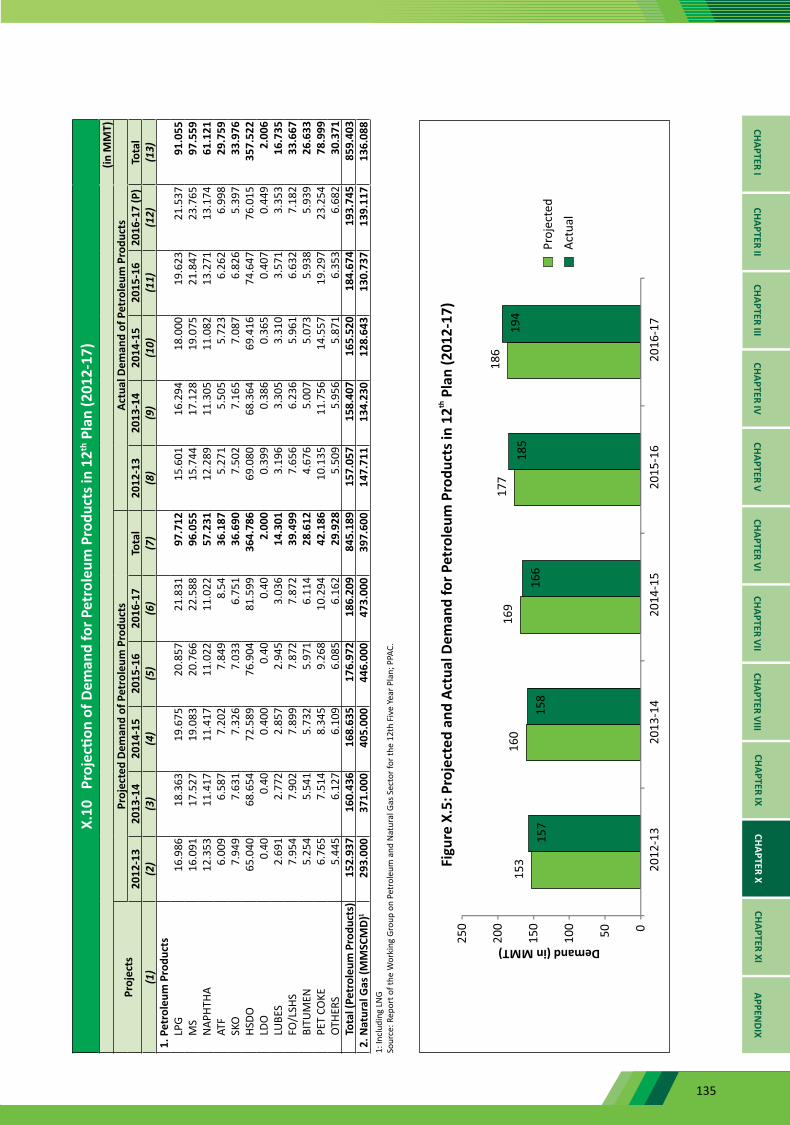
135
X.10
Pr
ojec
tion
of D
eman
d fo
r Pet
role
um P
rodu
cts i
n 12
th P
lan
(201
2-17
)(in
MM
T)
Proj
ects
Proj
ecte
d De
man
d of
Pet
role
um P
rodu
cts
Actu
al D
eman
d of
Pet
role
um P
rodu
cts
2012
-13
2013
-14
2014
-15
2015
-16
2016
-17
Tota
l20
12-1
320
13-1
420
14-1
520
15-1
620
16-1
7 (P
)To
tal
(1)
(2)
(3)
(4)
(5)
(6)
(7)
(8)
(9)
(10)
(11)
(12)
(13)
1. P
etro
leum
Pro
duct
s LP
G16
.986
18.3
6319
.675
20.8
5721
.831
97.7
1215
.601
16.2
9418
.000
19.6
2321
.537
91.0
55M
S16
.091
17.5
2719
.083
20.7
6622
.588
96.0
5515
.744
17.1
2819
.075
21.8
4723
.765
97.5
59N
APHT
HA12
.353
11.4
1711
.417
11.0
2211
.022
57.2
3112
.289
11.3
0511
.082
13.2
7113
.174
61.1
21AT
F6.
009
6.58
77.
202
7.84
98.
5436
.187
5.27
15.
505
5.72
36.
262
6.99
829
.759
SKO
7.94
97.
631
7.32
67.
033
6.75
136
.690
7.50
27.
165
7.08
76.
826
5.39
733
.976
HSDO
65.0
4068
.654
72.5
8976
.904
81.5
9936
4.78
669
.080
68.3
6469
.416
74.6
4776
.015
357.
522
LDO
0.40
0.40
0.40
00.
400.
402.
000
0.39
90.
386
0.36
50.
407
0.44
92.
006
LUBE
S2.
691
2.77
22.
857
2.94
53.
036
14.3
013.
196
3.30
53.
310
3.57
13.
353
16.7
35FO
/LSH
S7.
954
7.90
27.
899
7.87
27.
872
39.4
997.
656
6.23
65.
961
6.63
27.
182
33.6
67BI
TUM
EN5.
254
5.54
15.
732
5.97
16.
114
28.6
124.
676
5.00
75.
073
5.93
85.
939
26.6
33PE
T CO
KE6.
765
7.51
48.
345
9.26
810
.294
42.1
8610
.135
11.7
5614
.557
19.2
9723
.254
78.9
99O
THER
S5.
445
6.12
76.
109
6.08
56.
162
29.9
285.
509
5.95
65.
871
6.35
36.
682
30.3
71To
tal (
Petr
oleu
m P
rodu
cts)
152.
937
160.
436
168.
635
176.
972
186.
209
845.
189
157.
057
158.
407
165.
520
184.
674
193.
745
859.
403
2. N
atur
al G
as (M
MSC
MD)
1 29
3.00
037
1.00
040
5.00
044
6.00
047
3.00
039
7.60
014
7.71
113
4.23
012
8.64
313
0.73
713
9.11
713
6.08
81:
Incl
udin
g LN
G
Sour
ce: R
epor
t of t
he W
orki
ng G
roup
on
Petr
oleu
m a
nd N
atur
al G
as S
ecto
r for
the
12th
Fiv
e Ye
ar P
lan;
PPA
C.
CHAPTER ICHAPTER II
CHAPTER IIICHAPTER IV
CHAPTER VCHAPTER VI
CHAPTER VIICHAPTER VIII
CHAPTER IXCHAPTER X
CHAPTER XIAPPEN
DIX
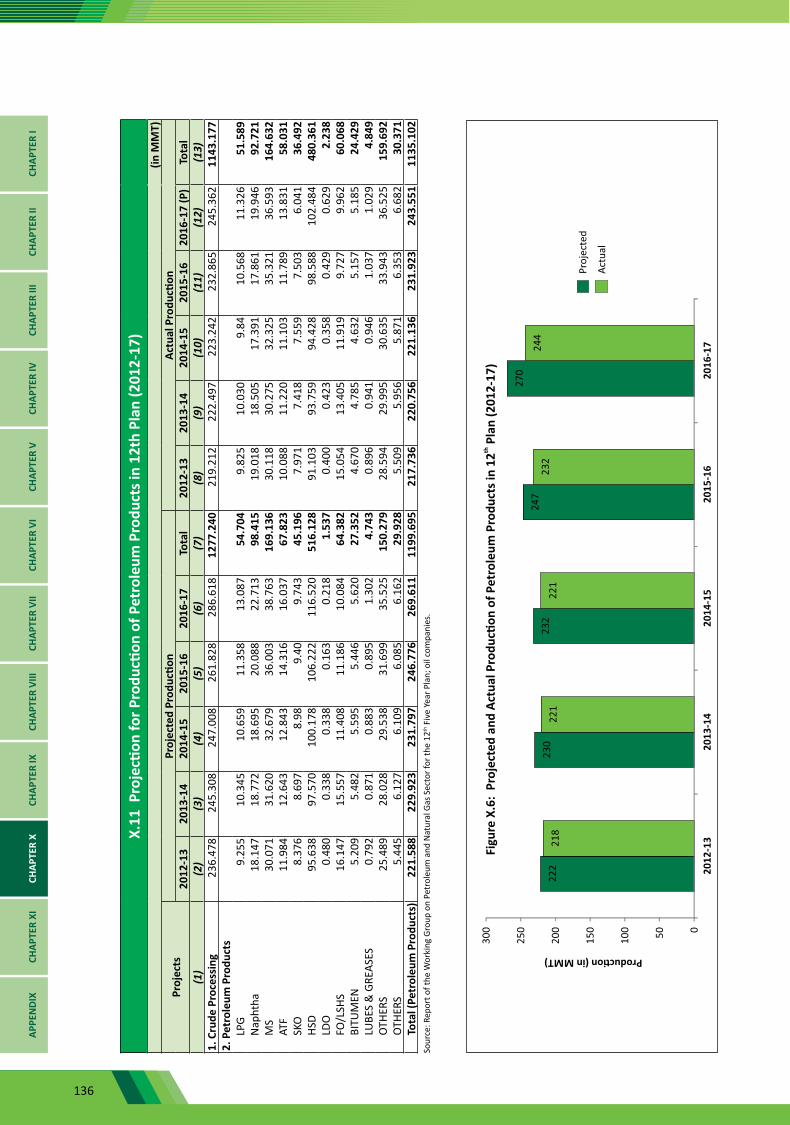
136
X.11
Pro
jecti
on fo
r Pro
ducti
on o
f Pet
role
um P
rodu
cts i
n 12
th P
lan
(201
2-17
)(in
MM
T)
Proj
ects
Proj
ecte
d Pr
oduc
tion
Actu
al P
rodu
ction
2012
-13
2013
-14
2014
-15
2015
-16
2016
-17
Tota
l20
12-1
320
13-1
420
14-1
520
15-1
620
16-1
7 (P
)To
tal
(1)
(2)
(3)
(4)
(5)
(6)
(7)
(8)
(9)
(10)
(11)
(12)
(13)
1. C
rude
Pro
cess
ing
236.
478
245.
308
247.
008
261.
828
286.
618
1277
.240
219.
212
222.
497
223.
242
232.
865
245.
362
1143
.177
2. P
etro
leum
Pro
duct
s LP
G9.
255
10.3
4510
.659
11.3
5813
.087
54.7
049.
825
10.0
309.
8410
.568
11.3
2651
.589
Nap
htha
18.1
4718
.772
18.6
9520
.088
22.7
1398
.415
19.0
1818
.505
17.3
9117
.861
19.9
4692
.721
MS
30.0
7131
.620
32.6
7936
.003
38.7
6316
9.13
630
.118
30.2
7532
.325
35.3
2136
.593
164.
632
ATF
11.9
8412
.643
12.8
4314
.316
16.0
3767
.823
10.0
8811
.220
11.1
0311
.789
13.8
3158
.031
SKO
8.37
68.
697
8.98
9.40
9.74
345
.196
7.97
17.
418
7.55
97.
503
6.04
136
.492
HSD
95.6
3897
.570
100.
178
106.
222
116.
520
516.
128
91.1
0393
.759
94.4
2898
.588
102.
484
480.
361
LDO
0.48
00.
338
0.33
80.
163
0.21
81.
537
0.40
00.
423
0.35
80.
429
0.62
92.
238
FO/L
SHS
16.1
4715
.557
11.4
0811
.186
10.0
8464
.382
15.0
5413
.405
11.9
199.
727
9.96
260
.068
BITU
MEN
5.20
95.
482
5.59
55.
446
5.62
027
.352
4.67
04.
785
4.63
25.
157
5.18
524
.429
LUBE
S &
GRE
ASES
0.79
20.
871
0.88
30.
895
1.30
24.
743
0.89
60.
941
0.94
61.
037
1.02
94.
849
OTH
ERS
25.4
8928
.028
29.5
3831
.699
35.5
2515
0.27
928
.594
29.9
9530
.635
33.9
4336
.525
159.
692
OTH
ERS
5.44
56.
127
6.10
96.
085
6.16
229
.928
5.50
95.
956
5.87
16.
353
6.68
230
.371
Tota
l (Pe
trol
eum
Pro
duct
s)22
1.58
822
9.92
323
1.79
724
6.77
626
9.61
111
99.6
9521
7.73
622
0.75
622
1.13
623
1.92
324
3.55
111
35.1
02So
urce
: Rep
ort o
f the
Wor
king
Gro
up o
n Pe
trol
eum
and
Nat
ural
Gas
Sec
tor f
or th
e 12
th F
ive
Year
Pla
n; o
il co
mpa
nies
.
CHAP
TER
ICH
APTE
R II
CHAP
TER
IIICH
APTE
R IV
CHAP
TER
VCH
APTE
R VI
CHAP
TER
VII
CHAP
TER
VIII
CHAP
TER
IXCH
APTE
R X
CHAP
TER
XIAP
PEN
DIX
137
CHAPTER ICHAPTER II
CHAPTER IIICHAPTER IV
CHAPTER VCHAPTER VI
CHAPTER VIICHAPTER VIII
CHAPTER IXCHAPTER X
CHAPTER XIAPPEN
DIX

138
Chapter Highlights
• World’s Proven Crude Oil reserves at end of 2016 are 1706.7 Thousand Million Barrels. Middle East with reserves of 813.5 Thousand Million Barrels has the highest share (47.7%), followed by Central & South America (19.2%). Asia Pacific region constitute a mere 2.8% of the total basket.
• Middle East with reserves of 79.4 Trillion cubic metres of Natural Gas has the highest share region wise (42.5%) in Proved Reserve of Natural Gas in world (186.6 Trillion cubic metres). Europe & Eurasia (56.7 Trillion cubic metres) followed by Asia Pacific (17.5 Trillion cubic metre) is having the second and third largest share region wise in World Natural gas reserves.
• World Production of Crude Oil was 4382.4 Million Tonnes during 2016, which is 0.5% higher than the Crude Oil production in 2015 (4359.58 Million Tonnes).
• Saudi Arabia had the largest share in crude oil production with 585.7 million tonnes (31.4%) for OPEC countries in 2016, followed by Iraq & Iran at 218.9 million tonnes (11.7%) and 216.4 million tonnes (11.6%) respectively.
• World Natural gas production in 2016 was 3212.9 Million Tonnes Oil Equivalent (MTOE) as compared to 3195 MTOE in 2015, registering a growth of 0.56%.
• Europe & Eurasia region accounted for 28.9% share (926.6 MTOE) in global consumption of natural gas at 3204.1 MTOE followed by North America at 27.7% (886.8 MTOE).
• World Oil Refining capacity at end of 2016 was 97430 thousand barrels/day registering a growth of over 0.4% over 2015. India with refining capacity of 4620 thousand barrels per day had a share of 4.7% in world refining capacity.
• India with a consumption of 212.75 Million tonnes is having the third largest share country wise in World Oil consumption (4418.2 Million tonnes).
• OPEC Countries are having a share of 57 % in world crude oil export for 2016.
• China is having the largest share (23%) in Global Primary energy consumption. India with consumption of 724 Million tonnes oil equivalent of primary energy is the third largest consumer of primary energy.
CHAP
TER
ICH
APTE
R II
CHAP
TER
IIICH
APTE
R IV
CHAP
TER
VCH
APTE
R VI
CHAP
TER
VII
CHAP
TER
VIII
CHAP
TER
IXCH
APTE
R X
CHAP
TER
XIAP
PEN
DIX
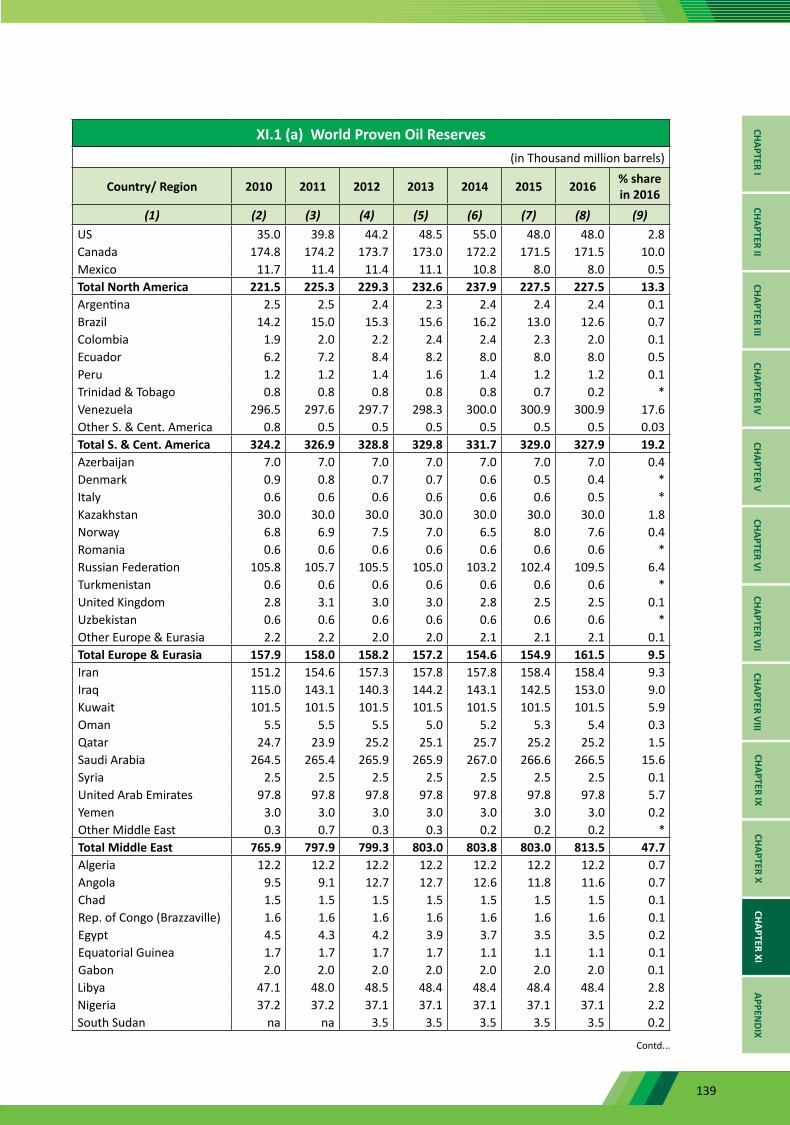
139
XI.1 (a) World Proven Oil Reserves(in Thousand million barrels)
Country/ Region 2010 2011 2012 2013 2014 2015 2016 % share in 2016
(1) (2) (3) (4) (5) (6) (7) (8) (9)US 35.0 39.8 44.2 48.5 55.0 48.0 48.0 2.8Canada 174.8 174.2 173.7 173.0 172.2 171.5 171.5 10.0Mexico 11.7 11.4 11.4 11.1 10.8 8.0 8.0 0.5Total North America 221.5 225.3 229.3 232.6 237.9 227.5 227.5 13.3Argentina 2.5 2.5 2.4 2.3 2.4 2.4 2.4 0.1Brazil 14.2 15.0 15.3 15.6 16.2 13.0 12.6 0.7Colombia 1.9 2.0 2.2 2.4 2.4 2.3 2.0 0.1Ecuador 6.2 7.2 8.4 8.2 8.0 8.0 8.0 0.5Peru 1.2 1.2 1.4 1.6 1.4 1.2 1.2 0.1Trinidad & Tobago 0.8 0.8 0.8 0.8 0.8 0.7 0.2 *Venezuela 296.5 297.6 297.7 298.3 300.0 300.9 300.9 17.6Other S. & Cent. America 0.8 0.5 0.5 0.5 0.5 0.5 0.5 0.03Total S. & Cent. America 324.2 326.9 328.8 329.8 331.7 329.0 327.9 19.2Azerbaijan 7.0 7.0 7.0 7.0 7.0 7.0 7.0 0.4Denmark 0.9 0.8 0.7 0.7 0.6 0.5 0.4 *Italy 0.6 0.6 0.6 0.6 0.6 0.6 0.5 *Kazakhstan 30.0 30.0 30.0 30.0 30.0 30.0 30.0 1.8Norway 6.8 6.9 7.5 7.0 6.5 8.0 7.6 0.4Romania 0.6 0.6 0.6 0.6 0.6 0.6 0.6 *Russian Federation 105.8 105.7 105.5 105.0 103.2 102.4 109.5 6.4Turkmenistan 0.6 0.6 0.6 0.6 0.6 0.6 0.6 *United Kingdom 2.8 3.1 3.0 3.0 2.8 2.5 2.5 0.1Uzbekistan 0.6 0.6 0.6 0.6 0.6 0.6 0.6 *Other Europe & Eurasia 2.2 2.2 2.0 2.0 2.1 2.1 2.1 0.1Total Europe & Eurasia 157.9 158.0 158.2 157.2 154.6 154.9 161.5 9.5Iran 151.2 154.6 157.3 157.8 157.8 158.4 158.4 9.3Iraq 115.0 143.1 140.3 144.2 143.1 142.5 153.0 9.0Kuwait 101.5 101.5 101.5 101.5 101.5 101.5 101.5 5.9Oman 5.5 5.5 5.5 5.0 5.2 5.3 5.4 0.3Qatar 24.7 23.9 25.2 25.1 25.7 25.2 25.2 1.5Saudi Arabia 264.5 265.4 265.9 265.9 267.0 266.6 266.5 15.6Syria 2.5 2.5 2.5 2.5 2.5 2.5 2.5 0.1United Arab Emirates 97.8 97.8 97.8 97.8 97.8 97.8 97.8 5.7Yemen 3.0 3.0 3.0 3.0 3.0 3.0 3.0 0.2Other Middle East 0.3 0.7 0.3 0.3 0.2 0.2 0.2 *Total Middle East 765.9 797.9 799.3 803.0 803.8 803.0 813.5 47.7Algeria 12.2 12.2 12.2 12.2 12.2 12.2 12.2 0.7Angola 9.5 9.1 12.7 12.7 12.6 11.8 11.6 0.7Chad 1.5 1.5 1.5 1.5 1.5 1.5 1.5 0.1Rep. of Congo (Brazzaville) 1.6 1.6 1.6 1.6 1.6 1.6 1.6 0.1Egypt 4.5 4.3 4.2 3.9 3.7 3.5 3.5 0.2Equatorial Guinea 1.7 1.7 1.7 1.7 1.1 1.1 1.1 0.1Gabon 2.0 2.0 2.0 2.0 2.0 2.0 2.0 0.1Libya 47.1 48.0 48.5 48.4 48.4 48.4 48.4 2.8Nigeria 37.2 37.2 37.1 37.1 37.1 37.1 37.1 2.2South Sudan na na 3.5 3.5 3.5 3.5 3.5 0.2
Contd...
CHAPTER ICHAPTER II
CHAPTER IIICHAPTER IV
CHAPTER VCHAPTER VI
CHAPTER VIICHAPTER VIII
CHAPTER IXCHAPTER X
CHAPTER XIAPPEN
DIX
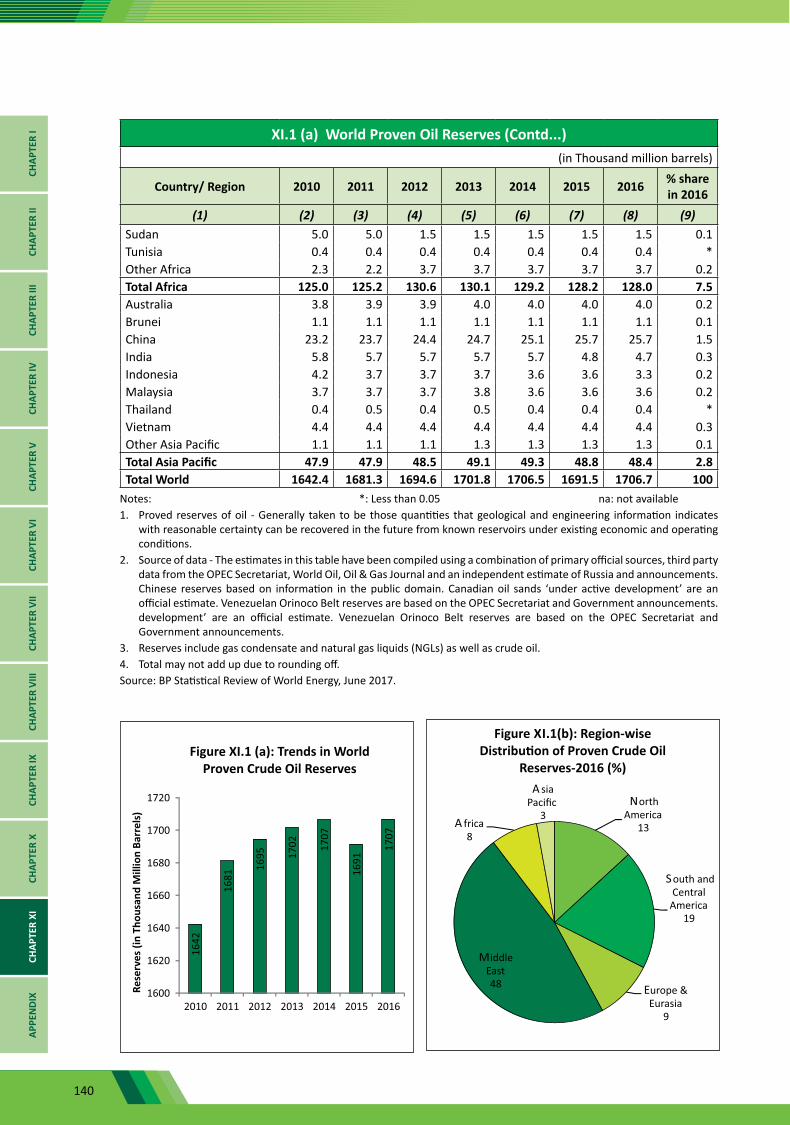
140
XI.1 (a) World Proven Oil Reserves (Contd...)(in Thousand million barrels)
Country/ Region 2010 2011 2012 2013 2014 2015 2016 % share in 2016
(1) (2) (3) (4) (5) (6) (7) (8) (9)Sudan 5.0 5.0 1.5 1.5 1.5 1.5 1.5 0.1Tunisia 0.4 0.4 0.4 0.4 0.4 0.4 0.4 *Other Africa 2.3 2.2 3.7 3.7 3.7 3.7 3.7 0.2Total Africa 125.0 125.2 130.6 130.1 129.2 128.2 128.0 7.5Australia 3.8 3.9 3.9 4.0 4.0 4.0 4.0 0.2Brunei 1.1 1.1 1.1 1.1 1.1 1.1 1.1 0.1China 23.2 23.7 24.4 24.7 25.1 25.7 25.7 1.5India 5.8 5.7 5.7 5.7 5.7 4.8 4.7 0.3Indonesia 4.2 3.7 3.7 3.7 3.6 3.6 3.3 0.2Malaysia 3.7 3.7 3.7 3.8 3.6 3.6 3.6 0.2Thailand 0.4 0.5 0.4 0.5 0.4 0.4 0.4 *Vietnam 4.4 4.4 4.4 4.4 4.4 4.4 4.4 0.3Other Asia Pacific 1.1 1.1 1.1 1.3 1.3 1.3 1.3 0.1Total Asia Pacific 47.9 47.9 48.5 49.1 49.3 48.8 48.4 2.8Total World 1642.4 1681.3 1694.6 1701.8 1706.5 1691.5 1706.7 100
Notes: *: Less than 0.05 na: not available 1. Proved reserves of oil - Generally taken to be those quantities that geological and engineering information indicates
with reasonable certainty can be recovered in the future from known reservoirs under existing economic and operating conditions.
2. Source of data - The estimates in this table have been compiled using a combination of primary official sources, third party data from the OPEC Secretariat, World Oil, Oil & Gas Journal and an independent estimate of Russia and announcements. Chinese reserves based on information in the public domain. Canadian oil sands ‘under active development’ are an official estimate. Venezuelan Orinoco Belt reserves are based on the OPEC Secretariat and Government announcements. development’ are an official estimate. Venezuelan Orinoco Belt reserves are based on the OPEC Secretariat and Government announcements.
3. Reserves include gas condensate and natural gas liquids (NGLs) as well as crude oil.4. Total may not add up due to rounding off. Source: BP Statistical Review of World Energy, June 2017.
CHAP
TER
ICH
APTE
R II
CHAP
TER
IIICH
APTE
R IV
CHAP
TER
VCH
APTE
R VI
CHAP
TER
VII
CHAP
TER
VIII
CHAP
TER
IXCH
APTE
R X
CHAP
TER
XIAP
PEN
DIX

141
XI.1 (b) World Proven Natural Gas Reserves(in Trillion cubic metres)
Country/ Region 2010 2011 2012 2013 2014 2015 2016 % share in 2016
(1) (2) (3) (4) (5) (6) (7) (8) (9)US 8.6 9.5 8.7 9.6 10.4 8.7 8.7 4.7Canada 2.0 1.9 2.0 2.0 2.0 2.2 2.2 1.2Mexico 0.4 0.4 0.4 0.3 0.3 0.2 0.2 0.1Total North America 11.0 11.7 11.1 12.0 12.8 11.1 11.1 6.0Argentina 0.4 0.3 0.3 0.3 0.3 0.4 0.4 0.2Bolivia 0.3 0.3 0.3 0.3 0.3 0.3 0.3 0.2Brazil 0.4 0.5 0.5 0.5 0.5 0.4 0.4 0.2Colombia 0.2 0.2 0.2 0.2 0.1 0.1 0.1 0.1Peru 0.4 0.4 0.4 0.4 0.4 0.4 0.4 0.2Trinidad & Tobago 0.4 0.4 0.4 0.3 0.3 0.3 0.3 0.2Venezuela 5.5 5.5 5.6 5.6 5.6 5.7 5.7 3.1Other S. & Cent. America 0.1 0.1 0.1 0.1 0.1 0.1 0.1 *Total S. & Cent. America 7.5 7.5 7.7 7.6 7.6 7.7 7.6 4.1Azerbaijan 0.9 0.9 0.9 0.9 1.2 1.1 1.1 0.6Denmark 0.1 0.04 0.04 0.04 0.04 0.02 0.01 *Germany 0.1 0.07 0.06 0.05 0.04 0.04 0.04 *Italy 0.1 0.06 0.05 0.05 0.05 0.05 0.03 *Kazakhstan 1.3 1.2 0.8 0.9 0.9 1.0 1.0 0.5Netherlands 1.1 1.0 0.8 0.8 0.7 0.7 0.7 0.4Norway 2.0 2.1 2.1 2.0 1.9 1.9 1.8 0.9Poland 0.1 0.1 0.1 0.1 0.1 0.1 0.1 *Romania 0.6 0.1 0.1 0.1 0.1 0.1 0.1 0.1Russian Federation 31.5 31.8 32.0 32.3 32.4 32.3 32.3 17.3Turkmenistan 10.2 17.5 17.5 17.5 17.5 17.5 17.5 9.4Ukraine 0.7 0.7 0.6 0.6 0.6 0.6 0.6 0.3United Kingdom 0.3 0.2 0.2 0.2 0.2 0.2 0.2 0.1Uzbekistan 1.1 1.1 1.1 1.1 1.1 1.1 1.1 0.6Other Europe & Eurasia 0.2 0.2 0.2 0.2 0.2 0.2 0.2 0.1Total Europe & Eurasia 50.1 57.1 56.6 56.9 57.0 56.8 56.7 30.4Bahrain 0.22 0.22 0.20 0.19 0.18 0.17 0.16 0.1Iran 33.09 33.62 33.78 34.02 34.02 33.50 33.50 18.0Iraq 3.17 3.59 3.59 3.59 3.69 3.69 3.69 2.0Israel 0.20 0.20 0.20 0.19 0.19 0.18 0.16 0.1Kuwait 1.78 1.78 1.78 1.78 1.78 1.78 1.78 1.0Oman 0.52 0.51 0.50 0.71 0.69 0.70 0.70 0.4Qatar 25.05 25.05 24.89 24.68 24.53 24.30 24.30 13.0Saudi Arabia 7.90 8.00 8.06 8.17 8.33 8.43 8.43 4.5Syria 0.28 0.28 0.28 0.28 0.28 0.28 0.28 0.2United Arab Emirates 6.09 6.09 6.09 6.09 6.09 6.09 6.09 3.3Yemen 0.32 0.30 0.29 0.28 0.27 0.27 0.27 0.1Other Middle East 0.01 0.01 0.01 0.01 0.01 0.01 0.01 *Total Middle East 78.6 79.7 79.7 80.0 80.1 79.4 79.4 42.5Algeria 4.5 4.5 4.5 4.5 4.5 4.5 4.5 2.4Egypt 2.2 2.2 2.0 1.8 1.8 1.8 1.8 1.0Libya 1.5 1.5 1.5 1.5 1.5 1.5 1.5 0.8Nigeria 5.2 5.2 5.1 5.1 5.3 5.3 5.3 2.8
Contd...
CHAPTER ICHAPTER II
CHAPTER IIICHAPTER IV
CHAPTER VCHAPTER VI
CHAPTER VIICHAPTER VIII
CHAPTER IXCHAPTER X
CHAPTER XIAPPEN
DIX
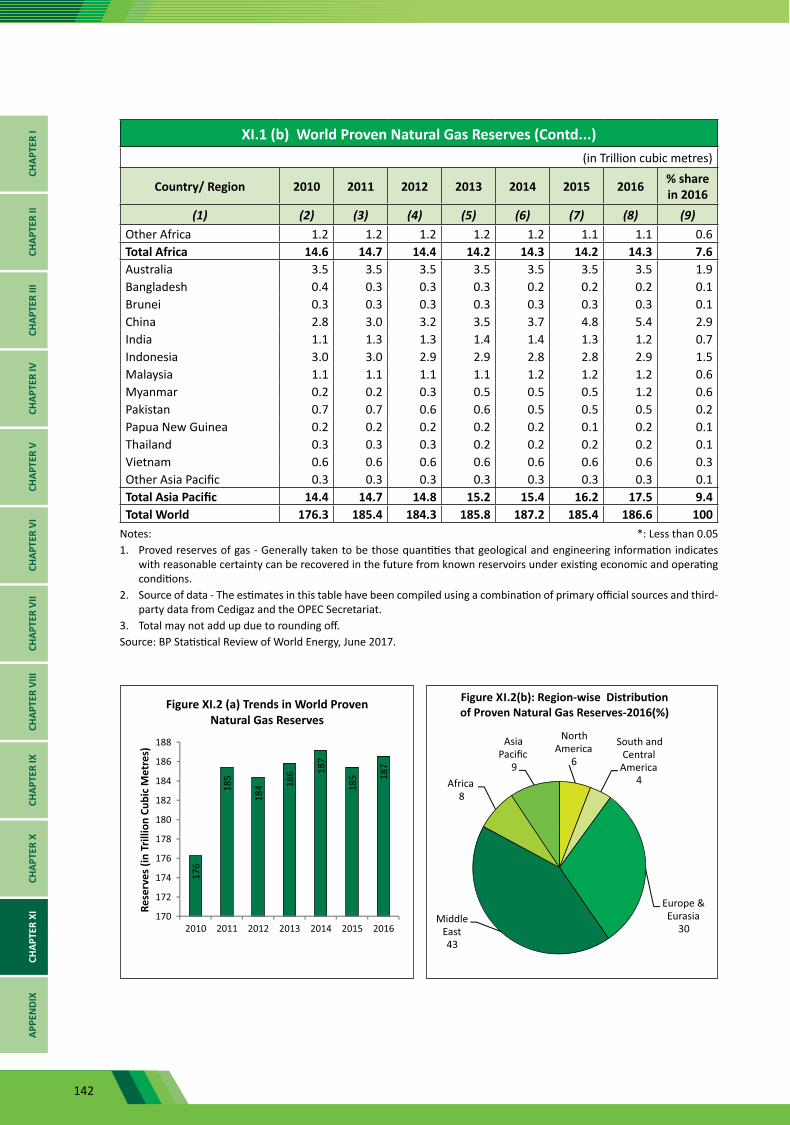
142
XI.1 (b) World Proven Natural Gas Reserves (Contd...)(in Trillion cubic metres)
Country/ Region 2010 2011 2012 2013 2014 2015 2016 % share in 2016
(1) (2) (3) (4) (5) (6) (7) (8) (9)Other Africa 1.2 1.2 1.2 1.2 1.2 1.1 1.1 0.6Total Africa 14.6 14.7 14.4 14.2 14.3 14.2 14.3 7.6Australia 3.5 3.5 3.5 3.5 3.5 3.5 3.5 1.9Bangladesh 0.4 0.3 0.3 0.3 0.2 0.2 0.2 0.1Brunei 0.3 0.3 0.3 0.3 0.3 0.3 0.3 0.1China 2.8 3.0 3.2 3.5 3.7 4.8 5.4 2.9India 1.1 1.3 1.3 1.4 1.4 1.3 1.2 0.7Indonesia 3.0 3.0 2.9 2.9 2.8 2.8 2.9 1.5Malaysia 1.1 1.1 1.1 1.1 1.2 1.2 1.2 0.6Myanmar 0.2 0.2 0.3 0.5 0.5 0.5 1.2 0.6Pakistan 0.7 0.7 0.6 0.6 0.5 0.5 0.5 0.2Papua New Guinea 0.2 0.2 0.2 0.2 0.2 0.1 0.2 0.1Thailand 0.3 0.3 0.3 0.2 0.2 0.2 0.2 0.1Vietnam 0.6 0.6 0.6 0.6 0.6 0.6 0.6 0.3Other Asia Pacific 0.3 0.3 0.3 0.3 0.3 0.3 0.3 0.1Total Asia Pacific 14.4 14.7 14.8 15.2 15.4 16.2 17.5 9.4Total World 176.3 185.4 184.3 185.8 187.2 185.4 186.6 100
Notes: *: Less than 0.051. Proved reserves of gas - Generally taken to be those quantities that geological and engineering information indicates
with reasonable certainty can be recovered in the future from known reservoirs under existing economic and operating conditions.
2. Source of data - The estimates in this table have been compiled using a combination of primary official sources and third-party data from Cedigaz and the OPEC Secretariat.
3. Total may not add up due to rounding off.Source: BP Statistical Review of World Energy, June 2017.
CHAP
TER
ICH
APTE
R II
CHAP
TER
IIICH
APTE
R IV
CHAP
TER
VCH
APTE
R VI
CHAP
TER
VII
CHAP
TER
VIII
CHAP
TER
IXCH
APTE
R X
CHAP
TER
XIAP
PEN
DIX

143
XI.2 World Crude Oil Production(in Million Tonnes)
Country/ Region 2010 2011 2012 2013 2014 2015 2016 % share in 2016
(1) (2) (3) (4) (5) (6) (7) (8) (9)US 332.7 344.9 393.2 446.9 522.7 565.1 543.0 12.4Canada 160.3 169.8 182.6 195.1 209.4 215.6 218.2 5.0Mexico 145.6 144.5 143.9 141.8 137.1 127.5 121.4 2.8Total North America 638.6 659.2 719.6 783.8 869.2 908.3 882.6 20.1Argentina 33.3 30.9 31.1 30.5 29.9 29.8 28.8 0.7Brazil 111.6 114.0 112.4 110.2 122.5 132.2 136.7 3.1Colombia 41.4 48.2 49.9 52.9 52.2 53.0 48.8 1.1Ecuador 26.1 26.8 27.1 28.2 29.8 29.1 29.3 0.7Peru 7.0 6.7 6.7 7.1 7.3 6.2 5.6 0.1Trinidad & Tobago 6.2 5.9 5.2 5.1 5.1 4.8 4.3 0.1Venezuela 145.8 141.5 139.3 137.8 138.5 135.9 124.1 2.8Other S. & Cent. America 6.9 7.0 7.3 7.5 7.7 7.5 7.0 0.2Total S. & Cent. America 378.4 381.1 378.9 379.2 392.9 398.6 384.5 8.8Azerbaijan 50.8 45.6 43.4 43.5 42.1 41.6 41.0 0.9Denmark 12.2 10.9 10.0 8.7 8.1 7.7 6.9 0.2Italy 5.1 5.3 5.4 5.6 5.8 5.5 3.8 0.1Kazakhstan 79.7 80.1 79.3 82.3 81.1 80.2 79.3 1.8Norway 98.8 93.8 87.3 83.2 85.3 88.0 90.4 2.1Romania 4.3 4.2 4.0 4.1 4.1 4.0 3.8 0.1Russian Federation 511.8 518.8 526.2 531.1 534.1 540.7 554.3 12.6Turkmenistan 10.8 10.8 11.2 11.7 12.1 12.7 12.7 0.3United Kingdom 63.2 52.1 44.7 40.7 40.0 45.4 47.5 1.1Uzbekistan 3.6 3.6 3.2 2.9 2.8 2.7 2.6 0.1Other Europe & Eurasia 19.2 19.2 19.2 19.6 19.2 18.8 18.2 0.4Total Europe & Eurasia 859.5 844.5 833.6 833.3 834.7 847.3 860.6 19.6Iran 211.7 212.7 180.7 169.8 174.2 181.6 216.4 4.9Iraq 121.5 136.7 152.5 153.2 160.3 197.0 218.9 5.0Kuwait 123.3 140.8 153.9 151.3 150.1 148.2 152.7 3.5Oman 42.2 43.2 45.0 46.1 46.2 48.0 49.3 1.1Qatar 71.1 78.0 82.2 80.3 79.4 79.1 79.4 1.8Saudi Arabia 473.8 525.9 549.8 538.4 543.4 567.8 585.7 13.4Syria 18.5 16.9 8.1 2.7 1.5 1.2 1.1 *United Arab Emirates 133.3 151.3 154.8 165.1 166.2 176.2 182.4 4.2Yemen 14.3 10.1 8.0 8.9 6.7 2.0 0.8 *Other Middle East 9.4 9.9 9.0 10.3 10.5 10.5 10.1 0.2Total Middle East 1219.2 1325.6 1344.0 1326.1 1338.7 1411.6 1496.9 34.2Algeria 73.8 71.7 67.2 64.8 68.8 67.2 68.5 1.6Angola 90.5 83.8 86.9 87.3 83.0 88.7 87.9 2.0Chad 6.4 6.0 5.3 4.4 4.3 3.8 3.8 0.1Rep. of Congo (Brazzaville) 16.0 15.3 14.3 12.6 13.4 12.9 11.9 0.3Egypt 35.0 34.6 34.7 34.4 35.1 35.4 33.8 0.8Equatorial Guinea 12.6 11.6 12.7 12.4 13.1 13.5 13.1 0.3Gabon 12.4 12.5 12.7 11.6 11.6 11.5 11.4 0.3Libya 77.8 22.5 71.2 46.5 23.4 20.3 20.0 0.5Nigeria 119.1 115.9 114.4 109.2 112.8 112.0 98.8 2.3South Sudan na na 1.5 4.9 7.7 7.3 5.8 0.1
Contd...
CHAPTER ICHAPTER II
CHAPTER IIICHAPTER IV
CHAPTER VCHAPTER VI
CHAPTER VIICHAPTER VIII
CHAPTER IXCHAPTER X
CHAPTER XIAPPEN
DIX
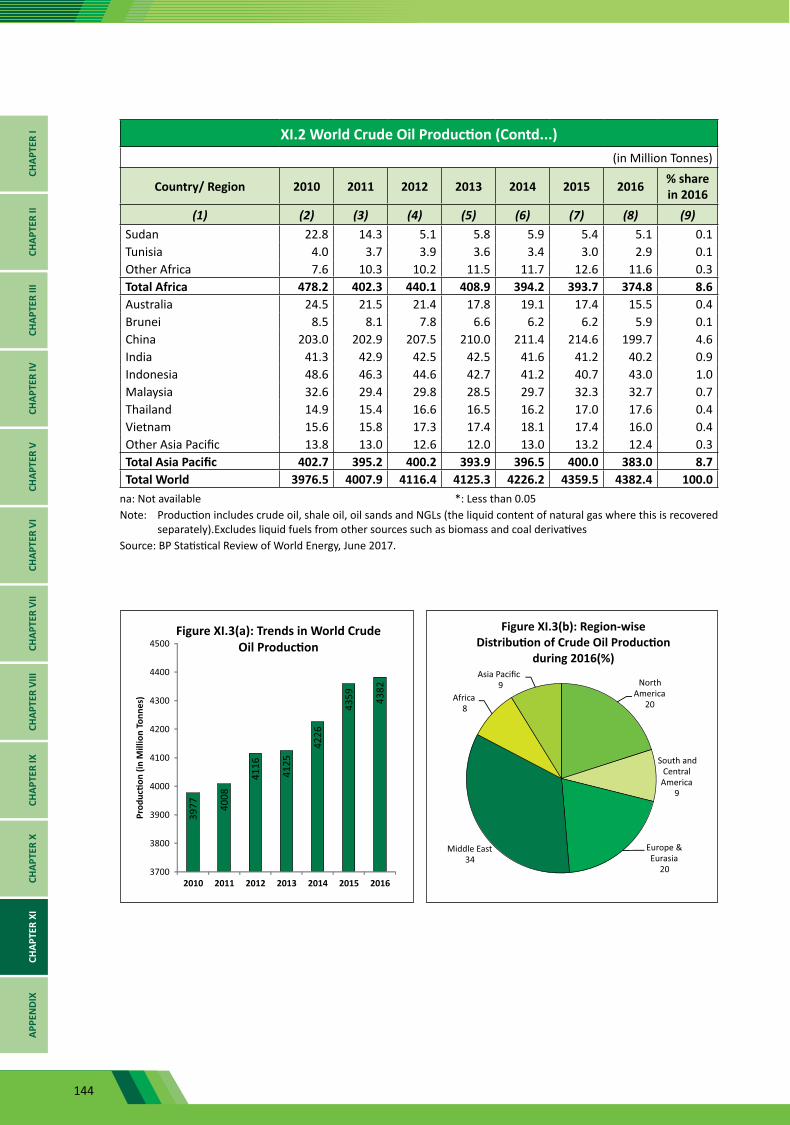
144
XI.2 World Crude Oil Production (Contd...)(in Million Tonnes)
Country/ Region 2010 2011 2012 2013 2014 2015 2016 % share in 2016
(1) (2) (3) (4) (5) (6) (7) (8) (9)Sudan 22.8 14.3 5.1 5.8 5.9 5.4 5.1 0.1Tunisia 4.0 3.7 3.9 3.6 3.4 3.0 2.9 0.1Other Africa 7.6 10.3 10.2 11.5 11.7 12.6 11.6 0.3Total Africa 478.2 402.3 440.1 408.9 394.2 393.7 374.8 8.6Australia 24.5 21.5 21.4 17.8 19.1 17.4 15.5 0.4Brunei 8.5 8.1 7.8 6.6 6.2 6.2 5.9 0.1China 203.0 202.9 207.5 210.0 211.4 214.6 199.7 4.6India 41.3 42.9 42.5 42.5 41.6 41.2 40.2 0.9Indonesia 48.6 46.3 44.6 42.7 41.2 40.7 43.0 1.0Malaysia 32.6 29.4 29.8 28.5 29.7 32.3 32.7 0.7Thailand 14.9 15.4 16.6 16.5 16.2 17.0 17.6 0.4Vietnam 15.6 15.8 17.3 17.4 18.1 17.4 16.0 0.4Other Asia Pacific 13.8 13.0 12.6 12.0 13.0 13.2 12.4 0.3Total Asia Pacific 402.7 395.2 400.2 393.9 396.5 400.0 383.0 8.7Total World 3976.5 4007.9 4116.4 4125.3 4226.2 4359.5 4382.4 100.0
na: Not available *: Less than 0.05 Note: Production includes crude oil, shale oil, oil sands and NGLs (the liquid content of natural gas where this is recovered
separately).Excludes liquid fuels from other sources such as biomass and coal derivativesSource: BP Statistical Review of World Energy, June 2017.
CHAP
TER
ICH
APTE
R II
CHAP
TER
IIICH
APTE
R IV
CHAP
TER
VCH
APTE
R VI
CHAP
TER
VII
CHAP
TER
VIII
CHAP
TER
IXCH
APTE
R X
CHAP
TER
XIAP
PEN
DIX
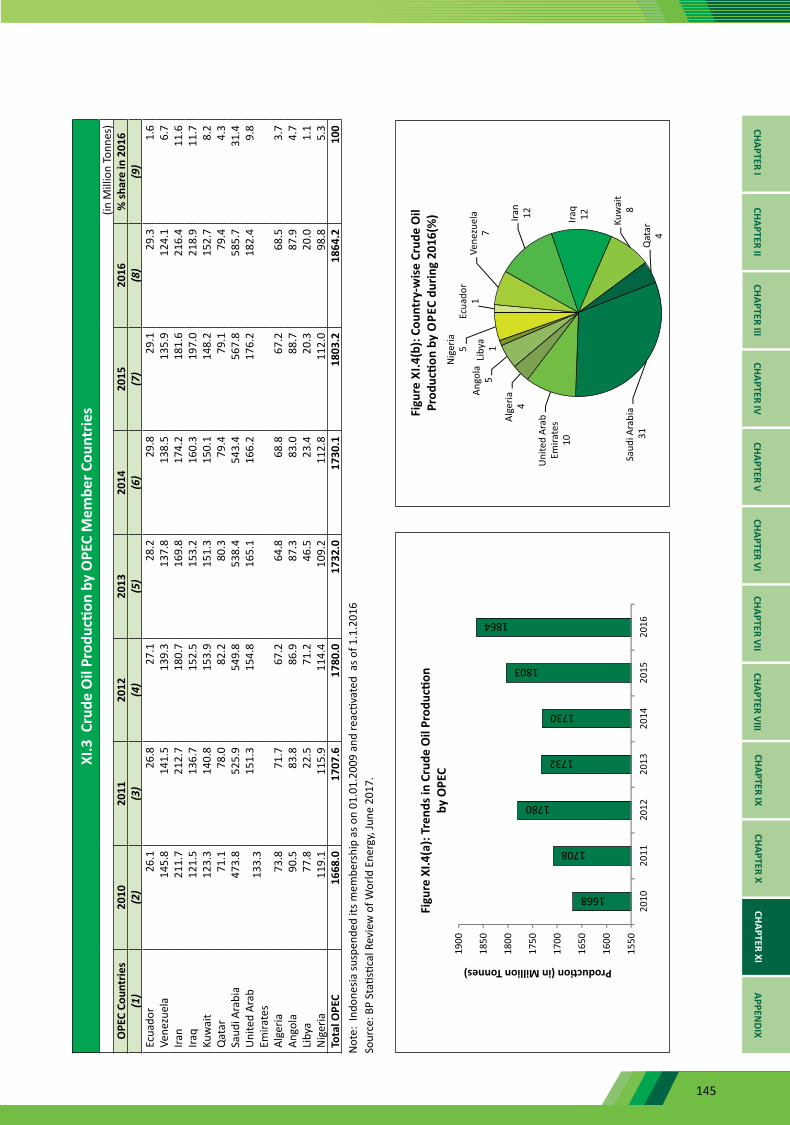
145
XI.3
Cru
de O
il Pr
oduc
tion
by O
PEC
Mem
ber C
ount
ries
(in M
illio
n To
nnes
)O
PEC
Coun
trie
s20
1020
1120
1220
1320
1420
1520
16%
shar
e in
201
6(1
)(2
)(3
)(4
)(5
)(6
)(7
)(8
)(9
)Ec
uado
r26
.126
.827
.128
.229
.829
.129
.31.
6Ve
nezu
ela
145.
814
1.5
139.
313
7.8
138.
513
5.9
124.
16.
7Ira
n21
1.7
212.
718
0.7
169.
817
4.2
181.
621
6.4
11.6
Iraq
121.
513
6.7
152.
515
3.2
160.
319
7.0
218.
911
.7Ku
wai
t12
3.3
140.
815
3.9
151.
315
0.1
148.
215
2.7
8.2
Qat
ar71
.178
.082
.280
.379
.479
.179
.44.
3Sa
udi A
rabi
a47
3.8
525.
954
9.8
538.
454
3.4
567.
858
5.7
31.4
Uni
ted
Arab
Em
irate
s13
3.3
151.
315
4.8
165.
116
6.2
176.
218
2.4
9.8
Alge
ria73
.871
.767
.264
.868
.867
.268
.53.
7An
gola
90.5
83.8
86.9
87.3
83.0
88.7
87.9
4.7
Liby
a77
.822
.571
.246
.523
.420
.320
.01.
1N
iger
ia11
9.1
115.
911
4.4
109.
211
2.8
112.
098
.85.
3To
tal O
PEC
1668
.017
07.6
1780
.017
32.0
1730
.118
03.2
1864
.210
0N
ote:
Ind
ones
ia su
spen
ded
its m
embe
rshi
p as
on
01.0
1.20
09 a
nd re
activ
ated
as o
f 1.1
.201
6So
urce
: BP
Stati
stica
l Rev
iew
of W
orld
Ene
rgy,
June
201
7.
CHAPTER ICHAPTER II
CHAPTER IIICHAPTER IV
CHAPTER VCHAPTER VI
CHAPTER VIICHAPTER VIII
CHAPTER IXCHAPTER X
CHAPTER XIAPPEN
DIX
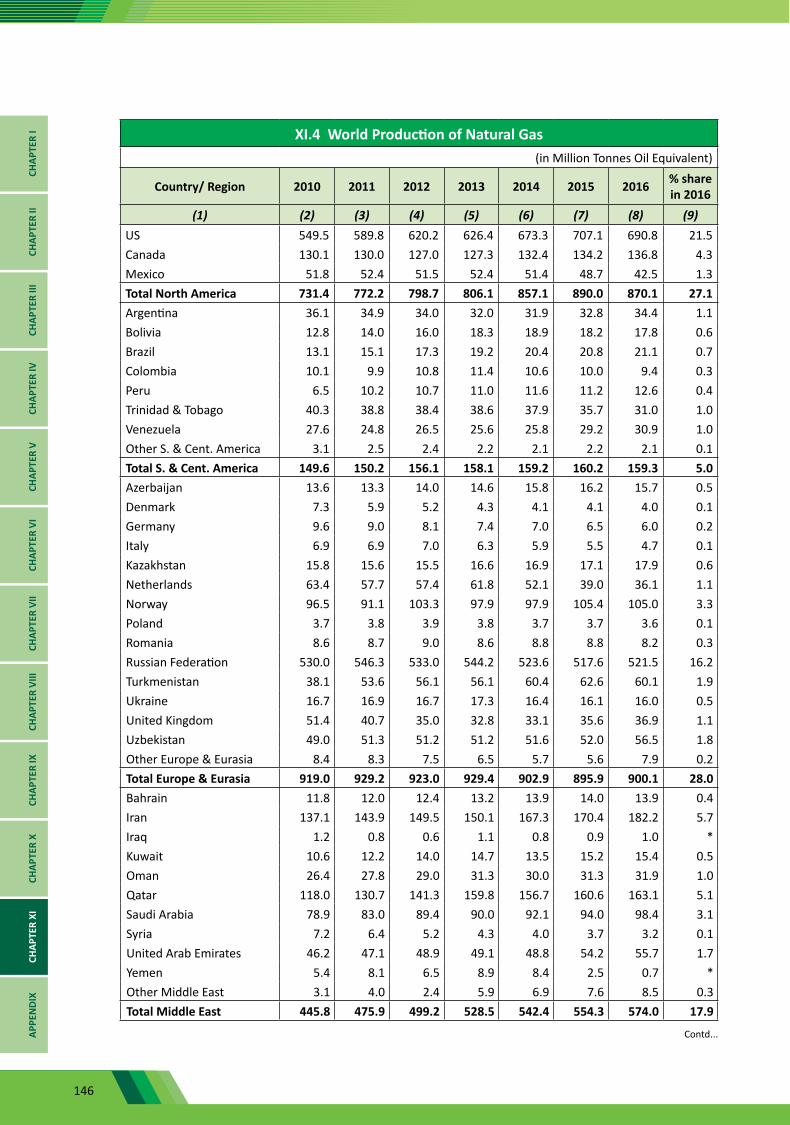
146
XI.4 World Production of Natural Gas(in Million Tonnes Oil Equivalent)
Country/ Region 2010 2011 2012 2013 2014 2015 2016 % share in 2016
(1) (2) (3) (4) (5) (6) (7) (8) (9)US 549.5 589.8 620.2 626.4 673.3 707.1 690.8 21.5Canada 130.1 130.0 127.0 127.3 132.4 134.2 136.8 4.3Mexico 51.8 52.4 51.5 52.4 51.4 48.7 42.5 1.3Total North America 731.4 772.2 798.7 806.1 857.1 890.0 870.1 27.1Argentina 36.1 34.9 34.0 32.0 31.9 32.8 34.4 1.1Bolivia 12.8 14.0 16.0 18.3 18.9 18.2 17.8 0.6Brazil 13.1 15.1 17.3 19.2 20.4 20.8 21.1 0.7Colombia 10.1 9.9 10.8 11.4 10.6 10.0 9.4 0.3Peru 6.5 10.2 10.7 11.0 11.6 11.2 12.6 0.4Trinidad & Tobago 40.3 38.8 38.4 38.6 37.9 35.7 31.0 1.0Venezuela 27.6 24.8 26.5 25.6 25.8 29.2 30.9 1.0Other S. & Cent. America 3.1 2.5 2.4 2.2 2.1 2.2 2.1 0.1Total S. & Cent. America 149.6 150.2 156.1 158.1 159.2 160.2 159.3 5.0Azerbaijan 13.6 13.3 14.0 14.6 15.8 16.2 15.7 0.5Denmark 7.3 5.9 5.2 4.3 4.1 4.1 4.0 0.1Germany 9.6 9.0 8.1 7.4 7.0 6.5 6.0 0.2Italy 6.9 6.9 7.0 6.3 5.9 5.5 4.7 0.1Kazakhstan 15.8 15.6 15.5 16.6 16.9 17.1 17.9 0.6Netherlands 63.4 57.7 57.4 61.8 52.1 39.0 36.1 1.1Norway 96.5 91.1 103.3 97.9 97.9 105.4 105.0 3.3Poland 3.7 3.8 3.9 3.8 3.7 3.7 3.6 0.1Romania 8.6 8.7 9.0 8.6 8.8 8.8 8.2 0.3Russian Federation 530.0 546.3 533.0 544.2 523.6 517.6 521.5 16.2Turkmenistan 38.1 53.6 56.1 56.1 60.4 62.6 60.1 1.9Ukraine 16.7 16.9 16.7 17.3 16.4 16.1 16.0 0.5United Kingdom 51.4 40.7 35.0 32.8 33.1 35.6 36.9 1.1Uzbekistan 49.0 51.3 51.2 51.2 51.6 52.0 56.5 1.8Other Europe & Eurasia 8.4 8.3 7.5 6.5 5.7 5.6 7.9 0.2Total Europe & Eurasia 919.0 929.2 923.0 929.4 902.9 895.9 900.1 28.0Bahrain 11.8 12.0 12.4 13.2 13.9 14.0 13.9 0.4Iran 137.1 143.9 149.5 150.1 167.3 170.4 182.2 5.7Iraq 1.2 0.8 0.6 1.1 0.8 0.9 1.0 *Kuwait 10.6 12.2 14.0 14.7 13.5 15.2 15.4 0.5Oman 26.4 27.8 29.0 31.3 30.0 31.3 31.9 1.0Qatar 118.0 130.7 141.3 159.8 156.7 160.6 163.1 5.1Saudi Arabia 78.9 83.0 89.4 90.0 92.1 94.0 98.4 3.1Syria 7.2 6.4 5.2 4.3 4.0 3.7 3.2 0.1United Arab Emirates 46.2 47.1 48.9 49.1 48.8 54.2 55.7 1.7Yemen 5.4 8.1 6.5 8.9 8.4 2.5 0.7 *Other Middle East 3.1 4.0 2.4 5.9 6.9 7.6 8.5 0.3Total Middle East 445.8 475.9 499.2 528.5 542.4 554.3 574.0 17.9
Contd...
CHAP
TER
ICH
APTE
R II
CHAP
TER
IIICH
APTE
R IV
CHAP
TER
VCH
APTE
R VI
CHAP
TER
VII
CHAP
TER
VIII
CHAP
TER
IXCH
APTE
R X
CHAP
TER
XIAP
PEN
DIX
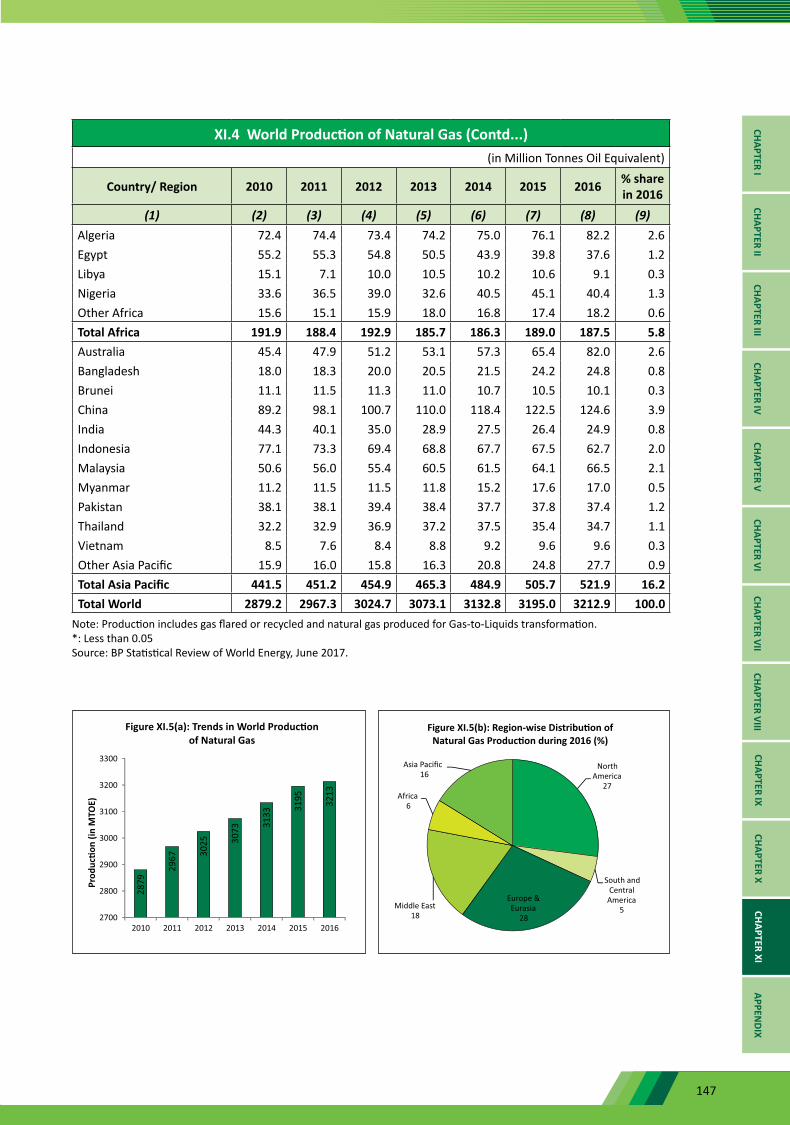
147
XI.4 World Production of Natural Gas (Contd...)(in Million Tonnes Oil Equivalent)
Country/ Region 2010 2011 2012 2013 2014 2015 2016 % share in 2016
(1) (2) (3) (4) (5) (6) (7) (8) (9)Algeria 72.4 74.4 73.4 74.2 75.0 76.1 82.2 2.6Egypt 55.2 55.3 54.8 50.5 43.9 39.8 37.6 1.2Libya 15.1 7.1 10.0 10.5 10.2 10.6 9.1 0.3Nigeria 33.6 36.5 39.0 32.6 40.5 45.1 40.4 1.3Other Africa 15.6 15.1 15.9 18.0 16.8 17.4 18.2 0.6Total Africa 191.9 188.4 192.9 185.7 186.3 189.0 187.5 5.8Australia 45.4 47.9 51.2 53.1 57.3 65.4 82.0 2.6Bangladesh 18.0 18.3 20.0 20.5 21.5 24.2 24.8 0.8Brunei 11.1 11.5 11.3 11.0 10.7 10.5 10.1 0.3China 89.2 98.1 100.7 110.0 118.4 122.5 124.6 3.9India 44.3 40.1 35.0 28.9 27.5 26.4 24.9 0.8Indonesia 77.1 73.3 69.4 68.8 67.7 67.5 62.7 2.0Malaysia 50.6 56.0 55.4 60.5 61.5 64.1 66.5 2.1Myanmar 11.2 11.5 11.5 11.8 15.2 17.6 17.0 0.5Pakistan 38.1 38.1 39.4 38.4 37.7 37.8 37.4 1.2Thailand 32.2 32.9 36.9 37.2 37.5 35.4 34.7 1.1Vietnam 8.5 7.6 8.4 8.8 9.2 9.6 9.6 0.3Other Asia Pacific 15.9 16.0 15.8 16.3 20.8 24.8 27.7 0.9Total Asia Pacific 441.5 451.2 454.9 465.3 484.9 505.7 521.9 16.2Total World 2879.2 2967.3 3024.7 3073.1 3132.8 3195.0 3212.9 100.0
Note: Production includes gas flared or recycled and natural gas produced for Gas-to-Liquids transformation.*: Less than 0.05Source: BP Statistical Review of World Energy, June 2017.
CHAPTER ICHAPTER II
CHAPTER IIICHAPTER IV
CHAPTER VCHAPTER VI
CHAPTER VIICHAPTER VIII
CHAPTER IXCHAPTER X
CHAPTER XIAPPEN
DIX
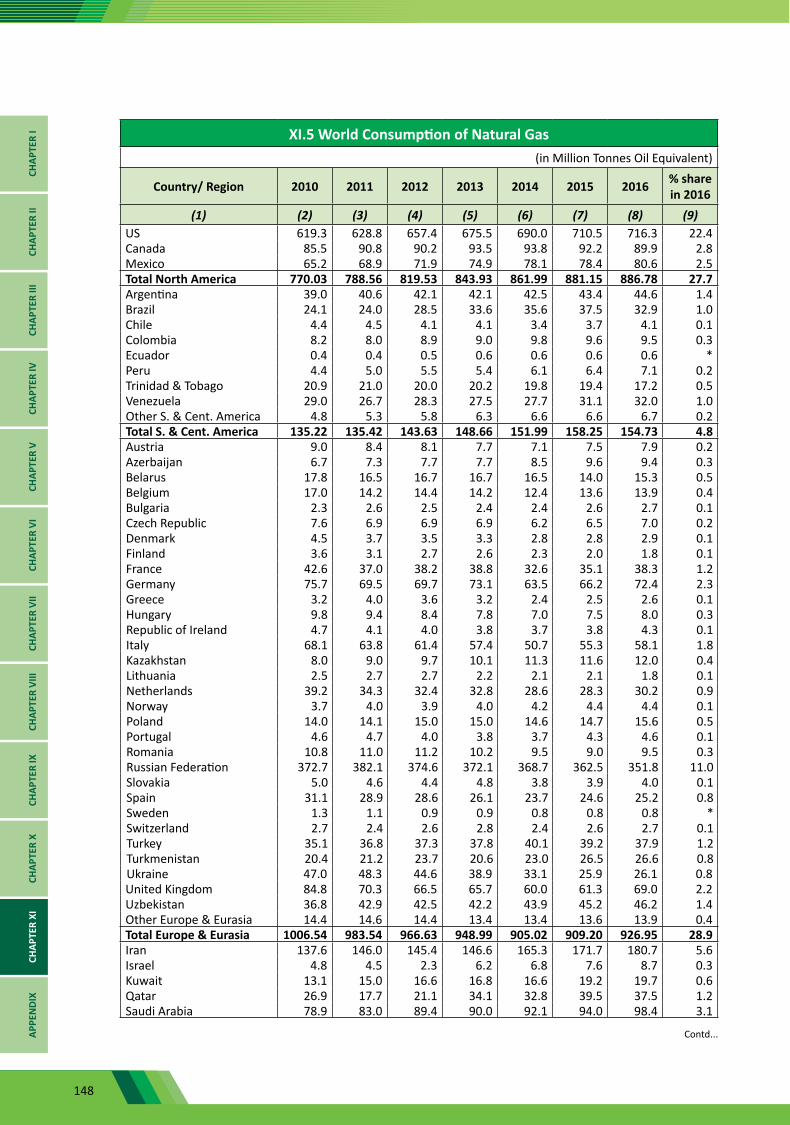
148
XI.5 World Consumption of Natural Gas(in Million Tonnes Oil Equivalent)
Country/ Region 2010 2011 2012 2013 2014 2015 2016 % share in 2016
(1) (2) (3) (4) (5) (6) (7) (8) (9)US 619.3 628.8 657.4 675.5 690.0 710.5 716.3 22.4Canada 85.5 90.8 90.2 93.5 93.8 92.2 89.9 2.8Mexico 65.2 68.9 71.9 74.9 78.1 78.4 80.6 2.5Total North America 770.03 788.56 819.53 843.93 861.99 881.15 886.78 27.7Argentina 39.0 40.6 42.1 42.1 42.5 43.4 44.6 1.4Brazil 24.1 24.0 28.5 33.6 35.6 37.5 32.9 1.0Chile 4.4 4.5 4.1 4.1 3.4 3.7 4.1 0.1Colombia 8.2 8.0 8.9 9.0 9.8 9.6 9.5 0.3Ecuador 0.4 0.4 0.5 0.6 0.6 0.6 0.6 *Peru 4.4 5.0 5.5 5.4 6.1 6.4 7.1 0.2Trinidad & Tobago 20.9 21.0 20.0 20.2 19.8 19.4 17.2 0.5Venezuela 29.0 26.7 28.3 27.5 27.7 31.1 32.0 1.0Other S. & Cent. America 4.8 5.3 5.8 6.3 6.6 6.6 6.7 0.2Total S. & Cent. America 135.22 135.42 143.63 148.66 151.99 158.25 154.73 4.8Austria 9.0 8.4 8.1 7.7 7.1 7.5 7.9 0.2Azerbaijan 6.7 7.3 7.7 7.7 8.5 9.6 9.4 0.3Belarus 17.8 16.5 16.7 16.7 16.5 14.0 15.3 0.5Belgium 17.0 14.2 14.4 14.2 12.4 13.6 13.9 0.4Bulgaria 2.3 2.6 2.5 2.4 2.4 2.6 2.7 0.1Czech Republic 7.6 6.9 6.9 6.9 6.2 6.5 7.0 0.2Denmark 4.5 3.7 3.5 3.3 2.8 2.8 2.9 0.1Finland 3.6 3.1 2.7 2.6 2.3 2.0 1.8 0.1France 42.6 37.0 38.2 38.8 32.6 35.1 38.3 1.2Germany 75.7 69.5 69.7 73.1 63.5 66.2 72.4 2.3Greece 3.2 4.0 3.6 3.2 2.4 2.5 2.6 0.1Hungary 9.8 9.4 8.4 7.8 7.0 7.5 8.0 0.3Republic of Ireland 4.7 4.1 4.0 3.8 3.7 3.8 4.3 0.1Italy 68.1 63.8 61.4 57.4 50.7 55.3 58.1 1.8Kazakhstan 8.0 9.0 9.7 10.1 11.3 11.6 12.0 0.4Lithuania 2.5 2.7 2.7 2.2 2.1 2.1 1.8 0.1Netherlands 39.2 34.3 32.4 32.8 28.6 28.3 30.2 0.9Norway 3.7 4.0 3.9 4.0 4.2 4.4 4.4 0.1Poland 14.0 14.1 15.0 15.0 14.6 14.7 15.6 0.5Portugal 4.6 4.7 4.0 3.8 3.7 4.3 4.6 0.1Romania 10.8 11.0 11.2 10.2 9.5 9.0 9.5 0.3Russian Federation 372.7 382.1 374.6 372.1 368.7 362.5 351.8 11.0Slovakia 5.0 4.6 4.4 4.8 3.8 3.9 4.0 0.1Spain 31.1 28.9 28.6 26.1 23.7 24.6 25.2 0.8Sweden 1.3 1.1 0.9 0.9 0.8 0.8 0.8 *Switzerland 2.7 2.4 2.6 2.8 2.4 2.6 2.7 0.1Turkey 35.1 36.8 37.3 37.8 40.1 39.2 37.9 1.2Turkmenistan 20.4 21.2 23.7 20.6 23.0 26.5 26.6 0.8Ukraine 47.0 48.3 44.6 38.9 33.1 25.9 26.1 0.8United Kingdom 84.8 70.3 66.5 65.7 60.0 61.3 69.0 2.2Uzbekistan 36.8 42.9 42.5 42.2 43.9 45.2 46.2 1.4Other Europe & Eurasia 14.4 14.6 14.4 13.4 13.4 13.6 13.9 0.4Total Europe & Eurasia 1006.54 983.54 966.63 948.99 905.02 909.20 926.95 28.9Iran 137.6 146.0 145.4 146.6 165.3 171.7 180.7 5.6Israel 4.8 4.5 2.3 6.2 6.8 7.6 8.7 0.3Kuwait 13.1 15.0 16.6 16.8 16.6 19.2 19.7 0.6Qatar 26.9 17.7 21.1 34.1 32.8 39.5 37.5 1.2Saudi Arabia 78.9 83.0 89.4 90.0 92.1 94.0 98.4 3.1
Contd...
CHAP
TER
ICH
APTE
R II
CHAP
TER
IIICH
APTE
R IV
CHAP
TER
VCH
APTE
R VI
CHAP
TER
VII
CHAP
TER
VIII
CHAP
TER
IXCH
APTE
R X
CHAP
TER
XIAP
PEN
DIX
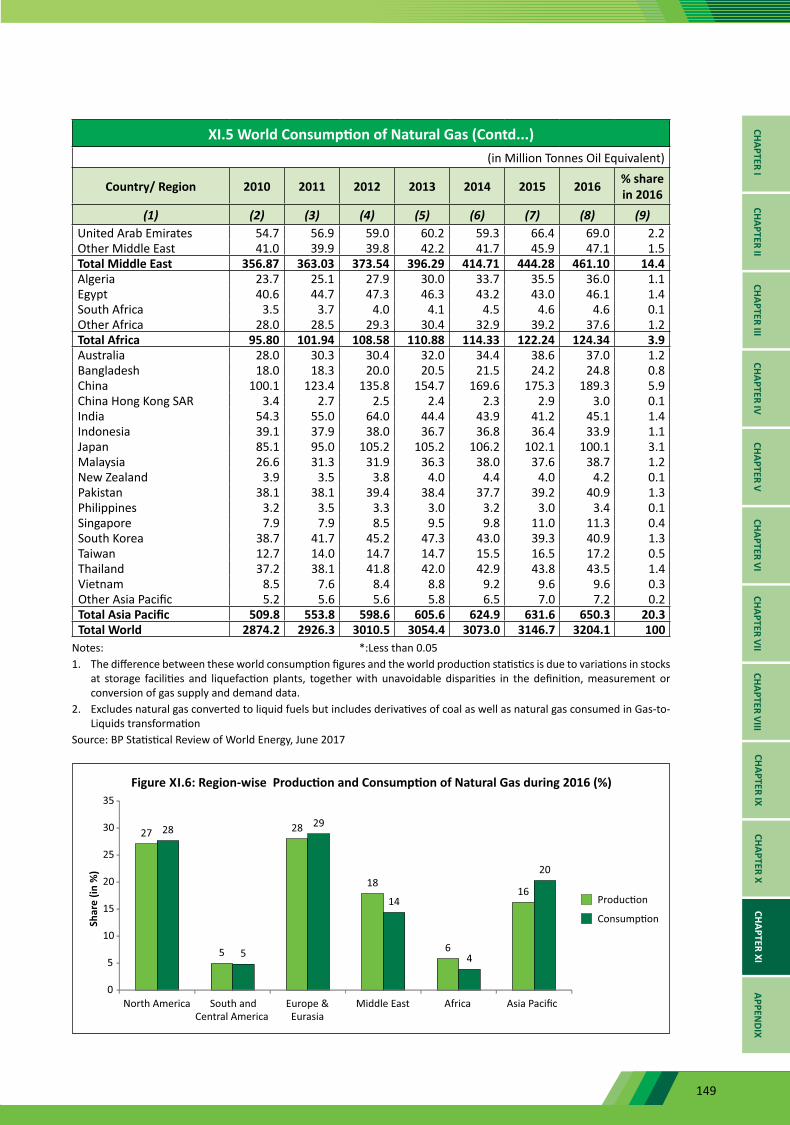
149
XI.5 World Consumption of Natural Gas (Contd...)(in Million Tonnes Oil Equivalent)
Country/ Region 2010 2011 2012 2013 2014 2015 2016 % share in 2016
(1) (2) (3) (4) (5) (6) (7) (8) (9)United Arab Emirates 54.7 56.9 59.0 60.2 59.3 66.4 69.0 2.2Other Middle East 41.0 39.9 39.8 42.2 41.7 45.9 47.1 1.5Total Middle East 356.87 363.03 373.54 396.29 414.71 444.28 461.10 14.4Algeria 23.7 25.1 27.9 30.0 33.7 35.5 36.0 1.1Egypt 40.6 44.7 47.3 46.3 43.2 43.0 46.1 1.4South Africa 3.5 3.7 4.0 4.1 4.5 4.6 4.6 0.1Other Africa 28.0 28.5 29.3 30.4 32.9 39.2 37.6 1.2Total Africa 95.80 101.94 108.58 110.88 114.33 122.24 124.34 3.9Australia 28.0 30.3 30.4 32.0 34.4 38.6 37.0 1.2Bangladesh 18.0 18.3 20.0 20.5 21.5 24.2 24.8 0.8China 100.1 123.4 135.8 154.7 169.6 175.3 189.3 5.9China Hong Kong SAR 3.4 2.7 2.5 2.4 2.3 2.9 3.0 0.1India 54.3 55.0 64.0 44.4 43.9 41.2 45.1 1.4Indonesia 39.1 37.9 38.0 36.7 36.8 36.4 33.9 1.1Japan 85.1 95.0 105.2 105.2 106.2 102.1 100.1 3.1Malaysia 26.6 31.3 31.9 36.3 38.0 37.6 38.7 1.2New Zealand 3.9 3.5 3.8 4.0 4.4 4.0 4.2 0.1Pakistan 38.1 38.1 39.4 38.4 37.7 39.2 40.9 1.3Philippines 3.2 3.5 3.3 3.0 3.2 3.0 3.4 0.1Singapore 7.9 7.9 8.5 9.5 9.8 11.0 11.3 0.4South Korea 38.7 41.7 45.2 47.3 43.0 39.3 40.9 1.3Taiwan 12.7 14.0 14.7 14.7 15.5 16.5 17.2 0.5Thailand 37.2 38.1 41.8 42.0 42.9 43.8 43.5 1.4Vietnam 8.5 7.6 8.4 8.8 9.2 9.6 9.6 0.3Other Asia Pacific 5.2 5.6 5.6 5.8 6.5 7.0 7.2 0.2Total Asia Pacific 509.8 553.8 598.6 605.6 624.9 631.6 650.3 20.3Total World 2874.2 2926.3 3010.5 3054.4 3073.0 3146.7 3204.1 100
Notes: *:Less than 0.05 1. The difference between these world consumption figures and the world production statistics is due to variations in stocks
at storage facilities and liquefaction plants, together with unavoidable disparities in the definition, measurement or conversion of gas supply and demand data.
2. Excludes natural gas converted to liquid fuels but includes derivatives of coal as well as natural gas consumed in Gas-to-Liquids transformation
Source: BP Statistical Review of World Energy, June 2017
CHAPTER ICHAPTER II
CHAPTER IIICHAPTER IV
CHAPTER VCHAPTER VI
CHAPTER VIICHAPTER VIII
CHAPTER IXCHAPTER X
CHAPTER XIAPPEN
DIX
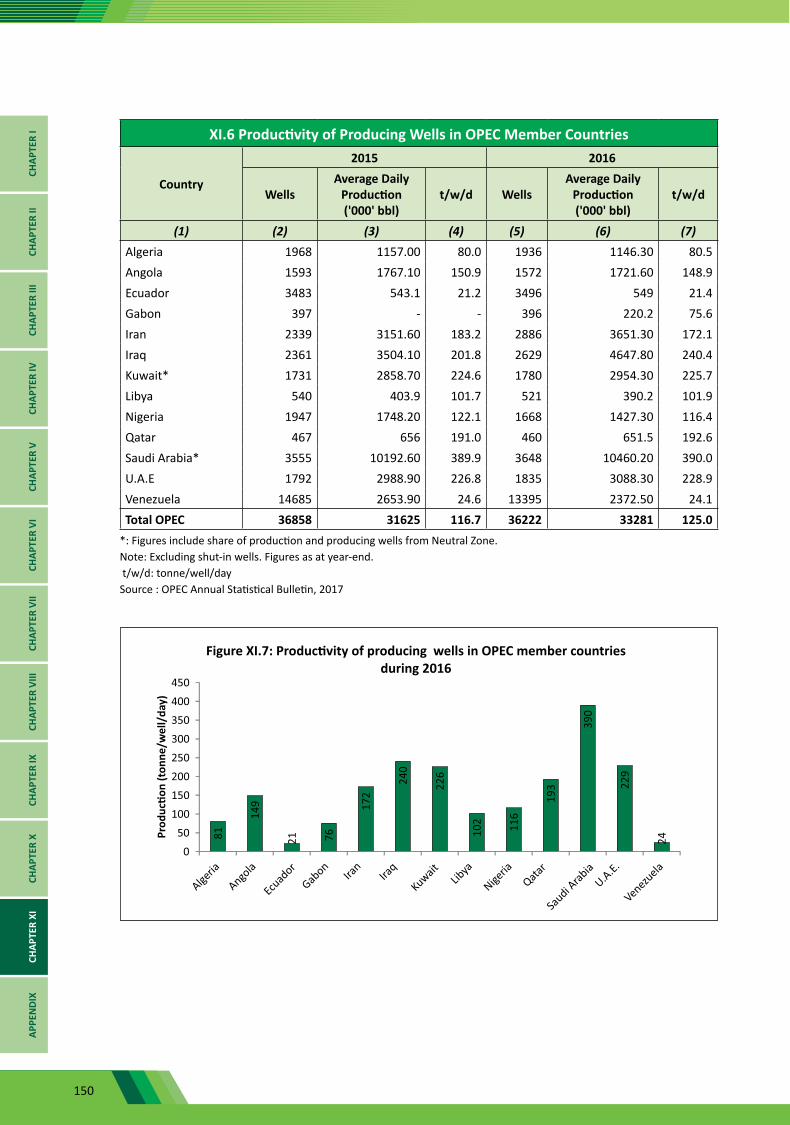
150
XI.6 Productivity of Producing Wells in OPEC Member Countries
Country
2015 2016
WellsAverage Daily
Production ('000' bbl)
t/w/d WellsAverage Daily
Production ('000' bbl)
t/w/d
(1) (2) (3) (4) (5) (6) (7)Algeria 1968 1157.00 80.0 1936 1146.30 80.5Angola 1593 1767.10 150.9 1572 1721.60 148.9Ecuador 3483 543.1 21.2 3496 549 21.4Gabon 397 - - 396 220.2 75.6Iran 2339 3151.60 183.2 2886 3651.30 172.1Iraq 2361 3504.10 201.8 2629 4647.80 240.4Kuwait* 1731 2858.70 224.6 1780 2954.30 225.7Libya 540 403.9 101.7 521 390.2 101.9Nigeria 1947 1748.20 122.1 1668 1427.30 116.4Qatar 467 656 191.0 460 651.5 192.6Saudi Arabia* 3555 10192.60 389.9 3648 10460.20 390.0U.A.E 1792 2988.90 226.8 1835 3088.30 228.9Venezuela 14685 2653.90 24.6 13395 2372.50 24.1Total OPEC 36858 31625 116.7 36222 33281 125.0
*: Figures include share of production and producing wells from Neutral Zone.Note: Excluding shut-in wells. Figures as at year-end. t/w/d: tonne/well/daySource : OPEC Annual Statistical Bulletin, 2017
CHAP
TER
ICH
APTE
R II
CHAP
TER
IIICH
APTE
R IV
CHAP
TER
VCH
APTE
R VI
CHAP
TER
VII
CHAP
TER
VIII
CHAP
TER
IXCH
APTE
R X
CHAP
TER
XIAP
PEN
DIX

151
XI.7 World Oil Refining Capacity (in ‘000’ barrels daily^)
Country/Region/ Year 2010 2011 2012 2013 2014 2015 2016 % share in 2016
(1) (2) (3) (4) (5) (6) (7) (8) (9)US 17736 17322 17824 17925 17889 18315 18621 19.1Canada 1913 2040 2050 1965 1965 1966 1967 2.0Mexico 1463 1606 1606 1606 1522 1522 1522 1.6Total North America 21113 20967 21479 21495 21375 21803 22110 22.7Argentina 625 625 657 657 657 657 657 0.7Brazil 1988 2010 2001 2093 2235 2278 2289 2.3Chile 242 250 254 254 258 258 258 0.3Colombia 336 336 336 336 336 421 421 0.4Curacao 320 320 320 320 320 320 320 0.3Ecuador 175 175 175 175 175 175 210 0.2Peru 252 252 252 253 253 253 253 0.3Trinidad & Tobago 165 165 165 165 165 165 165 0.2Venezuela 1303 1303 1303 1303 1303 1303 1303 1.3Other S. & Cent. America 901 1013 356 361 376 384 384 0.4Total S. & Cent. America 6307 6449 5819 5917 6078 6214 6259 6.4Austria 201 193 193 193 193 193 193 0.2Azerbaijan 205 205 205 205 205 205 205 0.2Belarus 460 460 460 460 460 460 460 0.5Belgium 787 788 753 776 776 776 776 0.8Bulgaria 195 195 195 195 195 195 195 0.2Czech Republic 193 193 178 178 178 178 178 0.2Denmark 189 181 181 181 180 180 180 0.2Finland 261 261 261 261 261 261 261 0.3France 1702 1610 1513 1375 1375 1375 1224 1.3Germany 2091 2077 2097 2061 2077 2049 2024 2.1Greece 490 495 498 498 498 498 498 0.5Hungary 165 165 165 165 165 165 165 0.2Ireland 75 75 75 75 75 75 75 0.1Italy 2396 2276 2113 1876 1915 1915 1915 2.0Kazakhstan 330 330 330 350 350 350 350 0.4Lithuania 241 241 241 241 241 241 241 0.2Netherlands 1274 1276 1274 1274 1274 1293 1293 1.3Norway 316 316 316 316 316 316 316 0.3Poland 560 580 582 582 582 581 581 0.6Portugal 306 306 306 306 306 306 306 0.3Romania 247 229 214 235 228 239 256 0.3Russian Federation 5573 5731 5826 6245 6347 6408 6418 6.6Slovakia 122 122 122 122 122 122 122 0.1Spain 1421 1542 1546 1546 1546 1562 1562 1.6
Contd...
CHAPTER ICHAPTER II
CHAPTER IIICHAPTER IV
CHAPTER VCHAPTER VI
CHAPTER VIICHAPTER VIII
CHAPTER IXCHAPTER X
CHAPTER XIAPPEN
DIX
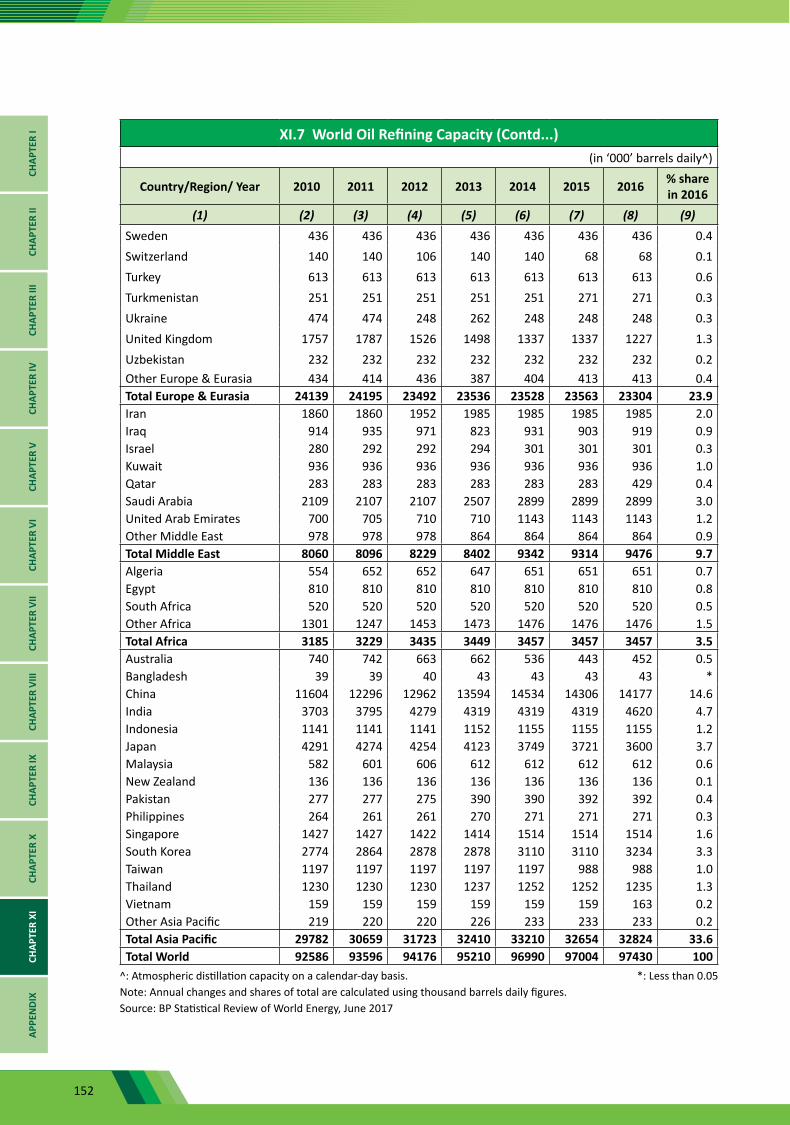
152
XI.7 World Oil Refining Capacity (Contd...) (in ‘000’ barrels daily^)
Country/Region/ Year 2010 2011 2012 2013 2014 2015 2016 % share in 2016
(1) (2) (3) (4) (5) (6) (7) (8) (9)Sweden 436 436 436 436 436 436 436 0.4Switzerland 140 140 106 140 140 68 68 0.1Turkey 613 613 613 613 613 613 613 0.6Turkmenistan 251 251 251 251 251 271 271 0.3Ukraine 474 474 248 262 248 248 248 0.3United Kingdom 1757 1787 1526 1498 1337 1337 1227 1.3Uzbekistan 232 232 232 232 232 232 232 0.2Other Europe & Eurasia 434 414 436 387 404 413 413 0.4Total Europe & Eurasia 24139 24195 23492 23536 23528 23563 23304 23.9Iran 1860 1860 1952 1985 1985 1985 1985 2.0Iraq 914 935 971 823 931 903 919 0.9Israel 280 292 292 294 301 301 301 0.3Kuwait 936 936 936 936 936 936 936 1.0Qatar 283 283 283 283 283 283 429 0.4Saudi Arabia 2109 2107 2107 2507 2899 2899 2899 3.0United Arab Emirates 700 705 710 710 1143 1143 1143 1.2Other Middle East 978 978 978 864 864 864 864 0.9Total Middle East 8060 8096 8229 8402 9342 9314 9476 9.7Algeria 554 652 652 647 651 651 651 0.7Egypt 810 810 810 810 810 810 810 0.8South Africa 520 520 520 520 520 520 520 0.5Other Africa 1301 1247 1453 1473 1476 1476 1476 1.5Total Africa 3185 3229 3435 3449 3457 3457 3457 3.5Australia 740 742 663 662 536 443 452 0.5Bangladesh 39 39 40 43 43 43 43 *China 11604 12296 12962 13594 14534 14306 14177 14.6India 3703 3795 4279 4319 4319 4319 4620 4.7Indonesia 1141 1141 1141 1152 1155 1155 1155 1.2Japan 4291 4274 4254 4123 3749 3721 3600 3.7Malaysia 582 601 606 612 612 612 612 0.6New Zealand 136 136 136 136 136 136 136 0.1Pakistan 277 277 275 390 390 392 392 0.4Philippines 264 261 261 270 271 271 271 0.3Singapore 1427 1427 1422 1414 1514 1514 1514 1.6South Korea 2774 2864 2878 2878 3110 3110 3234 3.3Taiwan 1197 1197 1197 1197 1197 988 988 1.0Thailand 1230 1230 1230 1237 1252 1252 1235 1.3Vietnam 159 159 159 159 159 159 163 0.2Other Asia Pacific 219 220 220 226 233 233 233 0.2Total Asia Pacific 29782 30659 31723 32410 33210 32654 32824 33.6Total World 92586 93596 94176 95210 96990 97004 97430 100
^: Atmospheric distillation capacity on a calendar-day basis. *: Less than 0.05Note: Annual changes and shares of total are calculated using thousand barrels daily figures.Source: BP Statistical Review of World Energy, June 2017
CHAP
TER
ICH
APTE
R II
CHAP
TER
IIICH
APTE
R IV
CHAP
TER
VCH
APTE
R VI
CHAP
TER
VII
CHAP
TER
VIII
CHAP
TER
IXCH
APTE
R X
CHAP
TER
XIAP
PEN
DIX

153
XI.8: World Refinery Crude Throughput (in ‘000’ barrels daily^)
Country/Region/ Year 2010 2011 2012 2013 2014 2015 2016 % share in 2016
(1) (2) (3) (4) (5) (6) (7) (8) (9)US 14724 14806 14999 15312 15848 16188 16202 20.1Canada 1774 1680 1751 1719 1640 1635 1594 2.0Mexico 1184 1166 1199 1224 1155 1064 933 1.2Total North America 17682 17652 17949 18255 18643 18887 18729 23.3Argentina 531 516 530 527 526 536 511 0.6Brazil 1787 1813 1889 2035 2085 1972 1831 2.3Chile 159 173 164 174 174 165 163 0.2Colombia 300 306 305 284 247 244 339 0.4Curacao 64 164 165 170 189 178 173 0.2Ecuador 137 156 152 141 125 121 150 0.2Peru 195 189 189 183 185 182 185 0.2Trinidad & Tobago 126 137 107 132 105 125 148 0.2Venezuela 969 991 936 952 920 863 698 0.9Other S. & Cent. America 709 720 335 301 295 316 291 0.4Total S. & Cent. America 4977 5165 4771 4899 4851 4702 4490 5.6Austria 158 168 170 174 173 179 164 0.2Azerbaijan 124 127 124 132 135 130 117 0.1Belarus 330 411 434 425 448 462 392 0.5Belgium 668 598 634 555 645 644 640 0.8Bulgaria 110 102 118 113 104 121 125 0.2Czech Republic 159 143 145 134 151 145 109 0.1Denmark 146 137 153 144 139 147 140 0.2Finland 211 225 215 227 225 197 226 0.3France 1314 1313 1138 1117 1096 1152 1111 1.4Germany 1915 1876 1901 1857 1833 1875 1887 2.3Greece 393 331 410 399 416 436 464 0.6Hungary 128 132 122 120 131 130 133 0.2Ireland 60 59 61 57 55 68 64 0.1Italy 1673 1570 1475 1259 1198 1347 1300 1.6Kazakhstan 257 326 331 341 361 342 339 0.4Lithuania 190 189 181 192 160 170 185 0.2Netherlands 1189 1144 1144 1044 1067 1138 1147 1.4Norway 259 289 287 292 274 293 230 0.3Poland 458 482 505 488 486 532 517 0.6Portugal 227 206 221 239 217 278 273 0.3Romania 217 194 182 189 194 208 228 0.3Russian Federation 5018 5185 5438 5636 5926 5773 5709 7.1Slovakia 110 120 108 116 105 119 116 0.1Spain 1060 1051 1186 1168 1185 1304 1303 1.6Sweden 406 374 417 332 380 401 395 0.5Switzerland 90 87 68 97 98 56 59 0.1Turkey 392 394 398 421 406 526 532 0.7
Contd...
CHAPTER ICHAPTER II
CHAPTER IIICHAPTER IV
CHAPTER VCHAPTER VI
CHAPTER VIICHAPTER VIII
CHAPTER IXCHAPTER X
CHAPTER XIAPPEN
DIX

154
XI.8: World Refinery Crude Throughput (Contd...) (in ‘000’ barrels daily^)
Country/Region/ Year 2010 2011 2012 2013 2014 2015 2016 % share in 2016
(1) (2) (3) (4) (5) (6) (7) (8) (9)Turkmenistan 170 165 157 160 163 157 153 0.2Ukraine 249 206 108 85 69 64 65 0.1United Kingdom 1395 1433 1348 1197 1125 1118 1069 1.3Uzbekistan 73 69 62 58 62 63 70 0.1Other Europe & Eurasia 186 160 134 140 132 148 158 0.2Total Europe & Eurasia 19335 19269 19376 18908 19158 19724 19420 24.1Iran 1829 1873 1932 1999 1932 1867 1891 2.3Iraq 520 543 579 598 487 409 440 0.5Israel 226 218 219 238 245 250 232 0.3Kuwait 892 852 916 873 879 913 830 1.0Qatar 294 278 292 270 261 253 280 0.3Saudi Arabia 1922 1884 1953 1876 2201 2479 2750 3.4United Arab Emirates 571 635 638 650 659 929 1000 1.2Other Middle East 809 805 719 685 671 629 605 0.8Total Middle East 7063 7087 7248 7189 7335 7728 8028 10.0Algeria 548 520 478 492 615 591 584 0.7Egypt 580 523 534 523 525 535 508 0.6South Africa 384 384 401 411 461 441 477 0.6Other Africa 910 726 797 827 625 532 533 0.7Total Africa 2422 2154 2210 2254 2226 2099 2102 2.6Australia 606 627 600 588 538 427 433 0.5Bangladesh 26 27 24 27 24 25 23 *China 8408 8686 9199 9599 10155 10684 11023 13.7India 3899 4085 4302 4462 4475 4561 4931 6.1Indonesia 853 880 820 822 848 836 885 1.1Japan 3619 3410 3400 3453 3289 3258 3280 4.1Malaysia 470 516 575 558 553 508 537 0.7New Zealand 99 108 109 105 101 109 108 0.1Pakistan 190 193 192 223 232 257 242 0.3Philippines 181 190 170 158 168 212 216 0.3Singapore 979 1035 1020 936 871 897 965 1.2South Korea 2390 2533 2582 2484 2516 2784 2928 3.6Taiwan 876 809 897 847 850 838 861 1.1Thailand 963 937 978 1078 1029 1132 1096 1.4Vietnam 123 124 142 145 125 145 148 0.2Other Asia Pacific 97 100 89 97 96 92 107 0.1Total Asia Pacific 23778 24258 25098 25581 25869 26765 27781 34.5Total World 75257 75586 76653 77086 78083 79905 80550 100
Note: *: Less than 0.051. Atmospheric distillation capacity on a calendar-day basis. 2. Total may not add up due to rounding off. Source: BP Statistical Review of World Energy, June 2017
CHAP
TER
ICH
APTE
R II
CHAP
TER
IIICH
APTE
R IV
CHAP
TER
VCH
APTE
R VI
CHAP
TER
VII
CHAP
TER
VIII
CHAP
TER
IXCH
APTE
R X
CHAP
TER
XIAP
PEN
DIX

155
XI.9 Country-wise World Oil Consumption*(in Million Tonnes)
Country/Region/ Year 2010 2011 2012 2013 2014 2015 2016 % share in 2016
(1) (2) (3) (4) (5) (6) (7) (8) (9)US 850.1 834.9 817.0 832.1 838.1 856.5 863.1 19.5Canada 101.0 104.2 102.3 103.5 103.1 99.1 100.9 2.3Mexico 88.6 90.3 92.3 89.8 85.4 84.4 82.8 1.9Total North America 1039.7 1029.5 1011.6 1025.4 1026.6 1040.0 1046.9 23.7Argentina 28.1 28.3 29.6 31.9 31.3 32.2 31.9 0.7Brazil 126.8 131.9 134.3 144.2 150.6 146.6 138.8 3.1Chile 16.0 17.6 17.5 16.8 17.4 17.6 17.8 0.4Colombia 11.9 12.8 13.9 13.9 14.8 15.6 15.9 0.4Ecuador 10.3 10.5 10.9 11.6 12.2 11.8 11.0 0.2Peru 8.6 9.5 9.6 10.1 10.0 10.7 11.4 0.3Trinidad & Tobago 2.2 2.1 2.0 2.3 2.1 2.2 2.2 0.1Venezuela 34.1 34.6 37.2 36.7 33.6 30.2 28.7 0.6Other S. & Cent. America 65.5 66.9 66.1 64.5 64.7 67.5 68.5 1.6Total S. & Cent. America 303.6 314.0 321.0 332.0 336.5 334.4 326.2 7.4Austria 13.4 12.7 12.5 12.7 12.5 12.5 12.7 0.3Azerbaijan 3.2 4.0 4.2 4.5 4.4 4.5 4.6 0.1Belarus 7.5 8.6 10.4 7.1 8.1 7.7 7.5 0.2Belgium 32.7 30.5 29.6 30.1 29.7 31.0 31.8 0.7Bulgaria 3.9 3.8 3.9 3.6 3.9 4.4 4.5 0.1Czech Republic 9.2 9.0 9.0 8.5 9.1 8.9 8.4 0.2Denmark 8.4 8.3 7.8 7.7 7.8 8.0 8.0 0.2Finland 10.6 9.7 9.1 9.0 8.6 8.7 9.0 0.2France 84.5 83.0 80.3 79.3 76.9 76.8 76.4 1.7Germany 115.4 112.0 111.4 113.4 110.4 110.0 113.0 2.6Greece 18.1 17.0 15.3 14.5 14.4 14.9 15.4 0.3Hungary 6.7 6.4 5.9 5.9 6.6 7.0 7.1 0.2Ireland 7.6 6.8 6.5 6.5 6.5 6.8 7.0 0.2Italy 73.1 70.5 64.2 59.4 55.8 57.6 58.1 1.3Kazakhstan 9.9 11.5 11.5 12.1 12.3 13.2 13.2 0.3Lithuania 2.7 2.6 2.7 2.6 2.6 2.8 3.0 0.1Netherlands 45.9 46.1 43.7 41.4 39.6 38.7 39.9 0.9Norway 10.8 10.6 10.5 10.8 10.2 10.3 10.4 0.2Poland 26.7 26.6 25.7 23.8 23.9 24.9 27.2 0.6Portugal 13.0 12.1 11.0 11.3 11.1 11.5 11.2 0.3Romania 8.8 9.1 9.2 8.4 9.0 9.2 9.5 0.2Russian Federation 133.3 142.2 144.6 144.3 152.3 144.2 148.0 3.3Slovakia 3.9 3.9 3.6 3.6 3.4 3.7 4.0 0.1Spain 72.1 68.8 64.7 59.3 59.0 61.2 62.5 1.4Sweden 16.2 14.8 14.6 14.4 14.5 14.1 14.7 0.3Switzerland 11.4 11.0 11.2 11.8 10.6 10.7 10.2 0.2Turkey 31.8 31.1 31.6 33.5 34.3 38.9 41.2 0.9Turkmenistan 5.5 5.8 6.0 6.2 6.5 6.6 6.7 0.2Ukraine 12.6 13.1 12.5 11.9 10.3 9.2 9.1 0.2United Kingdom 74.9 73.6 71.4 70.3 69.8 71.8 73.1 1.7Uzbekistan 3.6 3.4 3.0 2.9 2.7 2.7 2.8 0.1Other Europe & Eurasia 35.3 35.0 34.1 33.4 32.2 33.3 34.5 0.8Total Europe & Eurasia 912.3 903.7 882.1 864.3 858.8 865.9 884.6 20.0Iran 83.6 84.7 85.7 93.6 90.4 84.5 83.8 1.9Israel 11.2 11.8 13.9 11.5 10.6 11.4 11.6 0.3Kuwait 20.9 20.4 24.4 22.7 21.0 22.3 22.0 0.5
Contd...
CHAPTER ICHAPTER II
CHAPTER IIICHAPTER IV
CHAPTER VCHAPTER VI
CHAPTER VIICHAPTER VIII
CHAPTER IXCHAPTER X
CHAPTER XIAPPEN
DIX
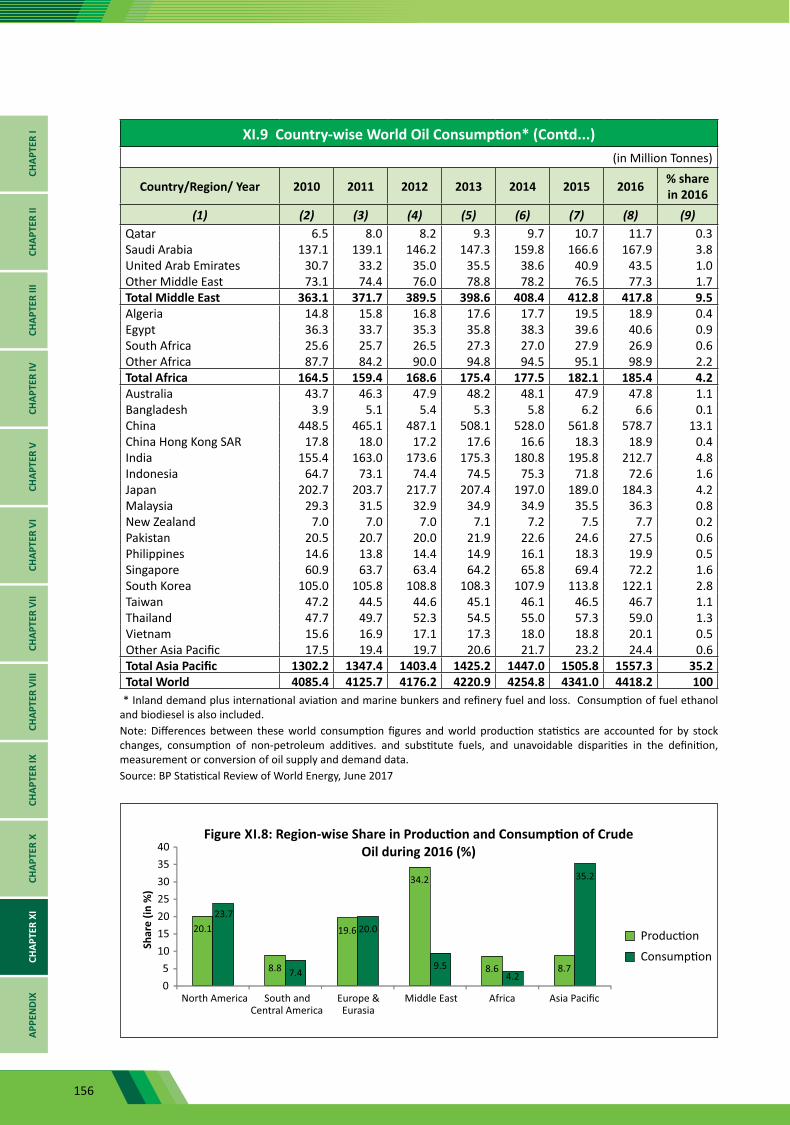
156
XI.9 Country-wise World Oil Consumption* (Contd...)(in Million Tonnes)
Country/Region/ Year 2010 2011 2012 2013 2014 2015 2016 % share in 2016
(1) (2) (3) (4) (5) (6) (7) (8) (9)Qatar 6.5 8.0 8.2 9.3 9.7 10.7 11.7 0.3Saudi Arabia 137.1 139.1 146.2 147.3 159.8 166.6 167.9 3.8United Arab Emirates 30.7 33.2 35.0 35.5 38.6 40.9 43.5 1.0Other Middle East 73.1 74.4 76.0 78.8 78.2 76.5 77.3 1.7Total Middle East 363.1 371.7 389.5 398.6 408.4 412.8 417.8 9.5Algeria 14.8 15.8 16.8 17.6 17.7 19.5 18.9 0.4Egypt 36.3 33.7 35.3 35.8 38.3 39.6 40.6 0.9South Africa 25.6 25.7 26.5 27.3 27.0 27.9 26.9 0.6Other Africa 87.7 84.2 90.0 94.8 94.5 95.1 98.9 2.2Total Africa 164.5 159.4 168.6 175.4 177.5 182.1 185.4 4.2Australia 43.7 46.3 47.9 48.2 48.1 47.9 47.8 1.1Bangladesh 3.9 5.1 5.4 5.3 5.8 6.2 6.6 0.1China 448.5 465.1 487.1 508.1 528.0 561.8 578.7 13.1China Hong Kong SAR 17.8 18.0 17.2 17.6 16.6 18.3 18.9 0.4India 155.4 163.0 173.6 175.3 180.8 195.8 212.7 4.8Indonesia 64.7 73.1 74.4 74.5 75.3 71.8 72.6 1.6Japan 202.7 203.7 217.7 207.4 197.0 189.0 184.3 4.2Malaysia 29.3 31.5 32.9 34.9 34.9 35.5 36.3 0.8New Zealand 7.0 7.0 7.0 7.1 7.2 7.5 7.7 0.2Pakistan 20.5 20.7 20.0 21.9 22.6 24.6 27.5 0.6Philippines 14.6 13.8 14.4 14.9 16.1 18.3 19.9 0.5Singapore 60.9 63.7 63.4 64.2 65.8 69.4 72.2 1.6South Korea 105.0 105.8 108.8 108.3 107.9 113.8 122.1 2.8Taiwan 47.2 44.5 44.6 45.1 46.1 46.5 46.7 1.1Thailand 47.7 49.7 52.3 54.5 55.0 57.3 59.0 1.3Vietnam 15.6 16.9 17.1 17.3 18.0 18.8 20.1 0.5Other Asia Pacific 17.5 19.4 19.7 20.6 21.7 23.2 24.4 0.6Total Asia Pacific 1302.2 1347.4 1403.4 1425.2 1447.0 1505.8 1557.3 35.2Total World 4085.4 4125.7 4176.2 4220.9 4254.8 4341.0 4418.2 100
* Inland demand plus international aviation and marine bunkers and refinery fuel and loss. Consumption of fuel ethanol and biodiesel is also included.Note: Differences between these world consumption figures and world production statistics are accounted for by stock changes, consumption of non-petroleum additives. and substitute fuels, and unavoidable disparities in the definition, measurement or conversion of oil supply and demand data.Source: BP Statistical Review of World Energy, June 2017
CHAP
TER
ICH
APTE
R II
CHAP
TER
IIICH
APTE
R IV
CHAP
TER
VCH
APTE
R VI
CHAP
TER
VII
CHAP
TER
VIII
CHAP
TER
IXCH
APTE
R X
CHAP
TER
XIAP
PEN
DIX

157
XI.10 Product-wise Regional Consumption of Main Petroleum Products(in ‘000’ barrels daily)
Country/Region/ Year 2010 2011 2012 2013 2014 2015 2016 % share in 2016
(1) (2) (3) (4) (5) (6) (7) (8) (9)North AmericaLight distillates 10950 10697 10572 10778 10841 11088 11312 11.72Middle distillates 6567 6694 6409 6519 6801 6812 6750 6.99Fuel oil 810 745 662 576 447 419 505 0.52Others 5172 5169 5251 5492 5332 5435 5276 5.46Total North America 23499 23305 22894 23364 23421 23753 23843 24.69of which: USLight distillates 9263 9022 8932 9125 9164 9413 9556 9.90Middle distillates 5464 5518 5278 5371 5632 5657 5594 5.79Fuel oil 532 459 367 317 256 258 356 0.37Others 3921 3883 3913 4147 4054 4203 4125 4.27Total US 19180 18882 18490 18961 19106 19531 19631 20.33South and Central AmericaLight distillates 1890 1969 2019 2118 2178 2231 2214 2.29Middle distillates 2392 2513 2635 2760 2774 2749 2696 2.79Fuel oil 763 741 740 715 734 730 663 0.69Others 1379 1443 1432 1481 1484 1429 1403 1.45Total S. & Cent. America 6424 6666 6826 7073 7171 7139 6976 7.22Europe & EurasiaLight distillates 4661 4448 4325 4272 4208 4143 4144 4.29Middle distillates 8970 8954 8839 8859 8787 9071 9269 9.60Fuel oil 1655 1631 1499 1387 1369 1235 1306 1.35Others 3958 4031 3932 3852 3924 4000 4074 4.22Total Europe & Eurasia 19244 19064 18594 18370 18287 18450 18793 19.46Middle EastLight distillates 1681 1758 1839 1908 1944 2009 2053 2.13Middle distillates 2412 2537 2656 2753 2749 2672 2661 2.76Fuel oil 1939 1972 2042 2080 2211 2235 2192 2.27Others 2070 2115 2223 2209 2276 2384 2525 2.61Total Middle East 8102 8382 8760 8950 9180 9300 9431 9.77AfricaLight distillates 835 815 867 883 902 954 1038 1.08Middle distillates 1613 1615 1680 1805 1846 1872 1843 1.91Fuel oil 460 394 440 438 437 431 421 0.44Others 576 568 583 595 586 609 634 0.66Total Africa 3483 3393 3571 3720 3771 3866 3937 4.08Asia PacificLight distillates 8320 8526 8944 9449 9759 10519 10955 11.35Middle distillates 9917 10345 10788 10991 11085 11368 11414 11.82
Contd...
CHAPTER ICHAPTER II
CHAPTER IIICHAPTER IV
CHAPTER VCHAPTER VI
CHAPTER VIICHAPTER VIII
CHAPTER IXCHAPTER X
CHAPTER XIAPPEN
DIX
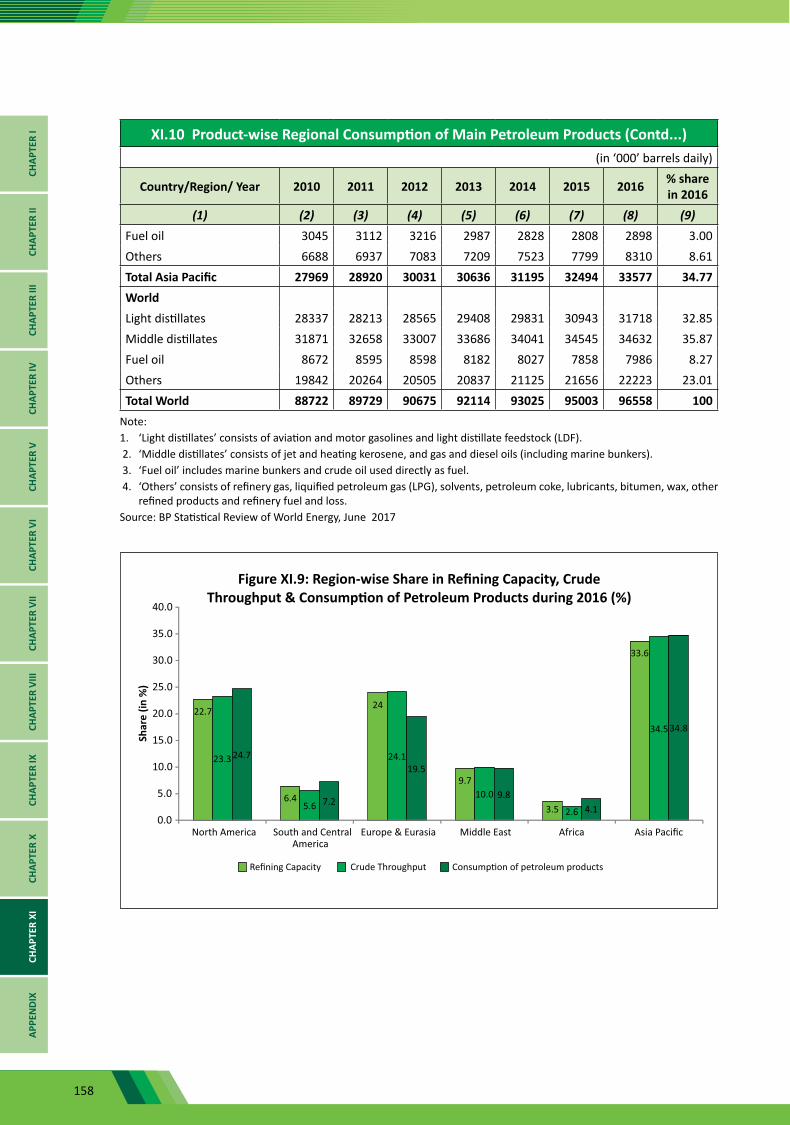
158
XI.10 Product-wise Regional Consumption of Main Petroleum Products (Contd...)(in ‘000’ barrels daily)
Country/Region/ Year 2010 2011 2012 2013 2014 2015 2016 % share in 2016
(1) (2) (3) (4) (5) (6) (7) (8) (9)Fuel oil 3045 3112 3216 2987 2828 2808 2898 3.00Others 6688 6937 7083 7209 7523 7799 8310 8.61Total Asia Pacific 27969 28920 30031 30636 31195 32494 33577 34.77WorldLight distillates 28337 28213 28565 29408 29831 30943 31718 32.85Middle distillates 31871 32658 33007 33686 34041 34545 34632 35.87Fuel oil 8672 8595 8598 8182 8027 7858 7986 8.27Others 19842 20264 20505 20837 21125 21656 22223 23.01Total World 88722 89729 90675 92114 93025 95003 96558 100
Note:1. ‘Light distillates’ consists of aviation and motor gasolines and light distillate feedstock (LDF). 2. ‘Middle distillates’ consists of jet and heating kerosene, and gas and diesel oils (including marine bunkers). 3. ‘Fuel oil’ includes marine bunkers and crude oil used directly as fuel. 4. ‘Others’ consists of refinery gas, liquified petroleum gas (LPG), solvents, petroleum coke, lubricants, bitumen, wax, other
refined products and refinery fuel and loss.Source: BP Statistical Review of World Energy, June 2017
CHAP
TER
ICH
APTE
R II
CHAP
TER
IIICH
APTE
R IV
CHAP
TER
VCH
APTE
R VI
CHAP
TER
VII
CHAP
TER
VIII
CHAP
TER
IXCH
APTE
R X
CHAP
TER
XIAP
PEN
DIX
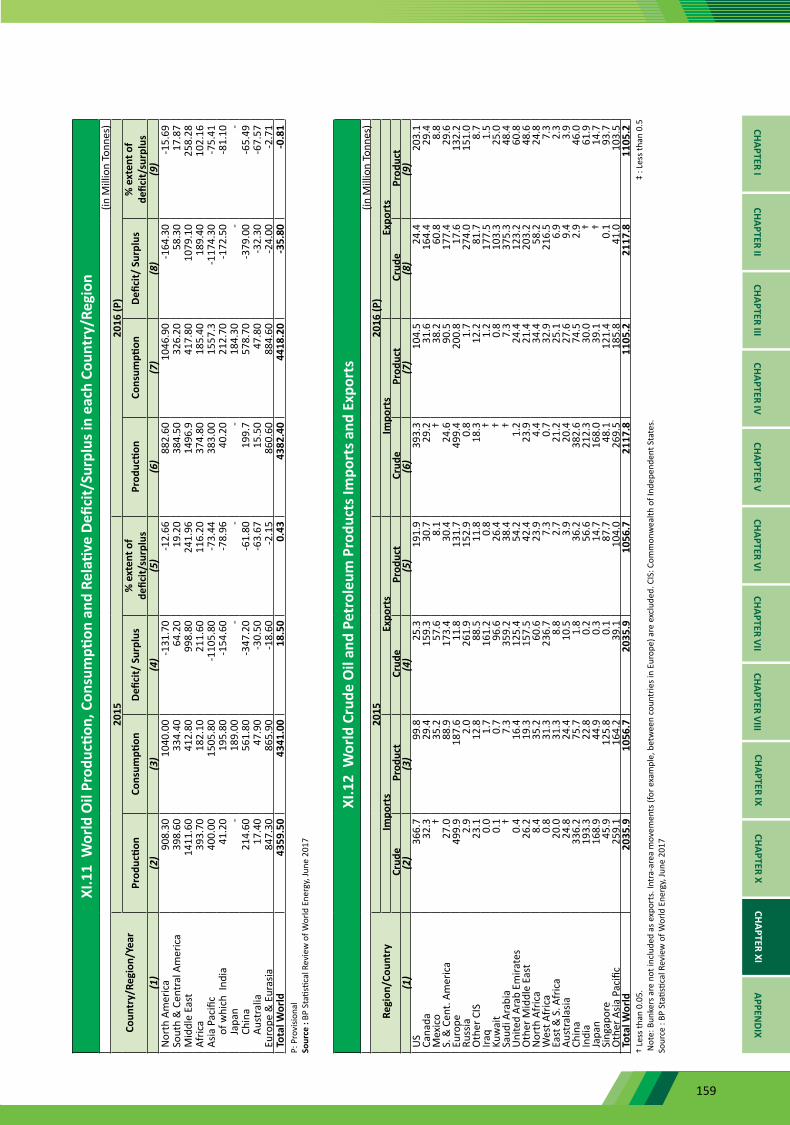
159
XI.1
1 W
orld
Oil
Prod
uctio
n, C
onsu
mpti
on a
nd R
elati
ve D
efici
t/Su
rplu
s in
each
Cou
ntry
/Reg
ion
(in M
illio
n To
nnes
)
Coun
try/
Regi
on/Y
ear
2015
2016
(P)
Prod
uctio
nCo
nsum
ption
Defic
it/ S
urpl
us%
ext
ent o
f de
ficit/
surp
lus
Prod
uctio
nCo
nsum
ption
Defic
it/ S
urpl
us%
ext
ent o
f de
ficit/
surp
lus
(1)
(2)
(3)
(4)
(5)
(6)
(7)
(8)
(9)
Nor
th A
mer
ica
908.
3010
40.0
0-1
31.7
0-1
2.66
882.
6010
46.9
0-1
64.3
0-1
5.69
Sout
h &
Cen
tral
Am
eric
a39
8.60
334.
4064
.20
19.2
038
4.50
326.
2058
.30
17.8
7M
iddl
e Ea
st14
11.6
041
2.80
998.
8024
1.96
1496
.941
7.80
1079
.10
258.
28Af
rica
393.
7018
2.10
211.
6011
6.20
374.
8018
5.40
189.
4010
2.16
Asia
Pac
ific
400.
0015
05.8
0-1
105.
80-7
3.44
383.
0015
57.3
-117
4.30
-75.
41
of w
hich
Ind
ia41
.20
195.
80-1
54.6
0-7
8.96
40.2
021
2.70
-172
.50
-81.
10
Jap
an
-18
9.00
--
-18
4.30
--
C
hina
214.
6056
1.80
-347
.20
-61.
8019
9.7
578.
70-3
79.0
0-6
5.49
A
ustr
alia
17.4
047
.90
-30.
50-6
3.67
15.5
047
.80
-32.
30-6
7.57
Euro
pe &
Eur
asia
847.
3086
5.90
-18.
60-2
.15
860.
6088
4.60
-24.
00-2
.71
Tota
l Wor
ld43
59.5
043
41.0
018
.50
0.43
4382
.40
4418
.20
-35.
80-0
.81
P: P
rovi
siona
lSo
urce
: BP
Sta
tistic
al R
evie
w o
f Wor
ld E
nerg
y, Ju
ne 2
017
XI.1
2 W
orld
Cru
de O
il an
d Pe
trol
eum
Pro
duct
s Im
port
s and
Exp
orts
(in
Mill
ion
Tonn
es)
Reg
ion/
Coun
try
2015
2016
(P)
Impo
rts
Exp
orts
Im
port
s E
xpor
ts
Cru
de
Pro
duct
C
rude
P
rodu
ct
Cru
de
Pro
duct
C
rude
P
rodu
ct
(1)
(2)
(3)
(4)
(5)
(6)
(7)
(8)
(9)
US
366.
799
.825
.319
1.9
393.
310
4.5
24.4
203.
1Ca
nada
32.3
29.4
159.
330
.729
.231
.616
4.4
29.4
Mex
ico
†35
.257
.68.
1†
38.2
60.8
8.8
S. &
Cen
t. Am
eric
a27
.088
.917
3.4
30.4
24.6
90.5
177.
429
.6Eu
rope
49
9.9
187.
611
.813
1.7
499.
420
0.8
17.6
132.
2Ru
ssia
2.9
2.0
261.
915
2.9
0.8
1.7
274.
015
1.0
Oth
er C
IS23
.112
.888
.511
.818
.312
.281
.78.
7Ira
q0.
01.
716
1.2
0.8
†1.
217
7.5
1.5
Kuw
ait
0.1
0.7
96.6
26.4
†0.
810
3.3
25.0
Saud
i Ara
bia
†7.
335
9.2
38.4
†7.
337
5.3
48.4
Uni
ted
Arab
Em
irate
s0.
416
.412
5.4
54.2
1.2
24.4
123.
260
.8O
ther
Mid
dle
East
26.2
19.3
157.
542
.423
.921
.420
3.2
48.6
Nor
th A
fric
a8.
435
.260
.623
.94.
434
.458
.224
.8W
est A
fric
a0.
831
.323
6.7
7.3
0.7
32.9
216.
57.
3Ea
st &
S. A
fric
a20
.031
.38.
82.
721
.225
.16.
92.
3Au
stra
lasia
24.8
24.4
10.5
3.9
20.4
27.6
9.4
3.9
Chin
a33
6.2
75.7
1.8
36.2
382.
674
.52.
946
.0In
dia
193.
322
.80.
256
.621
2.3
30.0
†61
.9Ja
pan
168.
944
.90.
314
.716
8.0
39.1
†14
.7Si
ngap
ore
45.9
125.
80.
187
.748
.112
1.4
0.1
93.7
Oth
er A
sia P
acifi
c25
9.1
164.
239
.110
4.0
269.
518
5.8
41.0
103.
5To
tal W
orld
2035
.910
56.7
2035
.910
56.7
2117
.811
05.2
2117
.811
05.2
† Le
ss th
an 0
.05.
‡
: Les
s tha
n 0.
5 N
ote:
Bun
kers
are
not
incl
uded
as e
xpor
ts. I
ntra
-are
a m
ovem
ents
(for
exa
mpl
e, b
etw
een
coun
trie
s in
Euro
pe) a
re e
xclu
ded.
CIS
: Com
mon
wea
lth o
f Ind
epen
dent
Sta
tes.
Sour
ce :
BP S
tatis
tical
Rev
iew
of W
orld
Ene
rgy,
June
201
7
CHAPTER ICHAPTER II
CHAPTER IIICHAPTER IV
CHAPTER VCHAPTER VI
CHAPTER VIICHAPTER VIII
CHAPTER IXCHAPTER X
CHAPTER XIAPPEN
DIX
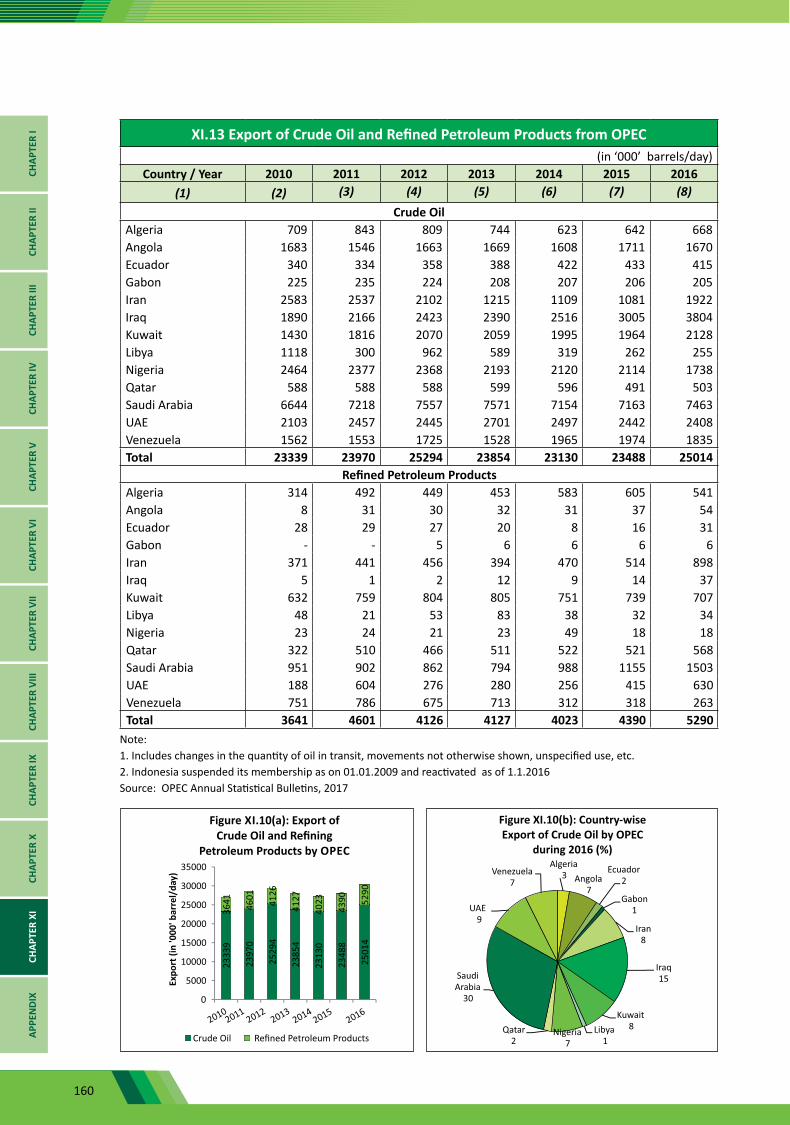
160
XI.13 Export of Crude Oil and Refined Petroleum Products from OPEC (in ‘000’ barrels/day)
Country / Year 2010 2011 2012 2013 2014 2015 2016(1) (2) (3) (4) (5) (6) (7) (8)
Crude OilAlgeria 709 843 809 744 623 642 668Angola 1683 1546 1663 1669 1608 1711 1670Ecuador 340 334 358 388 422 433 415Gabon 225 235 224 208 207 206 205Iran 2583 2537 2102 1215 1109 1081 1922Iraq 1890 2166 2423 2390 2516 3005 3804Kuwait 1430 1816 2070 2059 1995 1964 2128Libya 1118 300 962 589 319 262 255Nigeria 2464 2377 2368 2193 2120 2114 1738Qatar 588 588 588 599 596 491 503Saudi Arabia 6644 7218 7557 7571 7154 7163 7463UAE 2103 2457 2445 2701 2497 2442 2408Venezuela 1562 1553 1725 1528 1965 1974 1835Total 23339 23970 25294 23854 23130 23488 25014
Refined Petroleum Products Algeria 314 492 449 453 583 605 541Angola 8 31 30 32 31 37 54Ecuador 28 29 27 20 8 16 31Gabon - - 5 6 6 6 6Iran 371 441 456 394 470 514 898Iraq 5 1 2 12 9 14 37Kuwait 632 759 804 805 751 739 707Libya 48 21 53 83 38 32 34Nigeria 23 24 21 23 49 18 18Qatar 322 510 466 511 522 521 568Saudi Arabia 951 902 862 794 988 1155 1503UAE 188 604 276 280 256 415 630Venezuela 751 786 675 713 312 318 263Total 3641 4601 4126 4127 4023 4390 5290
Note:1. Includes changes in the quantity of oil in transit, movements not otherwise shown, unspecified use, etc. 2. Indonesia suspended its membership as on 01.01.2009 and reactivated as of 1.1.2016Source: OPEC Annual Statistical Bulletins, 2017
CHAP
TER
ICH
APTE
R II
CHAP
TER
IIICH
APTE
R IV
CHAP
TER
VCH
APTE
R VI
CHAP
TER
VII
CHAP
TER
VIII
CHAP
TER
IXCH
APTE
R X
CHAP
TER
XIAP
PEN
DIX
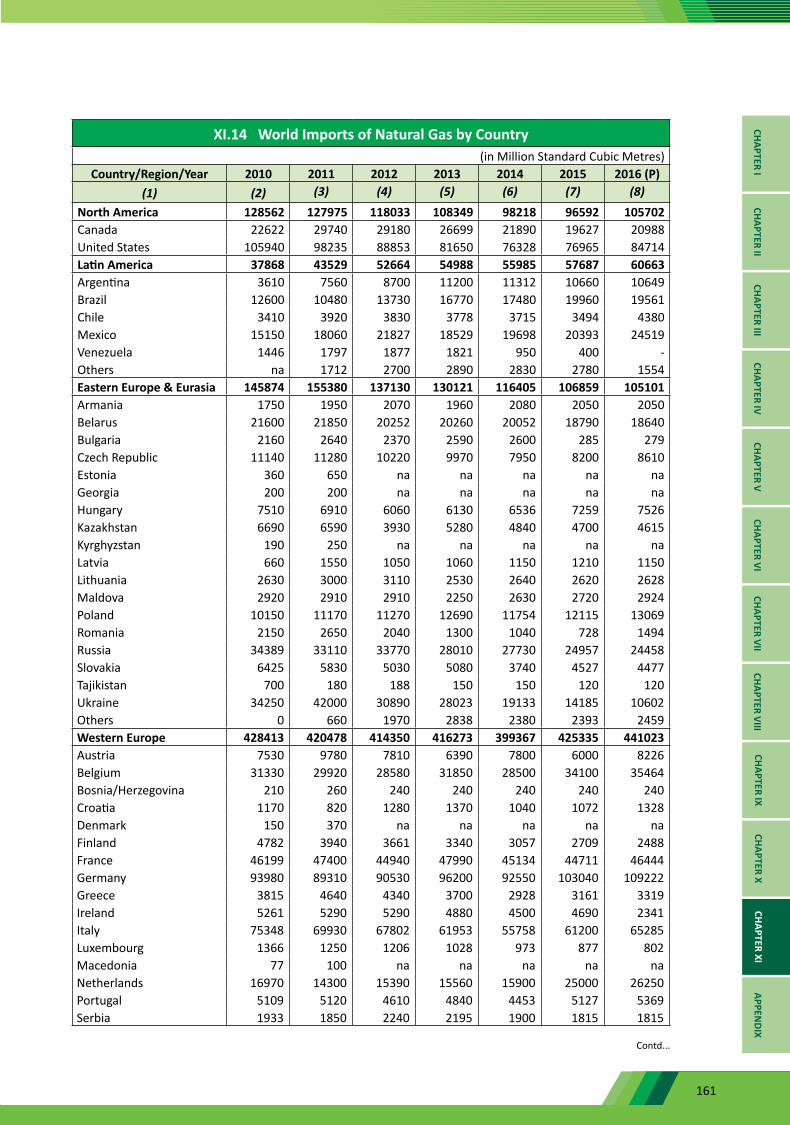
161
XI.14 World Imports of Natural Gas by Country(in Million Standard Cubic Metres)
Country/Region/Year 2010 2011 2012 2013 2014 2015 2016 (P)(1) (2) (3) (4) (5) (6) (7) (8)
North America 128562 127975 118033 108349 98218 96592 105702Canada 22622 29740 29180 26699 21890 19627 20988United States 105940 98235 88853 81650 76328 76965 84714Latin America 37868 43529 52664 54988 55985 57687 60663Argentina 3610 7560 8700 11200 11312 10660 10649Brazil 12600 10480 13730 16770 17480 19960 19561Chile 3410 3920 3830 3778 3715 3494 4380Mexico 15150 18060 21827 18529 19698 20393 24519Venezuela 1446 1797 1877 1821 950 400 -Others na 1712 2700 2890 2830 2780 1554Eastern Europe & Eurasia 145874 155380 137130 130121 116405 106859 105101Armania 1750 1950 2070 1960 2080 2050 2050Belarus 21600 21850 20252 20260 20052 18790 18640Bulgaria 2160 2640 2370 2590 2600 285 279Czech Republic 11140 11280 10220 9970 7950 8200 8610Estonia 360 650 na na na na naGeorgia 200 200 na na na na naHungary 7510 6910 6060 6130 6536 7259 7526Kazakhstan 6690 6590 3930 5280 4840 4700 4615Kyrghyzstan 190 250 na na na na naLatvia 660 1550 1050 1060 1150 1210 1150Lithuania 2630 3000 3110 2530 2640 2620 2628Maldova 2920 2910 2910 2250 2630 2720 2924Poland 10150 11170 11270 12690 11754 12115 13069Romania 2150 2650 2040 1300 1040 728 1494Russia 34389 33110 33770 28010 27730 24957 24458Slovakia 6425 5830 5030 5080 3740 4527 4477Tajikistan 700 180 188 150 150 120 120Ukraine 34250 42000 30890 28023 19133 14185 10602Others 0 660 1970 2838 2380 2393 2459Western Europe 428413 420478 414350 416273 399367 425335 441023Austria 7530 9780 7810 6390 7800 6000 8226Belgium 31330 29920 28580 31850 28500 34100 35464Bosnia/Herzegovina 210 260 240 240 240 240 240Croatia 1170 820 1280 1370 1040 1072 1328Denmark 150 370 na na na na naFinland 4782 3940 3661 3340 3057 2709 2488France 46199 47400 44940 47990 45134 44711 46444Germany 93980 89310 90530 96200 92550 103040 109222Greece 3815 4640 4340 3700 2928 3161 3319Ireland 5261 5290 5290 4880 4500 4690 2341Italy 75348 69930 67802 61953 55758 61200 65285Luxembourg 1366 1250 1206 1028 973 877 802Macedonia 77 100 na na na na naNetherlands 16970 14300 15390 15560 15900 25000 26250Portugal 5109 5120 4610 4840 4453 5127 5369Serbia 1933 1850 2240 2195 1900 1815 1815
Contd...
CHAPTER ICHAPTER II
CHAPTER IIICHAPTER IV
CHAPTER VCHAPTER VI
CHAPTER VIICHAPTER VIII
CHAPTER IXCHAPTER X
CHAPTER XIAPPEN
DIX
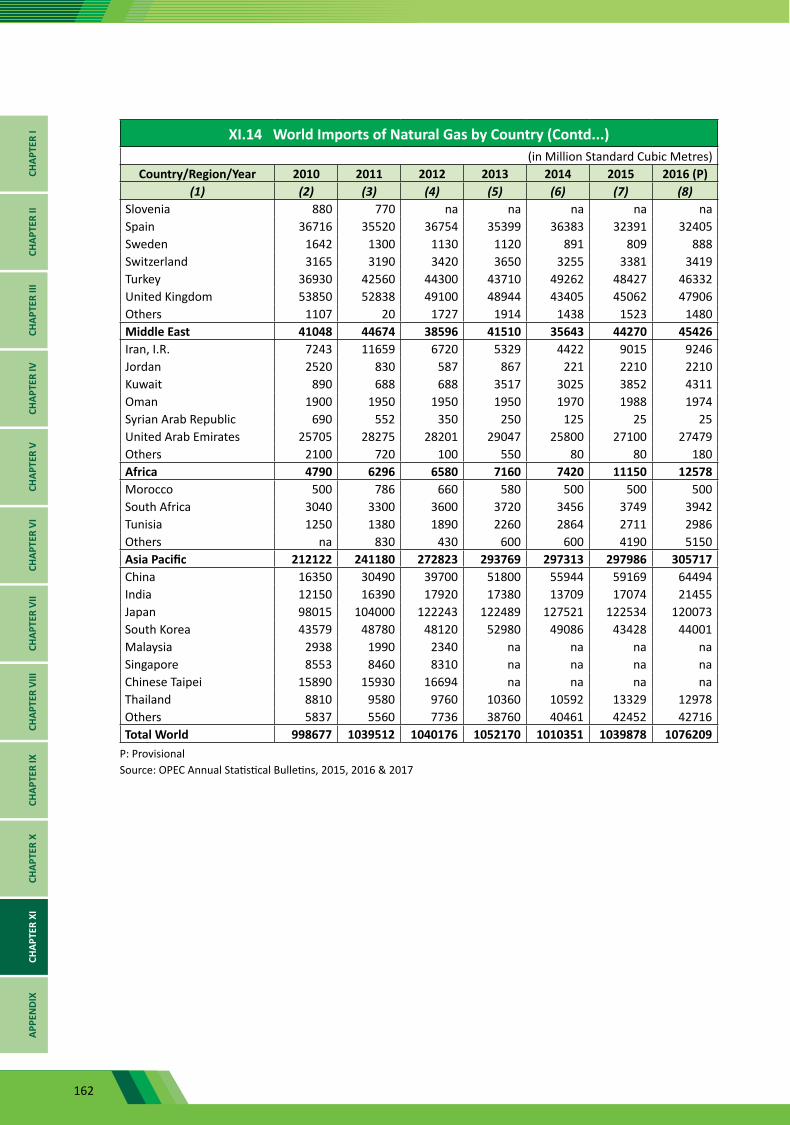
162
XI.14 World Imports of Natural Gas by Country (Contd...)(in Million Standard Cubic Metres)
Country/Region/Year 2010 2011 2012 2013 2014 2015 2016 (P)(1) (2) (3) (4) (5) (6) (7) (8)
Slovenia 880 770 na na na na naSpain 36716 35520 36754 35399 36383 32391 32405Sweden 1642 1300 1130 1120 891 809 888Switzerland 3165 3190 3420 3650 3255 3381 3419Turkey 36930 42560 44300 43710 49262 48427 46332United Kingdom 53850 52838 49100 48944 43405 45062 47906Others 1107 20 1727 1914 1438 1523 1480Middle East 41048 44674 38596 41510 35643 44270 45426Iran, I.R. 7243 11659 6720 5329 4422 9015 9246Jordan 2520 830 587 867 221 2210 2210Kuwait 890 688 688 3517 3025 3852 4311Oman 1900 1950 1950 1950 1970 1988 1974Syrian Arab Republic 690 552 350 250 125 25 25United Arab Emirates 25705 28275 28201 29047 25800 27100 27479Others 2100 720 100 550 80 80 180Africa 4790 6296 6580 7160 7420 11150 12578Morocco 500 786 660 580 500 500 500South Africa 3040 3300 3600 3720 3456 3749 3942Tunisia 1250 1380 1890 2260 2864 2711 2986Others na 830 430 600 600 4190 5150Asia Pacific 212122 241180 272823 293769 297313 297986 305717China 16350 30490 39700 51800 55944 59169 64494India 12150 16390 17920 17380 13709 17074 21455Japan 98015 104000 122243 122489 127521 122534 120073South Korea 43579 48780 48120 52980 49086 43428 44001Malaysia 2938 1990 2340 na na na naSingapore 8553 8460 8310 na na na naChinese Taipei 15890 15930 16694 na na na naThailand 8810 9580 9760 10360 10592 13329 12978Others 5837 5560 7736 38760 40461 42452 42716Total World 998677 1039512 1040176 1052170 1010351 1039878 1076209
P: ProvisionalSource: OPEC Annual Statistical Bulletins, 2015, 2016 & 2017
CHAP
TER
ICH
APTE
R II
CHAP
TER
IIICH
APTE
R IV
CHAP
TER
VCH
APTE
R VI
CHAP
TER
VII
CHAP
TER
VIII
CHAP
TER
IXCH
APTE
R X
CHAP
TER
XIAP
PEN
DIX

163
XI.15 World Imports of Petroleum Products by Country (in ‘000’ Barrels/ Day)
Country / Year 2010 2011 2012 2013 2014 2015 2016 (P)(1) (2) (3) (4) (5) (6) (7) (8)
NORTH AMERICA 2005 2818 2288 2347 2139 2327 2427Canada 251 317 217 218 242 241 246United States 1748 2501 2071 2129 1897 2086 2181LATIN AMERICA 2235 2424 2341 2306 2465 2670 2539Brazil 501 683 568 544 611 556 551Chile na na 138 140 135 154 156Ecuador 119 104 118 133 157 152 123Mexico 654 660 647 560 616 712 745Panama 64 51 61 59 62 58 66Venezuela 72 68 145 133 158 187 160Others 825 859 665 737 725 851 738Eastern Europe and Eurasia 792 868 814 811 865 902 983Bulgaria 37 26 31 32 34 38 39Russia 57 92 41 45 48 57 66Hungary 57 46 104 108 121 127 170Poland 138 130 176 153 169 163 196Others 503 575 463 473 495 517 512WESTERN EUROPE 7433 6742 6707 7039 7026 7319 7661Belgium 450 428 389 546 490 547 553France 839 815 900 881 897 857 824Germany 757 702 689 802 792 800 806Italy 390 233 206 260 253 262 325Netherlands 1766 1753 1871 1843 1793 1901 1932Spain na na 329 284 330 322 364Turkey na na 445 461 480 498 528United Kingdom 677 495 538 595 608 652 734Others 2554 2317 1341 1366 1384 1480 1596MIDDLE EAST 1063 981 1475 1556 1665 1844 1849Iran 107 30 6 15 40 53 62Iraq 48 63 103 84 99 81 92Qatar na na 0 6 5 33 21Saudi Arabia 170 197 320 482 465 588 591United Arab Emirates na na 290 292 350 358 340Others 738 691 756 677 706 732 743AFRICA 1493 1552 1682 1614 1633 1896 1886Algeria 18 43 94 102 55 83 73Angola 57 64 92 89 99 135 76Egypt 183 186 240 178 186 367 351Gabon na na 8 8 9 10 11Libya na 93 86 152 99 90 90Morocco 160 163 161 166 163 161 257Nigeria 197 412 352 331 439 441 423Tunisia 80 73 61 61 68 81 75Others 798 518 589 527 516 528 531Asia and Pacific 7861 8446 8417 8900 9159 9808 10027Australia 323 337 379 423 430 546 553China 997 1011 1018 1093 958 1151 1220India 390 394 405 372 488 637 814Indonesia na 435 467 461 555 506 499Japan 1053 1026 1089 1003 993 973 869Malaysia na na 382 517 543 588 662Singapore 2021 2513 2168 2310 2389 2576 2516South Korea na 763 853 899 886 844 901Others 3077 1967 1657 1821 1918 1988 1994TOTAL WORLD 22882 23831 23723 24573 24952 26765 27371Source : OPEC Annual Statistical Bulletins, 2016, 2016 & 2017 P: Provisional na: not available
CHAPTER ICHAPTER II
CHAPTER IIICHAPTER IV
CHAPTER VCHAPTER VI
CHAPTER VIICHAPTER VIII
CHAPTER IXCHAPTER X
CHAPTER XIAPPEN
DIX

164
XI.16 World Crude Oil Export by Country (in ‘000’ Barrels/ Day)
Country / Year 2010 2011 2012 2013 2014 2015 2016 (P)(1) (2) (3) (4) (5) (6) (7) (8)
NORTH AMERICA 1520 1731 1824 2193 2627 2766 3262Canada 1478 1684 1757 2059 2276 2301 2742United States 42 47 67 134 351 465 520LATIN AMERICA 4624 4600 4579 4383 4945 5213 5122Brazil na na 488 366 517 736 891Columbia 484 558 555 703 722 736 614Ecuador 340 334 358 388 422 433 415Mexico 1460 1420 1333 1271 1220 1247 1274Trinidad and Tobago 75 40 31 38 34 29 28Venezuela 1562 1553 1725 1528 1965 1974 1835Others 703 695 89 89 65 58 65EASTERN EUROPE & EURASIA 7273 7011 6968 6944 6800 7197 7382Azerbaijan na na 698 692 669 663 655Kazakhstan na na 1365 1378 1390 1393 1386Russia 4978 4786 4757 4689 4489 4898 5081Others 2295 2225 147 184 252 243 260WESTERN EUROPE 2555 2176 2038 1969 1892 1949 2096Norway 1602 1423 1303 1199 1203 1235 1373United Kingdom 747 563 576 614 571 595 620Others 206 190 159 156 118 120 103MIDDLE EAST 16323 17772 18077 17497 16793 17037 19211 Iran 2583 2537 2102 1215 1109 1081 1922 Iraq 1890 2166 2423 2390 2516 3005 3804 Kuwait 1430 1816 2070 2059 1995 1964 2128Oman 749 742 768 838 804 788 888Qatar 588 588 588 599 596 491 503 Saudi Arabia 6644 7218 7557 7571 7153 7163 7463United Arab Emirates 2103 2457 2445 2701 2497 2442 2408Others 336 248 123 124 123 104 96AFRICA 7608 6636 6994 6522 6054 6202 5747 Algeria 709 843 809 744 623 642 668 Angola 1683 1546 1663 1669 1608 1711 1670 Congo 288 264 252 241 261 227 254 Egypt 85 83 91 97 117 156 165 Gabon 225 235 224 208 207 206 205 Libia 1118 300 962 589 319 262 255 Nigeria 2464 2377 2368 2193 2120 2114 1738 Sudan 389 363 60 133 168 166 162 Others 647 625 565 649 631 717 629ASIA AND PACIFIC 1565 1291 1239 1131 1200 1324 1356 Australia 314 272 261 206 244 222 200 Brunei 162 154 139 115 108 112 105 China 61 51 49 32 12 57 58 Indonesia 356 257 229 229 256 315 335 Malaysia 370 280 268 263 278 366 390 Vietnam 161 165 185 170 173 144 146 Others 141 113 109 117 128 109 123TOTAL WORLD 41468 41218 41718 40639 40311 41688 44175OPEC 23339 23970 25294 23854 23130 23488 25014OPEC (%) 56 58 61 59 57 56 57
Note: P: Provisional 1. Revision have been made throughout the time series. Data includes re-exports. 2. Figures of World crude oil exports of OPEC and BP Statistical Review may not tally due to difference in coverage and
methodology used. Source : OPEC Annual Statistical Bulletins, 2015, 2016 & 2017
CHAP
TER
ICH
APTE
R II
CHAP
TER
IIICH
APTE
R IV
CHAP
TER
VCH
APTE
R VI
CHAP
TER
VII
CHAP
TER
VIII
CHAP
TER
IXCH
APTE
R X
CHAP
TER
XIAP
PEN
DIX
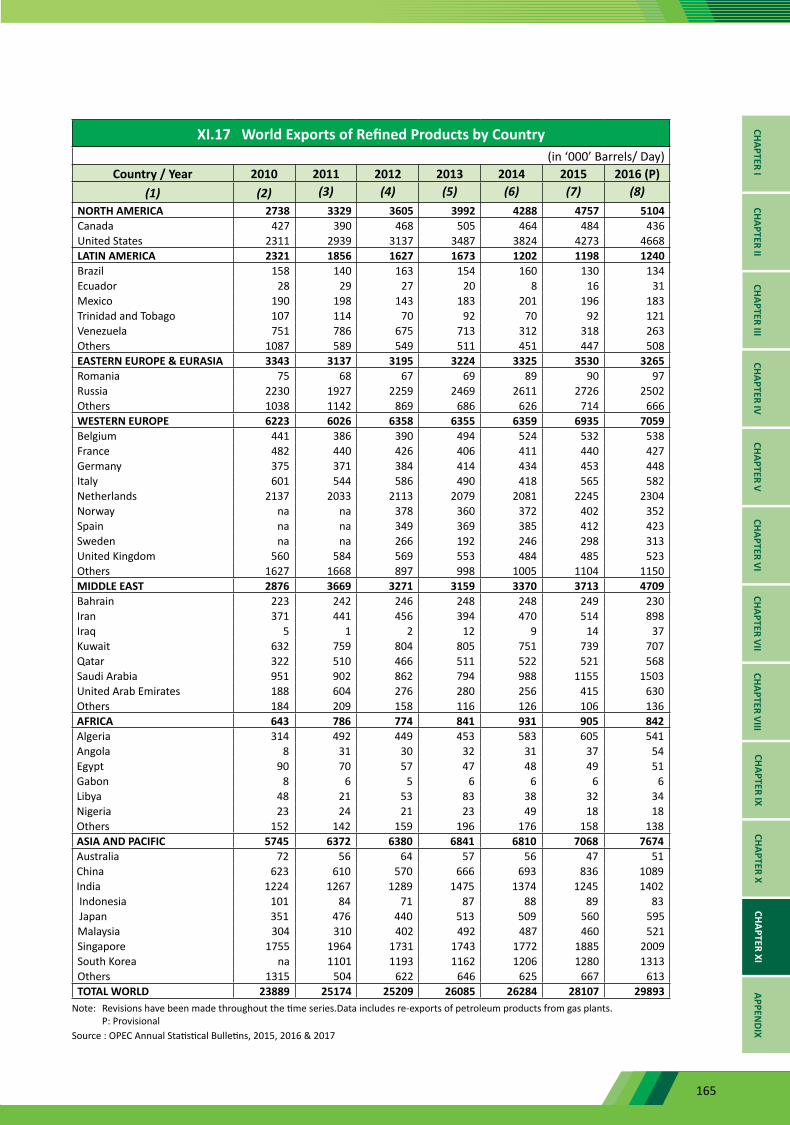
165
XI.17 World Exports of Refined Products by Country (in ‘000’ Barrels/ Day)
Country / Year 2010 2011 2012 2013 2014 2015 2016 (P)(1) (2) (3) (4) (5) (6) (7) (8)
NORTH AMERICA 2738 3329 3605 3992 4288 4757 5104Canada 427 390 468 505 464 484 436United States 2311 2939 3137 3487 3824 4273 4668LATIN AMERICA 2321 1856 1627 1673 1202 1198 1240Brazil 158 140 163 154 160 130 134Ecuador 28 29 27 20 8 16 31Mexico 190 198 143 183 201 196 183Trinidad and Tobago 107 114 70 92 70 92 121Venezuela 751 786 675 713 312 318 263Others 1087 589 549 511 451 447 508EASTERN EUROPE & EURASIA 3343 3137 3195 3224 3325 3530 3265Romania 75 68 67 69 89 90 97Russia 2230 1927 2259 2469 2611 2726 2502Others 1038 1142 869 686 626 714 666WESTERN EUROPE 6223 6026 6358 6355 6359 6935 7059Belgium 441 386 390 494 524 532 538France 482 440 426 406 411 440 427Germany 375 371 384 414 434 453 448Italy 601 544 586 490 418 565 582Netherlands 2137 2033 2113 2079 2081 2245 2304Norway na na 378 360 372 402 352Spain na na 349 369 385 412 423Sweden na na 266 192 246 298 313United Kingdom 560 584 569 553 484 485 523Others 1627 1668 897 998 1005 1104 1150MIDDLE EAST 2876 3669 3271 3159 3370 3713 4709Bahrain 223 242 246 248 248 249 230Iran 371 441 456 394 470 514 898Iraq 5 1 2 12 9 14 37Kuwait 632 759 804 805 751 739 707Qatar 322 510 466 511 522 521 568Saudi Arabia 951 902 862 794 988 1155 1503United Arab Emirates 188 604 276 280 256 415 630Others 184 209 158 116 126 106 136AFRICA 643 786 774 841 931 905 842Algeria 314 492 449 453 583 605 541Angola 8 31 30 32 31 37 54Egypt 90 70 57 47 48 49 51Gabon 8 6 5 6 6 6 6Libya 48 21 53 83 38 32 34Nigeria 23 24 21 23 49 18 18Others 152 142 159 196 176 158 138ASIA AND PACIFIC 5745 6372 6380 6841 6810 7068 7674Australia 72 56 64 57 56 47 51China 623 610 570 666 693 836 1089India 1224 1267 1289 1475 1374 1245 1402 Indonesia 101 84 71 87 88 89 83 Japan 351 476 440 513 509 560 595Malaysia 304 310 402 492 487 460 521Singapore 1755 1964 1731 1743 1772 1885 2009South Korea na 1101 1193 1162 1206 1280 1313Others 1315 504 622 646 625 667 613TOTAL WORLD 23889 25174 25209 26085 26284 28107 29893
Note: Revisions have been made throughout the time series.Data includes re-exports of petroleum products from gas plants. P: Provisional
Source : OPEC Annual Statistical Bulletins, 2015, 2016 & 2017
CHAPTER ICHAPTER II
CHAPTER IIICHAPTER IV
CHAPTER VCHAPTER VI
CHAPTER VIICHAPTER VIII
CHAPTER IXCHAPTER X
CHAPTER XIAPPEN
DIX
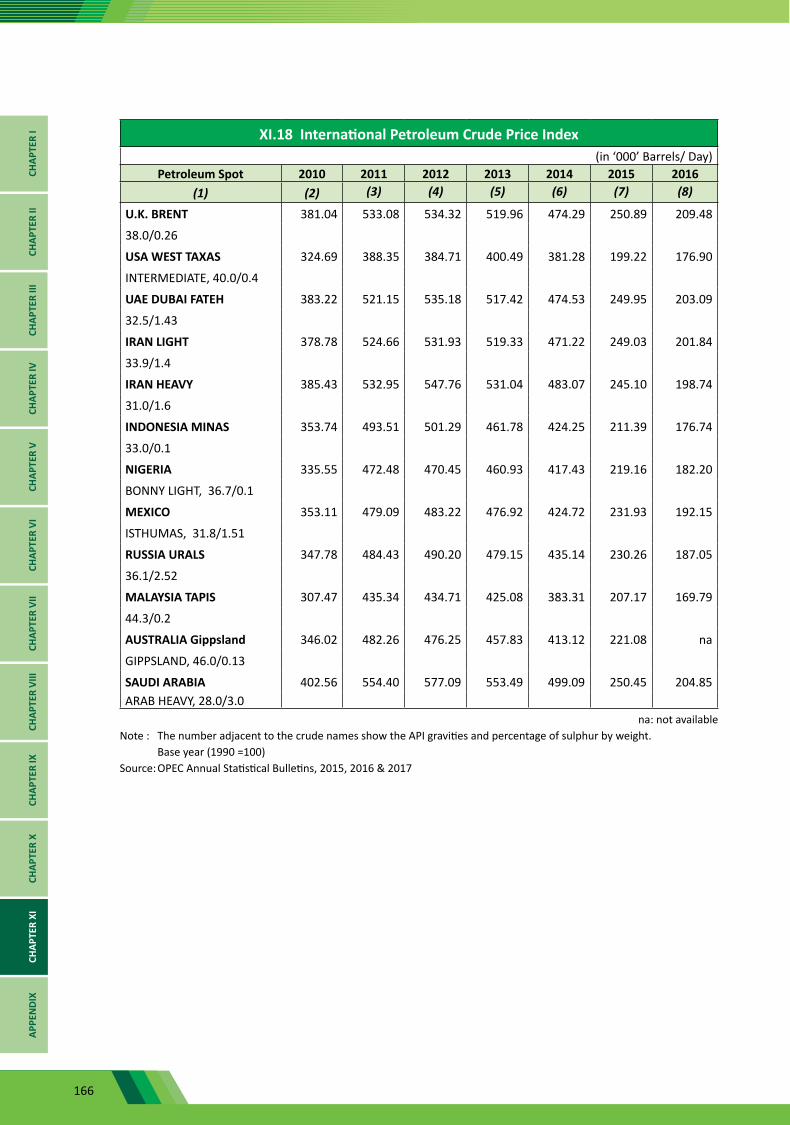
166
XI.18 International Petroleum Crude Price Index (in ‘000’ Barrels/ Day)
Petroleum Spot 2010 2011 2012 2013 2014 2015 2016(1) (2) (3) (4) (5) (6) (7) (8)
U.K. BRENT 381.04 533.08 534.32 519.96 474.29 250.89 209.48
38.0/0.26
USA WEST TAXAS 324.69 388.35 384.71 400.49 381.28 199.22 176.90
INTERMEDIATE, 40.0/0.4
UAE DUBAI FATEH 383.22 521.15 535.18 517.42 474.53 249.95 203.09
32.5/1.43
IRAN LIGHT 378.78 524.66 531.93 519.33 471.22 249.03 201.84
33.9/1.4
IRAN HEAVY 385.43 532.95 547.76 531.04 483.07 245.10 198.74
31.0/1.6
INDONESIA MINAS 353.74 493.51 501.29 461.78 424.25 211.39 176.74
33.0/0.1
NIGERIA 335.55 472.48 470.45 460.93 417.43 219.16 182.20
BONNY LIGHT, 36.7/0.1
MEXICO 353.11 479.09 483.22 476.92 424.72 231.93 192.15
ISTHUMAS, 31.8/1.51
RUSSIA URALS 347.78 484.43 490.20 479.15 435.14 230.26 187.05
36.1/2.52
MALAYSIA TAPIS 307.47 435.34 434.71 425.08 383.31 207.17 169.79
44.3/0.2
AUSTRALIA Gippsland 346.02 482.26 476.25 457.83 413.12 221.08 na
GIPPSLAND, 46.0/0.13
SAUDI ARABIA 402.56 554.40 577.09 553.49 499.09 250.45 204.85ARAB HEAVY, 28.0/3.0
na: not availableNote : The number adjacent to the crude names show the API gravities and percentage of sulphur by weight. Base year (1990 =100) Source: OPEC Annual Statistical Bulletins, 2015, 2016 & 2017
CHAP
TER
ICH
APTE
R II
CHAP
TER
IIICH
APTE
R IV
CHAP
TER
VCH
APTE
R VI
CHAP
TER
VII
CHAP
TER
VIII
CHAP
TER
IXCH
APTE
R X
CHAP
TER
XIAP
PEN
DIX
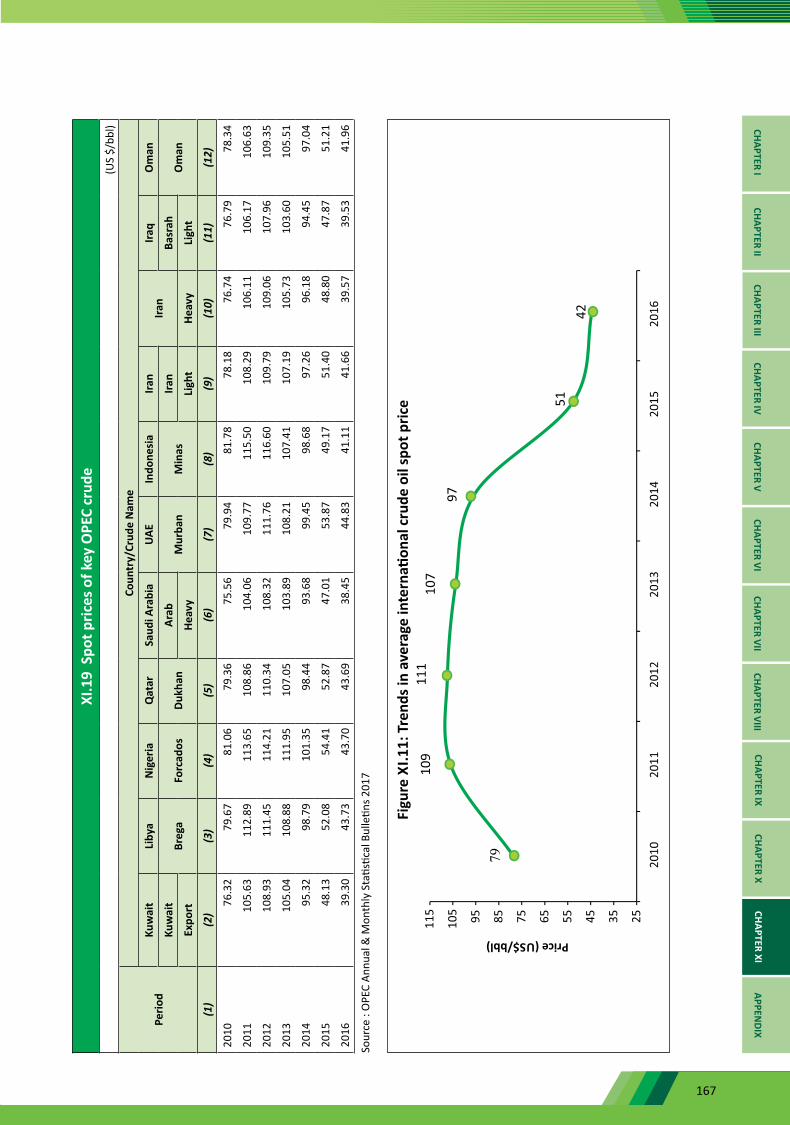
167
XI.1
9 S
pot p
rices
of k
ey O
PEC
crud
e (U
S $/
bbl)
Perio
d
Coun
try/
Crud
e N
ame
Kuw
ait
Liby
aN
iger
iaQ
atar
Saud
i Ara
bia
UAE
Indo
nesi
aIra
nIra
nIra
qO
man
Kuw
ait
Breg
aFo
rcad
osDu
khan
Arab
Mur
ban
Min
asIra
nBa
srah
Om
anEx
port
Heav
yLi
ght
Heav
yLi
ght
(1)
(2)
(3)
(4)
(5)
(6)
(7)
(8)
(9)
(10)
(11)
(12)
2010
76.3
279
.67
81.0
679
.36
75.5
679
.94
81.7
878
.18
76.7
476
.79
78.3
4
2011
105.
6311
2.89
113.
6510
8.86
104.
0610
9.77
115.
5010
8.29
106.
1110
6.17
106.
63
2012
108.
9311
1.45
114.
2111
0.34
108.
3211
1.76
116.
6010
9.79
109.
0610
7.96
109.
35
2013
105.
0410
8.88
111.
9510
7.05
103.
8910
8.21
107.
4110
7.19
105.
7310
3.60
105.
51
2014
95.3
298
.79
101.
3598
.44
93.6
899
.45
98.6
897
.26
96.1
894
.45
97.0
4
2015
48.1
352
.08
54.4
152
.87
47.0
153
.87
49.1
751
.40
48.8
047
.87
51.2
1
2016
39.3
043
.73
43.7
043
.69
38.4
544
.83
41.1
141
.66
39.5
739
.53
41.9
6
Sour
ce :
OPE
C An
nual
& M
onth
ly S
tatis
tical
Bul
letin
s 201
7
CHAPTER ICHAPTER II
CHAPTER IIICHAPTER IV
CHAPTER VCHAPTER VI
CHAPTER VIICHAPTER VIII
CHAPTER IXCHAPTER X
CHAPTER XIAPPEN
DIX
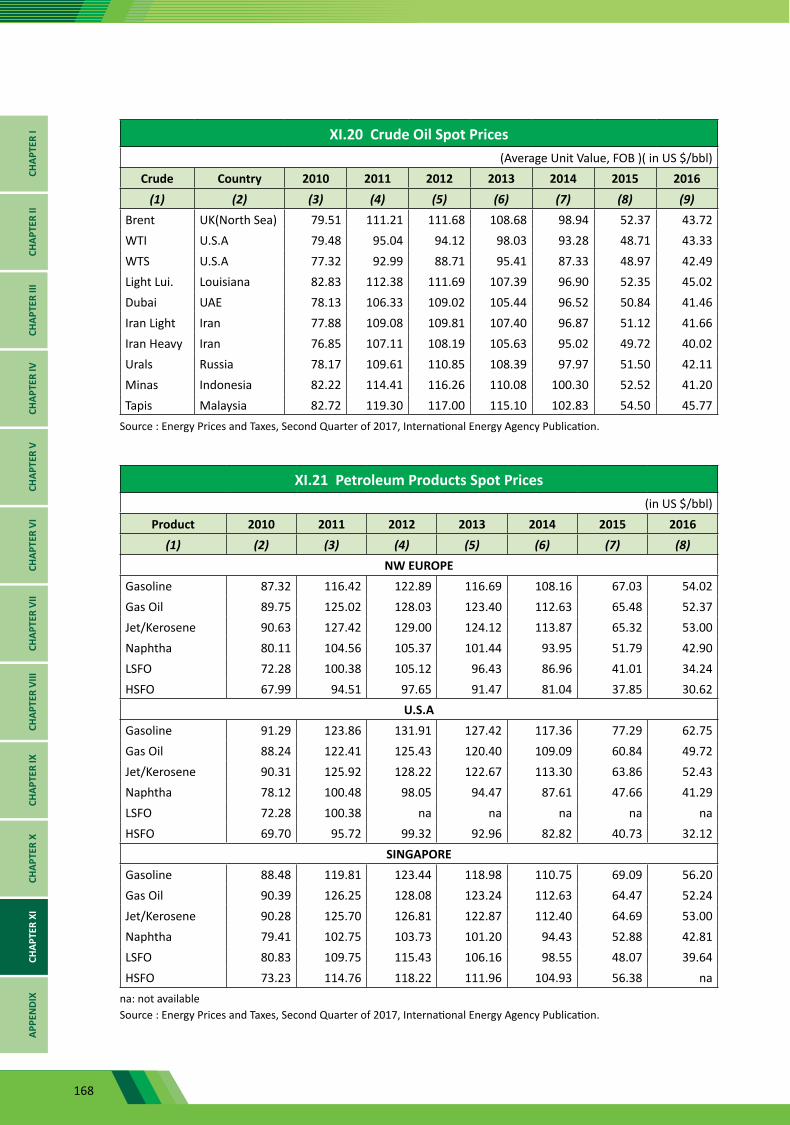
168
XI.20 Crude Oil Spot Prices(Average Unit Value, FOB )( in US $/bbl)
Crude Country 2010 2011 2012 2013 2014 2015 2016(1) (2) (3) (4) (5) (6) (7) (8) (9)
Brent UK(North Sea) 79.51 111.21 111.68 108.68 98.94 52.37 43.72WTI U.S.A 79.48 95.04 94.12 98.03 93.28 48.71 43.33WTS U.S.A 77.32 92.99 88.71 95.41 87.33 48.97 42.49Light Lui. Louisiana 82.83 112.38 111.69 107.39 96.90 52.35 45.02Dubai UAE 78.13 106.33 109.02 105.44 96.52 50.84 41.46Iran Light Iran 77.88 109.08 109.81 107.40 96.87 51.12 41.66Iran Heavy Iran 76.85 107.11 108.19 105.63 95.02 49.72 40.02Urals Russia 78.17 109.61 110.85 108.39 97.97 51.50 42.11Minas Indonesia 82.22 114.41 116.26 110.08 100.30 52.52 41.20Tapis Malaysia 82.72 119.30 117.00 115.10 102.83 54.50 45.77
Source : Energy Prices and Taxes, Second Quarter of 2017, International Energy Agency Publication.
XI.21 Petroleum Products Spot Prices (in US $/bbl)
Product 2010 2011 2012 2013 2014 2015 2016(1) (2) (3) (4) (5) (6) (7) (8)
NW EUROPEGasoline 87.32 116.42 122.89 116.69 108.16 67.03 54.02Gas Oil 89.75 125.02 128.03 123.40 112.63 65.48 52.37Jet/Kerosene 90.63 127.42 129.00 124.12 113.87 65.32 53.00Naphtha 80.11 104.56 105.37 101.44 93.95 51.79 42.90LSFO 72.28 100.38 105.12 96.43 86.96 41.01 34.24HSFO 67.99 94.51 97.65 91.47 81.04 37.85 30.62
U.S.AGasoline 91.29 123.86 131.91 127.42 117.36 77.29 62.75Gas Oil 88.24 122.41 125.43 120.40 109.09 60.84 49.72Jet/Kerosene 90.31 125.92 128.22 122.67 113.30 63.86 52.43Naphtha 78.12 100.48 98.05 94.47 87.61 47.66 41.29LSFO 72.28 100.38 na na na na naHSFO 69.70 95.72 99.32 92.96 82.82 40.73 32.12
SINGAPOREGasoline 88.48 119.81 123.44 118.98 110.75 69.09 56.20Gas Oil 90.39 126.25 128.08 123.24 112.63 64.47 52.24Jet/Kerosene 90.28 125.70 126.81 122.87 112.40 64.69 53.00Naphtha 79.41 102.75 103.73 101.20 94.43 52.88 42.81LSFO 80.83 109.75 115.43 106.16 98.55 48.07 39.64HSFO 73.23 114.76 118.22 111.96 104.93 56.38 na
na: not available Source : Energy Prices and Taxes, Second Quarter of 2017, International Energy Agency Publication.
CHAP
TER
ICH
APTE
R II
CHAP
TER
IIICH
APTE
R IV
CHAP
TER
VCH
APTE
R VI
CHAP
TER
VII
CHAP
TER
VIII
CHAP
TER
IXCH
APTE
R X
CHAP
TER
XIAP
PEN
DIX
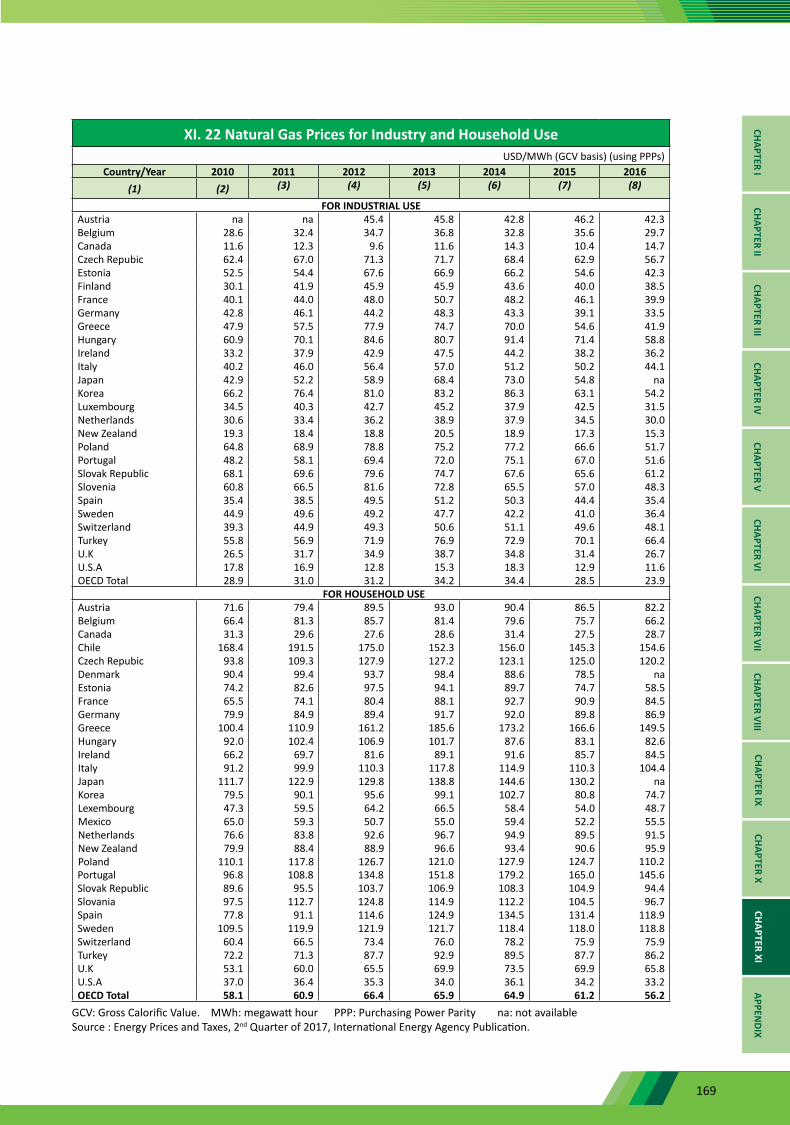
169
XI. 22 Natural Gas Prices for Industry and Household UseUSD/MWh (GCV basis) (using PPPs)
Country/Year 2010 2011 2012 2013 2014 2015 2016(1) (2) (3) (4) (5) (6) (7) (8)
FOR INDUSTRIAL USE Austria na na 45.4 45.8 42.8 46.2 42.3Belgium 28.6 32.4 34.7 36.8 32.8 35.6 29.7Canada 11.6 12.3 9.6 11.6 14.3 10.4 14.7Czech Repubic 62.4 67.0 71.3 71.7 68.4 62.9 56.7Estonia 52.5 54.4 67.6 66.9 66.2 54.6 42.3Finland 30.1 41.9 45.9 45.9 43.6 40.0 38.5France 40.1 44.0 48.0 50.7 48.2 46.1 39.9Germany 42.8 46.1 44.2 48.3 43.3 39.1 33.5Greece 47.9 57.5 77.9 74.7 70.0 54.6 41.9Hungary 60.9 70.1 84.6 80.7 91.4 71.4 58.8Ireland 33.2 37.9 42.9 47.5 44.2 38.2 36.2Italy 40.2 46.0 56.4 57.0 51.2 50.2 44.1Japan 42.9 52.2 58.9 68.4 73.0 54.8 naKorea 66.2 76.4 81.0 83.2 86.3 63.1 54.2Luxembourg 34.5 40.3 42.7 45.2 37.9 42.5 31.5Netherlands 30.6 33.4 36.2 38.9 37.9 34.5 30.0New Zealand 19.3 18.4 18.8 20.5 18.9 17.3 15.3Poland 64.8 68.9 78.8 75.2 77.2 66.6 51.7Portugal 48.2 58.1 69.4 72.0 75.1 67.0 51.6Slovak Republic 68.1 69.6 79.6 74.7 67.6 65.6 61.2Slovenia 60.8 66.5 81.6 72.8 65.5 57.0 48.3Spain 35.4 38.5 49.5 51.2 50.3 44.4 35.4Sweden 44.9 49.6 49.2 47.7 42.2 41.0 36.4Switzerland 39.3 44.9 49.3 50.6 51.1 49.6 48.1Turkey 55.8 56.9 71.9 76.9 72.9 70.1 66.4U.K 26.5 31.7 34.9 38.7 34.8 31.4 26.7U.S.A 17.8 16.9 12.8 15.3 18.3 12.9 11.6OECD Total 28.9 31.0 31.2 34.2 34.4 28.5 23.9
FOR HOUSEHOLD USE Austria 71.6 79.4 89.5 93.0 90.4 86.5 82.2Belgium 66.4 81.3 85.7 81.4 79.6 75.7 66.2Canada 31.3 29.6 27.6 28.6 31.4 27.5 28.7Chile 168.4 191.5 175.0 152.3 156.0 145.3 154.6Czech Repubic 93.8 109.3 127.9 127.2 123.1 125.0 120.2Denmark 90.4 99.4 93.7 98.4 88.6 78.5 naEstonia 74.2 82.6 97.5 94.1 89.7 74.7 58.5France 65.5 74.1 80.4 88.1 92.7 90.9 84.5Germany 79.9 84.9 89.4 91.7 92.0 89.8 86.9Greece 100.4 110.9 161.2 185.6 173.2 166.6 149.5Hungary 92.0 102.4 106.9 101.7 87.6 83.1 82.6Ireland 66.2 69.7 81.6 89.1 91.6 85.7 84.5Italy 91.2 99.9 110.3 117.8 114.9 110.3 104.4Japan 111.7 122.9 129.8 138.8 144.6 130.2 naKorea 79.5 90.1 95.6 99.1 102.7 80.8 74.7Lexembourg 47.3 59.5 64.2 66.5 58.4 54.0 48.7Mexico 65.0 59.3 50.7 55.0 59.4 52.2 55.5Netherlands 76.6 83.8 92.6 96.7 94.9 89.5 91.5New Zealand 79.9 88.4 88.9 96.6 93.4 90.6 95.9Poland 110.1 117.8 126.7 121.0 127.9 124.7 110.2Portugal 96.8 108.8 134.8 151.8 179.2 165.0 145.6Slovak Republic 89.6 95.5 103.7 106.9 108.3 104.9 94.4Slovania 97.5 112.7 124.8 114.9 112.2 104.5 96.7Spain 77.8 91.1 114.6 124.9 134.5 131.4 118.9Sweden 109.5 119.9 121.9 121.7 118.4 118.0 118.8Switzerland 60.4 66.5 73.4 76.0 78.2 75.9 75.9Turkey 72.2 71.3 87.7 92.9 89.5 87.7 86.2U.K 53.1 60.0 65.5 69.9 73.5 69.9 65.8U.S.A 37.0 36.4 35.3 34.0 36.1 34.2 33.2OECD Total 58.1 60.9 66.4 65.9 64.9 61.2 56.2
GCV: Gross Calorific Value. MWh: megawatt hour PPP: Purchasing Power Parity na: not available Source : Energy Prices and Taxes, 2nd Quarter of 2017, International Energy Agency Publication.
CHAPTER ICHAPTER II
CHAPTER IIICHAPTER IV
CHAPTER VCHAPTER VI
CHAPTER VIICHAPTER VIII
CHAPTER IXCHAPTER X
CHAPTER XIAPPEN
DIX
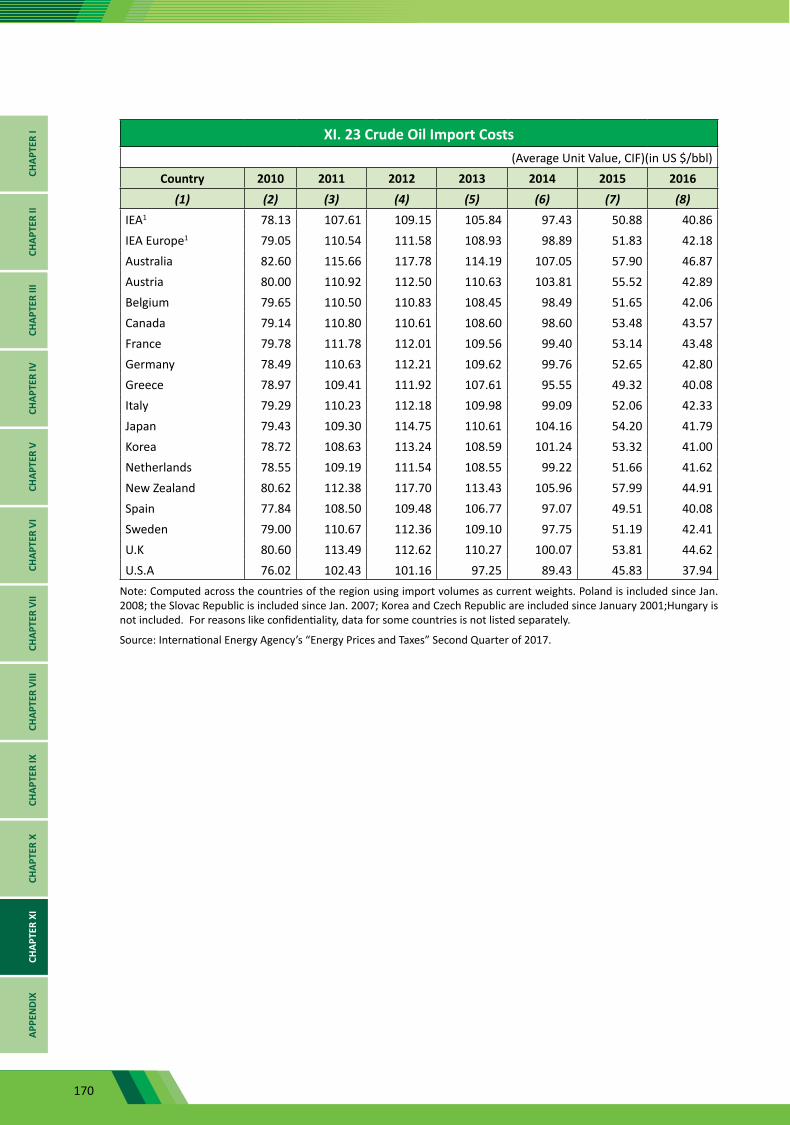
170
XI. 23 Crude Oil Import Costs(Average Unit Value, CIF)(in US $/bbl)
Country 2010 2011 2012 2013 2014 2015 2016(1) (2) (3) (4) (5) (6) (7) (8)
IEA1 78.13 107.61 109.15 105.84 97.43 50.88 40.86IEA Europe1 79.05 110.54 111.58 108.93 98.89 51.83 42.18Australia 82.60 115.66 117.78 114.19 107.05 57.90 46.87Austria 80.00 110.92 112.50 110.63 103.81 55.52 42.89Belgium 79.65 110.50 110.83 108.45 98.49 51.65 42.06Canada 79.14 110.80 110.61 108.60 98.60 53.48 43.57France 79.78 111.78 112.01 109.56 99.40 53.14 43.48Germany 78.49 110.63 112.21 109.62 99.76 52.65 42.80Greece 78.97 109.41 111.92 107.61 95.55 49.32 40.08Italy 79.29 110.23 112.18 109.98 99.09 52.06 42.33Japan 79.43 109.30 114.75 110.61 104.16 54.20 41.79Korea 78.72 108.63 113.24 108.59 101.24 53.32 41.00Netherlands 78.55 109.19 111.54 108.55 99.22 51.66 41.62New Zealand 80.62 112.38 117.70 113.43 105.96 57.99 44.91Spain 77.84 108.50 109.48 106.77 97.07 49.51 40.08Sweden 79.00 110.67 112.36 109.10 97.75 51.19 42.41U.K 80.60 113.49 112.62 110.27 100.07 53.81 44.62U.S.A 76.02 102.43 101.16 97.25 89.43 45.83 37.94
Note: Computed across the countries of the region using import volumes as current weights. Poland is included since Jan. 2008; the Slovac Republic is included since Jan. 2007; Korea and Czech Republic are included since January 2001;Hungary is not included. For reasons like confidentiality, data for some countries is not listed separately.
Source: International Energy Agency’s “Energy Prices and Taxes” Second Quarter of 2017.
CHAP
TER
ICH
APTE
R II
CHAP
TER
IIICH
APTE
R IV
CHAP
TER
VCH
APTE
R VI
CHAP
TER
VII
CHAP
TER
VIII
CHAP
TER
IXCH
APTE
R X
CHAP
TER
XIAP
PEN
DIX

171
XI.24 Spot Prices of Key OPEC Crude Oils(in US $/bbl )
Year/Month/Country Iran Kuwait Nigeria Bonny Saudi Arabia UAELight 33.9 Export 31.4 Light 36.7 Light 34.2 Heavy 28.0 Dubai 32.4
(1) (2) (3) (4) (5) (6) (7)2010January 75.62 75.69 77.39 76.46 75.60 76.69March 77.70 76.29 80.40 77.24 75.87 77.31June 73.13 72.30 76.00 73.84 71.19 73.99September 76.82 72.92 79.65 74.55 71.88 75.13December 90.60 87.25 93.08 89.59 86.11 89.172011January 94.90 91.45 98.10 93.59 90.26 92.33March 111.44 107.66 116.75 110.37 105.80 108.71June 110.45 106.65 117.27 109.37 104.34 107.77September 108.47 105.16 115.63 107.72 103.18 106.31December 107.06 107.06 110.71 107.96 106.61 106.432012January 109.76 112.00 113.08 112.82 111.73 109.86March 122.83 122.32 127.98 123.43 121.84 122.47June 93.35 93.32 97.19 94.51 92.67 94.44September 112.24 110.02 114.06 111.32 109.76 111.22December 107.61 106.19 111.19 108.35 104.79 106.342013January 105.33 103.79 115.41 110.64 102.21 107.94March 105.63 103.08 110.57 107.61 101.63 105.55June 110.27 106.56 106.12 101.30 104.50 100.32September 96.41 95.30 114.30 109.48 99.73 108.28December 61.32 58.25 113.11 108.07 56.65 107.802014January 105.33 103.79 110.26 105.74 102.21 104.01March 105.63 103.05 109.50 104.80 101.63 104.32June 110.27 106.56 114.36 108.61 104.50 108.03September 96.41 95.30 98.07 97.23 93.73 96.47December 61.32 58.25 63.81 60.13 56.65 60.252015January 47.42 42.31 48.51 44.47 40.25 45.57February 55.97 52.25 58.46 53.78 51.07 55.85March 54.79 50.52 56.75 52.20 49.34 54.66April 59.34 55.96 60.65 57.73 54.26 58.55May 63.97 60.92 65.31 62.62 59.42 63.54June 62.28 59.29 62.19 60.94 58.01 61.76July 55.76 53.85 56.77 54.94 53.55 56.15August 45.74 45.28 47.07 46.52 44.82 47.87September 46.16 43.96 48.01 45.56 43.37 45.38October 47.05 43.61 49.16 45.37 43.01 45.84November 43.17 38.39 44.81 40.64 37.00 41.79December 35.98 31.49 38.16 33.70 30.15 34.592016January 28.34 23.92 30.40 26.35 22.50 26.81February 30.16 26.77 32.24 28.77 26.15 29.44March 36.08 32.99 38.53 34.74 32.76 35.15April 39.09 36.33 41.51 38.22 35.92 39.00May 44.65 41.60 46.85 43.48 40.69 44.29June 46.38 44.50 48.48 46.28 43.68 46.25July 43.54 41.37 45.30 43.14 40.40 42.64August 43.66 41.88 46.35 43.47 41.00 43.58September 44.23 41.22 47.77 42.70 40.34 43.67October 47.99 47.04 50.83 48.26 46.26 48.94November 43.45 42.14 45.20 43.32 40.96 43.98December 51.85 50.93 53.91 51.92 49.70 52.08
Source: OPEC Bulletin 2017
CHAPTER ICHAPTER II
CHAPTER IIICHAPTER IV
CHAPTER VCHAPTER VI
CHAPTER VIICHAPTER VIII
CHAPTER IXCHAPTER X
CHAPTER XIAPPEN
DIX
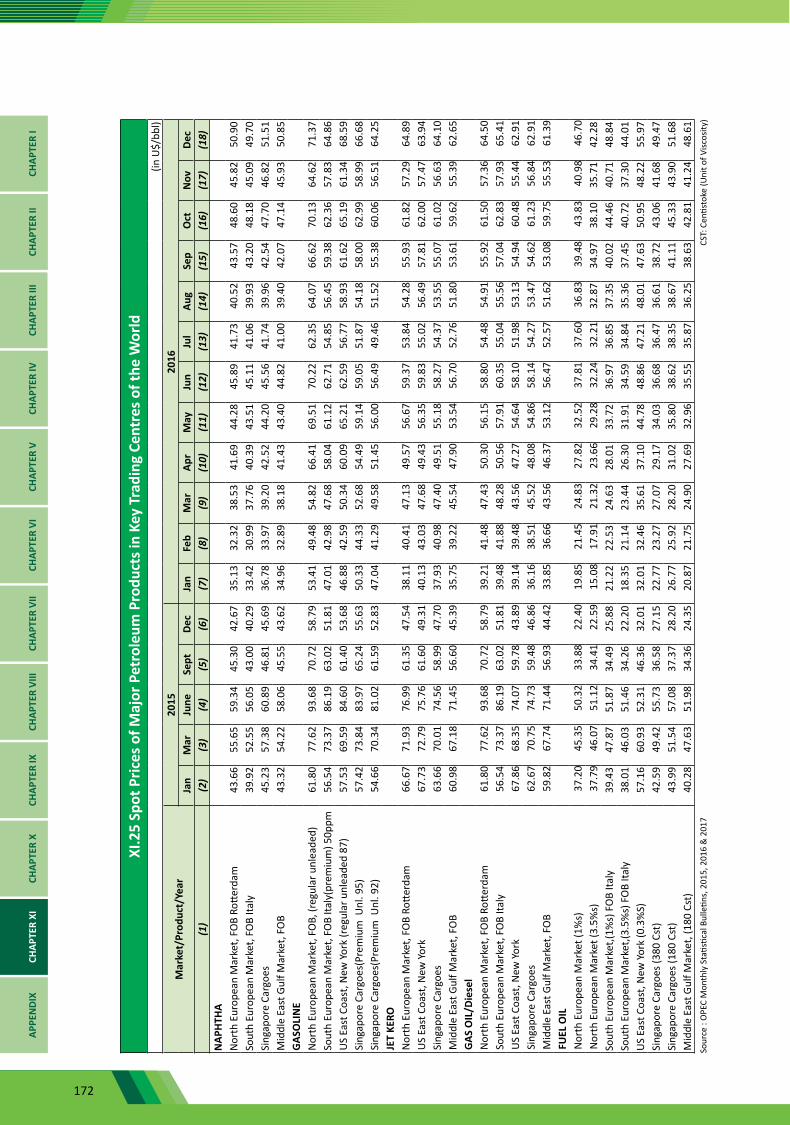
172
XI.2
5 Sp
ot P
rices
of M
ajor
Pet
role
um P
rodu
cts i
n Ke
y Tr
adin
g Ce
ntre
s of t
he W
orld
(in U
$/bb
l)
Mar
ket/
Prod
uct/
Year
2015
2016
Jan
Mar
June
Sept
Dec
Jan
Feb
Mar
Apr
May
Jun
Jul
Aug
Sep
Oct
Nov
Dec
(1)
(2)
(3)
(4)
(5)
(6)
(7)
(8)
(9)
(10)
(11)
(12)
(13)
(14)
(15)
(16)
(17)
(18)
NAP
HTHA
Nor
th E
urop
ean
Mar
ket,
FOB
Rotte
rdam
43.6
655
.65
59.3
445
.30
42.6
735
.13
32.3
238
.53
41.6
944
.28
45.8
941
.73
40.5
243
.57
48.6
045
.82
50.9
0So
uth
Euro
pean
Mar
ket,
FOB
Italy
39.9
252
.55
56.0
543
.00
40.2
933
.42
30.9
937
.76
40.3
943
.51
45.1
141
.06
39.9
343
.20
48.1
845
.09
49.7
0Si
ngap
ore
Carg
oes
45.2
357
.38
60.8
946
.81
45.6
936
.78
33.9
739
.20
42.5
244
.20
45.5
641
.74
39.9
642
.54
47.7
046
.82
51.5
1M
iddl
e Ea
st G
ulf M
arke
t, FO
B43
.32
54.2
258
.06
45.5
543
.62
34.9
632
.89
38.1
841
.43
43.4
044
.82
41.0
039
.40
42.0
747
.14
45.9
350
.85
GAS
OLI
NE
Nor
th E
urop
ean
Mar
ket,
FOB,
(reg
ular
unl
eade
d)61
.80
77.6
293
.68
70.7
258
.79
53.4
149
.48
54.8
266
.41
69.5
170
.22
62.3
564
.07
66.6
270
.13
64.6
271
.37
Sout
h Eu
rope
an M
arke
t, FO
B Ita
ly(p
rem
ium
) 50p
pm56
.54
73.3
786
.19
63.0
251
.81
47.0
142
.98
47.6
858
.04
61.1
262
.71
54.8
556
.45
59.3
862
.36
57.8
364
.86
US
East
Coa
st, N
ew Y
ork
(reg
ular
unl
eade
d 87
)57
.53
69.5
984
.60
61.4
053
.68
46.8
842
.59
50.3
460
.09
65.2
162
.59
56.7
758
.93
61.6
265
.19
61.3
468
.59
Sing
apor
e Ca
rgoe
s(Pr
emiu
m U
nl. 9
5)57
.42
73.8
483
.97
65.2
455
.63
50.3
344
.33
52.6
854
.49
59.1
459
.05
51.8
754
.18
58.0
062
.99
58.9
966
.68
Sing
apor
e Ca
rgoe
s(Pr
emiu
m U
nl. 9
2)54
.66
70.3
481
.02
61.5
952
.83
47.0
441
.29
49.5
851
.45
56.0
056
.49
49.4
651
.52
55.3
860
.06
56.5
164
.25
JET
KERO
Nor
th E
urop
ean
Mar
ket,
FOB
Rotte
rdam
66.6
771
.93
76.9
961
.35
47.5
438
.11
40.4
147
.13
49.5
756
.67
59.3
753
.84
54.2
855
.93
61.8
257
.29
64.8
9U
S Ea
st C
oast
, New
Yor
k 67
.73
72.7
975
.76
61.6
049
.31
40.1
343
.03
47.6
849
.43
56.3
559
.83
55.0
256
.49
57.8
162
.00
57.4
763
.94
Sing
apor
e Ca
rgoe
s63
.66
70.0
174
.56
58.9
947
.70
37.9
340
.98
47.4
049
.51
55.1
858
.27
54.3
753
.55
55.0
761
.02
56.6
364
.10
Mid
dle
East
Gul
f Mar
ket,
FOB
60.9
867
.18
71.4
556
.60
45.3
935
.75
39.2
245
.54
47.9
053
.54
56.7
052
.76
51.8
053
.61
59.6
255
.39
62.6
5G
AS O
IL/D
iese
lN
orth
Eur
opea
n M
arke
t, FO
B Ro
tterd
am61
.80
77.6
293
.68
70.7
258
.79
39.2
141
.48
47.4
350
.30
56.1
558
.80
54.4
854
.91
55.9
261
.50
57.3
664
.50
Sout
h Eu
rope
an M
arke
t, FO
B Ita
ly56
.54
73.3
786
.19
63.0
251
.81
39.4
841
.88
48.2
850
.56
57.9
160
.35
55.0
455
.56
57.0
462
.83
57.9
365
.41
US
East
Coa
st, N
ew Y
ork
67.8
668
.35
74.0
759
.78
43.8
939
.14
39.4
843
.56
47.2
754
.64
58.1
051
.98
53.1
354
.94
60.4
855
.44
62.9
1Si
ngap
ore
Carg
oes
62.6
770
.75
74.7
359
.48
46.8
636
.16
38.5
145
.52
48.0
854
.86
58.1
454
.27
53.4
754
.62
61.2
356
.84
62.9
1M
iddl
e Ea
st G
ulf M
arke
t, FO
B59
.82
67.7
471
.44
56.9
344
.42
33.8
536
.66
43.5
646
.37
53.1
256
.47
52.5
751
.62
53.0
859
.75
55.5
361
.39
FUEL
OIL
Nor
th E
urop
ean
Mar
ket (
1%s)
37.2
045
.35
50.3
233
.88
22.4
019
.85
21.4
524
.83
27.8
232
.52
37.8
137
.60
36.8
339
.48
43.8
340
.98
46.7
0N
orth
Eur
opea
n M
arke
t (3.
5%s)
37.7
946
.07
51.1
234
.41
22.5
915
.08
17.9
121
.32
23.6
629
.28
32.2
432
.21
32.8
734
.97
38.1
035
.71
42.2
8So
uth
Euro
pean
Mar
ket,(
1%s)
FO
B Ita
ly39
.43
47.8
751
.87
34.4
925
.88
21.2
222
.53
24.6
328
.01
33.7
236
.97
36.8
537
.35
40.0
244
.46
40.7
148
.84
Sout
h Eu
rope
an M
arke
t,(3.
5%s)
FO
B Ita
ly38
.01
46.0
351
.46
34.2
622
.20
18.3
521
.14
23.4
426
.30
31.9
134
.59
34.8
435
.36
37.4
540
.72
37.3
044
.01
US
East
Coa
st, N
ew Y
ork
(0.3
%S)
57.1
660
.93
52.3
146
.36
32.0
132
.01
32.4
635
.61
37.1
044
.78
48.8
647
.21
48.0
147
.63
50.9
548
.22
55.9
7Si
ngap
ore
Carg
oes (
380
Cst)
42.5
949
.42
55.7
336
.58
27.1
522
.77
23.2
727
.07
29.1
734
.03
36.6
836
.47
36.6
138
.72
43.0
641
.68
49.4
7Si
ngap
ore
Carg
oes (
180
Cst)
43.9
951
.54
57.0
837
.37
28.2
026
.77
25.9
228
.20
31.0
235
.80
38.6
238
.35
38.6
741
.11
45.3
343
.90
51.6
8M
iddl
e Ea
st G
ulf M
arke
t, (1
80 C
st)
40.2
847
.63
51.9
834
.36
24.3
520
.87
21.7
524
.90
27.6
932
.96
35.5
535
.87
36.2
538
.63
42.8
141
.24
48.6
1So
urce
: O
PEC
Mon
thly
Sta
tistic
al B
ulle
tins,
201
5, 2
016
& 2
017
CST:
Cen
tisto
ke (U
nit o
f Visc
osity
)
CHAP
TER
ICH
APTE
R II
CHAP
TER
IIICH
APTE
R IV
CHAP
TER
VCH
APTE
R VI
CHAP
TER
VII
CHAP
TER
VIII
CHAP
TER
IXCH
APTE
R X
CHAP
TER
XIAP
PEN
DIX
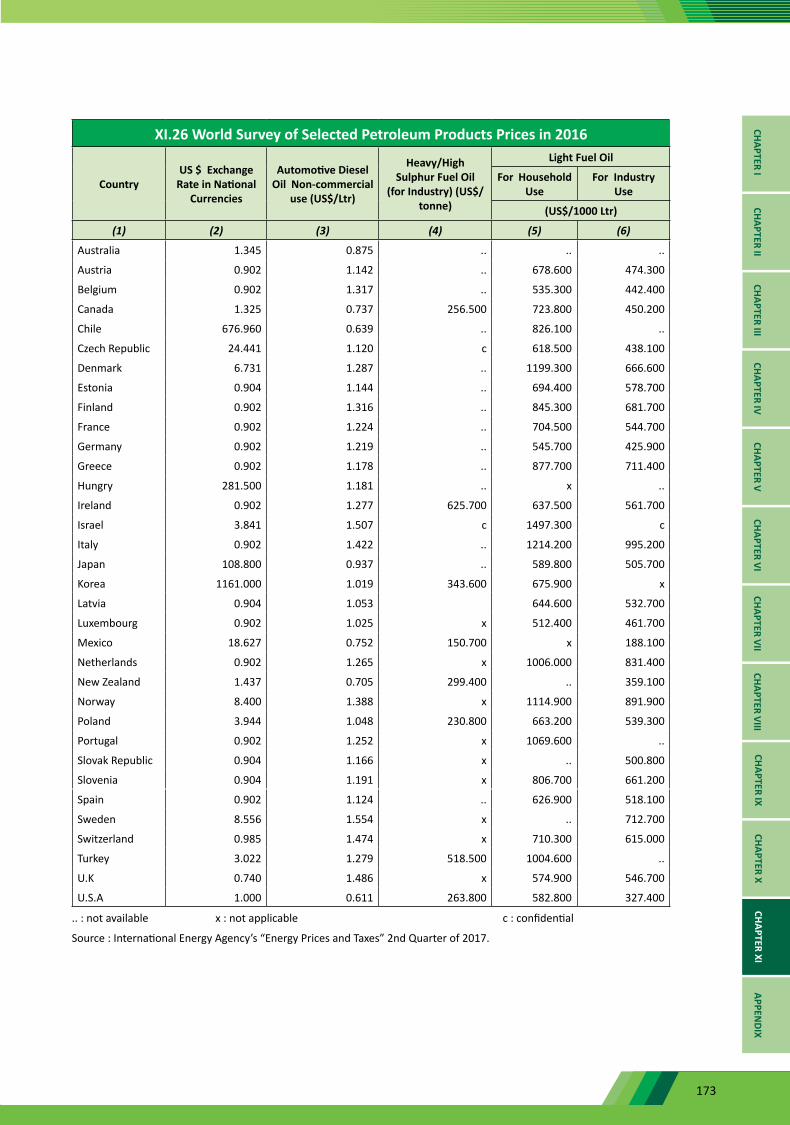
173
XI.26 World Survey of Selected Petroleum Products Prices in 2016
CountryUS $ Exchange
Rate in National Currencies
Automotive Diesel Oil Non-commercial
use (US$/Ltr)
Heavy/High Sulphur Fuel Oil
(for Industry) (US$/tonne)
Light Fuel Oil
For Household Use
For Industry Use
(US$/1000 Ltr)
(1) (2) (3) (4) (5) (6)
Australia 1.345 0.875 .. .. ..
Austria 0.902 1.142 .. 678.600 474.300
Belgium 0.902 1.317 .. 535.300 442.400
Canada 1.325 0.737 256.500 723.800 450.200
Chile 676.960 0.639 .. 826.100 ..
Czech Republic 24.441 1.120 c 618.500 438.100
Denmark 6.731 1.287 .. 1199.300 666.600
Estonia 0.904 1.144 .. 694.400 578.700
Finland 0.902 1.316 .. 845.300 681.700
France 0.902 1.224 .. 704.500 544.700
Germany 0.902 1.219 .. 545.700 425.900
Greece 0.902 1.178 .. 877.700 711.400
Hungry 281.500 1.181 .. x ..
Ireland 0.902 1.277 625.700 637.500 561.700
Israel 3.841 1.507 c 1497.300 c
Italy 0.902 1.422 .. 1214.200 995.200
Japan 108.800 0.937 .. 589.800 505.700
Korea 1161.000 1.019 343.600 675.900 x
Latvia 0.904 1.053 644.600 532.700
Luxembourg 0.902 1.025 x 512.400 461.700
Mexico 18.627 0.752 150.700 x 188.100
Netherlands 0.902 1.265 x 1006.000 831.400
New Zealand 1.437 0.705 299.400 .. 359.100
Norway 8.400 1.388 x 1114.900 891.900
Poland 3.944 1.048 230.800 663.200 539.300
Portugal 0.902 1.252 x 1069.600 ..
Slovak Republic 0.904 1.166 x .. 500.800
Slovenia 0.904 1.191 x 806.700 661.200
Spain 0.902 1.124 .. 626.900 518.100
Sweden 8.556 1.554 x .. 712.700
Switzerland 0.985 1.474 x 710.300 615.000
Turkey 3.022 1.279 518.500 1004.600 ..
U.K 0.740 1.486 x 574.900 546.700
U.S.A 1.000 0.611 263.800 582.800 327.400
.. : not available x : not applicable c : confidential
Source : International Energy Agency’s “Energy Prices and Taxes” 2nd Quarter of 2017.
CHAPTER ICHAPTER II
CHAPTER IIICHAPTER IV
CHAPTER VCHAPTER VI
CHAPTER VIICHAPTER VIII
CHAPTER IXCHAPTER X
CHAPTER XIAPPEN
DIX
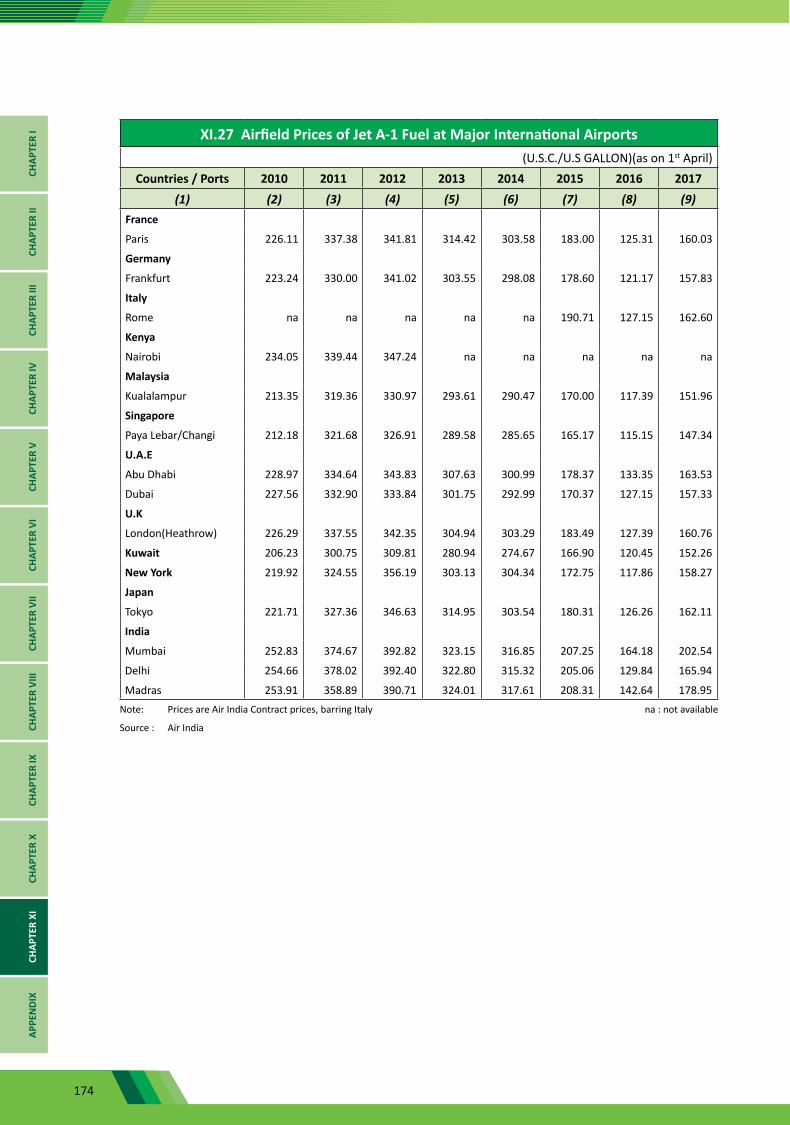
174
XI.27 Airfield Prices of Jet A-1 Fuel at Major International Airports(U.S.C./U.S GALLON)(as on 1st April)
Countries / Ports 2010 2011 2012 2013 2014 2015 2016 2017(1) (2) (3) (4) (5) (6) (7) (8) (9)
France
Paris 226.11 337.38 341.81 314.42 303.58 183.00 125.31 160.03
Germany
Frankfurt 223.24 330.00 341.02 303.55 298.08 178.60 121.17 157.83
Italy
Rome na na na na na 190.71 127.15 162.60
Kenya
Nairobi 234.05 339.44 347.24 na na na na na
Malaysia
Kualalampur 213.35 319.36 330.97 293.61 290.47 170.00 117.39 151.96
Singapore
Paya Lebar/Changi 212.18 321.68 326.91 289.58 285.65 165.17 115.15 147.34
U.A.E
Abu Dhabi 228.97 334.64 343.83 307.63 300.99 178.37 133.35 163.53
Dubai 227.56 332.90 333.84 301.75 292.99 170.37 127.15 157.33
U.K
London(Heathrow) 226.29 337.55 342.35 304.94 303.29 183.49 127.39 160.76
Kuwait 206.23 300.75 309.81 280.94 274.67 166.90 120.45 152.26
New York 219.92 324.55 356.19 303.13 304.34 172.75 117.86 158.27
Japan
Tokyo 221.71 327.36 346.63 314.95 303.54 180.31 126.26 162.11
India
Mumbai 252.83 374.67 392.82 323.15 316.85 207.25 164.18 202.54
Delhi 254.66 378.02 392.40 322.80 315.32 205.06 129.84 165.94
Madras 253.91 358.89 390.71 324.01 317.61 208.31 142.64 178.95Note: Prices are Air India Contract prices, barring Italy na : not available
Source : Air India
CHAP
TER
ICH
APTE
R II
CHAP
TER
IIICH
APTE
R IV
CHAP
TER
VCH
APTE
R VI
CHAP
TER
VII
CHAP
TER
VIII
CHAP
TER
IXCH
APTE
R X
CHAP
TER
XIAP
PEN
DIX
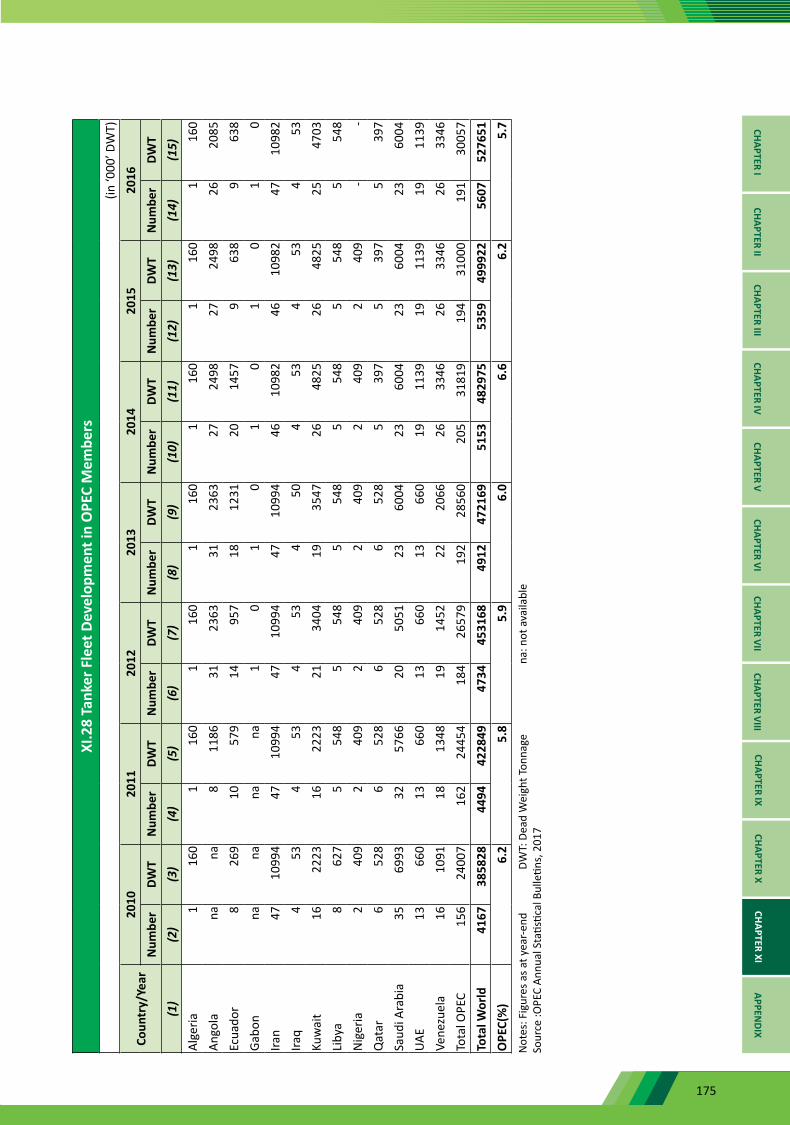
175
XI.2
8 Ta
nker
Fle
et D
evel
opm
ent i
n O
PEC
Mem
bers
(in
‘000
’ DW
T)
Coun
try/
Year
2010
2011
2012
2013
2014
2015
2016
Num
ber
DWT
Num
ber
DWT
Num
ber
DWT
Num
ber
DWT
Num
ber
DWT
Num
ber
DWT
Num
ber
DWT
(1)
(2)
(3)
(4)
(5)
(6)
(7)
(8)
(9)
(10)
(11)
(12)
(13)
(14)
(15)
Alge
ria1
160
116
01
160
116
01
160
116
01
160
Ango
lana
na8
1186
3123
6331
2363
2724
9827
2498
2620
85Ec
uado
r8
269
1057
914
957
1812
3120
1457
963
89
638
Gabo
nna
nana
na1
01
01
01
01
0Ira
n47
1099
447
1099
447
1099
447
1099
446
1098
246
1098
247
1098
2Ira
q4
534
534
534
504
534
534
53Ku
wai
t16
2223
1622
2321
3404
1935
4726
4825
2648
2525
4703
Liby
a8
627
554
85
548
554
85
548
554
85
548
Nig
eria
240
92
409
240
92
409
240
92
409
--
Qat
ar6
528
652
86
528
652
85
397
539
75
397
Saud
i Ara
bia
3569
9332
5766
2050
5123
6004
2360
0423
6004
2360
04UA
E13
660
1366
013
660
1366
019
1139
1911
3919
1139
Vene
zuel
a16
1091
1813
4819
1452
2220
6626
3346
2633
4626
3346
Tota
l OPE
C15
624
007
162
2445
418
426
579
192
2856
020
531
819
194
3100
019
130
057
Tota
l Wor
ld41
6738
5828
4494
4228
4947
3445
3168
4912
4721
6951
5348
2975
5359
4999
2256
0752
7651
OPE
C(%
)6.
25.
85.
96.
06.
66.
25.
7N
otes
: Fig
ures
as a
t yea
r-end
D
WT:
Dea
d W
eigh
t Ton
nage
na:
not
ava
ilabl
e
Sour
ce :O
PEC
Annu
al S
tatis
tical
Bul
letin
s, 2
017
CHAPTER ICHAPTER II
CHAPTER IIICHAPTER IV
CHAPTER VCHAPTER VI
CHAPTER VIICHAPTER VIII
CHAPTER IXCHAPTER X
CHAPTER XIAPPEN
DIX
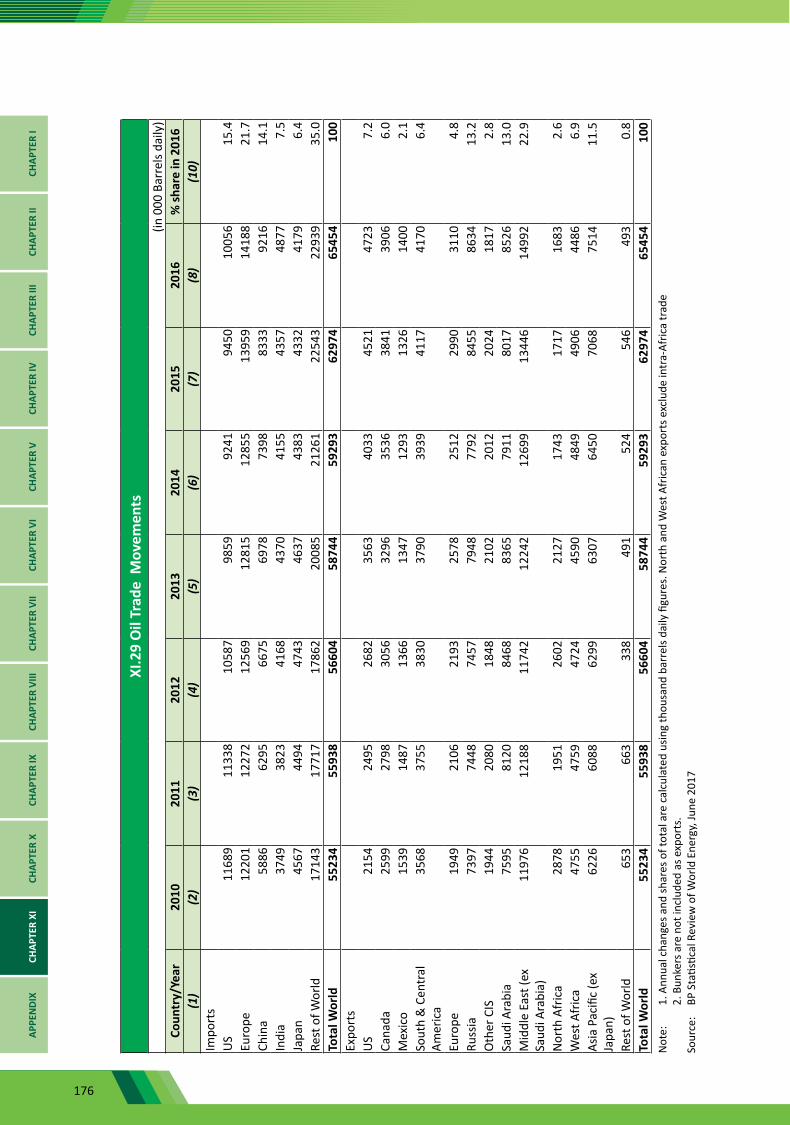
176
XI.2
9 O
il Tr
ade
Mov
emen
ts(in
000
Bar
rels
daily
)Co
untr
y/Ye
ar20
1020
1120
1220
1320
1420
1520
16%
shar
e in
201
6(1
)(2
)(3
)(4
)(5
)(6
)(7
)(8
)(1
0)Im
port
sU
S11
689
1133
810
587
9859
9241
9450
1005
615
.4Eu
rope
12
201
1227
212
569
1281
512
855
1395
914
188
21.7
Chin
a58
8662
9566
7569
7873
9883
3392
1614
.1In
dia
3749
3823
4168
4370
4155
4357
4877
7.5
Japa
n45
6744
9447
4346
3743
8343
3241
796.
4Re
st o
f Wor
ld17
143
1771
717
862
2008
521
261
2254
322
939
35.0
Tota
l Wor
ld55
234
5593
856
604
5874
459
293
6297
465
454
100
Expo
rts
US
2154
2495
2682
3563
4033
4521
4723
7.2
Cana
da25
9927
9830
5632
9635
3638
4139
066.
0M
exic
o15
3914
8713
6613
4712
9313
2614
002.
1So
uth
& C
entr
al
Amer
ica
3568
3755
3830
3790
3939
4117
4170
6.4
Euro
pe19
4921
0621
9325
7825
1229
9031
104.
8Ru
ssia
7397
7448
7457
7948
7792
8455
8634
13.2
Oth
er C
IS19
4420
8018
4821
0220
1220
2418
172.
8Sa
udi A
rabi
a75
9581
2084
6883
6579
1180
1785
2613
.0M
iddl
e Ea
st (e
x Sa
udi A
rabi
a)11
976
1218
811
742
1224
212
699
1344
614
992
22.9
Nor
th A
fric
a28
7819
5126
0221
2717
4317
1716
832.
6W
est A
fric
a47
5547
5947
2445
9048
4949
0644
866.
9As
ia P
acifi
c (e
x Ja
pan)
6226
6088
6299
6307
6450
7068
7514
11.5
Rest
of W
orld
65
366
333
849
152
454
649
30.
8To
tal W
orld
5523
455
938
5660
458
744
5929
362
974
6545
410
0N
ote:
1.
Ann
ual c
hang
es a
nd sh
ares
of t
otal
are
cal
cula
ted
usin
g th
ousa
nd b
arre
ls da
ily fi
gure
s. N
orth
and
Wes
t Afr
ican
exp
orts
exc
lude
intr
a-Af
rica
trad
e
2. B
unke
rs a
re n
ot in
clud
ed a
s exp
orts
.
Sour
ce:
BP S
tatis
tical
Rev
iew
of W
orld
Ene
rgy,
June
201
7
CHAP
TER
ICH
APTE
R II
CHAP
TER
IIICH
APTE
R IV
CHAP
TER
VCH
APTE
R VI
CHAP
TER
VII
CHAP
TER
VIII
CHAP
TER
IXCH
APTE
R X
CHAP
TER
XIAP
PEN
DIX
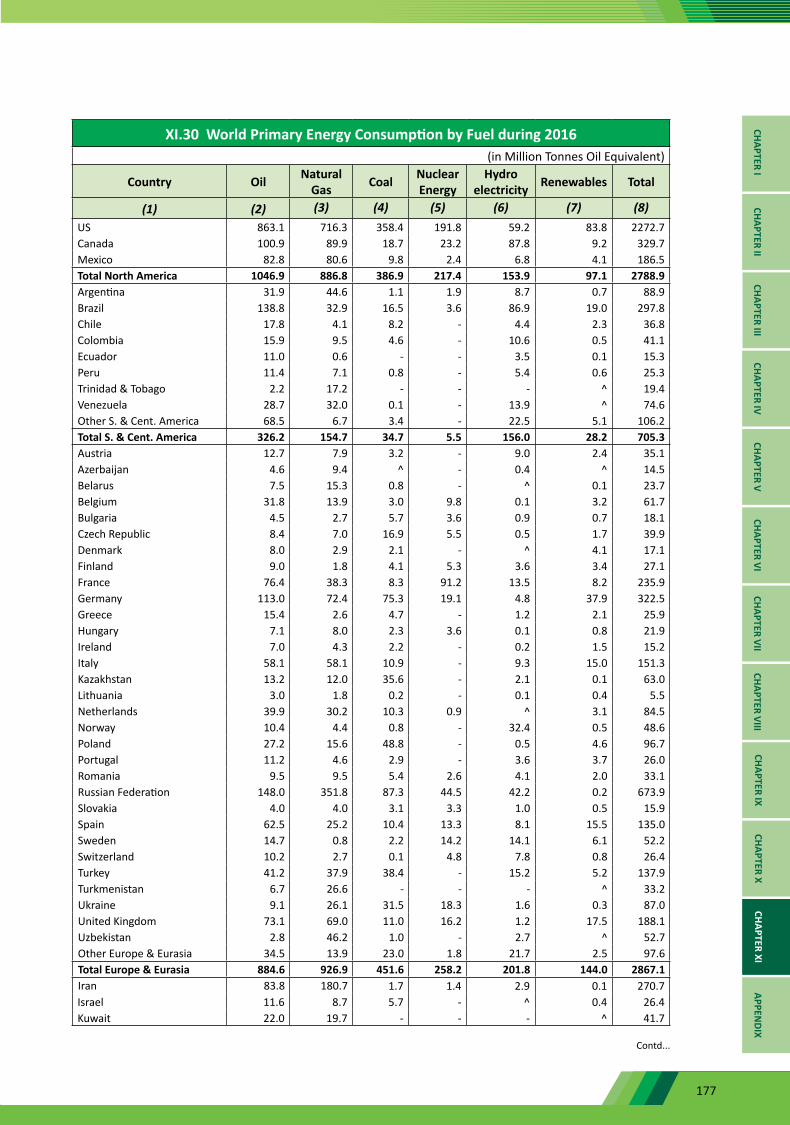
177
XI.30 World Primary Energy Consumption by Fuel during 2016 (in Million Tonnes Oil Equivalent)
Country Oil Natural Gas Coal Nuclear
EnergyHydro
electricity Renewables Total
(1) (2) (3) (4) (5) (6) (7) (8)US 863.1 716.3 358.4 191.8 59.2 83.8 2272.7Canada 100.9 89.9 18.7 23.2 87.8 9.2 329.7Mexico 82.8 80.6 9.8 2.4 6.8 4.1 186.5Total North America 1046.9 886.8 386.9 217.4 153.9 97.1 2788.9Argentina 31.9 44.6 1.1 1.9 8.7 0.7 88.9Brazil 138.8 32.9 16.5 3.6 86.9 19.0 297.8Chile 17.8 4.1 8.2 - 4.4 2.3 36.8Colombia 15.9 9.5 4.6 - 10.6 0.5 41.1Ecuador 11.0 0.6 - - 3.5 0.1 15.3Peru 11.4 7.1 0.8 - 5.4 0.6 25.3Trinidad & Tobago 2.2 17.2 - - - ^ 19.4Venezuela 28.7 32.0 0.1 - 13.9 ^ 74.6Other S. & Cent. America 68.5 6.7 3.4 - 22.5 5.1 106.2Total S. & Cent. America 326.2 154.7 34.7 5.5 156.0 28.2 705.3Austria 12.7 7.9 3.2 - 9.0 2.4 35.1Azerbaijan 4.6 9.4 ^ - 0.4 ^ 14.5Belarus 7.5 15.3 0.8 - ^ 0.1 23.7Belgium 31.8 13.9 3.0 9.8 0.1 3.2 61.7Bulgaria 4.5 2.7 5.7 3.6 0.9 0.7 18.1Czech Republic 8.4 7.0 16.9 5.5 0.5 1.7 39.9Denmark 8.0 2.9 2.1 - ^ 4.1 17.1Finland 9.0 1.8 4.1 5.3 3.6 3.4 27.1France 76.4 38.3 8.3 91.2 13.5 8.2 235.9Germany 113.0 72.4 75.3 19.1 4.8 37.9 322.5Greece 15.4 2.6 4.7 - 1.2 2.1 25.9Hungary 7.1 8.0 2.3 3.6 0.1 0.8 21.9Ireland 7.0 4.3 2.2 - 0.2 1.5 15.2Italy 58.1 58.1 10.9 - 9.3 15.0 151.3Kazakhstan 13.2 12.0 35.6 - 2.1 0.1 63.0Lithuania 3.0 1.8 0.2 - 0.1 0.4 5.5Netherlands 39.9 30.2 10.3 0.9 ^ 3.1 84.5Norway 10.4 4.4 0.8 - 32.4 0.5 48.6Poland 27.2 15.6 48.8 - 0.5 4.6 96.7Portugal 11.2 4.6 2.9 - 3.6 3.7 26.0Romania 9.5 9.5 5.4 2.6 4.1 2.0 33.1Russian Federation 148.0 351.8 87.3 44.5 42.2 0.2 673.9Slovakia 4.0 4.0 3.1 3.3 1.0 0.5 15.9Spain 62.5 25.2 10.4 13.3 8.1 15.5 135.0Sweden 14.7 0.8 2.2 14.2 14.1 6.1 52.2Switzerland 10.2 2.7 0.1 4.8 7.8 0.8 26.4Turkey 41.2 37.9 38.4 - 15.2 5.2 137.9Turkmenistan 6.7 26.6 - - - ^ 33.2Ukraine 9.1 26.1 31.5 18.3 1.6 0.3 87.0United Kingdom 73.1 69.0 11.0 16.2 1.2 17.5 188.1Uzbekistan 2.8 46.2 1.0 - 2.7 ^ 52.7Other Europe & Eurasia 34.5 13.9 23.0 1.8 21.7 2.5 97.6Total Europe & Eurasia 884.6 926.9 451.6 258.2 201.8 144.0 2867.1Iran 83.8 180.7 1.7 1.4 2.9 0.1 270.7Israel 11.6 8.7 5.7 - ^ 0.4 26.4Kuwait 22.0 19.7 - - - ^ 41.7
Contd...
CHAPTER ICHAPTER II
CHAPTER IIICHAPTER IV
CHAPTER VCHAPTER VI
CHAPTER VIICHAPTER VIII
CHAPTER IXCHAPTER X
CHAPTER XIAPPEN
DIX
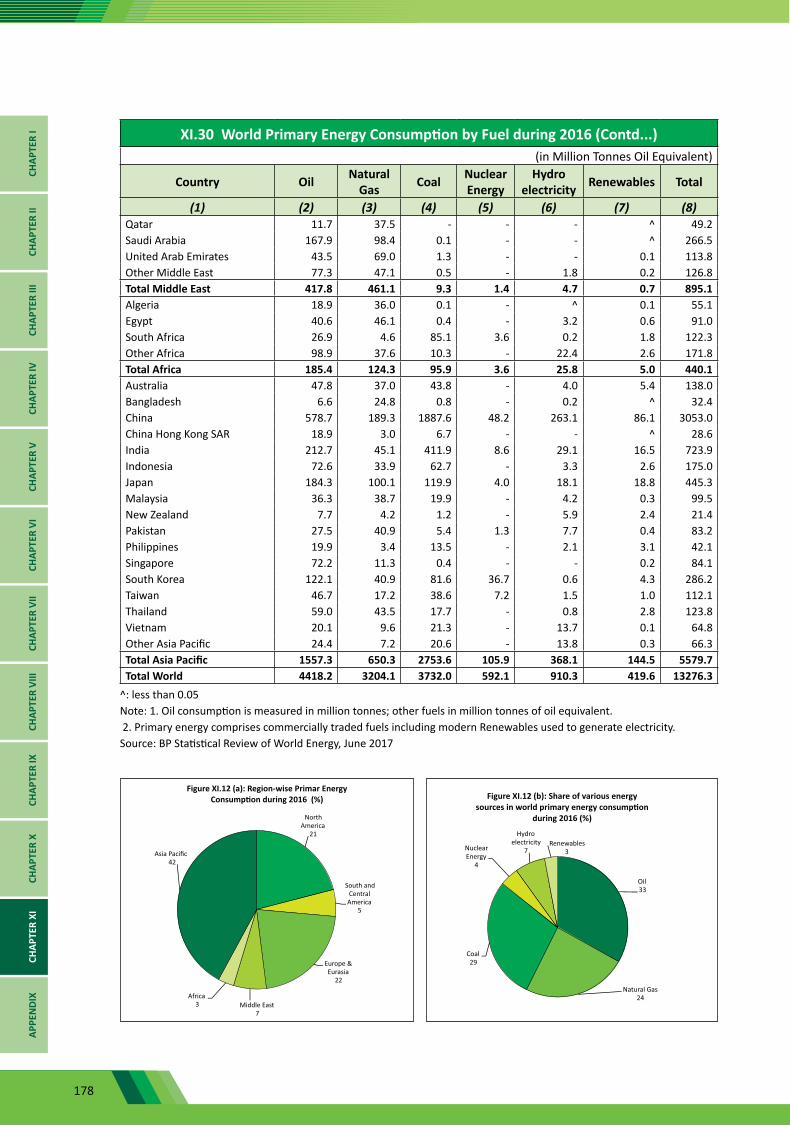
178
XI.30 World Primary Energy Consumption by Fuel during 2016 (Contd...) (in Million Tonnes Oil Equivalent)
Country Oil Natural Gas Coal Nuclear
EnergyHydro
electricity Renewables Total
(1) (2) (3) (4) (5) (6) (7) (8)Qatar 11.7 37.5 - - - ^ 49.2Saudi Arabia 167.9 98.4 0.1 - - ^ 266.5United Arab Emirates 43.5 69.0 1.3 - - 0.1 113.8Other Middle East 77.3 47.1 0.5 - 1.8 0.2 126.8Total Middle East 417.8 461.1 9.3 1.4 4.7 0.7 895.1Algeria 18.9 36.0 0.1 - ^ 0.1 55.1Egypt 40.6 46.1 0.4 - 3.2 0.6 91.0South Africa 26.9 4.6 85.1 3.6 0.2 1.8 122.3Other Africa 98.9 37.6 10.3 - 22.4 2.6 171.8Total Africa 185.4 124.3 95.9 3.6 25.8 5.0 440.1Australia 47.8 37.0 43.8 - 4.0 5.4 138.0Bangladesh 6.6 24.8 0.8 - 0.2 ^ 32.4China 578.7 189.3 1887.6 48.2 263.1 86.1 3053.0China Hong Kong SAR 18.9 3.0 6.7 - - ^ 28.6India 212.7 45.1 411.9 8.6 29.1 16.5 723.9Indonesia 72.6 33.9 62.7 - 3.3 2.6 175.0Japan 184.3 100.1 119.9 4.0 18.1 18.8 445.3Malaysia 36.3 38.7 19.9 - 4.2 0.3 99.5New Zealand 7.7 4.2 1.2 - 5.9 2.4 21.4Pakistan 27.5 40.9 5.4 1.3 7.7 0.4 83.2Philippines 19.9 3.4 13.5 - 2.1 3.1 42.1Singapore 72.2 11.3 0.4 - - 0.2 84.1South Korea 122.1 40.9 81.6 36.7 0.6 4.3 286.2Taiwan 46.7 17.2 38.6 7.2 1.5 1.0 112.1Thailand 59.0 43.5 17.7 - 0.8 2.8 123.8Vietnam 20.1 9.6 21.3 - 13.7 0.1 64.8Other Asia Pacific 24.4 7.2 20.6 - 13.8 0.3 66.3Total Asia Pacific 1557.3 650.3 2753.6 105.9 368.1 144.5 5579.7Total World 4418.2 3204.1 3732.0 592.1 910.3 419.6 13276.3
^: less than 0.05Note: 1. Oil consumption is measured in million tonnes; other fuels in million tonnes of oil equivalent. 2. Primary energy comprises commercially traded fuels including modern Renewables used to generate electricity.Source: BP Statistical Review of World Energy, June 2017
CHAP
TER
ICH
APTE
R II
CHAP
TER
IIICH
APTE
R IV
CHAP
TER
VCH
APTE
R VI
CHAP
TER
VII
CHAP
TER
VIII
CHAP
TER
IXCH
APTE
R X
CHAP
TER
XIAP
PEN
DIX
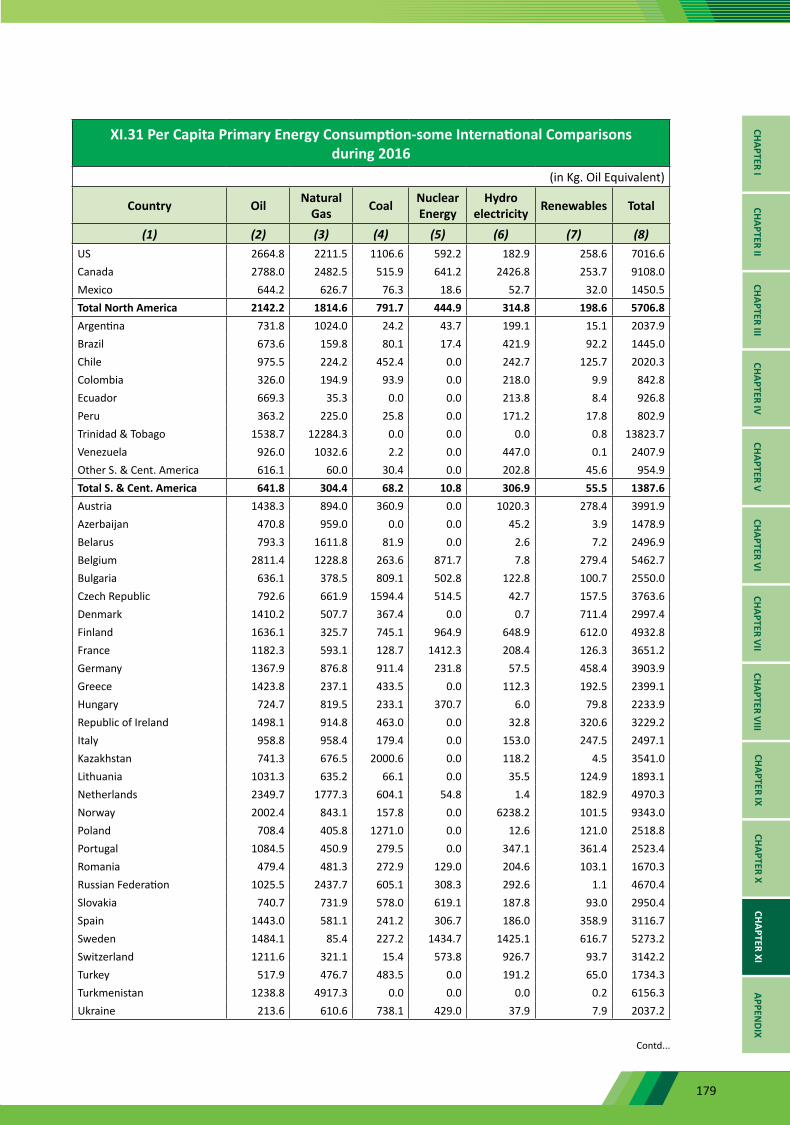
179
XI.31 Per Capita Primary Energy Consumption-some International Comparisons during 2016
(in Kg. Oil Equivalent)
Country Oil Natural Gas Coal Nuclear
EnergyHydro
electricity Renewables Total
(1) (2) (3) (4) (5) (6) (7) (8)US 2664.8 2211.5 1106.6 592.2 182.9 258.6 7016.6Canada 2788.0 2482.5 515.9 641.2 2426.8 253.7 9108.0Mexico 644.2 626.7 76.3 18.6 52.7 32.0 1450.5Total North America 2142.2 1814.6 791.7 444.9 314.8 198.6 5706.8Argentina 731.8 1024.0 24.2 43.7 199.1 15.1 2037.9Brazil 673.6 159.8 80.1 17.4 421.9 92.2 1445.0Chile 975.5 224.2 452.4 0.0 242.7 125.7 2020.3Colombia 326.0 194.9 93.9 0.0 218.0 9.9 842.8Ecuador 669.3 35.3 0.0 0.0 213.8 8.4 926.8Peru 363.2 225.0 25.8 0.0 171.2 17.8 802.9Trinidad & Tobago 1538.7 12284.3 0.0 0.0 0.0 0.8 13823.7Venezuela 926.0 1032.6 2.2 0.0 447.0 0.1 2407.9Other S. & Cent. America 616.1 60.0 30.4 0.0 202.8 45.6 954.9Total S. & Cent. America 641.8 304.4 68.2 10.8 306.9 55.5 1387.6Austria 1438.3 894.0 360.9 0.0 1020.3 278.4 3991.9Azerbaijan 470.8 959.0 0.0 0.0 45.2 3.9 1478.9Belarus 793.3 1611.8 81.9 0.0 2.6 7.2 2496.9Belgium 2811.4 1228.8 263.6 871.7 7.8 279.4 5462.7Bulgaria 636.1 378.5 809.1 502.8 122.8 100.7 2550.0Czech Republic 792.6 661.9 1594.4 514.5 42.7 157.5 3763.6Denmark 1410.2 507.7 367.4 0.0 0.7 711.4 2997.4Finland 1636.1 325.7 745.1 964.9 648.9 612.0 4932.8France 1182.3 593.1 128.7 1412.3 208.4 126.3 3651.2Germany 1367.9 876.8 911.4 231.8 57.5 458.4 3903.9Greece 1423.8 237.1 433.5 0.0 112.3 192.5 2399.1Hungary 724.7 819.5 233.1 370.7 6.0 79.8 2233.9Republic of Ireland 1498.1 914.8 463.0 0.0 32.8 320.6 3229.2Italy 958.8 958.4 179.4 0.0 153.0 247.5 2497.1Kazakhstan 741.3 676.5 2000.6 0.0 118.2 4.5 3541.0Lithuania 1031.3 635.2 66.1 0.0 35.5 124.9 1893.1Netherlands 2349.7 1777.3 604.1 54.8 1.4 182.9 4970.3Norway 2002.4 843.1 157.8 0.0 6238.2 101.5 9343.0Poland 708.4 405.8 1271.0 0.0 12.6 121.0 2518.8Portugal 1084.5 450.9 279.5 0.0 347.1 361.4 2523.4Romania 479.4 481.3 272.9 129.0 204.6 103.1 1670.3Russian Federation 1025.5 2437.7 605.1 308.3 292.6 1.1 4670.4Slovakia 740.7 731.9 578.0 619.1 187.8 93.0 2950.4Spain 1443.0 581.1 241.2 306.7 186.0 358.9 3116.7Sweden 1484.1 85.4 227.2 1434.7 1425.1 616.7 5273.2Switzerland 1211.6 321.1 15.4 573.8 926.7 93.7 3142.2Turkey 517.9 476.7 483.5 0.0 191.2 65.0 1734.3Turkmenistan 1238.8 4917.3 0.0 0.0 0.0 0.2 6156.3Ukraine 213.6 610.6 738.1 429.0 37.9 7.9 2037.2
Contd...
CHAPTER ICHAPTER II
CHAPTER IIICHAPTER IV
CHAPTER VCHAPTER VI
CHAPTER VIICHAPTER VIII
CHAPTER IXCHAPTER X
CHAPTER XIAPPEN
DIX
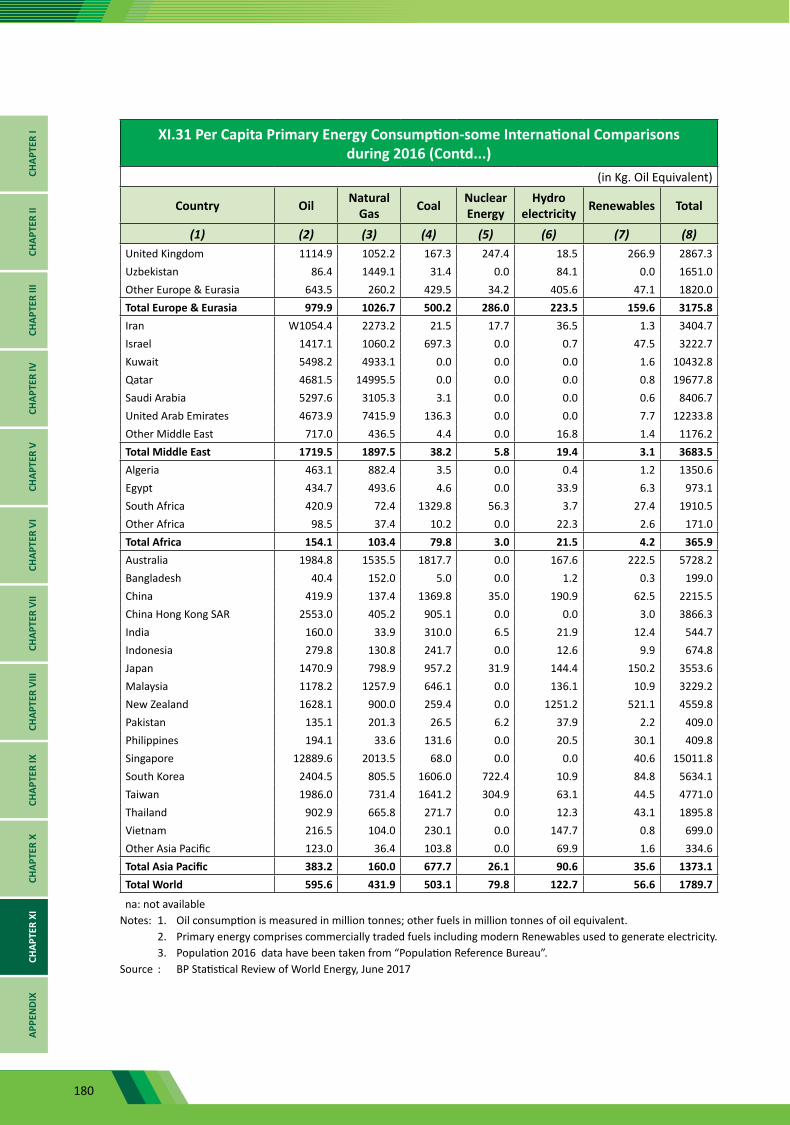
180
XI.31 Per Capita Primary Energy Consumption-some International Comparisons during 2016 (Contd...)
(in Kg. Oil Equivalent)
Country Oil Natural Gas Coal Nuclear
EnergyHydro
electricity Renewables Total
(1) (2) (3) (4) (5) (6) (7) (8)United Kingdom 1114.9 1052.2 167.3 247.4 18.5 266.9 2867.3Uzbekistan 86.4 1449.1 31.4 0.0 84.1 0.0 1651.0Other Europe & Eurasia 643.5 260.2 429.5 34.2 405.6 47.1 1820.0Total Europe & Eurasia 979.9 1026.7 500.2 286.0 223.5 159.6 3175.8Iran W1054.4 2273.2 21.5 17.7 36.5 1.3 3404.7Israel 1417.1 1060.2 697.3 0.0 0.7 47.5 3222.7Kuwait 5498.2 4933.1 0.0 0.0 0.0 1.6 10432.8Qatar 4681.5 14995.5 0.0 0.0 0.0 0.8 19677.8Saudi Arabia 5297.6 3105.3 3.1 0.0 0.0 0.6 8406.7United Arab Emirates 4673.9 7415.9 136.3 0.0 0.0 7.7 12233.8Other Middle East 717.0 436.5 4.4 0.0 16.8 1.4 1176.2Total Middle East 1719.5 1897.5 38.2 5.8 19.4 3.1 3683.5Algeria 463.1 882.4 3.5 0.0 0.4 1.2 1350.6Egypt 434.7 493.6 4.6 0.0 33.9 6.3 973.1South Africa 420.9 72.4 1329.8 56.3 3.7 27.4 1910.5Other Africa 98.5 37.4 10.2 0.0 22.3 2.6 171.0Total Africa 154.1 103.4 79.8 3.0 21.5 4.2 365.9Australia 1984.8 1535.5 1817.7 0.0 167.6 222.5 5728.2Bangladesh 40.4 152.0 5.0 0.0 1.2 0.3 199.0China 419.9 137.4 1369.8 35.0 190.9 62.5 2215.5China Hong Kong SAR 2553.0 405.2 905.1 0.0 0.0 3.0 3866.3India 160.0 33.9 310.0 6.5 21.9 12.4 544.7Indonesia 279.8 130.8 241.7 0.0 12.6 9.9 674.8Japan 1470.9 798.9 957.2 31.9 144.4 150.2 3553.6Malaysia 1178.2 1257.9 646.1 0.0 136.1 10.9 3229.2New Zealand 1628.1 900.0 259.4 0.0 1251.2 521.1 4559.8Pakistan 135.1 201.3 26.5 6.2 37.9 2.2 409.0Philippines 194.1 33.6 131.6 0.0 20.5 30.1 409.8Singapore 12889.6 2013.5 68.0 0.0 0.0 40.6 15011.8South Korea 2404.5 805.5 1606.0 722.4 10.9 84.8 5634.1Taiwan 1986.0 731.4 1641.2 304.9 63.1 44.5 4771.0Thailand 902.9 665.8 271.7 0.0 12.3 43.1 1895.8Vietnam 216.5 104.0 230.1 0.0 147.7 0.8 699.0Other Asia Pacific 123.0 36.4 103.8 0.0 69.9 1.6 334.6Total Asia Pacific 383.2 160.0 677.7 26.1 90.6 35.6 1373.1Total World 595.6 431.9 503.1 79.8 122.7 56.6 1789.7
na: not available Notes: 1. Oil consumption is measured in million tonnes; other fuels in million tonnes of oil equivalent. 2. Primary energy comprises commercially traded fuels including modern Renewables used to generate electricity. 3. Population 2016 data have been taken from “Population Reference Bureau”. Source : BP Statistical Review of World Energy, June 2017
CHAP
TER
ICH
APTE
R II
CHAP
TER
IIICH
APTE
R IV
CHAP
TER
VCH
APTE
R VI
CHAP
TER
VII
CHAP
TER
VIII
CHAP
TER
IXCH
APTE
R X
CHAP
TER
XIAP
PEN
DIX
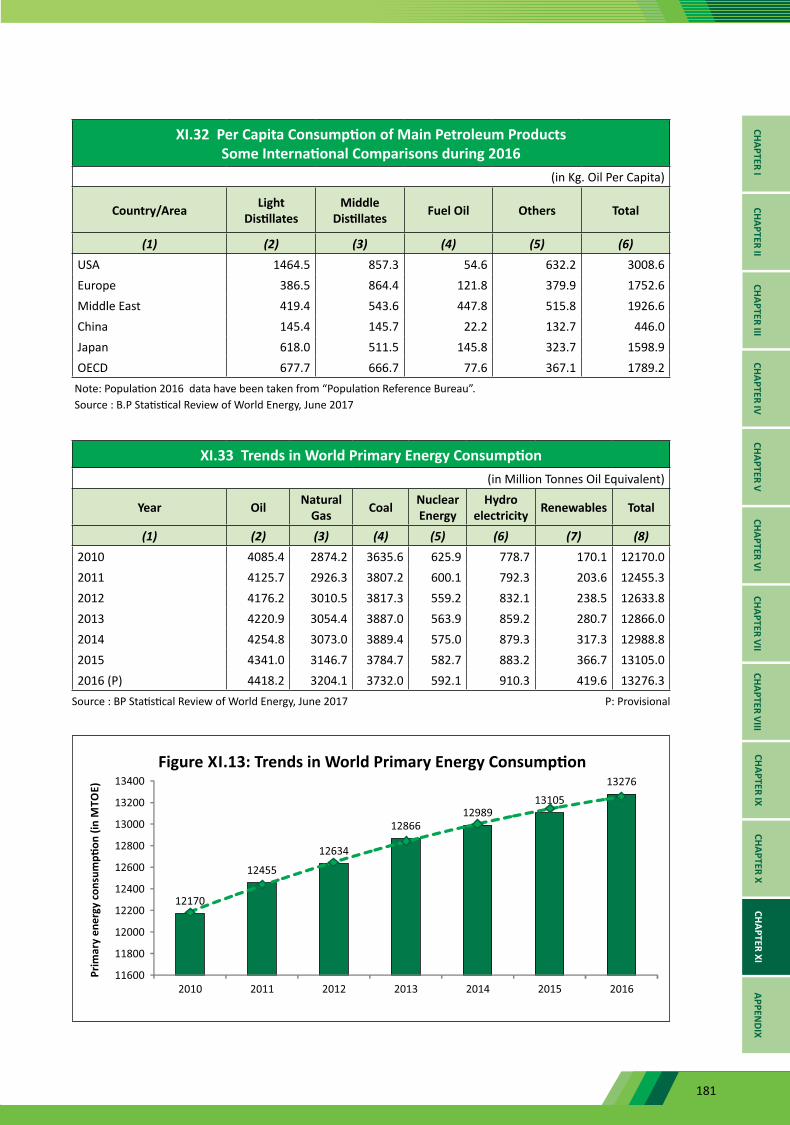
181
XI.32 Per Capita Consumption of Main Petroleum Products Some International Comparisons during 2016
(in Kg. Oil Per Capita)
Country/Area Light Distillates
Middle Distillates Fuel Oil Others Total
(1) (2) (3) (4) (5) (6)USA 1464.5 857.3 54.6 632.2 3008.6Europe 386.5 864.4 121.8 379.9 1752.6Middle East 419.4 543.6 447.8 515.8 1926.6China 145.4 145.7 22.2 132.7 446.0Japan 618.0 511.5 145.8 323.7 1598.9OECD 677.7 666.7 77.6 367.1 1789.2
Note: Population 2016 data have been taken from “Population Reference Bureau”. Source : B.P Statistical Review of World Energy, June 2017
XI.33 Trends in World Primary Energy Consumption (in Million Tonnes Oil Equivalent)
Year Oil Natural Gas Coal Nuclear
EnergyHydro
electricity Renewables Total
(1) (2) (3) (4) (5) (6) (7) (8)2010 4085.4 2874.2 3635.6 625.9 778.7 170.1 12170.02011 4125.7 2926.3 3807.2 600.1 792.3 203.6 12455.32012 4176.2 3010.5 3817.3 559.2 832.1 238.5 12633.82013 4220.9 3054.4 3887.0 563.9 859.2 280.7 12866.02014 4254.8 3073.0 3889.4 575.0 879.3 317.3 12988.82015 4341.0 3146.7 3784.7 582.7 883.2 366.7 13105.02016 (P) 4418.2 3204.1 3732.0 592.1 910.3 419.6 13276.3
Source : BP Statistical Review of World Energy, June 2017 P: Provisional
CHAPTER ICHAPTER II
CHAPTER IIICHAPTER IV
CHAPTER VCHAPTER VI
CHAPTER VIICHAPTER VIII
CHAPTER IXCHAPTER X
CHAPTER XIAPPEN
DIX
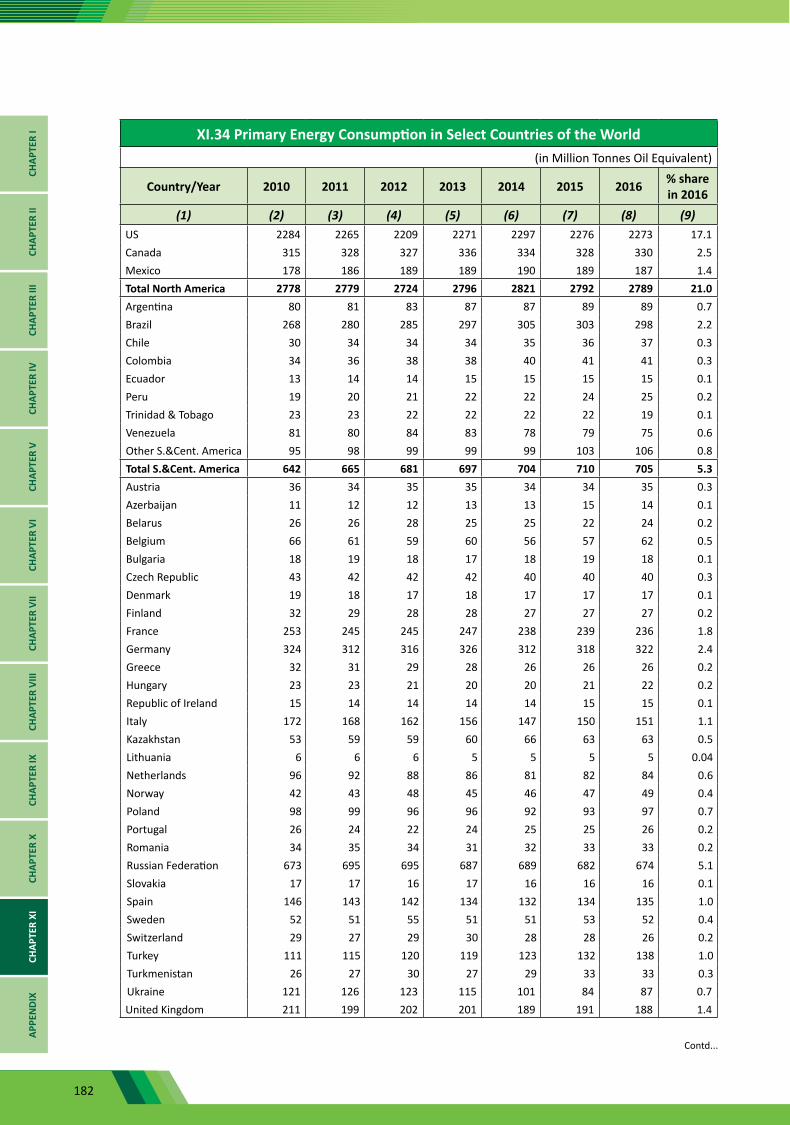
182
XI.34 Primary Energy Consumption in Select Countries of the World(in Million Tonnes Oil Equivalent)
Country/Year 2010 2011 2012 2013 2014 2015 2016 % share in 2016
(1) (2) (3) (4) (5) (6) (7) (8) (9)US 2284 2265 2209 2271 2297 2276 2273 17.1Canada 315 328 327 336 334 328 330 2.5Mexico 178 186 189 189 190 189 187 1.4Total North America 2778 2779 2724 2796 2821 2792 2789 21.0Argentina 80 81 83 87 87 89 89 0.7Brazil 268 280 285 297 305 303 298 2.2Chile 30 34 34 34 35 36 37 0.3Colombia 34 36 38 38 40 41 41 0.3Ecuador 13 14 14 15 15 15 15 0.1Peru 19 20 21 22 22 24 25 0.2Trinidad & Tobago 23 23 22 22 22 22 19 0.1Venezuela 81 80 84 83 78 79 75 0.6Other S.&Cent. America 95 98 99 99 99 103 106 0.8Total S.&Cent. America 642 665 681 697 704 710 705 5.3Austria 36 34 35 35 34 34 35 0.3Azerbaijan 11 12 12 13 13 15 14 0.1Belarus 26 26 28 25 25 22 24 0.2Belgium 66 61 59 60 56 57 62 0.5Bulgaria 18 19 18 17 18 19 18 0.1Czech Republic 43 42 42 42 40 40 40 0.3Denmark 19 18 17 18 17 17 17 0.1Finland 32 29 28 28 27 27 27 0.2France 253 245 245 247 238 239 236 1.8Germany 324 312 316 326 312 318 322 2.4Greece 32 31 29 28 26 26 26 0.2Hungary 23 23 21 20 20 21 22 0.2Republic of Ireland 15 14 14 14 14 15 15 0.1Italy 172 168 162 156 147 150 151 1.1Kazakhstan 53 59 59 60 66 63 63 0.5Lithuania 6 6 6 5 5 5 5 0.04Netherlands 96 92 88 86 81 82 84 0.6Norway 42 43 48 45 46 47 49 0.4Poland 98 99 96 96 92 93 97 0.7Portugal 26 24 22 24 25 25 26 0.2Romania 34 35 34 31 32 33 33 0.2Russian Federation 673 695 695 687 689 682 674 5.1Slovakia 17 17 16 17 16 16 16 0.1Spain 146 143 142 134 132 134 135 1.0Sweden 52 51 55 51 51 53 52 0.4Switzerland 29 27 29 30 28 28 26 0.2Turkey 111 115 120 119 123 132 138 1.0Turkmenistan 26 27 30 27 29 33 33 0.3Ukraine 121 126 123 115 101 84 87 0.7United Kingdom 211 199 202 201 189 191 188 1.4
Contd...
CHAP
TER
ICH
APTE
R II
CHAP
TER
IIICH
APTE
R IV
CHAP
TER
VCH
APTE
R VI
CHAP
TER
VII
CHAP
TER
VIII
CHAP
TER
IXCH
APTE
R X
CHAP
TER
XIAP
PEN
DIX

183
XI.34 Primary Energy Consumption in Select Countries of the World (Contd...)(in Million Tonnes Oil Equivalent)
Country/Year 2010 2011 2012 2013 2014 2015 2016 % share in 2016
(1) (2) (3) (4) (5) (6) (7) (8) (9)Uzbekistan 44 50 49 49 50 52 53 0.4Other Europe & Eurasia 99 97 95 97 94 95 98 0.7Total Europe & Eurasia 2953 2938 2936 2901 2838 2847 2867 21.6Iran 225 235 235 246 262 263 271 2.0Israel 24 24 25 25 24 26 26 0.2Kuwait 34 35 41 40 38 41 42 0.3Qatar 33 26 29 43 43 50 49 0.4Saudi Arabia 216 222 236 237 252 261 266 2.0United Arab Emirates 86 91 96 97 99 109 114 0.9Other Middle East 116 117 119 124 122 125 127 1.0Total Middle East 734 750 781 812 840 875 895 6.7Algeria 39 41 45 48 52 55 55 0.4Egypt 81 82 87 86 85 87 91 0.7South Africa 125 124 122 124 125 120 122 0.9Other Africa 144 141 149 158 166 172 172 1.3Total Africa 389 388 403 415 428 434 440 3.3Australia 126 132 130 131 133 138 138 1.0Bangladesh 23 24 26 27 28 31 32 0.2China 2491 2690 2797 2905 2971 3006 3053 23.0China Hong Kong SAR 27 28 27 28 27 28 29 0.2India 537 569 612 621 664 685 724 5.5Indonesia 149 163 171 174 163 165 175 1.3Japan 496 470 468 464 452 446 445 3.4Malaysia 72 80 83 89 92 94 99 0.7New Zealand 20 20 20 20 21 21 21 0.2Pakistan 70 71 71 72 74 77 83 0.6Philippines 29 30 30 32 34 38 42 0.3Singapore 69 72 72 74 76 81 84 0.6South Korea 255 269 272 272 275 280 286 2.2Taiwan 109 109 108 110 112 111 112 0.8Thailand 102 106 114 116 119 122 124 0.9Vietnam 44 50 53 55 60 64 65 0.5Other Asia Pacific 54 53 54 54 58 61 66 0.5Total Asia Pacific 4675 4935 5109 5245 5357 5447 5580 42.0Total World 12170 12455 12634 12866 12989 13105 13276 100
Notes: 1. Oil consumption is measured in million tonnes; other fuels in million tonnes of oil equivalent. 2. Primary energy comprises commercially traded fuels including modern Renewables used to generate electricity.Source: BP Statistical Review of World Energy, June 2017
CHAPTER ICHAPTER II
CHAPTER IIICHAPTER IV
CHAPTER VCHAPTER VI
CHAPTER VIICHAPTER VIII
CHAPTER IXCHAPTER X
CHAPTER XIAPPEN
DIX
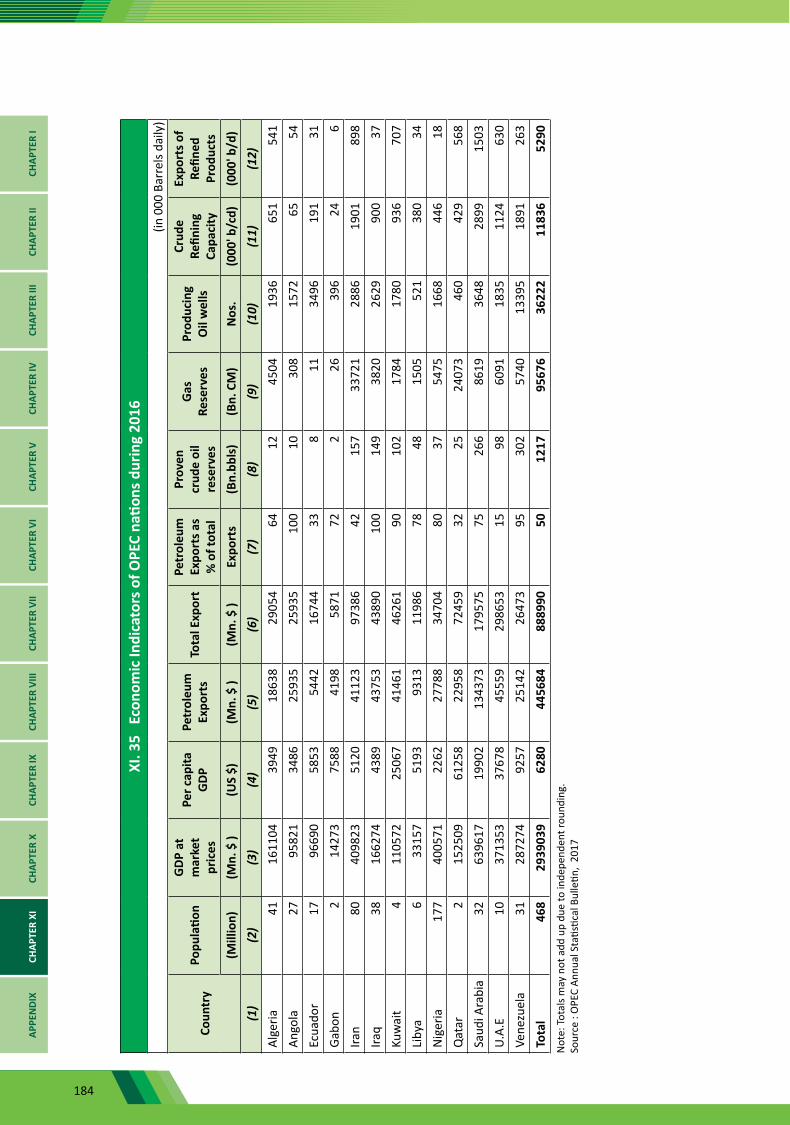
184
XI. 3
5 E
cono
mic
Indi
cato
rs o
f OPE
C na
tions
dur
ing
2016
(in 0
00 B
arre
ls da
ily)
Coun
try
Popu
latio
n G
DP a
t m
arke
t pr
ices
Per c
apita
G
DP
Petr
oleu
m
Expo
rts
Tota
l Exp
ort
Petr
oleu
m
Expo
rts a
s %
of t
otal
Prov
en
crud
e oi
l re
serv
es
Gas
Re
serv
es
Prod
ucin
g O
il w
ells
Crud
e Re
finin
g Ca
paci
ty
Expo
rts o
f Re
fined
Pr
oduc
ts(M
illio
n)(M
n. $
)(U
S $)
(Mn.
$ )
(Mn.
$ )
Expo
rts
(Bn.
bbls
)(B
n. C
M)
Nos
.(0
00' b
/cd)
(000
' b/d
)(1
)(2
)(3
)(4
)(5
)(6
)(7
)(8
)(9
)(1
0)(1
1)(1
2)Al
geria
4116
1104
3949
1863
829
054
6412
4504
1936
651
541
Ango
la27
9582
134
8625
935
2593
510
010
308
1572
6554
Ecua
dor
1796
690
5853
5442
1674
433
811
3496
191
31Ga
bon
214
273
7588
4198
5871
722
2639
624
6Ira
n80
4098
2351
2041
123
9738
642
157
3372
128
8619
0189
8Ira
q38
1662
7443
8943
753
4389
010
014
938
2026
2990
037
Kuw
ait
411
0572
2506
741
461
4626
190
102
1784
1780
936
707
Liby
a6
3315
751
9393
1311
986
7848
1505
521
380
34N
iger
ia17
740
0571
2262
2778
834
704
8037
5475
1668
446
18Q
atar
215
2509
6125
822
958
7245
932
2524
073
460
429
568
Saud
i Ara
bia
3263
9617
1990
213
4373
1795
7575
266
8619
3648
2899
1503
U.A.
E10
3713
5337
678
4555
929
8653
1598
6091
1835
1124
630
Vene
zuel
a31
2872
7492
5725
142
2647
395
302
5740
1339
518
9126
3To
tal
468
2939
039
6280
4456
8488
8990
5012
1795
676
3622
211
836
5290
Not
e: To
tals
may
not
add
up
due
to in
depe
nden
t rou
ndin
g.So
urce
: O
PEC
Annu
al S
tatis
tical
Bul
letin
, 20
17
CHAP
TER
ICH
APTE
R II
CHAP
TER
IIICH
APTE
R IV
CHAP
TER
VCH
APTE
R VI
CHAP
TER
VII
CHAP
TER
VIII
CHAP
TER
IXCH
APTE
R X
CHAP
TER
XIAP
PEN
DIX
185
Appendix
CHAPTER ICHAPTER II
CHAPTER IIICHAPTER IV
CHAPTER VCHAPTER VI
CHAPTER VIICHAPTER VIII
CHAPTER IXCHAPTER X
CHAPTER XIAPPEN
DIX
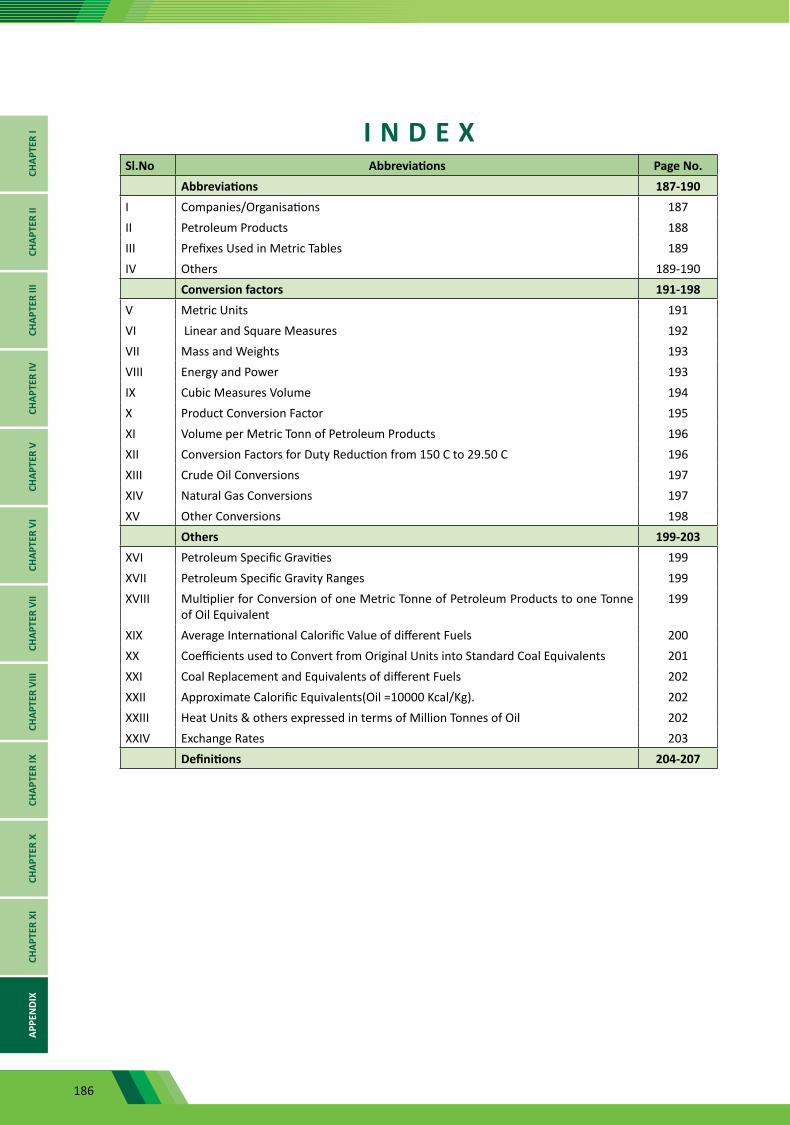
186
CHAP
TER
ICH
APTE
R II
CHAP
TER
IIICH
APTE
R IV
CHAP
TER
VCH
APTE
R VI
CHAP
TER
VII
CHAP
TER
VIII
CHAP
TER
IXCH
APTE
R X
CHAP
TER
XIAP
PEN
DIX
I N D E XSl.No Abbreviations Page No.
Abbreviations 187-190I Companies/Organisations 187II Petroleum Products 188III Prefixes Used in Metric Tables 189IV Others 189-190
Conversion factors 191-198V Metric Units 191VI Linear and Square Measures 192VII Mass and Weights 193VIII Energy and Power 193IX Cubic Measures Volume 194X Product Conversion Factor 195XI Volume per Metric Tonn of Petroleum Products 196XII Conversion Factors for Duty Reduction from 150 C to 29.50 C 196XIII Crude Oil Conversions 197XIV Natural Gas Conversions 197XV Other Conversions 198
Others 199-203XVI Petroleum Specific Gravities 199XVII Petroleum Specific Gravity Ranges 199XVIII Multiplier for Conversion of one Metric Tonne of Petroleum Products to one Tonne
of Oil Equivalent199
XIX Average International Calorific Value of different Fuels 200XX Coefficients used to Convert from Original Units into Standard Coal Equivalents 201XXI Coal Replacement and Equivalents of different Fuels 202XXII Approximate Calorific Equivalents(Oil =10000 Kcal/Kg). 202XXIII Heat Units & others expressed in terms of Million Tonnes of Oil 202XXIV Exchange Rates 203
Definitions 204-207

187
Abbreviations(I) Companies/Organisations
AFPC, Syria Al Furat Petroleum Company, Syria.AGC Assam Gas CompanyBL Balmer Lawrie & Co. Ltd.BLIL Balmer Lawrie Investments Ltd.BORL Bharat Oman Refinery Ltd.BP British PetroleumBPCL Bharat Petroleum Corporation Ltd.CAIRN Cairn India LimitedCPCL Chennai Petroleum Corporation Ltd.DGCIS Directorate General of Commercial Intelligence and StatisticsDGH Directorate General of HydrocarbonsDNPL Duliajan Numaligarh Pipeline Limited EIL Engineers India LtdEssar Essar Oil Ltd.GAIL Gail (India) LimitedGOI Government of IndiaGPOC, South Sudan Greater Pioneer Operating Company, South SudanHMEL HPCL Mittal Energy Ltd.HPCL Hindustan Petroleum Corporation Ltd.IEC, Russia. Imperial Energy Corporation, Russia.IOCL Indian Oil Corporation Ltd.ISPRL Indian Strategic Petroleum Reserves Limited.MECL Mansarovar Energy Colombia Ltd.MoPNG Ministry of Petroleum & Natural GasMoSPI Ministry of Statistics And Programme ImplementationMRPL Mangalore Refinery & Petrochemical Ltd.NRL Numaligarh Refinery Ltd.OIL Oil India LimitedOMC Oil Marketing Company.ONGC Oil & Natural Gas Corporation Ltd.OPEC Organization of the Petroleum Exporting CountriesOVL ONGC Videsh LtdP&NG Petroleum & Natural GasPPAC Petroleum Planning & Analysis Cell.RBI Reserve Bank of India.RIL Reliance Industries Ltd.
CHAPTER ICHAPTER II
CHAPTER IIICHAPTER IV
CHAPTER VCHAPTER VI
CHAPTER VIICHAPTER VIII
CHAPTER IXCHAPTER X
CHAPTER XIAPPEN
DIX
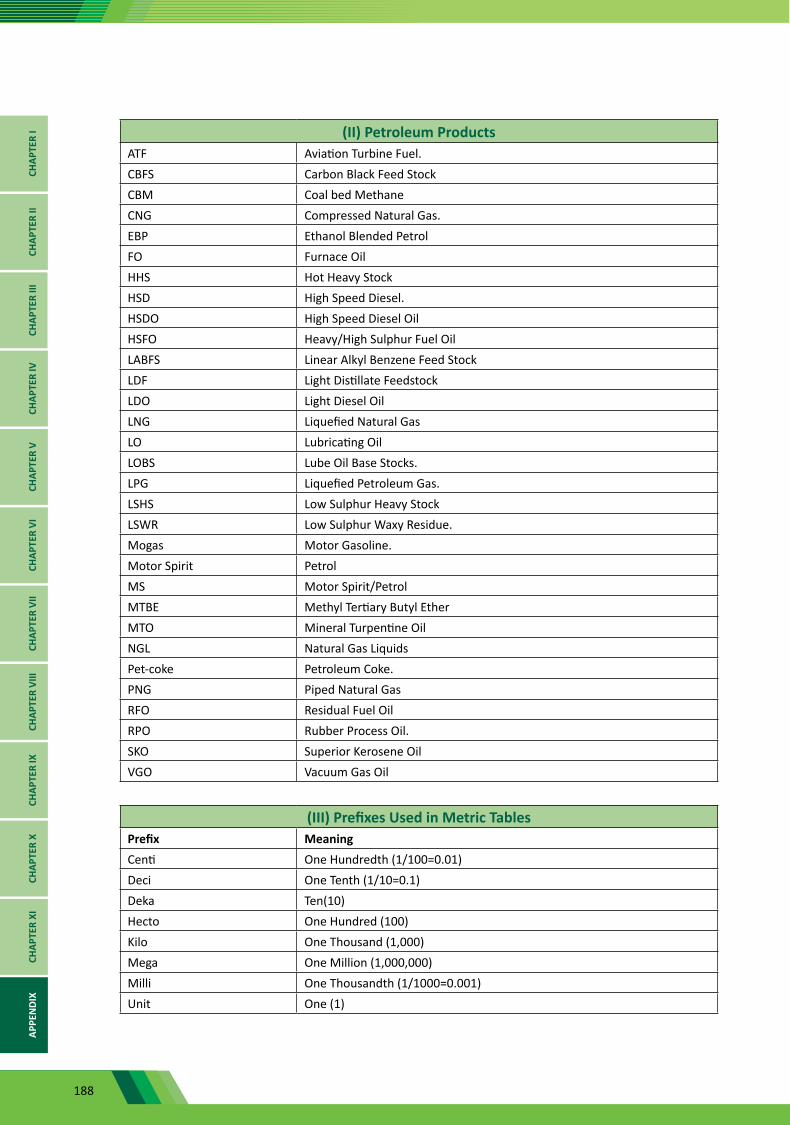
188
(II) Petroleum ProductsATF Aviation Turbine Fuel.CBFS Carbon Black Feed StockCBM Coal bed MethaneCNG Compressed Natural Gas.EBP Ethanol Blended PetrolFO Furnace OilHHS Hot Heavy Stock HSD High Speed Diesel.HSDO High Speed Diesel OilHSFO Heavy/High Sulphur Fuel Oil LABFS Linear Alkyl Benzene Feed StockLDF Light Distillate FeedstockLDO Light Diesel OilLNG Liquefied Natural GasLO Lubricating OilLOBS Lube Oil Base Stocks.LPG Liquefied Petroleum Gas.LSHS Low Sulphur Heavy StockLSWR Low Sulphur Waxy Residue. Mogas Motor Gasoline.Motor Spirit PetrolMS Motor Spirit/PetrolMTBE Methyl Tertiary Butyl EtherMTO Mineral Turpentine OilNGL Natural Gas LiquidsPet-coke Petroleum Coke.PNG Piped Natural GasRFO Residual Fuel OilRPO Rubber Process Oil.SKO Superior Kerosene OilVGO Vacuum Gas Oil
(III) Prefixes Used in Metric TablesPrefix MeaningCenti One Hundredth (1/100=0.01)Deci One Tenth (1/10=0.1)Deka Ten(10)Hecto One Hundred (100)Kilo One Thousand (1,000)Mega One Million (1,000,000)Milli One Thousandth (1/1000=0.001)Unit One (1)
CHAP
TER
ICH
APTE
R II
CHAP
TER
IIICH
APTE
R IV
CHAP
TER
VCH
APTE
R VI
CHAP
TER
VII
CHAP
TER
VIII
CHAP
TER
IXCH
APTE
R X
CHAP
TER
XIAP
PEN
DIX
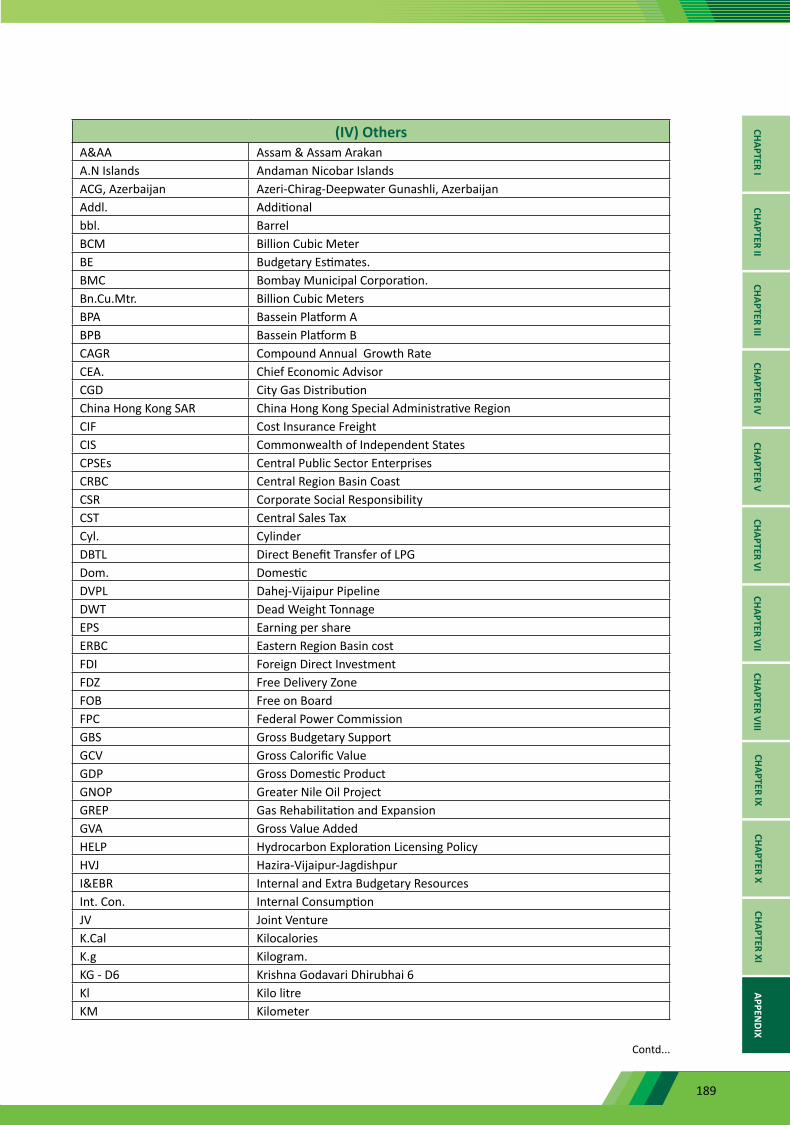
189
(IV) OthersA&AA Assam & Assam ArakanA.N Islands Andaman Nicobar IslandsACG, Azerbaijan Azeri-Chirag-Deepwater Gunashli, AzerbaijanAddl. Additionalbbl. BarrelBCM Billion Cubic MeterBE Budgetary Estimates.BMC Bombay Municipal Corporation.Bn.Cu.Mtr. Billion Cubic MetersBPA Bassein Platform ABPB Bassein Platform BCAGR Compound Annual Growth RateCEA. Chief Economic AdvisorCGD City Gas DistributionChina Hong Kong SAR China Hong Kong Special Administrative RegionCIF Cost Insurance FreightCIS Commonwealth of Independent StatesCPSEs Central Public Sector EnterprisesCRBC Central Region Basin CoastCSR Corporate Social ResponsibilityCST Central Sales TaxCyl. CylinderDBTL Direct Benefit Transfer of LPG Dom. DomesticDVPL Dahej-Vijaipur Pipeline DWT Dead Weight TonnageEPS Earning per shareERBC Eastern Region Basin costFDI Foreign Direct InvestmentFDZ Free Delivery ZoneFOB Free on BoardFPC Federal Power CommissionGBS Gross Budgetary SupportGCV Gross Calorific ValueGDP Gross Domestic ProductGNOP Greater Nile Oil ProjectGREP Gas Rehabilitation and ExpansionGVA Gross Value AddedHELP Hydrocarbon Exploration Licensing PolicyHVJ Hazira-Vijaipur-JagdishpurI&EBR Internal and Extra Budgetary ResourcesInt. Con. Internal ConsumptionJV Joint VentureK.Cal KilocaloriesK.g Kilogram.KG - D6 Krishna Godavari Dhirubhai 6 Kl Kilo litreKM Kilometer
Contd...
CHAPTER ICHAPTER II
CHAPTER IIICHAPTER IV
CHAPTER VCHAPTER VI
CHAPTER VIICHAPTER VIII
CHAPTER IXCHAPTER X
CHAPTER XIAPPEN
DIX
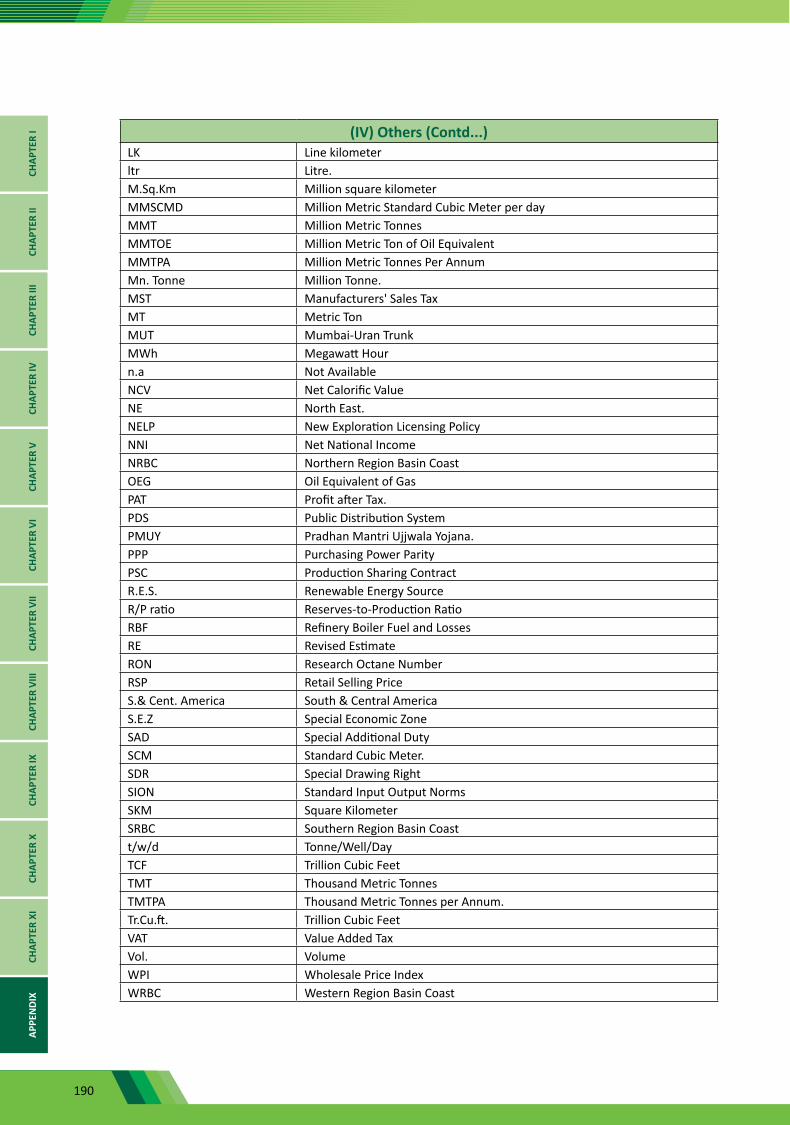
190
(IV) Others (Contd...)LK Line kilometerltr Litre.M.Sq.Km Million square kilometerMMSCMD Million Metric Standard Cubic Meter per dayMMT Million Metric TonnesMMTOE Million Metric Ton of Oil EquivalentMMTPA Million Metric Tonnes Per AnnumMn. Tonne Million Tonne.MST Manufacturers' Sales Tax MT Metric TonMUT Mumbai-Uran TrunkMWh Megawatt Hour n.a Not AvailableNCV Net Calorific Value NE North East.NELP New Exploration Licensing PolicyNNI Net National IncomeNRBC Northern Region Basin CoastOEG Oil Equivalent of GasPAT Profit after Tax.PDS Public Distribution SystemPMUY Pradhan Mantri Ujjwala Yojana.PPP Purchasing Power ParityPSC Production Sharing Contract R.E.S. Renewable Energy SourceR/P ratio Reserves-to-Production Ratio RBF Refinery Boiler Fuel and LossesRE Revised EstimateRON Research Octane NumberRSP Retail Selling PriceS.& Cent. America South & Central AmericaS.E.Z Special Economic ZoneSAD Special Additional DutySCM Standard Cubic Meter.SDR Special Drawing RightSION Standard Input Output Norms SKM Square KilometerSRBC Southern Region Basin Coastt/w/d Tonne/Well/Day TCF Trillion Cubic FeetTMT Thousand Metric TonnesTMTPA Thousand Metric Tonnes per Annum.Tr.Cu.ft. Trillion Cubic FeetVAT Value Added TaxVol. VolumeWPI Wholesale Price IndexWRBC Western Region Basin Coast
CHAP
TER
ICH
APTE
R II
CHAP
TER
IIICH
APTE
R IV
CHAP
TER
VCH
APTE
R VI
CHAP
TER
VII
CHAP
TER
VIII
CHAP
TER
IXCH
APTE
R X
CHAP
TER
XIAP
PEN
DIX
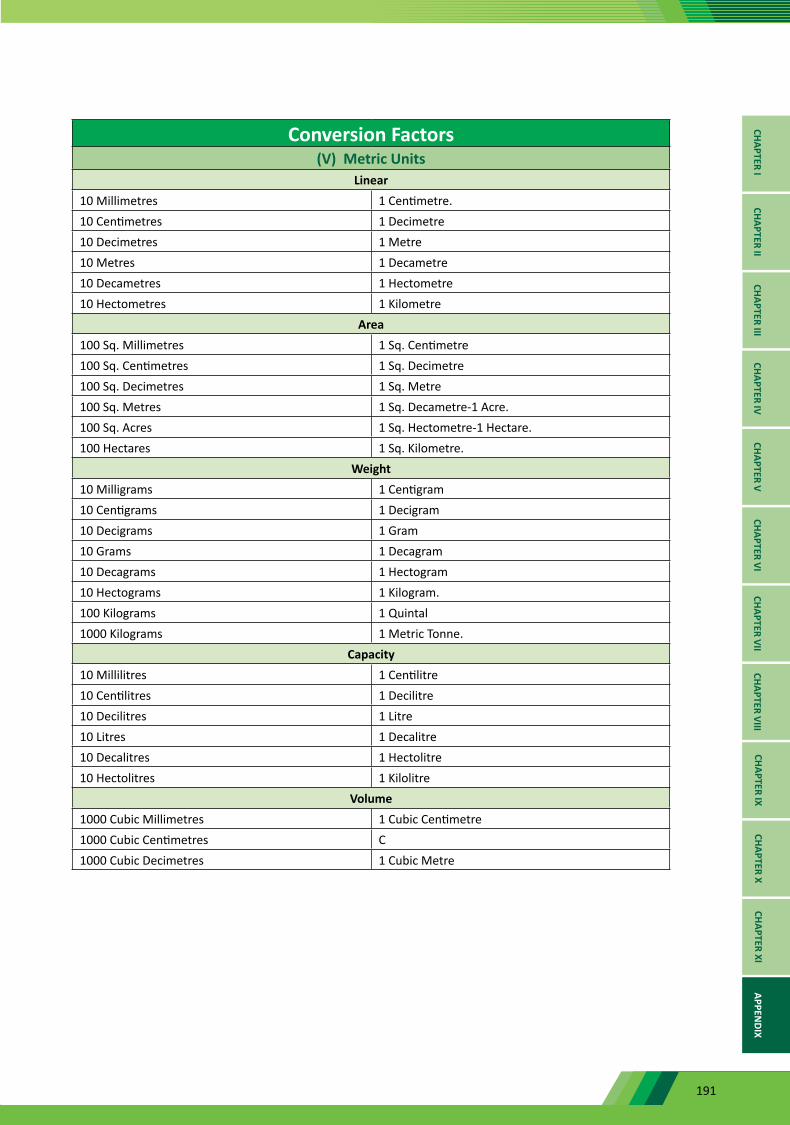
191
Conversion Factors(V) Metric Units
Linear10 Millimetres 1 Centimetre.10 Centimetres 1 Decimetre10 Decimetres 1 Metre10 Metres 1 Decametre10 Decametres 1 Hectometre10 Hectometres 1 Kilometre
Area100 Sq. Millimetres 1 Sq. Centimetre100 Sq. Centimetres 1 Sq. Decimetre100 Sq. Decimetres 1 Sq. Metre100 Sq. Metres 1 Sq. Decametre-1 Acre.100 Sq. Acres 1 Sq. Hectometre-1 Hectare.100 Hectares 1 Sq. Kilometre.
Weight10 Milligrams 1 Centigram10 Centigrams 1 Decigram10 Decigrams 1 Gram10 Grams 1 Decagram10 Decagrams 1 Hectogram10 Hectograms 1 Kilogram.100 Kilograms 1 Quintal1000 Kilograms 1 Metric Tonne.
Capacity10 Millilitres 1 Centilitre10 Centilitres 1 Decilitre10 Decilitres 1 Litre10 Litres 1 Decalitre10 Decalitres 1 Hectolitre10 Hectolitres 1 Kilolitre
Volume1000 Cubic Millimetres 1 Cubic Centimetre1000 Cubic Centimetres C1000 Cubic Decimetres 1 Cubic Metre
CHAPTER ICHAPTER II
CHAPTER IIICHAPTER IV
CHAPTER VCHAPTER VI
CHAPTER VIICHAPTER VIII
CHAPTER IXCHAPTER X
CHAPTER XIAPPEN
DIX
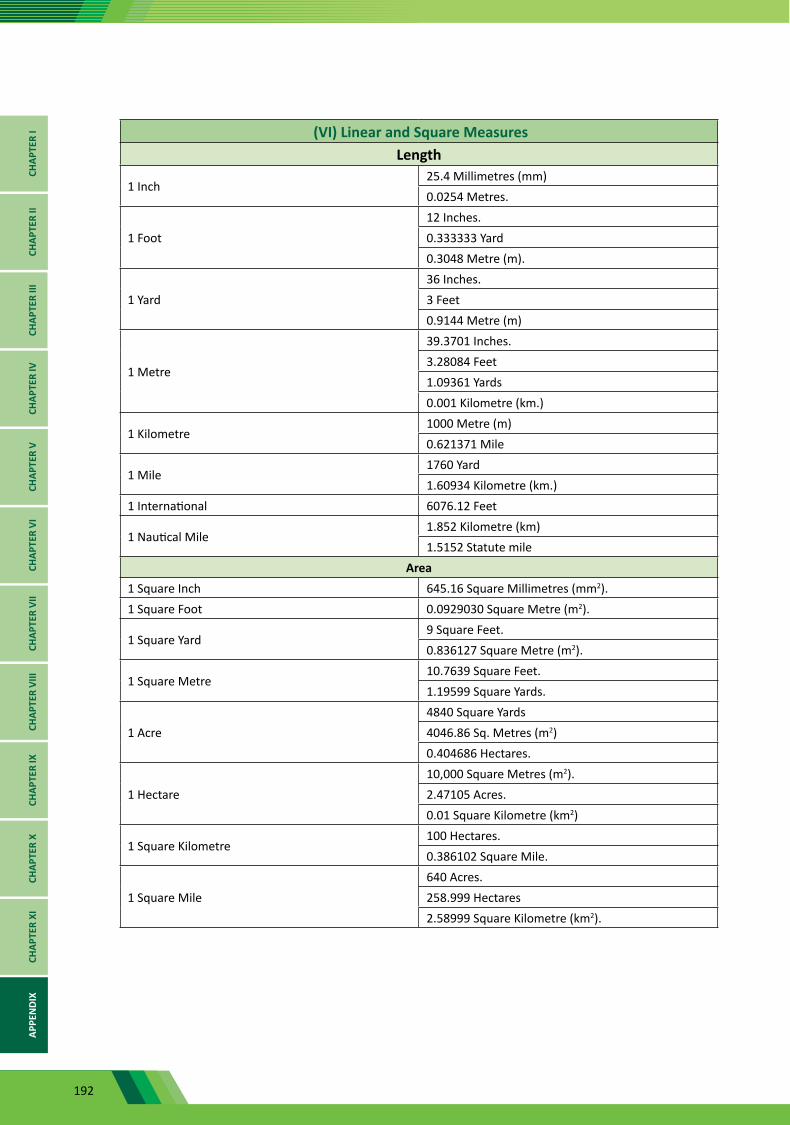
192
(VI) Linear and Square MeasuresLength
1 Inch25.4 Millimetres (mm)0.0254 Metres.
1 Foot12 Inches.0.333333 Yard0.3048 Metre (m).
1 Yard36 Inches.3 Feet0.9144 Metre (m)
1 Metre
39.3701 Inches.3.28084 Feet1.09361 Yards0.001 Kilometre (km.)
1 Kilometre1000 Metre (m)0.621371 Mile
1 Mile1760 Yard1.60934 Kilometre (km.)
1 International 6076.12 Feet
1 Nautical Mile1.852 Kilometre (km)1.5152 Statute mile
Area1 Square Inch 645.16 Square Millimetres (mm2).1 Square Foot 0.0929030 Square Metre (m2).
1 Square Yard9 Square Feet.0.836127 Square Metre (m2).
1 Square Metre10.7639 Square Feet.1.19599 Square Yards.
1 Acre4840 Square Yards4046.86 Sq. Metres (m2)0.404686 Hectares.
1 Hectare10,000 Square Metres (m2).2.47105 Acres.0.01 Square Kilometre (km2)
1 Square Kilometre100 Hectares.0.386102 Square Mile.
1 Square Mile640 Acres.258.999 Hectares2.58999 Square Kilometre (km2).
CHAP
TER
ICH
APTE
R II
CHAP
TER
IIICH
APTE
R IV
CHAP
TER
VCH
APTE
R VI
CHAP
TER
VII
CHAP
TER
VIII
CHAP
TER
IXCH
APTE
R X
CHAP
TER
XIAP
PEN
DIX
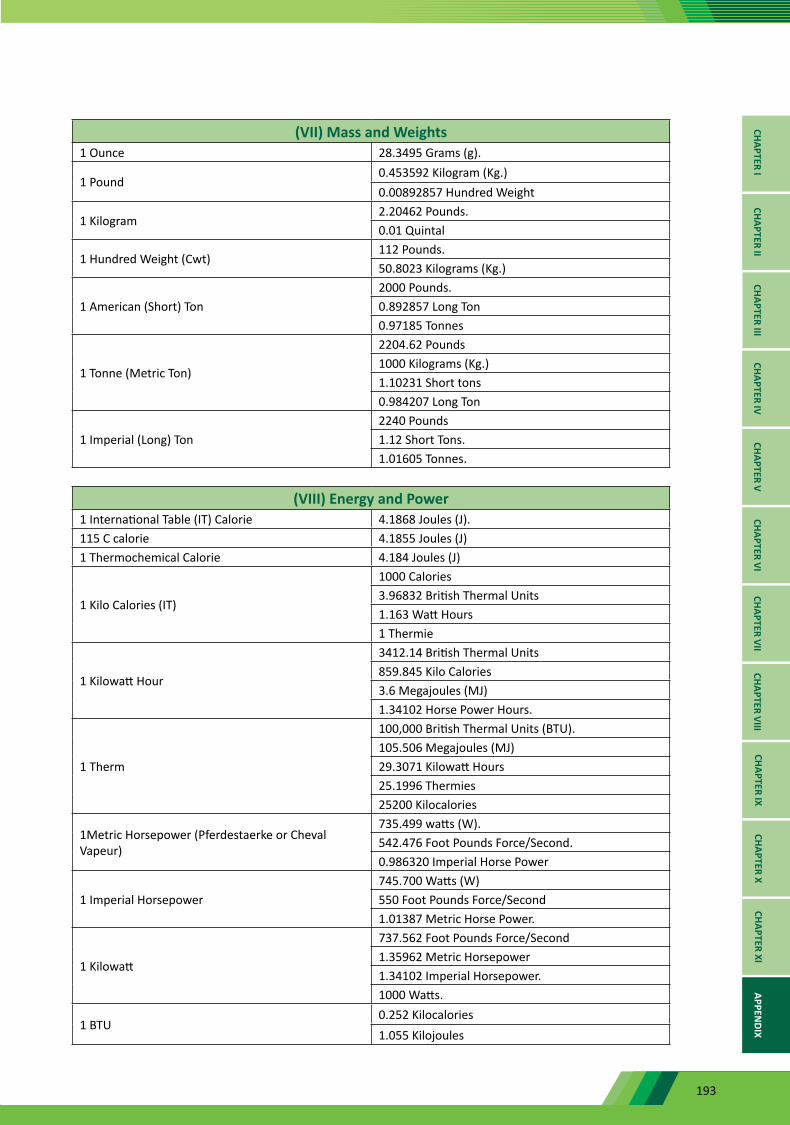
193
(VII) Mass and Weights1 Ounce 28.3495 Grams (g).
1 Pound0.453592 Kilogram (Kg.)0.00892857 Hundred Weight
1 Kilogram2.20462 Pounds. 0.01 Quintal
1 Hundred Weight (Cwt)112 Pounds.50.8023 Kilograms (Kg.)
1 American (Short) Ton2000 Pounds. 0.892857 Long Ton0.97185 Tonnes
1 Tonne (Metric Ton)
2204.62 Pounds1000 Kilograms (Kg.)1.10231 Short tons0.984207 Long Ton
1 Imperial (Long) Ton2240 Pounds1.12 Short Tons.1.01605 Tonnes.
(VIII) Energy and Power1 International Table (IT) Calorie 4.1868 Joules (J).115 C calorie 4.1855 Joules (J)1 Thermochemical Calorie 4.184 Joules (J)
1 Kilo Calories (IT)
1000 Calories3.96832 British Thermal Units1.163 Watt Hours 1 Thermie
1 Kilowatt Hour
3412.14 British Thermal Units 859.845 Kilo Calories3.6 Megajoules (MJ)1.34102 Horse Power Hours.
1 Therm
100,000 British Thermal Units (BTU). 105.506 Megajoules (MJ)29.3071 Kilowatt Hours25.1996 Thermies25200 Kilocalories
1Metric Horsepower (Pferdestaerke or Cheval Vapeur)
735.499 watts (W).542.476 Foot Pounds Force/Second. 0.986320 Imperial Horse Power
1 Imperial Horsepower745.700 Watts (W)550 Foot Pounds Force/Second1.01387 Metric Horse Power.
1 Kilowatt
737.562 Foot Pounds Force/Second1.35962 Metric Horsepower1.34102 Imperial Horsepower.1000 Watts.
1 BTU0.252 Kilocalories1.055 Kilojoules
CHAPTER ICHAPTER II
CHAPTER IIICHAPTER IV
CHAPTER VCHAPTER VI
CHAPTER VIICHAPTER VIII
CHAPTER IXCHAPTER X
CHAPTER XIAPPEN
DIX

194
(IX) Cubic Measures Volume1 Cubic Inch 16.3871 Cubic Centimetres (cm3)1 Pint 0.568261 Cubic Decimetres (dm3) or Litres.
1 Litre
61.024 Cubic Inches1.75975 Pints1 Cubic Decimeter (dm3)0.264172 American Gallons0.219963 Imperial Gallons0.0353147 Cubic Foot
1 Hectolitre100 Cubic Decimetres (dm3) or100 Litres
1 American Gallon
231 Cubic Inches3.78541 Cubic Decimetres or Litres 0.832674 Imperial Gallon. 0.133681 Cubic Foot.0.0238095 American Barrel.0.00378541 Cubic Metre (M3)
1 Imperial Gallon
277.420 Cubic Inches4.54609 Cubic Decimetres (dm3) or Litres1.20095 American Gallon0.160544 Cubic Foot0.02894 American Barrel0.00454609 Cubic Metre (m3)
1 Cubic Foot
28.3168 Cubic Decimetres (dm3) or Litres7.48052 American Gallons6.22883 Imperial Gallons0.17811 American Barrel0.0283168 Cubic Metre (m3)
1 Americal Barrel
9702 Cubic Inches158.987 Cubic Decimetres (dm3) or Litres42 American Gallons34.9726 Imperial Gallons5.6146 Cubic Feet0.158987 Cubic Metre (M3)
1 Cubic Metres
1000 Litres.264.172 American Gallons219.969 Imperial Gallons35.3147 Cubic Feet
1 Kilolitre1000 Cubic Decimetres (dm3) or Litres6.28981 Americal Barrels.
1 Gross Ton (Shipping)2.83168 Cubic Metres or 100 Cubic Feetor Permanently Enclosed Space
1 Ton of Liquefied MethaneApprox. 16 BarrelsApprox. 1400 Cubic Metres of Natural Gas depending upon Methane Content
CHAP
TER
ICH
APTE
R II
CHAP
TER
IIICH
APTE
R IV
CHAP
TER
VCH
APTE
R VI
CHAP
TER
VII
CHAP
TER
VIII
CHAP
TER
IXCH
APTE
R X
CHAP
TER
XIAP
PEN
DIX
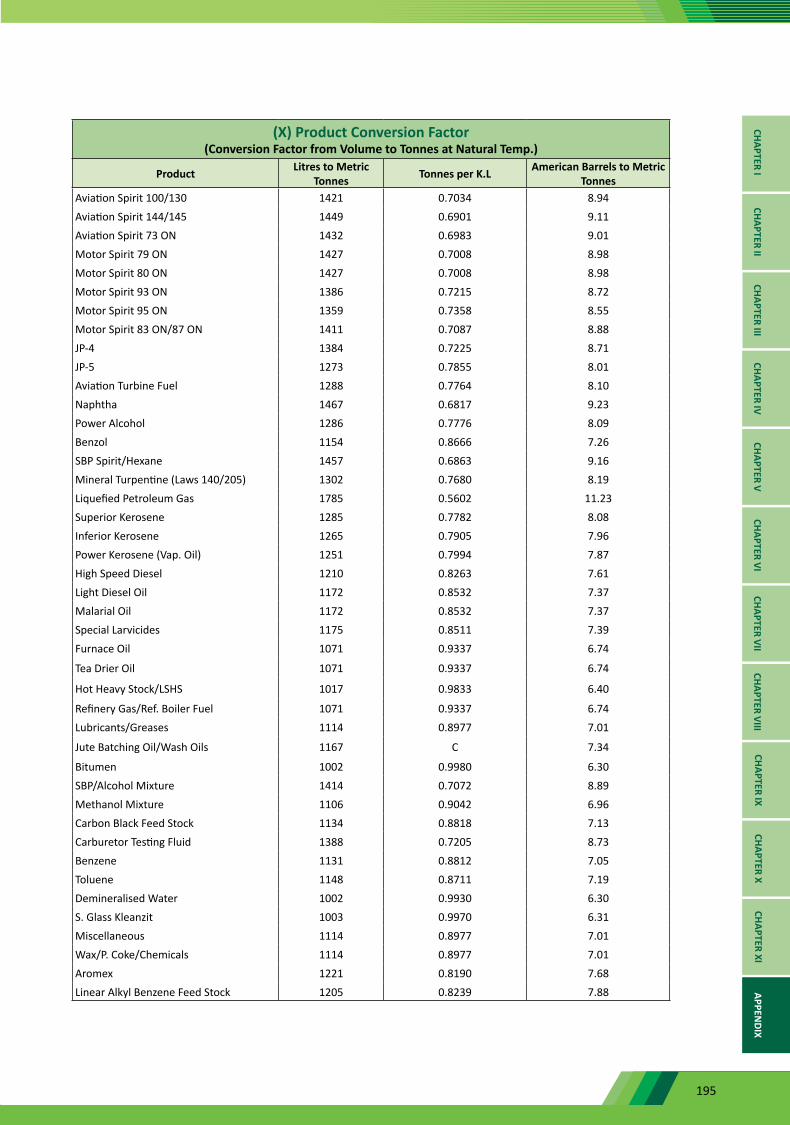
195
(X) Product Conversion Factor(Conversion Factor from Volume to Tonnes at Natural Temp.)
Product Litres to Metric Tonnes Tonnes per K.L American Barrels to Metric
TonnesAviation Spirit 100/130 1421 0.7034 8.94Aviation Spirit 144/145 1449 0.6901 9.11Aviation Spirit 73 ON 1432 0.6983 9.01Motor Spirit 79 ON 1427 0.7008 8.98Motor Spirit 80 ON 1427 0.7008 8.98Motor Spirit 93 ON 1386 0.7215 8.72Motor Spirit 95 ON 1359 0.7358 8.55Motor Spirit 83 ON/87 ON 1411 0.7087 8.88JP-4 1384 0.7225 8.71JP-5 1273 0.7855 8.01Aviation Turbine Fuel 1288 0.7764 8.10Naphtha 1467 0.6817 9.23Power Alcohol 1286 0.7776 8.09Benzol 1154 0.8666 7.26SBP Spirit/Hexane 1457 0.6863 9.16Mineral Turpentine (Laws 140/205) 1302 0.7680 8.19Liquefied Petroleum Gas 1785 0.5602 11.23Superior Kerosene 1285 0.7782 8.08Inferior Kerosene 1265 0.7905 7.96Power Kerosene (Vap. Oil) 1251 0.7994 7.87High Speed Diesel 1210 0.8263 7.61Light Diesel Oil 1172 0.8532 7.37Malarial Oil 1172 0.8532 7.37Special Larvicides 1175 0.8511 7.39Furnace Oil 1071 0.9337 6.74
Tea Drier Oil 1071 0.9337 6.74
Hot Heavy Stock/LSHS 1017 0.9833 6.40
Refinery Gas/Ref. Boiler Fuel 1071 0.9337 6.74Lubricants/Greases 1114 0.8977 7.01
Jute Batching Oil/Wash Oils 1167 C 7.34
Bitumen 1002 0.9980 6.30SBP/Alcohol Mixture 1414 0.7072 8.89Methanol Mixture 1106 0.9042 6.96Carbon Black Feed Stock 1134 0.8818 7.13Carburetor Testing Fluid 1388 0.7205 8.73Benzene 1131 0.8812 7.05Toluene 1148 0.8711 7.19Demineralised Water 1002 0.9930 6.30S. Glass Kleanzit 1003 0.9970 6.31Miscellaneous 1114 0.8977 7.01Wax/P. Coke/Chemicals 1114 0.8977 7.01Aromex 1221 0.8190 7.68Linear Alkyl Benzene Feed Stock 1205 0.8239 7.88
CHAPTER ICHAPTER II
CHAPTER IIICHAPTER IV
CHAPTER VCHAPTER VI
CHAPTER VIICHAPTER VIII
CHAPTER IXCHAPTER X
CHAPTER XIAPPEN
DIX
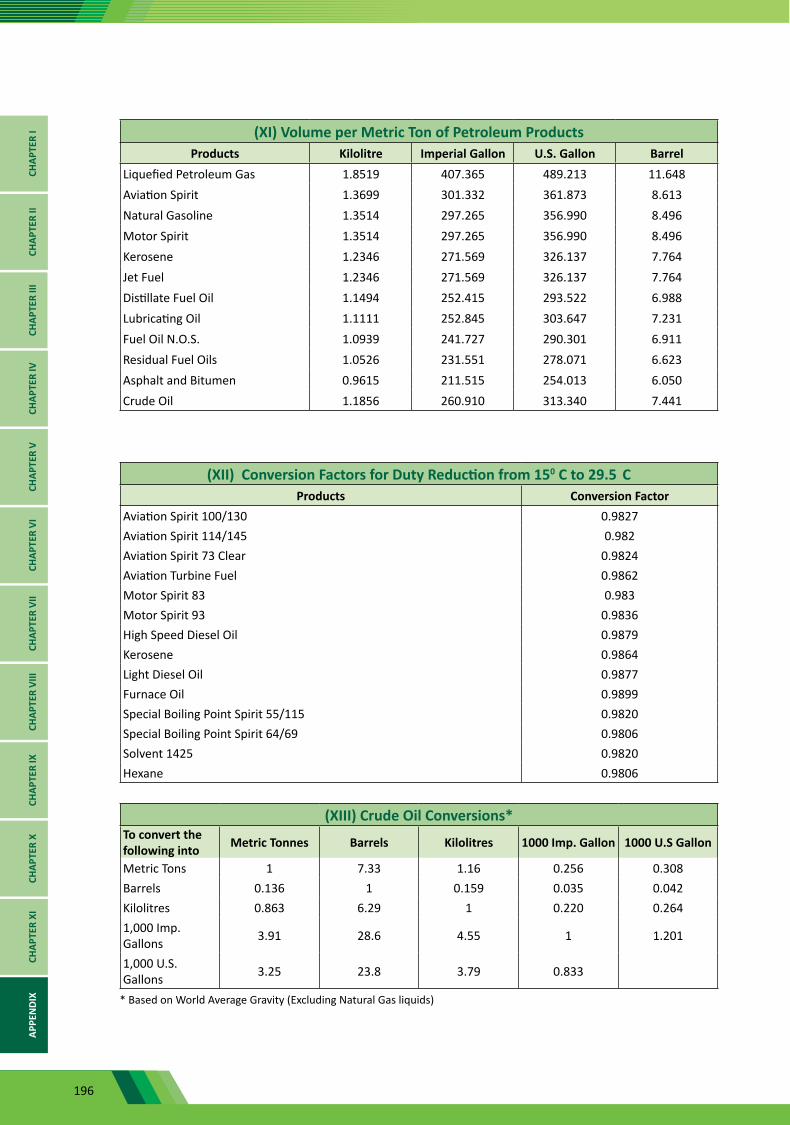
196
(XI) Volume per Metric Ton of Petroleum ProductsProducts Kilolitre Imperial Gallon U.S. Gallon Barrel
Liquefied Petroleum Gas 1.8519 407.365 489.213 11.648Aviation Spirit 1.3699 301.332 361.873 8.613Natural Gasoline 1.3514 297.265 356.990 8.496Motor Spirit 1.3514 297.265 356.990 8.496Kerosene 1.2346 271.569 326.137 7.764Jet Fuel 1.2346 271.569 326.137 7.764Distillate Fuel Oil 1.1494 252.415 293.522 6.988Lubricating Oil 1.1111 252.845 303.647 7.231Fuel Oil N.O.S. 1.0939 241.727 290.301 6.911Residual Fuel Oils 1.0526 231.551 278.071 6.623Asphalt and Bitumen 0.9615 211.515 254.013 6.050Crude Oil 1.1856 260.910 313.340 7.441
(XII) Conversion Factors for Duty Reduction from 150 C to 29.5 CProducts Conversion Factor
Aviation Spirit 100/130 0.9827Aviation Spirit 114/145 0.982Aviation Spirit 73 Clear 0.9824Aviation Turbine Fuel 0.9862Motor Spirit 83 0.983Motor Spirit 93 0.9836High Speed Diesel Oil 0.9879Kerosene 0.9864Light Diesel Oil 0.9877Furnace Oil 0.9899Special Boiling Point Spirit 55/115 0.9820Special Boiling Point Spirit 64/69 0.9806Solvent 1425 0.9820Hexane 0.9806
(XIII) Crude Oil Conversions*To convert the following into Metric Tonnes Barrels Kilolitres 1000 Imp. Gallon 1000 U.S Gallon
Metric Tons 1 7.33 1.16 0.256 0.308Barrels 0.136 1 0.159 0.035 0.042Kilolitres 0.863 6.29 1 0.220 0.2641,000 Imp. Gallons 3.91 28.6 4.55 1 1.201
1,000 U.S. Gallons 3.25 23.8 3.79 0.833
* Based on World Average Gravity (Excluding Natural Gas liquids)
CHAP
TER
ICH
APTE
R II
CHAP
TER
IIICH
APTE
R IV
CHAP
TER
VCH
APTE
R VI
CHAP
TER
VII
CHAP
TER
VIII
CHAP
TER
IXCH
APTE
R X
CHAP
TER
XIAP
PEN
DIX
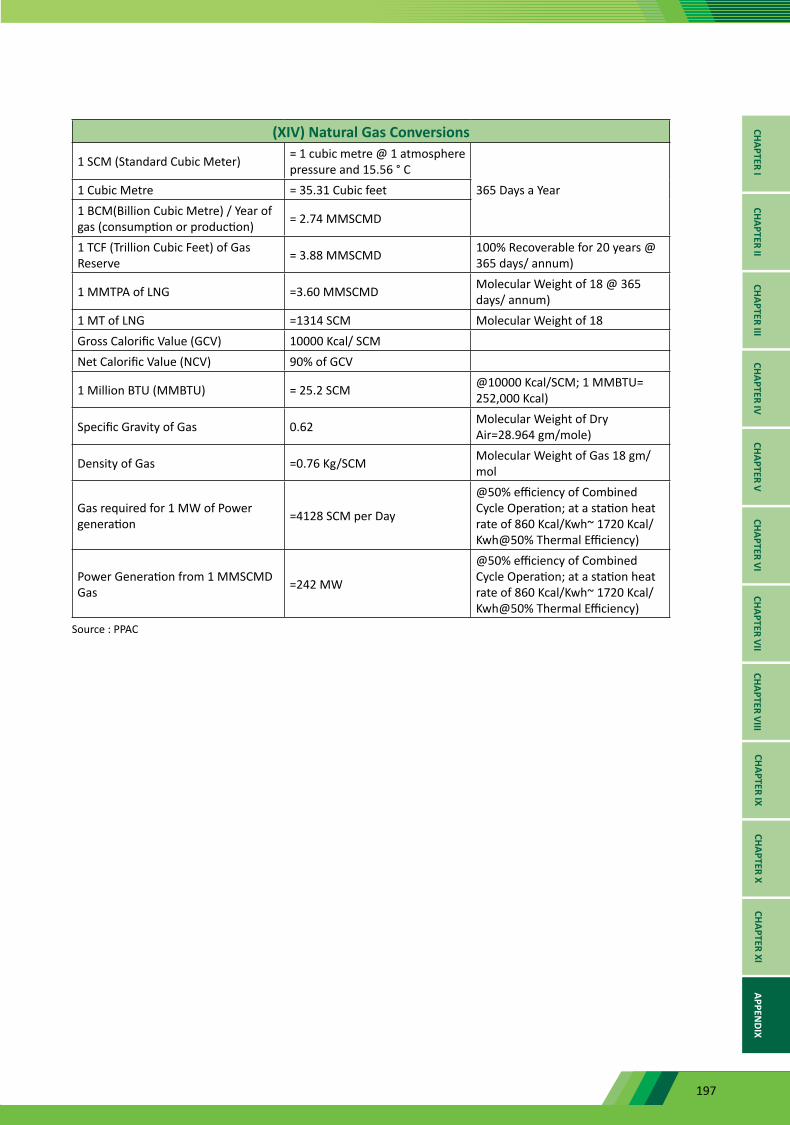
197
(XIV) Natural Gas Conversions
1 SCM (Standard Cubic Meter) = 1 cubic metre @ 1 atmosphere pressure and 15.56 ° C
365 Days a Year1 Cubic Metre = 35.31 Cubic feet1 BCM(Billion Cubic Metre) / Year of gas (consumption or production) = 2.74 MMSCMD
1 TCF (Trillion Cubic Feet) of Gas Reserve = 3.88 MMSCMD 100% Recoverable for 20 years @
365 days/ annum)
1 MMTPA of LNG =3.60 MMSCMD Molecular Weight of 18 @ 365 days/ annum)
1 MT of LNG =1314 SCM Molecular Weight of 18Gross Calorific Value (GCV) 10000 Kcal/ SCMNet Calorific Value (NCV) 90% of GCV
1 Million BTU (MMBTU) = 25.2 SCM @10000 Kcal/SCM; 1 MMBTU= 252,000 Kcal)
Specific Gravity of Gas 0.62 Molecular Weight of Dry Air=28.964 gm/mole)
Density of Gas =0.76 Kg/SCM Molecular Weight of Gas 18 gm/mol
Gas required for 1 MW of Power generation =4128 SCM per Day
@50% efficiency of Combined Cycle Operation; at a station heat rate of 860 Kcal/Kwh~ 1720 Kcal/Kwh@50% Thermal Efficiency)
Power Generation from 1 MMSCMD Gas =242 MW
@50% efficiency of Combined Cycle Operation; at a station heat rate of 860 Kcal/Kwh~ 1720 Kcal/Kwh@50% Thermal Efficiency)
Source : PPAC
CHAPTER ICHAPTER II
CHAPTER IIICHAPTER IV
CHAPTER VCHAPTER VI
CHAPTER VIICHAPTER VIII
CHAPTER IXCHAPTER X
CHAPTER XIAPPEN
DIX
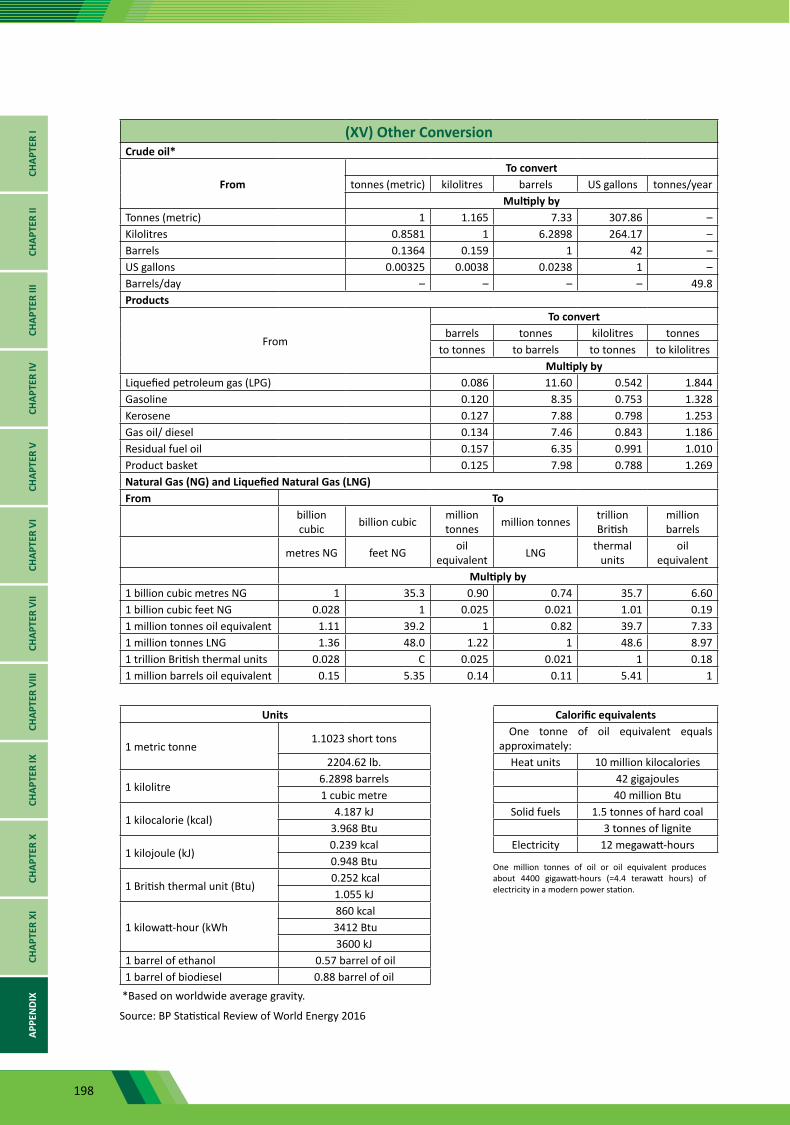
198
(XV) Other ConversionCrude oil*
FromTo convert
tonnes (metric) kilolitres barrels US gallons tonnes/yearMultiply by
Tonnes (metric) 1 1.165 7.33 307.86 –Kilolitres 0.8581 1 6.2898 264.17 –Barrels 0.1364 0.159 1 42 –US gallons 0.00325 0.0038 0.0238 1 –Barrels/day – – – – 49.8Products
From
To convertbarrels tonnes kilolitres tonnes
to tonnes to barrels to tonnes to kilolitresMultiply by
Liquefied petroleum gas (LPG) 0.086 11.60 0.542 1.844Gasoline 0.120 8.35 0.753 1.328Kerosene 0.127 7.88 0.798 1.253Gas oil/ diesel 0.134 7.46 0.843 1.186Residual fuel oil 0.157 6.35 0.991 1.010Product basket 0.125 7.98 0.788 1.269Natural Gas (NG) and Liquefied Natural Gas (LNG)From To
billion cubic billion cubic million
tonnes million tonnes trillion British
million barrels
metres NG feet NG oil equivalent LNG thermal
unitsoil
equivalentMultiply by
1 billion cubic metres NG 1 35.3 0.90 0.74 35.7 6.601 billion cubic feet NG 0.028 1 0.025 0.021 1.01 0.191 million tonnes oil equivalent 1.11 39.2 1 0.82 39.7 7.331 million tonnes LNG 1.36 48.0 1.22 1 48.6 8.971 trillion British thermal units 0.028 C 0.025 0.021 1 0.181 million barrels oil equivalent 0.15 5.35 0.14 0.11 5.41 1
Units Calorific equivalents
1 metric tonne 1.1023 short tons One tonne of oil equivalent equals
approximately:2204.62 lb. Heat units 10 million kilocalories
1 kilolitre6.2898 barrels 42 gigajoules1 cubic metre 40 million Btu
1 kilocalorie (kcal)4.187 kJ Solid fuels 1.5 tonnes of hard coal
3.968 Btu 3 tonnes of lignite
1 kilojoule (kJ)0.239 kcal Electricity 12 megawatt-hours0.948 Btu
1 British thermal unit (Btu) 0.252 kcal
1.055 kJ
1 kilowatt-hour (kWh 860 kcal 3412 Btu3600 kJ
1 barrel of ethanol 0.57 barrel of oil1 barrel of biodiesel 0.88 barrel of oil
*Based on worldwide average gravity.
Source: BP Statistical Review of World Energy 2016
One million tonnes of oil or oil equivalent produces about 4400 gigawatt-hours (=4.4 terawatt hours) of electricity in a modern power station.
CHAP
TER
ICH
APTE
R II
CHAP
TER
IIICH
APTE
R IV
CHAP
TER
VCH
APTE
R VI
CHAP
TER
VII
CHAP
TER
VIII
CHAP
TER
IXCH
APTE
R X
CHAP
TER
XIAP
PEN
DIX
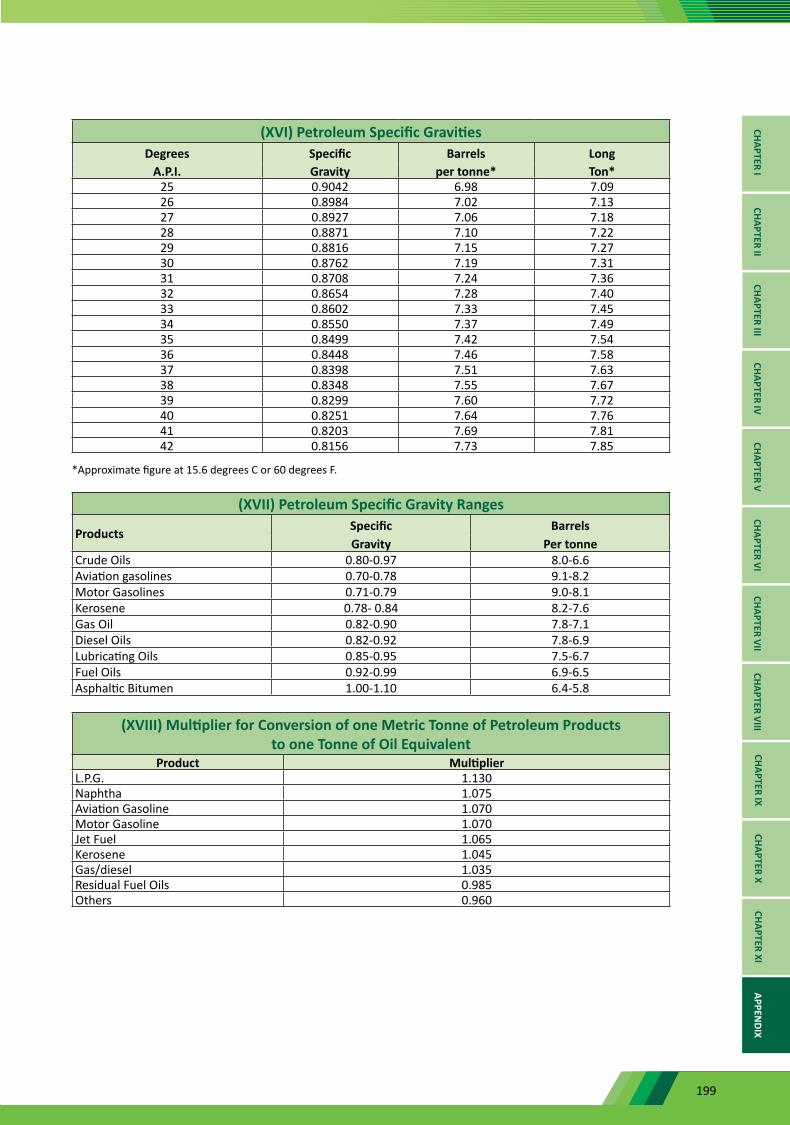
199
(XVI) Petroleum Specific GravitiesDegrees Specific Barrels Long
A.P.I. Gravity per tonne* Ton*25 0.9042 6.98 7.0926 0.8984 7.02 7.1327 0.8927 7.06 7.1828 0.8871 7.10 7.2229 0.8816 7.15 7.2730 0.8762 7.19 7.3131 0.8708 7.24 7.3632 0.8654 7.28 7.4033 0.8602 7.33 7.4534 0.8550 7.37 7.4935 0.8499 7.42 7.5436 0.8448 7.46 7.5837 0.8398 7.51 7.6338 0.8348 7.55 7.6739 0.8299 7.60 7.7240 0.8251 7.64 7.7641 0.8203 7.69 7.8142 0.8156 7.73 7.85
*Approximate figure at 15.6 degrees C or 60 degrees F.
(XVII) Petroleum Specific Gravity Ranges
Products Specific BarrelsGravity Per tonne
Crude Oils 0.80-0.97 8.0-6.6Aviation gasolines 0.70-0.78 9.1-8.2Motor Gasolines 0.71-0.79 9.0-8.1Kerosene 0.78- 0.84 8.2-7.6Gas Oil 0.82-0.90 7.8-7.1Diesel Oils 0.82-0.92 7.8-6.9Lubricating Oils 0.85-0.95 7.5-6.7Fuel Oils 0.92-0.99 6.9-6.5Asphaltic Bitumen 1.00-1.10 6.4-5.8
(XVIII) Multiplier for Conversion of one Metric Tonne of Petroleum Products to one Tonne of Oil Equivalent
Product MultiplierL.P.G. 1.130Naphtha 1.075Aviation Gasoline 1.070Motor Gasoline 1.070Jet Fuel 1.065Kerosene 1.045Gas/diesel 1.035Residual Fuel Oils 0.985Others 0.960
CHAPTER ICHAPTER II
CHAPTER IIICHAPTER IV
CHAPTER VCHAPTER VI
CHAPTER VIICHAPTER VIII
CHAPTER IXCHAPTER X
CHAPTER XIAPPEN
DIX
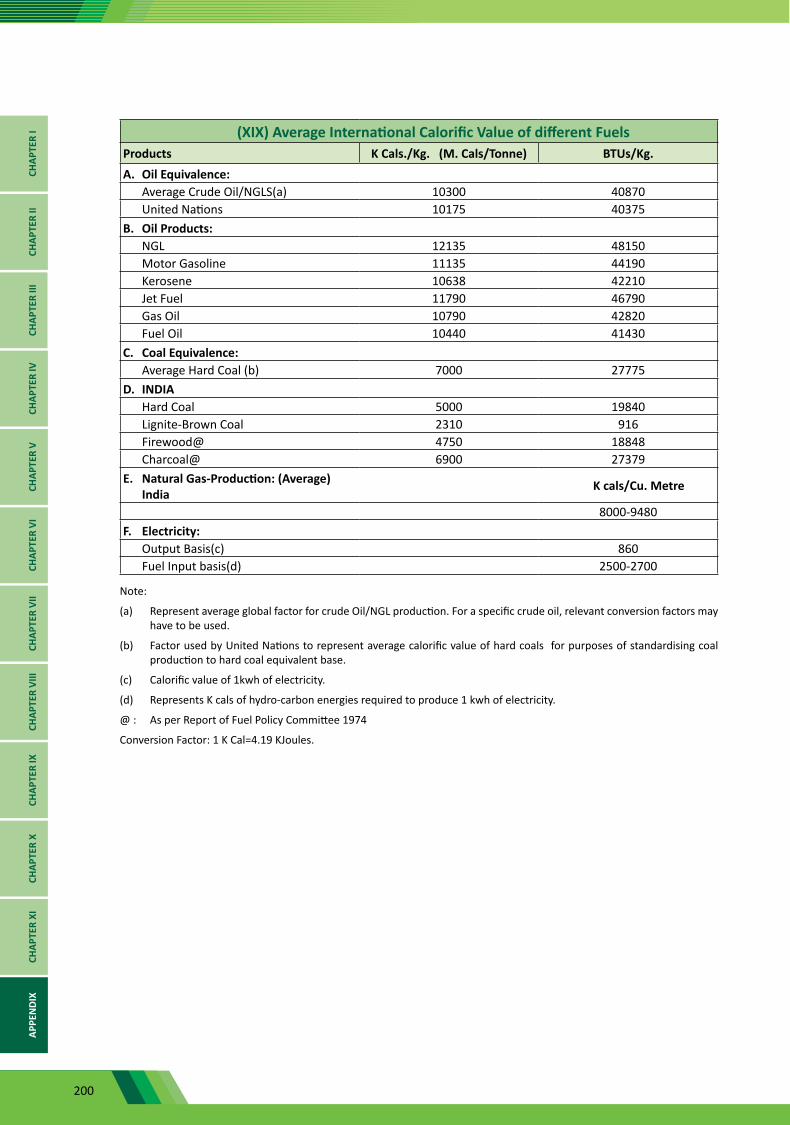
200
(XIX) Average International Calorific Value of different FuelsProducts K Cals./Kg. (M. Cals/Tonne) BTUs/Kg.A. Oil Equivalence:
Average Crude Oil/NGLS(a) 10300 40870United Nations 10175 40375
B. Oil Products:NGL 12135 48150Motor Gasoline 11135 44190Kerosene 10638 42210Jet Fuel 11790 46790Gas Oil 10790 42820Fuel Oil 10440 41430
C. Coal Equivalence:Average Hard Coal (b) 7000 27775
D. INDIAHard Coal 5000 19840Lignite-Brown Coal 2310 916Firewood@ 4750 18848Charcoal@ 6900 27379
E. Natural Gas-Production: (Average) India
K cals/Cu. Metre
8000-9480F. Electricity:
Output Basis(c) 860Fuel Input basis(d) 2500-2700
Note:
(a) Represent average global factor for crude Oil/NGL production. For a specific crude oil, relevant conversion factors may have to be used.
(b) Factor used by United Nations to represent average calorific value of hard coals for purposes of standardising coal production to hard coal equivalent base.
(c) Calorific value of 1kwh of electricity.
(d) Represents K cals of hydro-carbon energies required to produce 1 kwh of electricity.
@ : As per Report of Fuel Policy Committee 1974
Conversion Factor: 1 K Cal=4.19 KJoules.
CHAP
TER
ICH
APTE
R II
CHAP
TER
IIICH
APTE
R IV
CHAP
TER
VCH
APTE
R VI
CHAP
TER
VII
CHAP
TER
VIII
CHAP
TER
IXCH
APTE
R X
CHAP
TER
XIAP
PEN
DIX
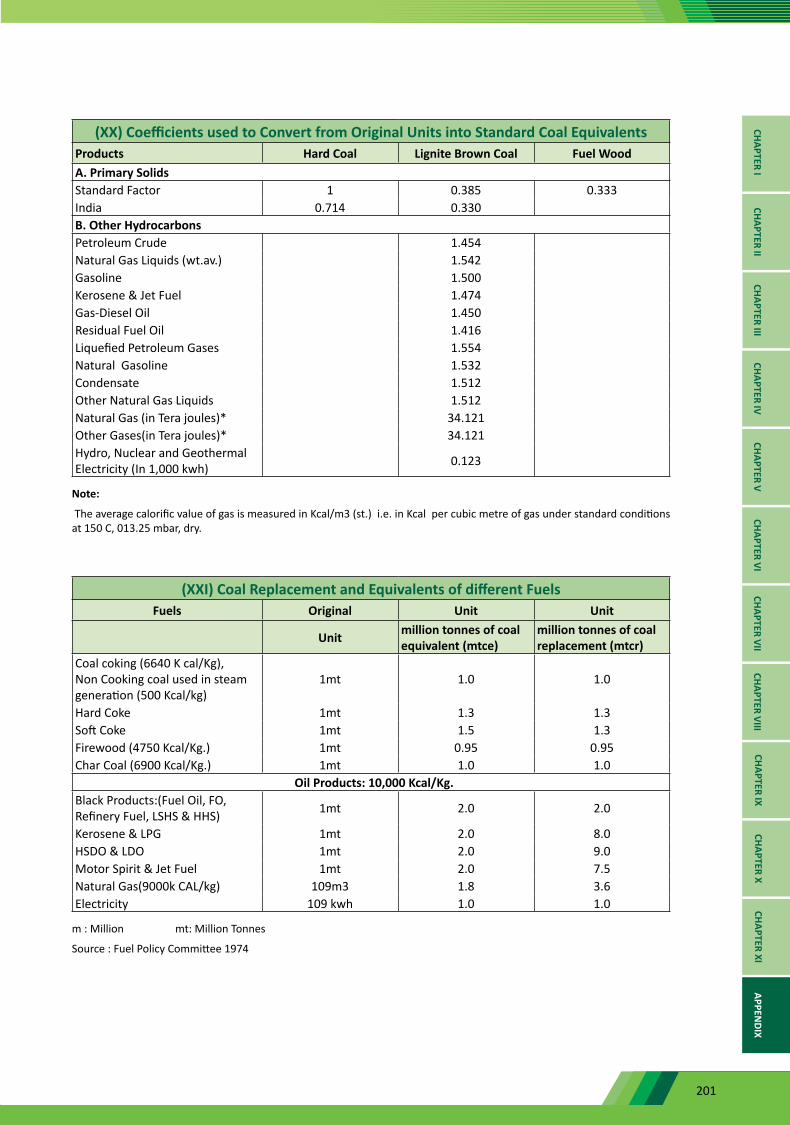
201
(XX) Coefficients used to Convert from Original Units into Standard Coal EquivalentsProducts Hard Coal Lignite Brown Coal Fuel WoodA. Primary SolidsStandard Factor 1 0.385 0.333India 0.714 0.330B. Other HydrocarbonsPetroleum Crude 1.454Natural Gas Liquids (wt.av.) 1.542Gasoline 1.500Kerosene & Jet Fuel 1.474Gas-Diesel Oil 1.450Residual Fuel Oil 1.416Liquefied Petroleum Gases 1.554Natural Gasoline 1.532Condensate 1.512Other Natural Gas Liquids 1.512Natural Gas (in Tera joules)* 34.121Other Gases(in Tera joules)* 34.121Hydro, Nuclear and Geothermal Electricity (In 1,000 kwh) 0.123
Note:
The average calorific value of gas is measured in Kcal/m3 (st.) i.e. in Kcal per cubic metre of gas under standard conditions at 150 C, 013.25 mbar, dry.
(XXI) Coal Replacement and Equivalents of different FuelsFuels Original Unit Unit
Unit million tonnes of coal equivalent (mtce)
million tonnes of coal replacement (mtcr)
Coal coking (6640 K cal/Kg), Non Cooking coal used in steam generation (500 Kcal/kg)
1mt 1.0 1.0
Hard Coke 1mt 1.3 1.3Soft Coke 1mt 1.5 1.3Firewood (4750 Kcal/Kg.) 1mt 0.95 0.95Char Coal (6900 Kcal/Kg.) 1mt 1.0 1.0
Oil Products: 10,000 Kcal/Kg.Black Products:(Fuel Oil, FO, Refinery Fuel, LSHS & HHS) 1mt 2.0 2.0
Kerosene & LPG 1mt 2.0 8.0HSDO & LDO 1mt 2.0 9.0Motor Spirit & Jet Fuel 1mt 2.0 7.5Natural Gas(9000k CAL/kg) 109m3 1.8 3.6Electricity 109 kwh 1.0 1.0
m : Million mt: Million Tonnes
Source : Fuel Policy Committee 1974
CHAPTER ICHAPTER II
CHAPTER IIICHAPTER IV
CHAPTER VCHAPTER VI
CHAPTER VIICHAPTER VIII
CHAPTER IXCHAPTER X
CHAPTER XIAPPEN
DIX
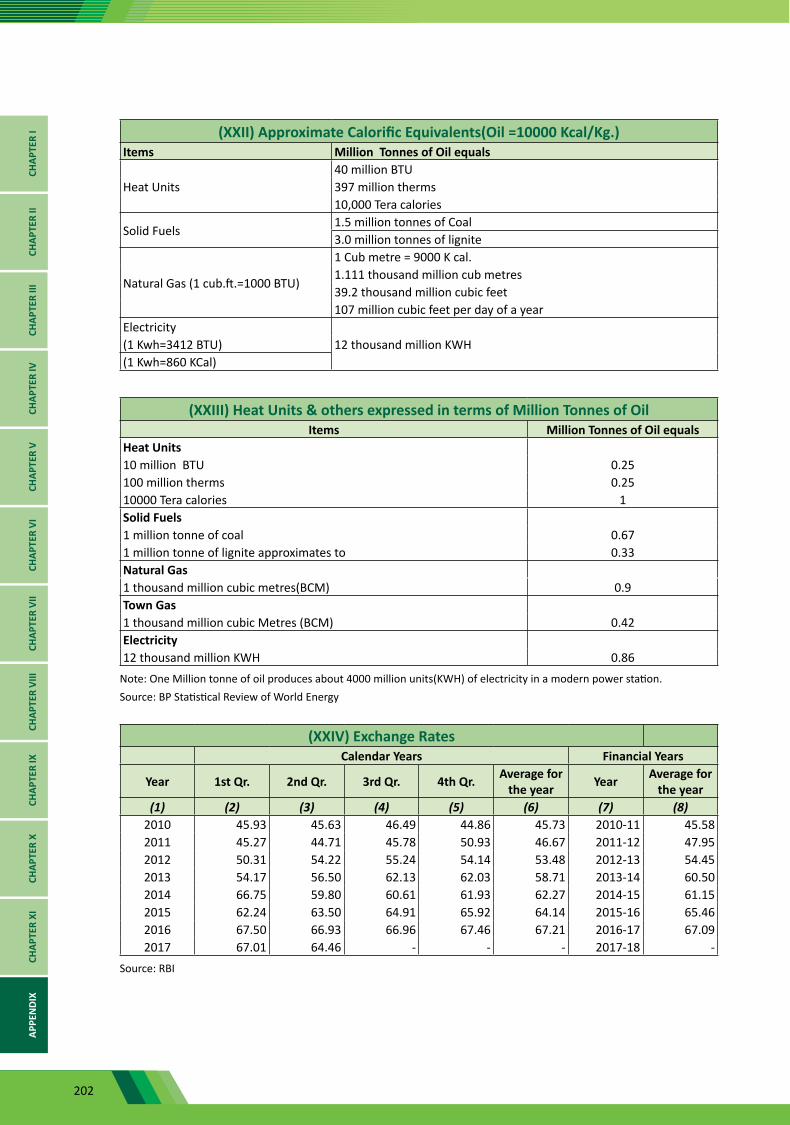
202
(XXII) Approximate Calorific Equivalents(Oil =10000 Kcal/Kg.)Items Million Tonnes of Oil equals
Heat Units 40 million BTU397 million therms10,000 Tera calories
Solid Fuels1.5 million tonnes of Coal3.0 million tonnes of lignite
Natural Gas (1 cub.ft.=1000 BTU)
1 Cub metre = 9000 K cal.1.111 thousand million cub metres39.2 thousand million cubic feet107 million cubic feet per day of a year
Electricity12 thousand million KWH (1 Kwh=3412 BTU)
(1 Kwh=860 KCal)
(XXIII) Heat Units & others expressed in terms of Million Tonnes of OilItems Million Tonnes of Oil equals
Heat Units10 million BTU 0.25100 million therms 0.2510000 Tera calories 1Solid Fuels1 million tonne of coal 0.671 million tonne of lignite approximates to 0.33Natural Gas1 thousand million cubic metres(BCM) 0.9Town Gas1 thousand million cubic Metres (BCM) 0.42Electricity12 thousand million KWH 0.86
Note: One Million tonne of oil produces about 4000 million units(KWH) of electricity in a modern power station. Source: BP Statistical Review of World Energy
(XXIV) Exchange RatesCalendar Years Financial Years
Year 1st Qr. 2nd Qr. 3rd Qr. 4th Qr. Average for the year Year Average for
the year(1) (2) (3) (4) (5) (6) (7) (8)
2010 45.93 45.63 46.49 44.86 45.73 2010-11 45.582011 45.27 44.71 45.78 50.93 46.67 2011-12 47.952012 50.31 54.22 55.24 54.14 53.48 2012-13 54.452013 54.17 56.50 62.13 62.03 58.71 2013-14 60.502014 66.75 59.80 60.61 61.93 62.27 2014-15 61.152015 62.24 63.50 64.91 65.92 64.14 2015-16 65.462016 67.50 66.93 66.96 67.46 67.21 2016-17 67.092017 67.01 64.46 - - - 2017-18 -
Source: RBI
CHAP
TER
ICH
APTE
R II
CHAP
TER
IIICH
APTE
R IV
CHAP
TER
VCH
APTE
R VI
CHAP
TER
VII
CHAP
TER
VIII
CHAP
TER
IXCH
APTE
R X
CHAP
TER
XIAP
PEN
DIX
203
DEFINITIONSCrude Oil: Crude oil is a mineral oil consisting of a mixture of hydrocarbons of natural origin and associated impurities, such as sulphur. It exists in the liquid phase under normal surface temperature and pressure and its physical characteristics (density, viscosity, etc.) are highly variable.
Natural Gas: It comprises gases, occurring in underground deposits, whether liquefied or gaseous, consisting mainly of methane. It includes both “non associated” gas originating from fields producing hydrocarbons only in gaseous form, and “associated” gas produced in association with crude oil as well as methane recovered from coal mines (colliery gas).
Condensate: Condensate means low vapour pressure hydrocarbons obtained from Natural Gas through condensation or extraction and refer solely to those hydrocarbons that are liquid at normal surface temperature and pressure conditions.
Reservoir: Reservoir means a naturally occurring discrete accumulation of Petroleum.
Oil Field: Oil Field means, within the Contract Area, an Oil Reservoir or a group of Oil Reservoirs within a common geological structure or feature.
Gas Field: Gas Field means, within the Contract Area, a Natural Gas Reservoir or a group of Natural Gas Reservoirs within a common geological structure or feature.
Reserves: Amount of crude oil (or gas) expected to be recovered profitably from a given reservoir by known techniques under known or assumed economic conditions.
Discovery: Discovery means the finding, during Petroleum Operations, of a deposit of Petroleum not previously known to have existed, which can be recovered at the surface in a flow measurable by petroleum industry testing methods.
Exploration Well: Well drilled for the purpose of searching for undiscovered Petroleum accumulations on any geological entity (be it of structural, stratigraphic, facies or pressure nature) to at least a depth or stratigraphic level specified in the Work Programme.
Development Well: Well means a Well drilled, deepened or completed after the date of approval of the Development Plan pursuant to Development Operations or Production Operations for the purposes of producing Petroleum, increasing production, sustaining production or accelerating extraction of Petroleum including production Wells, injection Wells and dry Wells.
Oil Refinery: It converts crude oil into high-octane motor fuel (gasoline/petrol), diesel oil, liquefied petroleum gases (LPG), jet aircraft fuel, kerosene, heating fuel oils, lubricating oils, asphalt and petroleum coke, etc.
Refinery feedstock: Refinery feedstock is product or a combination of products derived from crude oil and destined for further processing other than blending in the refining industry. It is transformed into one or more components and/or finished products.
Petroleum Products: Petroleum products are any oil based products which can be obtained by distillation and are normally used outside the refining industry. The exceptions to this are those finished products which are classified as refinery feedstocks
Distillate: Any product obtained by condensation of the vapours of a petroleum product when it is distilled under atmospheric pressure or under reduced pressure.

204
Light distillate: Naphthas and gasolines boiling below 2300C) at normal atmospheric pressure, and with a closedcup flash point below ambient temperature.
Middle Distillate: Kerosenes and gas oils boiling between approximately 1500C and 4000C at normal atmospheric pressure and having a closed-cup flash point above 380C.
Heavy Distillate: Distillate boiling predominately above 3500C at normal atmospheric pressure, it includes the heaviest fractions from atmospheric distillation, together with the distillate fractions obtained by vacuum distillation.
Motor gasoline: Motor gasoline consists of a mixture of light hydrocarbons distilling between 35°C and 215°C. It is used as a fuel for land-based spark ignition engines. Motor gasoline may include additives, oxygenates and octane enhancers, including lead compounds such as TEL (Tetraethyl lead) and TML (tetramethyl lead). Motor gasoline can be divided into two groups:
• Unleaded motor gasoline: motor gasoline where lead compounds have not been added to enhance octane rating. It may contain traces of organic lead.
• Leaded motor gasoline: motor gasoline with TEL (tetraethyl lead) and/or TML (tetramethyl lead) added to enhance octane rating. This category includes motor gasoline blending components (excluding additives/oxygenates), e.g. alkylates, isomerate, reformate, cracked gasoline destined for use as finished motor gasoline.
Diesel/Gasoil : Petroleum derived diesel (called as petrodiesel) is a mixture of straight run product (150°C and 350°C) with varying amount of selected cracked distillates and is composed of saturated hydrocarbons (primarily paraffins including n, iso, and cycloparaffins), and aromatic hydrocarbons (including napthalenes and alkylbenzenes). Diesel is used in diesel engines, a type of internal combustion engine.
Automotive diesel fuel serves to power trains, buses, trucks, and automobiles, to run construction, petroleum drilling and other off-road equipment and to be the prime mover in a wide range of power generation & pumping applications. The diesel engine is high compression, self-ignition engine. Fuel is ignited by the heat of high compression and no spark plug is used.
Kerosene : Kerosenes are distillate fractions of crude oil in the boiling range of 150-250°C. They are treated mainly for reducing aromatic content to increase their smoke point (height of a smokeless flame)
and hydrofining to reduce sulphur content and to improve odour, colour & burning qualities (char value). Kerosene is used as a domestic fuel for heating / lighting and also for manufacture of insecticides/herbicides/fungicides to control pest, weeds and fungi. Since kerosene is less volatile than gasoline, increase in its evaporation rate in domestic burners is achieved by increasing surface area of the oil to be burned and by increasing its temperature. The two types of burners which achieve this fall into two categories namely vaporisers & atomizers
Liquefied Petroleum Gas (LPG): LPG is light paraffinic hydrocarbons derived from the refinery processes, crude oil stabilisation and natural gas processing plants. This consists mainly of propane (C3H8) and butane (C4Hl0) or a combination of the two. It could also include propylene, butylene, isobutene and isobutylene. LPG is normally liquefied under pressure for transportation and storage.
Lubricants: Lubricants are hydrocarbons produced from distillate by-products; they are mainly used to reduce friction between bearing surfaces. This category includes all finished grades of lubricating
205
oil, from spindle oil to cylinder oil, and those used in greases, including motor oils and all grades of lubricating oil base stocks.
Fuel oil: This covers all residual (heavy) fuel oils (including those obtained by blending). Kinematic viscosity is above 10 cSt at 80°C. The flash point is always above 50°C and density is always more than 0.90 kg/l.
• Low sulphur content: heavy fuel oil with sulphur content lower than 1%.
• High sulphur content: heavy fuel oil with sulphur content of 1% or higher.
Liquefied Natural Gas (LNG): Natural gas cooled to approximately –160°C under atmospheric pressure
condenses to its liquid form called LNG. LNG is odourless, colourless, noncorrosive and non-toxic.
Compressed Natural Gas (CNG): CNG is natural gas for use in special CNG vehicles, where it is stored in high-pressure fuel cylinders. CNG’s use stems in part from its clean burning properties, as it produces fewer exhaust and greenhouse gas emissions than motor gasoline or diesel oil. It is used most frequently in light-duty passenger vehicles and pickup trucks, medium-duty delivery trucks, and in transit and school buses.
Natural Gas Liquids (NGL): Natural gas liquids are liquid or liquefied hydrocarbons recovered from natural gas in separation facilities or gas processing plants. Natural gas liquids include ethane, propane, butane (normal and iso-), (iso)pentane and pentanes plus (sometimes referred to as natural gasoline or plant condensate).
The natural gas may be extracted with crude oil (associated gas) or from a gas field without crude oil. The NGL may be removed from the natural gas stream close to the well-head or transported to a distant gas processing plant. Where gas processing and crude oil production are both occurring, it is common for some of the condensate fraction of the NGL to be injected into the crude oil stream.
Petroleum coke: Petroleum coke is a black solid by-product, obtained mainly by cracking and carbonising petroleum-derived feedstock, vacuum bottoms, tar and pitches in processes such as delayed coking or fluid coking. It consists mainly of carbon (90% to 95%) and has a low ash content. It is used as a feedstock in coke ovens for the steel industry, for heating purposes, for electrode manufacture and for production of chemicals. The two most important qualities are “green coke” and “calcinated coke”. This category also includes “catalyst coke” deposited on the catalyst during refining processes; this coke is not recoverable and is usually burned as refinery fuel.
Refinery gas (not liquefied): Refinery gas includes a mixture of non-condensable gases mainly consisting of hydrogen, methane, ethane and olefins obtained during distillation of crude oil or treatment of oil products (e.g. cracking) in refineries. This also includes gases which are returned from the petrochemical industry.
Flared Gas: Flared Gas at oil production rigs and in refineries is gas burnt at the site. Its primary purpose is to act as a safety device to protect vessels or pipes from over-pressuring or due to insufficient capacity in the domestic market to absorb such gas, and there are few opportunities for its safe re-injection into reservoirs.
Percentage Gas flared: Gas flared as percentage of total output of gas, excluding re-inject gas.
Source: Bureau of Indian Standards, Manual on Infrastructure Statistics (CSO), Director General of Hydrocarbons, oil & gas CPSEs.

206