Control Theoretic Optimization of 802.11 WLANs: Implementation and Experimental Evaluation
18
Control Theoretic Optimization of 802.11 WLANs: Implementation and Experimental Evaluation Pablo Serrano a,* , Paul Patras b , Andrea Mannocci c,a , Vincenzo Mancuso c,a , Albert Banchs a,c a University Carlos III de Madrid, Spain b Hamilton Institute, Ireland c Institute IMDEA Networks, Spain Abstract In 802.11 WLANs, adapting the contention parameters to network conditions results in substantial performance improvements. Even though the ability to change these parameters has been available in standard devices for years, so far no adaptive mechanism using this functionality has been validated in a realistic deployment. In this paper we report our experiences with implementing and evaluating two adaptive algorithms based on control theory, one centralized and one distributed, in a large- scale testbed consisting of 18 commercial off-the-shelf devices. We conduct extensive measurements, considering different network conditions in terms of number of active nodes, link qualities, and data traffic. We show that both algorithms significantly outperform the standard configuration in terms of total throughput. We also identify the limitations inherent in distributed schemes, and demonstrate that the centralized approach substantially improves performance under a large variety of scenarios, which confirms its suitability for real deployments. Keywords: WLAN, 802.11, Control Theory, Experimentation 1. Introduction The IEEE 802.11 standard for Wireless LANs [1] has become one of the most commonly used tech- nologies to provide broadband connectivity to the Internet. The default channel access mechanism employed in IEEE 802.11 networks is based on a CSMA/CA scheme, regulated by a set of parame- ters that determines the aggressiveness of the sta- tions when trying to access the channel. In par- ticular, the contention window (CW ) parameter controls the probability that a station defers or transmits a frame once the medium has become idle, and therefore has a key impact on the WLAN performance. * Corresponding author: Universidad Carlos III de Madrid, Avenida de la Universidad 30, E-28911 Legan´ es, Madrid, Spain, Tel: +34 91-624-6236, Fax: +34 91-624- 8749. E-mail: [email protected] Commercial devices implement a fixed CW configuration, which is known to yield subopti- mal performance [2]. Indeed, for a fixed CW , if too many stations contend the collision rate will be very high, while if few stations are back- logged the channel will be underutilized most of the time. This behavior has been analyzed by sev- eral works in the literature, e.g. [2, 3, 4], which have shown that adapting the CW to the num- ber of backlogged stations significantly improves performance. Following the above result, an overwhelming number of solutions have proposed to adapt the 802.11 MAC behavior to the observed network conditions with the goal of maximizing the WLAN performance [5, 6, 7, 8, 9, 10, 11, 12, 13, 14, 15]. However, as we detail in the related work section, these previous works suffer from both theoretical and practical limitations. Preprint submitted to Computer Networks September 4, 2012
Transcript of Control Theoretic Optimization of 802.11 WLANs: Implementation and Experimental Evaluation

Control Theoretic Optimization of 802.11 WLANs: Implementation and
Experimental Evaluation
Pablo Serranoa,∗, Paul Patrasb, Andrea Mannoccic,a, Vincenzo Mancusoc,a, Albert Banchsa,c
aUniversity Carlos III de Madrid, SpainbHamilton Institute, Ireland
cInstitute IMDEA Networks, Spain
Abstract
In 802.11 WLANs, adapting the contention parameters to network conditions results in substantialperformance improvements. Even though the ability to change these parameters has been available instandard devices for years, so far no adaptive mechanism using this functionality has been validatedin a realistic deployment. In this paper we report our experiences with implementing and evaluatingtwo adaptive algorithms based on control theory, one centralized and one distributed, in a large-scale testbed consisting of 18 commercial off-the-shelf devices. We conduct extensive measurements,considering different network conditions in terms of number of active nodes, link qualities, and datatraffic. We show that both algorithms significantly outperform the standard configuration in terms oftotal throughput. We also identify the limitations inherent in distributed schemes, and demonstratethat the centralized approach substantially improves performance under a large variety of scenarios,which confirms its suitability for real deployments.
Keywords: WLAN, 802.11, Control Theory, Experimentation
1. Introduction
The IEEE 802.11 standard forWireless LANs [1]has become one of the most commonly used tech-nologies to provide broadband connectivity to theInternet. The default channel access mechanismemployed in IEEE 802.11 networks is based on aCSMA/CA scheme, regulated by a set of parame-ters that determines the aggressiveness of the sta-tions when trying to access the channel. In par-ticular, the contention window (CW ) parametercontrols the probability that a station defers ortransmits a frame once the medium has becomeidle, and therefore has a key impact on the WLANperformance.
∗Corresponding author: Universidad Carlos III deMadrid, Avenida de la Universidad 30, E-28911 Leganes,Madrid, Spain, Tel: +34 91-624-6236, Fax: +34 91-624-8749. E-mail: [email protected]
Commercial devices implement a fixed CWconfiguration, which is known to yield subopti-mal performance [2]. Indeed, for a fixed CW ,if too many stations contend the collision ratewill be very high, while if few stations are back-logged the channel will be underutilized most ofthe time. This behavior has been analyzed by sev-eral works in the literature, e.g. [2, 3, 4], whichhave shown that adapting the CW to the num-ber of backlogged stations significantly improvesperformance.
Following the above result, an overwhelmingnumber of solutions have proposed to adapt the802.11 MAC behavior to the observed networkconditions with the goal of maximizing theWLANperformance [5, 6, 7, 8, 9, 10, 11, 12, 13, 14, 15].However, as we detail in the related work section,these previous works suffer from both theoreticaland practical limitations.
Preprint submitted to Computer Networks September 4, 2012

In this paper, we present our experiences withthe implementation of two adaptive algorithms,namely the Centralized Adaptive Control (CAC)[16] and the Distributed Adaptive Control (DAC)[17], both based on a Proportional Integrator (PI)controller that dynamically tunes the CW config-uration to optimize performance. In contrast toprevious proposals [5, 6, 7, 8, 9, 10, 11, 12, 13, 18,14, 15], both algorithms are supported by solidtheoretical foundations from control theory andcan be easily implemented with unmodified ex-isting devices. Further, as compared to the fewexisting implementations of adaptive MAC mech-anisms that require complete interface redesignand enhanced computational capabilities [15] orrely on proprietary firmware code and are tightto a specific platform [18], our prototypes can bedeployed with off-the-shelf devices, demand min-imal system resources and do not alter the net-working stack, as they are executed as userlandprocesses.
CAC and DAC have been carefully designedfollowing detailed performance analyses of 802.11and employing control-theoretic techniques, to en-sure both optimal performance and system stabil-ity. While previous simulation results illustratethe benefits of these algorithms [16, 17], in thispaper we demonstrate the feasibility of runningthese mechanisms on real devices, and extensivelyassess their behavior in a real deployment undera wide range of network conditions.
First, we provide a detailed description of theimplementation of our adaptive mechanisms withcommodity hardware and open-source drivers. Thealgorithms run as user space applications and relyon standardized system calls to estimate the con-tention level in the WLAN and adjust the CWconfiguration of 802.11 stations. We also provideinsights into the differences between the theoreti-cal design and the practical implementation of thealgorithms, which arose with the inherent limita-tions of the real devices. Second, by conductingexhaustive experiments in a large-scale testbedconsisting of 18 devices, which is able to emu-late realistic deployments such as office environ-ment, seminar room, etc., we evaluate the per-formance of our proposals under non-ideal chan-
nel effects and different traffic conditions. Addi-tionally, we compare the performance of our algo-rithms against the default IEEE 802.11 configura-tion, and identify those scenarios where a networkdeployment can benefit from using such adaptivemechanisms.
Our results confirm that both approaches out-perform the standard’s default scheme, improvingthe performance by up to 50%. Our experimentsalso reveal that the distributed algorithm suffersfrom a number of problems with heterogeneousradio links, which are inherent in its distributednature and the limitations of the wireless inter-faces. In contrast, the centralized scheme exhibitsremarkable performance under a wide variety ofnetwork conditions. The conclusions drawn fromour analysis prove the feasibility of using adap-tive MAC mechanisms in realistic scenarios andprovide valuable insights for their design.
The remainder of the paper is organized asfollows. Section 2 summarizes the IEEE 802.11EDCA protocol and the underlying principles ofCAC and DAC. Section 3 details the implemen-tation of the functionality comprised by the pro-posed schemes. Section 4 describes our testbedand Section 5 validates the implementation of thealgorithms. Section 6 presents a thorough exper-imental study of the algorithms in a wide set ofnetwork conditions. Finally, Section 7 summa-rizes the related work and Section 8 concludes thepaper.
2. Background
This section summarizes the behavior of IEEE802.11 EDCA [1] and the two adaptive protocolsimplemented in this paper.
2.1. IEEE 802.11 EDCA
The IEEE 802.11 Enhanced Distributed Chan-nel Access (EDCA) mechanism [1] is a CSMA/CA-based protocol that operates as follows. If a sta-tion with a new frame to transmit senses the chan-nel idle for a period of time equal to the arbitra-tion interframe space parameter (AIFS), the sta-tion transmits. Otherwise, if the channel is busy(either immediately or during the AIFS period),
2

R=0 R=1R=0 collisionother station R=0
U[0,CWmin-1] U[0,CWmin-1] U[0,CWmin-1]U[0,2xCWmin-1]
Figure 1: Retry flag marking upon collisions.
the station continues to monitor the channel untilit is sensed idle for an AIFS interval, and thenexecutes a backoff process.
Upon starting the backoff process, stations com-pute a random integer uniformly distributed inthe range [0, CW − 1], and initialize their back-off time counter with this value. The CW valueis called the contention window, and depends onthe number of failed transmission attempts. Forthe first transmission attempt the minimum con-tention window (CWmin) is used. In case of a col-lision, its value doubles, up to a maximum valueCWmax. The backoff time counter is decrementedonce every time slot if the channel is sensed idle,frozen when a transmission is detected on thechannel, and reactivated when the channel is sensedidle again for an AIFS time. When the backofftime counter reaches zero, the station transmitsits frame in the next time slot.
When two or more stations start transmittingsimultaneously, a collision occurs. Acknowledg-ment (ACK) frames are used to notify a transmit-ting station of successfully received frames. In thecase of a failed transmission, the station doublesits CW and reenters the backoff process. Oncea frame has been successfully transmitted or theretry limit has been exceeded, the CW value is setagain to CWmin. To prevent duplicates, the stan-dard uses a retry flag R to mark those frames thatare being retransmitted, i.e., the flag is set to 0on the first transmission attempt, and set to 1 onevery retransmission (see Fig. 1). As we discusslater, our algorithms exploit this functionality toinfer the network conditions and adapt the CWof the stations accordingly.
To support service differentiation, EDCA im-plements different access categories (ACs) at ev-ery station, each having a different backoff con-figuration. The parameters of each AC are an-
nounced by the Access Point using the BeaconFrames. In the rest of the paper we do not con-sider service differentiation and assume that allstations only execute the Best Effort AC.
2.2. Optimal Point of Operation of the WLAN
Both CAC and DAC share the goal of ad-justing the CW to drive the WLAN to the op-timal point of operation that maximizes the to-tal throughput given the observed network condi-tions. Let p denote the probability that a trans-mission attempt collides. Following the work of[2], that derives the optimal transmission proba-bility τopt, the corresponding optimal conditionalcollision probability can be computed as
pcol = 1− (1− τopt)n−1 = 1−
(
1−1
n
√
2Te
Tc
)n−1
,
(1)which, following [16, 17], can be approximated forlarge n by
popt ≈ 1− e−
√
2Te
Tc , (2)
where Te is the duration of an idle slot (a PHYlayer constant) and Tc is the average duration ofa collision. Further, previous simulations demon-strate that this approximation does not impactthe performance even when n is small [16, 17].Therefore, popt does not depend on the numberof stations, but only on the average duration of acollision Tc, i.e.,
Tc = TPLCP +L
C+ EIFS. (3)
where TPLCP is the duration of the Physical LayerConvergence Protocol (PLCP) preamble and header,C is the modulation rate, EIFS is a PHY layerconstant and L denotes the frame length.1
2.3. Centralized Adaptive Control Algorithm
The Centralized Adaptive Control (CAC) al-gorithm [16], illustrated in Fig. 2, is based on a
1The duration of a collision is given by the longestpacket involved in a collision. For simplicity, here we con-sider a fixed frame length, but the analysis can be easilyextended for the case of different frame sizes following [4].
3

WLAN
PI Controller�
-popt
z-1pobs
+
CWmin
AP
STA 1
STA 2
STA N
Sniffer
Figure 2: CAC algorithm.
PI controller located at the Access Point (AP).This controller computes the configuration of theCWmin parameter as an integer ranging betweenthe default minimum and maximum values de-fined by the standard specification, while CWmax
is set as CWmax = 2mCWmin, following the stan-dard binary exponential backoff procedure.2 Byadjusting the CW configuration to be used by thestations, the AP controls the collision probabilityin the WLAN, with the goal of driving the net-work to the optimal point of operation that max-imizes throughput.
Following the above, the controller performstwo tasks every beacon interval (approx. 100 ms)3:(i) it estimates the current point of operation ofthe WLAN as given by the observed collision prob-ability pobs, and (ii) based on this estimation andpopt, it computes the CW configuration to be usedduring the next beacon interval and sends it to thestations in a beacon frame.
The computation of pobs is based on the ob-servation of the retry flag of successful frames.Let us denote by R1 (R0) the number of observedframes with the retry bit set (unset) during a bea-con interval. Assuming that no frames exceedthe retry limit given by the MAX RETRY parame-ter,4 and that transmission attempts collide with
2In our experiments we use the PHY layer parametersof IEEE 802.11a, hence m = 6 is chosen.
3This is the default beacon interval value recommendedby the 802.11 specification and standard compliant devicesmust be able to update their configuration with this fre-quency. Existing devices support setting this parameterto different values, however larger values may slow the re-action to network changes.
4Note that this assumption is accurate as in an opti-
a constant and independent probability,5 the ob-served probability of a collision in the WLAN canbe estimated with (see [16]):
pobs =R1
R0 +R1
, (4)
which can also be seen as the probability that thefirst transmission attempt from a station collides.Given the short length of a frame transmissionrelative to the beacon interval, on average therewill be a large number of samples to accuratelycompute pobs. Still, in order to prevent inaccura-cies, if the number of available samples of R0 andR1 is smaller than 20, the update is deferred untilthe next beacon, which results in a good accuracyfor our purposes as experiments demonstrate.
To calculate the new CWmin, CAC employs aPI controller that takes as input an error signal e,computed as the difference between the observedcollision probability pobs and the target value popt:
e = pobs − popt. (5)
In this way, when the observed collision prob-ability is above the target value, the error sig-nal will be positive and trigger an increase of theCWmin, and consequently a decrease of the colli-sion rate in the next beacon interval. Similarly,when the collision probability is below the targetvalue, CWmin is decreased in order to increase theactivity on the channel. The operation of CAC issummarized in Algorithm 1.
The {KP , KI} parameters of the PI controllerare obtained using the Ziegler-Nichols rules, toachieve a proper trade-off between stability andspeed of reaction to changes. Specifically, theseare computed as Kp = 0.4Ku, respectively Ki =Kp/(0.85Ti), where Ku is the Kp value that turnsthe system unstable when Ki = 0 and Ti is the os-cillation period under these conditions [19]. Then,Kp and Ki are configured as follows:
mally configured WLAN the collision probability is verylow.
5This assumption has been widely used and shown tobe accurate, see e.g. [2].
4

Algorithm 1 Centralized Adaptive Control algo-rithm.1: while true do
2: repeat
3: if new frame sniffed then
4: retrieve retry flag5: if retry flag is set then6: Increment R1
7: else
8: Increment R0
9: end if
10: end if
11: until new beacon interval12: compute pobs[t] using (4)13: e[t] = pobs[t]− popt14: CWmin[t] = CWmin[t− 1] +KP · e[t]+15: +(KI −KP ) · e[t− 1]16: send beacon with new CW configuration17: end while
KP =0.8
p2opt(1 + popt∑m−1
k=0 (2popt)k);
KI =0.4
0.85 · p2opt(1 + popt∑m−1
k=0 (2popt)k).
(6)
The detailed computation of the {KP , KI} pa-rameters and the proof that the system behavesstably with this configuration are given in [16].
2.4. Distributed Adaptive Control Algorithm
The Distributed Adaptive Control (DAC) algo-rithm [17] employs an independent PI controllerat each station to compute its CW configuration,to drive the overall collision probability to the tar-get value popt. As illustrated in Fig. 3, each con-troller computes the CWmin value employed byits Network Interface Card (NIC), based on thelocally observed network conditions. Similarly toCAC, CWmax is set as CWmax = 2mCWmin.
While with centralized approaches all stationsuse the same configuration provided by a singleentity, and therefore fairly share the channel, withdistributed approaches this is not necessarily thecase. Indeed, given that the collision probability
WLAN
PI Controller�
-popt
z-12·pobs,1 - pown,1
+
APSTA 1
STA N
PI Controller�
-popt
z-12·pobs,N - pown,N
+
CWmin,N
NIC
Sniffer &Stats collector
CWmin,1
NIC
Sniffer &Stats collector
Figure 3: DAC algorithm.
in a network of n stations is p = 1−∏n
i=1(1− τi),in general there are multiple (τ1, ..., τn) solutionsthat satisfy p = popt, with τi 6= τj. These solutionsmaximize the total network throughput but resultin dissimilar allocations among stations. There-fore, to guarantee a fair throughput distribution,the error signal utilized in DAC consists of twoterms: one to drive the WLAN to the desiredpoint of operation, and another one to achievefairness between stations. More specifically, theerror signal at station i is given by
ei = ecollision,i + efairness,i. (7)
The first term of (7) ensures that the collisionprobability in the network is driven to the targetvalue:
ecollision,i = pobs,i − popt, (8)
where pobs,i denotes the collision probability asmeasured by station i. When the collision prob-ability observed by station i is larger than thetarget value, the above term yields a positive er-ror that increases the CW of station i, therebyreducing the collision probability.
The second term of (7) is computed as
efairness,i = pobs,i − pown,i, (9)
where pown,i is the collision probability experi-enced by station i. The purpose of this secondcomponent of ei is to drive the CW of all sta-tions to the same value. Indeed, the higher theCWmin, the lower the number of collisions caused,and thereby, the lower the observed collision prob-ability pobs,i is. Therefore, a station will increase
5
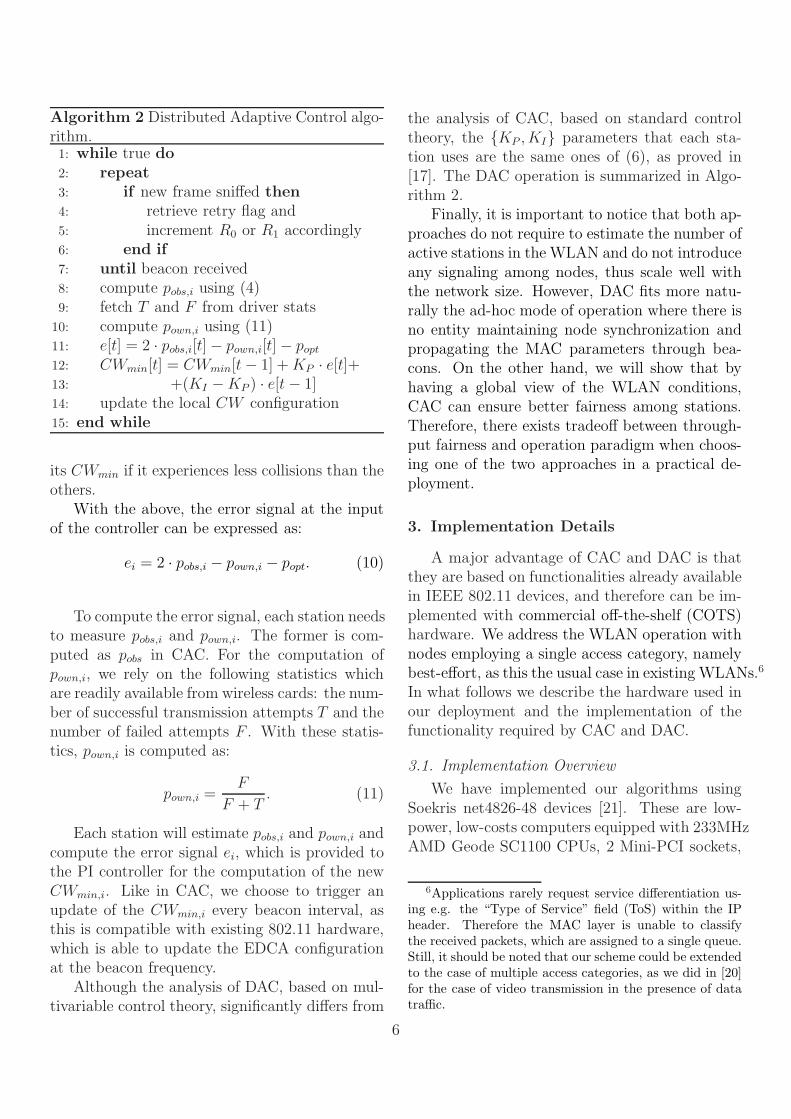
Algorithm 2 Distributed Adaptive Control algo-rithm.1: while true do
2: repeat
3: if new frame sniffed then
4: retrieve retry flag and5: increment R0 or R1 accordingly6: end if
7: until beacon received8: compute pobs,i using (4)9: fetch T and F from driver stats
10: compute pown,i using (11)11: e[t] = 2 · pobs,i[t]− pown,i[t]− popt12: CWmin[t] = CWmin[t− 1] +KP · e[t]+13: +(KI −KP ) · e[t− 1]14: update the local CW configuration15: end while
its CWmin if it experiences less collisions than theothers.
With the above, the error signal at the inputof the controller can be expressed as:
ei = 2 · pobs,i − pown,i − popt. (10)
To compute the error signal, each station needsto measure pobs,i and pown,i. The former is com-puted as pobs in CAC. For the computation ofpown,i, we rely on the following statistics whichare readily available from wireless cards: the num-ber of successful transmission attempts T and thenumber of failed attempts F . With these statis-tics, pown,i is computed as:
pown,i =F
F + T. (11)
Each station will estimate pobs,i and pown,i andcompute the error signal ei, which is provided tothe PI controller for the computation of the newCWmin,i. Like in CAC, we choose to trigger anupdate of the CWmin,i every beacon interval, asthis is compatible with existing 802.11 hardware,which is able to update the EDCA configurationat the beacon frequency.
Although the analysis of DAC, based on mul-tivariable control theory, significantly differs from
the analysis of CAC, based on standard controltheory, the {KP , KI} parameters that each sta-tion uses are the same ones of (6), as proved in[17]. The DAC operation is summarized in Algo-rithm 2.
Finally, it is important to notice that both ap-proaches do not require to estimate the number ofactive stations in the WLAN and do not introduceany signaling among nodes, thus scale well withthe network size. However, DAC fits more natu-rally the ad-hoc mode of operation where there isno entity maintaining node synchronization andpropagating the MAC parameters through bea-cons. On the other hand, we will show that byhaving a global view of the WLAN conditions,CAC can ensure better fairness among stations.Therefore, there exists tradeoff between through-put fairness and operation paradigm when choos-ing one of the two approaches in a practical de-ployment.
3. Implementation Details
A major advantage of CAC and DAC is thatthey are based on functionalities already availablein IEEE 802.11 devices, and therefore can be im-plemented with commercial off-the-shelf (COTS)hardware. We address the WLAN operation withnodes employing a single access category, namelybest-effort, as this the usual case in existing WLANs.6
In what follows we describe the hardware used inour deployment and the implementation of thefunctionality required by CAC and DAC.
3.1. Implementation Overview
We have implemented our algorithms usingSoekris net4826-48 devices [21]. These are low-power, low-costs computers equipped with 233MHzAMD Geode SC1100 CPUs, 2 Mini-PCI sockets,
6Applications rarely request service differentiation us-ing e.g. the “Type of Service” field (ToS) within the IPheader. Therefore the MAC layer is unable to classifythe received packets, which are assigned to a single queue.Still, it should be noted that our scheme could be extendedto the case of multiple access categories, as we did in [20]for the case of video transmission in the presence of datatraffic.
6

128 Mbyte SDRAM and 256 Mbyte compact flashcircuits for data storage. To accommodate the in-stallation of current Linux distributions, we haveextended the storage capacity of the boards with2-GB USB drives. As wireless interfaces, we usedAtheros AR5414-based 802.11a/b/g devices.
As software platform we installed Gentoo LinuxOS (kernel 2.6.24) and the popular MadWifi open-source WLAN driver (version v0.9.4) [22], whichwe modified as follows: (i) we enabled the dy-namic setting of the EDCA parameters for thebest effort AC, since the driver disables by defaultchanging the configuration of the parameters forthis category (which is not inline with the stan-dard specification); (ii) we overwrote the drivers’EDCA values for the best-effort traffic with thestandard recommended ones [1], and (iii) for thecase of DAC we modified the driver to enable thestations to employ the locally computed EDCAconfiguration using standardized system calls (asdescribed in Section 3.4). The source code of themodified drivers and our implemented prototypesis available online [23].
Fig. 4 illustrates the main modules of our im-plementation of CAC and DAC. The algorithmsdo not require introducing modifications to thehardware/firmware nor have tight timing constraints,and therefore they can run as user-space applica-tions that communicate with the driver by meansof IOCTL calls. We also take advantage of theability of the MadWifi driver to support multi-ple virtual devices using different operation modes(master/managed/monitor) with a single physicalinterface. In the following we detail the imple-mentation of the different modules.
3.2. Estimation of pobs
Both algorithms require to estimate the colli-sion probability observed in the WLAN. For thecase of CAC this is performed only at the AP andresults in pobs, while for the case of DAC this isperformed independently at each station i and re-sults in pobs,i. The estimators are computed with(4), which relies on observing the retry flag of theoverheard frames. We next explain how these val-ues are obtained from a practical perspective.
Wireless Interface
Kernel space
User space
MadWifi driver
Centralized Adaptive Control
Frame
Sniffer
CW Configuration Module
CWmin
Private
IOCTL
call
Data Frames
pobs
Master mode
virtual interface
Monitor mode
virtual interface
Wireless Interface
Kernel space
User space
MadWifi driver
Distributed Adaptive Control
Frame
Sniffer
Statistics
Collector
CW Configuration Module
CWmin
Private
IOCTL
call
SIOCGATHSTATS
IOCTLData Frames
pobspown
Managed mode
virtual interface
Monitor mode
virtual interface
(Configuration
to be sent w/
next beacon)
Beacon
frames
STAAP
Figure 4: CAC (left) and DAC (right) implementations.
To overhear frames, we utilize a virtual de-vice operating in the so called monitor mode withpromiscuous configuration. With this configura-tion, the device passes all traffic to user-space ap-plications, including frames not addressed to thestation. We also configure the device to pass thereceived frames with full IEEE 802.11 link layerheaders, such that the Frame Control field of theframes (where the retry flag resides) can be ex-amined.
With this set-up, the algorithms open a raw
socket to the driver, which enables the receptionof Layer 2 frames. Through this socket, the al-gorithms listen for transmitted frames and pro-cess their headers in an independent thread (the“Frame Sniffer” module of Fig. 4). For every ob-served frame, one of the counters used in the esti-mation of the collision probability is incremented:R0 if the retry flag was unset, R1 if the retry flagwas set. Every beacon interval the computationof pobs or pobs,i using (4) is triggered, and then thecounters are reset to zero.
3.3. Estimation of pown
In addition to the observed collision probabil-ity pobs,i, the DAC algorithm requires to estimatethe experienced collision probability pown,i. Weperform this computation in the “Statistics Col-lector” module of Fig. 4 using information recordedby the wireless driver. More specifically, at theend of a beacon interval we open a communica-tion channel with the driver instance, configuredin managed mode, and perform a SIOCGATHSTATS
IOCTL request. Upon this request, the driver pop-ulates an ath stats data structure, which con-
7

tains detailed information about the transmittedand received frames since the Linux kernel hasloaded the driver module. Out of the statisticsretrieved, the records that are of particular inter-est for our implementation are:
• ast tx packets: number of unique framessent to the transmission interface.
• ast tx noack: number of transmitted framesthat do not require ACK.
• ast tx longretry: number of transmissionretries of frames larger than the RTS thresh-old. As we do not use the RTS/CTS mech-anisms, this is the total number of retrans-missions.
• ast tx xretries: number of frames not trans-mitted due to exceeding the retry limit, whichis set by the MAX RETRY parameter.
To compute pown,i we need to count the num-ber of successful transmissions and the number offailed attempts. To compute the former, we sub-tract from the number of unique frames those thatare not acknowledged (e.g., management frames)and those that were not delivered,
Successes = ast tx packets
− ast tx xretries − ast tx noack.(12)
Similarly, to compute the number of failed at-tempts, out of the total number of retransmissionswe do not count those retransmissions caused byframes that were eventually discarded because theMAX RETRY limit was reached, therefore,
Failures = ast tx longretry
− ast tx xretries · MAX RETRY.(13)
With the above, the terms F and T of (11) usedto estimate pown,i are computed as
F [t] = Failures[t]− Failures[t− 1],
T [t] = Successes[t]− Successes[t− 1],(14)
where t denotes the time of the current beaconinterval and t− 1 the previous one. Note that inthe above we take the difference between the to-tal number of failures and successes, respectively,counted by the driver at the end of the current andprevious intervals, as these counters accumulatevalues since the driver module has been loaded inthe kernel and cannot be reset by the user.
3.4. Contention Window Update
With the estimated collision probabilities, CACand DAC compute the error signal at the end of abeacon interval according to (5) and (7), respec-tively. Depending on this value, the PI controllertriggers an update of the CWmin to be used in thenext beacon interval t, according to the followingexpression:
CWmin[t] = CWmin[t−1]+KP ·e[t]+(KI−KP )·e[t−1].(15)
To ensure a safeguard against too large andtoo small CWmin values we impose lower and up-per bounds for the CWmin. We set these boundsto the default CWDCF
min and CWDCFmax values spec-
ified by the standard, which are 16 and 1024, re-spectively, for IEEE 802.11a [24].
The algorithms assume that the CWmin cantake any integer value in the [16, 1024] range. How-ever, with our devices only integer powers of 2are supported (i.e., CWmin ∈ {16, 32, . . . , 1024}).Therefore, the value actually used is obtained as:
CW[t] = pow(2,rint(log2(CWmin[t]))). (16)
where rint(x) is a function that returns the in-teger value nearest to x.
To commit the computed CW configuration, firstwe retrieve the list of private IOCTLs supportedby the device to search for the call that sets theCWmin. Once this call has been identified, weprepare an iwreq data structure with the follow-ing information: the interface name, the base-2exponent of the CW computed with Eq. (16), theaccess category index as defined by the standard(0 for Best Effort) and an additional parameterthat identifies if the value is intended to be usedlocally or propagated. For the case of DAC thisvalue is set to 0, as the CW is only intended to
8

Figure 5: Deployed testbed.
the local card, while for the case of CAC is set to1, thereby requesting the driver to broadcast thenew CW within the EDCA Parameter Set elementof the next scheduled beacon frame.
4. Testbed Description
In this section we describe our testbed andanalyze the link qualities between each node andthe AP, showing that our set-up is able to mimica realistic deployment with significant differencesin terms of SNR.
Our testbed is located in the Torres Quevedobuilding at University Carlos III de Madrid. Itconsists of 18 devices deployed under the raisedfloor, a placement that provides physical protec-tion as well as radio shielding to some extent (see[25]).
Fig. 5 illustrates the location of the nodes.We placed one node towards the center of thetestbed, which acts as the Access Point through-out our experiments and we denote as AP, whilestations are distributed at different distances fromthe AP and numbered from 1 to 17 in decreasingorder of their links’ SNR values towards the AP,which we measure as explained next. In this way,
20
30
40
50
60
70
1 2 3 4 5 6 7 8 9 10 11 12 13 14 15 16 17
SN
R [d
B]
Station index
Figure 6: SNR of the links between each node and theAccess Point.
our deployment emulates several popular scenar-ios, e.g. cafes, offices, conference rooms, both interms of number of nodes and mobility. Indeed,in such scenarios nodes are mostly static, expe-riencing dissimilar link qualities towards the APwith small variations, as our measurements con-firm. Although we focus on a single AP topol-ogy, in the considered scenarios careful channelallocation is usually performed to avoid inter-APinterference, and therefore our algorithms can beindependently executed within each WLAN.
All nodes are equipped with 5 dBi omnidi-rectional antennas and are configured to oper-ate on channel 64 (5.32 GHz) of IEEE 802.11astandard [24], where no other WLANs were de-tected. All nodes use the 16-QAM modulationand coding scheme, which provides 24 Mbps chan-nel bit rate, as calibration measurements showedthat this was the highest rate achievable by thenode with the worst link to the AP (node 17). Ad-ditionally, we disabled the RTS/CTS, rate adap-tation, turbo, fast frame, bursting and unsched-uled automatic power save delivery functionality,as well as the antenna diversity scheme for trans-mission/reception.
Unless otherwise specified, all nodes use thesame transmission power level of 17 dBm. Giventhe node placement of Fig. 5, this setting resultsin dissimilar link qualities between each stationand the AP (e.g., node 1 is very close to theAP, while e.g. node 16 is far away, which will
9

affect the perceived SNR). To confirm this linkheterogeneity, we designed the following experi-ment. For a given node, we ran a 10-second ping
test between the station and the AP, recordingthe SNR values of the received frames as obtainedby the wireshark packet analyzer [26] from theradiotap header.7 This test was performed ona node-by-node basis, and repeated for 18 hours.The average and standard deviation of the SNRfor each link are shown in Fig. 6.
5. Validation of the Algorithms
Our first set of experiments aims at confirmingthat the good operation properties of CAC andDAC, obtained analytically and via simulationsin [16, 17], are also achieved in a real testbed.Specifically, we want to confirm that the use ofthe algorithms results in stable behavior despitethe described hardware/software limitations andthe impairments introduced by the channel condi-tions, and also assess their resource consumptionin terms of CPU and memory usage.
5.1. Point of operation
We consider a scenario with N = 10 stationsrandomly selected, namely 1, 2, 5, 6, 8, 9, 10, 12,13, and 14, which corresponds to a network withheterogeneous link qualities. Stations are con-stantly backlogged with 1500-Byte UDP frames,which they send to the AP utilizing iperf [27] fora duration of 5 minutes. For the case of the cen-tralized algorithm (CAC) we log its key variables,namely, the CW announced in beacon frames andthe observed collision probability pobs. Both areobtained every 100 ms and depicted in Fig. 7.
As the 30-second snapshot in the figure shows,CAC drives the WLAN to the desired point ofoperation. Indeed, the announced CW oscillatesbetween the two power of 2 values closest to theoptimal CWmin (i.e., 64 and 128), while pobs fluc-tuates stably around the desired popt given by (2).We conclude that, despite the hardware limita-tions imposed on the values of CW and the channel
7With the radiotap option, the driver provides addi-tional information about received frames to user-space ap-plications, including the signal-to-noise ratio.
0
0.25
0.5
0.75
1
0 5 10 15 20 25 30
Col
lisio
n pr
obab
ility
time [s]
pobspopt
16
32
64
128
256
CW
min
Figure 7: Announced CWmin and observed collision prob-ability with CAC.
0
0.25
0.5
0.75
1
0 5 10 15 20 25 30
Col
lisio
n pr
obab
ility
time [s]
pownpobspopt
16
32
64
128
256
CW
min
CWmin,1CWmin,10CWmin,13CWmin,14
Figure 8: CWmin used by four selected nodes (1, 10, 13and 14) and the estimated pobs and pown for node 10 withDAC.
impairments, CAC is able to drive the WLAN tothe desired point of operation.
Next we validate the operation of the distributedalgorithm (DAC). We consider the same scenarioas before, logging the key parameters of the algo-rithm at each station, namely CWmin,i, pown,i andpobs,i. In Fig. 8 we depict in the upper subplot theevolution of the CWmin used by four representa-tive nodes. More specifically, we select out of the10 considered nodes the one with the best link(node 1) and the one with the worst link (node14), as well as two stations with similar link qual-ities, (nodes 10 and 13). Additionally, in the lower
10

subplot we show the collision probabilities esti-mated by node 10 (pobs,10 and pown,10).
From the two subplots we see that DAC alsodrives the average collision probability in theWLANto the desired value. However, there is a key dif-ference as compared to the previous case: whilewith CAC all stations use the same CWmin value,with DAC they operate at different average CWmin.Indeed, the four stations considered in the experi-ment use average CWmin values of 300, 92, 92 and64, respectively. As we will explain in Section 6.2,this behavior is caused by the relative differencesin link qualities, combined with the inability ofthe wireless interface to identify the reasons for apacket loss.
5.2. Resource consumption
In addition to analyzing the performance ofCAC and DAC, it is also important to assess theirresource consumption. For this purpose, we an-alyzed the CPU and memory usage of the algo-rithms utilizing the top Linux application, whichprovides a dynamic real-time view of a runningsystem. With this tool, we recorded the usedshares of the CPU time and available physicalmemory with a frequency of 1 sample per secondand computed the average usage. CAC, whichruns exclusively at the AP, demands on average14% of the CPU time and only 0.8% of the phys-ical memory. For the case of DAC, which runs atevery station, the average CPU time consumptionis 17%, while the physical memory consumptionis 0.9%. Given the low speed of the nodes’ CPU(233 MHz) and their reduced physical memory(128 MB), these results show that both CAC andDAC are suitable for commercial deployments asthey do not pose stringent resource requirements.8
8In order to have a benchmark to compare against,we measured the CPU and memory usage of the popularpacket sniffer tcpdump, running on the same device type.Measurements revealed that tcpdump consumes 28% of theCPU time, while its memory usage reaches 4.3%, these val-ues being significantly larger than the ones for CAC andDAC.
0
5
10
15
20
EDCA CAC DAC
Tot
al th
roug
hput
[Mbp
s]
Figure 9: Total throughput with UDP traffic.
6. Performance Evaluation
We next assess the performance of the algo-rithms under a large number of different scenariosand evaluate their improvements over the defaultEDCA configuration, which we use as a bench-mark. Each considered experiment runs for 2 min-utes and is repeated 10 times to obtain averagevalues of the measured metrics with good statis-tical significance.
We evaluated the behavior of the proposedalgorithms with both unidirectional (UDP) andbidirectional (TCP) traffic, under diverse condi-tions in terms of link qualities and number of ac-tive nodes. Unless otherwise stated, we assumenodes have similar traffic demands and are con-stantly backlogged, thus the network is mostlysaturated.
6.1. UDP Throughput
We first measure the achievable throughputbetween the nodes and the AP when all the sta-tions are transmitting UDP traffic at the sametime. Fig. 9 plots the average and standard devi-ation of the total throughput obtained with eachmechanism. We observe that the EDCA defaultconfiguration achieves around 11 Mbps, while theuse of DAC and CAC results in a performancegain of approximately 45%. Therefore, we con-firm that both approaches, by properly adaptingthe CW configuration to the number of contend-ing stations, achieve a much higher efficiency.
11

0
0.5
1
1.5
2
1 2 3 4 5 6 7 8 9 10 11 12 13 14 15 16 17
Indi
vidu
al th
roug
hput
[Mbp
s]
Station index
EDCACACDAC
Figure 10: Throughput per station with UDP traffic.
To further examine the performance of the al-gorithms we plot the per-station throughput inFig. 10. According to the figure, the use of theEDCA recommended values not only provides thelowest overall throughput figures, but also fails toprovide a fair sharing of the available bandwidth.Indeed, it can be seen that, e.g., the node withthe best link quality to the AP (node 3) achievesmore than three times the throughput obtainedby the station with the poorest link (node 15).
While DAC provides a larger total throughputthan EDCA, it does not improve the level of fair-ness. Actually, it results in a somehow opposite
performance as the one obtained with EDCA: sta-tions that obtained a relatively large bandwidthwith EDCA (e.g., nodes 3, 6) now obtain a rela-tively small bandwidth with DAC. Furthermore,due to the poor short-term fairness properties of802.11 MAC [28], the results show a notable vari-ability. The use of CAC, on the other hand, pro-vides the best performance both in terms of totalthroughput and fairness, as it provides all stationswith very similar throughput values.
To quantify the throughput fairness achievedby the considered mechanisms we compute theJain’s fairness index (JFI) [29].9 The resulting
9Since in most scenarios the network operates close tosaturation and all nodes have the same traffic require-ments, we argue that JFI is the most suitable metric forassessing the fairness properties of CAC and DAC. Specif-ically, our goal is to quantify the dissimilarity in the re-source distribution, independent of the number of users.
0
0.5
1
1.5
2
30 40 50 60 70
Per
nod
e th
roug
hput
[Mbp
s]
SNR [dB]
EDCACACDAC
Figure 11: Per node throughput obtained vs. SNR.
JFI values are 0.865, 0.997 and 0.817 for the caseof EDCA, CAC and DAC, respectively. These fig-ures confirm the good fairness properties of CAC,and shows that DAC and EDCA suffer from ahigher level of unfairness, a result that we ana-lyze next.
6.2. Impact of SNR on Throughput
We have seen that link quality affects through-put distribution, in particular for EDCA and DAC.To analyze this impact, we plot in Fig. 11 the av-erage UDP throughput per station vs. the SNRof the link between the station and the AP. Notethat, in this analysis we do not modify stations’SNR by tuning their transmission power, but in-stead we investigate how the SNR dissimilaritythat arises due to their relative position to theAP affects the throughput performance of CACand DAC as compared to EDCA. For ease of vi-sualization we also plot natural smoothing splines
over the data points.From the figure we observe that: (i) for EDCA
there is a noticeable and positive correlation be-tween SNR and throughput; (ii) for CAC, per-formance is not much affected by SNR dissimi-larities, as significantly better link qualities resultin very small throughput improvements; (iii) forDAC there is a large and negative correlation be-tween SNR and throughput, with small differ-ences in terms of SNR causing large differencesin terms of throughput.
For the case of EDCA, the positive correla-tion is caused by the capture effect [30]. With
12

0
1
2
3
4
5
6
STA #10 STA #13
Thr
ough
put [
Mbp
s]
EDCACACDAC
Figure 12: Performance with hidden nodes.
this effect, in case of a collision the receiver candecode the packet with the higher SNR. As aresult, stations with better link quality obtainhigher throughput. In contrast, the use of CACreduces the number of collisions in the WLAN,and therefore the impact of the capture effect issignificantly reduced.
For the case of DAC, the negative correlationis also driven by the capture effect as follows.Nodes with high capture probability will experi-ence smaller collision rates than the others, andtherefore will have pown,i smaller than pobs,i. Thiswill cause a positive error signal according to theefairness,i term in (9), which will result in largeCWmin values. Conversely, nodes with low cap-ture probability will experience larger pown,i val-ues and smaller pobs,i ones, and therefore will havesmaller CWmin configurations. In this way, cap-turing nodes will transmit less often and there-fore will obtain low throughput figures, while theother nodes will transmit more often and expe-rience a higher throughput. Additional experi-ments with different transmission power settings,not reported due to space constraints, confirmedthat a careful equalization of the link qualities isable to restore fairness to some extent.
6.3. Hidden Nodes Scenario
Our adaptive algorithms have been designedfor scenarios where all stations are in radio rangeof each other and coordinate their transmissionsby means of carrier sensing. However, in realdeployments hidden nodes may be present, and
therefore we want to investigate their behaviorunder such circumstances.
To this aim, we ran extensive measurements,selecting different topologies and different trans-mission power settings, to determine the mostpathological scenario. This is obtained when node1 acts as AP, and nodes 10 and 13 act as stations,using a transmission power level of 5 dBm. Withthis setting, each EDCA station transmitting inisolation (i.e., with the other station silent) ob-tains about 16.3 Mbps of UDP throughput, whileif both stations transmit simultaneously the through-put of each one drops to 1.6 Mbps. Thereby wemanaged to reproduce a hidden node scenario.
We then repeated the experiment with CACand DAC, and obtained the results depicted inFig. 12. We observe that the use of DAC doesnot improve performance over EDCA. In contrast,CAC provides a dramatic throughput increase,i.e., more than three times the throughput at-tained with the other mechanisms. We concludethat CAC detects the large collision rate and com-mands hidden nodes to be less aggressive by an-nouncing a higher CWmin, which lessens (but doesnot eliminate) the hidden node problem. On theother hand, a station running DAC is not ableto overhear MAC (re-)transmissions from hiddennodes, and hence cannot correctly estimate thecollision probability in the network.
6.4. Impact Network Size
We next evaluate the performance of the algo-rithms as a function of the number of stations.To this aim, we measure the total throughputand JFI for an increasing number of contendingnodes, adding new stations in ascending order oftheir link quality. We plot the obtained results inFig. 13.
We observe that for both DAC and CAC thetotal throughput performance is practically flat,regardless of the number of stations. This resultconfirms that both approaches are able to adaptthe CW to the number of stations present in theWLAN.
For the case of EDCA, performance degradeswith the number of stations, which is the expectedresult from the use of a fixed set of (relatively
13
0.8
0.9
1
1 2 3 4 5 6 7 8 9 10 11 12 13 14 15 16 17
JFI
Number of stations
EDCACACDAC
10
12
14
16
18
Thr
ough
put [
Mbp
s]
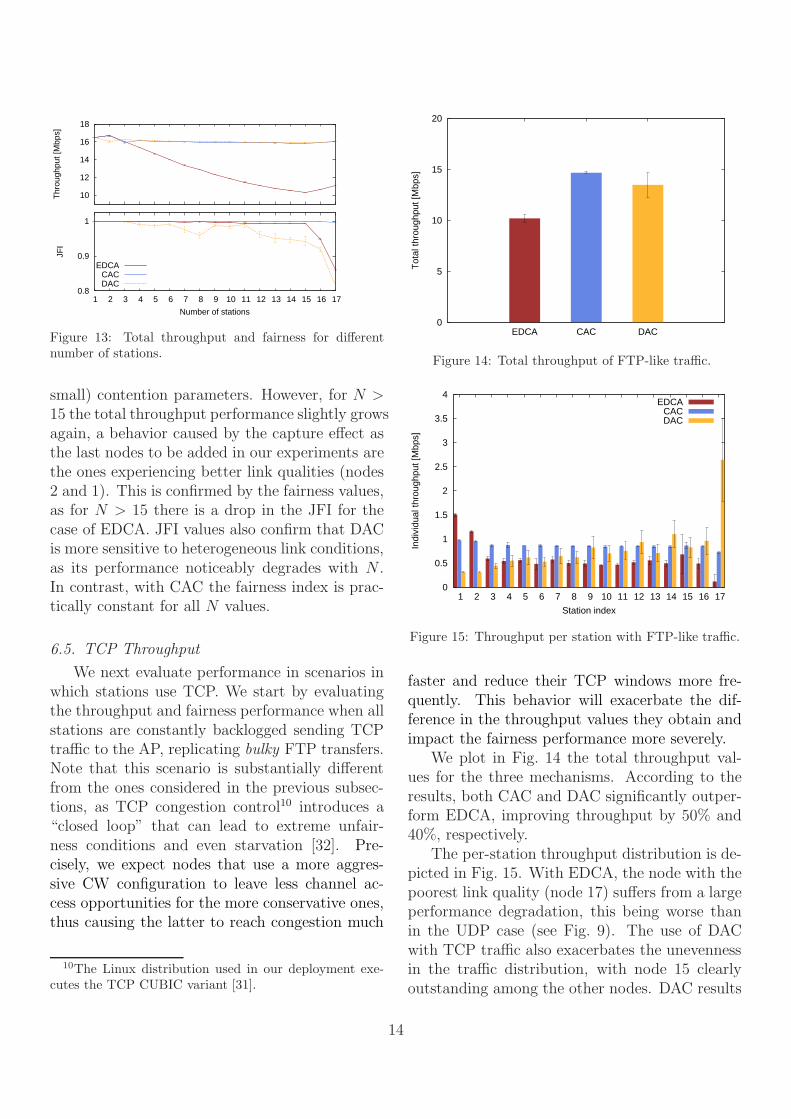
Figure 13: Total throughput and fairness for differentnumber of stations.
small) contention parameters. However, for N >15 the total throughput performance slightly growsagain, a behavior caused by the capture effect asthe last nodes to be added in our experiments arethe ones experiencing better link qualities (nodes2 and 1). This is confirmed by the fairness values,as for N > 15 there is a drop in the JFI for thecase of EDCA. JFI values also confirm that DACis more sensitive to heterogeneous link conditions,as its performance noticeably degrades with N .In contrast, with CAC the fairness index is prac-tically constant for all N values.
6.5. TCP Throughput
We next evaluate performance in scenarios inwhich stations use TCP. We start by evaluatingthe throughput and fairness performance when allstations are constantly backlogged sending TCPtraffic to the AP, replicating bulky FTP transfers.Note that this scenario is substantially differentfrom the ones considered in the previous subsec-tions, as TCP congestion control10 introduces a“closed loop” that can lead to extreme unfair-ness conditions and even starvation [32]. Pre-cisely, we expect nodes that use a more aggres-sive CW configuration to leave less channel ac-cess opportunities for the more conservative ones,thus causing the latter to reach congestion much
10The Linux distribution used in our deployment exe-cutes the TCP CUBIC variant [31].
0
5
10
15
20
EDCA CAC DAC
Tot
al th
roug
hput
[Mbp
s]
Figure 14: Total throughput of FTP-like traffic.
0
0.5
1
1.5
2
2.5
3
3.5
4
1 2 3 4 5 6 7 8 9 10 11 12 13 14 15 16 17
Indi
vidu
al th
roug
hput
[Mbp
s]
Station index
EDCACACDAC
Figure 15: Throughput per station with FTP-like traffic.
faster and reduce their TCP windows more fre-quently. This behavior will exacerbate the dif-ference in the throughput values they obtain andimpact the fairness performance more severely.
We plot in Fig. 14 the total throughput val-ues for the three mechanisms. According to theresults, both CAC and DAC significantly outper-form EDCA, improving throughput by 50% and40%, respectively.
The per-station throughput distribution is de-picted in Fig. 15. With EDCA, the node with thepoorest link quality (node 17) suffers from a largeperformance degradation, this being worse thanin the UDP case (see Fig. 9). The use of DACwith TCP traffic also exacerbates the unevennessin the traffic distribution, with node 15 clearlyoutstanding among the other nodes. DAC results
14

0
100
200
300
400
500
600
700
Tra
nsfe
r tim
e [s
]
(a) λ-1 = 30 [s]
EDCACACDAC
0
50
100
150
200
250
300
Tra
nsfe
r tim
e [s
]
(b) λ-1 = 60 [s]
EDCACACDAC
0
10
20
30
40
50
60
Tra
nsfe
r tim
e [s
]
(c) λ-1 = 90 [s]
EDCACACDAC
Figure 16: TCP delay performance.
also present a large deviation, caused by relativelyfrequent TCP timeouts from nodes with weak ra-dio link (e.g., node 17). Conversely, CAC yieldsa remarkably fair and stable throughput distribu-tion.
Like in the UDP case, we compute the JFI val-ues for the resulting throughput distributions. Inthis case, the values for EDCA, CAC and DAC are0.787, 0.996 and 0.692, respectively. We concludethat, as expected, the performance of EDCA andDAC worsens with TCP, while CAC preserves itsgood properties in this scenario.
6.6. TCP Transfer Delay
We finally consider a scenario involving finite-size TCP connections. More specifically, all sta-tions alternate periods of activity—during whicha transmission of 10 MB occurs—with silent peri-ods exponentially distributed with mean λ−1 [33].We consider three different values for λ, corre-sponding to three different levels of activity, namelyhigh, moderate and low. For each case we ran 1-hour experiments, logging all transfer durationsand computing the per-station average delay. Weuse a box-and-whisker diagram to illustrate thedistribution of the average delay among nodes:we provide the median, first and third quartilesof the average delay, as well as its maximum andminimum values.
Results are depicted in Fig. 16. With λ−1 =30 s, which corresponds to high activity, we seethat CAC provides the smallest and most uni-form distribution of transfer delay among nodes,with practically no difference between the bestand worst performing node. In case of EDCA, thedelay shows a larger median and higher variabil-ity. However, the small distance between the firstand third quartiles shows that most of the sta-tions experience similar performance. Finally, forthe case of DAC, despite the median is similar tothe one of CAC, results show a much larger disper-sion. This further confirms that, although DACachieves the main objective of optimizing the totalthroughput, nodes adjust their CW based on dif-ferent, locally observed conditions, which resultsin some stations being more aggressive than oth-ers, and correspondingly yields large variations inthe delay figures.
When the traffic activity is moderate (λ−1 =60 s), the absolute values decrease, but the rela-tive results are similar, i.e., CAC provides againthe smallest and most uniform delays among nodes.Finally, when the activity of the nodes is low(λ−1 = 90 s), medians are very similar but stillCAC provides the most fair distribution of thetransfer delays. From these experiments, we con-clude that CAC also provides the best perfor-mance under dynamic traffic scenarios.
15
7. Related Work
The scientific literature offers many examplesof MAC optimization approaches. Many of themare based on a centralized entity, responsible formonitoring system performance and adapting thesystem parameters to current conditions. Otherworks focus on distributed approaches to adaptMAC parameters. Very little experimental workis available, and it is based on complex algorithms,non-standard functionality and small-sized net-works. In the following we review the most sig-nificant contributions in each of these areas anddescribe the novelty of our work.
Centralized approaches. A significant num-ber of approaches exists in the literature [5, 7, 14,16] that use a single node to compute the set ofMAC parameters to be used in the WLAN. Withthe exception of our CAC algorithm [16], the maindrawbacks of these approaches are that they areeither based on heuristics, thereby lacking analyt-ical support for providing performance guarantees[5, 7], or they do not consider the dynamics of theWLAN under realistic scenarios [14].
Distributed approaches. Several works [8,10, 13, 34, 35] have proposed mechanisms that in-dependently adjust the backoff operation of eachstations in the WLAN. The main disadvantagesof these approaches are that they change the rulesof the IEEE 802.11 standard and therefore requireintroducing significant hardware or firm-ware mod-ifications.
Implementation experiences. Very fewschemes to optimize WLAN performance have beendeveloped in practice [14, 15, 18]. While the ideabehind Idle Sense [13] is fairly simple, its imple-mentation [18] entails a significant level of com-plexity, introducing tight timing constraints thatrequire programming at the firmware level. None-theless, the microcode that achieves the desiredfunctionality is proprietary and thus subject toportability constraints. Similar limitations holdfor the approach of [15], which introduces changesto the MAC protocol that require redesigning thewhole NIC implementation. Further, this involvescomplex DSP and FPGA programming and de-
mands non-negligible computational resources. Fi-nally, the work of [14] does not propose or evalu-ate any adaptive algorithm to adapt the CW butjust evaluates the performance of static configu-rations. Additionally, our testbed is substantiallylarger than the one used in these previous works.
8. Conclusions
We have prototyped with standard 802.11 de-vices two adaptive mechanisms that tune the con-tention window based on the observed networkconditions. In contrast to other proposals thatrequire complex modifications, these mechanismsrely on functionalities already supported by COTShardware/firmware, and do not introduce any ex-tensions to the standard 802.11 MAC. We haveextensively evaluated the performance of the mech-anisms in an 18-nodes testbed, considering a largevariety of network conditions. With our experi-mental study we have identified the key limita-tions of the distributed scheme, inherent in real-istic scenarios, and we have confirmed that thecentralized mechanism significantly improves net-work throughput, transfer delay and fairness amongstations in a broad range of circumstances, includ-ing the pathological case of hidden nodes. A ma-jor conclusion from our work is that, by simplyadding a few lines of code at the AP to exploitthe functionality readily available, we can achieveperformance improvements of up to 50%. We be-lieve that the results presented herein pave theway for a widespread deployment of the central-ized mechanism.
Acknowledgements
This work has been supported by the Euro-pean Community’s Seventh Framework Programme(FP7-ICT-2009-5) under grant agreement n. 257263(FLAVIA project).
[1] IEEE 802.11, Wireless LAN Medium Access Control(MAC) and Physical Layer (PHY) Specifications, Re-vision of IEEE Std 802.11-1999, 2007.
[2] G. Bianchi, “Performance Analysis of the IEEE802.11 Distributed Coordination Function,” IEEEJournal on Selected Areas in Communications, vol.18, no. 3, pp. 535–547, Mar 2000.
16

[3] A. Banchs and L. Vollero, “Throughput Analysis andOptimal Configuration of 802.11e EDCA,” ComputerNetworks, vol. 50, no. 11, August 2006.
[4] P. Serrano, A. Banchs, P. Patras, and A. Azcorra,“Optimal Configuration of 802.11e EDCA for Real-Time and Data Traffic,” IEEE Transactions on Ve-hicular Technology, vol. 59, no. 5, pp. 2511 –2528, jun2010.
[5] J. Freitag, N. L. S. da Fonseca, and J. F. de Rezende,“Tuning of 802.11e Network Parameters,” IEEECommunications Letters, vol. 10, no. 8, pp. 611–613,2006.
[6] L. Scalia, I. Tinnirello, J.W. Tantra, and Chuan HengFoh, “Dynamic MAC Parameters Configuration forPerformance Optimization in 802.11e Networks,” inProc. GLOBECOM, San Francisco, CA, USA, Dec2006, pp. 1–6.
[7] A. Nafaa, A. Ksentini, A. Ahmed Mehaoua,B. Ishibashi, Y. Iraqi, and R. Boutaba, “SlidingContention Window (SCW): Towards Backoff Range-Based Service Differentiation over IEEE 802.11 Wire-less LAN Networks,” IEEE Network, vol. 19, no. 4,pp. 45–51, Jul 2005.
[8] Y. Yang, J. J. Wang, and R. Kravets, “DistributedOptimal ContentionWindow Control for Elastic Traf-fic in Single-Cell Wireless LANs ,” IEEE Transac-tions on Networking, vol. 15, no. 6, pp. 1373–1386,Dec 2007.
[9] Q. Xia and M. Hamdi, “Contention Window Adjust-ment for IEEE 802.11 WLANs: A Control-TheoreticApproach,” in Proc. International Conference onComputer Communications (ICC), Istanbul, Turkey,Jun 2006.
[10] Q. Ni, I. Aad, C. Barakat, and T. Turletti, “Mod-eling and Analysis of Slow CW Decrease for IEEE802.11 WLAN,” in Proc. IEEE Personal, Indoor, andMobile Radio Communications Conference (PIMRC),Beijing, 2003.
[11] Lijun Chen, Steven H. Low, and John C. Doyle,“Joint Congestion Control and Media Access Con-trol Design for Wireless Ad Hoc Networks,” in Proc.IEEE INFOCOM, Miami, Florida, march 2005.
[12] Lijun Chen, Steven H. Low, and John C. Doyle,“Random Access Game and Medium Access ControlDesign,” IEEE Transactions on Networking, vol. 18,no. 4, pp. 1063–6692, dec. 2010.
[13] Martin Heusse, Franck Rousseau, Romaric Guillier,and Andrzej Duda, “Idle Sense: An Optimal AccessMethod for High Throughput and Fairness in RateDiverse Wireless LANs,” in Proc. ACM SIGCOMM,Philadelphia, PA, USA, 2005, pp. 121–132.
[14] Vasilios A. Siris and George Stamatakis, “OptimalCWmin Selection for Achieving Proportional Fair-ness in Multi-rate 802.11e WLANs: Test-bed Imple-mentation and Evaluation,” in Proceedings of the 1stinternational workshop on Wireless network testbeds,
experimental evaluation & characterization, Los An-geles, CA, USA, 2006, pp. 41–48.
[15] Ralph Bernasconi, Silvia Giordano, AlessandroPuiatti, Raffaele Bruno, and Enrico Gregori, “De-sign and Implementation of an Enhanced 802.11MAC Architecture for Single-Hop Wireless Net-works,” EURASIP Journal on Wireless Communi-cations and Networking, 2007.
[16] P. Patras, A. Banchs, and P. Serrano, “A ControlTheoretic Approach for Throughput Optimization inIEEE 802.11e EDCAWLANs,” Mobile Networks andApplications (MONET), vol. 14, no. 6, pp. 697–708,Dec 2009.
[17] P. Patras, A. Banchs, P. Serrano, and A. Azcorra, “AControl Theoretic Approach to Distributed OptimalConfiguration of 802.11 WLANs,” IEEE Transac-tions on Mobile Computing, vol. 10, no. 6, pp. 897–910, Jun 2011.
[18] Yan Grunenberger, Martin Heusse, Franck Rousseau,and Andrzej Duda, “Experience with an Implemen-tation of the Idle Sense Wireless Access Method,” inProceedings of the ACM CoNEXT conference, NewYork, New York, 2007, pp. 1–12.
[19] G. F. Franklin, J. D. Powell, and M. L. Work-man, Digital Control of Dynamic Systems, Addison-Wesley, 2nd edition, 1990.
[20] Paul Patras, Albert Banchs, and Pablo Serrano, “AControl Theoretic Scheme for Efficient Video Trans-mission over IEEE 802.11e EDCA WLANs,” ACMTransaction on Multimedia Computing, Communica-tions and Applications (TOMCCAP), vol. in press,2011.
[21] “Soekris Engineering, Inc.,” http://www.soekris.
com/.[22] “The MadWifi Project,” http://madwifi-project.
org/.[23] “Personal page,” http://www.hamilton.ie/
ppatras/#code.[24] IEEE 802.11, Supplement to Wireless LAN Medium
Access Control and Physical Layer Specifications:High-speed Physical Layer in the 5 GHz Band, IEEEStd 802.11a, 1999.
[25] Pablo Serrano, Carlos J. Bernardos, Antonio de laOliva, Albert Banchs, Ignacio Soto, and MichaelZink, “FloorNet: Deployment and Evaluation of aMultihop Wireless 802.11 Testbed,” EURASIP Jour-nal on Wireless Communications and Networking,2010.
[26] “Wireshark network protocol analyzer,” http://
wireshark.org.[27] “Iperf traffic generator,” http://sourceforge.net/
projects/iperf/.[28] Gilles Berger-Sabbatel, Andrzej Duda, Martin
Heusse, and Franck Rousseau, “Short-term fairness of802.11 networks with several hosts,” in Proceedingsof the Sixth IFIP TC6/WG6.8 Conference on Mo-
17
bile and Wireless Communication Networks (MWCN2004), Paris, France, Oct. 25–27, 2004, vol. 162, pp.263–274.
[29] R. Jain, Chiu, D.M., and W. Hawe, “A QuantitativeMeasure of Fairness and Discrimination for ResourceAllocation in Shared Systems,” DEC Research ReportTR-301, 1984.
[30] Z. Hadzi-Velkov and B. Spasenovski, “Capture Effectin IEEE 802.11 Basic Service Area under Influence ofRayleigh Fading and Near/far Effect,” in Proc. IEEEPersonal, Indoor, and Mobile Radio CommunicationsConference (PIMRC), 2002, vol. 1, pp. 172–176.
[31] Sangtae Ha, Injong Rhee, and Lisong Xu, “CUBIC: ANew TCP-friendly High-speed TCP Variant,” ACMSIGOPS Operating Systems Review, vol. 42, pp. 64–74, July 2008.
[32] O. Gurewitz, V. Mancuso, Jingpu Shi, and E.W.Knightly, “Measurement and Modeling of the Ori-gins of Starvation of Congestion-Controlled Flows inWireless Mesh Networks,” IEEE Transactions onNetworking, vol. 17, no. 6, dec. 2009.
[33] P. Barford and M. E. Crovella, “Generating Rep-resentative Web Workloads for Network and ServerPerformance Evaluation,” in Proc. ACM SIGMET-RICS, 1998, pp. 151–169.
[34] L. Bononi, M. Conti, and E. Gregori, “Runtimeoptimization of IEEE 802.11 wireless LANs perfor-mance,” IEEE Transactions on Parallel and Dis-tributed Systems, vol. 15, no. 1, pp. 66–80, Jan. 2004.
[35] F. Cali, M. Conti, and E. Gregori, “IEEE 802.11Protocol: Design and Performance Evaluation of anAdaptive Backoff Mechanism,” IEEE Journal on Se-lected Areas in Communications, vol. 18, no. 9, pp.1774–1786, Sept. 2000.
18