802.11 Wireless Simulation and Anomaly Detection using ...
12
802.11 Wireless Simulation and Anomaly Detection using HMM and UBM Anisa Allahdadi 1 , Ricardo Morla 1 , Jaime S. Cardoso 1 1 INESC TEC, and Faculty of Engineering, University of Porto, Porto, Portugal * E-mail: [email protected] Abstract: Despite the growing popularity of 802.11 wireless networks, users often suffer from connectivity problems and per- formance issues due to unstable radio conditions and dynamic user behavior among other reasons. Anomaly detection and distinction are in the thick of major challenges that network managers encounter. Complication of monitoring the broaden and complex WLANs, that often requires heavy instrumentation of the user devices, makes the anomaly detection analysis even harder. In this paper we exploit 802.11 access point usage data and propose an anomaly detection technique based on Hidden Markov Model (HMM) and Universal Background Model (UBM) on data that is inexpensive to obtain. We then generate a number of network anomalous scenarios in OMNeT++/INET network simulator and compare the detection outcomes with those in base- line approaches (RawData and PCA). The experimental results show the superiority of HMM and HMM-UBM models in detection precision and sensitivity. Keywords: 802.11 Wireless Network, Network Management, Anomaly Detection, Hidden Markov Model, Universal Background Model, Network Simulation, OMNeT++/INET 1 Introduction In recent years, IEEE 802.11 wireless networks has emerged as a promising technology for wireless access by mobile devices in many public places from enterprises and universities to urban areas. The flourishing popularity and ease of access to these networks has led to heavy utilization and congestion circumstances. On the other hand, interferences caused by broadcast nature of wireless links along with the other radio waves in the same frequency normally result in poor performance. In such conditions the packet transmission fails or requires several retransmission attempts causing performance issues. Furthermore, dynamic traffic loads, evolving nature of users move- ment and association to different APs often induce connectivity problems in large-scale 802.11 deployments. Generally speaking, at any given moment 802.11 APs or users are likely to come across problems threatening the connection quality. Thus the question of performance becomes increasingly important as new applications demand sufficient bandwidth and reliable medium access. Across the infrastructure, there are various types of anomalous situations caused by users or APs, and automatic detection of these anomalies is of great importance for future mitigation plans. Highly utilized medium, overloaded APs, failed or crashed APs, persistent interference between adjacent APs, RF effects and authentication failure are examples of such anomalies. However, due to the time and cost limitations of constantly monitoring the entire wireless ter- ritory by sensors and sniffers [1, 2], obtaining reliable ground truth becomes more and more challenging. In such circumstances, when acquiring ground truth is too expen- sive and time-consuming, network simulations seem to be effective solutions to achieve a close to reality setup that is computation- ally tractable. In the research community, many wireless networks are evaluated using discrete event simulators like OMNeT++ [3–5]. Although having worked with other simulation frameworks such as NS3 and OPNET, we found OMNeT++/INET the most appropri- ate wireless network simulators for our research purposes. Besides the well-structured framework and user-friendly IDE that facilitate analysis and data gathering, OMNeT++/INET provides an adequate set of modules supporting physical and radio models for 802.11 that perfectly meet our requirements for this project. In our previous papers [6, 7] we utilized RADIUS authentica- tion log data collected at the hotspot of the Faculty of Engineering of the University of Porto (FEUP). The trace data consisted of the daily summary of the connections between hundreds of APs and their corresponding wireless stations. In [8] we deployed a real testbed in small scale with one AP and 6 STAs using FreeRADIUS server, and generated a number of anomalies in a controlled environ- ment for experimental purposes. In the current work we simulate a more extended WLAN with 5 APs and 30 STAs and set up several anomalous cases, including the previous ones in [8] and some new anomalies. We further improve our Hidden Markov Model (HMM) formerly proposed in [7] and [8] by integrating it with the concept of Universal Background Model (UBM). The simulation data are then utilized to evaluate HMM and HMM-UBM models and compare the anomaly detection results with baseline approaches (RawData and PCA). The key steps of the present work include: 1) Conducting 802.11 wireless network simulation in OMNeT++/INET to resemble nor- mal and anomalous scenarios. 2) Reiterating the simulations with different seeds to provide miscellaneous replicates. 3) Extracting the wireless users’ data, and converting it to AP usage data. 4) Building HMM and HMM-UBM models from the prepared dataset. 5) Apply- ing the proposed anomaly detection algorithms. 6) Calculating the detection rate and sensitivity for evaluate purposes. Regarding the anomaly detection techniques we analyze three main approaches: 1) detection of anomalous time-series in a database of time-series, 2) recognition of anomalous patterns, and 3) detection of anomalous points within a given time-series. Furthermore, this paper explores the following research ques- tions: 1) whether HMM and HMM-UBM models are capable of anomaly detection and anomalous pattern recognition in AP usage data, 2) whether HMM and HMM-UBM models are required for anomaly detection or the baseline approaches are enough, 3) whether HMM-UBM have any advantages over HMM. The rest of the paper proceeds as follows. In section 2, the related work and the most recent researches relevant to the current work are presented. Section 3 characterizes the data features briefly. In section 3, the anomaly detection methodology is elaborated. Section 4 deals with the network simulation setup and focuses on the com- mon key properties of the accomplished simulations. In section 5 the simulated scenarios are described and the experimental results are analyzed. In section 8, the main conclusions are provided and the prominent direction of future work is disclosed. arXiv:1707.02933v2 [cs.NI] 29 Aug 2018
-
Upload
khangminh22 -
Category
Documents
-
view
0 -
download
0
Transcript of 802.11 Wireless Simulation and Anomaly Detection using ...
802.11 Wireless Simulation and AnomalyDetection using HMM and UBMAnisa Allahdadi1, Ricardo Morla1, Jaime S. Cardoso1
1 INESC TEC, and Faculty of Engineering, University of Porto, Porto, Portugal* E-mail: [email protected]
Abstract: Despite the growing popularity of 802.11 wireless networks, users often suffer from connectivity problems and per-formance issues due to unstable radio conditions and dynamic user behavior among other reasons. Anomaly detection anddistinction are in the thick of major challenges that network managers encounter. Complication of monitoring the broaden andcomplex WLANs, that often requires heavy instrumentation of the user devices, makes the anomaly detection analysis evenharder. In this paper we exploit 802.11 access point usage data and propose an anomaly detection technique based on HiddenMarkov Model (HMM) and Universal Background Model (UBM) on data that is inexpensive to obtain. We then generate a numberof network anomalous scenarios in OMNeT++/INET network simulator and compare the detection outcomes with those in base-line approaches (RawData and PCA). The experimental results show the superiority of HMM and HMM-UBM models in detectionprecision and sensitivity.
Keywords: 802.11 Wireless Network, Network Management, Anomaly Detection, Hidden Markov Model, Universal Background Model,Network Simulation, OMNeT++/INET
1 Introduction
In recent years, IEEE 802.11 wireless networks has emerged as apromising technology for wireless access by mobile devices in manypublic places from enterprises and universities to urban areas. Theflourishing popularity and ease of access to these networks has led toheavy utilization and congestion circumstances. On the other hand,interferences caused by broadcast nature of wireless links along withthe other radio waves in the same frequency normally result in poorperformance. In such conditions the packet transmission fails orrequires several retransmission attempts causing performance issues.Furthermore, dynamic traffic loads, evolving nature of users move-ment and association to different APs often induce connectivityproblems in large-scale 802.11 deployments. Generally speaking, atany given moment 802.11 APs or users are likely to come acrossproblems threatening the connection quality. Thus the question ofperformance becomes increasingly important as new applicationsdemand sufficient bandwidth and reliable medium access.
Across the infrastructure, there are various types of anomaloussituations caused by users or APs, and automatic detection of theseanomalies is of great importance for future mitigation plans. Highlyutilized medium, overloaded APs, failed or crashed APs, persistentinterference between adjacent APs, RF effects and authenticationfailure are examples of such anomalies. However, due to the timeand cost limitations of constantly monitoring the entire wireless ter-ritory by sensors and sniffers [1, 2], obtaining reliable ground truthbecomes more and more challenging.
In such circumstances, when acquiring ground truth is too expen-sive and time-consuming, network simulations seem to be effectivesolutions to achieve a close to reality setup that is computation-ally tractable. In the research community, many wireless networksare evaluated using discrete event simulators like OMNeT++ [3–5].Although having worked with other simulation frameworks such asNS3 and OPNET, we found OMNeT++/INET the most appropri-ate wireless network simulators for our research purposes. Besidesthe well-structured framework and user-friendly IDE that facilitateanalysis and data gathering, OMNeT++/INET provides an adequateset of modules supporting physical and radio models for 802.11 thatperfectly meet our requirements for this project.
In our previous papers [6, 7] we utilized RADIUS authentica-tion log data collected at the hotspot of the Faculty of Engineeringof the University of Porto (FEUP). The trace data consisted of thedaily summary of the connections between hundreds of APs and
their corresponding wireless stations. In [8] we deployed a realtestbed in small scale with one AP and 6 STAs using FreeRADIUSserver, and generated a number of anomalies in a controlled environ-ment for experimental purposes. In the current work we simulate amore extended WLAN with 5 APs and 30 STAs and set up severalanomalous cases, including the previous ones in [8] and some newanomalies. We further improve our Hidden Markov Model (HMM)formerly proposed in [7] and [8] by integrating it with the concept ofUniversal Background Model (UBM). The simulation data are thenutilized to evaluate HMM and HMM-UBM models and compare theanomaly detection results with baseline approaches (RawData andPCA).
The key steps of the present work include: 1) Conducting 802.11wireless network simulation in OMNeT++/INET to resemble nor-mal and anomalous scenarios. 2) Reiterating the simulations withdifferent seeds to provide miscellaneous replicates. 3) Extracting thewireless users’ data, and converting it to AP usage data. 4) BuildingHMM and HMM-UBM models from the prepared dataset. 5) Apply-ing the proposed anomaly detection algorithms. 6) Calculating thedetection rate and sensitivity for evaluate purposes.
Regarding the anomaly detection techniques we analyze threemain approaches: 1) detection of anomalous time-series in adatabase of time-series, 2) recognition of anomalous patterns, and3) detection of anomalous points within a given time-series.
Furthermore, this paper explores the following research ques-tions: 1) whether HMM and HMM-UBM models are capable ofanomaly detection and anomalous pattern recognition in AP usagedata, 2) whether HMM and HMM-UBM models are required foranomaly detection or the baseline approaches are enough, 3) whetherHMM-UBM have any advantages over HMM.
The rest of the paper proceeds as follows. In section 2, the relatedwork and the most recent researches relevant to the current workare presented. Section 3 characterizes the data features briefly. Insection 3, the anomaly detection methodology is elaborated. Section4 deals with the network simulation setup and focuses on the com-mon key properties of the accomplished simulations. In section 5the simulated scenarios are described and the experimental resultsare analyzed. In section 8, the main conclusions are provided andthe prominent direction of future work is disclosed.
arX
iv:1
707.
0293
3v2
[cs
.NI]
29
Aug
201
8
2 Related Work
2.1 Anomalous Pattern Detection
In the most recent studies concerning 802.11 wireless networks,there exist several analysis on connectivity and performance issuesfor facilitating the network management tasks. In connection to this,a number of articles investigate the overloaded networks, faulty APs,impact of interference in chaotic 802.11 deployments and similaranomalous cases.
Having explored the network under high medium utilization con-ditions, authors in [9] show that in the overloaded networks, stationsonly maintain a short association period with an AP, and repeatedassociation and re-association attempts are common phenomenaeven in the absence of client mobility. Their analysis demonstratesthat stations’ throughput suffers drastically from the unnecessaryhandoffs, leading to suboptimal network performance.
In another direction of work in [10], the authors present a numberof algorithms that detect failed APs by analyzing AP usage logs. Themain assumption in their algorithm is that the longer the time an APdoes not register events, the greater the probability that particular APis faulty (crashed/halted).
In relation to interference detection in WLANs, authors in [11]propose methods including intelligent frequency allocation acrossAPs, load balancing of user affiliations across APs and AP adaptivepower control for interference mitigation in dense 802.11 deploy-ments. Furthermore, the authors in [12] studied the impact of RFinterference on 802.11 networks from devices like Zigbee and cord-less phones that crowd the 2.4GHz ISM band to devices like wirelesscamera jammers and non-compliant 802.11 devices that disrupt802.11 operations. They affirm through practice that moving to adifferent channel is more effective in coping with interference thanchanging 802.11 operational parameters such as CCA (clear channelassessment).
In [13], a usage pattern called "abrupt ending" is explored inFEUP dataset [6, 7] that concerns the disassociation of a largenumber of wireless sessions in the same AP within a one secondwindow.
The authors introduce some anomalous patterns that might bein correlation with the occurrence of this phenomena. For instance,AP halt/crash, AP overload, persistence interference and intermittentconnectivity. The analysis of the anomaly-related patterns performedin this research, inspired our work to re-generate similar anomaliesin network simulator in addition to the real Testbed that was alreadydone in our previous work [8]. The principal goal of the simulationand the real Testbed experiments is to evaluate the HMM anomalydetection methodologies proposed in the current work as well as ourformer studies [7, 8].
2.2 Wireless Network Simulation
There are numerous efforts in the literature that tried to exploitsimulation as an effective tool to setup a computationally tractablenetwork. Wireless network simulation is used for various objectivesfrom assessment and validation of models to obtain synthesized dataand parameterized metrics. In [14] the authors employed simula-tion to generate synthetic traffic and validate their proposed modelof traffic workload in a campus WLAN. As another example, theresearchers in [15] propose a framework to integrate the infrastruc-ture mode and ad hoc mode and they implement the frameworkin NS2. They used simulation to show the higher performance oftheir proposed model compared to the traditional wireless LAN.In a rather relevant work to ours, the performance of IEEE 802.11wireless networks is evaluated using OPNET Modeler [16]. Thesimulated network in infrastructure mode for one AP and 12 sta-tions investigates the performance of pure 802.11g network over anetwork that uses both 802.11g and 802.11b clients.
In relation to OMNet++ and its simulation models, a num-ber of articles work on validating the reliability and accuracy ofOMNeT++. For example in [17] the authors perform a measure-ment study of wireless networks in a highly controlled environment
to validate the IEEE 8021.11g model of OMNet++. They used met-rics like throughput, delay and packet inter-transmission to comparethe measurement results to identical simulations. They show that thesimulation results match the measurements well in most cases. Fur-thermore in [18] the reliability of OMNeT++ is assessed for wirelessDoS attacks by comparing the simulation results to the real 802.11testbed. In this case throughput, end-to-end delay, and packet lostratio are considered as performance measures. The authors confirmthe accuracy of the simulation results in wireless DoS domain.
However, there exist few efforts in the literature that conduct sim-ulation of WLANs in OMNeT++ and concern about performanceand quality of service (QoS). For example in [4] the performanceof the TCP protocol for audio and video transmission is evaluatedusing OMNeT++ simulation. In another direction of work in [5] anoverview of the IEEE 802.11b model is simulated in OMNeT++ andan example network consisting of a mobile station moving througha series of APs is used to analyze the handover behavior of themodel. To the best of our knowledge the simulation of aforemen-tioned anomalous patterns in WLAN infrastructure mode has neverbeen done before.
2.3 HMM Applications in Network Analysis
In wireless networking, HMMs are employed to address variousaspects of network measurement and analysis. Hierarchical and Hid-den Markov based techniques are analyzed in [19] to model 802.11bMAC-to-MAC channel behavior in terms of bit error and packetloss. The authors employed two random variables in packet loss pro-cess, inter-arrival-rate and burst-length of packet loss, and appliedthe traditional two-state Markov chain. The results demonstrates thattwo-state Markov chain provides an adequate model for the 802.11bMAC-to-MAC packet loss process.
In [20] a multilevel approach involving HMMs and Mixtures ofMultivariate Bernoullis (MMB) is proposed to model the long andshort time scale behavior of wireless sensor network links, that is, thebinary sequence of packet receptions (1s) and losses (0s) in the link.In this approach, HMM is applied to model the long-term evolutionof the trace, and the short-term evolution is modeled within the statesby HMM or MMB.
In another related work, HMMs are applied for modeling and pre-diction of user movement in wireless networks to address QoS issues[21]. User movement from an AP to an adjacent AP is modeledusing a second-order HMM. Although the authors demonstrated thenecessity of using HMM instead of Markov chain model, the pro-posed model is only practical for small wireless networks with a fewnumber of APs, not widespread WLANs.
In a more recent study in [22], the authors use HMM for eval-uating the performance of cooperative sensing at the fusion centre(FC). The proposed method enables the FC to become aware whenthe performance of cooperative spectrum sensing degrades withoutrequiring knowledge of the local sensing statistics. Numerical resultsobtained from simulations confirm the effectiveness of the pro-posed method for both soft and hard combining schemes in practicalscenarios with noise and multipath fading.
As the above literatures indicate, HMM related studies in wire-less network management are rarely used specifically in performanceanomaly detection of wireless networks.
3 Data Features
In our previous papers we utilized RADIUS authentication log datawhich contains session records of wireless stations connecting toAPs. A preliminary analysis on the raw data yields a sequentialdataset summarizing APs association history. In the current simu-lation we create a similar dataset with the exact same features tobe synchronized with the previous HMM modeling. The definitionof the main features along with a brief explanation on the featureselection process is presented in the following paragraphs.

3.1 Data Attributes
Data features are categorized in two main classes: Density Attributesand Usage Attributes. Density Attributes demonstrate how crowdedis the place in terms of active attendant users, and the UsageAttributes disclose the volume of the sent and received traffics bythe present users. The former attributes mainly characterize the asso-ciation population and durability, and the later ones reveal the totalbandwidth throughput regardless of how populous is the place andit is more relevant to the applications utilized by the current mobileusers.
3.1.1 Density Attributes:
User Count: the number of unique users observed in a specificlocation (indicated by an AP) in a time-slot.
Session Count: the total population of active sessions during a time-slot regardless of the owner user. This attribute reveals the number ofattempts made by the congregation of the present users to associateto the current AP.
Connection Duration: the total duration of association time of allthe current users. This attribute is an indicator of the overall connec-tion persistence. The utmost amount of this feature is achieved whenthere is no evidence of disassociation in the ongoing active sessionduring a time-slot.
3.1.2 Usage Attributes:
Input Data in Octets: the number of octets transmitted from theclient. This attributes briefly refers to the number of bytes uploadedby the wireless user.
Output Data in Octets: the number of octets received by the client.This attribute shortly refers to the number of bytes downloaded bythe wireless user.
Input Data in Packets: the number of packets transmitted from theclient. This attribute is similar to the above Input-Octet, just to bemeasured in packets.
Output Data in packets: the number of packets received by theclient. This attribute is similar to the above Output-Octet, just to bemeasured in packets.
3.2 Feature Selection
For subsequent analysis, we favor using less features than the entireset of attributes introduced earlier. For this purpose, we applied Prin-cipal Component Analysis (PCA) technique to find the combinationof the variables which best explain the phenomena and contain thegreatest part of the entire information. In the current experiment thefirst three principal components bring the cumulative proportion ofvariance to over 99%. More detail explanation on the correlation ofdata features with themselves and with the principal components areprovided in our previous work [8].
4 Anomaly Detection in AP Usage Data
We use Hidden Markov Models adapted from a Universal Back-ground Model for 1) detection of anomalous time-series, 2) recog-nition of anomalous patterns, and 3) detection of anomalies within agiven time-series.
Fig. 1: Data and model pooling approaches for creating a UBM. (a)Data from subpopulations pooled prior to training the final UBM.(b) Individual subpopulation models trained then combined to createfinal UBM.
4.1 Preliminaries
4.1.1 Hidden Markov Model: HMM symbolizes a doublystochastic process with a set of observable states and a series of hid-den states which can only be observed through the observable setof stochastic process. HMMs are generally used for the stochasticmodeling of non-stationary time-series.
The formal definition of a n-state HMM with Gaussian emissionis determined as follows:
• A set of hidden states S = {si} , 1 ≤ i ≤ n.• State transition probability distribution or transition matrix. A ={ai,j} , ai,j = P (sj at t+ 1|si at t) , 1 ≤ i, j ≤ n.
• Observation probability distributions, typically from a normaldistribution in case of continuous observations. B = {bi(ot)} ,bi(ot) = P (ot at t|si at t) , 1 ≤ i ≤ n.
bi(ot) =exp{− 1
2 (ot−µi)′Σ−1
i (ot−µi)}(2π)D/2|Σi|1/2
where D refers to thedimensionality of the observation space.
• Initial state distribution π = {πi}, 1 ≤ i ≤ n , πi = P (si at t =1).
• n = number of hidden states.
4.1.2 Universal Background Model: A universal backgroundmodel (UBM) is a model used in a biometric verification system torepresent general, person-independent feature characteristics to becompared against a model of person-specific feature characteristicswhen making an accept or reject decision. For example, in a speakerverification system, the UBM is a speaker-independent Gaussianmixture model (GMM) trained with speech samples from a largeset of speakers to represent general speech characteristics. Using aspeaker-specific GMM trained with speech samples from a particularenrolled speaker, a likelihood-ratio test for an unknown speech sam-ple can be formed between the match score of the speaker-specificmodel and the UBM. The UBM may also be used while training the

speaker-specific model by acting as the prior model in maximum aposteriori (MAP) parameter estimation [23].
We applied UBM to initialize the HMM models using the dataavailable from all experiments regardless of containing anomalies ornot. This is advantageous as in unsupervised learning approach theanomalous events are not recognized antecedently. If the HMM mod-els adapted from a UBM (HMM-UBM) produce as promising resultsas HMM models for labeled data, we can claim that we achieve aqualified model even in absence of the labeled data. This in turnfacilitates the process of unsupervised modeling. We later comparethe detection results of the HMMs initialized with and without UBMin Section 6.
Given the data to train a UBM, there are many approaches thatcan be used to obtain the final model. The simplest is to merely poolall the data to train the UBM via the EM algorithm (Figure 1-a).One should be careful that the pooled data are balanced over thesubpopulations within the data. Otherwise, the final model will bebiased toward the dominant subpopulation [24]. Another approachis to train individual UBMs over the subpopulations in the data, andthen pool the subpopulation models together (Figure 1-b). The latterapproach has the advantages that one can effectively use unbalanceddata and can carefully control the composition of the final UBM[24]. In our model we used the first approach, and to avoid a biasedmodel we included the same amount of normal and anomalous datasequences. Half of the dataset contains normal samples and the restconsist of anomalous events (equal portion for each anomaly).
4.2 Anomaly Detection
4.2.1 Detection of anomalous time-series: The goal of thistype of anomaly detection is to find all anomalous time-series in adatabase of time-series, and to distinguish normal days from thosewhich contain a number of anomalous events. Similar to tradi-tional outlier∗ detection methods, the usual approach is to learn amodel based on all the time-series in the database, and then com-pute an outlier score for each sequence with respect to the model[24]. In our case, we build an HMM model with UBM initializationusing the training data of all the experiments. Then we calculate thelog-likelihood values of each time-series in the test dataset. Thoseexperiments that contain one or more anomalous events are expectedto gain lower log-likelihood values.
The likelihood value of HMM is the probability of an observationsequence given the model parameters. Equation 1 shows how thelikelihood value of HMM model λ is calculated.
P (O|λ) =∑all S
P (O|S, λ)P (S|λ)
=∑
s1,s2,...sT
πs1bs1(O1)as1,s2bs2(O2)...asT−1,sTbsT(OT)
(1)Due to the vanishingly small likelihood probabilities produced in
long time-series, normally the logarithmic value is utilized.Figure 2 shows the range of the log-likelihood values belonging to
the normal and anomalous experiments. The anomalous cases con-sist of AP Shutdown/Halt, AP Overload, Noise, and Flash Crowdscenarios. As this figure displays there is a distinction between thelog-likelihood values of the normal cases and the rest of the anoma-lies. However, the anomalous cases are not completely separatedand there is an overlap between them. The log-likelihood valuesof the AP Overload, Noise and AP Shutdown/Halt scenarios areapproximately in a similar range. However, those of the Flash Crowdscenario are slightly lower than the rest and take a widespread rangewhile the values of the AP Shutdown/Halt scenario are condensed ina limited range.
As a conclusion, all the anomalous cases obtain log-likelihoodvalues less than the normal range and thus it is feasible to distinguishthe anomalous time-series from the normal ones. However, due to
∗We use outlier and anomaly interchangeably in this context.
Fig. 2: Log-likelihood values of normal and anomalous experi-ments.
Fig. 3: Detection results of the observations data by the trainedHMM models.
the overlapping log-likelihood values of the anomalies, it is not thatsimple to make a distinction between the anomalous scenarios justby inspecting their log-likelihood values. In the next section we con-sider modeling the anomalous cases independently to facilitate thedistinction process.
4.2.2 Recognition of anomalous patterns: To capture dis-tinctive characteristics of the anomalous scenarios we build separateHMM models for each one and also one model for the normalscenario. Then we compute the probability of each observationsequence getting generated by each of these models. The HMMmodel that produces the highest log-likelihood value is consideredto be the generative model of the given time-series.
Choosing the best λ model among the competing models istermed as scoring problem and is an important function of log-likelihood values. At the end of this process we obtain a 2D matrixwhose rows and columns consist of HMM models and observationsequences, respectively.
Figure 3 presents the detection results of the HMM models giventhe normal and anomalous observation sequences. The x-axis con-tain the trained HMM models and the bottom part of the bars (inblue) demonstrate the percentage of time-series correctly detectedby their corresponding models. The top piece of the bars (in pink)show the mis-detection ratio that occurs in AP Overload and FlashCrowd scenarios. 25% of AP Overload time-series are detected to be

generated by Flash Crowd model. Moreover, 12.5% of Flash Crowdsequences are detected to be created by AP Overload model and12.5% of them by Noise model. Besides these trivial mis-detectionerrors, the distinction process yields promising results in recognitionof different anomalous patterns.
However, it should be taken into consideration that each anoma-lous time-series in our work contain a single anomaly, while inreality each time-series can contain no anomaly (in normal cases)or various anomalies (in anomalous cases). A methodology to detectanomalous periods and distinguish between different anomalouspatterns in unlabeled data is required to be performed in an unsu-pervised mode. Here we propose the basic scheme of an algorithmwhich is based on the general model training in [25], and is adaptedto our specific modeling approach and requisites:
1. A general HMM model is estimated with a large number oftraining samples (HMM-UBM).
2. Slice the first test sequence into fixed length segments. The seg-ment(s) with the lowest log-likelihood given the general model in1 is identified as anomaly.
3. A new anomalous model is adapted from the general modelusing the detected anomaly. A normal model is adapted from thegeneral model using the other segments.
4. Slice the next test sequence into fixed length segments. Esti-mate the log-likelihood values of all segments given the previousadapted models (normal and anomalous models of step 3).
5. Update the adapted models using those segments that achievecloser log-likelihood to each model. Adapt a new anomalousmodel from the general model using any segment that achievesextremely low log-likelihood given the existing models (a newanomaly that hardly belong to any previous model).
6. Repeat step 4 and 5 until there is no more test sequences.
There are a number of parameters in this algorithm that is to belearned and determined, for example the length of the fixed-size seg-ments, and the proper threshold for anomaly detection. However, bythe end of this algorithm we expect to have one normal model andseveral anomalous models each presenting a specific anomalous pat-tern. Further post-processes are also applicable to merge the verysimilar models (by measuring models’ distance) and yield the mostoptimized set of final models. More accurate explanation and imple-mentation of this algorithm is out of the scope of the current paperand is left for the future work.
4.2.3 Detection of anomalous points within a given time-series: In this approach the anomaly score (log-likelihood) iscomputed for each data point given the trained HMM model. Theunexpected low log-likelihood values show the divergence from thenormal model and are typically indicative of anomalies. This methodlocalizes the anomalous points or subsequences more precisely in thetest sequence.
To detect the anomalous points in the log-likelihood series auto-matically, we propose a technique called threshold detection todefine a boundary where the lower values belong to the anomalousset. As many anomaly detection algorithms presume, outliers are theminority group not following the common pattern of the majorities.Accordingly we look for the extreme data points (outliers) with thelowest log-likelihood values. To this end a univariate histogram isconstructed and the relative frequency (height of the histogram) iscomputed. The frequency of samples falling into each bin is used asan estimate of the density. We assume the samples with the highestdensity (mode) are the normal data points, and accordingly the binscontaining the lowest frequencies and farther from the mode are theoutliers. As a rule of thumb we mark bins with frequencies lowerthan a quarter of mode as outliers. Like any other change detec-tion algorithm ours as well produce false positives, however in allthe performed experiments of this work the false positive ratio isinsignificant.
We use the same algorithm to detect the outliers or anomaliesin RawData and PCA for the purpose of comparison. However, asRawData contains seven features, we conduct the algorithm on eachsingle feature and aggregate the detected points as the final outcome.
Fig. 4: Log-likelihood of the normal model together with anexample anomaly related to AP Overload experiment.
For example for the likelihood series of s1s2...s40, the algorithmdetects s2 and s4 as outlier points for the first feature and s4 and s15for the third feature and for the rest of the features no anomaly isdetected. In this case the final anomalous set contains {s2, s4, s15}.The same method is applied to the PCA components to detect theanomalous points for three principal components.
Figure 4 demonstrates the log-likelihood values of an exampleanomalous case (AP Overload) generated by simulation. The redpoints are the anomalies detected by threshold detection algorithmand the black diamond points show the real anomalous period.
We further explore this type of anomaly detection in Section 6 andanalyze each anomalous case specifically in more detail.
5 Experimental Setup
In order to evaluate the proposed strategy, we perform an exten-sive set of simulations using OMNeT++ [26] simulator and INETframework [27]. OMNeT++ is a C++-based discrete event simulator(DES) for modeling communication networks, multiprocessors andother distributed or parallel systems. It has a generic architecture andis used in various problem domains including the modeling of wiredand wireless communication networks.
One of the major network simulation model frameworks forOMNeT++ is the INET Framework that provides detailed proto-col models for TCP, IPv4, IPv6, Ethernet, Ieee802.11b/g, MPLS,OSPFv4, and several other protocols. We used OMNeT++ alongwith INET Framework to simulate the IEEE 802.11 WLANg (2.4GHz band) in infrastructure mode.
In a discrete event simulator, as well as the OMNeT++, eventstake place at discrete instances in time, and they take zero time tohappen. It is assumed that nothing important happens between twoconsecutive events. Thus the simulation time is relevant to the orderof events in the events’ queue, and it could take more than the realCPU time or less than it based on the number of nodes, amount oftraffic transfered, and other details of the network. In our example,with the current number of nodes (5 APs and 30 STAs) and trafficplan, 10 minutes of simulation time takes around 17 minutes of CPUtime. Our HMM approach operates on 40 consecutive time-slots of15s simulation time each.
5.1 Normal Scenario
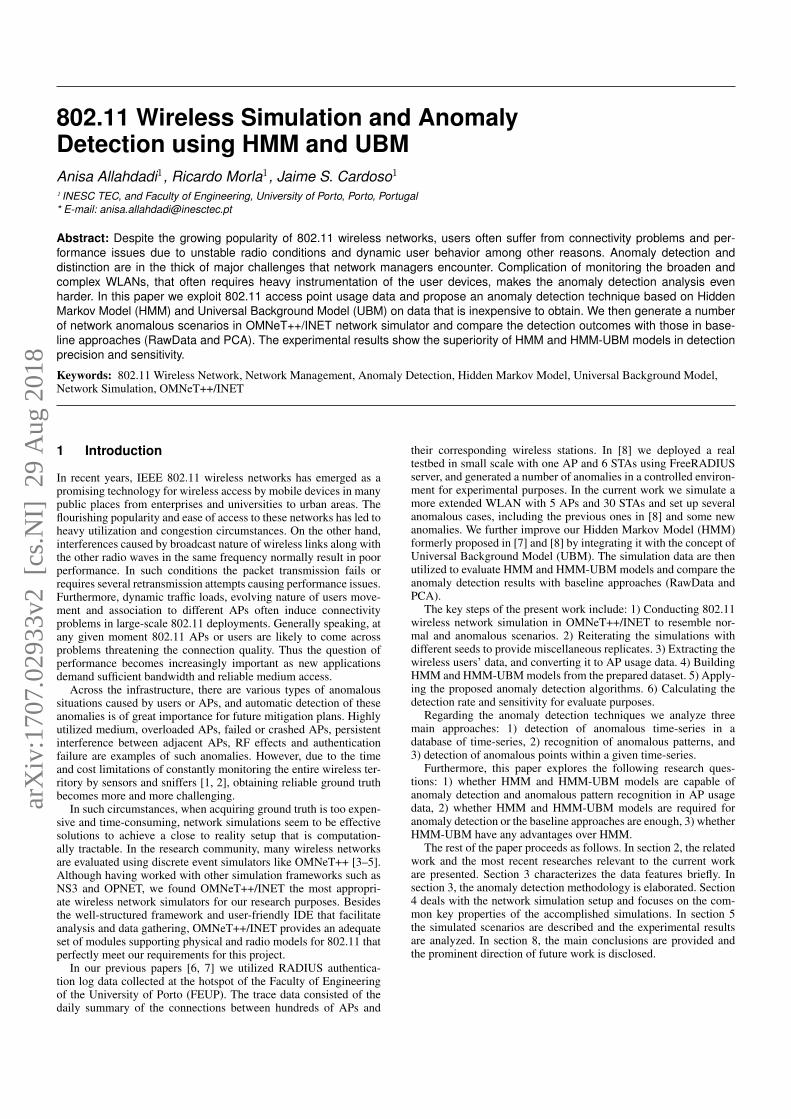
Figure 5a shows the initial picture of a normal scenario, the locationof the access points (APs), wireless stations (STAs), and the servers.Figure 5b displays the location of the wireless stations after passing30s (simulation time) from the beginning of the simulation.
(a) (b)
Fig. 5: a) The initial picture of the wireless network simulated in OMNeT++/INET. b) Location of the wireless stations after 30s of simulation.
In the normal scenario, there are 5 APs and 30 STAs. Each STA isinitially associated to one of the available APs depending on its loca-tion. During the simulation STAs, based on their mobility models,are handed over to other APs when moving around the simulationground. Furthermore, according to the defined traffic plans in section5.3, each node sends and receives packets to the existing servers.
5.2 Mobility Models of the Wireless Stations
The APs are stationary and the wireless nodes follow differentmobility patterns. In the current experiment, the mobility modelsof the nodes are selected in a way to emulate the usage behav-ior of three typical places in a campus. The mobile nodes initiallyconnected to the first AP (AP1) follow the Linear Mobility patternwhich is configured with speed, angle and acceleration parameters.The mobile nodes move to random destinations with the specifiedparameters and when they hit a wall they reflect off the wall at thesame defined angle. These nodes connect to the other AP (AP2)besides their own AP (AP1), and sometimes lose the connectionwhen they move to blind spots. This pattern is selected to symbolizethe nodes with some degree of freedom but within a limited spacelike administrative offices.
The nodes connected to the second AP (AP2) follow the MassMobility model, and accordingly move within the room. This patternof mobility is intended to represent places like classroom or libraryin which users do not leave the place frequently, but still have somemotions in the place.
The rest of the wireless nodes follow the Random WaypointMobility and move to a random destination (distributed uniformlyover the playground) with a random speed. When the node reachesthe target position, it waits for a specified waitTime and selects a newrandom position afterwards. This type of movement resembles therandom mobile users around the wireless ground mostly connectedwith their mobile devices.
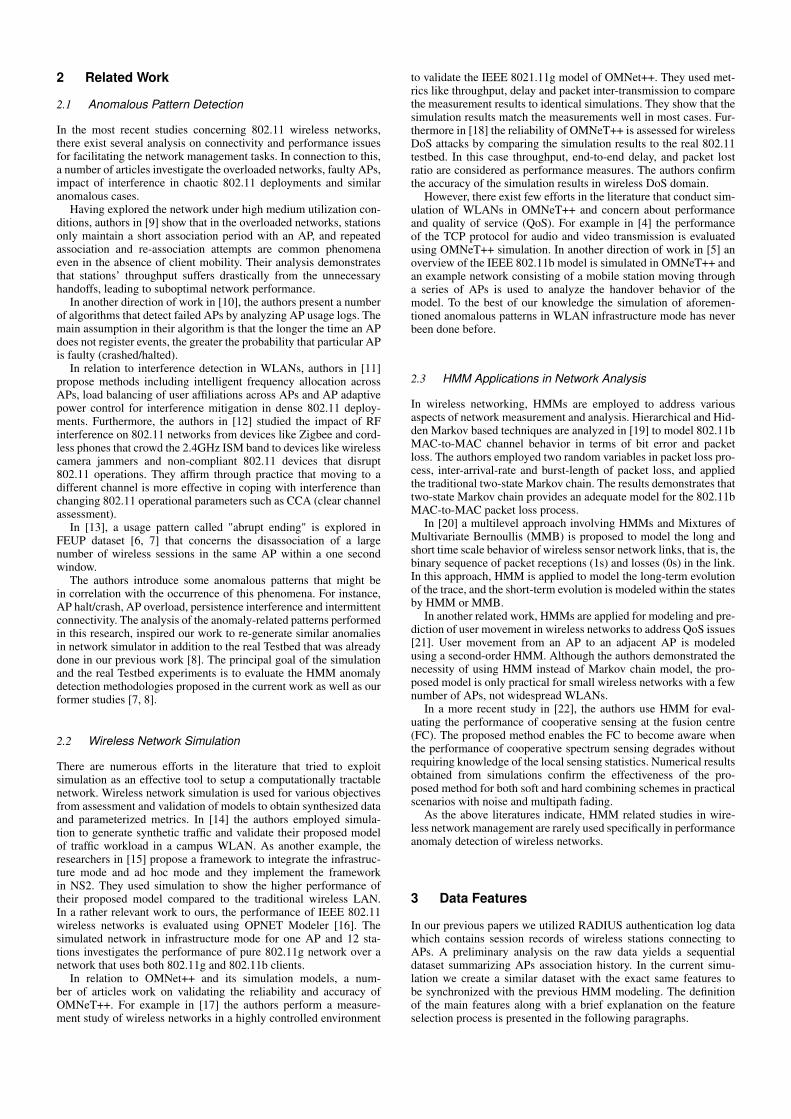
A summary of wireless nodes’ specifications in terms of mobilitymodels is provided in Table 1.
5.3 Traffic Generation
As it is shown in Figure 5a and 5b, there are three main serverswire connected to the Ethernet switch: srvHostVideo, srvHostFTP,and srvHostEcho. The traffic transfered between wireless stationsand the servers (through APs) is considered to be User DatagramProtocol (UDP). The video server (srvHostVideo) sends UDP pack-ets with the message length of N (600B, 150B) to the clients ofAP2, resembling the video downloading by those users. The FTP
Table 1 Wireless nodes’ specifications in terms of mobility modelsMobility Model #
NodesMobility Parameters
Linear Mobility 6 speed: truncnormal∗ (20mps,10mps)angle: normal† (270deg, 90deg)acceleration: 0
Mass Mobility 10 speed: truncnormal(70mps, 50mps)changeInterval: truncnormal(2ms,0.5ms)changeAngleBy: normal(90deg,90deg)
Random Way-point Mobility
14 speed: uniform‡ (50mps,50mps)waitTime: uniform(3s,8s)
server (srvHostFTP) is to receive the FTP uploads by the clients ofAP1 with message length of N (500B, 100B). In addition to exclu-sively downloading or uploading, the other server (srvHostEcho) isin charge of sending and receiving traffics to all the users. This trafficpattern represents the common act of email checking and web brows-ing by the wireless nodes. The echo packets length are configuredto be smaller than the previous ones, N (200B, 50B), indicatinga lighter traffic transmission. In AP Overload anomalous scenarioone more server is added to take care of heavy channel utilization(srvHostBurst), and more detail about that can be found in section6.2.
5.4 Path Loss Models
As the signal propagates through space its power density decreases.Path loss might be due to the combination of many effects, suchas free-space loss, refraction, diffraction, reflection, and absorption.The path loss model computes the power loss factor based on thetraveled distance, the signal frequency and the propagation speed. Inour experiments we utilized the following four path loss models toincrease the complexity of the simulation and make it more realistic:
• Free Space Path Loss: is the loss in signal strength resulting froma line-of-sight path through free space, with no obstacles nearbyto cause reflection or diffraction.
• Log Normal Shadowing: is a stochastic path loss model, wherepower levels follow a lognormal distribution. It is useful formodeling shadowing caused by objects such as trees.
(a) HMM (b) HMM-UBM
Fig. 6: The log-likelihood series and detected anomalies of AP shutdown/halt scenario in HMM and HMM-UBM models.
• Rician Fading: is a stochastic path loss model which assumesa dominant line-of-sight signal and multiple reflected signalsbetween the transmitter and the receiver. It is useful for modelingradio propagation in an urban environment.
• Rayleigh Fading: is the loss in signal magnitude according to aRayleigh distribution - the radial component of the sum of twouncorrelated Gaussian random variables. It is useful for modelingthe effect of heavily built-up urban environments on radio signals.
6 Experimental Results and Evaluation
In this section we explore a set of anomalous scenarios and describedifferent cases of each one. Then we present the HMM and HMM-UBM results in anomaly detection and compare them to baselineapproaches (RawData and PCA) for evaluation purposes.
In terms of HMMs, we consider fully connected models (ergodic),continuous observations with Gaussian distributions, and 3 hiddenstates. The HMMs with 2 states are too simple to capture the diversecharacteristics of the locations (APs), while there is not enough vari-ety in day-long sequential data for 4 or higher number of states. Eachexperiment is repeated at least 20 times with different seeds in orderto examine the models on miscellaneous samples providing slightlydifferent data. 80% of the data sequences is used for training themodel and 20% is kept for testing.
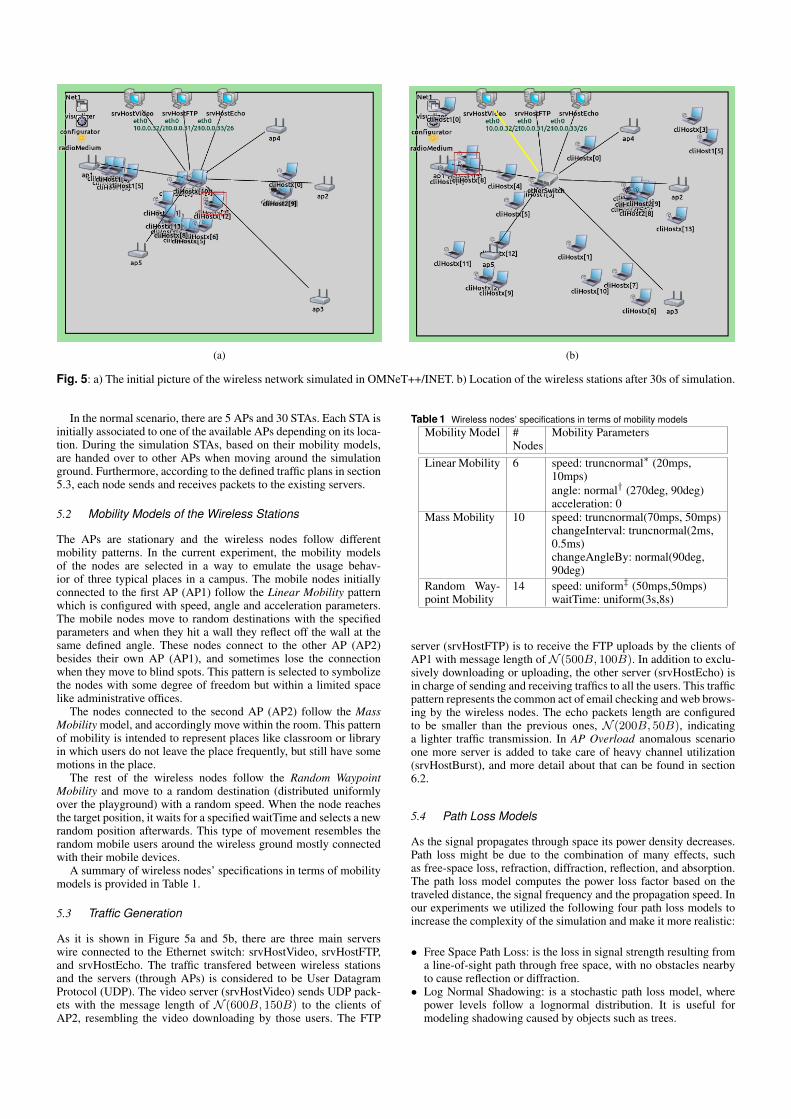
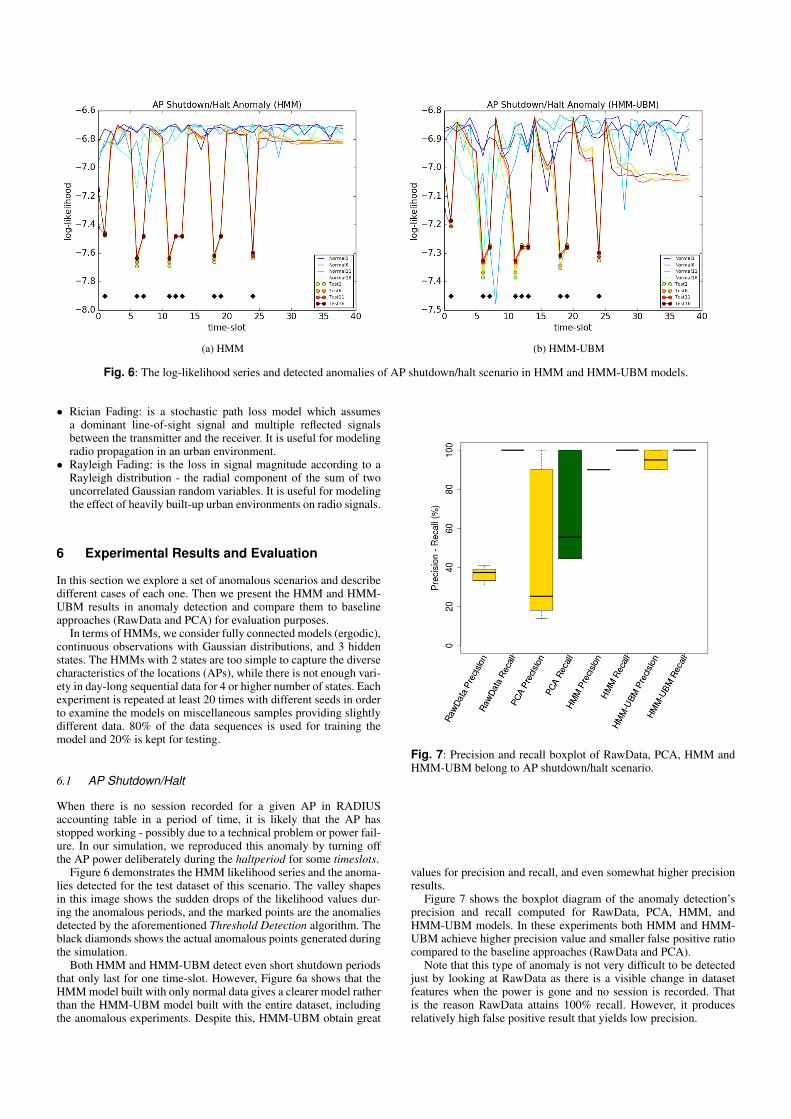
6.1 AP Shutdown/Halt
When there is no session recorded for a given AP in RADIUSaccounting table in a period of time, it is likely that the AP hasstopped working - possibly due to a technical problem or power fail-ure. In our simulation, we reproduced this anomaly by turning offthe AP power deliberately during the haltperiod for some timeslots.
Figure 6 demonstrates the HMM likelihood series and the anoma-lies detected for the test dataset of this scenario. The valley shapesin this image shows the sudden drops of the likelihood values dur-ing the anomalous periods, and the marked points are the anomaliesdetected by the aforementioned Threshold Detection algorithm. Theblack diamonds shows the actual anomalous points generated duringthe simulation.
Both HMM and HMM-UBM detect even short shutdown periodsthat only last for one time-slot. However, Figure 6a shows that theHMM model built with only normal data gives a clearer model ratherthan the HMM-UBM model built with the entire dataset, includingthe anomalous experiments. Despite this, HMM-UBM obtain great
Fig. 7: Precision and recall boxplot of RawData, PCA, HMM andHMM-UBM belong to AP shutdown/halt scenario.
values for precision and recall, and even somewhat higher precisionresults.
Figure 7 shows the boxplot diagram of the anomaly detection’sprecision and recall computed for RawData, PCA, HMM, andHMM-UBM models. In these experiments both HMM and HMM-UBM achieve higher precision value and smaller false positive ratiocompared to the baseline approaches (RawData and PCA).
Note that this type of anomaly is not very difficult to be detectedjust by looking at RawData as there is a visible change in datasetfeatures when the power is gone and no session is recorded. Thatis the reason RawData attains 100% recall. However, it producesrelatively high false positive result that yields low precision.

(a) burstduration < sleepduration (b) burstduration = sleepduration (c) burstduration > sleepduration
Fig. 8: The log-likelihood series and detected anomalies of AP overload scenario (HMM).
(a) burstduration < sleepduration (b) burstduration = sleepduration (c) burstduration > sleepduration
Fig. 9: The log-likelihood series and detected anomalies of AP overload scenario (HMM-UBM).
Fig. 10: Precision and recall boxplot of RawData, PCA and HMM belong to AP overload scenario. Left: burstduration < sleepduration,middle: burstduration = sleepduration, right: burstduration > sleepduration.
6.2 AP Overload
In this anomalous case, the excessive channel utilization occurs thatcould be the consequence of excessive download or upload by anumber of wireless users. In such circumstances, the clients couldget disconnected from the current AP frequently even with the pres-ence of high signal strength. In this experiment we simulated APheavy usage caused by all of the users of the second AP. Burst server(srvHostBurst) sends UDP packets to the given IP addresses in burstsduring the burstduration which resembles the heavy downloads of
the wireless users. In the time of sleepduration the burst flow stopsand the channel utilization gets back to normal. This experimentcontains three different cases as following:
• burstduration < sleepduration.• burstduration = sleepduration.• burstduration > sleepduration.
Figure 8 and 9 display the log-likelihood series of three types ofburstduration and sleepduration obtained for AP overload scenario

(a) -90 dBm (b) -95 dBm (c) -100 dBm
Fig. 11: The log-likelihood series and detected anomalies of Noise scenario (HMM).
(a) -90 dBm (b) -95 dBm (c) -100 dBm
Fig. 12: The log-likelihood series and detected anomalies of Noise scenario (HMM-UBM).
Fig. 13: Precision and recall boxplot of RawData, PCA, HMM and HMM-UBM belong to noise scenario. Left: -90dBm, middle: -95dBm,right: -100dBm.
applying HMM and HMM-UBM methodologies, respectively. As itis shown in these figures, during the burst period the log-likelihoodvalue drops drastically and in the sleep period it raises again to thenormal level. The longer the burst period the wider is the valleyshape in the log-likelihood series, and both HMM and HMM-UBMeffectively detect heavy utilization periods in all these cases.
Figure 10 displays the boxplot diagram of the precision and recallresults of RawData, PCA, HMM and HMM-UBM models. Thelow precision ratios of RawData and PCA show that this type ofanomaly is not that straightforward to detect directly from the raw
data and needs some advanced techniques. The HMM and HMM-UBM results, both in precision and recall, outperform the baselineapproaches with a discernible distance.
6.3 Noise
Thermal noise, cosmic background noise, and other random fluctu-ations of the electromagnetic field affect the quality of the commu-nication channel. This kind of noise doesn’t come from a particular
(a) Flash Crowd Arrival Scenario (b) Flash Crowd Departure Scenario
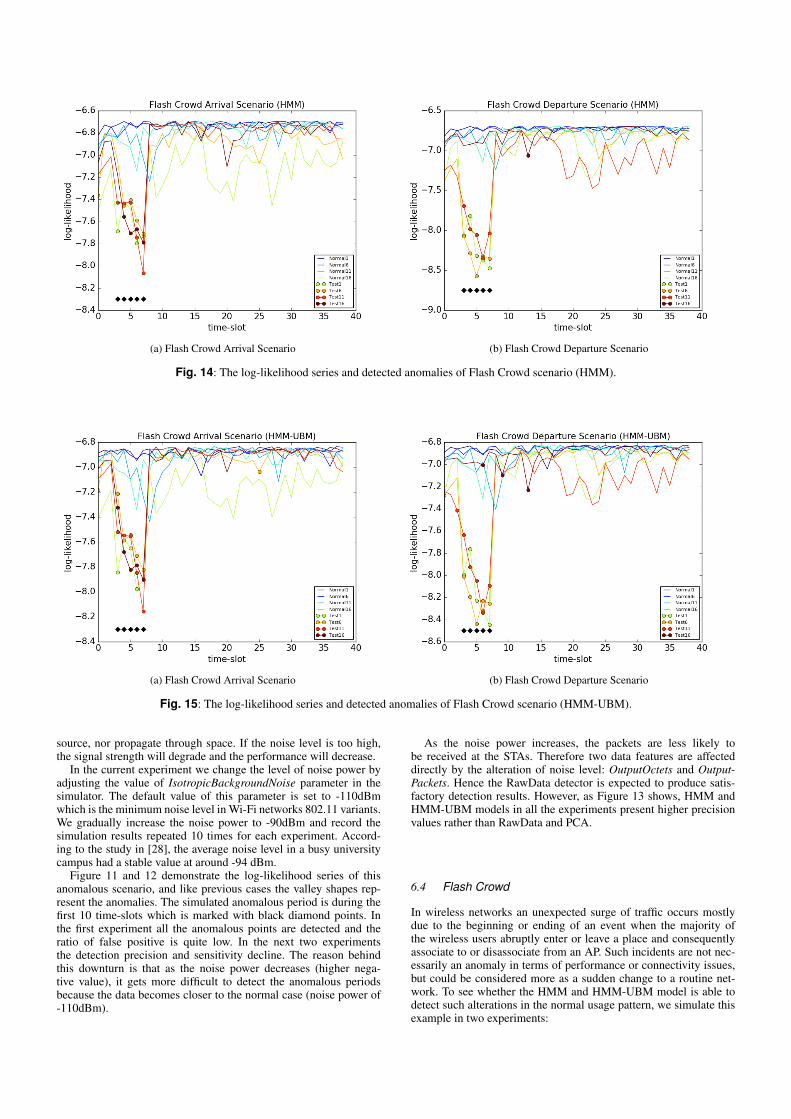
Fig. 14: The log-likelihood series and detected anomalies of Flash Crowd scenario (HMM).
(a) Flash Crowd Arrival Scenario (b) Flash Crowd Departure Scenario
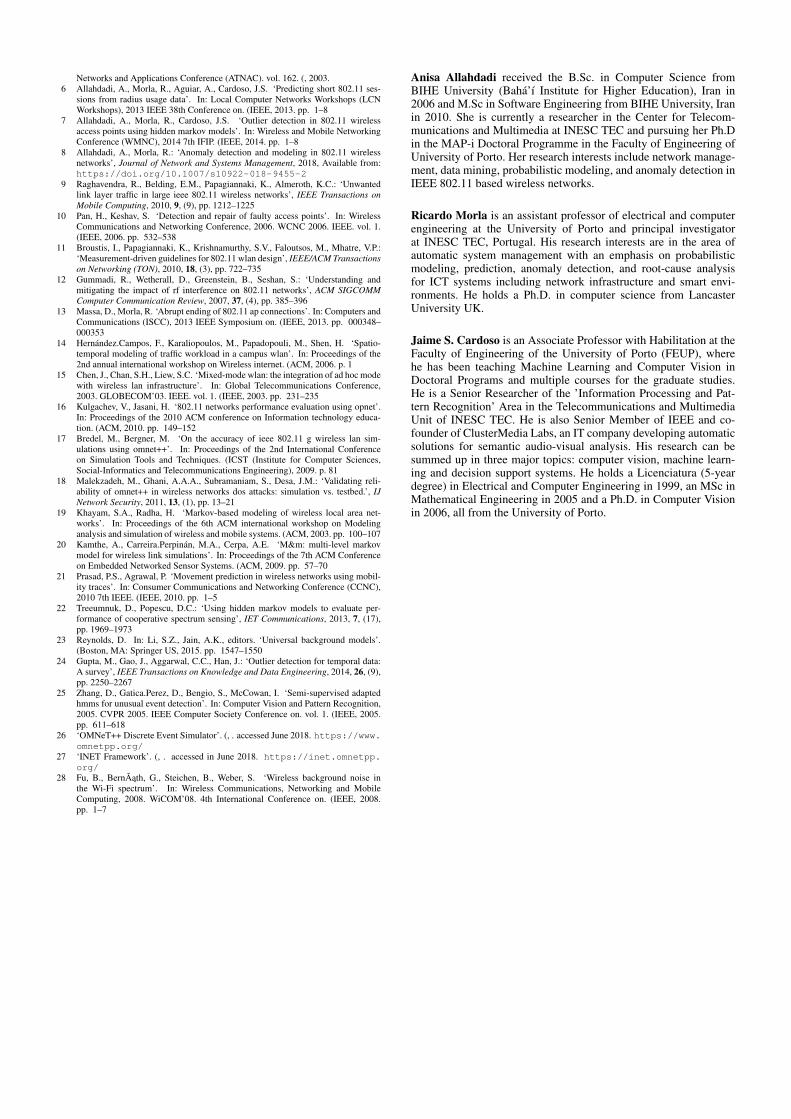
Fig. 15: The log-likelihood series and detected anomalies of Flash Crowd scenario (HMM-UBM).
source, nor propagate through space. If the noise level is too high,the signal strength will degrade and the performance will decrease.
In the current experiment we change the level of noise power byadjusting the value of IsotropicBackgroundNoise parameter in thesimulator. The default value of this parameter is set to -110dBmwhich is the minimum noise level in Wi-Fi networks 802.11 variants.We gradually increase the noise power to -90dBm and record thesimulation results repeated 10 times for each experiment. Accord-ing to the study in [28], the average noise level in a busy universitycampus had a stable value at around -94 dBm.
Figure 11 and 12 demonstrate the log-likelihood series of thisanomalous scenario, and like previous cases the valley shapes rep-resent the anomalies. The simulated anomalous period is during thefirst 10 time-slots which is marked with black diamond points. Inthe first experiment all the anomalous points are detected and theratio of false positive is quite low. In the next two experimentsthe detection precision and sensitivity decline. The reason behindthis downturn is that as the noise power decreases (higher nega-tive value), it gets more difficult to detect the anomalous periodsbecause the data becomes closer to the normal case (noise power of-110dBm).
As the noise power increases, the packets are less likely tobe received at the STAs. Therefore two data features are affecteddirectly by the alteration of noise level: OutputOctets and Output-Packets. Hence the RawData detector is expected to produce satis-factory detection results. However, as Figure 13 shows, HMM andHMM-UBM models in all the experiments present higher precisionvalues rather than RawData and PCA.
6.4 Flash Crowd
In wireless networks an unexpected surge of traffic occurs mostlydue to the beginning or ending of an event when the majority ofthe wireless users abruptly enter or leave a place and consequentlyassociate to or disassociate from an AP. Such incidents are not nec-essarily an anomaly in terms of performance or connectivity issues,but could be considered more as a sudden change to a routine net-work. To see whether the HMM and HMM-UBM model is able todetect such alterations in the normal usage pattern, we simulate thisexample in two experiments:

Fig. 16: Precision and recall boxplot of RawData, PCA and HMM belong to flash crowd scenario. Left: arrival scenario, right: departurescenario.
• Arrival: simultaneous association of 7 new nodes to the currentAP.
• Departure: simultaneous disassociation of 7 existing nodes fromthe current AP.
Figure 15 and 11 present the log-likelihood series of Flash Crowdscenario, and detected anomalous points as colored circles and simu-lated anomalies as black diamonds. Only in one test case in departurescenario which is related to Rician Fading path loss, anomalousperiod is not detected neither in HMM nor in HMM-UBM. In therest of the experiments the anomaly detection technique performsaccurately both in arrival and departure scenarios.
As it is illustrated in the boxplot diagram of Figure 16, HMM andHMM-UBM easily outperform the RawData and PCA results in bothArrival and Departure scenarios. However, due to the aforemen-tioned exception in the departure scenario, the arrival experimentsachieve higher precision and recall.
7 Conclusions and Future Work
Intelligent detection of anomalies in 802.11 networks from the anal-ysis of the collected AP usage data is of great significance to networkmanagers. It facilitates their everyday administration workload, andassists them in network maintenance, providing future mitigationplans.
The key contributions of this work consist of: 1) HMM modelingand threshold detection technique for anomaly detection, 2) propos-ing HMM-UBM technique for a robust initialization of the hiddenstates and unsupervised learning, 3) simulation of a small WLANand a number of anomalous scenarios to evaluate the anomalydetection results.
The precision and recall outcomes of the anomalous cases arecomputed and compared to the baseline approaches (RawData andPCA). The experimental results show that HMM and HMM-UBMmodels are both capable of detecting a great portion of anomalieswhile producing only a trivial false positive ratio. This is promisingfor in HMM-UBM model all the data, regardless of being normalor containing anomalous events, is utilized to initialize the HMM
model. Thus, in unsupervised learning, when the normal data is notknown beforehand, HMM-UBM yields a robust model as reliable asHMM for anomaly detection purposes.
In future work we intend to propose a hybrid HMM model thatconsider the spatial proximity of APs in addition to the temporalrelativity of data sequences. Furthermore, we intend to propose anunsupervised learning algorithm for modeling and characterizingvarious anomaly-related patterns.
8 Acknowledgement
This work is financed by the ERDF - European Regional Devel-opment Fund through the Operational Programme for Competi-tiveness and Internationalisation - COMPETE 2020 Programmewithin project POCI-01-0145-FEDER-006961, and by NationalFunds through the FCT - Fundação para a Ciência e a Tecnolo-gia (Portuguese Foundation for Science and Technology) as part ofproject UID/EEA/50014/2013. The first author is also sponsored byFCT grant SFRH/BD/99714/2014.
9 References1 Cheng, Y.C., Bellardo, J., Benkö, P., Snoeren, A.C., Voelker, G.M., Savage, S.
‘Jigsaw: Solving the puzzle of enterprise 802.11 analysis’. In: Proceedings of the2006 Conference on Applications, Technologies, Architectures, and Protocols forComputer Communications. SIGCOMM ’06. (New York, NY, USA: ACM, 2006.pp. 39–50. Available from: http://doi.acm.org/10.1145/1159913.1159920
2 Sheth, A., Doerr, C., Grunwald, D., Han, R., Sicker, D. ‘Mojo: A distributed phys-ical layer anomaly detection system for 802.11 wlans’. In: Proceedings of the4th international conference on Mobile systems, applications and services. (ACM,2006. pp. 191–204
3 Colesanti, U.M., Crociani, C., Vitaletti, A. ‘On the accuracy of omnet++ in thewireless sensornetworks domain: simulation vs. testbed’. In: Proceedings of the4th ACM workshop on Performance evaluation of wireless ad hoc, sensor, andubiquitous networks. (ACM, 2007. pp. 25–31
4 Qashi, R., Bogdan, M., Haenssgen, K. ‘Analysis of packet throughput and delay inieee 802.11 wlans with udp traffic’. In: International Conference on Mobile Com-munications, Networking and Applications (MobiCONA). Proceedings. (GlobalScience and Technology Forum, 2011. p. M48
5 Woon, S., Wu, E., Sekercioglu, A. ‘A simulation model of ieee802. 11b for per-formance analysis of wireless lan protocols’. In: Australian Telecommunications,
Networks and Applications Conference (ATNAC). vol. 162. (, 2003.6 Allahdadi, A., Morla, R., Aguiar, A., Cardoso, J.S. ‘Predicting short 802.11 ses-
sions from radius usage data’. In: Local Computer Networks Workshops (LCNWorkshops), 2013 IEEE 38th Conference on. (IEEE, 2013. pp. 1–8
7 Allahdadi, A., Morla, R., Cardoso, J.S. ‘Outlier detection in 802.11 wirelessaccess points using hidden markov models’. In: Wireless and Mobile NetworkingConference (WMNC), 2014 7th IFIP. (IEEE, 2014. pp. 1–8
8 Allahdadi, A., Morla, R.: ‘Anomaly detection and modeling in 802.11 wirelessnetworks’, Journal of Network and Systems Management, 2018, Available from:https://doi.org/10.1007/s10922-018-9455-2
9 Raghavendra, R., Belding, E.M., Papagiannaki, K., Almeroth, K.C.: ‘Unwantedlink layer traffic in large ieee 802.11 wireless networks’, IEEE Transactions onMobile Computing, 2010, 9, (9), pp. 1212–1225
10 Pan, H., Keshav, S. ‘Detection and repair of faulty access points’. In: WirelessCommunications and Networking Conference, 2006. WCNC 2006. IEEE. vol. 1.(IEEE, 2006. pp. 532–538
11 Broustis, I., Papagiannaki, K., Krishnamurthy, S.V., Faloutsos, M., Mhatre, V.P.:‘Measurement-driven guidelines for 802.11 wlan design’, IEEE/ACM Transactionson Networking (TON), 2010, 18, (3), pp. 722–735
12 Gummadi, R., Wetherall, D., Greenstein, B., Seshan, S.: ‘Understanding andmitigating the impact of rf interference on 802.11 networks’, ACM SIGCOMMComputer Communication Review, 2007, 37, (4), pp. 385–396
13 Massa, D., Morla, R. ‘Abrupt ending of 802.11 ap connections’. In: Computers andCommunications (ISCC), 2013 IEEE Symposium on. (IEEE, 2013. pp. 000348–000353
14 Hernández.Campos, F., Karaliopoulos, M., Papadopouli, M., Shen, H. ‘Spatio-temporal modeling of traffic workload in a campus wlan’. In: Proceedings of the2nd annual international workshop on Wireless internet. (ACM, 2006. p. 1
15 Chen, J., Chan, S.H., Liew, S.C. ‘Mixed-mode wlan: the integration of ad hoc modewith wireless lan infrastructure’. In: Global Telecommunications Conference,2003. GLOBECOM’03. IEEE. vol. 1. (IEEE, 2003. pp. 231–235
16 Kulgachev, V., Jasani, H. ‘802.11 networks performance evaluation using opnet’.In: Proceedings of the 2010 ACM conference on Information technology educa-tion. (ACM, 2010. pp. 149–152
17 Bredel, M., Bergner, M. ‘On the accuracy of ieee 802.11 g wireless lan sim-ulations using omnet++’. In: Proceedings of the 2nd International Conferenceon Simulation Tools and Techniques. (ICST (Institute for Computer Sciences,Social-Informatics and Telecommunications Engineering), 2009. p. 81
18 Malekzadeh, M., Ghani, A.A.A., Subramaniam, S., Desa, J.M.: ‘Validating reli-ability of omnet++ in wireless networks dos attacks: simulation vs. testbed.’, IJNetwork Security, 2011, 13, (1), pp. 13–21
19 Khayam, S.A., Radha, H. ‘Markov-based modeling of wireless local area net-works’. In: Proceedings of the 6th ACM international workshop on Modelinganalysis and simulation of wireless and mobile systems. (ACM, 2003. pp. 100–107
20 Kamthe, A., Carreira.Perpinán, M.A., Cerpa, A.E. ‘M&m: multi-level markovmodel for wireless link simulations’. In: Proceedings of the 7th ACM Conferenceon Embedded Networked Sensor Systems. (ACM, 2009. pp. 57–70
21 Prasad, P.S., Agrawal, P. ‘Movement prediction in wireless networks using mobil-ity traces’. In: Consumer Communications and Networking Conference (CCNC),2010 7th IEEE. (IEEE, 2010. pp. 1–5
22 Treeumnuk, D., Popescu, D.C.: ‘Using hidden markov models to evaluate per-formance of cooperative spectrum sensing’, IET Communications, 2013, 7, (17),pp. 1969–1973
23 Reynolds, D. In: Li, S.Z., Jain, A.K., editors. ‘Universal background models’.(Boston, MA: Springer US, 2015. pp. 1547–1550
24 Gupta, M., Gao, J., Aggarwal, C.C., Han, J.: ‘Outlier detection for temporal data:A survey’, IEEE Transactions on Knowledge and Data Engineering, 2014, 26, (9),pp. 2250–2267
25 Zhang, D., Gatica.Perez, D., Bengio, S., McCowan, I. ‘Semi-supervised adaptedhmms for unusual event detection’. In: Computer Vision and Pattern Recognition,2005. CVPR 2005. IEEE Computer Society Conference on. vol. 1. (IEEE, 2005.pp. 611–618
26 ‘OMNeT++ Discrete Event Simulator’. (, . accessed June 2018. https://www.omnetpp.org/
27 ‘INET Framework’. (, . accessed in June 2018. https://inet.omnetpp.org/
28 Fu, B., BernÃath, G., Steichen, B., Weber, S. ‘Wireless background noise inthe Wi-Fi spectrum’. In: Wireless Communications, Networking and MobileComputing, 2008. WiCOM’08. 4th International Conference on. (IEEE, 2008.pp. 1–7
Anisa Allahdadi received the B.Sc. in Computer Science fromBIHE University (Bahá’í Institute for Higher Education), Iran in2006 and M.Sc in Software Engineering from BIHE University, Iranin 2010. She is currently a researcher in the Center for Telecom-munications and Multimedia at INESC TEC and pursuing her Ph.Din the MAP-i Doctoral Programme in the Faculty of Engineering ofUniversity of Porto. Her research interests include network manage-ment, data mining, probabilistic modeling, and anomaly detection inIEEE 802.11 based wireless networks.
Ricardo Morla is an assistant professor of electrical and computerengineering at the University of Porto and principal investigatorat INESC TEC, Portugal. His research interests are in the area ofautomatic system management with an emphasis on probabilisticmodeling, prediction, anomaly detection, and root-cause analysisfor ICT systems including network infrastructure and smart envi-ronments. He holds a Ph.D. in computer science from LancasterUniversity UK.
Jaime S. Cardoso is an Associate Professor with Habilitation at theFaculty of Engineering of the University of Porto (FEUP), wherehe has been teaching Machine Learning and Computer Vision inDoctoral Programs and multiple courses for the graduate studies.He is a Senior Researcher of the ’Information Processing and Pat-tern Recognition’ Area in the Telecommunications and MultimediaUnit of INESC TEC. He is also Senior Member of IEEE and co-founder of ClusterMedia Labs, an IT company developing automaticsolutions for semantic audio-visual analysis. His research can besummed up in three major topics: computer vision, machine learn-ing and decision support systems. He holds a Licenciatura (5-yeardegree) in Electrical and Computer Engineering in 1999, an MSc inMathematical Engineering in 2005 and a Ph.D. in Computer Visionin 2006, all from the University of Porto.