FACTORS AFFECTING ANOMALY FORMATION IN DRILLED ...
293
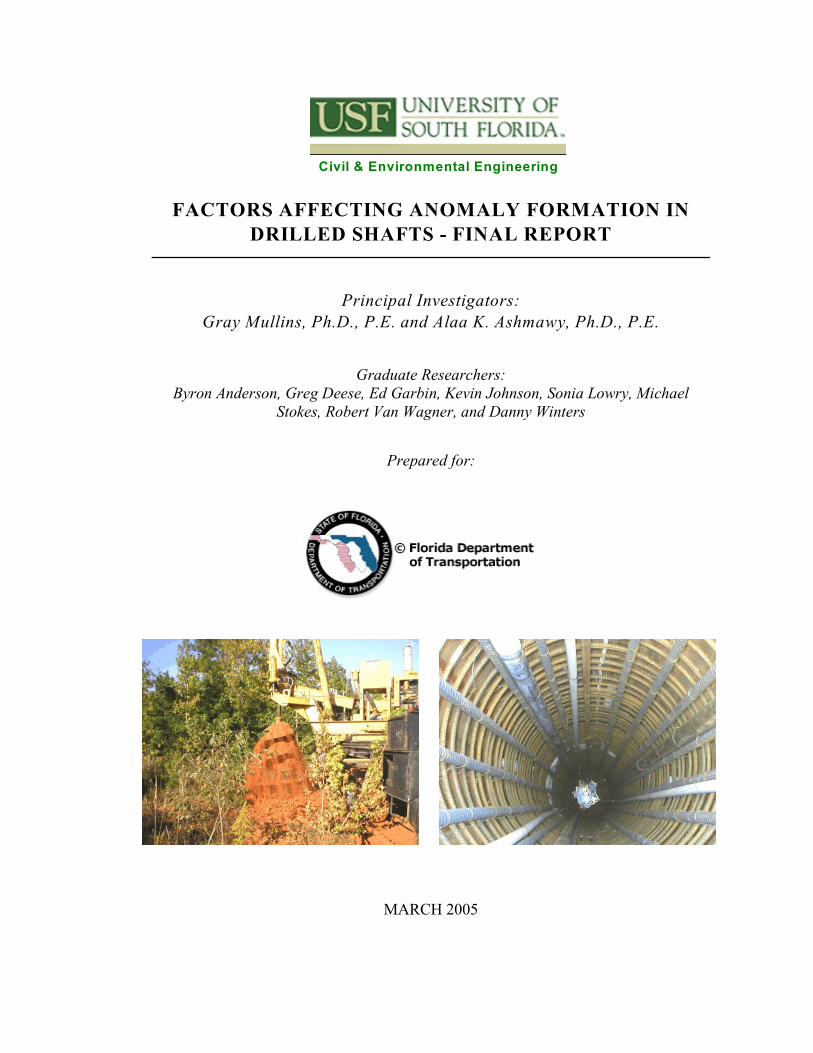
Civil & Environmental Engineering FACTORS AFFECTING ANOMALY FORMATION IN DRILLED SHAFTS - FINAL REPORT Principal Investigators: Gray Mullins, Ph.D., P.E. and Alaa K. Ashmawy, Ph.D., P.E. Graduate Researchers: Byron Anderson, Greg Deese, Ed Garbin, Kevin Johnson, Sonia Lowry, Michael Stokes, Robert Van Wagner, and Danny Winters Prepared for: MARCH 2005
-
Upload
khangminh22 -
Category
Documents
-
view
4 -
download
0
Transcript of FACTORS AFFECTING ANOMALY FORMATION IN DRILLED ...
Civil & Environmental Engineering
FACTORS AFFECTING ANOMALY FORMATION INDRILLED SHAFTS - FINAL REPORT
Principal Investigators:Gray Mullins, Ph.D., P.E. and Alaa K. Ashmawy, Ph.D., P.E.
Graduate Researchers:Byron Anderson, Greg Deese, Ed Garbin, Kevin Johnson, Sonia Lowry, Michael
Stokes, Robert Van Wagner, and Danny Winters
Prepared for:
MARCH 2005

i
DISCLAIMER
The opinions, findings and conclusions expressed in this publication are those of the authorsand not necessarily those of the State of Florida Department of Transportation.
ii
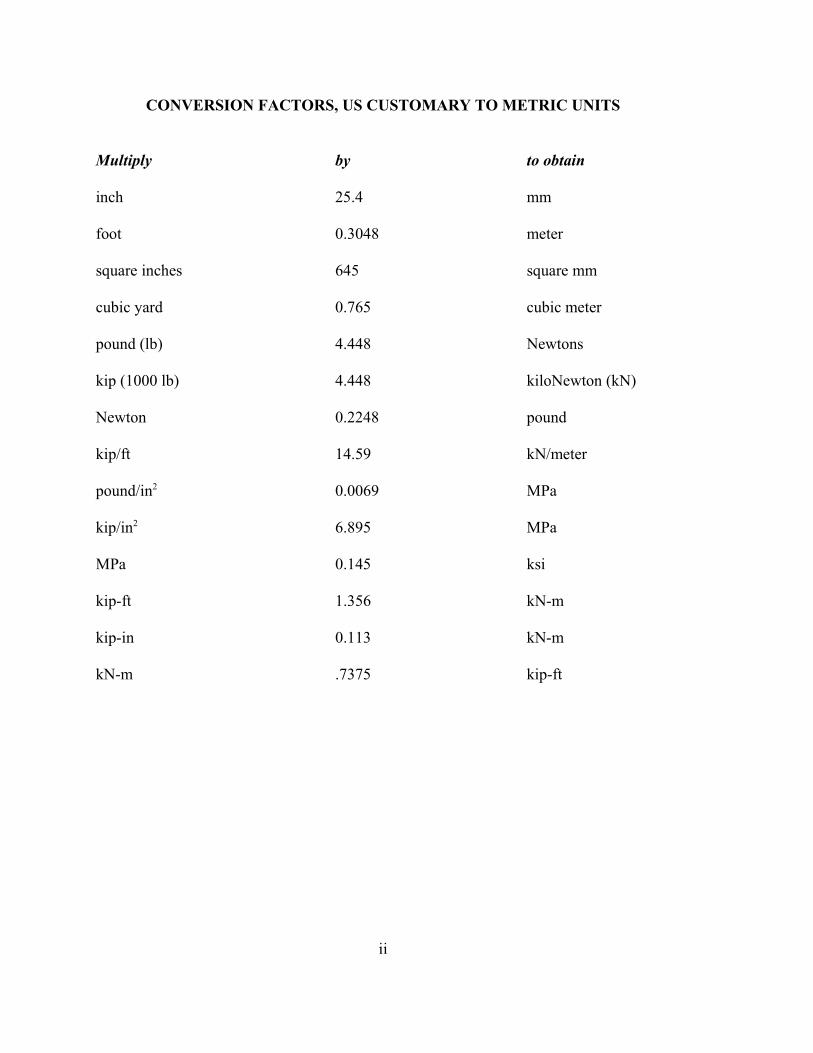
CONVERSION FACTORS, US CUSTOMARY TO METRIC UNITS
Multiply by to obtain
inch 25.4 mm
foot 0.3048 meter
square inches 645 square mm
cubic yard 0.765 cubic meter
pound (lb) 4.448 Newtons
kip (1000 lb) 4.448 kiloNewton (kN)
Newton 0.2248 pound
kip/ft 14.59 kN/meter
pound/in 0.0069 MPa2
kip/in 6.895 MPa2
MPa 0.145 ksi
kip-ft 1.356 kN-m
kip-in 0.113 kN-m
kN-m .7375 kip-ft

iii
PREFACE
This research project was funded as a supplemental contract awarded to the University ofSouth Florida, Tampa by the Florida Department of Transportation. Dr. David Horhota wasthe Project Manager. It is a pleasure to acknowledge his contribution to this study.
This project was carried out in part with the cooperation and collaboration of AuburnUniversity. The contributions provided by this institution are greatly appreciated withparticular acknowledgment to Dr. Dan Brown.
Likewise, the principal investigator is indebted to following companies and their associatesfor the interaction they afforded: Applied Foundation Testing, Case Foundation, RussoCorporation, and Trevi Icos South. Therein, the opportunity to interact with primecontractors and provide access to sites was made possible by: Michael Muchard and DonRobertson; Rube Clarson and Nigel Osborne; Harris Wilson; and Bud Khouri and MichaelRossie, respectively.
Special thanks are extended to the College of Engineering’s Machine Shop staff of Mr. BobSmith, Mr. James Christopher, and Mr. Tom Gage for their unending support. Theassistance of graduate researchers (not in any order) Mr. Byron Anderson, Mr. Kadir Uslu,Mr. Greg Deese, Dr. Ed Garbin, Mr. Kevin Johnson, Mrs. Sonia Lowry, Mr. Michael Stokes,Mr. Van Wagner and Mr. Danny Winters as well as undergraduate assistant Mr. RyanFlorence is duly recognized.

iv
THIS PAGE IS INTENTIONALLY BLANK

v
EXECUTIVE SUMMARY
In instances where excavation around drilled shafts has been required (e.g. footings,foundation caps, etc.) imperfections or anomalous conditions have frequently been observed.In many instances this was thought to have been caused by the presence of the water table.This seemingly alarming trend prompted the Florida Department of Transportation tosponsor a research program aimed at revealing the mystery of this phenomenon.
Upon reviewing the preliminary research findings this study defined factors that likelyaffected the occurrence of these conditions. Primary focus was directed at boreholecleanliness, concrete placement techniques, slump, clear spacing of rebar, aggregate size,and placement of concrete under a fluid head (such as drilling slurry).
Laboratory testing in the Lateral Pressure Cell was conducted to investigate the relationshipbetween lateral pressure development and slump during pour, coarse aggregate size, clearspacing of rebar, and fluid head in the borehole. The most interesting finding of this seriesof tests was that the rebar clear spacing to aggregate diameter ratio of 3 to 5, which is mostoften specified, leads to substantial build-up of material inside the cage before enoughpressure is developed to push the shaft mix through the cage to the annular volume outsidethe cage.
Field testing on full scale drilled shafts on numerous sites and over 40 data sets was thenconducted in order to corroborate the findings in the lab. Using a down-hole camera and/orweighted tape measurements, head differentials between inner and outer cage material werefound to be excessively large even when using common mixes and rebar spacing. Thisbuild-up was found to be closely related to the clear spacing of the rebar, aggregate size, andrate of concreting.
A second series of laboratory testing in the Frustum Confining Vessel evaluated constructionfactors affecting finish shaft performance (e.g. casing extraction rate, slump, and slumploss). These tests found that when using the temporary casing method of construction, theunit skin friction developed by the shaft was drastically reduced when the slump of theconcrete was allowed to drop below 5 inches prior to pulling the casing. At slumps of 3.5inches or less, most shafts were damaged during casing extraction, and those that appearedfine developed nearly zero unit skin friction.
Finally, a large scale concrete pour simulator was designed and fabricated to investigate theeffect of slurry properties and sand content on accumulation (settling soil particles) at thebottom of the excavation and/or a rising concrete-slurry interface. Results showed thatalmost half of the suspended sand would fall out of suspension within 2 hours. If leftundisturbed, the remaining sand stayed in suspension up to 12 hours (the longest test run).

vi
THIS PAGE IS INTENTIONALLY BLANK

vii
TABLE OF CONTENTS
LIST OF TABLES . . . . . . . . . . . . . . . . . . . . . . . . . . . . . . . . . . . . . . . . . . . . . . . . . . . . . . . v
LIST OF FIGURES . . . . . . . . . . . . . . . . . . . . . . . . . . . . . . . . . . . . . . . . . . . . . . . . . . . . vii
1. INTRODUCTION . . . . . . . . . . . . . . . . . . . . . . . . . . . . . . . . . . . . . . . . . . . . . . . . . . . . 1
2. BACKGROUND . . . . . . . . . . . . . . . . . . . . . . . . . . . . . . . . . . . . . . . . . . . . . . . . . . . . . 52.1 Historical Background of Drilled Shafts . . . . . . . . . . . . . . . . . . . . . . . . . . 52.2 Varieties of Drilled Shafts . . . . . . . . . . . . . . . . . . . . . . . . . . . . . . . . . . . . . 62.3 Methods of Construction . . . . . . . . . . . . . . . . . . . . . . . . . . . . . . . . . . . . . . 7
2.3.1 Dry Method . . . . . . . . . . . . . . . . . . . . . . . . . . . . . . . . . . . . . . . . . . 72.3.2 Casing Method . . . . . . . . . . . . . . . . . . . . . . . . . . . . . . . . . . . . . . . . 82.3.3 Wet (Slurry) Method . . . . . . . . . . . . . . . . . . . . . . . . . . . . . . . . . . . 8
2.4 Drilling Slurries . . . . . . . . . . . . . . . . . . . . . . . . . . . . . . . . . . . . . . . . . . . . . 92.4.1 Effect of Slurry on Drilled Shaft Capacity . . . . . . . . . . . . . . . . . 122.4.2 Borehole Stability and Particle Suspension . . . . . . . . . . . . . . . . . 132.4.3 Slurry Economics . . . . . . . . . . . . . . . . . . . . . . . . . . . . . . . . . . . . . 14
2.5 Excavation Clean out Techniques and Equipment . . . . . . . . . . . . . . . . . 142.6 The State of Drilled Shaft Integrity Testing . . . . . . . . . . . . . . . . . . . . . . 15
2.6.1 Cross Hole Sonic Logging . . . . . . . . . . . . . . . . . . . . . . . . . . . . . . . 162.6.2 Crosshole Tomography . . . . . . . . . . . . . . . . . . . . . . . . . . . . . . . . . 212.6.3 Sonic Echo Test . . . . . . . . . . . . . . . . . . . . . . . . . . . . . . . . . . . . . . . 222.6.4 Impulse Response Test . . . . . . . . . . . . . . . . . . . . . . . . . . . . . . . . . 282.6.5 Gamma-Gamma Testing . . . . . . . . . . . . . . . . . . . . . . . . . . . . . . . . 302.6.6 Concreteoscopy . . . . . . . . . . . . . . . . . . . . . . . . . . . . . . . . . . . . . . . 322.6.7 Parallel Seismic Integrity Testing . . . . . . . . . . . . . . . . . . . . . . . . . 322.6.8 Thermal Integrity Testing . . . . . . . . . . . . . . . . . . . . . . . . . . . . . . . 34
2.7 Prior Research into Drilled Shaft Anomalies . . . . . . . . . . . . . . . . . . . . . 382.7.1 Borehole Stability and Stabilization . . . . . . . . . . . . . . . . . . . . . . 382.7.2 Behavior of Fresh Concrete and Lateral Pressure Distribution . . 38
3. LATERAL PRESSURE CELL TESTING . . . . . . . . . . . . . . . . . . . . . . . . . . . . . . . . . 413.1 Concept and Development . . . . . . . . . . . . . . . . . . . . . . . . . . . . . . . . . . . . 413.2 LPC Test Program Overview . . . . . . . . . . . . . . . . . . . . . . . . . . . . . . . . . . 41
3.2.1 LPC Mix Designs . . . . . . . . . . . . . . . . . . . . . . . . . . . . . . . . . . . . . 423.2.2 LPC Casting Procedure . . . . . . . . . . . . . . . . . . . . . . . . . . . . . . . . 43
3.3 LPC Test Series I - Slump vs. Lateral Pressure . . . . . . . . . . . . . . . . . . . . 433.4 LPC Test Series I Results . . . . . . . . . . . . . . . . . . . . . . . . . . . . . . . . . . . . 443.5 LPC Test Series II - Effects of Cage on Lateral Pressure . . . . . . . . . . . . 453.6 LPC Test Series II Results . . . . . . . . . . . . . . . . . . . . . . . . . . . . . . . . . . . . 453.7 LPC Test Series III - Head Differentials . . . . . . . . . . . . . . . . . . . . . . . . . 463.8 LPC Test Series III Results . . . . . . . . . . . . . . . . . . . . . . . . . . . . . . . . . . . 463.9 Arching of Mortar During Tremie Placement . . . . . . . . . . . . . . . . . . . . . 49

viii
4. FRUSTUM CONFINING VESSEL TESTING . . . . . . . . . . . . . . . . . . . . . . . . . . . . . 654.1 Background . . . . . . . . . . . . . . . . . . . . . . . . . . . . . . . . . . . . . . . . . . . . . . . 654.2 FCV Test Program Overview . . . . . . . . . . . . . . . . . . . . . . . . . . . . . . . . . 65
4.2.1 FCV Mix Designs . . . . . . . . . . . . . . . . . . . . . . . . . . . . . . . . . . . . 664.2.2 FCV Casting Procedure . . . . . . . . . . . . . . . . . . . . . . . . . . . . . . . . 664.2.3 Static Load Test Apparatus and Procedure . . . . . . . . . . . . . . . . . 674.2.4 Shaft Extraction and Investigation . . . . . . . . . . . . . . . . . . . . . . . . 68
4.3 Control Shaft Tests . . . . . . . . . . . . . . . . . . . . . . . . . . . . . . . . . . . . . . . . . 684.4 FCV Test Series I - Water Table Elevation . . . . . . . . . . . . . . . . . . . . . . . 684.5 FCV Test Series I - Results . . . . . . . . . . . . . . . . . . . . . . . . . . . . . . . . . . . 694.6 FCV Test Series II - Temporary Casing Extraction Rate . . . . . . . . . . . . 714.7 FCV Test Series II - Results . . . . . . . . . . . . . . . . . . . . . . . . . . . . . . . . . . 714.8 FCV Test Series III - Slump Loss During Pour . . . . . . . . . . . . . . . . . . . . 754.9 FCV Test Series III - Results . . . . . . . . . . . . . . . . . . . . . . . . . . . . . . . . . . 754.10 Summary of Results . . . . . . . . . . . . . . . . . . . . . . . . . . . . . . . . . . . . . . . . . 77
5. SLURRY / SAND FALLOUT TESTING . . . . . . . . . . . . . . . . . . . . . . . . . . . . . . . . . 955.1 Sand Fallout Background . . . . . . . . . . . . . . . . . . . . . . . . . . . . . . . . . . . . . 955.2 Concrete Pour Simulator . . . . . . . . . . . . . . . . . . . . . . . . . . . . . . . . . . . . . 95
5.2.1 Simulated Shaft . . . . . . . . . . . . . . . . . . . . . . . . . . . . . . . . . . . . . . 955.2.2 Simulated Rising Concrete Head . . . . . . . . . . . . . . . . . . . . . . . . . 965.2.3 Pulling Device . . . . . . . . . . . . . . . . . . . . . . . . . . . . . . . . . . . . . . . 965.2.4 Storage/Mixing System . . . . . . . . . . . . . . . . . . . . . . . . . . . . . . . . 97
5.3 Slurry/Sand Fallout Test Program Overview . . . . . . . . . . . . . . . . . . . . . . 975.4 Sand Fallout Testing Procedure . . . . . . . . . . . . . . . . . . . . . . . . . . . . . . . . 985.5 Fallout Testing Results . . . . . . . . . . . . . . . . . . . . . . . . . . . . . . . . . . . . . . 98
5.5.1 1% Sand Content . . . . . . . . . . . . . . . . . . . . . . . . . . . . . . . . . . . . . 995.5.2 2% Sand Content . . . . . . . . . . . . . . . . . . . . . . . . . . . . . . . . . . . . . 995.5.3 4% Sand Content . . . . . . . . . . . . . . . . . . . . . . . . . . . . . . . . . . . . . 995.5.4 8% Sand Content . . . . . . . . . . . . . . . . . . . . . . . . . . . . . . . . . . . . . 99
5.6 Sieve Analysis of Fallout Sand . . . . . . . . . . . . . . . . . . . . . . . . . . . . . . . 1005.7 Effect of Sand Accumulation . . . . . . . . . . . . . . . . . . . . . . . . . . . . . . . . . 100
6. NGES FULL SCALE TESTING . . . . . . . . . . . . . . . . . . . . . . . . . . . . . . . . . . . . . . . 1136.1 NGES Test Program Overview . . . . . . . . . . . . . . . . . . . . . . . . . . . . . . . 1136.2 NGES Site Details and Layout . . . . . . . . . . . . . . . . . . . . . . . . . . . . . . . 1136.3 Rebar Cage Preparation . . . . . . . . . . . . . . . . . . . . . . . . . . . . . . . . . . . . . 1146.4 Drilled Shaft Excavation . . . . . . . . . . . . . . . . . . . . . . . . . . . . . . . . . . . . 1146.5 Mix Specifications . . . . . . . . . . . . . . . . . . . . . . . . . . . . . . . . . . . . . . . . . 1156.6 Borescope Video Interpretation . . . . . . . . . . . . . . . . . . . . . . . . . . . . . . . 1166.7 Quality Assurance . . . . . . . . . . . . . . . . . . . . . . . . . . . . . . . . . . . . . . . . . 119
6.7.1 Cross-hole Sonic Logging . . . . . . . . . . . . . . . . . . . . . . . . . . . . . 1206.7.2 Thermal Integrity Testing . . . . . . . . . . . . . . . . . . . . . . . . . . . . . 1206.7.3 Shaft Integrity Testing . . . . . . . . . . . . . . . . . . . . . . . . . . . . . . . . 1226.7.4 Post Grout . . . . . . . . . . . . . . . . . . . . . . . . . . . . . . . . . . . . . . . . . 122
6.8 Statnamic Load Testing . . . . . . . . . . . . . . . . . . . . . . . . . . . . . . . . . . . . . 122

ix
6.9 Core Sample Tests . . . . . . . . . . . . . . . . . . . . . . . . . . . . . . . . . . . . . . . . . 1236.9.1 Permeability . . . . . . . . . . . . . . . . . . . . . . . . . . . . . . . . . . . . . . . . 1236.9.2 Aggregate Distribution . . . . . . . . . . . . . . . . . . . . . . . . . . . . . . . 123
7. FIELD HEAD DIFFERENTIAL MEASUREMENTS . . . . . . . . . . . . . . . . . . . . . . 1677.1 Background . . . . . . . . . . . . . . . . . . . . . . . . . . . . . . . . . . . . . . . . . . . . . . 1677.2 Drilled Shaft Testing Procedure . . . . . . . . . . . . . . . . . . . . . . . . . . . . . . 1677.3 Field Sites . . . . . . . . . . . . . . . . . . . . . . . . . . . . . . . . . . . . . . . . . . . . . . . 167
7.3.1 Port of Tampa (Essex Cement) . . . . . . . . . . . . . . . . . . . . . . . . . 1687.3.2 Crosstown Expressway Reversible Lanes Bridge . . . . . . . . . . . 1687.3.3 Alagon Condominiums . . . . . . . . . . . . . . . . . . . . . . . . . . . . . . . 169
7.4 Head Differential Summary . . . . . . . . . . . . . . . . . . . . . . . . . . . . . . . . . . 169
8. CONCLUSIONS AND RECOMMENDATIONS . . . . . . . . . . . . . . . . . . . . . . . . . . 1778.1 General Conclusions . . . . . . . . . . . . . . . . . . . . . . . . . . . . . . . . . . . . . . . 177
8.1.1 Lateral Pressure Cell Testing . . . . . . . . . . . . . . . . . . . . . . . . . . . 1788.1.2 Frustum Confining Vessel Testing . . . . . . . . . . . . . . . . . . . . . . 1788.1.3 Slurry/Sand Fallout Testing . . . . . . . . . . . . . . . . . . . . . . . . . . . . 1798.1.4 NGES Full-Scale Testing . . . . . . . . . . . . . . . . . . . . . . . . . . . . . . 1798.1.5 Full-Scale Head Differential Testing . . . . . . . . . . . . . . . . . . . . . 180
8.2 Recommendations . . . . . . . . . . . . . . . . . . . . . . . . . . . . . . . . . . . . . . . . . 180
REFERENCES . . . . . . . . . . . . . . . . . . . . . . . . . . . . . . . . . . . . . . . . . . . . . . . . . . . . . . . 183
BIBLIOGRAPHY . . . . . . . . . . . . . . . . . . . . . . . . . . . . . . . . . . . . . . . . . . . . . . . . . . . . . 189
APPENDICES . . . . . . . . . . . . . . . . . . . . . . . . . . . . . . . . . . . . . . . . . . . . . . . . . . . . . . . . 193Appendix A. Section 455 A and C with Commentary . . . . . . . . . . . . . . . . . . . 195

x
LIST OF TABLES
Table 2-1. Summary of Slurry Acceptance from Individual State Specifications . . . . . 10Table 2-1. (Continued) . . . . . . . . . . . . . . . . . . . . . . . . . . . . . . . . . . . . . . . . . . . . . . . . . . 11Table 2-2. State of Florida Specifications for Road and Bridge Construction: 455-15.8.1
. . . . . . . . . . . . . . . . . . . . . . . . . . . . . . . . . . . . . . . . . . . . . . . . . . . . . . . . . . . . . . . 12Table 2-3. P-Wave Velocity in Different Media . . . . . . . . . . . . . . . . . . . . . . . . . . . . . . 17Table 2-4. Alabama’s Minimum Number of CSL Tubes per Shaft (ADOT, 2001) . . . . 17Table 2-5. Approximate Time Window for Acquiring Optimal CSL Data . . . . . . . . . . 18Table 2-6. Compression Wave Velocity in Concrete . . . . . . . . . . . . . . . . . . . . . . . . . . . 25Table 2-7. List of thermal anomaly types and descriptions . . . . . . . . . . . . . . . . . . . . . . 36
Table 4-1. Shaft Summary for FCV Test Series I . . . . . . . . . . . . . . . . . . . . . . . . . . . . . . 70Table 4-2. Shaft Summary for FCV Test Series II . . . . . . . . . . . . . . . . . . . . . . . . . . . . . 72Table 4-2. (Continued) . . . . . . . . . . . . . . . . . . . . . . . . . . . . . . . . . . . . . . . . . . . . . . . . . . 73Table 4-2. (Continued) . . . . . . . . . . . . . . . . . . . . . . . . . . . . . . . . . . . . . . . . . . . . . . . . . . 74Table 4-3. Shaft Summary for FCV Test Series III . . . . . . . . . . . . . . . . . . . . . . . . . . . . 76Table 4-4. Extraction Rate versus Shaft Diameter . . . . . . . . . . . . . . . . . . . . . . . . . . . . . 77
Table 5-1. Calibrated Velocity Times . . . . . . . . . . . . . . . . . . . . . . . . . . . . . . . . . . . . . . . 96
Table 6-1. Detailed Summary of Concrete Mixes . . . . . . . . . . . . . . . . . . . . . . . . . . . . 116Table 6-2. Summary of Differing Shaft Parameters and Associated Head Differentials
. . . . . . . . . . . . . . . . . . . . . . . . . . . . . . . . . . . . . . . . . . . . . . . . . . . . . . . . . . . . . . 119
xi
LIST OF FIGURES
Figure 1-1. Soil Inclusions, Exposed Rebar, and Necking Found Near Water Table. . . . 1Figure 1-2. Anomalies in cased construction caused by concrete quality (top) and in slurry
supported construction caused by bottom of excavation soil accumulation (bottom).. . . . . . . . . . . . . . . . . . . . . . . . . . . . . . . . . . . . . . . . . . . . . . . . . . . . . . . . . . . . . . . . 2
Figure 2-1. A Velocity Tomogram of a Drilled Shaft on a Highway Bridge showing ananomalous zone between 31 and 33 feet . . . . . . . . . . . . . . . . . . . . . . . . . . . . . . . 22
Figure 2-2. Typical Response Curve for SIT (after Baker, 1993) . . . . . . . . . . . . . . . . . 24Figure 2-3. Typical Mobility Plot for IRT (after Baker, 1993) . . . . . . . . . . . . . . . . . . . 29Figure 2-4. Results of a Gamma Gamma Test Indicates Necked Shaft . . . . . . . . . . . . . 32Figure 2-5. Thermal Integrity Test Equipment Setup . . . . . . . . . . . . . . . . . . . . . . . . . . . 37Figure 3-1. Lucite Tube Used to Construct the Lateral Pressure Cell . . . . . . . . . . . . . . 50Figure 3-2. Resistive Strain Gages Mounted . . . . . . . . . . . . . . . . . . . . . . . . . . . . . . . . . 50Figure 3-3. Lateral Pressure Transducers Mounted to LPC Side Wall . . . . . . . . . . . . . 51Figure 3-4. Load Cell (inset) is Mounted Between the Base Plates . . . . . . . . . . . . . . . . 51Figure 3-5. Water Calibration of the Lateral Pressure Cell Prior to Mortar Testing . . . 52Figure 3-6. Water Calibration Data Collected Before Each Mortar Test in the LPC . . . 52Figure 3-7. Lateral Pressure Developed for Various Values of Slump . . . . . . . . . . . . . 53Figure 3-8. Lateral Pressure as a Function of Vertical Pressure in the LPC . . . . . . . . . 53Figure 3-9. Kappa as a Function of Slump for LPC Series I . . . . . . . . . . . . . . . . . . . . . 54Figure 3-10. LPC Series I Lateral Pressure as a Function of Slump . . . . . . . . . . . . . . . 54Figure 3-11. Model Cages Used in LPC from Left to Right; 1", 1/2", 1/4" Grid . . . . . . 55Figure 3-12. Lateral Pressure Versus Depth for Various Rebar Clear Spacing . . . . . . . 55Figure 3-13. LPC Series II Lateral Pressure as a Function of Slump . . . . . . . . . . . . . . . 56Figure 3-14. Kappa as a Function of Slump for LPC Series I & II . . . . . . . . . . . . . . . . 56Figure 3-15. Wet Density and Lateral Pressure Versus Slump for Various Mortar Mixes
. . . . . . . . . . . . . . . . . . . . . . . . . . . . . . . . . . . . . . . . . . . . . . . . . . . . . . . . . . . . . . . 57Figure 3-16. Head Differential Using 1/4" Spacing, Dry Hole Construction . . . . . . . . . 57Figure 3-17. Alternate View of Head Differential Using 1/4" Spacing, Dry Hole . . . . 58Figure 3-18. Flow past Lateral Pressure Transducer with Obvious Head Differential . 58Figure 3-19. Head Differential Using 1/2" Cage, Dry Hole Construction . . . . . . . . . . . 59Figure 3-20. Alternate View of Head Differential Using 1/2" Cage, Dry Hole . . . . . . . 59Figure 3-21. Head Differential Using 1" Cage, Dry Hole Construction . . . . . . . . . . . . 60Figure 3-22. Alternate View of Head Differential Using 1" Cage, Dry Hole . . . . . . . . 60Figure 3-23. Head Differential Comparison for 1/4" Cage, 6 and 10 Inch Slump . . . . . 61Figure 3-24. Head Differential Comparison for 1/2" Cage, 6 and 10 Inch Slump . . . . . 61Figure 3-25. Head Differential Comparison for 6" Slump, 1/4" and 1/2" Cages . . . . . . 62Figure 3-26. Head Differential Comparison for 10" Slump, 1/4" and 1/2" Cages . . . . . 62Figure 3-27. Radial Flow Rate as a Function of Grid Opening in the LPC . . . . . . . . . . 63Figure 3-28. Radial Flow and Flux as a Function of Grid Opening . . . . . . . . . . . . . . . . 63Figure 3-29. Mortar Head Differential as a Function of CSD . . . . . . . . . . . . . . . . . . . . 64Figure 3-30. One Inch Head Differential in an Early LPC Pour . . . . . . . . . . . . . . . . . . 64Figure 4-1. Total Vertical Soil Stress in the FCV . . . . . . . . . . . . . . . . . . . . . . . . . . . . . . 78Figure 4-2. Alluviation of the FCV Using the Water Jet Tool . . . . . . . . . . . . . . . . . . . . 78
xii
Figure 4-3. Casing Driven into Specified Depth . . . . . . . . . . . . . . . . . . . . . . . . . . . . . . 79Figure 4-4. Primary Auger Tool Used to Excavate Most of the Shaft . . . . . . . . . . . . . . 79Figure 4-5. Clean-out Bucket Used to Finish Excavation . . . . . . . . . . . . . . . . . . . . . . . 80Figure 4-6. Permanent Casing Installed Around Temporary Casing . . . . . . . . . . . . . . . 80Figure 4-7. Tremie Plugged to Prevent Segregation . . . . . . . . . . . . . . . . . . . . . . . . . . . . 81Figure 4-8. Connecting Tremie Pipe to Hopper in Preparation for Pour . . . . . . . . . . . . 81Figure 4-9. Casing Extraction Using the Overhead Lift . . . . . . . . . . . . . . . . . . . . . . . . . 82Figure 4-10. Starlogger Pro Data Acquisition System . . . . . . . . . . . . . . . . . . . . . . . . . . 82Figure 4-11. Reaction Frame Used for FCV Static Load Testing . . . . . . . . . . . . . . . . . 83Figure 4-12. Load Cell and Bearing Plates used for FCV Static Load Testing . . . . . . . 83Figure 4-13. Load Cell Assembly Installed on Shaft . . . . . . . . . . . . . . . . . . . . . . . . . . . 84Figure 4-14. Hydraulic Jack and LVDTs Installed on Shaft . . . . . . . . . . . . . . . . . . . . . 84Figure 4-15. Manual Pump Used to Control Hydraulic Jack . . . . . . . . . . . . . . . . . . . . . 85Figure 4-16. SLT Results for Shaft A3 . . . . . . . . . . . . . . . . . . . . . . . . . . . . . . . . . . . . . . 85Figure 4-17. Shaft S1 Removed from the Frustum - Undersized . . . . . . . . . . . . . . . . . . 86Figure 4-18. Toe Bulb on Shaft S2 due to Over-excavation . . . . . . . . . . . . . . . . . . . . . 86Figure 4-19. Slight Neck below Casing on Shaft S5 . . . . . . . . . . . . . . . . . . . . . . . . . . . 87Figure 4-20. Toe Anomaly on Shaft S5 . . . . . . . . . . . . . . . . . . . . . . . . . . . . . . . . . . . . . 87Figure 4-21. Shaft S7 Showing Bulge Just below Permanent Casing . . . . . . . . . . . . . . 88Figure 4-22. Uneven Toe Formation on Shaft S8 . . . . . . . . . . . . . . . . . . . . . . . . . . . . . . 88Figure 4-23. Reduced cross section at toe Shaft S10 . . . . . . . . . . . . . . . . . . . . . . . . . . . 89Figure 4-24. Reduced toe cross-section due to poor excavation on Shaft S40 . . . . . . . . 89Figure 4-25. Surface Cracking in Upper Portion of Shaft Specimen . . . . . . . . . . . . . . . 90Figure 4-26. Porous surface noted during rapid casing extraction on Shaft S41 . . . . . . 90Figure 4-27. Surface markings due to casing wobble during extraction on Shaft S32 . . 91Figure 4-28. Mobilized Unit Skin Friction as a Function of Slump at Casing Extraction
. . . . . . . . . . . . . . . . . . . . . . . . . . . . . . . . . . . . . . . . . . . . . . . . . . . . . . . . . . . . . . . 91Figure 4-29. Entire Shaft Lodged in Casing Due to Excessive Slump Loss on Shaft S47
. . . . . . . . . . . . . . . . . . . . . . . . . . . . . . . . . . . . . . . . . . . . . . . . . . . . . . . . . . . . . . . 92Figure 4-30. Side Shear versus Water Table Elevation . . . . . . . . . . . . . . . . . . . . . . . . . 92Figure 4-31. Shaft Diameter versus Slump (Measured and Predicted from Mini-slump)
. . . . . . . . . . . . . . . . . . . . . . . . . . . . . . . . . . . . . . . . . . . . . . . . . . . . . . . . . . . . . . . 93Figure 5-1. Concrete Pour Simulator . . . . . . . . . . . . . . . . . . . . . . . . . . . . . . . . . . . . . . 101Figure 5-2. Simulated Shaft . . . . . . . . . . . . . . . . . . . . . . . . . . . . . . . . . . . . . . . . . . . . . 101Figure 5-3. Intake Fitting . . . . . . . . . . . . . . . . . . . . . . . . . . . . . . . . . . . . . . . . . . . . . . . 102Figure 5-4. Drainage Plumbing . . . . . . . . . . . . . . . . . . . . . . . . . . . . . . . . . . . . . . . . . . 102Figure 5-5. Sealing Device (Simulated top of Concrete) . . . . . . . . . . . . . . . . . . . . . . . 103Figure 5-6. Pulling Device . . . . . . . . . . . . . . . . . . . . . . . . . . . . . . . . . . . . . . . . . . . . . . 103Figure 5-7. Hootonany Mixer . . . . . . . . . . . . . . . . . . . . . . . . . . . . . . . . . . . . . . . . . . . . 104Figure 5-8. Slurry Tank . . . . . . . . . . . . . . . . . . . . . . . . . . . . . . . . . . . . . . . . . . . . . . . . 104Figure 5-9. Slurry Mixing Device . . . . . . . . . . . . . . . . . . . . . . . . . . . . . . . . . . . . . . . . . 105Figure 5-10. Mixing Slurry with Device . . . . . . . . . . . . . . . . . . . . . . . . . . . . . . . . . . . 105Figure 5-11. FDOT Drill Rig Pump . . . . . . . . . . . . . . . . . . . . . . . . . . . . . . . . . . . . . . . 106Figure 5-12. Text Matrix Flowchart . . . . . . . . . . . . . . . . . . . . . . . . . . . . . . . . . . . . . . . 106Figure 5-13. Accumulation for 1% Sand Content Tests . . . . . . . . . . . . . . . . . . . . . . . . 107

xiii
Figure 5-14. Accumulation for Initial 2% Sand Content Tests . . . . . . . . . . . . . . . . . . 107Figure 5-15. Accumulation for Refined 2% Sand Content Tests . . . . . . . . . . . . . . . . . 108Figure 5-16. Accumulation for 4% Sand Content Tests . . . . . . . . . . . . . . . . . . . . . . . . 108Figure 5-17. Accumulation for 8% Sand Content Tests . . . . . . . . . . . . . . . . . . . . . . . . 109Figure 5-18. Sieve Analysis for 4% Sand Content Accumulation and Pit Sand . . . . . 109Figure 5-19. Weight Retained versus Sieve Opening for 4% Sand Content . . . . . . . . 110Figure 5-20. Sand Fallout as Percentage of Total Sand in Column . . . . . . . . . . . . . . . 110Figure 5-21. Summary of Sand Accumulation of All Sand Contents . . . . . . . . . . . . . . 111Figure 5-22. Total Volume of Sand for Various Diameter Drilled Shafts at 4% Sand Content
. . . . . . . . . . . . . . . . . . . . . . . . . . . . . . . . . . . . . . . . . . . . . . . . . . . . . . . . . . . . . . 111Figure 5-23. Volume of Fallout for Various Diameter Drilled Shafts at 4% Sand Content
. . . . . . . . . . . . . . . . . . . . . . . . . . . . . . . . . . . . . . . . . . . . . . . . . . . . . . . . . . . . . . 112Figure 5-24. Depth of Fallout versus Depth of Drilled Shaft for 4% Sand Content . . 112Figure 6-1. Location of Auburn University’s NGES Test Site in Opelika, Alabama . 124Figure 6-2. Borescope Video Camera Bell . . . . . . . . . . . . . . . . . . . . . . . . . . . . . . . . . . 124Figure 6-3. Borescope Video Monitor and Recorder Unit . . . . . . . . . . . . . . . . . . . . . . 125Figure 6-4. Post Grout Cell as Installed in Auburn Test Shaft . . . . . . . . . . . . . . . . . . . 125Figure 6-5. Toe Anomaly Created by Installing Sand Bags Inside the Cage . . . . . . . . 126Figure 6-6. View of Toe Sand Bags from Inside the Cage . . . . . . . . . . . . . . . . . . . . . . 126Figure 6-7. Detail View of Sister Bars, CSL Tubes, and Grout Tubes . . . . . . . . . . . . 127Figure 6-8. Auburn Site CPT Soundings in Test Area . . . . . . . . . . . . . . . . . . . . . . . . . 127Figure 6-9. Subsurface Exploration Using the USF Mini-CPT Rig . . . . . . . . . . . . . . . 128Figure 6-10. TS-1 Mini-CPT Sounding . . . . . . . . . . . . . . . . . . . . . . . . . . . . . . . . . . . . 128Figure 6-11. TS-2 Mini-CPT Sounding . . . . . . . . . . . . . . . . . . . . . . . . . . . . . . . . . . . . 129Figure 6-12. TS-3 Mini-CPT Sounding . . . . . . . . . . . . . . . . . . . . . . . . . . . . . . . . . . . . 129Figure 6-13. TS-4 Mini-CPT Sounding . . . . . . . . . . . . . . . . . . . . . . . . . . . . . . . . . . . . 130Figure 6-14. TS-5 Mini-CPT Sounding . . . . . . . . . . . . . . . . . . . . . . . . . . . . . . . . . . . . 130Figure 6-15. Auburn Test Site Layout . . . . . . . . . . . . . . . . . . . . . . . . . . . . . . . . . . . . . 131Figure 6-16. Rotary Drill Rig . . . . . . . . . . . . . . . . . . . . . . . . . . . . . . . . . . . . . . . . . . . . 131Figure 6-17. Dry Hole Drilling Was Used Because of Soil Conditions on Site . . . . . . 132Figure 6-18. L-box Flow Test Device Used for SCC Mixes . . . . . . . . . . . . . . . . . . . . 132Figure 6-19. Material Flows Through Lower Gate and Drop Height Is Recorded . . . 133Figure 6-20. TS-1: Borehole Cleanliness as Observed with the Borescope . . . . . . . . . 133Figure 6-21. TS-1: Sidewall of Borehole Viewed with Borescope . . . . . . . . . . . . . . . 134Figure 6-22. TS-1: Toe Anomaly Formed Using Sand Bags above Grout Cell . . . . . . 134Figure 6-23. TS-1: #57 Stone Mix, High Slump, Showing Some Binding near Rebar
. . . . . . . . . . . . . . . . . . . . . . . . . . . . . . . . . . . . . . . . . . . . . . . . . . . . . . . . . . . . . . 135Figure 6-24. TS-1: Binding of Coarse Aggregate near Rebar . . . . . . . . . . . . . . . . . . . 135Figure 6-25. TS-1: Longitudinal Bars Create an Even Larger Area of Binding . . . . . 136Figure 6-26. TS-2: #7 Stone Mix, High Slump, Good Flow Characteristics . . . . . . . . 136Figure 6-27. TS-2: Overall Flow for #7 Stone Mix Is More Uniform . . . . . . . . . . . . . 137Figure 6-28. TS-2: Tight Longitudinal Spacing but No Obvious Binding . . . . . . . . . . 137Figure 6-29. TS-2: #7 Stone Mix Pours with Minimal Head Differential . . . . . . . . . . 138Figure 6-30. TS-3: #57 Stone, Low Slump, Showing Segregation and Bleeding . . . . 138Figure 6-31. TS-3: Obvious Segregation and Bleed off of Mix Water During Pour . . 139

xiv
Figure 6-32. TS-3: Low Slump Mix Also Exhibits High Degree of Clumping . . . . . . 139Figure 6-33. TS-5: SCC Mix Flows Well Around Tight Obstructions . . . . . . . . . . . . 140Figure 6-34. TS-5: No Visible Binding Near Rebar for SCC Mixes . . . . . . . . . . . . . . 140Figure 6-35. TS-5: SCC Mix Shows Even Flow and No Obvious Segregation . . . . . . 141Figure 6-36. TS-5: SCC Mix Flow Shows Very Little Inner to Outer Cage Differential
. . . . . . . . . . . . . . . . . . . . . . . . . . . . . . . . . . . . . . . . . . . . . . . . . . . . . . . . . . . . . . 141Figure 6-37. TS-3 CSL Data (a) Initial Readings and (b) Final Readings . . . . . . . . . . 142Figure 6-38. TS-1 CSL Data for All Access Tubes and Anomaly Location . . . . . . . . 143Figure 6-39. TS-2 CSL Data for All Access Tubes and Anomaly Location . . . . . . . . 144Figure 6-40. TS-3 CSL Data for All Access Tubes and Anomaly Location . . . . . . . . 145Figure 6-41. TS-5 CSL Data for All Access Tubes and Anomaly Location . . . . . . . . 146Figure 6-42. TS-4 CSL Data for All Access Tubes (Control Shaft, No Anomalies) . . 147Figure 6-43. TS-4 Exhumed Shaft Tip . . . . . . . . . . . . . . . . . . . . . . . . . . . . . . . . . . . . . 148Figure 6-44. Thermal Integrity Testing of TS-2 (Tube B) . . . . . . . . . . . . . . . . . . . . . 148Figure 6-45. Fourier analysis of inward-facing sensor temperature data for shaft TS-3 (Tube
A) . . . . . . . . . . . . . . . . . . . . . . . . . . . . . . . . . . . . . . . . . . . . . . . . . . . . . . . . . . . . 149Figure 6-46. Low-passed (“rebar-filtered”) temperature traces and one unfiltered trace of
the inward-facing channel from shaft TS-3 (Tube A) . . . . . . . . . . . . . . . . . . . . 149Figure 6-47. SIT data for TS-1 before grouting (top) and after load testing (bottom).
. . . . . . . . . . . . . . . . . . . . . . . . . . . . . . . . . . . . . . . . . . . . . . . . . . . . . . . . . . . . . . 150Figure 6-48. SIT data for TS-2 before grouting (top) and after load testing (bottom).
. . . . . . . . . . . . . . . . . . . . . . . . . . . . . . . . . . . . . . . . . . . . . . . . . . . . . . . . . . . . . . 150Figure 6-49. SIT data for TS-3 before grouting (top) and after load testing (bottom).
. . . . . . . . . . . . . . . . . . . . . . . . . . . . . . . . . . . . . . . . . . . . . . . . . . . . . . . . . . . . . . 151Figure 6-50. SIT data for TS-4 day of grouting (top) and after load testing (bottom).
. . . . . . . . . . . . . . . . . . . . . . . . . . . . . . . . . . . . . . . . . . . . . . . . . . . . . . . . . . . . . . 151Figure 6-51. SIT data for TS-5 before grouting (top) and after load testing (bottom).
. . . . . . . . . . . . . . . . . . . . . . . . . . . . . . . . . . . . . . . . . . . . . . . . . . . . . . . . . . . . . . 152Figure 6-52. Mixing Grout in the Pump Prior to Post Grouting Each Shaft . . . . . . . . 152Figure 6-53. Post Grouting Operation Injects Grout to Shaft Tip . . . . . . . . . . . . . . . . 153Figure 6-54. Upward Movement of Shaft Measured with String Extensometers . . . . 153Figure 6-55. TS-1 Grout Pressure versus Displacement . . . . . . . . . . . . . . . . . . . . . . . . 154Figure 6-56. TS-2 Grout Pressure versus Displacement . . . . . . . . . . . . . . . . . . . . . . . . 154Figure 6-57. TS-3 Grout Pressure versus Displacement . . . . . . . . . . . . . . . . . . . . . . . . 155Figure 6-58. TS-5 Grout Pressure versus Displacement . . . . . . . . . . . . . . . . . . . . . . . . 155Figure 6-59. TS-1 Side Shear Plots . . . . . . . . . . . . . . . . . . . . . . . . . . . . . . . . . . . . . . . 156Figure 6-60. TS-2 Side Shear Plots . . . . . . . . . . . . . . . . . . . . . . . . . . . . . . . . . . . . . . . 156Figure 6-61. TS-3 Side Shear Plots . . . . . . . . . . . . . . . . . . . . . . . . . . . . . . . . . . . . . . . 157Figure 6-62. TS-5 Side Shear Plot during Grouting . . . . . . . . . . . . . . . . . . . . . . . . . . . 157Figure 6-63. 4MN Statnamic Load Test Setup . . . . . . . . . . . . . . . . . . . . . . . . . . . . . . . 158Figure 6-64. Side Shear Values for All Test Shafts (except TS-5) . . . . . . . . . . . . . . . . 158Figure 6-65. Soil Excavation for Shaft Removal . . . . . . . . . . . . . . . . . . . . . . . . . . . . . 159Figure 6-66. Coring of Test Shafts for Permeability Testing . . . . . . . . . . . . . . . . . . . . 159Figure 6-67. Saw Cutting of Test Shafts . . . . . . . . . . . . . . . . . . . . . . . . . . . . . . . . . . . . 160Figure 6-68. Permeability Results from Concrete Cores . . . . . . . . . . . . . . . . . . . . . . . 160
xv
Figure 6-69. Core Sample from Shaft TS-1 Showing Material from Inner & Outer Cage. . . . . . . . . . . . . . . . . . . . . . . . . . . . . . . . . . . . . . . . . . . . . . . . . . . . . . . . . . . . . . 161
Figure 6-70. TS-1 Core Sample Before Splitting . . . . . . . . . . . . . . . . . . . . . . . . . . . . . 161Figure 6-71. Core Sample from Shaft TS-2 . . . . . . . . . . . . . . . . . . . . . . . . . . . . . . . . . 162Figure 6-72. Core Sample from Shaft TS-3 . . . . . . . . . . . . . . . . . . . . . . . . . . . . . . . . . 162Figure 6-73. Outer Cage Core Sample from Shaft TS-4 . . . . . . . . . . . . . . . . . . . . . . . 163Figure 6-74. Core Sample from Shaft TS-5 . . . . . . . . . . . . . . . . . . . . . . . . . . . . . . . . . 163Figure 6-75. TS-3 Saw Cut . . . . . . . . . . . . . . . . . . . . . . . . . . . . . . . . . . . . . . . . . . . . . . 164Figure 6-76. TS-5 Saw Cut . . . . . . . . . . . . . . . . . . . . . . . . . . . . . . . . . . . . . . . . . . . . . . 164Figure 6-77. TS-2 Saw Cut . . . . . . . . . . . . . . . . . . . . . . . . . . . . . . . . . . . . . . . . . . . . . . 165Figure 7-1. Weighted Tape (left) used in Taking Head Differential Measurements (right). . . . . . . . . . . . . . . . . . . . . . . . . . . . . . . . . . . . . . . . . . . . . . . . . . . . . . . . . . . . . . . . . . . . 170
Figure 7-2. Location of the 4 Sites Visited for Head Differential Readings . . . . . . . . 170Figure 7-3. Cage Installation at the Port of Tampa . . . . . . . . . . . . . . . . . . . . . . . . . . . . 171Figure 7-4. High Water Table Visible at the Port of Tampa . . . . . . . . . . . . . . . . . . . . 171Figure 7-5. Head Differential as a Function of the CSD Ratio for the Port of Tampa
. . . . . . . . . . . . . . . . . . . . . . . . . . . . . . . . . . . . . . . . . . . . . . . . . . . . . . . . . . . . . . 172Figure 7-6. Head Differential as a Function of the Velocity for the Port of Tampa
. . . . . . . . . . . . . . . . . . . . . . . . . . . . . . . . . . . . . . . . . . . . . . . . . . . . . . . . . . . . . . 172Figure 7-7. Mono-pier Cage Placement at the Crosstown Expressway . . . . . . . . . . . . 173Figure 7-8. Head Differential Measurements at the Crosstown Expressway . . . . . . . . 173Figure 7-9. Head Differential as a Function of Velocity for the Crosstown Expressway
. . . . . . . . . . . . . . . . . . . . . . . . . . . . . . . . . . . . . . . . . . . . . . . . . . . . . . . . . . . . . . 174Figure 7-10. Alagon Bucket Pours (left) and Field Measurements (right) . . . . . . . . . 174Figure 7-11 Field Measurements Combined with Lab Data . . . . . . . . . . . . . . . . . . . . . 175Figure 7-12. Summary of Head Differential as a Function of Velocity . . . . . . . . . . . . 175Figure 7-13. Recommended CSD Range to Minimize Head Differential . . . . . . . . . . 176Figure 8-1. Comparison of Idealized Concrete Flow with Observed . . . . . . . . . . . . . . 177

xvi
THIS PAGE IS INTENTIONALLY BLANK
1
1. INTRODUCTION
Drilled shafts are large diameter cast-in-place concrete foundations that extend deep into theground up to hundreds of feet. As the form-work (typically soil) is rarely removed, theactual shape and quality of the concrete goes largely unverified. In some instances wherethe shafts have been exhumed or at least partially exposed, aberrant conditions have beenfound. These anomalies were observed in the form of soil inclusions, concrete segregation,or cross-section reductions. This project investigates many of the mechanisms that lead tocompromised shaft integrity.
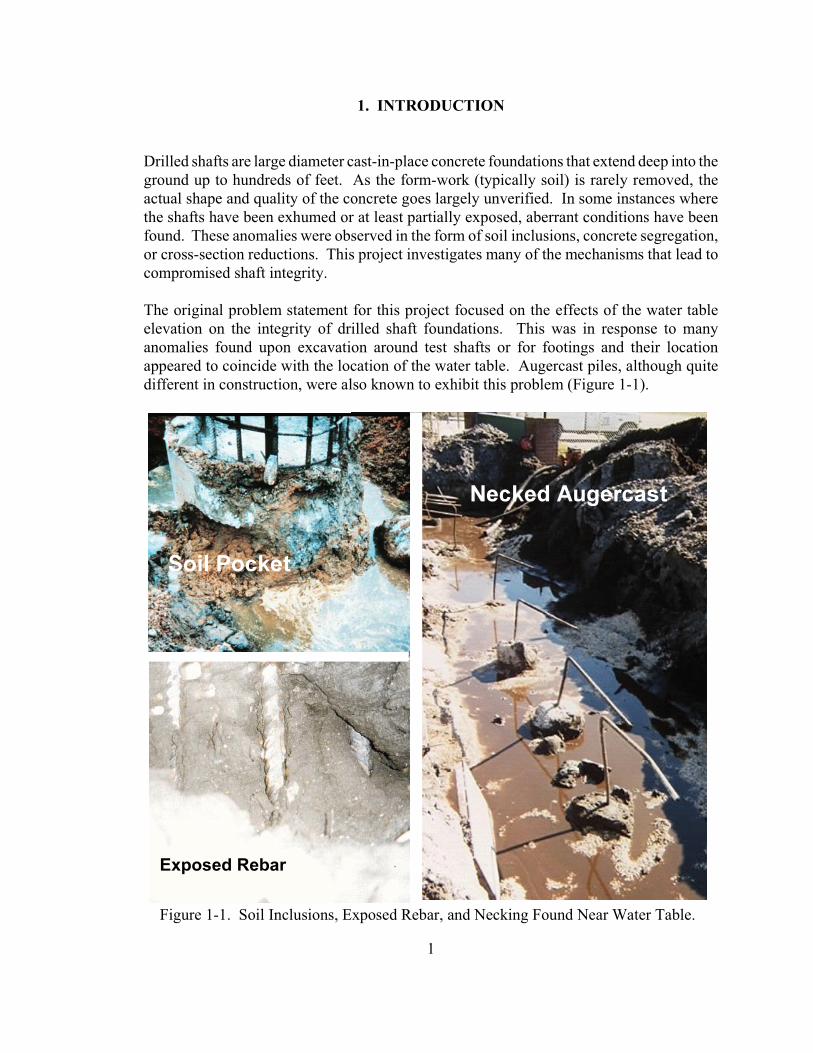
The original problem statement for this project focused on the effects of the water tableelevation on the integrity of drilled shaft foundations. This was in response to manyanomalies found upon excavation around test shafts or for footings and their locationappeared to coincide with the location of the water table. Augercast piles, although quitedifferent in construction, were also known to exhibit this problem (Figure 1-1).
Figure 1-1. Soil Inclusions, Exposed Rebar, and Necking Found Near Water Table.
2
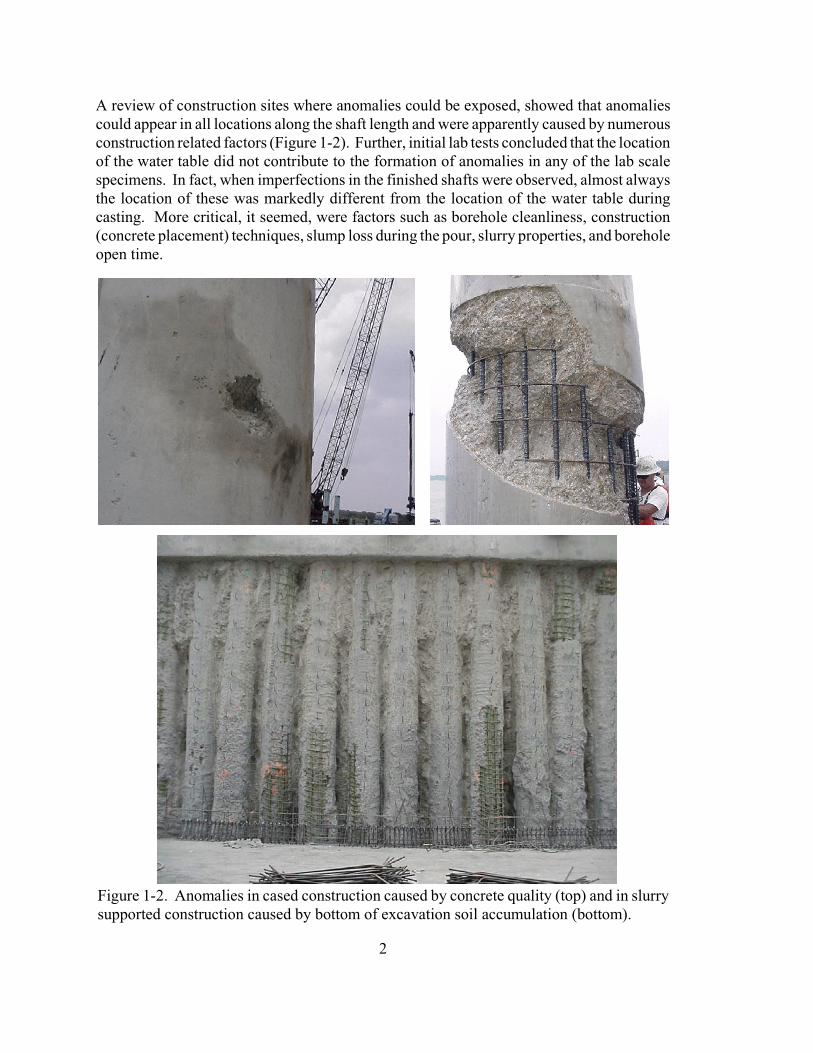
A review of construction sites where anomalies could be exposed, showed that anomaliescould appear in all locations along the shaft length and were apparently caused by numerousconstruction related factors (Figure 1-2). Further, initial lab tests concluded that the locationof the water table did not contribute to the formation of anomalies in any of the lab scalespecimens. In fact, when imperfections in the finished shafts were observed, almost alwaysthe location of these was markedly different from the location of the water table duringcasting. More critical, it seemed, were factors such as borehole cleanliness, construction(concrete placement) techniques, slump loss during the pour, slurry properties, and boreholeopen time.
Figure 1-2. Anomalies in cased construction caused by concrete quality (top) and in slurrysupported construction caused by bottom of excavation soil accumulation (bottom).
3
After discussion of these early findings with FDOT personnel, these observations ultimatelyled to a broadened scope of research which included the factors listed above, as well asadditional items such as clear spacing of rebar and placement of concrete under a fluid head(such as drill slurry) versus a dry hole. This report will present the findings from bothlaboratory and field testing aimed at more accurately describing the effects of theaforementioned parameters on finished shaft integrity and axial capacity. The organizationof this report is presented below.
Chapter 2 will introduce the original problem as outlined in the USF proposal submitted tothe FDOT. Following this, the findings of a comprehensive review of literature on topicssuch as drilled shaft history, techniques of drilled shaft construction, borehole stabilizationmethods, and quality assurance testing will be presented.
A new laboratory device is presented in Chapter 3. This device, designated the Lateral
Pressure Cell, was designed and constructed specifically for this study in an effort to betterunderstand the effects of such parameters as slump loss and clear spacing of rebar on theflow of fresh concrete. The results of the lateral pressure cell tests are presented anddiscussed. These tests focused on shaft integrity and quality, as affected by variousconstruction related parameters.
In Chapter 4, the Frustum Confining Vessel is introduced with a standard testing procedurefor pressurization, casing installation, excavation, and specimen casting. The results of thelab scale study are presented. The focus is on the results of three separate series of tests inthe frustum confining vessel. These tests targeted the effects of various constructionparameters on the axial capacity of a shaft.
Chapter 5 presents a series of tests designed to address drill slurry properties as well as theeffect of sand content on settling time. A discussion of the design, fabrication, and testingusing a large scale concrete pour simulator are presented that was used to simulate an openexcavation filled with mineral slurry. A summary of the results is included.
Chapter 6 discusses the full scale testing program carried out in conjunction with AuburnUniversity. A total of five shafts were constructed, and video footage of the rising concretein the hole was obtained through the use of an experimental down-hole camera known as theborescope. Several non-destructive tests were also carried out to show the effectiveness ofdetecting known anomalies. The findings from the Auburn full scale test program arepresented.
In addition to the full scale work addressed in Chapter 6, additional monitoring of drilledshafts during the concreting process was undertaken. The primary focus of this work wasto capture the head differential between the inside and outside of the reinforcing cage whenconcrete was placed. Chapter 7 discusses the specifics of each construction site visited aswell as the results of those efforts.
Finally, Chapter 8 concludes this report with a summary of the important findings of thestudy. Additionally, some general recommendations for construction procedure changes arepresented, and suggestions for possible avenues of future research are given.

4
THIS PAGE IS INTENTIONALLY BLANK
5
2. BACKGROUND
The original proposal written by the University of South Florida and submitted to the FloridaDepartment of Transportation, entitled “The Influence of Water Table in Drilled ShaftConstruction,” was prepared in response to what seemed to be a recurring problem in drilledshaft construction. Although drilled shaft capacity is closely linked to soil type, it has beenlong understood that construction practices can drastically affect anticipated capacity inaddition to integrity and durability. A scenario that has plagued numerous constructionprojects to date involves anomalies occurring at the water table elevation. Although manytypes of anomalies can occur during normal shaft construction, this specific type of flaw ismanifested in the form of necking or a reduced section. As a result the structural integrityand corrosion durability is compromised. The full extent of this problem is often unknownand/or unrealized. This condition is not limited to drilled shaft construction as there isevidence of this scenario occurring in other types of bored piles such as auger cast-in-situ(augercast) piles.
In order to properly present the findings of the research project, a thorough review ofavailable literature was first conducted. Topics of concern include a brief history on theevolution and use of drilled shaft foundations, varieties, construction and boreholestabilization methods, excavation clean out techniques and equipment, and quality assurance(shaft integrity) methods. Additionally, any previous research related to this report will besummarized.
2.1 Historical Background of Drilled Shafts
The primary reason for using deep foundations is to transfer structural loads and momentsthrough the relatively weak upper strata of many sites to deeper, stronger geomaterialshaving sufficient bearing capacity for the anticipated loading. These structural loads areoften the result of very heavy buildings, tall buildings having considerable weight and windloads, and bridges spanning long distances which require foundations capable of resistingsubstantial dynamic loads in addition to large dead loads. As such, the use of deepfoundations, and in particular drilled shafts, can be traced back to the early 1900's and thebeginning of the growth of major cities such as Chicago and Detroit (Bowles, 1996).
As populations grew and the industrial revolution progressed, buildings started reachinghigher and higher. Shallow foundations were simply inadequate to support these structuressince the soil beneath these foundations did not possess the needed strength. Early civilengineering pioneers began considering ways to transfer the enormous loads of thesesuperstructures directly to bedrock or other high strength subsurface strata.
As city buildings grew larger and higher during the early 20 century, hand-excavatedth
caissons became popular. There were primarily two methods of construction: the Chicagomethod and the Gow method (O’Neill and Reese, 1999). In the Chicago method, workersdug to a depth equal to the length of stave boards used to shore up the walls of the

6
excavation. These boards were placed against the internal walls of the borehole, and wereheld in place using compression rings (similar to the construction of a wooden barrel butopposite in force application). Excavation then proceeded, in increments equivalent to thelength of the staves, until the desired depth was reached. The Gow method was similar tothis, except that a telescoping wall liner (casing) was used in place of the stave boards. Thismethod resulted in a reduction in cross section of the shaft as the excavation was madedeeper.
As excavations needed to be constructed to greater depths and required larger diameters,man-power was replaced with machines powered by teams of horses (horse-power). Earlymodel auger machines could bore a 12 inch diameter hole to a depth of up to 30 feet. Whenrotary auger machines incorporated horse-power, greater depths became possible.Motorized, truck-mounted boring machines began to appear in the early 1930’s. A.H. Beckof San Antonio, TX and Hugh B. Williams of Dallas, Texas were among the first to developthese devices, first for digging shallow holes and later for drilled shaft excavation.
2.2 Varieties of Drilled Shafts
Bowles refers to the general case of a rotary drilled, cylindrical earthen hole filled withconcrete as a drilled pier, and lists the commonly used types as follows:
(1) Drilled shaft (used herein)(2) Drilled caisson, or simply a caisson(3) Bored pile, when the diameter is less than about 30 inches (1996).
When the base or tip of the shaft is drilled to a larger diameter than that of the shaft itself (aprocess known as underreaming), two additional nomenclatures are possible:
(1) Belled pier or belled caisson(2) Underreamed foundation.
The term “caisson” is used, in addition to the above, as a classification of early excavationsystems employing pre-made box structures. These weighted boxes, which were typicallymade of wood, were placed on the site to be excavated (normally under water) and filledwith pressurized air. Laborers inside the box hand-dug the soil beneath them causing thecaisson box to progressively sink deeper into the ground. Once the desired depth wasreached, the workers were removed and the structure was filled with concrete and used asa base in the foundation system. This type of caisson is markedly different from the augerbored piers of today, and is not considered a type of drilled shaft.
There are other types of deep foundation systems that utilize technologies such as percussiondigging (for excavation in rock), clamshell grab buckets, and auger-grouted excavations.These systems are not considered as drilled shafts. However, some of the construction issuesassociated with hole stability of grab bucket excavation are also similar to those encounteredin conventional drilled shaft construction.
7
2.3 Methods of Construction
Most literature agrees that there are three main types of drilled shaft construction. These arethe dry method, the casing method, and the slurry or wet method. On some sites it may benecessary to employ more than one of these methods, and in some instances a combinationof techniques may be utilized on one borehole location. An overview of each of thesemethods is presented in this section.
2.3.1 Dry Method
In the dry method of construction, soil is excavated using a rotary auger tool and thecorresponding borehole is left unsupported. This method is used in non-caving, cohesivesoils, which are generally located above the local ground water table (GWT). As the augertool advances, it must be removed from the hole periodically to place the spoil material asidefor later removal. Once the desired depth is reached, a clean-out bucket can be used toremove any remaining loose debris from the bottom of the borehole, and if desired,underreaming can be completed. Once the excavation is completed, concrete is normallyplaced by means of a tremie, although in some locals it is allowable to place the concrete byfree fall from the top of the excavation. This can have undesirable consequences, however,as segregation of the concrete may occur, and partial or full caving of the borehole may beinduced by concrete striking the wall of the excavation as it falls. However, some researchreports that this is not the case (STS, 1994).
When temporary casings are to be used, care must be taken to ensure that the steel is free ofany old concrete, oils, or other contaminants that may prove detrimental to the integrity ofthe finished shaft. Although it is common place in the U.S. to use recycled pipe fortemporary casing, if the walls of the pipe are not clean and relatively smooth, problems maybe encountered during extraction. Increased adhesion forces between the walls of the casingand the fluid concrete can, in effect, drag the freshly placed concrete upward while thecasing is being extracted. This drag can ultimately lead to necking in the shaft. In addition,any old concrete left on the outside of the casing can chip away and drop into the fluidconcrete as the casing is extracted, causing imperfections and possible weak points in thefinished shaft (FHWA, 1997).
If the drilled shaft is designed to resist tensile stresses (as would occur from the applicationof a bending moment) then a steel rebar cage will have to be placed into the hole. This canbe done prior to pouring concrete, or some concrete can first be placed, then the cage set atthe required depth before completing the pour. In any case, when using a rebar cage in adrilled shaft, care must be taken to ensure the rebar does not come in contact with the soil,especially at the base of the shaft. This could lead to a corrosion problem which willundermine the effectiveness of the foundation system.
The dry method of construction can sometimes be completed to depths greater than thelocation of the GWT if the geomaterial being penetrated has a low permeability, or if the

8
drilling and concreting operations are completed rapidly enough that no significant amountof water enters the borehole.
2.3.2 Casing Method
The casing method of construction employs some type of borehole liner, usually in the formof a simple steel pipe. Construction of a drilled shaft using the casing method is used onsites where caving or excessive lateral deformation of the excavation is probable, or whenthe geomaterial on the site is stable until cut. Additionally, it can be used when it is desiredto seal a borehole from the GWT.
The cased method can use wet or dry drilling techniques. When using this method ofconstruction, a temporary structural reinforcing sleeve (casing) is installed in the excavationto provide the lateral support necessary for maintaining the integrity of the hole. Thetemporary casings are generally installed such that they extend into an impervious formation,such as rock, and are left in place until the concrete is placed. These casings are installedusing any one of a variety of procedures. Two popular casing installation techniques arevibrated or driven and twisted (oscillated). Vibrated casings are usually continuous pipesections driven to the required depth of a competent formation. This is generally a fast andefficient method of installing a temporary casing, but if competent rock or the target "goodlayer" is at a variable depth, cutting and welding of the casing becomes necessary.Additionally, vibration of existing structures in the vicinity of the excavation is a concern.Twisted, sectional casings are a good alternative when vibrated casings become problematic.Because they are installed segmentally, no cutting or welding of the steel is required, and thevibration of adjacent structures is not an issue. However, the installation time is greater thanthat for vibrated casing, and specialized equipment is also necessary.
The casing can be installed prior to, during, or immediately after drilling. It is oftennecessary to install cutting teeth on the bottom of the casing to allow it to core into rock orother strong material. The casing can also be installed after the borehole has been drilled,though it may be necessary to fill the hole with slurry to stabilize it until the casing is placed.Then, the slurry must be completely bailed from the inside of the casing prior to placing arebar cage and pouring concreted (Bowles, 1996).
When using a casing to construct a drilled shaft, it can either be removed after the placementof concrete is complete (temporary casing) or left behind to become an integral part of thefoundation (permanent casing).
2.3.3 Wet (Slurry) Method
In any situation where the casing method is applicable, the wet method (a.k.a. slurry method)can optionally be used. The premise behind the wet method is that by maintaining a fluidpressure within the borehole that is at a higher level than the piezometric surface on the site,inward flow into the borehole is prevented and the likelihood of caving is reduced
9
substantially. The wet method utilizes one of the three classifications of drilling fluid:natural (freshwater or saltwater), mineral (bentonite, attapulgite, or sepiolite), or polymer.
When excavating a drilled shaft using the wet method, two methods of removing the spoilfrom the borehole are typically employed. The first, and most common according to O’Neilland Reese, is the static method (1999). In this method the cuttings are transported to thesurface by means of the drilling tool, and the fluid is left in the borehole while drillingadvances. The other is the reverse circulation method of drilling. Here, the drilling fluid iscontinuously pumped out of the borehole using a vacuum pump which is hose-connected tothe hollow stem of the auger tool. As drilling progresses, cuttings are forced to the centerof the borehole under the drill bit, and are removed using the vacuum pump along with anydrilling fluid in the vicinity. The removed material is then passed through a series of screenswhich removes the spoil from the drilling fluid. This “conditioned” drilling fluid is thenreturned to the borehole while drilling continues to the desired depth. The entire systemforms a closed loop, and the fluid head within the borehole is always maintained at a levelabove the local GWT.
2.4 Drilling Slurries
Drilling fluids commonly used today are slurries of either naturally occurring minerals orsynthetic polymers and water. In the first type, mineral slurries, bentonite is mixed with thewater to create a slurry with a unit weight that is moderately higher than water alone.Bentonite, which is a processed, powdered sodium montmorillonite clay, consists ofmicroscopic plate-like particles that remain suspended in the mixing water. When this slurryis placed into an excavation and maintained at a higher head than the natural piezometricsurface, the suspended particles permeate the walls and form a mud-cake layer that helps tostabilize the hole.
Synthetic polymer slurries are a relatively new alternate to mineral slurries. However, theyare only currently accepted in 12 out of the 21 states that have drilled shaft specifications.Table 2-1 lists each of the 50 states and notes permissible slurry types. In polymer slurries,the active mechanism comes from very long chains of hydrocarbons. These chains lead tothe characteristic strings that are visible during drilling. Similar to the permeation of theexcavation walls by bentonite slurries, the hair-shaped hydrocarbon chains of polymerslurries serve to stabilize the excavation through continuous cohesion and drag forces asfiltration of the chains into the walls occurs. Unlike bentonite slurries, synthetics do notleave a mud cake or have the gel capacity to suspend and transport drill cuttings for anyappreciable time. Also, since the unit weights of most polymer slurries is just slightly higherthan or equal to that of water, the slurry level must be kept significantly higher than thepiezometric surface of the formation. FHWA recommends at least a +2 meter headdifferential (O’Neill and Reese, 1999).

10
Table 2-1. Summary of Slurry Acceptance From Individual State SpecificationsSLURRY
ALLOWED BENTONITE ATTAPULGITE
OTHERMINERAL
POLYMER YEAR
ALABAMA (AL)Y Y Y W/A W/A 2002
AL506.pdf
ALASKA (AK)Y N N N N 2002
special provisions for water (natural) slurry only
ARIZONA (AZ)W/A Y Y N N 2002
AZ609.pdf
ARKANSAS (AR) no formal drilled shaft specs 1996
CALIFORNIA (CA)Y Y Y Y Y 1999
COLORADO (CO)W/A* Y Y Y Y 1999
*follow specs from FHWA 1999 construction procedures & design
CONNECTICUT (CT) no formal drilled shaft specs 1999
DELAWARE (DE) No Drilled Shaft Construction Allowed 2004
FLORIDA (FL)Y Y Y Y N 2004
FLD455.pdf & FLD455S1.pdf
GEORGIA (GA)W/A Y N N N 2001
special provisions, not in pdf format
HAWAII (HI)Y Y Y Y N 1994
HI511.pdf
IDAHO (ID) no formal drilled shaft specs 2004
ILLINOIS (IL)W/A W/A W/A W/A W/A 2004
special provisions, IDOTspecprov.pdf
INDIANA (IN) no formal drilled shaft specs 1999
IOWA (IA)Y Y Y Y Y 2004
IADS-01038.pdf
KANSAS (KS)Y Y N N Y 2004
KA5.pdf
KENTUCKY (KY) no formal drilled shaft specs 2004
LOUISIANA (LA)Y Y Y N Y 2000
LA814.pdf
MAINE (ME) no drilled shaft specs 2002
MARYLAND (MD)Y N N N N 2001
MD400-412changes2001.doc
MASSACHUSETTS (MA) no formal drilled shaft specs 1995
MICHIGAN (MI) no formal drilled shaft specs 2003
MINNESOTA (MN) no formal drilled shaft specs 2000
MISSISSIPPI (MS) no formal drilled shaft specs 2003
MISSOURI (MO) no formal drilled shaft specs 1999
11
Table 2-1. (Continued)SLURRY
ALLOWED BENTONITE ATTAPULGITE
OTHERMINERAL
POLYMERYEAR(as of)
MONTANA (MT) no formal drilled shaft specs 1995
NEBRASKA (NE) no formal drilled shaft specs 2002
NEVADA (NV)Y Y Y Y Y 1997
NV509.pdf
NEW HAMPSHIRE (NH) no formal drilled shaft specs 2002
NEW JERSEY (NJ) no formal drilled shaft specs 2001
NEW MEXICO (NM)Y Y Y Y Y 2000
NM502.pdf
NEW YORK (NY) no formal drilled shaft specs 2002
NORTH CAROLINA (NC) no formal drilled shaft specs 2002
NORTH DAKOTA (ND) no formal drilled shaft specs
OHIO (OH) no formal drilled shaft specs 2000
OKLAHOMA (OK)Y Y Y Y Y 1999
OK516.pdf
OREGON (OR)Y Y Y Y Y 2002
OR02-00500.pdf
PENNSYLVANIA (PA)Y Y N N N 2000
PASection1006.pdf
RHODE ISLAND (RI) no formal drilled shaft specs 1997
SOUTH CAROLINA (SC)Y Y Y N N 2000
SC712.pdf
SOUTH DAKOTA (SD)N N N N N 2002
SD465dual.pdf
TENNESSEE (TN) no formal drilled shaft specs 1995
TEXAS (TX)Y Y N N N 1993
TX416.pdf
UTAH (UT)N N N N N 2002
UT0466.pdf
VERMONT (VT) no formal drilled shaft specs 2001
VIRGINIA (VA) no formal drilled shaft specs 2002
WASHINGTON (WA) no formal drilled shaft specs 2002
WASHINGTON DC no formal drilled shaft specs 1996
WEST VIRGINIA (WV)Y W/A W/A W/A W/A 2000
WV_SUP_Y2K[1].pdf
WISCONSIN (WI) no formal drilled shaft specs 2004
WYOMING (WY)W/A W/A W/A W/A W/A 1995
WY506.pdf
12
2.4.1 Effect of Slurry on Drilled Shaft Capacity
It is important to note that the use of drill slurries, either mineral or polymer, may havesignificant effects on the axial capacity of drilled shafts. Extensive research has been doneto verify load carrying capacities suggested by current design practices. Most of this researchis based on dry, cased, or mineral (bentonite) slurry construction methods in clayey or sandysubsurface environments. More recent research shows the effect of polymer slurry onperimeter load transfer and end-bearing capacity. However, little research has beenconducted that investigates the effect of polymer slurry on borehole stability and designparameters for drilled shafts.
In permeable subsurface conditions, filter cake formation of bentonite slurry is essential inpreventing the loss of slurry from the borehole. Additionally, the filter cake adds stability tothe excavation by minimizing the required slurry head differential from the ground waterelevation. However, the formation of a filter cake may also have a downside. As concreteis placed into the borehole through a tremie pipe, it displaces the bentonite slurry, but doesnot generate enough friction to remove the filter cake. Constant, adequate mixing of theslurry can help decrease the thickness of the filter cake, but it will not prevent it from formingall together. Studies have shown that the filter cake interferes with the bond between theconcrete and the borehole wall, thus decreasing unit side shear. According to Brown (2002),shafts excavated and inspected several months after construction have a distinct mud-cake
layer of approximately 1 to 3 mm separating the concrete from the surrounding soil.However, Thasnanipan (1998) states that if the following bentonite slurry parameters aremaintained within the given ranges and construction time does not exceed 24 hours, there isno significant effect on the axial capacity: marsh cone viscosity of 30 - 60, pH between 7 and11, and sand content of less than 4%. Drilled shaft specifications adopted by the Florida DOTclosely resemble these ranges (Table 2-2), with the exception that prior to concreteplacement, slurry is allowed to remain in the borehole up to 36 hours before the sidewallsmust be overreamed. Though the upper limit on sand content is 4%, advances in drilled shaftconstruction procedures and equipment warrant stricter tolerances, and are in fact beingimplemented by other states (e.g. Louisiana and North Carolina).
Table 2-2. State of Florida Specifications for Road and Bridge Construction: 455-15.8.1
Item to be Measured Range of Results at 20 C Test Methodo
Density 1030 to 1170 kg/m (in freshwater)3
1060 to 1200 kg/m (in saltwater)3Mud density balance:
FM 8-RP13B-1
Viscosity 28 to 40 seconds Marsh Cone Method:FM 8-RP13B-2
pH 8 to 11 Electric pH meter or pHFM 8-RP13B-4
Sand Content 4% or less FM 8-RP13B-3

13
Most side shear degradation occurs during the first 24 hours of construction, but shaftcapacity will still exceed the estimated design value. After 24 hours, there is less timedependance for side shear degradation, but side shear will be ultimately reduced to less thanthe estimated design capacity (Thasnanipan, 1998).
Polymer slurries do not form a filter cake. Fluid loss prevention depends on the formationof long chemical chains. Because there is no filter cake or boundary layer formed betweenthe slurry and the sidewall, a nearly indistinct bond will form between the concrete andsurrounding soil. Frizzi (2004) showed that shafts constructed and load tested in a sandySouth Florida location exhibited 25% to 50% less side shear in the upper half of shaftsconstructed with bentonite slurry when compared to those constructed with polymer slurry.In a study conducted by Brown, et al. in 2002, two identical shafts were constructed using thewet method. One borehole was drilled using a bentonite slurry, while the other utilized asynthetic polymer slurry. Load tests conducted on the shafts after adequate curing timeshowed that the shaft constructed using the bentonite slurry had a much lower axial capacitythan did the other shaft. In particular, a 300% increase in side friction resistance wasobserved with the shaft constructed using polymer. A study conducted with 11 drilled shaftsconstructed in Bangkok Subsoil (clay and dense sand layers) using polymer slurry showedthat overall capacity was 1.5 times greater than calculated values determined for bentoniteslurry method. Most of this capacity is believed to result from greater skin friction in sandylayers (Thasnanipan, 2002).
For shafts constructed in impermeable formations, the measured side shear was very similar(Ata, 1998). This may be because no filter cake forms in the borehole containing bentoniteslurry and the concrete/soil bond is preserved (Ata, 1998 and Camp, 2002).
2.4.2 Borehole Stability and Particle Suspension
Maintaining hole stability at all times is paramount for all drilled shaft construction and is notslurry type specific. When the hole becomes unstable, the soil structure relaxes and changesthe soil parameters used for design. The consequence is that the resultant shaft capacity inno way reflects the anticipated/designed capacity. Bentonite slurry is known to maintain holestability as long as it is kept higher than the GWT. Polymer slurries have proven to maintainborehole stability, but maybe more sensitive to surrounding ground vibrations. If a boreholeis filled with polymer slurry after sidewall sloughing has already begun, the hole willcontinue to collapse. However, if polymer slurry is added during excavation and prior toreaching the piezometric surface, the borehole stability will be maintained for more than 18hours (Ata, 1998). Thasnanipan (2002) used cross hole sonic logging to show that boreholeintegrity was maintained for over 24 hours using polymer slurry in Bangkok subsoil.
Bentonite and other mineral slurries have an excellent ability to suspend solids due to the gel-like structure formed between clay molecules. Under this construction method, bottomcleanliness is usually maintained once it has been achieved within a reasonable time frame(1-2 hrs). Polymer slurries do not tend to suspend solids, especially sands. Sands and largerparticles will settle very quickly in excavations filled with polymer slurry. Polymer
14
constructed shafts have less end-bearing capacity possibly due to greater settlement of solids(Frizzi, 2004). However, no significant difference in end-bearing was observed for shaftsdrilled with polymer and mineral slurries through both sand and clay layers above the CooperMarl formation which is a very stiff clay (Camp, 2002). This was surmised to have beenbecause there was not a significant amount of sand particles that settled to the boreholebottom.
2.4.3 Slurry Economics
Construction costs can be greatly impacted by choosing mineral or polymer slurry. Costs canincrease based on product yield and preparation or clean-up time required. Bentonite slurriesrequire more clean up for reuse and must be treated prior to disposal. They must be desandedand then readjusted to the required rheological properties prior to use in a new excavation.This requires additional time and equipment, resulting in higher mobilization costs (Ballard,2000). Bentonite is also known to be harmful to aquatic life and can be detrimental to normalgroundwater flows because it creates an impermeable layer where it is disposed. Thus, itmust be treated extensively before it can be disposed of at a regulated location.
Polymer (according to manufacturers) can be mixed directly in the borehole, or shortly beforeexcavation in an onsite tank, and requires minimal clean up for reuse, and no clean up fordisposal. It can also be disposed of anywhere as it is biodegradable and has no adverseenvironmental effects. Also, a larger quantity of bentonite is required for slurry mixing (10to 40 tons of bentonite per 1 ton of most polymers). This can be more costly and requiresmore space for storage at the construction site (Beresford, 1989).
2.5 Excavation Clean out Techniques and Equipment
Regardless of the method of excavation, the finished quality of a drilled shaft depends largelyon the cleanliness of the borehole. Current FDOT specifications (455-15.11.4) limit theamount of loose material remaining on the bottom of a borehole to no more than 1/2 inchacross 50% of the base area of the shaft, and no more than 1.5 inches in any one location formost structures (FDOT, 2000). Visual inspection is accomplished using a Shaft InspectionDevice or some derivation thereof, or by use of a diver. Other methods, such as soundingusing a weighted tape are used at the discretion of the supervising engineer (Crapps, 1992).Removal of loose debris from a borehole can be completed using any one of several methods,the most common of which are:
(1) Cleaning bucket (or, clean out bucket)(2) Air lift(3) Sweeper air lift(4) Three-in-one bucket(5) Submersible pumps(6) Over-reaming
15
A cleaning bucket is similar to a core bit except that it has the capability of being closed atthe bottom so as to prevent material from falling out while the tool is lifted from the borehole.This tool, which is also known as a bail bucket or clean-out bucket, is nearly watertight whenclosed, and thus it can be used to remove drilling slurry from the excavation (Crapps, 1992).Ideally these buckets have one or more vent tubes located in them to prevent vacuum fromdeveloping beneath the tool as it is extracted. Because this phenomena could induce failureof the borehole through suction action on the walls, it is important to keep these passagesclear.
Air lift systems are another means of removing loose debris from the base of a drilled shaftwhen the wet method of construction is used. In these systems, compressed air is introducedinto the bottom of the borehole by means of a special pipe that extends to the surface. As thisair is forced into the excavation, it creates bubbles that rise in the column of fluid therein. Asthese air bubbles ascend toward the surface, loose debris and slurry are carried upwardthrough the pipe and are removed at the surface. The procedure is analogous to a vacuumcleaner.
Designed in Australia, the sweeper air lift system is similar to the standard air lift, except thatit incorporates a brush that pushes loose material toward the center of the excavation. There,the debris is removed using a vacuum pump system as described previously. The three-in-one bucket is a combination tool that incorporates a sweeper air lift system into a clean-outbucket. Larger materials are collected in the bucket while finer materials are removed usingthe air lift system.
Specially modified submersible pumps are sometimes used at the bottom of a borehole.These pumps are placed onto risers so that they do not damage the bottom of the excavation.The pumps force slurry and suspended material out of the shaft through hoses that areconnected to some type of spoil removal system (i.e. de-sanding unit), and at the same timefresh fluid is returned to the borehole from the top. This method of circulation continuouslyreplaces the fluid column in the borehole until all suspended materials are removed (Huerstel,et. al., 1989).
Overreaming is a technique that is used to scrape the walls of a drilled shaft excavation inorder to remove any filter cake left by the slurry as well as soft soils or clays left behind bythe drilling process (Crapps, 1992). This is done to increase the side skin resistence of thefinished shaft (Passe, 1993).
2.6 The State of Drilled Shaft Integrity Testing
The design of structural elements, including mass foundations, assures that the resistance ofa specific structural element exceeds the Ultimate, Serviceability, and Specific limit stateswith an acceptable factor of safety. The magnitude of the factor of safety applied to astructural system has a direct correlation to the ability of the designer to verify the resistancesfrom structural components. It is then verified that these resistances exceed the direct load

16
effects. The factor of safety also has a direct effect on the overall size and cost of anystructural system.
In the case of super structure members such as bridge girders, the inspection process can bestraight forward, since the structural elements are easily inspected during manufacturing,shipping, and installation, yielding an efficient system that accomplishes the required taskwith little waste. However, substructure elements, such as drilled concrete shaft foundations,do not have the same liberties of inspection as the aforementioned counterparts. Therefore,several methods have been developed in an effort to determine the integrity of a completeddrilled shaft. The most widely accepted methods are described herein along with a synopsisof the underlying physical principals or science that these tests are founded upon, and adiscussion of each test’s pros and cons.
The following subsections will investigate the current state of integrity testing. Thesemethods can be categorized as either destructive or nondestructive and include: concretecoring, seismic echo, impulse response, cross-hole sonic logging, and density testing bydownhole gamma-gamma logging.
2.6.1 Cross Hole Sonic Logging
Cross Hole Sonic Logging (CSL) is arguably the most widely accepted and used integritytesting method. CSL evaluates the uniformity and continuity of concrete by recording thevelocity of signals from an emitter to a receiver, each inserted into the pile in preset tubes orpipes (Lewet al., el, 2002). In fact, Alabama Department of Transportation’s Specifications
for Drilled Shaft Construction, Section 506 states in 506.10(a)1, states that “thenondestructive testing method called Crosshole Sonic Logging (CSL) shall be used on allproduction and trial drilled shafts (a) when constructed with the placement of concrete underwater or through slurry, (b) when required by special note on the plans, (c) when full lengthtemporary casing is used to prevent water from entering the shaft, or (d) when determined tobe necessary by the Engineer (ADOT, 2001).” In short, whenever there is a high probabilityof the existence of drilled shaft inclusions or a problem, Alabama requires CSL testing beperformed. Alabama does not recognize or accept any other testing methods in their statespecifications.
State of California Department of Transportation Engineering Service Center Division ofStructures, California Foundation Manual and New York State Department ofTransportation’s Drilled Shaft Inspector’s Guidelines, have similar requirements as Alabamabut also allow the use of several different testing methods included in this chapter.
The primary reason that CSL is so widely accepted is because it is an accurate, cost-effective,and nondestructive means of investigating the integrity of concrete in drilled shaftfoundations (Branagan & Associates, Inc, 2002). Furthermore, CSL determines the integrityand homogeneity of concrete in a deep foundation and identifies voids or soil intrusionswithin the structure.
17
The CSL test includes placing a signal generator in one access tube and a signal receiver inanother access tube. The basic theory of the CSL test is that the arrival time of thecompression wave signal from the generator to the receiver has a direct correlation to thedensity of the concrete. The ultrasonic compression-wave (or p-wave) arrival time from asignal source in one tube is measured to a receiver in another tube. The test is normally runfrom the bottom to the top with both the receiver and the generator at the same verticalelevation. Knowing the tube separation distance, the p-wave velocity is calculated for eachdepth. The results are plotted as velocity with respect to depth (2002).
P-wave velocities for sound concrete free of defects are typically around 3,700 m/sec (12,000ft/sec). Decreases in sonic-velocity from the local velocity average, accompanied bydecreases in signal energy, indicate a departure from uniform concrete quality. Soil intrusion,poor concrete mix quality, voids, or other non-cemented intrusive materials can cause adecrease in p-wave velocity (2002). Table 2-3 indicates the p-wave velocity in differentmedia.
Table 2-3. P-Wave Velocity in Different MediaMaterial Velocity (ft/sec) Velocity (km/sec)
Sound Concrete 12,000 3.7
Water 4,800 1.5
Air 1,100 0.3
The equipment set up for the CSL test includes placing either steel or PVC access tubesaround the perimeter of the reinforcement cage. The number of tubes to be installed willdepend on the diameter of the shaft and requirements of the state drilled shaft constructionspecifications where the shaft is being installed. The general guide, however, is to install oneaccess tube per foot of shaft diameter (or one tube per 0.25 to 0.30 meters of shaft diameter)(2002). Alabama requires that 1.5 inch to 2.0 inch (40 mm to 50 mm) inside diameterschedule 40 steel pipe be used in quantities specified in Table 2-4 below.
Table 2-4. Alabama’s Minimum Number of CSL Tubes per Shaft (ADOT, 2001)
Shaft Diameter, D Minimum # Of Tubes
D� 4.5 feet {1372 mm} 44.5 feet {1372 mm} < D � 5.5 feet {1676 mm} 55.5 feet {1676 mm} < D � 6.5 feet {1981 mm} 66.5 feet {1981 mm} < D � 7.5 feet {2286 mm} 77.5 feet {2286 mm} < D � 8.5 feet {2591 mm} 88.5 feet {2591 mm} < D � 9.0 feet {2743 mm} 99.0 feet {2743 mm} < D � 10.0 feet {3048 mm} 1010.0 feet {3048 mm} < D � 11.0 feet {3353 mm} 1111.0 feet {3353 mm} < D � 12.0 feet {3658 mm} 12
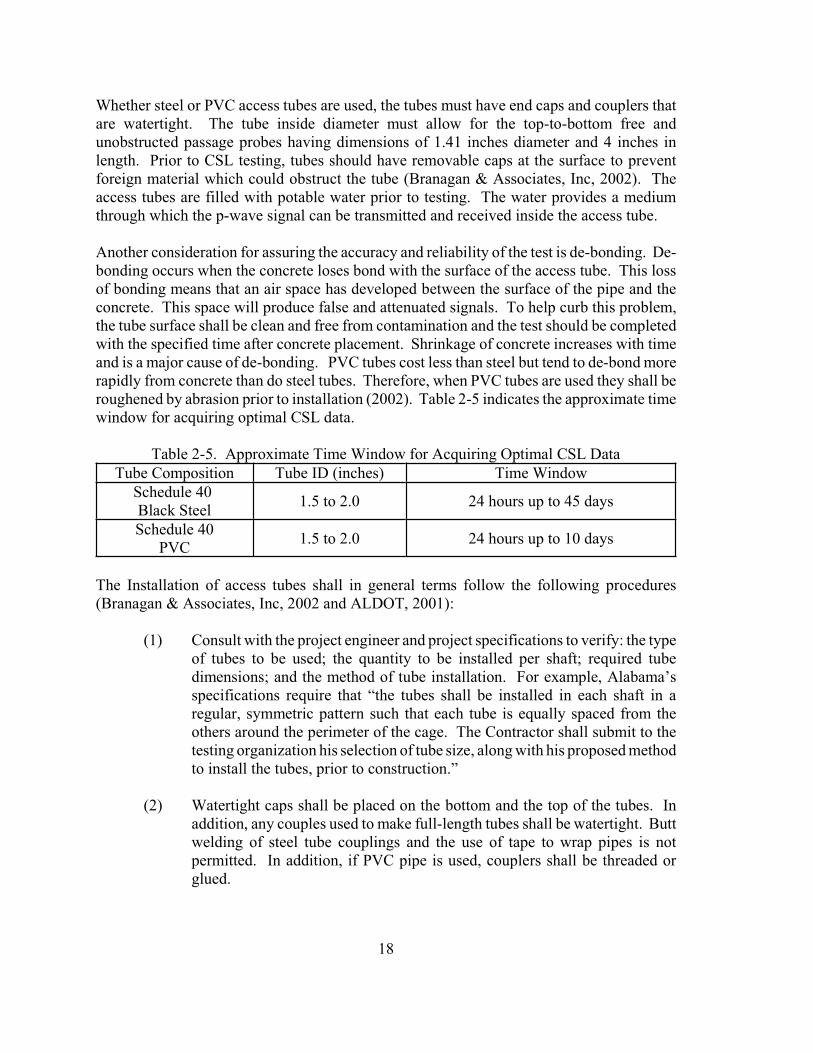
18
Whether steel or PVC access tubes are used, the tubes must have end caps and couplers thatare watertight. The tube inside diameter must allow for the top-to-bottom free andunobstructed passage probes having dimensions of 1.41 inches diameter and 4 inches inlength. Prior to CSL testing, tubes should have removable caps at the surface to preventforeign material which could obstruct the tube (Branagan & Associates, Inc, 2002). Theaccess tubes are filled with potable water prior to testing. The water provides a mediumthrough which the p-wave signal can be transmitted and received inside the access tube.
Another consideration for assuring the accuracy and reliability of the test is de-bonding. De-bonding occurs when the concrete loses bond with the surface of the access tube. This lossof bonding means that an air space has developed between the surface of the pipe and theconcrete. This space will produce false and attenuated signals. To help curb this problem,the tube surface shall be clean and free from contamination and the test should be completedwith the specified time after concrete placement. Shrinkage of concrete increases with timeand is a major cause of de-bonding. PVC tubes cost less than steel but tend to de-bond morerapidly from concrete than do steel tubes. Therefore, when PVC tubes are used they shall beroughened by abrasion prior to installation (2002). Table 2-5 indicates the approximate timewindow for acquiring optimal CSL data.
Table 2-5. Approximate Time Window for Acquiring Optimal CSL DataTube Composition Tube ID (inches) Time Window
Schedule 40 Black Steel
1.5 to 2.0 24 hours up to 45 days
Schedule 40PVC
1.5 to 2.0 24 hours up to 10 days
The Installation of access tubes shall in general terms follow the following procedures(Branagan & Associates, Inc, 2002 and ALDOT, 2001):
(1) Consult with the project engineer and project specifications to verify: the typeof tubes to be used; the quantity to be installed per shaft; required tubedimensions; and the method of tube installation. For example, Alabama’sspecifications require that “the tubes shall be installed in each shaft in aregular, symmetric pattern such that each tube is equally spaced from theothers around the perimeter of the cage. The Contractor shall submit to thetesting organization his selection of tube size, along with his proposed methodto install the tubes, prior to construction.”
(2) Watertight caps shall be placed on the bottom and the top of the tubes. Inaddition, any couples used to make full-length tubes shall be watertight. Buttwelding of steel tube couplings and the use of tape to wrap pipes is notpermitted. In addition, if PVC pipe is used, couplers shall be threaded orglued.
19
(3) Access tubes shall be attached to the interior of the reinforcing cage with wireties at regular intervals along the length of the shaft, for example every threefeet. Tubes shall be secured as to maintain vertical and parallel alignmentduring cage lifting, lowering and concrete placement. Tubes that are notvertical and parallel can adversely affect the outcome of a CSL test. Inaddition, care shall be taken during reinforcement installation operations inthe drilled shaft hole not to damage the tubes.
(4) In order to include the toe of the shaft in the testing, the access tubes shall beinstalled such their bottom is close to the bottom of drilled shaft. Generally,tubes are placed within six inches of the toe of the shaft. Tubes are alsoextended two to three feet above what will be the top of the concrete shaft.
(5) The tubes must be filled with clean water as soon as possible after thereinforcement cage is set; in no case shall the tubes remain dry for more thanone hour after concrete placement. The addition of the water to the tubes helpsprevent the tubes from de-bonding. The tubes shall be capped or pluggedimmediately after being filled with water to prevent debris from entering intothe tubes.
(6) Alabama’s Specifications require, “The pipe caps or plugs shall not beremoved until the concrete in the shaft has set. Care shall be exercised in theremoval of caps or plugs from the pipes after installation so as not to applyexcess torque, hammering, or other stresses which could break the bondbetween the tubes and the concrete.”
(7) Normally, after the CSL test is completed, the access holes are evacuated andfilled with an approved grout mix.
When determining how soon after concrete placement a CSL test can be completed,consideration must be given to how much the concrete has cured. In no case shall a test beconsidered accurate if completed within twenty-four hours after concrete placement. Thistime may need to be extended for larger diameter shafts or if mix designs that retard concretesetting are used (2002). In the interest of correcting any problems found in a timely mannerand before the concrete is fully cured, the shaft should be tested as soon as possible after ithas adequately cured.
The industry leader in manufacturing CSL equipment is Olson Engineering of Wheat Ridge,Colorado. The instrumentation provided for a CSL test from Olson Engineering typicallyconsists of the following components (2002):
(1) A depth wheel/counter cabling system that is used to measure the verticalelevation of the CSL probes during the CSL Test.
20
(2) 35-kHz hydrophone source and receiver probes with a diameter of 1.41inches and a length of 4 inches.
(3) A synchronized triggering system that starts recording data at the same timethat the source is excited.
(4) A microprocessor-based computer system that has the capability to displayindividual records, perform analog to digital conversion, record data, datamanipulation, and data output.
(5) As an option, a 12-volt DC battery power source may be incorporated into thesystem to allow for remote use of the system.
The procedure for completing a CSL test includes the following (2002):
(1) The top and bottom elevations for the shaft being tested, or the shaft length,are recorded. The concrete placement date is recorded along with any otherpertinent data regarding unusual observations or events that occurred duringconstruction of the concrete shaft.
(2) A sketch of the shaft under consideration is made and the access tubes areassigned a reference number. This reference number is recorded on thesketch along with a precise distance measurement between all of the tubepairs and the tube stick-ups above the concrete surface. Since the theorybehind the CSL test is based on the p-wave arrival time, exact determinationof the distance between tube pairs is necessary to accurately analyze a test.
(3) A tripod with the depth wheel is set up over top of the foundation to be testedand cabling is spooled from the computer, over the depth wheel, to each ofthe source and receiver probes. The cabling along with a cable from thedepth wheel runs back to the microprocessor based data acquisition unit.These cables provide both excitation and signal return for the hydrophone,receiver, and depth encoder.
(4) Standard CSL tests are run with both the source and receiver probes in thesame horizontal plane. Therefore, the test is started by lowering the probesto the full depth of the tubes being tested. After the slack is removed fromthe cables attached to the probes, the cables are simultaneously hand pulledover the depth wheel to steadily bring the probes to the surface. CSL acoustictravel time measurements are made at depth intervals of 0.2 feet or less fromthe bottom to the top.
(5) Well trained personnel are able to field analyze the measured data as well asthe derived sonic velocities in terms of completeness and accuracy todetermine the validity of the test. Final determination of whether a suspect
21
shaft contains an anomaly or not should only be made after additional datareduction and evaluation is completed. This additional work is not ordinarilycompleted in a field environment.
The data from a CSL test is typically presented to the client in the form of a written reportwhich in addition to general descriptive information, includes the following specificinformation. Results are based on transit times and signal strength between each tube pairtested and should include:
(1) Interpretation of velocity profile logs with regard to the integrity of theconcrete.
(2) Identification of the depth interval and tube pair that includes a sonicanomaly.
(3) Profiles of the initial acoustic pulse arrival time versus depth and pulseenergy / amplitude versus depth (2002).
If it is determined, from CSL testing that a drilled shaft contains an anomaly, several methodsmay be used to try and isolate the location of the anomaly. Ultimately, however, the drilledshaft will likely need to be cored to determine whether or not the shaft is acceptable.
2.6.2 Crosshole Tomography
Several variations of the CSL test have been developed using the same instrumentation as theCSL. These tests are typically employed after CSL has determined the high probability ofan anomaly in a given area and are applied to improve location accuracy and to furthercharacterize the feature. The additional information is utilized to reduce the uncertainty incoring and remediating the defective area (2002). One of the most popular of these variationsis Crosshole Tomography.
A Crosshole Tomography test is performed by leaving the receiver in a fixed position andraising the hydrophone while the hydrophone is producing sonic pulses. As in the CSL test,the arrival times from the hydrophone to the receiver are recorded. This procedure producesray-paths that allows for three dimensional modeling of the suspect shaft. Figure 2-1 showsa velocity tomogram on a drilled shaft of a highway bridge. The anomalous zone is the slow-velocity area which lies in between 31 and 33 feet below the top of the concrete near tubeone. Note that the center of the shaft is sound (Olson, 2003).
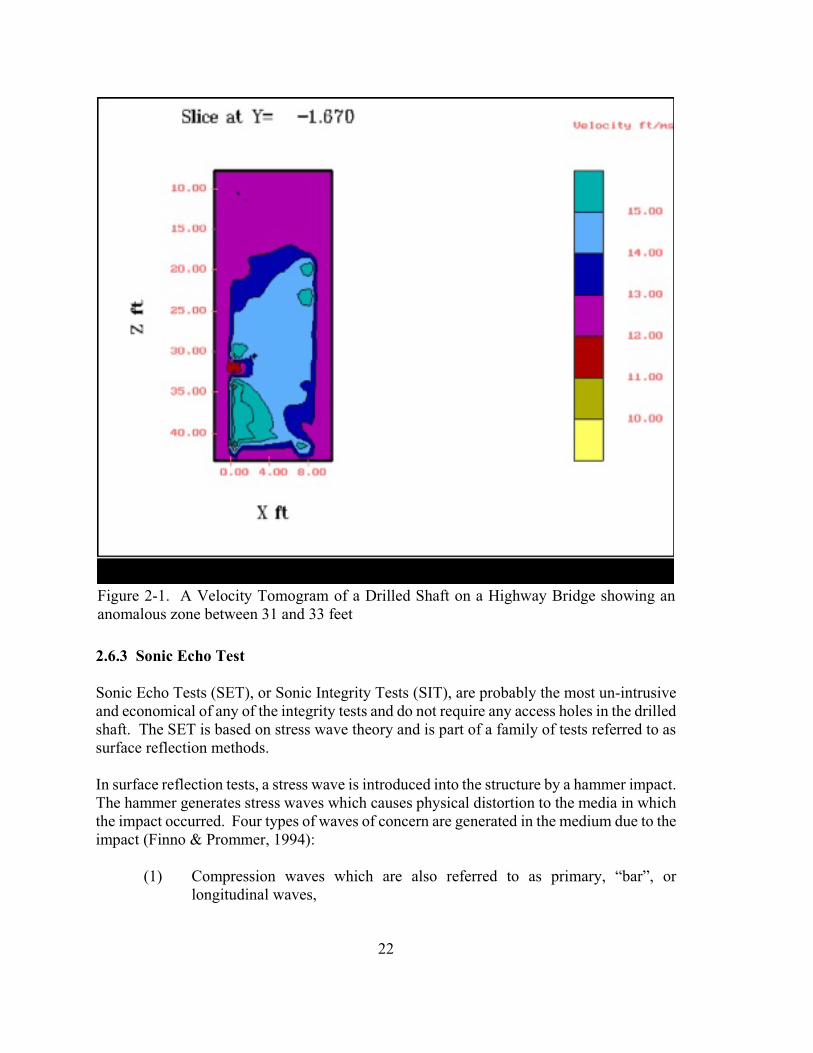
22
2.6.3 Sonic Echo Test
Sonic Echo Tests (SET), or Sonic Integrity Tests (SIT), are probably the most un-intrusiveand economical of any of the integrity tests and do not require any access holes in the drilledshaft. The SET is based on stress wave theory and is part of a family of tests referred to assurface reflection methods.
In surface reflection tests, a stress wave is introduced into the structure by a hammer impact.The hammer generates stress waves which causes physical distortion to the media in whichthe impact occurred. Four types of waves of concern are generated in the medium due to theimpact (Finno & Prommer, 1994):
(1) Compression waves which are also referred to as primary, “bar”, orlongitudinal waves,
Figure 2-1. A Velocity Tomogram of a Drilled Shaft on a Highway Bridge showing ananomalous zone between 31 and 33 feet

23
(2) Shear waves which are also referred to as secondary or transverse waves,
(3) Surface waves or Rayleigh waves, and
(4) Stonely waves or tube wave.
The basis behind integrity tests that are developed from stress wave theory is: the time thatit takes for a compressive stress wave to be generated at the surface, reflected off of the toe,and return to the surface is based on the velocity of the wave and the length of the shaft. Anyvariation from the expected arrival time may be indicative of a problem.
The compression wave is the primary concern for SET and is the fastest wave traveling13,100 ft/s (4,000 m/s) in solid high quality concrete. The compression wave causes thematerial being tested to alternate compressive and tensile stresses by the wave (Blitz, 1971).At the point of the hammer impact, a compression zone is produced which results in theformation of a compressive stress wave. The compression wave travels down the shaft at a
c cvelocity (v ) with a force (F). Shaft impedance (Z) is a ratio of v and F. It is also a functioncof the elastic modules (E), cross-sectional area (A), and compression wave velocity (v ) of
the shaft (Finno & Prommer, 1994).
A change in the cross-sectional area of the drilled shaft and/or a change in the density of themedium (concrete) will cause a change in impedance. Part of the stress wave reflects backup the shaft whenever the wave encounters a change in impedance. The remainder of thestress wave continues down the length of the shaft. A compression or negative wave isreflected back up the shaft whenever an increase in cross-section or density occurs. A tensileor positive wave is reflected back up the shaft with a reduction in cross-sectional area orconcrete density. In the absence of changes in impendence, the stress wave travels until it isreflected off of the pile toe (1994).
Figure 2-2 shows a typical response curve obtained from an SET (SIT). The initial impactat the top of the pile is visible and the distance to the toe is observed by noting the returnreflection of this wave. Any early reflections would indicate some type of increase in theimpedance of the material to stress wave propagation. This can be a break in the shaft, achange in soil stiffness, or a significant change in cross section of the shaft. Additionally, thepolarity of the reflected wave with respect to the original impact can often be an indicator ofthe type of anomaly encountered. In general, when the reflected wave is of the same polarity(algebraic sign) as the impact wave, this indicates an increase in cross section or a decreasein impedance. If the polarity of the reflection is opposite that of the original impact, a higherimpedance is being encountered, such as would be caused by a necked region of the shaft.
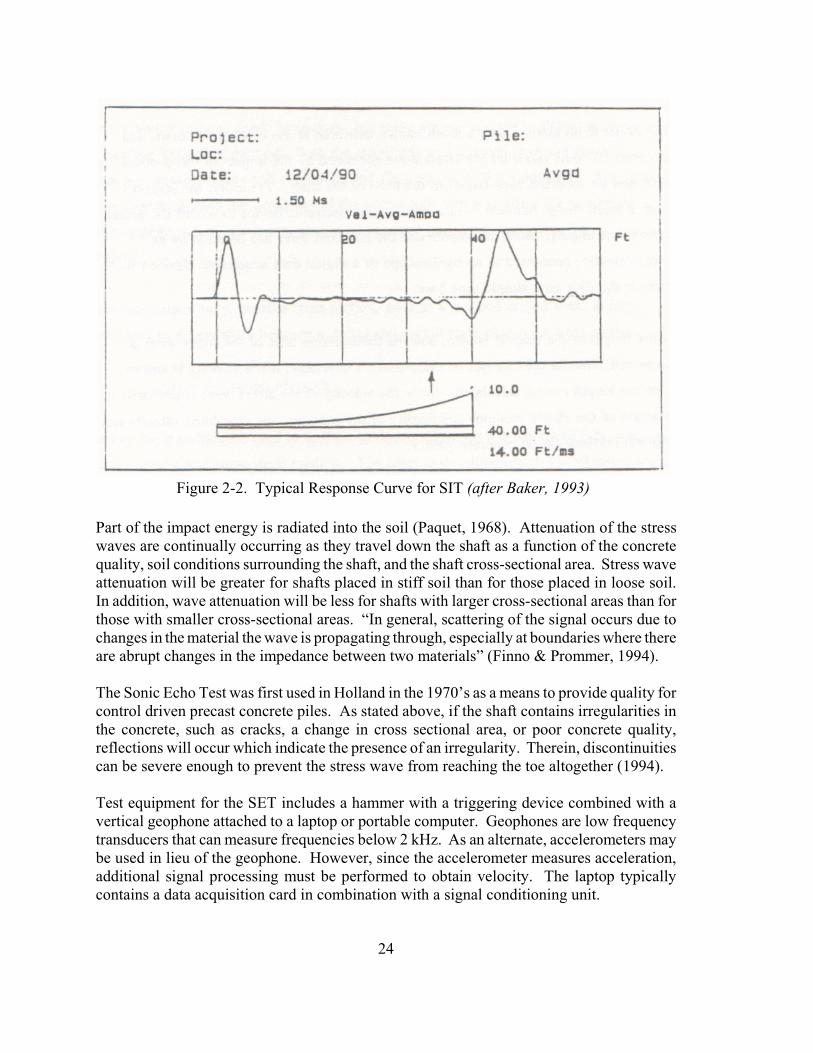
24
Figure 2-2. Typical Response Curve for SIT (after Baker, 1993)
Part of the impact energy is radiated into the soil (Paquet, 1968). Attenuation of the stresswaves are continually occurring as they travel down the shaft as a function of the concretequality, soil conditions surrounding the shaft, and the shaft cross-sectional area. Stress waveattenuation will be greater for shafts placed in stiff soil than for those placed in loose soil.In addition, wave attenuation will be less for shafts with larger cross-sectional areas than forthose with smaller cross-sectional areas. “In general, scattering of the signal occurs due tochanges in the material the wave is propagating through, especially at boundaries where thereare abrupt changes in the impedance between two materials” (Finno & Prommer, 1994).
The Sonic Echo Test was first used in Holland in the 1970’s as a means to provide quality forcontrol driven precast concrete piles. As stated above, if the shaft contains irregularities inthe concrete, such as cracks, a change in cross sectional area, or poor concrete quality,reflections will occur which indicate the presence of an irregularity. Therein, discontinuitiescan be severe enough to prevent the stress wave from reaching the toe altogether (1994).
Test equipment for the SET includes a hammer with a triggering device combined with avertical geophone attached to a laptop or portable computer. Geophones are low frequencytransducers that can measure frequencies below 2 kHz. As an alternate, accelerometers maybe used in lieu of the geophone. However, since the accelerometer measures acceleration,additional signal processing must be performed to obtain velocity. The laptop typicallycontains a data acquisition card in combination with a signal conditioning unit.
25
In order to perform a SET, two areas on the top of the concrete shaft being tested are cleanedand ground to a smooth surface. One area is cleaned close to the center of the shaft. Thislocation is the impact point for the hammer. The second location shall be near the perimeter,but within the rebar cage. The geophone is fixed to the concrete surface with a couplingagent. Next, the shaft is struck with the hammer at the area close to the center. Once thehammer impacts the top of the shaft, the portable computer is triggered and records theresponse of the top of the shaft via the geophone or the accelerometer. Background noise canbe eliminated by performing the test several times and comparing and averaging the results(1994).
The results of the SET indicating a sound shaft show compression wave reflection planes atthe concrete-soil interface at the toe and the concrete-air interface at the top. Defects in theshaft will also cause the waves to reflect. The waves will continue to reflect back and forthbetween the reflection points until full attenuation has occurred. The depth of the reflectoris determined by the following equation:
bwhere, z is the depth to the reflector (either a defect or the toe of the shaft), V is thelongitudinal wave velocity in concrete, andDt is the travel time of the reflected wave. Sincethe velocity of the compression wave varies with concrete quality, it is preferable to
bdetermine V based on concrete samples that are representative of the in-situ concrete in thedrilled shaft. As a less accurate method it is reasonable to use the values indicated in Table2-6, though these values differ from source to source. Therefore, the values indicated arebased on ultrasonic pulse velocity measurements represented by an infinite concrete mediumas reported by Hearneet al., al. (1981). These values are reduced 5%, assuming a Poisson’sratio of 0.2 for concrete since Hearne’s experiments were based on an infinite concretemedium.
Table 2-6. Compression Wave Velocity in ConcreteCompression wave velocity, feet per
second (meters per second)General concrete quality
Above 14,200 (4,300) Excellent11,400 – 14,200 (3,500 – 4,300) Good9,500 – 11,400 (2,900 – 3,500) Questionable6,700 – 9,500 (2,000 – 2,900) Poor
Below 6,700 (2,000) Very Poor
According to a report published by the FHWA (Baker et al., 1993), concrete with accompressive strength of approximately 4,300 to 5,100 psi (30 to 35 MPa) has a V between
12,500 and 13,100 ft/s (Finno & Prommer, 1994).
26
In order to interpret a SET, both the concrete quality and the shaft length must be known orassumed. Given these parameters, it is easy to determine if a reflection in the signal is eitherthe toe or an anomaly present in the shaft (1994).
Exponential amplification is used to progressively increase the amplitude of the reflectedsignal in a similar manner to its attenuation. This amplification process is required becausethe impact at the top of the shaft produces small strains relative to those required to mobilizethe shaft capacity. However, it is important to verify that the reflection is being amplifiedand not just background noise (1994).
There is a limiting length / diameter (L/D) ratio beyond which all wave energy is dissipatedand no toe response can be detected (Baker et al., 1993) The limiting L/D ratio variesdepending on the damping and signal loss into adjacent soils. In soft soil deposits, such assilts, good results can be obtained for L/D ratios of 50:1 (Davis and Robertson, 1976). Forstiff clays, this ratio is reduced to 30:1 (Hearne et al., 1981). In cases where the L/D ratio isexceeded, the only useful information that can be obtained from a SET test is the presenceor absence of anomalies in the upper portion of the shaft (Finno & Prommer, 1994).
As with the CSL test, several variations of the SET have been developed in which a receiveris embedded along the shaft or at the shaft toe. The additional points allow directmeasurement of the compression wave arrival time and permit more accurate velocitycalculations. This method also allows for shafts that exceed the L/D ratio to be tested witha higher level of confidence. However, this method drastically increases the cost of the SETsince care must be given to the installation of the embedded receivers and the receivers arenot able to be retrieved and used again; they become a permanent part of the shaft (1994).
The SET is only useful for determining the linear continuity of a shaft. Its limitations includebut are not limited to (1994):
(1) SET provides no quantifiable information about the shafts cross-sectional area orbehavior of the shaft under load.
(2) Unless the test utilizes embedded receivers, only the uppermost defect can be readilydetected. Any defects occurring below the initial defect may not receive adequatesignal to return a reflection that will not be masked out by noise.
(3) The hammer impact generates Rayleigh waves which propagate along the shaftsurface and cause a noisy environment. This problem is especially troublesome in thetop 10 feet of a shaft.
(4) Defects located near the toe of the shaft can be difficult to identify since reflectionsfrom anomalies close to the toe may easily be misinterpreted as the toe and not ananomaly.

27
(5) Since a reduction in concrete shaft cross-sectional area, or necking, and poor concretequality both produce reductions in impedance, it is not possible to distinguish them.In addition, a gradual decrease in cross-sectional area may not generate a reflectionat all.
(6) A layer of stiff soil may cause reflections, increasing the uncertainty of the shaftintegrity.
(7) An increase in cross-sectional area will actually increase the shaft capacity and isgenerally not viewed as a problem. However, the reflection from the bulb will besimilar to that of a defective shaft.
(8) Utilizing higher frequency waves would improve the accuracy of the test. Howeverthe wavelength used for the SET cannot decrease much less that the diameter of theshaft. If shorter wavelengths are used, the shaft will behave as an elastic mediumwhere compression waves will occur from all shaft boundaries and not behave likea rod-type structure.
(9) In stiff soils, wave attenuation can be a problem. The more similarity between the toebearing material and the concrete, the lower the amplitude toe reflection. Therefore,shafts with end bearing in rock have very poor toe reflections.
It has been summarized in Finno & Prommer (1994), that “the method (SET) is best suitedfor checking precast and permanently cased piles due to the straight-sided shafts thesestructures provide. It is not as suitable for drilled shafts due to variations in cross-section thatoften exist causing multiple reflections.”
Several case studies of SET discussed in Finno & Prommer (1994) are summarized below assupporting documentation to the information contained herein:
(1) SET tests were performed on 1.6 feet (0.5 m) diameter auger cast friction piles withlengths ranging from 20 to 59 feet (6 to 18m) and founded in stiff and very stiff claylayers. As expected, the piles with a L/D ratio of 32:1 and 36:1 did not produce a toereflection. Since the length of the piles were known, allowing for the determinationof the compression wave velocity, it was also possible to determine that one pile hadpoor or questionable concrete quality. Specifically, the compression wave velocity in
c cthis pile was V = 11,200 ft/s (3,400 m/s). The remaining piles had V ranging from11,500 to 13,100 ft/s.
(2) As part of a FHWA test program for evaluating drilled shafts for bridge foundations,a test section was constructed at Texas A & M University with nine shafts. Theseshafts varied in length from 34 to 79 feet with 3 feet of stick-up above the groundlevel. All of the shafts were constructed with a 36 inch diameter (L/D ratio from 11:1to 26:1). The integrity tests performed on the piles included the Impulse Response,Sonic Logging, and Sonic Echo. In this study, several shafts were constructed with

28
both planned and unplanned defects. In conclusion of this test, SET was able todetermine some areas where defects occurred. However, the results also showed thelimits of the SET and in one case, “…one could have been deceived into thinking thatthe reflection at 31 feet (9.4m) was the toe, if it was unknown that the shaft was 79feet (24.1 m) long.”
Clearly the SET method of integrity testing can return some questionable results that maylead an engineer to falsely accept or deny the integrity of a test.
2.6.4 Impulse Response Test
Another method that is based on the measurement of compression wave reflections is theImpulse Response Test (IRT). This test is an extension of the vibration test, which was foundto provide more information than the SET, particularly with the irregular profiles of drilledshafts. In the IRT the head of the shaft is impacted with a hammer that induces transientvibrations with frequencies as high as 2 kHz. The response of the shaft to these vibrationsis measured in the time domain, and the signal is digitally converted to the frequency domainfor analysis (1994).
The equipment set up for IRT is similar to SET except the impact hammer has a load cell thatmeasures the impact force with time. A vertical geophone is triggered upon hammer impactand records the vibrations at the shaft head. Both the hammer and the geophone areconnected to a portable PC which is used for acquiring, analyzing and storing the data.
The testing procedure for IRT is identical to the SET. However, it is critical that the hammerstrike the shaft head squarely to ensure proper force measurement.
Unlike SET, IRT provides a determination of the homogeneity of concrete in the shaft andmeasure of the shafts performance (Higgs and Robertson, 1979). IRT provides a stiffnessvalue of the shaft which has a direct correlation to shaft performance. In addition, the shaftslength may be determined from the IRT (Finno & Prommer, 1994).
Analysis of the results obtained from an IRT includes performing Fast Fourier Transform(FFT) on the force and velocity signals to convert them from the time to frequency domain.Next, a plot of mobility versus frequency is obtained by dividing the velocity spectrum by theforce spectrum. The length of the shaft is calculated by measuring the frequency changebetween resonant peaks (1994).
IRT data when presented on a mobility plot can be subdivided into two distinct regions. First,at low frequencies there is a lack of significant inertial effects and the response of the systemis linear, like a spring. However, at higher frequencies the system goes into resonance. Thefrequencies associated with this resonance depend on the length of the shaft, and their relativeamplitude depends on the damping characteristics of the soil (Baker et al., 1993). If theresults of an IRT test indicate a smaller shaft length than expected, this is interpreted as ananomaly. Then, information from the linear portion of the mobility curve (Figure 2-3) is used

29
Figure 2-3. Typical Mobility Plot for IRT (after Baker, 1993)
to obtain the dynamic stiffness of the shaft. This aids in the determination of whether themeasured anomaly is a neck or a bulge. The following equation illustrates this calculation:
m o o mwhere, E’ is the Dynamic Stiffness, f is the frequency, and the ratio (V /F ) is known as theMobility.
The low-strain dynamic stiffness (K’) can be calculated and correlated to the static stiffness.At low frequencies, the lack of internal effects causes the shaft/soil system to behave as aspring. This behavior appears as a linear increase in amplitude of mobility from zero to theonset of resonance (Baker et al., 1993). The commonly accepted dynamic stiffness value (K)provides a good indication of the low-strain, soil-foundation interaction. For a rigid base ahigh stiffness value will be calculated; for a compressible base a low stiffness value will becalculated. By comparing stiffness values for similar sized shafts, it can be determined whichones should be considered questionable. Shafts founded in loose soil and shafts that have soilinclusions, necks, and breaks will have lower stiffness values than sound shafts founded insolid soils (Finno & Prommer, 1994).
min maxAn evaluation of the shaft performance is made by calculating the K and K or thetheoretical limiting values for dynamic stiffness and comparing them with the actual stiffnessvalue. In addition, the IRT provides a calculation of the theoretical mass of the shaft whichcan be cross-checked against the amount of concrete used in the shaft (1994).

30
It is easier to determine if a bulb or a neck has occurred with IRT than with SET. Stiffnessvalues are lower than normal for necked shafts and higher than normal for shafts with bulbs.In all, this method proves to be better for testing the integrity of drilled shafts than SET withsome of the same limitations, such as:
(1) This is a surface reflection method that relies on measuring reflected responses.
(2) There is a limiting L/D ratio based on the soil conditions. As this L/D ratio isapproached, the curve will flatten out to where resonant peaks are not discernable.
(3) This method is subject to the problems associated with surface waves.
(4) There is a limit on the size of defects that can be detected.
(5) Only the top defect in a shaft can be detected, if multiple defects exist.
(6) In order to interpret the results from a test, either the concrete compression wavevelocity or the shaft length must be known.
2.6.5 Gamma-Gamma Testing
Gamma-Gamma Testing (GGT) is an integrity testing method that is widely used andaccepted by Caltrans. In GGT testing, a source of ionizing radiation is lowered down anaccess tube similar to CSL. The probe that emits the radiation also contains a gamma-raydetector. The basic theory behind GGT is that the number of gamma-ray photons per unit oftime that are reflected from the nuclei of the modules of the material surrounding the tube andreturn at a given energy level to the detector is related to the density of the materialsurrounding the tube. In short, GGT can detect significant reductions in localized density ofthe shaft concrete which would be indicative of a void or imperfection in the shaft (O’Neill& Reese, 1999). GGT has an advantage over CSL in that it can detect reductions in concretedensity outside of the reinforcement cage.
The access tubes for GGT must be made of a material such as PCV that will allow thephotons to pass through and reflect back through the wall of the tube. In general GGT willnot detect changes in density of the concrete outside of about a 4 inch (100 mm) radius fromthe access tube. In order to accurately determine the density of the entire shaft, access tubeswould need to be placed at 8 inches (200 mm) on center. Since this is not possible, anengineer must be content with having intermittent sampling of the concrete density aroundthe perimeter of the cage (1999). Caltrans recommends that one access tube be used per footof pile diameter (Lew et al., 2002). This leaves a tube spacing of about 2.75 feet around thecircumference of the cage.
It is further recommended that the access tubes be placed at least 3 inches (76 mm) awayfrom any vertical reinforcement. Since the vertical steel reinforcement is about 3 times moredense than concrete, having the reinforcement too close to the access tubes or varying the
31
distance between the tubes and the reinforcement will cause false readings in the bulk densityreadings. Furthermore, if the access tubes around the perimeter of the cage are not placed sothat they have the same influence from the reinforcement, different tubes within the shaftcannot be compared (Speer, 1997).
Due to the length of the gamma-gamma probe, vertical alignment of the access tubes mustbe maintained so that a 2 foot (0.6 m) long by 1.9 inch (48 mm) diameter rigid cylinder canpass from the top to bottom of the tube (1997). Since radiation sources are subject to theNuclear Regulatory Commission (NRC), regulations that require special training andlicensing is required for the handling and transporting of the device. Abandoning a lodgeddevice and grouting it in place is not an option. During one well documented GGT, the iontransmitting probe was wedged in the inspection tube. It took two weeks to remove the probeusing special drilling and finishing tools (Lew et al., 2002). Caltrans specifications requireaccess tubes that do not allow the probe to pass be drilled out to within tolerances for theprobe to pass (Speer, 1997). In addition, the process can be time consuming compared toother testing methods. A typical 7 foot (2.1 m) diameter shaft with seven inspections tubes60 feet (18 m) long will take eight hours to test.
The standard GGT has a 1.87 inch (47 mm) diameter gamma-gamma probe with a 10millicurie Cs 137 source. The probe is lowered down the access tube with a cable. Theprobes are configured for the determination of density by backscatter. This method allowsfor the use of a less powerful radioactive source. Radiation is emitted from the source at thebottom of the probe. The radiation is simultaneously absorbed and scattered by the concreteand reinforcement surrounding the inspection tube. The receiver at the top of the tube countsthe reflected gamma rays over a time interval. More gamma rays are counted in less densematerial than in dense material (1997).
GGT data is processed by first plotting the bulk densities versus time. Next, this data iscompared to all of the data for shafts in the same vicinity, using the same probe. The datasets are reviewed and data that is insignificant and redundant is discarded. The mean, meanminus two standard deviations, and the mean minus three standard deviations are plotted onthe same graph. Figure 2-4 show the results of GGT that clearly shows the presence of anecking defect.
Interpretation of the test results rely equally on experience, engineering judgment, andstatistical analysis (1997). In any shaft, there is normally some variation in the density ofnormal concrete from different points in the shaft. In general, anomalies can be interpretedif the bulk density of the concrete appears to drop below the mean minus three standarddeviations line (O’Neill & Reese, 1999). As with most, if not all of the integrity testingmethods, it is difficult, if not impossible, to determine the exact nature and full extent ofpotential anomalies without extracting the shaft.

32
Figure 2-4. Results of a Gamma Gamma Test Indicates Necked Shaft
2.6.6 Concreteoscopy
Concreteoscopy is a relatively new testing method that allows the integrity of the shaft to bechecked in real time. In this testing method, ½ inch diameter (12.7 mm) clear plastic tubesare attached to the rebar cage. As the concrete is placed, a miniature television camera ona fiber-optic cable is used to view the concrete from within the tubes. This test is similar tothe GGT except that the results provide visual conformation as to the soundness of theconcrete instead of relying on density monitoring. As with GGT, Concreteoscopy, is able toview only the material directly adjacent to the access tubes (1999).
2.6.7 Parallel Seismic Integrity Testing
Parallel Seismic Integrity Testing (PSIT) was developed in France in the 1970’s to evaluatethe conditions of piles and drilled shafts under existing structures (Davis and Hertlein, 1993).The general procedure for the (PSIT) is that after the shaft construction is complete, aborehole is drilled adjacent to and slightly deeper than the shaft. Stress wave energy isgenerated on the surface of the structure by impacting it with a hammer and the arrival timeof the compression wave is monitored in the bore hole by means of a hydrophone. The testsare typically completed in increments of approximately 20 inches (50 cm) (Stain, 1987). Aprofile of signals is built up for the entire length of the shaft. Under good conditions,transmission distances up to 130 feet (40 m) are possible (Davis and Hertlein, 1993).
As in the CSL test, the access tubes are filled with water. As discussed in earlier testingmethods, the stress waves generated on the surface due to the impact have a velocity that isdirectly proportional to the density of the medium in which they are propagating. Therefore,the arrival times of the stress waves are proportional to the depth of the hydrophone. A
33
difference in the rate of the arrival time velocity with respect to depth indicates a change inthe medium or the base of the shaft (Finno & Prommer, 1994).
The test equipment required for a PSIT includes an impulse hammer, a hydrophone receiver,and a data acquisition system that allows high speed sampling of the hydrophone. In a typicalarrangement, the data acquisition system is triggered when the impulse hammer strikes thepile or the shaft. The hydrophone then records the arrival of the generated stress waves. Thehydrophone receiver must be capable of withstanding the hydrostatic pressure generatedwithin the access tubes or boeholes, which can be in excess of 43 psi. The data is collectedby the acquisition system, which typically consist of a data acquisition card in a portablecomputer, and may be analyzed on site.
The borehole should be made in the ground adjacent to the foundation and slightly deeper.To assure the correctness of the test, the boreholes must be parallel to and within 3 feet of theshaft wall. If the distance between the shaft and the borehole is not relatively constant,variations in arrival time will occur leading to false readings. In addition, if the borehole isgreater than three feet from the shaft wall, the signal will be affected due to attenuation andthe non-homogeneity of the different soil layers. Since compression waves are able to travelthrough fluids, water is added to the borehole to act as a coupling medium for the hydrophonereceiver (1994).
This method of testing can also be accomplished by coring a hole in the suspect structure,filling with water, and performing the test as outlined above. This test method is referred toas the downhole seismic method. The arrival of the compression wave is critically refractedalong the core hole wall at the propagation wave velocity of concrete (Davis and Hertlein,1993).
The test results and integrity are dependent on the ability to measure the direct arrival timeof stress waves. An anomaly in a drilled shaft will appear as an increase in the arrival timeof the wave at the depth in which the anomaly occurs. A test result for a continuous shaftwithout defects should contain a linear increase in arrival time with depth. The toe of theshaft will also cause an increase in the wave arrival time, giving a clear indication of thelocation of the shaft toe.
The downhole seismic test records a second wave in addition to the compression wave. Thissecond wave is known as the tube, hydo, or Stonely wave. The tube wave velocity is afunction of tube diameter, roughness, and the permeability of the material surrounding thehole. The velocity of the tube wave is approximately 5,000 ft/s (1,500 m/s) in cored concreteand, its amplitude is much greater than that of the concrete compression wave (1993).
Tube waves are reflected from the ends of the core hole. They are refracted at locationswhere the bulk elastic modulus of concrete and the diameter of the core hole change. Theshape and the spectral content of the tube waves have a higher frequency and a shorterduration than the first direct waves. Vertical receivers are generally used for recording tubewaves (Galperin, 1985). Little has been studied about obtaining information from the tube
34
wave, which theoretically should be able to yield information on the concrete quality (Finno& Prommer, 1994).
All that can be determined from reviewing the results from either a parallel seismic ordownhole test is that arrival time of the compression wave or tube wave has increased as aresult of lower wave propagation velocity. These changes can be caused by several factorsincluding changes in concrete quality, cracks, soil inclusions, and the toe of the shaft.Therefore, it is difficult to determine the type of defect, if any exists, that has caused thechange in the slope of the arrival time line. This may lead to inconclusive results. Anothermajor disadvantage of the tests is the cost of coring and installing the access hole (1994).
In review of a case study as reported by Finno & Prommer (1994), two test piles wereconstructed at a research site in France by the CEBTP (Centre Expérimental �Études duBâtiment et des Traveux Publics). They were both 46 feet (14 m) long and 26 inches (65 cm)in diameter. One was continuous and the other had a break at 24.6 feet (7.5 m). Access tubeswere installed adjacent to the shafts to a depth of 66 feet (20 m) to facilitate parallel seismictesting. The sound shaft had a signal transmission time that increased linearly with depthdown to the toe, proving continuity over the full length. The broken pile was linear down to24.6 feet (7.5 m), but the arrival time increased significantly below this point. For this shaft,it was known that the pile extended to 46 feet and had a break at 24.6 feet, but the test wasunable to differentiate weather the break was in fact a defect or whether it was the pile toe.
2.6.8 Thermal Integrity Testing
Recently, a new method for evaluating the integrity of drilled shafts has been developed thatuses the natural temperature rise of curing concrete. This concept involves preciselymeasuring the temperature within the shaft due to the heat of hydration generated within thefirst 48 hours. Subsequent signal matching with a computer model is used to discern thelocation and size of inclusions that produce no heat. Aside from the merits of thoroughintegrity evaluation, this method provides integrity feedback while the concrete is still“green” allowing easy coring, flushing, and grouting of affected areas.
In the late 1980's, University of South Florida researchers idealized a method of evaluatingthe integrity of drilled shafts on the basis of the measured soil temperature around the curingconcrete foundation elements. At that time, it was conceived that the then-evolving quasi-static cone penetrometer could be equipped with thermocouples capable of registering subtlevariations in soil temperature caused by the generation of heat from cement hydrationreactions. These variations in temperature would be indicative of a compromised shaftstructure. In concept, a homogeneous concrete cylinder would produce a uniformtemperature profile with depth (with some variations attributed to soil stratigraphy).However, as many drilled shafts were cast in soils that were not amenable to cone penetrationtesting (e.g. rock or gravelly soils), the applications for this approach were severely limited.

35
The general use of access tubes in drilled shaft reinforcement cages refocused the thermalintegrity concept to consider capturing and modeling temperature data from the pile interior.Recent developments in the remote monitoring of industrial processes, using windowed orfocused infrared systems, has allowed the workers at USF to design a preliminary system forrecording continuous thermal traces on the interior walls of access tubes. The infraredtransducers used are robust and can register surface temperature using reflected wavetechnology.
The first probe capable of making these measurements was outfitted with a single infraredthermocouple that was inserted into a logging tube four times to ascertain the temperaturevariation in both the radial and circumferential directions. Subsequently, this device wasoutfitted with four orthogonally-oriented infrared sensors that would simultaneously registerthe wall temperature in four directions. Due to space considerations, each sensor wasseparated vertically by 3 inches. This improvement (of four sensors) led to more intelligibledata, as the introduction of the probe into the access tube disrupts the wall temperature (byinducing cooling), and thus reducing the temperature for the subsequent three soundings.
Although the temperature-voltage response is not linear, a roughly linear response can befound in a useful range of temperatures, if the thermocouple junctions are selected properly.As these recently developed transducers are sensitive (with high repeatability and very smalltime constant) signal conditioning and careful calibration of each transducer is important.
The transducer is based on thermocouple technology (junctions of dissimilar metalconductors) using radiative thermal energy focused on a thermocouple. Each infraredtransducer generates a voltage signal output, on the order of 5-10mV over the range oftemperatures in outdoor conditions and hydrating concrete. The slope of the response curvein the useful range of temperatures is roughly 0.3 mV per degree Celsius. Maintaining theintegrity of the signal from the sonde (probe) to the data recording device (e.g., laptopcomputer adjacent to the pile test) through lengthy copper cable requires high gainamplification of the differential signal, and conversion to a current signal. Therefore a highinput impedance amplifier stage with gain and a voltage-to-current amplifier stage (4-20mA“current loop” AD697 chip) is included in the sonde. Also included in the updated design isa digitizing vertical displacement counter/encoder, similar to that used in computer “mice”,for registering the depth of the sonde within the shaft.
The data output of the sonde consists of the depth within the access tube of the encoder, andfour current signals from each of the infrared sensors. The four current signals are convertedto voltage signals directly by simply reading a voltage drop across a resistor placed in eachsensor circuit near the recording equipment. These voltages, as well as the encoder signal,are read directly into a laptop through a National Instruments DAQ700, 12-bit multi-channeldata acquisition card. As the depth encoder/counter represents one value of depth within theshaft, a depth “shift” is added for each sensor, which represents the vertical separation of eachtemperature sensor and the observed depth. Also, the voltage readings are applied to an apriori linear calibration model of each sensor. After the voltage-temperature conversions and

36
depth corrections are made, individual temperature readings from each channel will consistof an ordered pair of depth and temperature. Figure 2-5 shows the general setup of the testingequipment.
Temperature anomalies that can be expected in a drilled shaft may derive from variousphenomena, and are listed in Table 2-7. In general, three overall categories exist based uponthe anomaly type (heat source changes , boundary condition changes, and the scalar productgrad T • grad diffusivity). All three categories of thermal signal anomalies are observed inthe Auburn field data (see Chapter 6).
Table 2-7. List of thermal anomaly types and descriptions.
Phenomena Anomaly Type Anomaly Source
GWT boundary condition higher specific heat of water
aggregate heat source (none) lack of heat production
rebar diffusivity gradient very high conductivity
shaft toe boundary condition vertical flow condition
lift heat source mix age or mix proportions
soil slump heat source boundary condition
lack of heat production change of heat flow geometry

37
Figure 2-5. Thermal Integrity Test Equipment Setup
38
2.7 Prior Research into Drilled Shaft Anomalies
As it happens, there is not an abundance of available information on drilled shaft foundationsthat have had severe anomalies or other unacceptable quality. This is perhaps due to thereluctance of drilled shaft contractors and engineers to publish information which highlightshow their particular project failed. However, when looking at the issue with a broadenedperspective, some information is available. Several items of interest that were studied in thisreport have been addressed in some way in the past. These include borehole stabilization,behavior of fresh concrete, and lateral pressure distribution of fresh, cast-in-place concrete.
2.7.1 Borehole Stability and Stabilization
When drilled shafts are to be installed in cohesive soils, a major factor affecting the stabilityof the borehole is the moisture content of the soil and the location of the ground water table.Past research has proposed that when a borehole is drilled into this type of material, excesspore water suction forces will dissipate very slowly (Carter, 1986). This will allow the voidratio of the soil around the hole to increase, and as a result swelling will occur. If thisswelling is allowed to proceed unabated, collapse of the borehole is probable.
The problem of maintaining a stable borehole is not limited to cohesive soils, however, as canbe seen in case histories published, mainly, in the oil drilling industry (Maury, 1987).Unexpected conditions encountered while drilling in rock and sand often result in partial ortotal loss of a borehole, and the related financial loss. Research into various drill slurriesaimed at improving the stability of boreholes in questionable material has been ongoing foryears (Gray, 1974). Concerted efforts at instrumenting boreholes so as to better understandthe three dimensional displacement of strata have been undertaken as well (Smart, 1978).Data collected from such research has led to the development of many calibrated numericalmodels that allow at least a qualitative prediction of a site’s response to drilling (Bandis,1986).
2.7.2 Behavior of Fresh Concrete and Lateral Pressure Distribution
In order to remain within the scope of this report, past research into the behavior of freshlyplaced concrete in a drilled shaft borehole was explored. In particular, tremie placement andfree fall techniques were studied both above and below the water table. It has been arguedthe method of drilling plays an important role in the strength and quality of the finisheddrilled shaft (Chadeisson, 1971). This is due mainly to issues already discussed above.However, the rate of placement of concrete in a drilled shaft is a parameter which some saymerits more investigation (Bernal, 1983). In this report, rate of concrete placement as wellas rate of casing extraction is addressed. Also, Bernal suggested that the extraction of thetremie from the newly placed shaft results in an unpredictable increase in the lateral pressureexerted by the concrete (1983). Data presented later in this report will suggest that theopposite it true, at least for laboratory scale tests.

39
Rodin’s experimental work (1952) on the lateral pressure of concrete on formwork shows thatthe lateral stress distribution in a freshly poured concrete column is hydrostatic up to somecritical depth. The actual value of this depth depends in large part on the geometry of theshaft; in particular the length to diameter ratio. Beyond this critical value, there is a reductionin lateral pressure due mostly to arching of the concrete. This phenomenon was notreproducible in the lab scale testing (discussed later, Chapter 3).

40
THIS PAGE IS INTENTIONALLY BLANK

41
3. LATERAL PRESSURE CELL TESTING
3.1 Concept and Development
Early research into the causes of voids, necks, and bulges in finished shafts promptedresearchers at USF to explore the kinematics of flowing concrete inside a boreholecontaining reinforcing steel. It was desired to at least qualitatively study the rheology ofconcrete flow as it emerged from the bottom of the tremie and rose inside the borehole. TheLateral Pressure Cell (LPC) was developed to meet this research need.
Initially the LPC concept was to measure the lateral stress distribution as a function of depthin a borehole and to compare this to design and construction parameters such as aggregatesize and gradation, cement type, water/cementitious materials ratio, reinforcement size andplacement, and borehole stabilization method. To accomplish this, a lab-scale cell wasconstructed out of Lucite (Figure 3-1) and instrumented using resistive strain gages (Figure3-2) aligned to measure hoop strains in the cell as it was filled with fluid (water, slurry, orconcrete).
The LPC was additionally outfitted with 6-psi pressure transducers flush mounted to theinside of the Lucite walls (Figure 3-3). A JP-2000 load cell was mounted to the base of thedevice (Figure 3-4). This allowed calibrations to be performed as needed by simply fillingthe device with a known volume water and measuring the weight. The pressure transducersproved to be more stable and precise than the strain gages. Accordingly, the data analysiswas far simpler.
A recommended modification to the LPC, should a future generation be constructed, wouldbe to place additional pressure transducers at each level on opposing sides of the cell. Thiscould be done at half-points or quarter-points on the circumference. These added sensorswould allow more complete lateral pressure data measurement, and could be used to quantifystress localizations and mortar arching. This additional data may even be used to record(roughly) the shape of the mortar column as it flows into the cell, although to do this wouldrequire much more testing and calibration.
3.2 LPC Test Program Overview
The first testing performed in the LPC was designed to study the effect of concrete slumpon lateral pressure of the finished shaft. A series of mortar mixes were designed, eachhaving the same cement content but different w/c ratios. Early selection of the w/c ratiorequired to obtain a desired slump was largely a trial and error process, but after a significantnumber of test mixes had been measured, it was found that varying the w/c ratio between0.46 and 0.5 produced a range of slumps that could be poured through the laboratory tremie.This was adopted as the standard range acceptable for use in the lab study, with very fewmixes deviating from this range at either the upper or lower bound.
42
This first series of tests in the LPC did not include a model rebar cage and was constructedin dry conditions. The only parameter being investigated in these trials was slump. Thehypothesis was that a stiffer material will not flow radially as fully as a looser material, andtherefore the pressure exerted by the shaft on the wall of the borehole would be lower forstiffer mixes.
The second series of tests in the LPC was designed to compare the difference in sidewallpressures when rebar cages having various bar spacings were used. The hypothesis was thattighter steel spacing would impede the flow of concrete and cause the material to segregate.This segregation would leave a thicker, more dense material on the inside of the cage whilethe material in contact with the wall of the borehole would be thinner and less dense. Theresult would be a lower axial capacity for shafts having tighter steel spacing than those withspacings nearer the upper range allowable by current design specifications.
Within this series of tests, the effects of drill fluid head in the borehole on the flow ofconcrete out of the tremie was investigated. The hypothesis was that increased pressure headin the borehole, caused by the use of any type of soil stabilizing fluid, would impede the flowof concrete exiting the tremie. This too could lead to segregation of the mix and result in areduction in axial strength.
Allowable slurries have unit weights of 64-73 pcf for freshwater and 66-75 pcf for saltwater(Crapps, 1992). Since freshwater having a density of 62.4 pcf is slightly less dense than theminimum allowable during construction, proving this hypothesis using freshwater in theborehole would also prove it for any fluid having a higher unit weight. Therefore, a seriesof test shafts were poured in the LPC where the slump and rebar spacing were kept constantfor each pair of shafts. Additionally, each shaft was constructed and poured under dry andwet hole conditions.
The final series of tests in the LPC were designed to compare the head differential inside andoutside of the reinforcement cage. The hypothesis was that tighter steel spacing wouldimpede the flow of concrete and cause head differentials from inside to outside of the rebarcage. This head differential has the potential of causing voids or trapping loose materials(i.e. sand) in the drilled shaft.
3.2.1 LPC Mix Designs
A total of seven trials were completed for this series of tests, and of those seven, five wereunique mix designs. The w/c ratio was adjusted for the different mixes in order to obtainthe desired range of slump values. The first mix designs used in this series were specifiedas a low to medium slump, in the range of 6 to 8 inches. Water to cement ratios of 0.47 to0.50 were used, and batch volumes of 1.0 to 1.5 ft were specified depending on how many3
additional slump tests would be performed. Speedy moisture testing was completed on thefine aggregate material prior to each mix, and proportions were adjusted accordingly. Asan example, for a w/c ratio of 0.47, a 1.0 ft batch volume using the standard 1100 lb/yd3 3
43
cement content, and fine aggregate moisture content of 1.3%, the following proportions wereused: 40.74 lbs cement, 80.85 lbs sand, and 18.09 lbs water.
A second round of testing under the same conditions was completed using higher slumpmaterial, because during the first set of tests, the lower slump material proved very difficultto pour through the 2 inch I.D. hopper valve and tremie pipe. Water cement ratios of 0.51,0.52, and 0.53 were specified for these trials.
3.2.2 LPC Casting Procedure
The LPC was flushed prior to each test with water. Data during the filling and draining ofthe cell with water was collected in order to verify acceptable performance of the base loadcell and lateral pressure transducers (Figures 3-5 and 3-6). Mixing of the mortar commencedduring the water-draining operation of the LPC verification stage, and pouring wascompleted shortly thereafter. Video footage and still photography was used to collectqualitative information on the characteristics of flow within the cell.
Just after mixing each batch, but prior to pouring, the slump was measured. It was desiredto keep all pours within the FDOT 7 inch to 9 inch slump guidelines, although somedeviation above or below these values was acceptable. Also, any batch having a slump ofabout 6 inches or below would be difficult if not impossible to pour with the 2 inch tremiein the lab. The required slump for pouring was 8 in.
3.3 LPC Test Series I - Slump vs. Lateral Pressure
The first series of tests completed in the LPC focused on the effect of slump on the lateralpressure exerted by the concrete column on the walls of a borehole. The hypothesis of LPCtest series one was that as the slump of the concrete (as placed) decreased, there would bea notable decrease in skin friction capacity of the finished shaft due to a smaller lateralpressure within the concrete column. This lower pressure during the pour would cause thefluid concrete to penetrate a smaller distance beyond the rebar cage than would be seen witha high slump mix. Ultimately, the contact between concrete and soil would be reduced andskin friction capacity would suffer.
In order to test this hypothesis the lateral pressure cell was used, but for this first series oftests no rebar cages were installed. The only variable between tests was the mini-slump(slump) of the mortar mixes. The LPC was calibrated using clean tap water prior to testingwith mortars, which for the first series included seven mixes.
Upon completing each pour, the LPC was allowed to sit undisturbed for 2 minutes so thatpressure transducer and load cell readings would stabilize. The resulting lateral pressuredistribution over the 33.25 inches of depth in the LPC was then recorded, and is plotted in

44
Figure 3-7 for several representative slumps. Notice that regardless of the slump, the lateralpressure was relatively the same. As a reference, the dashed line is the lateral pressure ofwater.
Any excess fill was recorded and used to normalize all pressures to a standard fill of 33.25inches. The measured vertical pressure distribution was also recorded for this same fluiddepth, and a plot of lateral pressure versus vertical pressure, as shown in Figure 3-8, leadsto a coefficient of lateral concrete pressure (�), which is the slope of this graph as definedin the following equation. Note that the Greek letter kappa (�) is used here in lieu of usingK, which is normally reserved for lateral pressures in soils.
Shown in Figure 3-8 is the lateral concrete pressure as a function of vertical pressure. Therelationship between the two is linear, and the slope of the line for each equals the value of� for that mix. As a reference, water pressure is also plotted and is seen to be the lowerbound of these curves (dashed line). Again, very high slump materials show a tendencytowards having lateral pressure coefficients closer to that of water, with a correspondingdecrease in vertical fluid pressure. Overall, however, the higher unit weight of the mortars(and concrete) leads to a considerably higher vertical pressure as compared to water, so evenwith a slight reduction in � the lateral pressures developed are still well above those ofwater.
3.4 LPC Test Series I Results
For the mixes studied, � varied from 0.818 to 0.982, with an average value of 0.882. Asshown in Figure 3-9, approximately 71% of the collected data falls within +/- one standarddeviation of the computed � value. This average value of 0.882 is slightly lower than thatof water, which theoretically has a “�” equal to 1.0, and was measured in the LPC to havean experimental value of 0.99.
The results of this preliminary series of tests suggest that the lateral pressure of thecompleted concrete shaft does not vary significantly with slump within the specified rangeof values (from 7 to 11 inches) (Figure 3-10). The coefficient of lateral concrete pressureremains nearly constant at 0.88 throughout the range of slumps tested. Pressures measuredat the upper and lower transducers for all tests were 1.89 psi and 1.18 psi, respectively.
As expected, the radial flow of the mortar leaving the tremie was greatly affected by theslump of the material. It was apparent during all pours that the higher slump material flowedmore easily outward and also tended to rise higher in the LPC without any necessarywithdraw of the tremie during placement.
45
3.5 LPC Test Series II - Effects of Cage on Lateral Pressure
The hypothesis of LPC test series two was that as the minimum clear spacing of rebar in thereinforcement cages was decreased, there would be a corresponding decrease in skin frictioncapacity of the finished shaft due to a reduction in lateral pressure (because of impededconcrete flow) and also because of segregation of the concrete constituents. Aggravatingthis situation is the use of a drilling fluid for borehole stabilization. The increased verticalpressure (fluid head) in the hole would further retard the flow of concrete out of the tremieand through the rebar cage. This would ultimately result in a shaft having a slightly reduceddiameter and potentially lower skin friction capacity.
For each group of tests, mortar mixes having approximately the same slump value were usedwhile steel cages having different clear spacing between bars were included in the cell.Three different steel cages were constructed from standard hardware cloth. The hardwarecloth had grid sizes of one quarter inch, one half inch, and one inch (Figure 3-11). Also,tests were either performed using an initially empty cell (dry hole) or with 29 inches of waterhead added prior to placement of the concrete (wet hole). The rate of concrete placementwas kept low in order to avoid dynamic fluid effects, and to allow an adequate number ofmeasurements to be taken during each pour.
3.6 LPC Test Series II Results
Multiple mortar pours were completed for this series of tests, and the results were added tothose of Series I testing to expand the database. The results of this second series of LPCtests suggest that the lateral pressure of the completed shaft does not vary significantly withminimum clear spacing of rebar, for materials having a slump within a range of values from7 inches to 11 inches. Apparent in Figure 3-12, all values of lateral pressure are similarregardless of the clear spacing of the rebar. The median pressures observed in Figures 3-10and 3-13 (Series I and Series II, respectively) are nearly identical. This is due to zerocompliance once the mortar made contact with the cell walls. Therefore, pressure did notvary considerably with clear spacing because the coefficient of lateral concrete pressure (�)remains nearly constant.
For the mixes studied in this test series, � varied from 0.818 to 0.982, with an average valueof 0.886. As shown in Figure 3-14, approximately 80% of the collected data falls within +/-one standard deviation of the computed � value. This increase in the certainty of � lendscredence to the conclusion that lateral pressure is not significantly affected by clear rebarspacing. For the mortar mixes used, and with the 1/4" grid spacing (the tightest cage), aclear spacing to diameter ratio (CSD) of approximately 18 is calculated as determined bythe following equation.
46
The combination graph shown in Figure 3-15 also illustrates clearly that for the range ofslumps tested, the lateral pressure developed in the shaft remains confined to a small band,with a mean value of about 2 psi. Additionally shown in this figure is the measured wet unitweight (density) of the mixes as-poured, again as a function of slump. These values appearto be even less a function of slump than do the lateral pressure values, with a mean unitweight of 130 pcf obtained very consistently for the different mixes.
3.7 LPC Test Series III - Head Differentials
The final series of tests in the lateral pressure cell were derived out of necessity. During theearlier test series, it was evident that during tremie placement of the mortar into the LPC ameasurable head differential existed between the material inside the rebar and that on theoutside. Contrary to what is expected in the field, a uniform rising column of concrete wasnot observed in any of the earlier LPC tests. It appeared that the material inside the rebarcage rose to a much higher level than that on the outside, and only after a critical headdifferential was reached did the material finally move to the outside of the cage. It wasdecided to perform a series of experiments in which common field practice during tremieplacement of a shaft was simulated, and the depth-to-concrete on the inside and outside ofthe cage during each pour was measured. This was performed using a weighted-tape system,but an obvious advantage of the lab study was that at all times the material was visible as itflowed in the LPC. Therefore, still photography and video footage was recorded for eachof these experiments. Using the measured head differentials and interpreting the videofootage, a quantitative analysis of this phenomenon was performed and is documentedherein. As with Series II, the rate of concrete placement was kept very low. This allowednear-static head differentials to be measured, and eliminated the need to consider dynamiceffects in the analysis of the data.
The variables in this test series were construction method (dry hole versus wet hole) andshear steel spacing. Three different steel cages were again used, having a grid patternidentical to those of Test Series II. Each of these cages were used once for dry holeconstruction and once for wet hole construction, for each mix tested. The goal was tomonitor the aforementioned head differential as shear steel spacing and external pressureswere varied, and also as the slump of the material was varied from stiff to loose.
3.8 LPC Test Series III Results
Test Series III provided new and useful data that strongly refuted the idea that concrete risesin a uniform manner, scouring the side walls of the borehole as its level increases. To thecontrary, it was observed that as the previously defined clear spacing ratio (CSD) decreases,and as slump decreases, the concrete level differential between inner-cage and outer-cagematerial increases. This differential is responsible for radial flow of concrete through thecage as observed in the flow characteristics illustrated in Figures 3-16 through 3-22. Thesephotographs were taken during LPC testing using the three different cage configurationspreviously discussed, and the formation of large head differentials as the clear spacing of the
47
cage decreases was apparent. Also, as can be seen in Figures 3-23 and 3-24, the headdifferential varies considerably with slump. Figures 3-25 and 3-26 show the headdifferentials that developed in the LPC using the 1/2 inch and 1/4 inch cage spacings andmixes of similar slump varying from 6 inches to 10 inches. These head differentialsdeveloped quite readily even in the absence of coarse aggregate.
In and of itself, this differential is not generally a problem. However, when one considersexactly how the material migrates from the higher levels inside the cage to the lower levelsoutside the cage, it becomes apparent that the material does not flow as anticipated. Instead,material builds up along the tremie until some critical inner-to-outer differential is reached.At this point, the material begins to slide from the higher potential to the lower potential, andas it interacts with the rebar cage rotation of the material is introduced in addition to verticaland radial translation. This rotation during translation can be describe in laymen’s terms asa “rolling” of the concrete surface as it rises in the borehole.
Obviously this rolling motion has serious implications when considering the final structuralintegrity of the shaft. Any loose debris remaining in the borehole after drilling is likely tobe left in place as the concrete rolls and folds over itself, creating potential void pockets inthe finished shaft. Also, any material that falls into the concrete from either the surface orthe sidewalls of the excavation during pouring will likely become collected and confined bythe rolling concrete surface. Once this material becomes stationary, the concrete will simplyroll over and around it, and again the potential to form significant voids is present. Oneother possible consequence of this rolling action is that it prevents the rising concrete fromscouring the sidewall of a borehole during placement. Should a filter-cake forming drillfluid be left in place long enough that the cake thickness becomes significant, the risingcolumn of concrete will not scour it clean. Therefore, the skin friction of the shaft will bemuch less that anticipated during design.
Comparing the flow characteristics observed in the LPC in a quantitative manner provedchallenging because most of the data collected was qualitative in nature (i.e. video,photographs, etc.). However, there was a way to numerically describe the flow through thecage as a function of the aggregate diameter, clear spacing, and construction method. Usingthe video records collected for each test, radial flow was determined based on the time ittook for the mortar column to rise a fixed distance. Knowing the annular volume betweenthe cage and the LPC wall, this rate of rise was converted to radial flow.
With this information, several comparisons become possible. First, shown in Figure 3-27,the radial flow rate of the mortar is given as a function of the nominal grid opening for eachof the three cages used in the LPC tests. As expected, the flow rate increased as the clearspacing increased, but appeared to approach an asymptote with increasing grid openings.
Taking the radial flow rate and dividing by the clear area penetrated yields the quantity offlux. Shown in Figure 3-28 is the relationship of both flow and flux to grid opening for thethree cages tested.
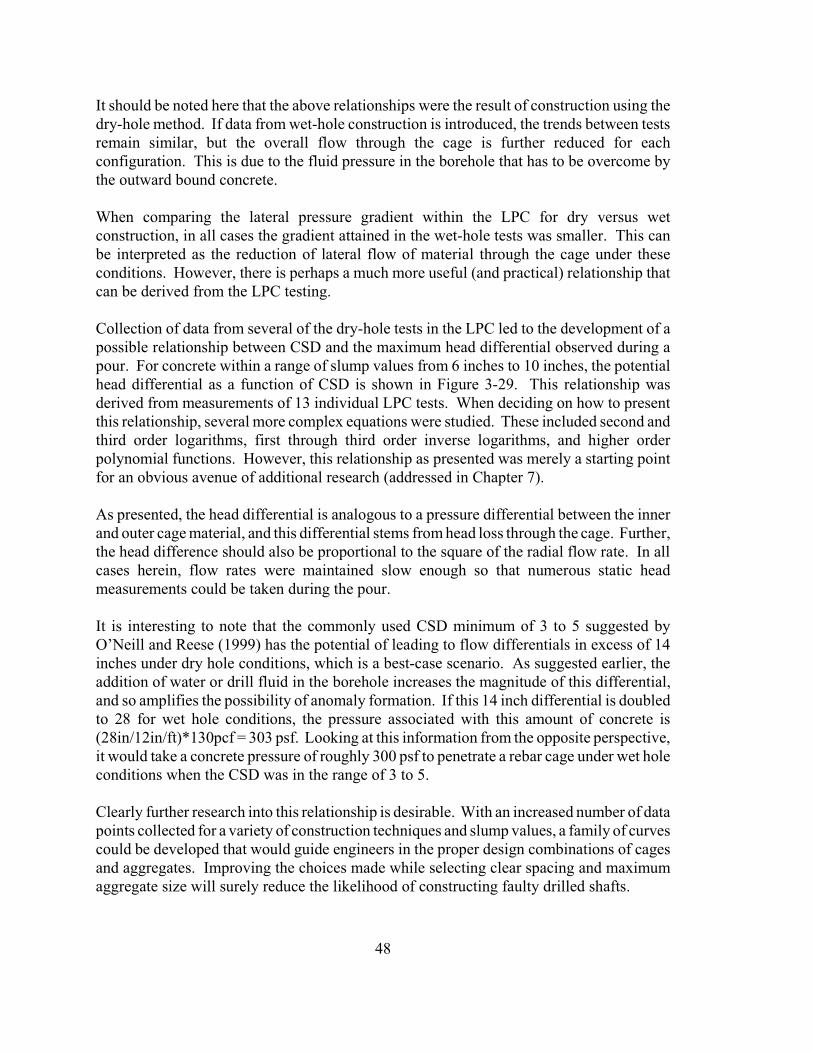
48
It should be noted here that the above relationships were the result of construction using thedry-hole method. If data from wet-hole construction is introduced, the trends between testsremain similar, but the overall flow through the cage is further reduced for eachconfiguration. This is due to the fluid pressure in the borehole that has to be overcome bythe outward bound concrete.
When comparing the lateral pressure gradient within the LPC for dry versus wetconstruction, in all cases the gradient attained in the wet-hole tests was smaller. This canbe interpreted as the reduction of lateral flow of material through the cage under theseconditions. However, there is perhaps a much more useful (and practical) relationship thatcan be derived from the LPC testing.
Collection of data from several of the dry-hole tests in the LPC led to the development of apossible relationship between CSD and the maximum head differential observed during apour. For concrete within a range of slump values from 6 inches to 10 inches, the potentialhead differential as a function of CSD is shown in Figure 3-29. This relationship wasderived from measurements of 13 individual LPC tests. When deciding on how to presentthis relationship, several more complex equations were studied. These included second andthird order logarithms, first through third order inverse logarithms, and higher orderpolynomial functions. However, this relationship as presented was merely a starting pointfor an obvious avenue of additional research (addressed in Chapter 7).
As presented, the head differential is analogous to a pressure differential between the innerand outer cage material, and this differential stems from head loss through the cage. Further,the head difference should also be proportional to the square of the radial flow rate. In allcases herein, flow rates were maintained slow enough so that numerous static headmeasurements could be taken during the pour.
It is interesting to note that the commonly used CSD minimum of 3 to 5 suggested byO’Neill and Reese (1999) has the potential of leading to flow differentials in excess of 14inches under dry hole conditions, which is a best-case scenario. As suggested earlier, theaddition of water or drill fluid in the borehole increases the magnitude of this differential,and so amplifies the possibility of anomaly formation. If this 14 inch differential is doubledto 28 for wet hole conditions, the pressure associated with this amount of concrete is(28in/12in/ft)*130pcf = 303 psf. Looking at this information from the opposite perspective,it would take a concrete pressure of roughly 300 psf to penetrate a rebar cage under wet holeconditions when the CSD was in the range of 3 to 5.
Clearly further research into this relationship is desirable. With an increased number of datapoints collected for a variety of construction techniques and slump values, a family of curvescould be developed that would guide engineers in the proper design combinations of cagesand aggregates. Improving the choices made while selecting clear spacing and maximumaggregate size will surely reduce the likelihood of constructing faulty drilled shafts.

49
3.9 Arching of Mortar During Tremie Placement
During the execution of the experiments composing the three LPC test programs, thephenomena referred to herein as “arching” of the advancing mortar surface as the columnrises in the cell was observed. This can be seen by studying the shape of the top of themortar column shown in Figure 3-30. As previously discussed, during tremie placement ahead differential between the inside and outside of the reinforcing cage is created. Materialclosest to the tremie on the inside of the cage tends to rise higher than the level measuredoutside of the cage. In addition to this differential, the material within the confines of thecage has a slight head differential which manifests itself in a arched surface at the leadingedge of the rising column.
As material leaves the tremie and moves outward, it must displace material already in placein the cell. The existing material is forced outward and also upward. At the interfacebetween the tremie pipe and the mortar, frictional forces develop and tend to cause downdrag on that part of the material. Along the inner surface of the reinforcing cage, frictionalforces develop which again cause a down drag on the mortar. Between the tremie and thecage there is nothing for the advancing mortar column to interact with and so the uppersurface tends to be at a higher elevation than the material directly adjacent to the cage andthe tremie. The resulting arched shape is interesting to study as it rises in the cell.
As stated earlier, fresh material leaving the tremie causes the mortar already in the LPC tomove radially outward and longitudinally upward at the same time. This motion is visiblein the arched section of material between the tremie and the reinforcement cage. The risingmaterial tends to “roll over” on itself as it moves up the cell. Material from the upper portionof the arch rolls downward toward the reinforcing steel as well as toward the tremie pipe.At both locations, down drag pulls this material back under the surface.
This arching must occur during the full scale construction procedure as well. Potentially thisleads to a serious problem with drilled shaft construction, particularly when slurries are usedto stabilize the borehole. Design and construction specifications are based on the assumptionthat “all of the slurry is displaced from the borehole by the rising column of fresh concrete”and that “the slurry does not weaken the bond between the concrete and the naturalgeomaterial” (O’Neill and Reese, 1999). However, the behavior observed in the LPCtesting does not support this assumption, and in fact refutes it. The concrete does not risein a uniform column flushing material out of the borehole, and more importantly scouringthe walls of the borehole as it advances. Instead, this rolling action just presented serves topress material in the borehole into the walls, potentially weakening the bond betweenconcrete and soil.
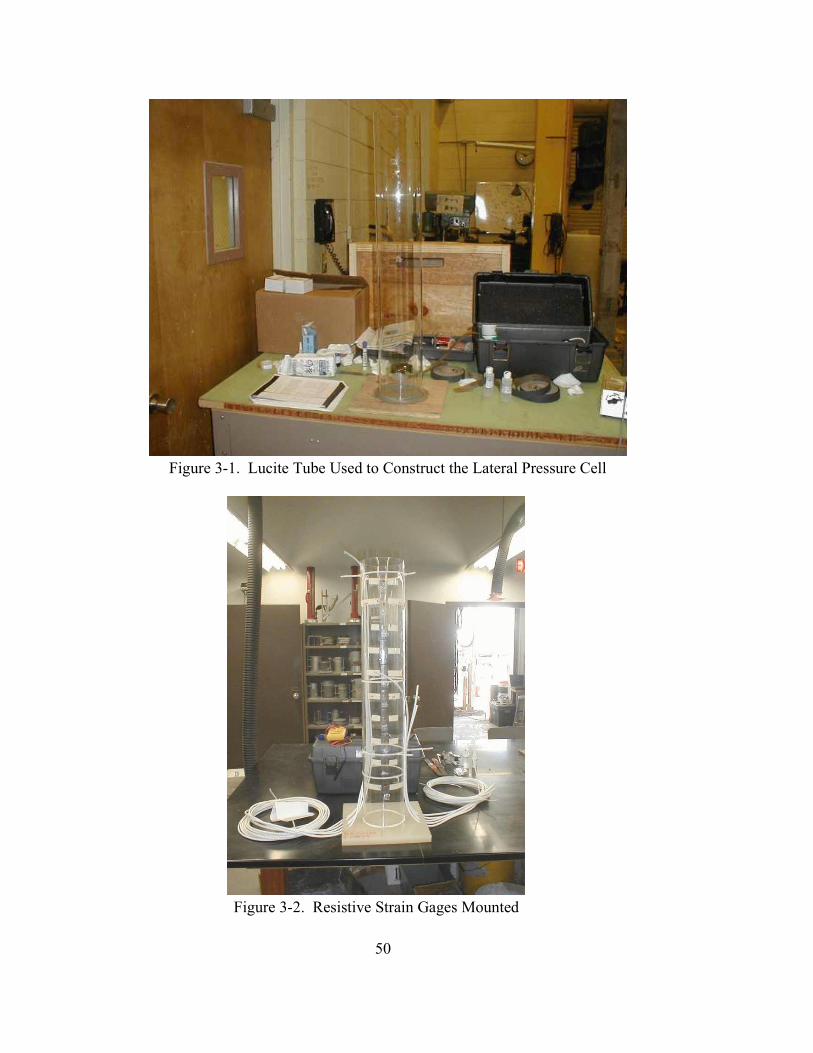
50
Figure 3-1. Lucite Tube Used to Construct the Lateral Pressure Cell
Figure 3-2. Resistive Strain Gages Mounted
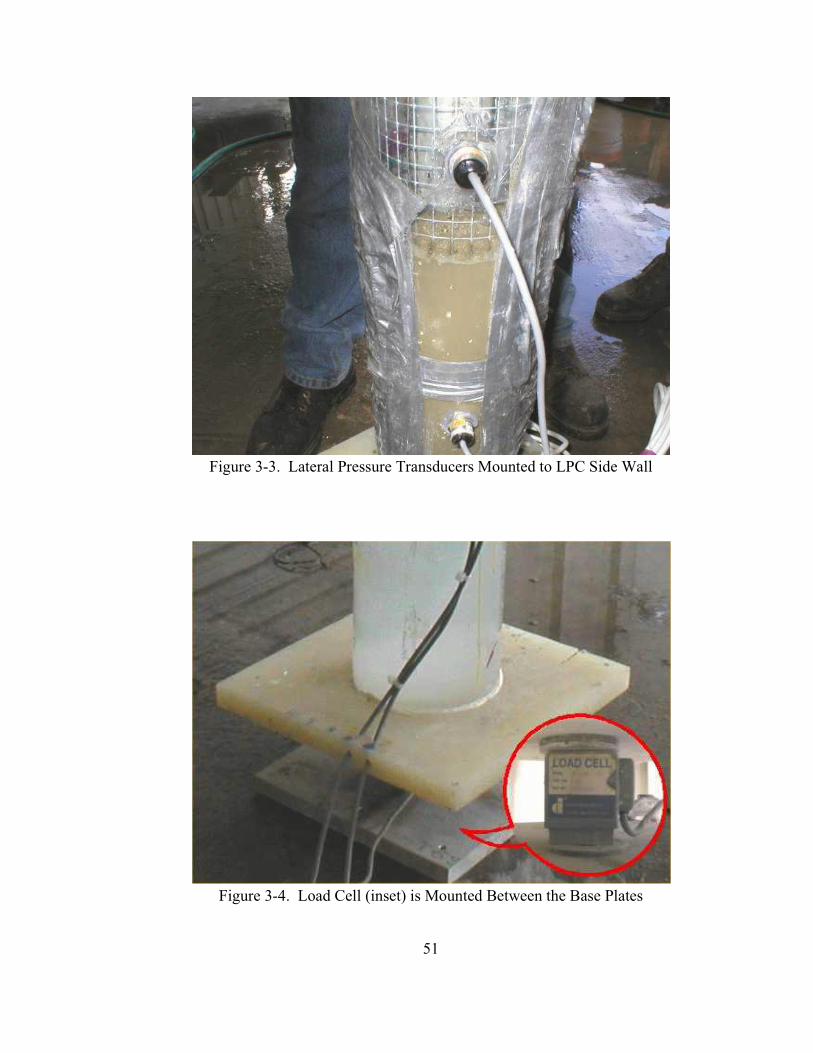
51
Figure 3-3. Lateral Pressure Transducers Mounted to LPC Side Wall
Figure 3-4. Load Cell (inset) is Mounted Between the Base Plates
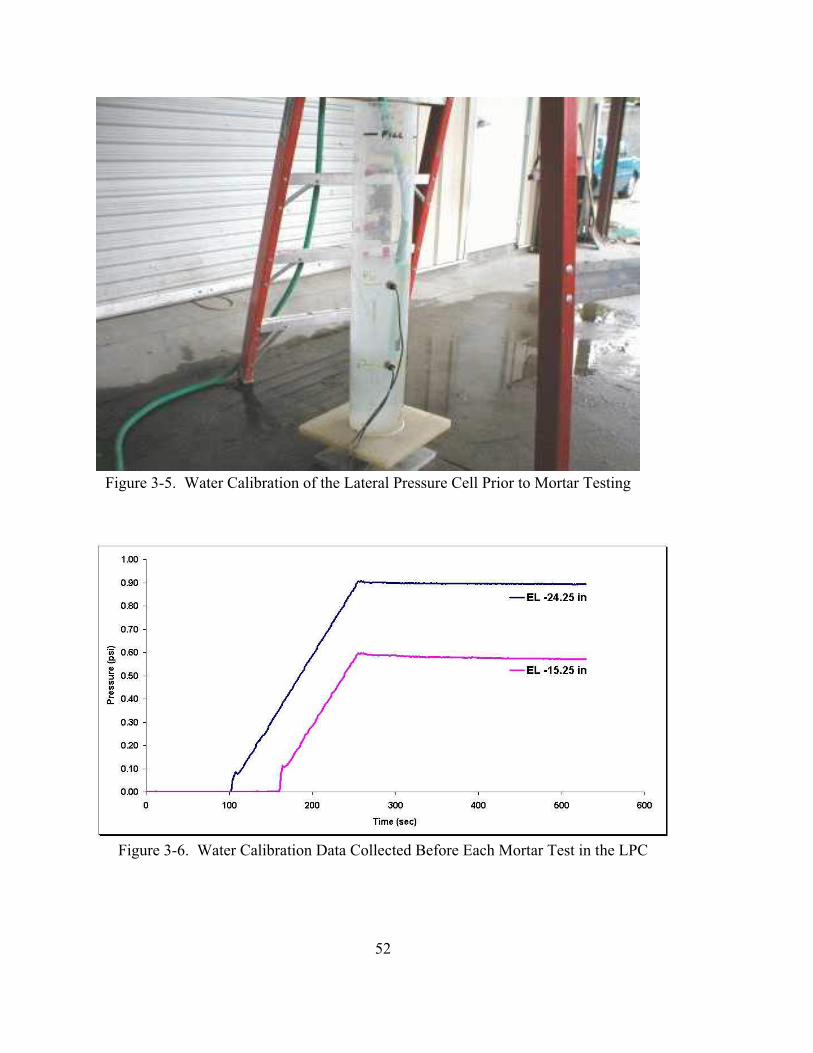
52
Figure 3-5. Water Calibration of the Lateral Pressure Cell Prior to Mortar Testing
Figure 3-6. Water Calibration Data Collected Before Each Mortar Test in the LPC

53
Figure 3-7. Lateral Pressure Developed for Various Values of Slump
Figure 3-8. Lateral Pressure as a Function of Vertical Pressure in the LPC
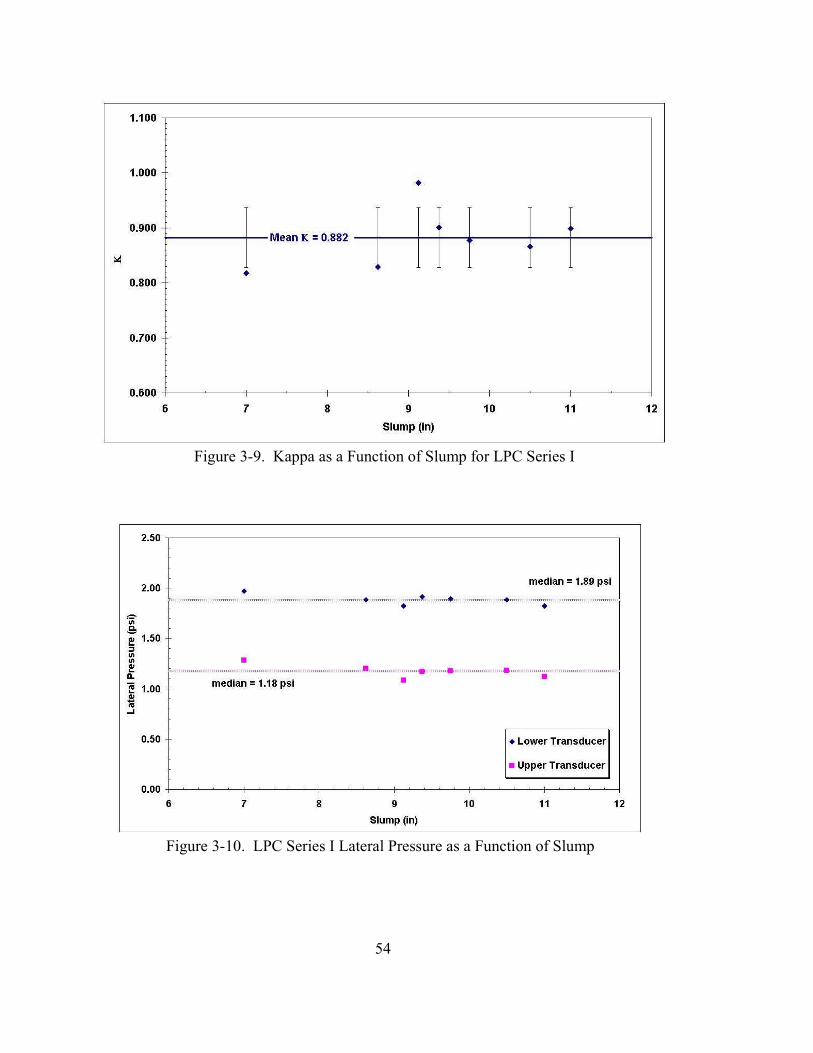
54
Figure 3-9. Kappa as a Function of Slump for LPC Series I
Figure 3-10. LPC Series I Lateral Pressure as a Function of Slump
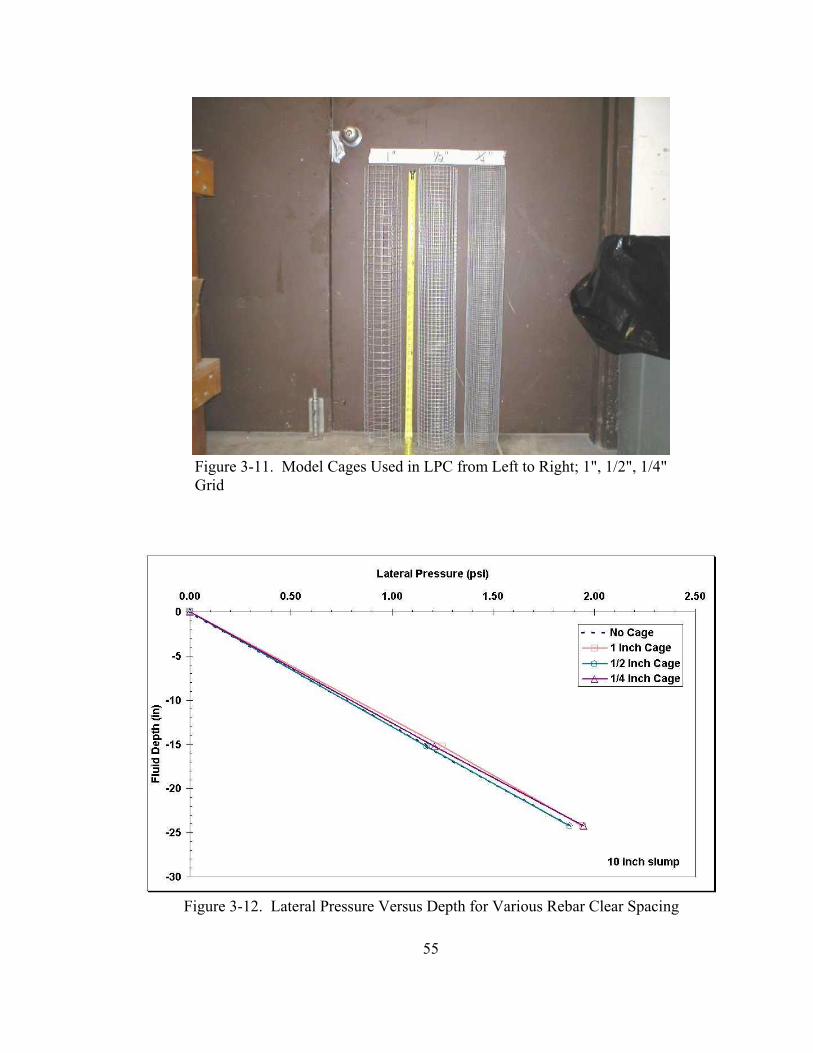
55
Figure 3-11. Model Cages Used in LPC from Left to Right; 1", 1/2", 1/4"Grid
Figure 3-12. Lateral Pressure Versus Depth for Various Rebar Clear Spacing

56
Figure 3-13. LPC Series II Lateral Pressure as a Function of Slump
Figure 3-14. Kappa as a Function of Slump for LPC Series I & II

57
Figure 3-15. Wet Density and Lateral Pressure Versus Slump for VariousMortar Mixes
Figure 3-16. Head Differential Using 1/4" Spacing, Dry HoleConstruction

58
Figure 3-17. Alternate View of Head Differential Using 1/4" Spacing,Dry Hole
Figure 3-18. Flow past Lateral Pressure Transducer with Obvious HeadDifferential
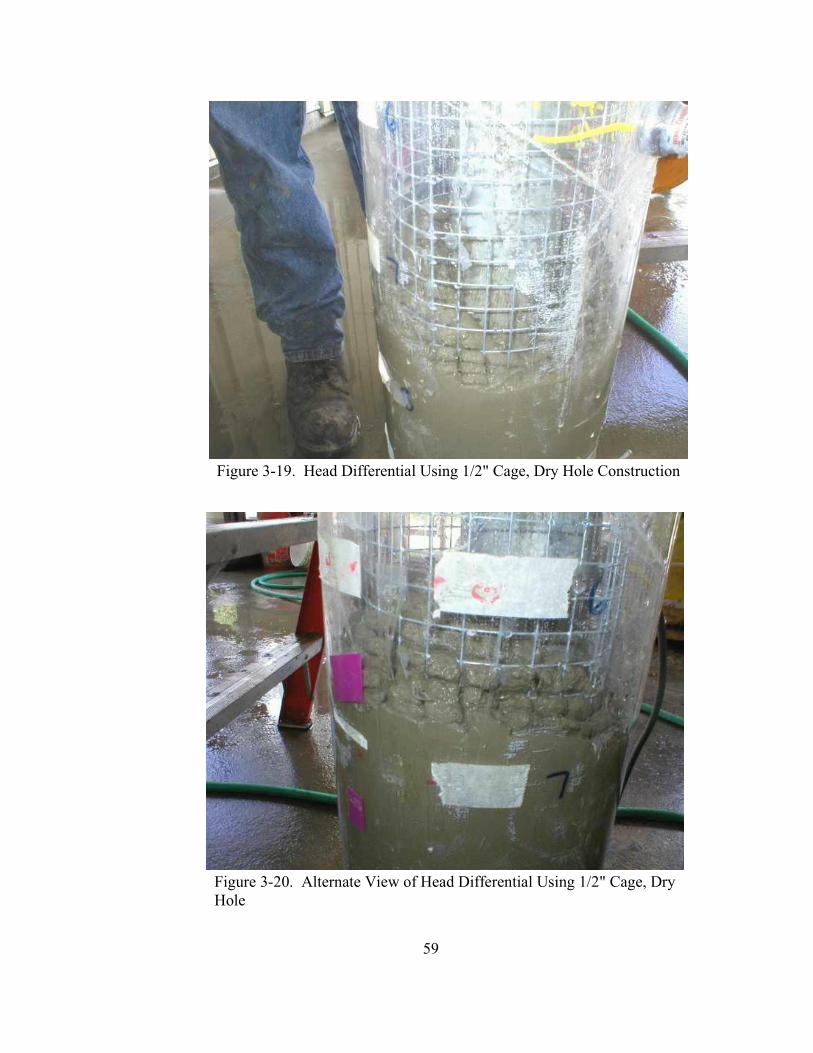
59
Figure 3-19. Head Differential Using 1/2" Cage, Dry Hole Construction
Figure 3-20. Alternate View of Head Differential Using 1/2" Cage, DryHole

60
Figure 3-21. Head Differential Using 1" Cage, Dry Hole Construction
Figure 3-22. Alternate View of Head Differential Using 1" Cage, DryHole
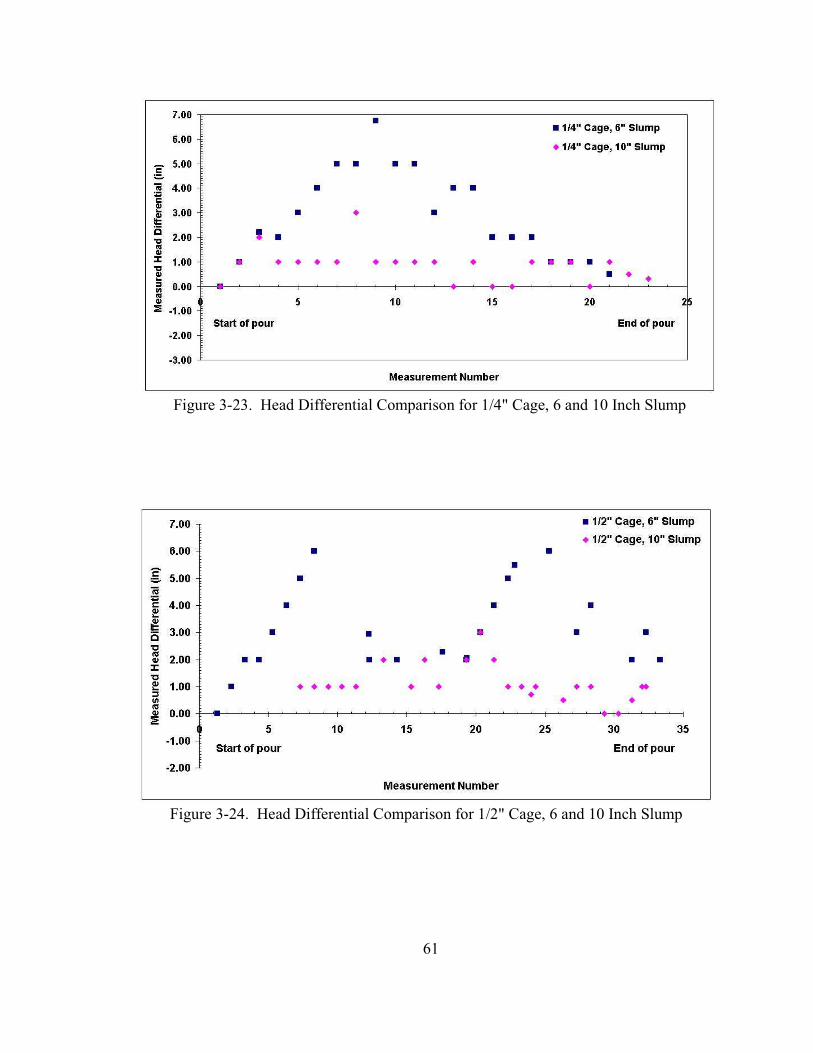
61
Figure 3-23. Head Differential Comparison for 1/4" Cage, 6 and 10 Inch Slump
Figure 3-24. Head Differential Comparison for 1/2" Cage, 6 and 10 Inch Slump
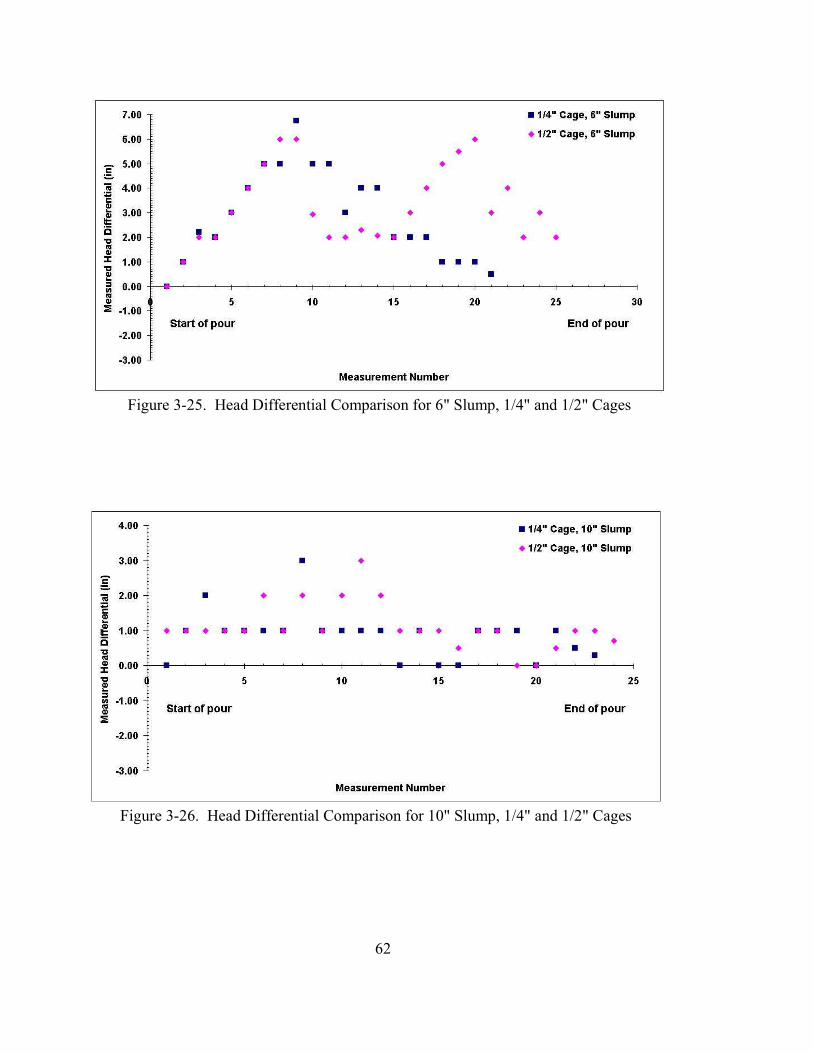
62
Figure 3-25. Head Differential Comparison for 6" Slump, 1/4" and 1/2" Cages
Figure 3-26. Head Differential Comparison for 10" Slump, 1/4" and 1/2" Cages

63
Figure 3-27. Radial Flow Rate as a Function of Grid Opening in the LPC
Figure 3-28. Radial Flow and Flux as a Function of Grid Opening
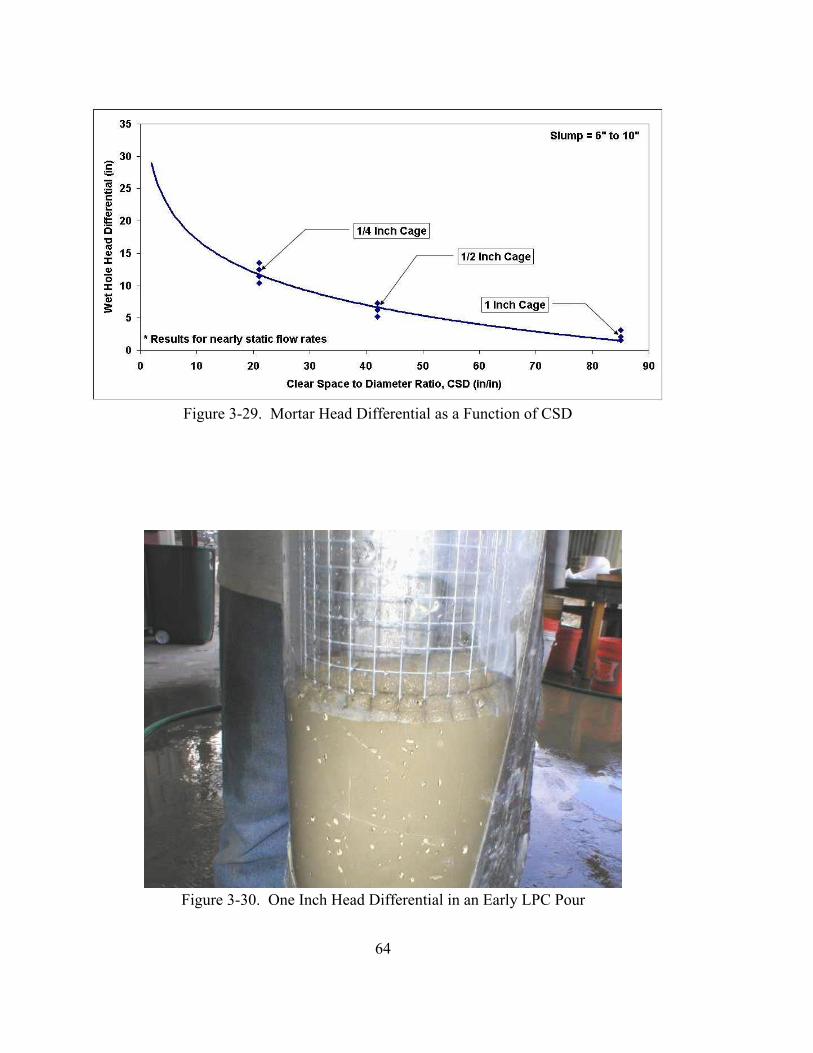
64
Figure 3-29. Mortar Head Differential as a Function of CSD
Figure 3-30. One Inch Head Differential in an Early LPC Pour

65
4. FRUSTUM CONFINING VESSEL TESTING
4.1 Background
The Frustum Confining Vessel (FCV) is a laboratory device that allows scale model testingto be accomplished without the use of an expensive centrifuge. It is not new, in fact severalstudies have already employed it as the basis of small scale testing (Horvath, 1996;Frederick, 2001; and Dapp, 2002). The concept of the device is that an inverted conically-shaped steel chamber, open to the atmosphere at the top, is filled with a geomaterial andstressed from the bottom via pressurized rubber bladder. The soil stress gradient ismagnified due to this arrangement, varying from atmospheric pressure at the top to thebladder pressure near the base. For a bladder pressure of 30 psi, which is used throughoutthis research, the gradient was achieved over a depth of approximately 47 inches. If the unitweight of the sand in the frustum was 105 pcf, then without the bladder pressure the verticalsoil stress at a depth of 47 inches would be about 2.9 psi. Therefore, the soil stress gradientwas scaled by a factor of about 10. Figure 4-1 shows the vertical soil stress distribution inthe FCV before and after bladder pressure is applied. However, fluid pressures, such asthose of a mortar column or a simulated ground water table, are not dependent on the bladderpressure and therefore cannot be scaled in the FCV. In this project shafts were constructedin the FCV in the stressed state to better simulated the construction related issues.
4.2 FCV Test Program Overview
At the start of the project, 40 to 50 lab scale drilled shaft specimens were envisioned in orderto study the parameters thought to be affecting shaft quality. A construction test matrix wasestablished that targeted the three main parameters: ground water table location, casingextraction rate, and slump of the shaft mix at the time of extraction.
(1) The location of the simulated ground water table (GWT) in the FCV was varied fordifferent drilled shaft specimens during placement of the concrete as well as duringcasing extraction and curing. As many of the observed anomalies in the field arelocated in the general vicinity of the GWT, it had been thought that the suddenchange in unit weight (from saturated to submerged) of the soil in this region mayhave an impact on the final integrity of the shaft (taught in the drilled shaft inspectorscourse). Therefore, during construction of the first lab specimens the only majorvariable was GWT elevation. Referring to the top of the FCV as elevation zero, theGWT was placed at elevations ranging from -3 inches to -12 inches.
(2) The extraction rate of the temporary casing used in the FCV was another parameterstudied. The overhead lift available in the test area had a standard upward advancerate of 8 feet/minute. This was therefore the “standard” rate used for specimens thatwere cast with other parameters varying. However, a number of shafts wereconstructed where this extraction rate was increased to 16 feet/minute and 24

66
feet/minute. The focus was to determine if the rate of casing extraction had anyeffect on the diameter of the finished shaft.
(3) Slump loss during the time it takes to pour a drilled shaft is also a concern, andFDOT currently mandates that the slump of the concrete during the time ofconstruction never should fall below 4 inches (FDOT, 2000). In the lab, constructiontimes are generally short because of the small volume of material needed to build alab scale specimen. In order to study the effect of slump loss on the quality of thefinished shaft, the temporary casing was left in place after the pour was completed,and excess material was stored in a plastic tub kept dry and undisturbed. Every 15to 20 minutes the material in the tub was mixed by hand, and slump tests (full slumpand mini-slump) were performed. In this way, the slump loss was reported as afunction of time, and only after a target slump was reached was the temporary casingextracted from the FCV. Normally the target slump was chosen at or below theFDOT 4 inch guideline. Once axial load tests were performed on the specimens, theshaft strength was compared to the slump loss before casing extraction. Also, thediameter of the finished shaft was compared to this same slump loss information.
4.2.1 FCV Mix Designs
The mix design for the FCV testing was similar to that used in the Lateral Pressure Cell(LPC) testing program. The mortar mix consisted of 1100 lb/yd cement content, water to3
cement ratios of 0.30 to 0.56, and batch volumes of 0.9 to 1.5 ft . The moisture content of3
the fine aggregate was tested with a Speedy moisture content testing device just prior to eachmix to maintain the w/c ratio specified for each pour. The w/c ratio was adjusted for eachtest in order to obtain the desired slump ranges.
4.2.2 FCV Casting Procedure
For the purpose of this study, the FCV was filled with masonry sand and had an adjustablewater table. Of the 53 lab scale drilled shafts constructed, 50 were completed below thewater table. Only the first three specimens cast were constructed in the dry for purposes ofobtaining baseline frustum performance information. The following casting procedure wasused throughout the test program.
(1) Alluviation of the FCV (Figure 4-2) was used to randomly redistribute the soil insidethe FCV and to allow it to fall out of suspension under the influence of gravity in amanner similar to natural alluvial processes. This ensured there was no residual stateof stress remaining from the installation and testing of previous samples, andapproximated virgin material without having to completely replace the soil in theFCV after each test.
(2) Once the soil in the FCV had time to sufficiently settle out of suspension (procedural4 hr minimum), pressure was slowly applied to the bladder in 5 psi increments every
67
15 minutes up to the target pressure of 30 psi. The FCV was then left undisturbedfor twelve hours prior to excavation.
(3) Using a duplex excavation / casing installation approach, the casing was installed toa depth of 33 inches (Figure 4-3). A common hand auger was used for most the bulkof the excavation and a small-scale clean-out bucket was used to finish excavation,as shown in Figures 4-4 and 4-5. Upon completion of the excavation, a permanentsteel casing, 6 inches in length, was placed around the temporary casing to a depthof 3 inches (Figure 4-6). The additional 3 inches of stickup provided the necessaryheight for load testing.
(4) Prior to pouring the shaft, the water table was lowered to the desired elevation anda final pass with the clean-out bucket was performed. Pouring typically commencedwithin 15 minutes of the completion of excavation. A mini-slump test was used toverify that the mix can be poured through the tremie pipe.
(5) The FCV casting was designed to replicate full-scaled tremie-placed drilled shaftconstruction. Once the workability of the mix was verified, the entire batch wastransferred to the hopper/tremie assembly and positioned directly over the center ofthe excavation. The pour started and continued until fresh concrete flowed from thetop of the excavation. The bottom of the tremie was kept several inches below thetop of the rising concrete at all times in order to maintain a seal. Once fresh concretereached the top of the excavation, the hopper valve was closed and the hopper/tremieassembly was removed. Figures 4-7 and 4-8 show the tremie pipe and the concreteplacement with the hopper/tremie assembly.
(6) The temporary casing was then removed using an overhead lift, as shown in Figure4-9. The rate of casing extraction was 8 ft/min, 16 ft/min, or 24 ft/min depending onthe goal of the particular test series.
4.2.3 Static Load Test Apparatus and Procedure
Each drilled shaft specimen constructed in the FCV was subjected to multiple cycles of staticloading prior to being removed. This test was conducted axially in general accordance withASTM 1143 and was conducted at a time between 48 and 72 hours after casting (ASTM,1996). The apparatus used to complete the static load tests (SLT) consisted of a reactionframe, bearing plates, a hydraulic jack, and a manual pump. Instrumentation and dataacquisition consisted of a resistive load cell and two linear variable differential transformers(LVDT) used to measure top of shaft load and displacement, respectively, and a StarLoggerPro (Figure 4-10) data collection unit used to condition and record the signals. The SLT testequipment and instrumentation is shown in Figures 4-11 through 4-15.
Once the SLT equipment was properly set up and calibrated, each load test was comprisedof multiple load-reload cycles. The first cycle ended at a displacement of 0.25 inch, at which
68
time the load was held for several minutes prior to unloading. A second load cycle was thenperformed, and was carried out until a total top-of-shaft displacement of 0.5 inches wasachieved. Final load and displacement readings were taking for an additional 30 to 60seconds following completion of the second load cycle.
4.2.4 Shaft Extraction and Investigation
Each test shaft, following load testing, was extracted and investigated for any anomalies.Once the shaft was removed from the FCV and cleaned of any loose sand, diameter andlength measurements were recorded. The diameter measurements were taken at 6 inchintervals along the length of the shaft as well as just below the permanent casing. The lengthmeasurements were taken at third points around the shaft. The summary of the three testingseries is presented below. Details can be found elsewhere (Garbin, 2003).
4.3 Control Shaft Tests
The first shafts constructed in the FCV were performed in dry conditions. Out of test shaftsA1, A2, and A3, only A3 was load tested. Figure 4-16 shows the load-displacement curvefor test shaft A3. Each of the two loading cycles of A3 were performed in 0.5 inchincrements. The maximum load achieved was 9000 lbs at a displacement of 1 inch. Theside shear was fully mobilized within 0.1 inches of displacement at a load of 1800 lbs.
4.4 FCV Test Series I - Water Table Elevation
At the start of the research program there were many potential parameters that wereconsidered as the focus for lab scale testing. Obviously at this early stage of the research,the elevation of the simulated GWT in the FCV was considered an important variable. Thefirst series of test shafts constructed would therefore focus on this parameter.
To summarize, a total of twelve model shafts were constructed for the first series of FCVtesting. The focus of this test series was on the influence of the water table elevation on theintegrity of the shaft. Various water table elevations were selected, ranging in value from-3.0 inches to -12.0 inches, below the top of the FCV. Shafts were constructed using thecased method, with the casing being extracted immediately following placement of theconcrete. The extraction rate was kept constant at 8 feet/minute, and for the most part themix designs used for this group of shafts were similar. For most specimens cast, mini-slumptesting was performed prior to pouring. After load testing, each shaft was removed from theFCV then measured for diameter as previously described. Additionally, photographicrecords of any anomalies were taken, and any deviation from standard procedure was notedin the construction logs. Summarized in Table 4-1 are the relevant statistics for each of theshafts included in Test Series I. These include Shaft ID, length measurements, mediandiameter, mini-slump, anomalies that may have formed, water table elevation, and probablecause of the anomalies.
69
4.5 FCV Test Series I - Results
Studying the results of these preliminary tests in the FCV, it is apparent that the location ofthe water table had little to no effect on the formation of anomalies within a shaft. In everymodel specimen constructed, any irregularities in the finished shaft were attributed, mostoften, to some abnormality with the construction methodologies employed. Based on thefindings of FCV Test Series I, it seems that the quality of a finished shaft depended moreheavily on quality and consistency of construction rather than on location of the water table.Figures 4-17 through 4-22 show typical anomaly formations in the test shafts for Test SeriesI.

70
Sha
ft I
nfor
mat
ion
Sha
ft P
hysi
cal S
tati
stic
sS
haft
Str
engt
h S
tati
stic
sA
nom
aly
Typ
eC
omm
ents
Sha
ftID
Wat
erT
able
EL
(in)
Nom
inal
Len
gth
(in)
Med
ian
Dia
met
er(i
n)
Min
i-sl
ump
atpo
ur (
in)2
She
arC
apac
ity
(lbs
)
She
arD
isp
(in)
Max
Loa
d(l
bs)
Max
Dis
p(i
n)
Ano
mal
yL
ocat
ion
(in)
Ano
mal
yT
ype
S1
-3.0
23.0
04.
4514
.02
--
1000
0.75
-23.
0S
hort
sha
ftIm
prop
erpl
acem
ent o
f m
orta
r
S2
-3.0
34.0
04.
5814
.35
1100
0.10
2200
0.60
-3.0
Nec
kIm
prop
er h
andl
ing
of p
erm
anen
t cas
ing
-40.
5B
ulge
Ove
r-ex
cava
tion
S3
-3.0
36.0
04.
5819
.60
4900
0.15
6000
0.30
N/A
N/A
Goo
d sh
aft
S4
-12.
037
.00
4.58
21.5
712
500.
0823
000.
30N
/AN
/AG
ood
shaf
t des
pite
irre
gula
r ca
sing
ext
ract
ion
S5
-5.0
36.0
04.
539.
8421
500.
0640
000.
24-3
6.0
Tap
erP
oor
exca
vati
on a
nd ir
regu
lar
casi
ng e
xtra
ctio
n
S6
-7.0
36.0
04.
5728
.32
2350
0.10
3900
0.50
-26.
0N
eck
Irre
gula
rca
sing
ext
ract
ion
(wob
ble
duri
ng p
ull)
-37.
0B
ulge
Ove
r-ex
cava
tion
S7
-8.0
36.0
04.
559.
2610
000.
0535
000.
33-3
.0B
ulge
Impr
oper
han
dlin
g of
per
man
ent c
asin
g
S8
-8.0
36.0
04.
589.
6850
00.
0825
000.
63-3
5.0
Odd
sha
peD
irty
toe
- po
or e
xcav
atio
n
-3.0
Bul
geP
erm
anen
t cas
ing
hand
ling
S13
-8.0
34.5
04.
597.
6947
00.
0525
000.
63E
ntir
eL
engt
hN
ecks
Liq
uefa
ctio
n du
ring
cas
ing
inst
alla
tion
-34.
5S
hort
sha
ftD
irty
toe
- po
or e
xcav
atio
n
S14
-8.0
35.7
54.
57-
1100
0.10
2900
0.50
-3.0
Bul
geP
erm
anen
t cas
ing
hand
ling
S15
-8.0
37.2
54.
5414
.73
--
--
-3.0
Nec
kP
erm
anen
t cas
ing
hand
ling
-37.
25L
ong
shaf
tO
ver-
exca
vati
on
S16
-8.0
36.5
04.
54-
1000
0.10
3300
0.78
-36.
0N
eck
Irre
gula
r ca
sing
ext
ract
ion
Tab
le 4
-1.
Sha
ft S
umm
ary
for
FC
V T
est S
erie
s I
71
4.6 FCV Test Series II - Temporary Casing Extraction Rate
As this research study commenced, it started to become apparent that, at least in the FCV,the location of the ground water table had little if any influence on the quality of the finishedshaft. Construction procedure was much more critical, however, as most of the anomaliesrecorded in the first test series could be attributed to some deviation from the norm duringborehole excavation, casting, or finishing the shaft. Accordingly, the second series of testshafts were constructed using the same methodologies as before, but with the rate ofextraction of the temporary casing being varied. Three individual extraction rates werestudied, starting with the 8 feet/minute standard that was used previously, and includingadditional shafts for which the casings were removed at either 16 feet/minute or 24feet/minute. The following sections present and discuss the strength testing and qualityinspection of each group of shafts, starting with the 8 feet/minute specimens and concludingwith the 24 feet/minute specimens.
4.7 FCV Test Series II - Results
A total of 28 shafts were constructed and studied for this second series of FCV tests. Themain parameter varied was extraction rate of the temporary casing. Shafts were grouped byextraction rate into three categories: 8 feet/minute, 16 feet/minute, and 24 feet/minute. Thewater table elevation was kept constant for all tests within this series at -8.0 inches, andalthough mortar mixes of various w/c ratios and slumps were used, all fell within the FDOTrange of 7 to 9 inches at pour. The casing was extracted immediately after each pour, withno appreciable time allowed for slump loss to occur.
Table 4-2 summarizes the physical properties of each of these shafts as well as the strengthvalues obtained from axial SLT testing. Figures 4-23 through 4-27 show some of the testshafts from Test Series II with anomaly formations. When comparing the median diameterof each shaft with its corresponding extraction rate, it can be seen that from 8 feet/minuteto 16 feet/minute there was a small reduction in median shaft diameter for the fasterextraction rate. However, increasing the rate again to 24 feet/minute (3 times the referencerate) resulted in a slight increase in the median shaft diameter.
The first trend is expected. Doubling the extraction rate of the temporary casing increasesthe dynamic friction forces between the inner casing wall and the concrete shaft. Becausethe shaft itself is in no way anchored to the bottom of the FCV, as the casing is pulled itcauses the shaft to be stretched. Due to the Poisson effect, the cross sectional diameterdecreases as this stretching takes place. What is initially puzzling is the second trend. Itseems as though once the extraction rate becomes high enough, there is a tendency for thecasing to move so quickly that the inertia of the semi-fluid shaft mix overcame the previousscenario of stretching or net suction at the base of the shaft. Therefore, although somereduction in cross sectional diameter is observed, it is not severe while the shaft mix is stillfluid (i.e. no significant slump loss).
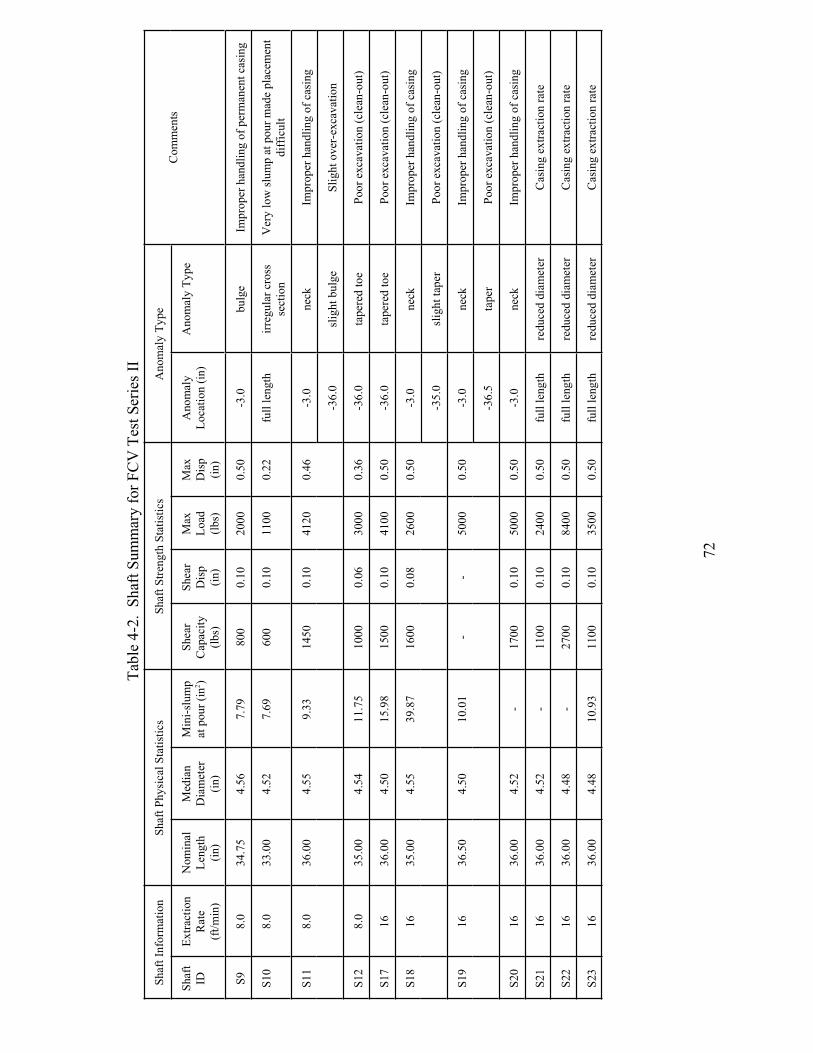
72
Sha
ft I
nfor
mat
ion
Sha
ft P
hysi
cal S
tati
stic
sS
haft
Str
engt
h S
tati
stic
sA
nom
aly
Typ
eC
omm
ents
Sha
ftID
Ext
ract
ion
Rat
e(f
t/m
in)
Nom
inal
Len
gth
(in)
Med
ian
Dia
met
er(i
n)
Min
i-sl
ump
atpo
ur (
in)2
She
arC
apac
ity
(lbs
)
She
arD
isp
(in)
Max
Loa
d(l
bs)
Max
Dis
p(i
n)
Ano
mal
yL
ocat
ion
(in)
Ano
mal
y T
ype
S9
8.0
34.7
54.
567.
7980
00.
1020
000.
50-3
.0bu
lge
Impr
oper
han
dlin
g of
per
man
ent c
asin
g
S10
8.0
33.0
04.
527.
6960
00.
1011
000.
22fu
ll le
ngth
irre
gula
r cr
oss
sect
ion
Ver
y lo
w s
lum
p at
pou
r m
ade
plac
emen
tdi
ffic
ult
S11
8.0
36.0
04.
559.
3314
500.
1041
200.
46-3
.0ne
ckIm
prop
er h
andl
ing
of c
asin
g
-36.
0sl
ight
bul
geS
ligh
t ove
r-ex
cava
tion
S12
8.0
35.0
04.
5411
.75
1000
0.06
3000
0.36
-36.
0ta
pere
d to
eP
oor
exca
vati
on (
clea
n-ou
t)
S17
1636
.00
4.50
15.9
815
000.
1041
000.
50-3
6.0
tape
red
toe
Poo
r ex
cava
tion
(cl
ean-
out)
S18
1635
.00
4.55
39.8
716
000.
0826
000.
50-3
.0ne
ckIm
prop
er h
andl
ing
of c
asin
g
-35.
0sl
ight
tape
rP
oor
exca
vati
on (
clea
n-ou
t)
S19
1636
.50
4.50
10.0
1-
-50
000.
50-3
.0ne
ckIm
prop
er h
andl
ing
of c
asin
g
-36.
5ta
per
Poo
r ex
cava
tion
(cl
ean-
out)
S20
1636
.00
4.52
-17
000.
1050
000.
50-3
.0ne
ckIm
prop
er h
andl
ing
of c
asin
g
S21
1636
.00
4.52
-11
000.
1024
000.
50fu
llle
ngth
redu
ced
diam
eter
Cas
ing
extr
acti
on r
ate
S22
1636
.00
4.48
-27
000.
1084
000.
50fu
llle
ngth
redu
ced
diam
eter
Cas
ing
extr
acti
on r
ate
S23
1636
.00
4.48
10.9
311
000.
1035
000.
50fu
llle
ngth
redu
ced
diam
eter
Cas
ing
extr
acti
on r
ate
Tab
le 4
-2.
Sha
ft S
umm
ary
for
FC
V T
est S
erie
s II

73
Sha
ft I
nfor
mat
ion
Sha
ft P
hysi
cal S
tati
stic
sS
haft
Str
engt
h S
tati
stic
sA
nom
aly
Typ
eC
omm
ents
Sha
ftID
Ext
ract
ion
Rat
e(f
t/m
in)
Nom
inal
Len
gth
(in)
Med
ian
Dia
met
er(i
n)
Min
i-sl
ump
atpo
ur (
in)2
She
arC
apac
ity
(lbs
)
She
arD
isp
(in)
Max
Loa
d(l
bs)
Max
Dis
p(i
n)
Ano
mal
yL
ocat
ion
(in)
Ano
mal
y T
ype
S24
1636
.00
4.46
10.6
911
500.
1035
000.
50fu
llle
ngth
redu
ced
diam
eter
Cas
ing
extr
acti
on r
ate
S25
1636
.00
4.40
20.2
918
000.
1045
000.
50en
tire
leng
thre
duce
d di
amet
erC
asin
g ex
trac
tion
rat
e
S26
1636
.00
4.47
16.5
620
400.
1050
000.
50-3
.0cr
acki
ngIm
prop
er c
asin
g ha
ndli
ng
enti
re le
ngth
redu
ced
diam
eter
Cas
ing
extr
acti
on r
ate
S27
1635
.50
4.55
11.3
495
00.
1025
000.
50-3
.0ne
ckIm
prop
er c
asin
g ha
ndli
ng
-35.
5ta
pere
d to
eP
oor
exca
vati
on (
clea
n-ou
t)
S28
1637
.00
4.55
14.9
726
300.
1070
000.
50-3
7.0
bulg
eO
ver-
exca
vati
on
S29
1636
.00
4.61
10.0
221
900.
1045
000.
50n/
an/
aE
xcel
lent
sha
ft q
uali
ty
S30
1636
.00
4.56
10.9
723
400.
1035
000.
50-3
6.0
tape
red
toe
Poo
r ex
cava
tion
(cl
ean-
out)
S31
1636
.00
4.53
7.72
1650
0.10
3300
0.50
-32.
0ta
pere
d to
eP
oor
exca
vati
on (
clea
n-ou
t)
S33
1636
.00
4.52
8.39
1990
0.05
4700
0.50
-3.0
neck
Impr
oper
cas
ing
hand
ling
S40
1636
.00
4.55
10.9
1950
0.10
6000
0.50
-9.0
tape
rC
asin
g ex
trac
tion
rat
e
S41
1636
.00
4.53
8.72
2700
0.10
8100
0.50
-36.
0ir
regu
lar
toe
Poo
r ex
cava
tion
(cl
ean-
out)
enti
re le
ngth
redu
ced
diam
eter
Cas
ing
extr
acti
on r
ate
Tab
le 4
-2.
(Con
tinu
ed)

74
Sha
ft I
nfor
mat
ion
Sha
ft P
hysi
cal S
tati
stic
sS
haft
Str
engt
h S
tati
stic
sA
nom
aly
Typ
eC
omm
ents
Sha
ftID
Ext
ract
ion
Rat
e(f
t/m
in)
Nom
inal
Len
gth
(in)
Med
ian
Dia
met
er(i
n)
Min
i-sl
ump
atpo
ur (
in)2
She
arC
apac
ity
(lbs
)
She
arD
isp
(in)
Max
Loa
d(l
bs)
Max
Dis
p(i
n)
Ano
mal
yL
ocat
ion
(in)
Ano
mal
y T
ype
S32
2435
.50
4.48
8.48
1800
0.10
5000
0.50
-3.0
slig
ht n
eck
Impr
oper
cas
ing
hand
ling
enti
re le
ngth
groo
ves
Hig
h ca
sing
ext
ract
ion
rate
S34
2435
.75
4.56
9.13
900
0.07
3000
0.50
-24.
0gr
oove
sH
igh
casi
ng e
xtra
ctio
n ra
te
-35.
75ir
regu
lar
toe
Impr
oper
cas
ing
hand
ling
S35
2436
.25
4.50
8.39
500
0.10
2000
0.50
enti
re le
ngth
redu
ced
diam
eter
Hig
h ca
sing
ext
ract
ion
rate
S39
2436
.25
4.58
8.69
900
0.10
2250
0.50
enti
re le
ngth
poro
us te
xtur
eH
igh
casi
ng e
xtra
ctio
n ra
te
S42
2436
.00
4.52
9.36
2150
0.10
9000
0.50
enti
re le
ngth
groo
ves
Hig
h ca
sing
ext
ract
ion
rate
S43
2436
.25
4.51
7.91
--
--
enti
re le
ngth
groo
ves
Hig
h ca
sing
ext
ract
ion
rate
Tab
le 4
-2.
(Con
tinu
ed)
75
4.8 FCV Test Series III - Slump Loss During Pour
The final series of tests in the FCV targeted slump loss during construction as the mainparameter. FDOT specifies that at no time during the construction of a drilled shaft shouldthe slump of the concrete drop below 4 inches (FDOT, 2000). This includes all time thatelapses during transportation of the material to the site, delays on the site, setup at the tremie,and pouring of the shaft. Any material that cannot maintain a slump of 4 inches or greaterduring this time must be rejected. This series of tests was sculpted to better define thisspecified construction limit on the basis of performance (i.e. function of shaft capacity).
In order to study the effects, if any, of excessive slump loss on the quality and capacity ofdrilled shafts in the FCV, 10 specimens were cast at an initial slump between 7 to 9 inches.Extraction of the temporary casing was completed at an extraction rate of 8 feet/minute, afterthe slump of the material had dropped to 4 inches or lower. The water table elevation waskept constant for all tests within this series at -8.0 inches, and load testing was conducted inaccordance with the standard operating procedure.
4.9 FCV Test Series III - Results
As with the previous two test series, a summary of the physical and strength characteristicsand anomaly locations for each shaft in Test Series III can be found in Table 4-3. Althoughit was often difficult to pull the temporary casing once the slump had fallen below about 4.5inches, doing so in this series of tests has shed new light on the effect of slump loss on thefrictional capacity of a shaft. Figure 4-28 shows the results of the tests conducted in thisseries as compared with those of series two, where little to no slump loss was allowed tooccur before casing extraction. It is immediately apparent that slump loss has a strong effecton skin friction capacity. For the shafts where little to no slump loss was allowed, unit skinfriction approached about 5 psi. However, as slump loss increased, unit skin friction valuesdecreased dramatically. At the FDOT allowable slump loss limit of 4 inches, unit skinfriction values were only about 1 psi. Below a slump of 3.5 inches, it became impossibleto construct a shaft in the FCV, as the casing extraction would tear out most, if not all, of theshaft (Figure 4-29). In this instance, the slump was allowed to drop to 3.5 inches over aperiod of about 2 hours. When the casing was extracted, the entire shaft was removed.
It is clear that an allowable slump loss resulting in a minimum 4 inch slump is much toorisky, especially when using temporary casing. Slip forming of the concrete occurs as thecasing is pulled, and unit skin friction values drop off substantially as an annular space isformed around the shaft where no shaft to soil contact is achieved. Also, as this 4 inch lowerbound is approached, the likelihood that a portion of the shaft will be lost during casingextraction increases. Therefore, it will be the recommendation of this report to increase thislower limit on slump loss. Further research into this phenomenon is warranted, and perhapsthis slump loss criteria can be refined with more data.

76
Sha
ft I
nfor
mat
ion
Sha
ft P
hysi
cal S
tati
stic
sS
haft
Str
engt
h S
tati
stic
sA
nom
aly
Typ
eC
omm
ents
Sha
ftID
Slu
mp
atC
asin
g Pu
ll(i
n)
Nom
inal
Len
gth
(in)
Med
ian
Dia
met
er(i
n)
Min
i-sl
ump
atpo
ur (
in)2
She
arC
apac
ity
(lbs
)
She
arD
isp
(in)
Max
Loa
d(l
bs)
Max
Dis
p(i
n)
Ano
mal
yL
ocat
ion
(in)
Ano
mal
y T
ype
S36
4.87
536
.00
4.58
8.55
680
0.07
1200
0.50
n/a
n/a
Goo
d sh
aft
S37
4.75
36.0
04.
609.
0452
50.
0721
000.
50en
tire
leng
thre
duce
d di
amet
erP
orou
s su
rfac
e al
ong
enti
re s
haft
leng
th
S38
4.87
536
.25
4.56
9.62
750
0.07
2700
0.50
-36.
25ta
pere
d to
eP
orou
s su
rfac
e al
ong
enti
re s
haft
leng
th
S44
3.62
536
.00
4.54
9.52
--
3000
0.50
-36.
00ta
pere
d to
eP
orou
s su
rfac
e al
ong
enti
re s
haft
leng
th
S45
4.25
36.0
04.
448.
3839
00.
0711
000.
50-3
.0to
-8.
0m
inor
nec
king
Por
ous
surf
ace
alon
g en
tire
sha
ft le
ngth
S46
4.50
36.0
04.
487.
9924
00.
0713
000.
50-3
.0 to
-10
.0gr
een
Por
ous
surf
ace
and
not w
ell c
ured
alo
ngen
tire
leng
th
S47
3.62
5-
-8.
36-
--
-n/
an/
aL
ost s
haft
dur
ing
casi
ng e
xtra
ctio
n
S48
6.87
536
.00
4.51
9.79
700
0.07
2500
0.50
-3.0
min
or n
ecki
ngR
educ
ed d
iam
eter
and
rou
nded
toe
S49
5.0
36.2
54.
548.
1488
00.
0725
000.
50n/
an/
aG
ood
shaf
t
S50
3.75
36.0
04.
478.
0820
00.
0518
000.
50en
tire
leng
thre
duce
d di
amet
erP
orou
s su
rfac
e al
ong
enti
re s
haft
leng
th
Tab
le 4
-3.
Sha
ft S
umm
ary
for
FC
V T
est S
erie
s II
I

77
4.10 Summary of Results
Of the three main parameters studied during FCV testing, only two were found to have aneffect on shaft quality: casing extraction rate and slump loss. Though variations in theelevation of the water table had little effect on shaft quality, results of the constructionmishaps noted during this series of tests directed attention away from geotechnical site issuesand refocused on the impact of construction techniques. Figure 4-30 shows the effects ofwater table elevation on side shear within the FCV. Typically in design, submerged sideshear values are lower than dry values. This suggests that other factors may have controlledside shear within the FCV. Though minor, the casing extraction rate proved to have aneffect on the diameter of the cured shaft. Table 4-4 shows the statistical data for theextraction rate versus diameter for all the test shafts with water table elevation of -8 inches.Figure 4-31 shows the diameter of the test shafts at various slumps.
Table 4-4. Extraction Rate versus Shaft Diameter
Extraction
Rate (ft/min)
Median
Diameter (in)
Average
Diameter (in)
Standard
Deviation (in)
Number of
Test Shafts
8 4.54 4.52 0.0915 20
16 4.52 4.52 0.0463 18
24 4.52 4.53 0.0362 6

78
Figure 4-1. Total Vertical Soil Stress in the FCV
Figure 4-2. Alluviation of the FCV Using the Water Jet Tool

79
Figure 4-3. Casing Driven into Specified Depth
Figure 4-4. Primary Auger Tool Used to Excavate Most of the Shaft

80
Figure 4-5. Clean-out Bucket Used to Finish Excavation
Figure 4-6. Permanent Casing Installed Around Temporary Casing
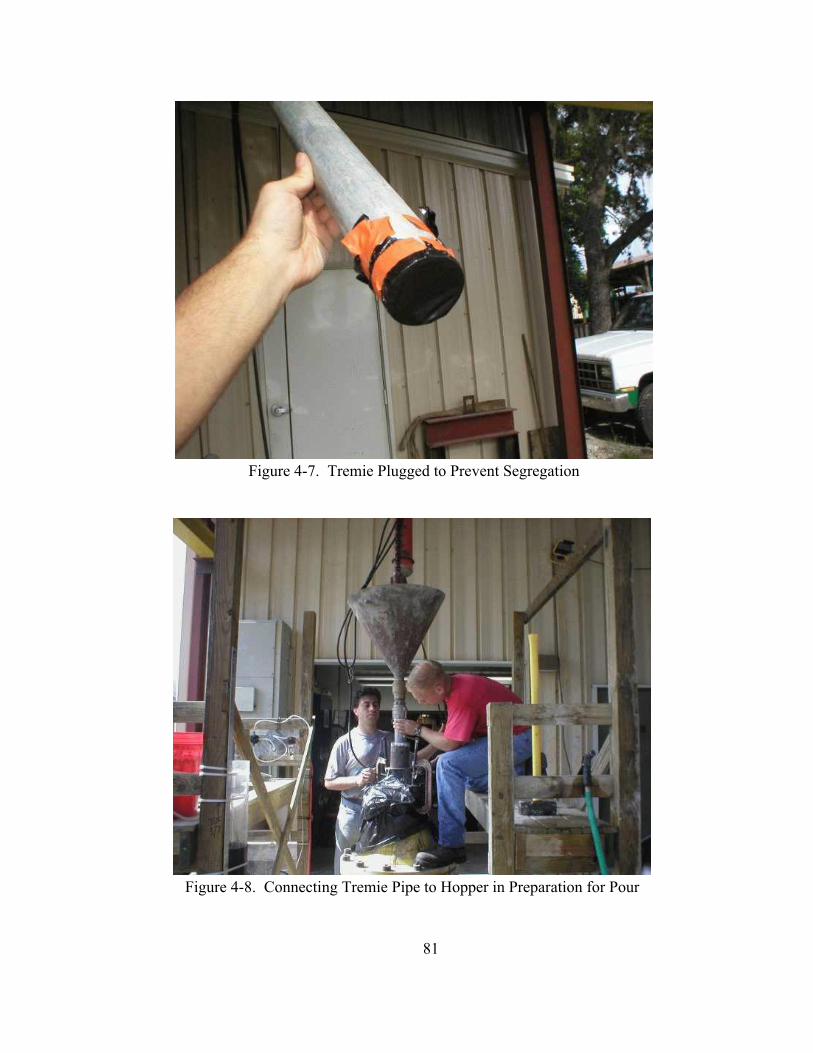
81
Figure 4-7. Tremie Plugged to Prevent Segregation
Figure 4-8. Connecting Tremie Pipe to Hopper in Preparation for Pour

82
Figure 4-9. Casing Extraction Using the OverheadLift
Figure 4-10. Starlogger Pro Data Acquisition System

83
Figure 4-11. Reaction Frame Used for FCV Static Load Testing
Figure 4-12. Load Cell and Bearing Plates used for FCV Static LoadTesting

84
Figure 4-13. Load Cell Assembly Installed on Shaft
Figure 4-14. Hydraulic Jack and LVDTs Installed on Shaft
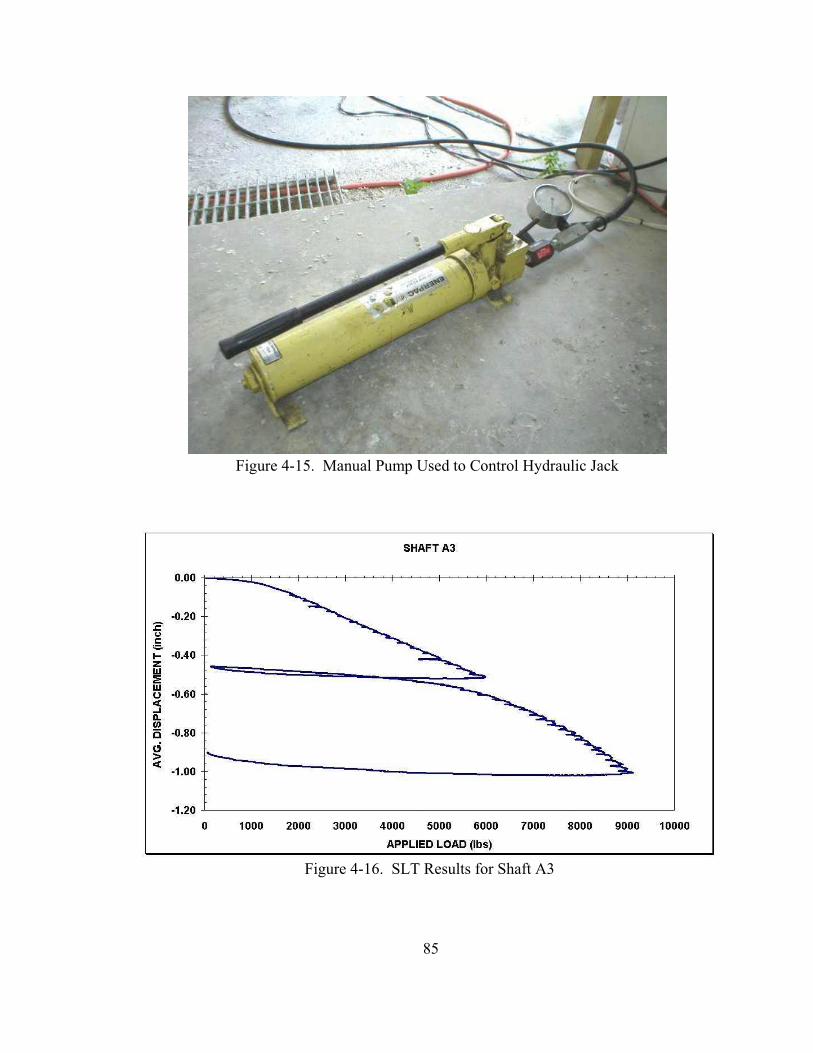
85
Figure 4-15. Manual Pump Used to Control Hydraulic Jack
Figure 4-16. SLT Results for Shaft A3
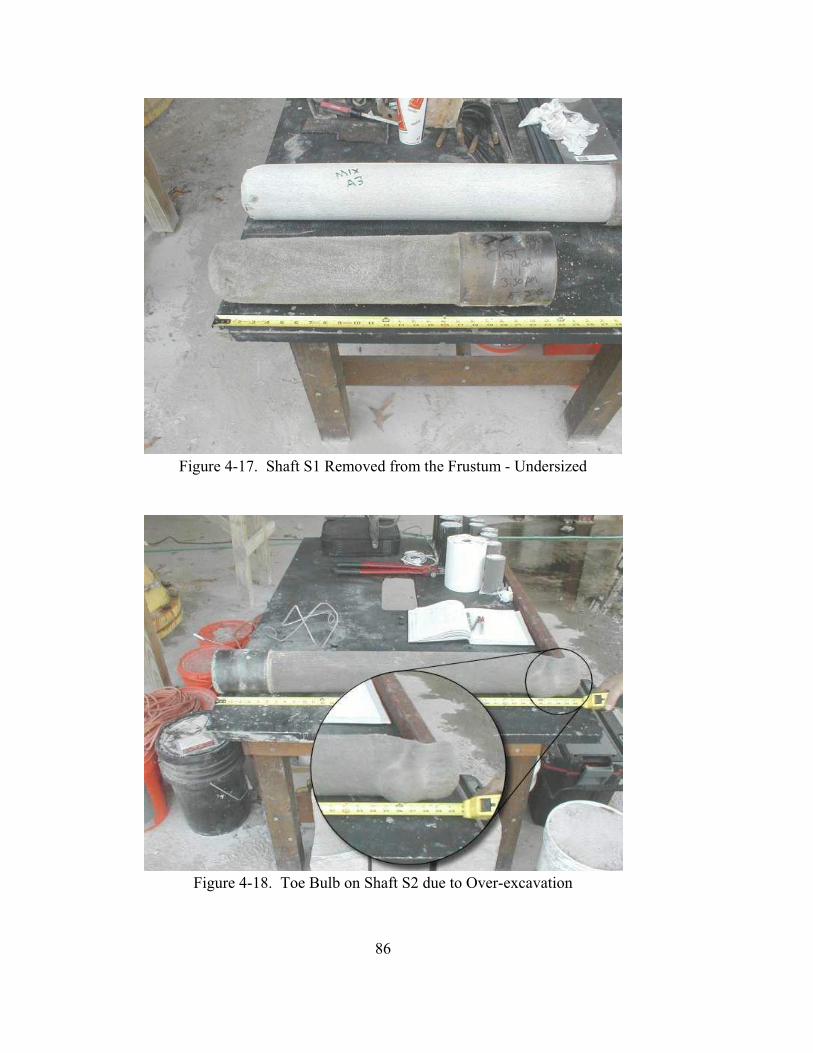
86
Figure 4-17. Shaft S1 Removed from the Frustum - Undersized
Figure 4-18. Toe Bulb on Shaft S2 due to Over-excavation

87
Figure 4-19. Slight Neck below Casing on Shaft S5
Figure 4-20. Toe Anomaly on Shaft S5

88
Figure 4-21. Shaft S7 Showing Bulge Just below Permanent Casing
Figure 4-22. Uneven Toe Formation on Shaft S8
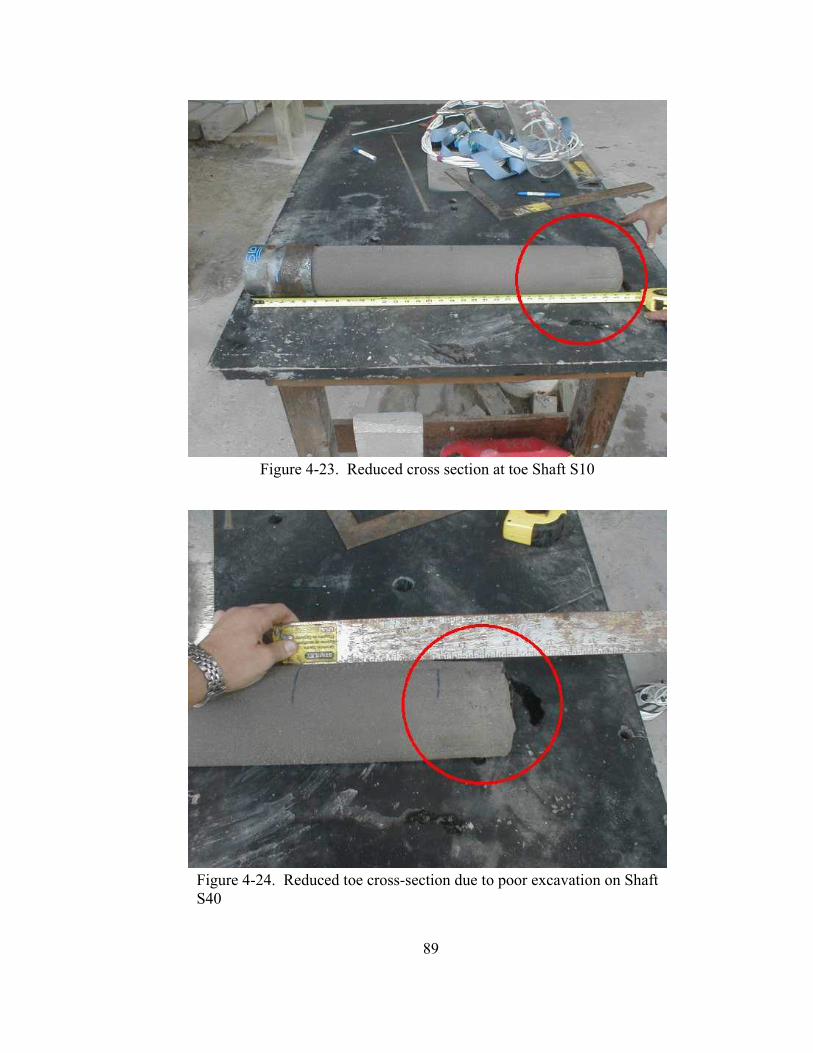
89
Figure 4-23. Reduced cross section at toe Shaft S10
Figure 4-24. Reduced toe cross-section due to poor excavation on ShaftS40

90
Figure 4-25. Surface Cracking in Upper Portion of Shaft Specimen
Figure 4-26. Porous surface noted during rapid casing extraction on ShaftS41

91
Figure 4-27. Surface markings due to casing wobble during extraction on ShaftS32
Figure 4-28. Mobilized Unit Skin Friction as a Function of Slump at Casing Extraction

92
Figure 4-29. Entire Shaft Lodged in Casing Due to Excessive Slump Loss onShaft S47
Figure 4-30. Side Shear versus Water Table Elevation

93
Figure 4-31. Shaft Diameter versus Slump (Measured and Predicted fromMini-slump)

94
THIS PAGE IS INTENTIONALLY BLANK

95
5. SLURRY / SAND FALLOUT TESTING
5.1 Sand Fallout Background
The permissible standard sand content widely used in state specifications for slurry mixesis 4% at the time of concrete placement. For example, a typical 4 foot diameter, 60 foot longdrilled shaft filled with a 4% sand content slurry, contains approximately 30 ft of sand in3
suspension. If the slurry is incapable of suspending the sand, fallout will occur. Sand falloutduring a large drilled shaft pour which takes several hours will accumulate on top of theadvancing concrete which has the potential of creating anomalies within the final shaft.
In order to test sand fallout in a drilled shaft borehole supported by slurry, a large scaleapparatus was conceived and developed. The “concrete pour simulator” device wasdesigned to simulate tremie placed concrete in drilled shafts (Figure 5-1). As such, variableconcrete placement rates and slurry standing times could be addressed.
5.2 Concrete Pour Simulator
It was critical that the device have enough height to adequately simulate drilled shafts, andalso a diameter that would not limit the applicability of the experiment. This unique devicewas envisioned as a 20 foot tall circular shaft with the ability to hold slurry by means of asealed bottom plug. Further, it needed to have the ability to raise this bottom plug atdifferent velocities to simulate the rise of concrete in a commercially constructed drilledshaft (similar to a vertical syringe pushing upwards). Also necessary was a tank to store theslurry while it was not in use, a pump to fill the shaft and circulate the slurry, a drain pipefor slurry to escape from the top of the shaft, and easy accessibility to the top and bottom ofthe shaft. Each component will be discussed in the following sections.
5.2.1 Simulated Shaft
To simulate the shaft, a 20 foot long section of 12 inch diameter PVC pipe was used (Figure5-2). The pipe assembly was mounted to the side of the USF 4MN statnamic hydrauliccatching frame. The plumbing fittings were installed at the top and bottom of the shaft bytapping into the side of the pipe. The intake fitting (Figure 5-3) consisted of a cam-lockadapter for easy connection with an inline valve so that the pump could be disconnected afterfilling the shaft. This plumbing was placed approximately one foot from the bottom of thepipe so the fully inserted plug would not block slurry from being pumped into the shaft.Approximately one foot from the top of the shaft, the drainage plumbing was installed(Figure 5-4). This consisted of a 2 inch PVC pipe draining directly back into the storagetank for slurry re-circulation. This allowed for approximately 18 feet of effective shaftlength for the experimental tests.
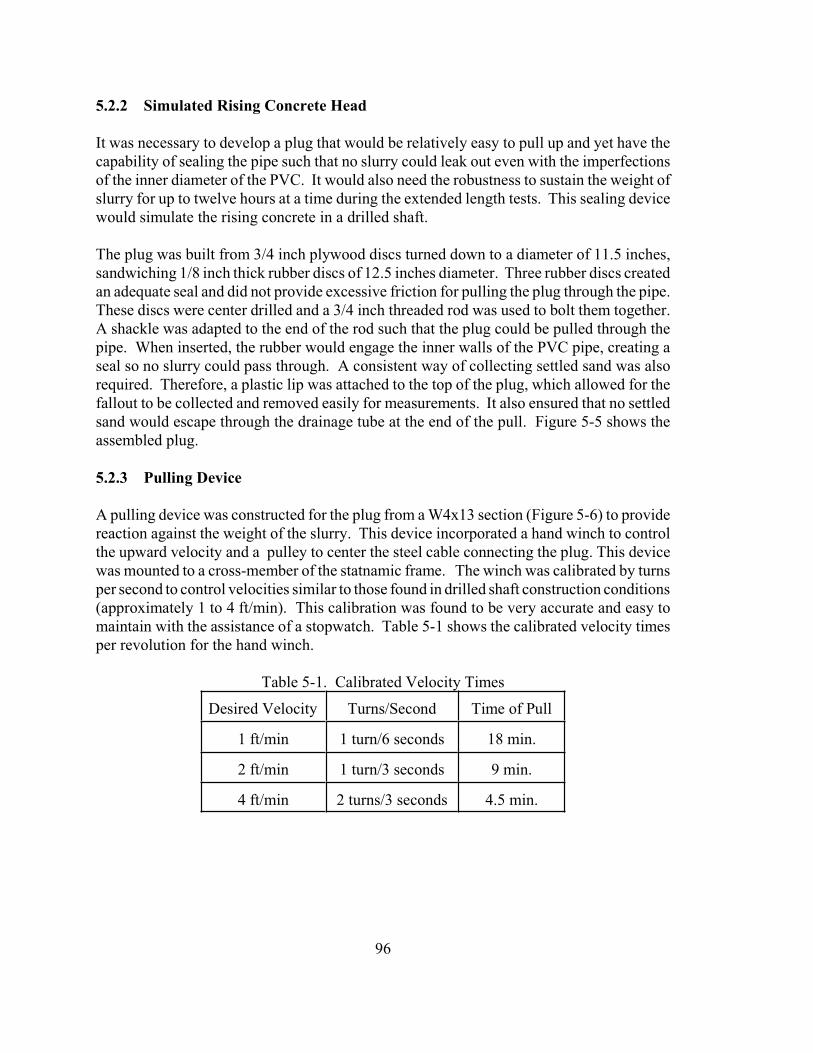
96
5.2.2 Simulated Rising Concrete Head
It was necessary to develop a plug that would be relatively easy to pull up and yet have thecapability of sealing the pipe such that no slurry could leak out even with the imperfectionsof the inner diameter of the PVC. It would also need the robustness to sustain the weight ofslurry for up to twelve hours at a time during the extended length tests. This sealing devicewould simulate the rising concrete in a drilled shaft.
The plug was built from 3/4 inch plywood discs turned down to a diameter of 11.5 inches,sandwiching 1/8 inch thick rubber discs of 12.5 inches diameter. Three rubber discs createdan adequate seal and did not provide excessive friction for pulling the plug through the pipe.These discs were center drilled and a 3/4 inch threaded rod was used to bolt them together.A shackle was adapted to the end of the rod such that the plug could be pulled through thepipe. When inserted, the rubber would engage the inner walls of the PVC pipe, creating aseal so no slurry could pass through. A consistent way of collecting settled sand was alsorequired. Therefore, a plastic lip was attached to the top of the plug, which allowed for thefallout to be collected and removed easily for measurements. It also ensured that no settledsand would escape through the drainage tube at the end of the pull. Figure 5-5 shows theassembled plug.
5.2.3 Pulling Device
A pulling device was constructed for the plug from a W4x13 section (Figure 5-6) to providereaction against the weight of the slurry. This device incorporated a hand winch to controlthe upward velocity and a pulley to center the steel cable connecting the plug. This devicewas mounted to a cross-member of the statnamic frame. The winch was calibrated by turnsper second to control velocities similar to those found in drilled shaft construction conditions(approximately 1 to 4 ft/min). This calibration was found to be very accurate and easy tomaintain with the assistance of a stopwatch. Table 5-1 shows the calibrated velocity timesper revolution for the hand winch.
Table 5-1. Calibrated Velocity Times
Desired Velocity Turns/Second Time of Pull
1 ft/min 1 turn/6 seconds 18 min.
2 ft/min 1 turn/3 seconds 9 min.
4 ft/min 2 turns/3 seconds 4.5 min.

97
5.2.4 Storage/Mixing System
Instead of drill auger mixing or a slurry gun, an innovative device called a Hootanany(Figure 5-7) was used to introduce dry bentonite into the slurry. The Hootanany uses venturiinduced vacuum to draw dry bentonite through a tube and into the top of the device. Thesuction is created by water or previously mixed slurry, under pressure of approximately 20psi, that is pumped into the body of the device. The pressure causes a violent mixing ofbentonite particles with the water. This device ensures complete mixing of the bentonitepowder. After extended use, there was no evidence of agglomeration of dry bentonite in theslurry tank.
The slurry was stored directly below the pipe in a 200 gallon plastic tank (Figure 5-8). Thistank was covered between test runs for protection from environmental elements (i.e. rain).This helped ensure that the slurry mix stayed consistent from test to test. Before introductioninto the shaft, the slurry was mixed and various tests were run to ensure proper slurryproperties. A powerful mixing device was required to reintroduce sand that had settledduring storage into the slurry mix. Such a device was designed and fabricated consisting ofa ½ horsepower electric motor driving a shaft connected to a 5 blade fan placed deep intothe slurry tank (Figure 5-9). This system was very effective in re-circulating the settled sandand suspending the sand in the slurry (Figure 5-10). This system proved to be the mostefficient mixing system and allowed for the most consistent slurry properties to be obtained.The pumping of the slurry was accomplished using a helical pump mounted on a FDOT drillrig (Figure 5-11).
5.3 Slurry/Sand Fallout Test Program Overview
The apparent variables that influence sand settlement were the reasons the concrete poursimulator was built. The testing matrix was tailored to simulate the wide variety ofconditions that can be encountered in drilled shaft construction. Its aim was to seek howchanging each condition would affect the slurry and sand suspension. A construction testmatrix was established that targeted the three main parameters: velocity, wait time, andslurry properties.
(1) Upward velocity of rising concrete was a concern for both the field and lab aspectsof this study. Since a head differential was observed, it was desired to discover ifsand accumulation could be minimized with faster concrete pours (less wait time).Upward concrete surface velocities, based upon collected field data, ranged between1 and 4 ft/min. The velocity is dictated by the diameter of the drilled shaft and theconcrete flow rate. Concrete flow rate was in turn affected by method of pour (e.g.bucket or pump).
(2) The wait time of a slurry supported borehole is defined as the time taken between thecompletion of drilling and concreting of the shaft. It is obviously ideal to pour theconcrete directly after the drilling and de-sanding is complete, however, it is entirely
98
possible for the concrete to arrive later for a variety of logistical reasons. It is alsocommon for the contractor to separate drilling and concreting to different days. Ifthis is the case, it is possible to have slurry supported excavations left openovernight.
The most obvious effect of wait time is the settlement of suspended sand in the slurrymixture. An aim of this study was to survey a wide array of wait times in order toexamine the settlement behavior. Wait times up to twelve hours were tested.
(3) Also, it was desired to see how different slurry properties would affect the sandaccumulation phenomenon. It was originally assumed that altering the volumetricsand content independently of slurry viscosity and density would be adequate froma research standpoint. However, after initial tests and the literature review, it wasfound that these three primary characteristics of slurry (density, viscosity, and sandcontent) are quite dependent on each other.
If correlation between slurry properties and sand settlement could be found, it wouldbe easy to establish criteria for contractors to use that dictates if the need to clean outthe borehole before concreting exists.
Figure 5-12 gives a representation of the original testing matrix. Sand contents tested were1%, 2%, 4% and 8%. This range would give researchers adequate information outside theparameters of the current FDOT specifications.
5.4 Sand Fallout Testing Procedure
In order to ensure the consistency of test results, a standard procedure was established to usethe concrete pour simulator. The first step in the process was to ensure the quality of theslurry. Standard density, Marsh cone viscosity, and sand content tests were run to ensuredesired slurry properties. The plug was then inserted to the bottom of the shaft and the shaftwas filled with slurry shortly after final mixing. Once the shaft was filled, the pumpcontinued to circulate slurry for approximately 5 minutes. The wait time began as soon asthis mixing ceased and the slurry in the shaft was isolated. After the wait period, the plugwas pulled up by turning the winch at the appropriate velocity (Table 5-1) and sandaccumulation on the surface of the plug was collected at the top of the column. Theaccumulation often contains some amount of bentonite, so the collected material was passedthrough a No. 200 sieve and placed in an oven overnight to dry. The dried material wasweighed and counted as sand accumulation.
5.5 Fallout Testing Results
The sand fallout testing was run in geometrically progressive steps from 1% to 8% sandcontent. The following sections discuss the results from each sand content testing.
99
5.5.1 1% Sand Content
The first full battery of tests were run with 1% sand content slurry with propertiesapproximately in the mid-range of the FDOT specifications. Figure 5-13 shows theaccumulation of sand for the array of velocities and wait times. As can be seen, the scatterdata does not suggest any logical trends. This series of data prompted researchers to revisethe data collection technique. It was assumed that some accumulated sand was exitingthrough the drainage pipe at the end of the pull or collecting in the rubber seals. A plasticlip was devised to ensure sand fallout would be caught more reproducibly. Unfortunately,further testing with the new plug design did not display any trends.
5.5.2 2% Sand Content
The first series of tests used slurry properties similar to those in the 1% sand content tests.Once again, the results of these tests were unintelligible. The bentonite content of the slurrywas raised, which subsequently led to the increase of density and viscosity to the upper endof the FDOT specifications. This caused an apparent difference in the sand accumulation.Various 2% tests are documented in Figure 5-14. As can be seen, the higher viscosity,approximately 40 second Marsh Cone, creates a slurry mix where much less fallout wasobtained as opposed to the tests run with 34 second Marsh Cone viscosities. This prompteda continuance with high viscosity slurry. Figure 5-15 shows the accumulation results of thenew testing. The data with thoroughly mixed slurry indicates accumulation increases withwait time.
5.5.3 4% Sand Content
The accumulation testing was continued on slurry with similar properties from the final 2%testing. The density of this slurry was slightly increased due to the extra weight of the sand.A similar pattern of accumulation with respect to wait time was expected. However, Figure5-16 suggests that wait time had no substantial effects on accumulation. This trend can beexplained by the gelling behavior of bentonite slurry. After a certain time period (1-2hours), slurry particles bond due to opposing charges which is able to suspend sandindefinitely (Reese and Tucker, 1985).
5.5.4 8% Sand Content
In an effort to examine beyond the FDOT specifications, sand content was increased to 8%.The slurry properties were maintained with the exception of density which was again slightlyincreased due to additional weight of sand. In an effort to catch all of the accumulated sand,a deeper lip was constructed and mounted to the top of the plug. This deemed useful as theamount of sand would have overflown the original lip. Figure 5-17 shows accumulation thatis roughly double of the 4% sand content tests. It is also apparent that accumulationincreases slightly with wait times, however it is fairly insignificant compared to immediateaccumulation.
100
5.6 Sieve Analysis of Fallout Sand
A sieve analysis was conducted on the dried accumulated material to determine the patternof grain sizes which settled out. It was assumed that coarse grains would fall out quickly,followed by finer grains over the period of the higher wait time tests. Figure 5-18 displaysthe results of the sieve analyses for the 4% sand content tests compared against the materialadded to the slurry. It is apparent that increasing wait time facilitates increased fallout ofalmost all grain sizes. For No. 16 (1.18 mm) and larger, virtually all grains settled out after4 hours. For grains as small as No. 100 (0.150 mm), increasing wait time increases falloutup to about 4 hours. It can be seen that for materials as fine as No. 200 (0.075 mm), minimalincrease occurs which suggests fines may remain suspended indefinitely.
Figure 5-19 shows the weight retained of each grain size versus sieve opening for the 4%sand content tests. Also included is the grain size analysis of the total amount of sand in thecolumn. This graph gives an indication of the fallout particles relative to the total sand inthe slurry column. It is easy to see that the coarser grained particles falling out in a higherproportion to the finer material.
Figure 5-20 shows all the 1, 2, 4, and 8% tests combined. A clear trend of increased fallout(in lbs) is observed with increased sand content.
5.7 Effect of Sand Accumulation
The graphs of the accumulated material mentioned earlier in this chapter use oven-driedweights of accumulation to graph against wait time. This was done to maintain consistencyof results, but this data requires some regression to estimate fallout in commerciallyconstructed drilled shafts. Since sand is suspended in a slurry solution, the resulting relativedensity would be very low. Hence, a bulk density was estimated using the weight of dryaccumulation and the average depth of accumulation in the plug.
Using the calibrated bulk density, Figure 5-21 shows the sand fallout as a percentage of totalsand in the slurry column. It is apparent that as sand content increased in the slurry, thepercentage of fallout did as well. It can also be noted that for sand contents of 4% or higher,wait time becames a smaller factor. This suggests that slurry mixed within FDOTspecifications will settle out most material within 2 hours.
Figures 5-22 through 5-24 show predicted volume and height of sand fallout for drilledshafts with various diameters and depths at the FDOT maximum limit of 4% sand content.Sand accumulation can clearly be seen to have a greater effect on deeper shafts. Paired withthe effects of tremie-placed concrete desegregating immediately after charging, thisaccumulation can have a substantial effect on the formation of toe inclusions.
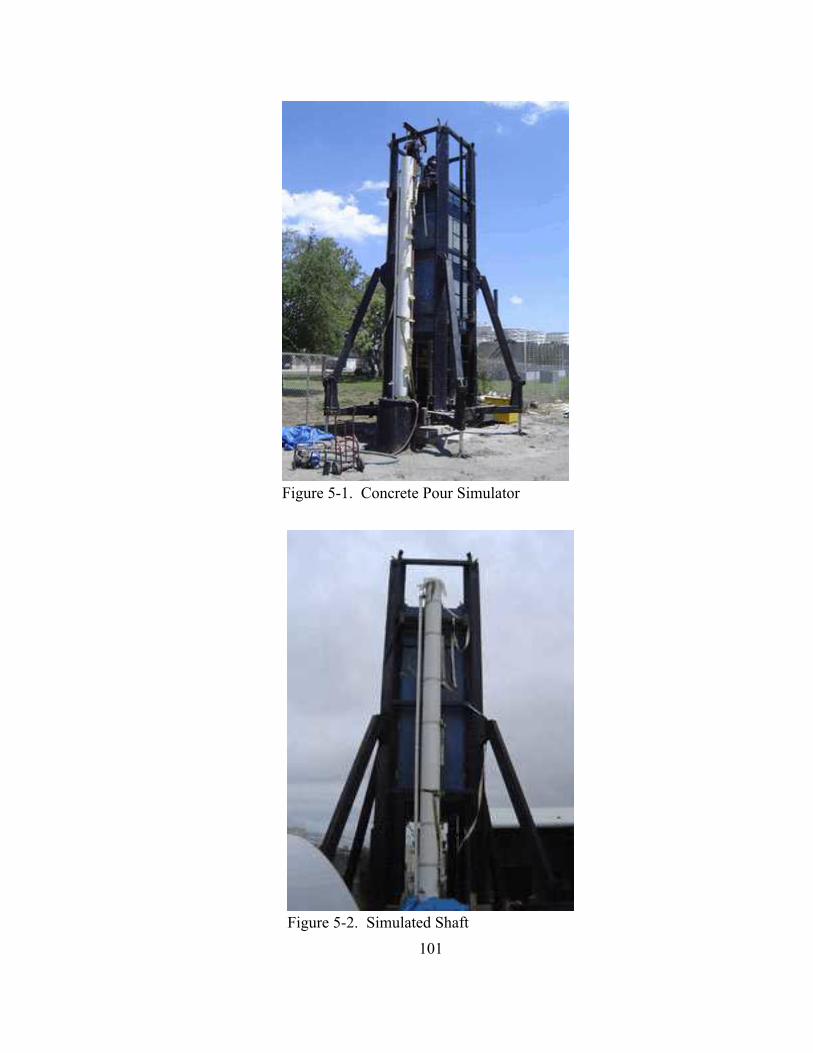
101
Figure 5-1. Concrete Pour Simulator
Figure 5-2. Simulated Shaft

102
Figure 5-3. Intake Fitting
Figure 5-4. Drainage Plumbing

103
Figure 5-5. Sealing Device (Simulated top ofConcrete)
Figure 5-6. Pulling Device

104
Figure 5-7. Hootonany Mixer
Figure 5-8. Slurry Tank

105
Figure 5-9. Slurry Mixing Device
Figure 5-10. Mixing Slurry with Device

106
Figure 5-11. FDOT Drill Rig Pump
Figure 5-12. Text Matrix Flowchart

107
Figure 5-13. Accumulation for 1% Sand Content Tests
Figure 5-14. Accumulation for Initial 2% Sand Content Tests

108
Figure 5-15. Accumulation for Refined 2% Sand Content Tests
Figure 5-16. Accumulation for 4% Sand Content Tests

109
Figure 5-17. Accumulation for 8% Sand Content Tests
Figure 5-18. Sieve Analysis for 4% Sand Content Accumulation and PitSand

110
Figure 5-19. Weight Retained versus Sieve Opening for 4% Sand Content
Figure 5-20. Sand Fallout as Percentage of Total Sand in Column

111
Figure 5-22. Total Volume of Sand for Various Diameter Drilled Shafts at4% Sand Content
Figure 5-21. Summary of Sand Accumulation of All Sand Contents
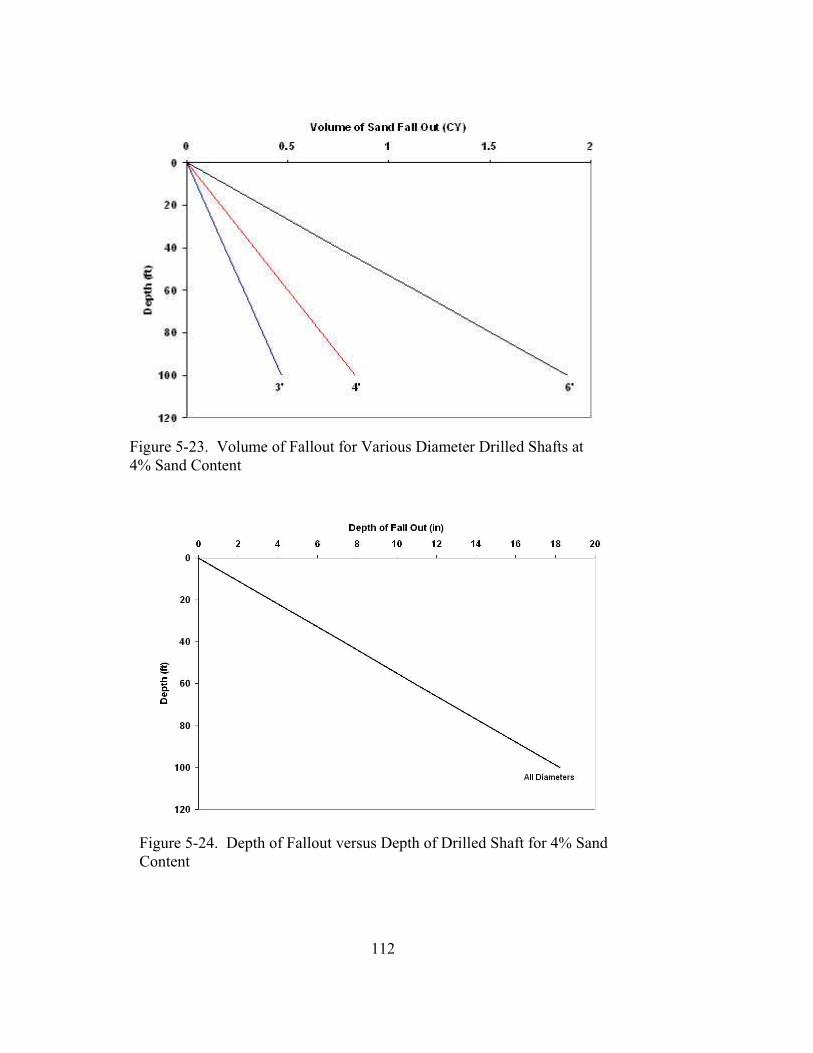
112
Figure 5-23. Volume of Fallout for Various Diameter Drilled Shafts at4% Sand Content
Figure 5-24. Depth of Fallout versus Depth of Drilled Shaft for 4% SandContent
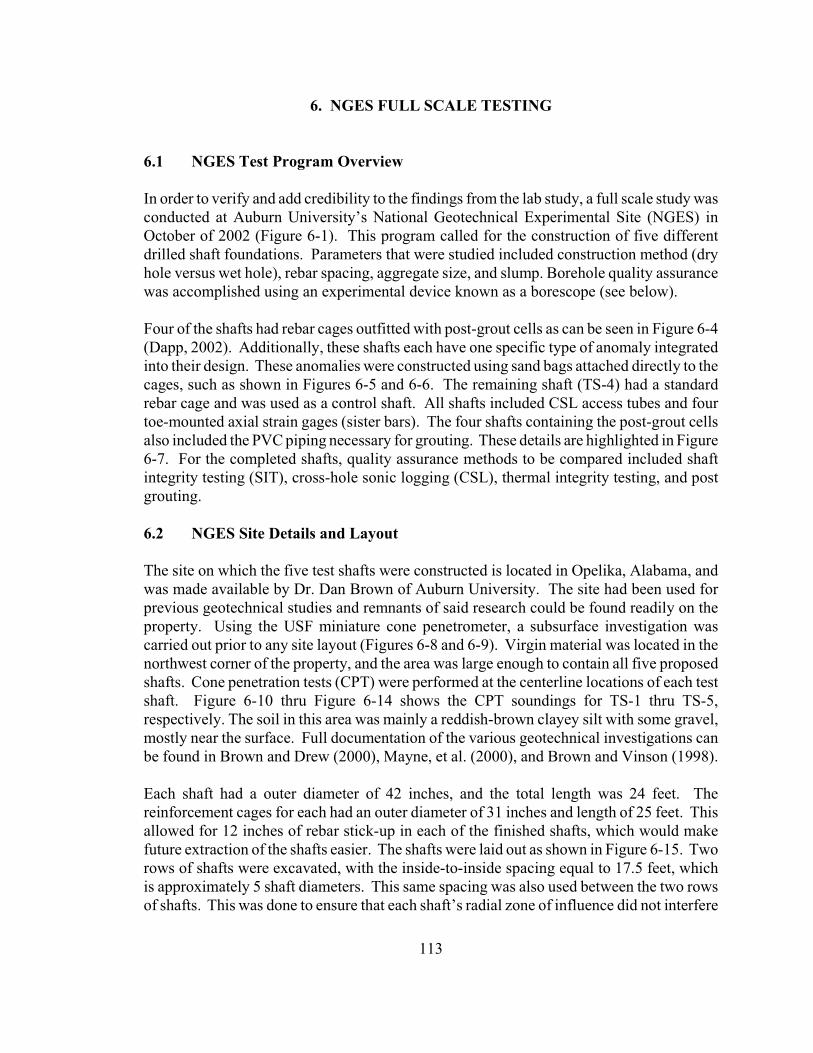
113
6. NGES FULL SCALE TESTING
6.1 NGES Test Program Overview
In order to verify and add credibility to the findings from the lab study, a full scale study wasconducted at Auburn University’s National Geotechnical Experimental Site (NGES) inOctober of 2002 (Figure 6-1). This program called for the construction of five differentdrilled shaft foundations. Parameters that were studied included construction method (dryhole versus wet hole), rebar spacing, aggregate size, and slump. Borehole quality assurancewas accomplished using an experimental device known as a borescope (see below).
Four of the shafts had rebar cages outfitted with post-grout cells as can be seen in Figure 6-4(Dapp, 2002). Additionally, these shafts each have one specific type of anomaly integratedinto their design. These anomalies were constructed using sand bags attached directly to thecages, such as shown in Figures 6-5 and 6-6. The remaining shaft (TS-4) had a standardrebar cage and was used as a control shaft. All shafts included CSL access tubes and fourtoe-mounted axial strain gages (sister bars). The four shafts containing the post-grout cellsalso included the PVC piping necessary for grouting. These details are highlighted in Figure6-7. For the completed shafts, quality assurance methods to be compared included shaftintegrity testing (SIT), cross-hole sonic logging (CSL), thermal integrity testing, and postgrouting.
6.2 NGES Site Details and Layout
The site on which the five test shafts were constructed is located in Opelika, Alabama, andwas made available by Dr. Dan Brown of Auburn University. The site had been used forprevious geotechnical studies and remnants of said research could be found readily on theproperty. Using the USF miniature cone penetrometer, a subsurface investigation wascarried out prior to any site layout (Figures 6-8 and 6-9). Virgin material was located in thenorthwest corner of the property, and the area was large enough to contain all five proposedshafts. Cone penetration tests (CPT) were performed at the centerline locations of each testshaft. Figure 6-10 thru Figure 6-14 shows the CPT soundings for TS-1 thru TS-5,respectively. The soil in this area was mainly a reddish-brown clayey silt with some gravel,mostly near the surface. Full documentation of the various geotechnical investigations canbe found in Brown and Drew (2000), Mayne, et al. (2000), and Brown and Vinson (1998).
Each shaft had a outer diameter of 42 inches, and the total length was 24 feet. Thereinforcement cages for each had an outer diameter of 31 inches and length of 25 feet. Thisallowed for 12 inches of rebar stick-up in each of the finished shafts, which would makefuture extraction of the shafts easier. The shafts were laid out as shown in Figure 6-15. Tworows of shafts were excavated, with the inside-to-inside spacing equal to 17.5 feet, whichis approximately 5 shaft diameters. This same spacing was also used between the two rowsof shafts. This was done to ensure that each shaft’s radial zone of influence did not interfere
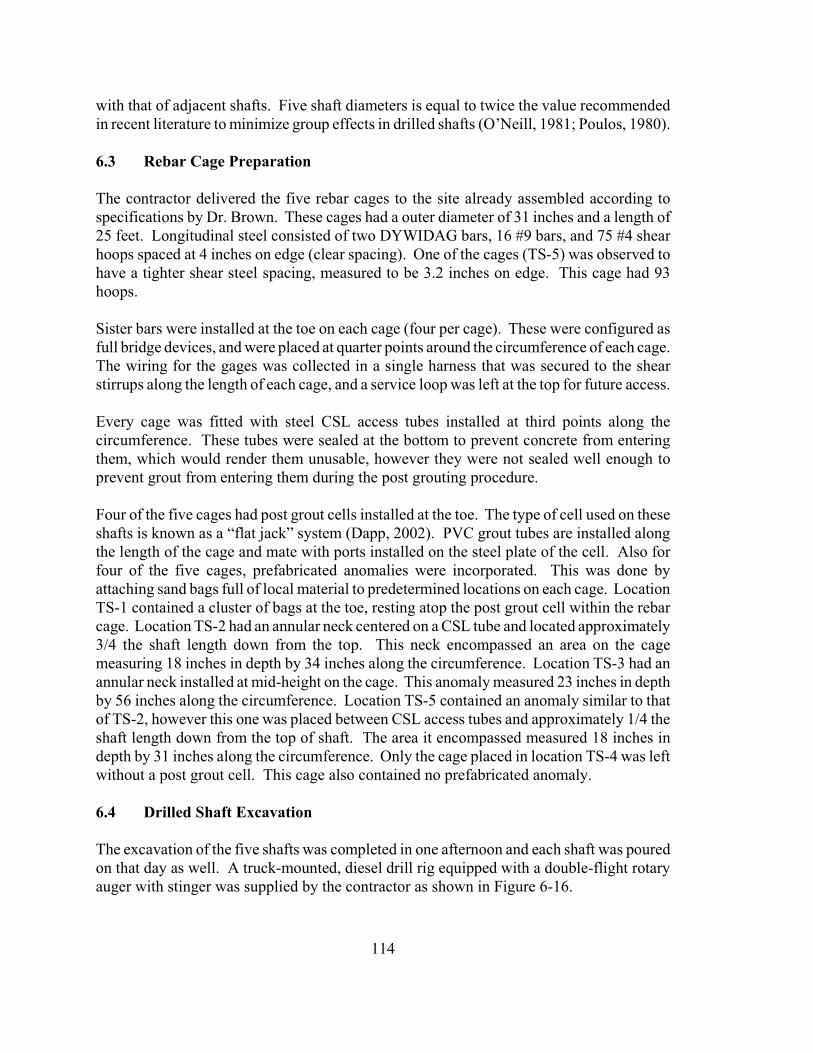
114
with that of adjacent shafts. Five shaft diameters is equal to twice the value recommendedin recent literature to minimize group effects in drilled shafts (O’Neill, 1981; Poulos, 1980).
6.3 Rebar Cage Preparation
The contractor delivered the five rebar cages to the site already assembled according tospecifications by Dr. Brown. These cages had a outer diameter of 31 inches and a length of25 feet. Longitudinal steel consisted of two DYWIDAG bars, 16 #9 bars, and 75 #4 shearhoops spaced at 4 inches on edge (clear spacing). One of the cages (TS-5) was observed tohave a tighter shear steel spacing, measured to be 3.2 inches on edge. This cage had 93hoops.
Sister bars were installed at the toe on each cage (four per cage). These were configured asfull bridge devices, and were placed at quarter points around the circumference of each cage.The wiring for the gages was collected in a single harness that was secured to the shearstirrups along the length of each cage, and a service loop was left at the top for future access.
Every cage was fitted with steel CSL access tubes installed at third points along thecircumference. These tubes were sealed at the bottom to prevent concrete from enteringthem, which would render them unusable, however they were not sealed well enough toprevent grout from entering them during the post grouting procedure.
Four of the five cages had post grout cells installed at the toe. The type of cell used on theseshafts is known as a “flat jack” system (Dapp, 2002). PVC grout tubes are installed alongthe length of the cage and mate with ports installed on the steel plate of the cell. Also forfour of the five cages, prefabricated anomalies were incorporated. This was done byattaching sand bags full of local material to predetermined locations on each cage. LocationTS-1 contained a cluster of bags at the toe, resting atop the post grout cell within the rebarcage. Location TS-2 had an annular neck centered on a CSL tube and located approximately3/4 the shaft length down from the top. This neck encompassed an area on the cagemeasuring 18 inches in depth by 34 inches along the circumference. Location TS-3 had anannular neck installed at mid-height on the cage. This anomaly measured 23 inches in depthby 56 inches along the circumference. Location TS-5 contained an anomaly similar to thatof TS-2, however this one was placed between CSL access tubes and approximately 1/4 theshaft length down from the top of shaft. The area it encompassed measured 18 inches indepth by 31 inches along the circumference. Only the cage placed in location TS-4 was leftwithout a post grout cell. This cage also contained no prefabricated anomaly.
6.4 Drilled Shaft Excavation
The excavation of the five shafts was completed in one afternoon and each shaft was pouredon that day as well. A truck-mounted, diesel drill rig equipped with a double-flight rotaryauger with stinger was supplied by the contractor as shown in Figure 6-16.

115
Each of the five shafts was excavated in dry conditions with no casing. This was appropriatebecause the soil was non-caving and the water table was below the proposed bottomelevation of the borehole (Figure 6-17). Because of this, drilling proceeded quickly and eachexcavation was finished in approximately 30 minutes. Also, the clean-out bucket was notused because there was little loose material left at the bottom of the excavation once augerdrilling was complete. This was verified using the borescope.
As noted, the water table was below the bottom elevation of each excavation, so the holesremained relatively dry. It was desired to construct the control shaft using tremie placedconcrete poured under water. Therefore, the excavation denoted TS-4 was filled with waterprior to placing the rebar cage. This was performed using water stored in a tank onsite.After the hole was filled with water, the borescope was again used to verify the final qualityof the excavation before placement of the rebar cage.
6.5 Mix Specifications
Several different concrete mix designs were used in this study. The first two shafts pouredused a standard portland cement concrete with #57 angular stone (maximum aggregate sizeof 1 inch). These two mixes were identical except for the slump. One of the mixes wasrequired to have a slump of 8 to 9 inches, while the other needed a slump of 5 to 7 inches.FDOT recommends a slump of 7 to 9 inches for all drilled shafts constructed using thetremie placed method, so this governed the selection of slumps for the test mixes.
One shaft was constructed using a standard Portland cement concrete and #7 river rock. Thisparticular aggregate is rounded and has a maximum aggregate size of ½ inch. Number 7stone is not typically used on FDOT drilled shaft projects. However, it was anticipated thatthis mix design should perform much better than the #57 stone mix in terms of tremieplacement and flowability.
The remaining two shafts, one of which was the control shaft constructed under water, useda mix known as a “Self Compacting Concrete” (SCC). This mix design is a very fluid, highslump (>10 inches) material that is designed to exhibit very favorable flow characteristicseven in the presence of tight rebar spacing. Because of this, a different assessment ofworkability is normally used with a SCC mix. The apparatus, pictured in Figures 6-18 and6-19, measures the flow of the material through a series of rebar sections. Detailedinformation regarding this method of testing can be found in literature by Hodgsen (2003)at Auburn University.
SCC mixes generally have higher cementitious contents and higher fines, with lower waterto cement ratios and high dosages of high range water reducers (W.R. Grace, 2003). Thefirst SCC mix was modified at the site by the addition of Glenium 3000NS to reach therequired slump. This delayed addition of the high range water reducer could be responsiblefor different characteristics between the mixes for TS-4 and TS-5. Of other significance isthe high water to cementitious ratio. Generally SCC mix have lower water to cementitious
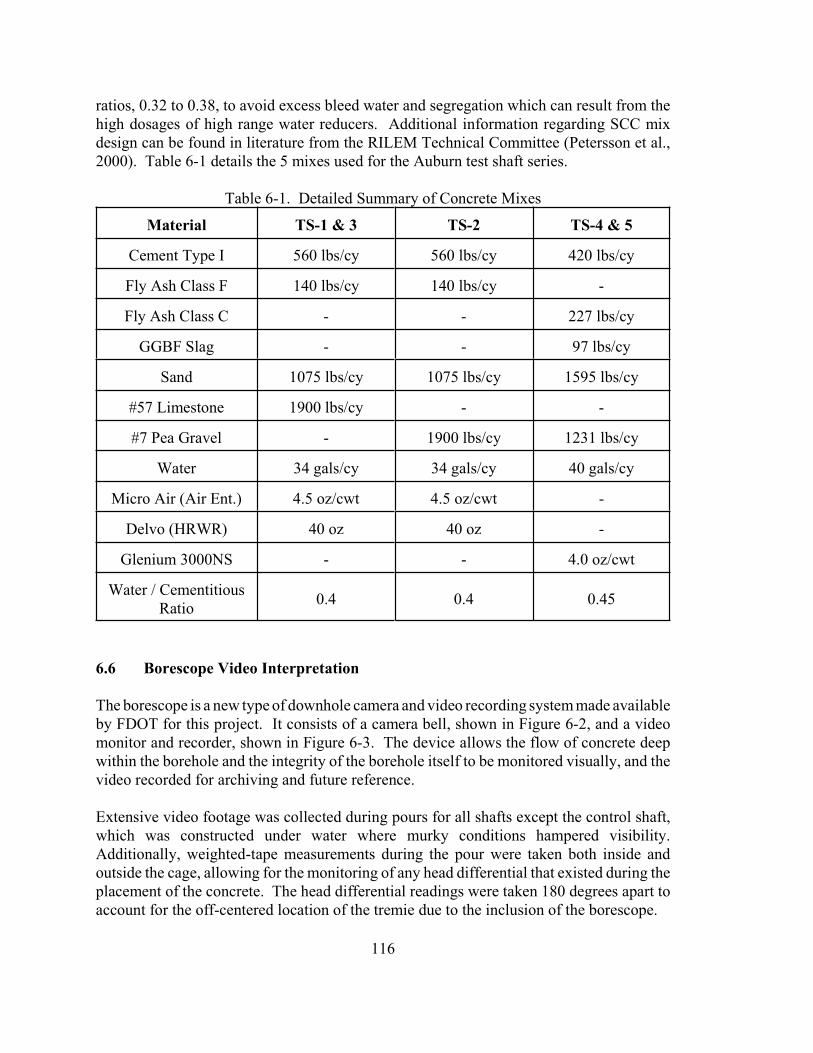
116
ratios, 0.32 to 0.38, to avoid excess bleed water and segregation which can result from thehigh dosages of high range water reducers. Additional information regarding SCC mixdesign can be found in literature from the RILEM Technical Committee (Petersson et al.,2000). Table 6-1 details the 5 mixes used for the Auburn test shaft series.
Table 6-1. Detailed Summary of Concrete Mixes
Material TS-1 & 3 TS-2 TS-4 & 5
Cement Type I 560 lbs/cy 560 lbs/cy 420 lbs/cy
Fly Ash Class F 140 lbs/cy 140 lbs/cy -
Fly Ash Class C - - 227 lbs/cy
GGBF Slag - - 97 lbs/cy
Sand 1075 lbs/cy 1075 lbs/cy 1595 lbs/cy
#57 Limestone 1900 lbs/cy - -
#7 Pea Gravel - 1900 lbs/cy 1231 lbs/cy
Water 34 gals/cy 34 gals/cy 40 gals/cy
Micro Air (Air Ent.) 4.5 oz/cwt 4.5 oz/cwt -
Delvo (HRWR) 40 oz 40 oz -
Glenium 3000NS - - 4.0 oz/cwt
Water / CementitiousRatio
0.4 0.4 0.45
6.6 Borescope Video Interpretation
The borescope is a new type of downhole camera and video recording system made availableby FDOT for this project. It consists of a camera bell, shown in Figure 6-2, and a videomonitor and recorder, shown in Figure 6-3. The device allows the flow of concrete deepwithin the borehole and the integrity of the borehole itself to be monitored visually, and thevideo recorded for archiving and future reference.
Extensive video footage was collected during pours for all shafts except the control shaft,which was constructed under water where murky conditions hampered visibility.Additionally, weighted-tape measurements during the pour were taken both inside andoutside the cage, allowing for the monitoring of any head differential that existed during theplacement of the concrete. The head differential readings were taken 180 degrees apart toaccount for the off-centered location of the tremie due to the inclusion of the borescope.

117
Shaft TS-1. As with all the following shafts, borescope video of the bottom of theexcavation just prior to pouring shows some minor inflow of water and a muddy bottom.Overall the quality of the excavation was acceptable, as can be seen in Figures 6-20 and 6-21. The borehole was stable and the toe was reasonably clean. The toe-mounted sandbagsjust above the post grout cell are visible in Figure 6-22.
The borescope video quality for this first shaft was poor, but still useful. It is apparent thatthe large aggregate size (up to 1 inch diameter) does have an adverse effect on theflowability of the material in the hole. Figures 6-23 through 6-25 show some of the detailof the flow that occurred during this pour. The material leaving the tremie tends to build upon the inside of the cage. Along the tremie, the movement of the concrete is slowed by thefriction that develops. Along the inside of the rebar cage, concrete flow is again impededby friction, and radial flow is impeded due to the low CSD ratio of 4. These conditionsmanifest themselves in the arched surface that is visible in the video. Meanwhile, thematerial on the outside of the cage is maintained at a much lower level. Evident in Figures6-24 and 6-25, the concrete inside the cage simply builds up until some critical differentialis reached, and then it sloughs to the outside of the cage. Larger particles remain on theinside of the cage particularly concentrated around rebar, and more of the water and finesflow through the reinforcement. This action is observed even though the material is pouredat the high end of the FDOT slump guidelines, again reinforcing the notion that CSD hasmuch more of an impact on flow in the borehole than does slump. The measured headdifferential reached values of 6 to 10 inches during this pour.
Shaft TS-2. For this cage and mix configuration the CSD increased to 8. The clear spacingdid not change, but the smaller maximum aggregate size increased the CSD. According towhat was observed in the LPC testing program, this alone should result in a much moreuniform flow with lower head differentials and higher consistency of the material on theinside and outside of the cage.
From the early stages of this pour, as shown in Figure 6-26, the material flowed in a moreconsistent manner with little visible segregation of the material within the inner cage area.Further observation of the video footage shows that the flow of material from the tremie intothe borehole is markedly different than that observed with the #57 stone mixes. Instead ofthe material arching up between the tremie wall and the inside of the cage, and thensloughing to the outer cage area, the material inside the cage rises in a much more uniformmanner across its surface. This can be seen in Figures 6-27 through 6-29. This wascharacteristic of the entire pour for this shaft, and as expected, much lower differentials ofonly 3 to 5 inches were recorded.
Shaft TS-3. For this cage and mix configuration, the CSD was again about 4. Overall, theflow characteristics evident in the borescope video are similar to those seen in the TS-1 pourand are consistent with expectations derived from LPC testing in the lab. The decrease inslump, however, adds to the uncertainty already present in the flow.
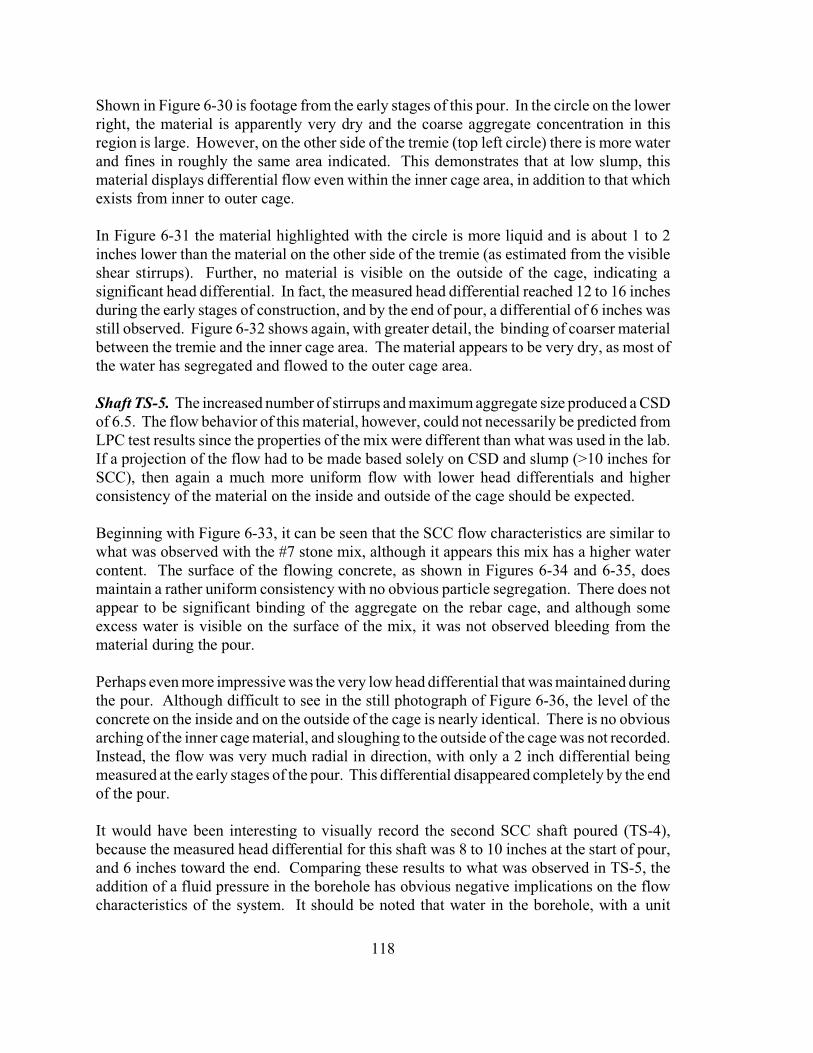
118
Shown in Figure 6-30 is footage from the early stages of this pour. In the circle on the lowerright, the material is apparently very dry and the coarse aggregate concentration in thisregion is large. However, on the other side of the tremie (top left circle) there is more waterand fines in roughly the same area indicated. This demonstrates that at low slump, thismaterial displays differential flow even within the inner cage area, in addition to that whichexists from inner to outer cage.
In Figure 6-31 the material highlighted with the circle is more liquid and is about 1 to 2inches lower than the material on the other side of the tremie (as estimated from the visibleshear stirrups). Further, no material is visible on the outside of the cage, indicating asignificant head differential. In fact, the measured head differential reached 12 to 16 inchesduring the early stages of construction, and by the end of pour, a differential of 6 inches wasstill observed. Figure 6-32 shows again, with greater detail, the binding of coarser materialbetween the tremie and the inner cage area. The material appears to be very dry, as most ofthe water has segregated and flowed to the outer cage area.
Shaft TS-5. The increased number of stirrups and maximum aggregate size produced a CSDof 6.5. The flow behavior of this material, however, could not necessarily be predicted fromLPC test results since the properties of the mix were different than what was used in the lab.If a projection of the flow had to be made based solely on CSD and slump (>10 inches forSCC), then again a much more uniform flow with lower head differentials and higherconsistency of the material on the inside and outside of the cage should be expected.
Beginning with Figure 6-33, it can be seen that the SCC flow characteristics are similar towhat was observed with the #7 stone mix, although it appears this mix has a higher watercontent. The surface of the flowing concrete, as shown in Figures 6-34 and 6-35, doesmaintain a rather uniform consistency with no obvious particle segregation. There does notappear to be significant binding of the aggregate on the rebar cage, and although someexcess water is visible on the surface of the mix, it was not observed bleeding from thematerial during the pour.
Perhaps even more impressive was the very low head differential that was maintained duringthe pour. Although difficult to see in the still photograph of Figure 6-36, the level of theconcrete on the inside and on the outside of the cage is nearly identical. There is no obviousarching of the inner cage material, and sloughing to the outside of the cage was not recorded.Instead, the flow was very much radial in direction, with only a 2 inch differential beingmeasured at the early stages of the pour. This differential disappeared completely by the endof the pour.
It would have been interesting to visually record the second SCC shaft poured (TS-4),because the measured head differential for this shaft was 8 to 10 inches at the start of pour,and 6 inches toward the end. Comparing these results to what was observed in TS-5, theaddition of a fluid pressure in the borehole has obvious negative implications on the flowcharacteristics of the system. It should be noted that water in the borehole, with a unit

119
weight of only 62.4 pcf, has the lowest unit weight of the possible drilling fluids that couldbe present. Therefore, as slurries of increasing unit weight are introduced, and as CSDdecreases, much larger head differentials are possible, and have been observed. The possiblemagnitude of these differentials is on the order of several feet (Brown and Camp, 2002) asopposed to the 2 to 16 inches observed in the Auburn testing (Table 6-2).
Table 6-2. Summary of Differing Shaft Parameters and Associated Head Differentials
ShaftI.D.
Excavation Reinforcement
AnomalyLocation
(24 ftshaft)
ConcreteMix
Head Differential(in)
Start ofPour
End ofPour
TS-1 Dry Hole4" stirrup
spacing withCSD of 4
Toe
#57stone
with 8.5"slump
8 to 12 4 to 6
TS-2 Dry Hole4" stirrup
spacing withCSD of 8
3/4 pointfrom top
#7 stonewith8.75"slump
3 to 5 0
TS-3 Dry Hole4" stirrup
spacing withCSD of 4
Midpoint
#57stone
with 5.5"slump
12 to 16 6
TS-4 Wet Hole4" stirrup
spacing withCSD of 8
None
SCCwith24.5"slumpflow
8 to10 4 to 6
TS-5 Dry Hole3.25" stirrupspacing withCSD of 6.5
1/4 pointfrom top
SCCwith 24"slumpflow
2 0
6.7 Quality Assurance
The deliberate placement of anomalous regions within the shafts offered an opportunity tocompare different non-destructive quality assurance methods. Cross-hole Sonic Logging andThermal Integrity Testing were performed on each shaft shortly following construction.
120
Sonic Integrity Testing was also performed on each shaft during the curing of the shaft. Oncefully cured, the four shafts containing grout cells were tip-grouted while monitoring both thegrout pressure and upward displacement.
6.7.1 Cross-hole Sonic Logging
Cross-hole Sonic Logging readings for each shaft were taken at 12 hour intervals for twodays following shaft construction. The wave speed as a function of depth from the initialreading to the final cured reading of TS-3 (tubes A-B) can be seen in Figure 6-37. Thesignal does not show significant change from these readings. The results from TS-1 (Figure6-38) show a decreasing velocity from 23 to 24 feet. This indicates a less dense materialwithin this region (i.e. sand bags). Results from TS-2, TS-3, and TS-5 (Figures 6-39, 6-40,and 6-41, respectively) do not indicate the presence of anomalous regions in the test shafts.This is due to the fact that the included anomalies for these shafts are not arranged inside ofthe triangulated path between the 3 CSL tubes, but rather attached to the outside of the rebarcage. TS-4 (Figure 6-42) shows no significant change in velocity for all readings, althoughwhen excavated, TS-4 had a bullet shaped toe with CSL tubes exposed (Figure 6-43).
6.7.2 Thermal Integrity Testing
Thermal temperature readings were taken in the same fashion as CSL; however, the resultsproved more promising. Temperature soundings were taken in each of the three access tubesfor all 5 shafts roughly every 4-6 hours over a 2 day period. Figure 6-44 shows the layoutof TS-2 anomaly placement around the outside reinforcement cage at the third quarter point,and the recorded thermal data for access tube B, at about 24 hours after placement. Despitethe very high thermal conductivity of the steel CSL tubes, the thermal signal was repeatableand sensitive on the order of 0.1 F (see below).o
Shaft TS-2B. Thermal data taken from shaft TS-2B show the effects that boundaryconditions and diffusivity changes of various materials have on the heat flow regime of adrilled shaft. The data show sharply increasing temperature curves at the top of the shaft,with peak temperatures occurring at a depth of 7 to 8 feet. Below this depth temperatures aredecreasing somewhat steeply, with a flattening of the curves occurring around the shaftmidpoint. At 13 feet deep, a 6 inch pipe coupling induces a temperature increase on all thetraces, below which is the sandbag anomaly. Pipe coupling anomalies are identifiable in allshaft traces where a coupling exists. Below this point, the thermal signal decreases steeplyas some of the heat flow is diminished due to changing boundary conditions: increasing freewater in pore spaces in the capillary fringe (previously noted GWT below tip of shafts >24feet) and the end condition, requiring outward heat flow with both radial and verticalcomponents.
The anomaly at the third quarter point can be seen in all four traces at approximately 17 to22 feet, with the coolest temperature trace (outward-facing) showing the greatest anomaly.The base of the anomalous signal is clearly defined by the sharply increasing temperature

121
curve beginning at 20 feet, progressing toward the non-anomalous temperature. This upwardtemperature change occurs over approximately a 1 foot vertical span in which the purelyoutward radial heat flow of a cylinder is disrupted, adding a vertical component of heat flow.The placement of the sandbag adjacent to the coupling enhances the heat flow (vertically andradially) through the coupling and around the sandbag. This “heat channeling” effect mayraise the temperature above that of the neighboring material, which appears to contradictFourier’s Law Q = -k dT/dx (where k is the thermal conductivity), but which is only validin a constant-k domain.
Sensitivity and Noise. The manufacturer’s specification of the infrared thermocouple givesa repeatability error for any device without temperature control (viz., this design) of 1 to 2%of reading value, and for complete ambient temperature control an error of 0.01% of value.This is a large range of values, and an analysis of sampled signal and noise may moreaccurately place the expected values of error and signal/noise for this design.
Figure 6-45 shows the magnitude spectrum of the outward-facing sensor data from accesstube A of shaft TS-3, one sampling cycle after the data in Figure 6-46. Note that thisspectral peak at 0 Hz resides in the decade 100-1000 degrees, so that magnitude percentagescan be read approximately from the log plot. The plot was generated using 441 data fromthe trace TS-3A (outward), and was zero-padded to 512 points, and Fourier transformedusing the “boxcar” window only. Without any filter windows the boxcar will yield spectrathat are factorable into sinc functions, where sinc(x) = sin(x)/x, which produce the lobes seenthroughout the data. This effect itself introduces noise to the transformed data.
The data exhibit a 0.5dB amplitude falloff per wavenumber and a total drop of ~15dB forwavenumbers < 30. This spatial frequency (wavenumber = 30) represents a wavelength of8.8 inches, and it suggests that important information in the data can be restricted statisticallyto length scales larger than 8.8 inches. Also at this wavenumber, spectral magnitude fallbelow approximately 1% of the maximum value, the nominal signal error. The data “noise”appears to follow an exponential falloff (shown by the curve, Figure 6-45). The exceptionto this trend occurs at wavenumber equal to 62 to 65, which was in part masked by thelobular character of the data, but which clearly stands above the curve. These wavenumbershave equivalent wavelengths of 4.06 to 4.26 inches, indicating rebar signal in the data,which is concordant with the placement of circular hoop rebars at nominal 4 inch separations(although some cages had smaller clear spacings).
Figure 6-46 shows four “rebar-filtered” traces of shaft TS-3A and the unfiltered trace. Theunfiltered trace shows a strong heat transfer coupling between the circular rebar hoops andthe access tube nearby which the data was taken. Although the rebar “signals” are readilyapparent in the trace, their magnitude is <0.1% , higher than that of a temperature controlleddevice, but much less than expected in this device. This signal is sufficiently greater than thecombination of all sources of noise, including uncontrolled ambient temperature and those
122
introduced by poor data transformations (i.e., the un-windowed FFT). It should beconcluded that the sensitivity and signal/noise ratio have surpassed the predicted values forthis design.
6.7.3 Shaft Integrity Testing
The goal of this non-destructive testing was to detect the anomalous regions placed withinthe test shafts. SIT soundings were taken prior to post grouting, after load testing, and afterextraction. These readings were taken to show the additional affects of post grouting, loadtesting, and the influence of the surrounding soil. Figure 6-47 through 6-51 show the resultsfrom the SIT soundings prior to post grouting and after load testing for TS-1 through TS-5,respectively. The results show no significant change in the signal from the control shaft (TS-4) to the shafts with known anomalies. TS-1, TS-2, and TS-3 show a stronger toe reflectionafter grouting and load testing. Additional information on the effects of post grouting canbe found in Mullins and Winters (2004).
6.7.4 Post Grout
Post grouting was performed on four of the five test shafts (TS-1, TS-2, TS-3, and TS-5).Portland type I cement with a w/c ratio of 0.55 was pumped to the tip of each shaft. Figures6-52 through 6-54 show the grouting process and test setup. The specified upwarddisplacement was set at 2.5% the diameter (approximately 1 inch for the 42 inch diametershafts). The displacement and grout pressure were monitored during the grouting processwith LVDTs and a pressure transducer. The strains at the toe of the test shafts were alsomeasured by four resistive strain gages. The grout pressure versus displacement graphs forTS-1, TS-2, TS-3, and TS-5 are shown in Figures 6-55 through 6-58, respectively. The postgrouting results are summarized as follows:
• TS-1 maximum grout pressure of 82 psi and uplift of 0.105 inches.• TS-2 maximum grout pressure of 88 psi and uplift of 0.074 inches.• TS-3 maximum grout pressure of 100 psi and uplift of 0.132 inches.• TS-5 maximum grout pressure of 109 psi and uplift of 0.075 inches.
Figures 6-59 through 6-62 show the side shear results from grouting and downward loadtesting for each test shaft. In the case for TS-5, only grouting side shear is shown. Postgrouting in silty/clayey soils cannot fully verify the side shear capacity, but rather may onlybe able to proof test the shaft up to the ultimate capacity of the end bearing strata (Mullinsand Winters, 2004).
6.8 Statnamic Load Testing
Statnamic load testing was performed on all shafts using a 4 MN statnamic device, equippedwith the hydraulic catching mechanism (Figure 6-63). Two load cycles were performed oneach shaft; the target displacement was set at 2.5% the shaft diameter. The strain gages

123
located at the toe of each shaft made it possible to separate the applied load into side frictionand end bearing components. Side shear results from the first load cycles can be seen inFigure 6-64. The figure also shows the respective slumps for each test shaft. The resultsshow that within this test program the slump does not affect the side shear component. Thisis also noted in the LPC and FCV testing.
6.9 Core Sample Tests
After all load tests were completed, each shaft was exhumed by excavating the surroundingsoil (Figures 6-65) with the intent of a thorough dissection. A 4 inch and 2-2 inch diametercore samples were taken at 1/4, 1/2 and 3/4 points along each shaft (Figure 6-66) to providespecimens for permeability tests. It was ensured that each core was of sufficient depth toprovide specimen inside and outside the rebar cage. Also, each shaft was cross-cut using adiamond impregnated steel band (Figure 6-67). This allowed for visual inspection ofaggregate distribution.
6.9.1 Permeability
FDOT personnel conducted permeability tests on cores without reinforcements from all ofthe shafts using the Rapid Chloride Ion Penetration in accordance with ASTM C1202.Results from the permeability testing can be seen in Figure 6-68. The findings suggest thatthere is a negligible difference in the hydraulic conductivity between the inside and outsideof the rebar cage for shafts TS-1 through TS-3. However, a large disparity exists betweenthe inside and outside of the rebar cage for both SCC test shafts, TS-4 and TS-5.
6.9.2 Aggregate Distribution
The difference in coarse aggregate shape is easily identified when studying Figures 6-69through 6-74. The angular #57 stone used in shafts TS-1 and TS-3 contrasts with therounded, river rock (#7 stone) used in shafts TS-2, TS-4, and TS-5. This difference in shapeinfluenced the flow characteristics of each concrete mix. Figures 6-75 through 6-77 showsaw cuts of the test shafts. From these cross-sections and the cores, no aggregate segregationbetween the inside and outside of the rebar cage is discernable.
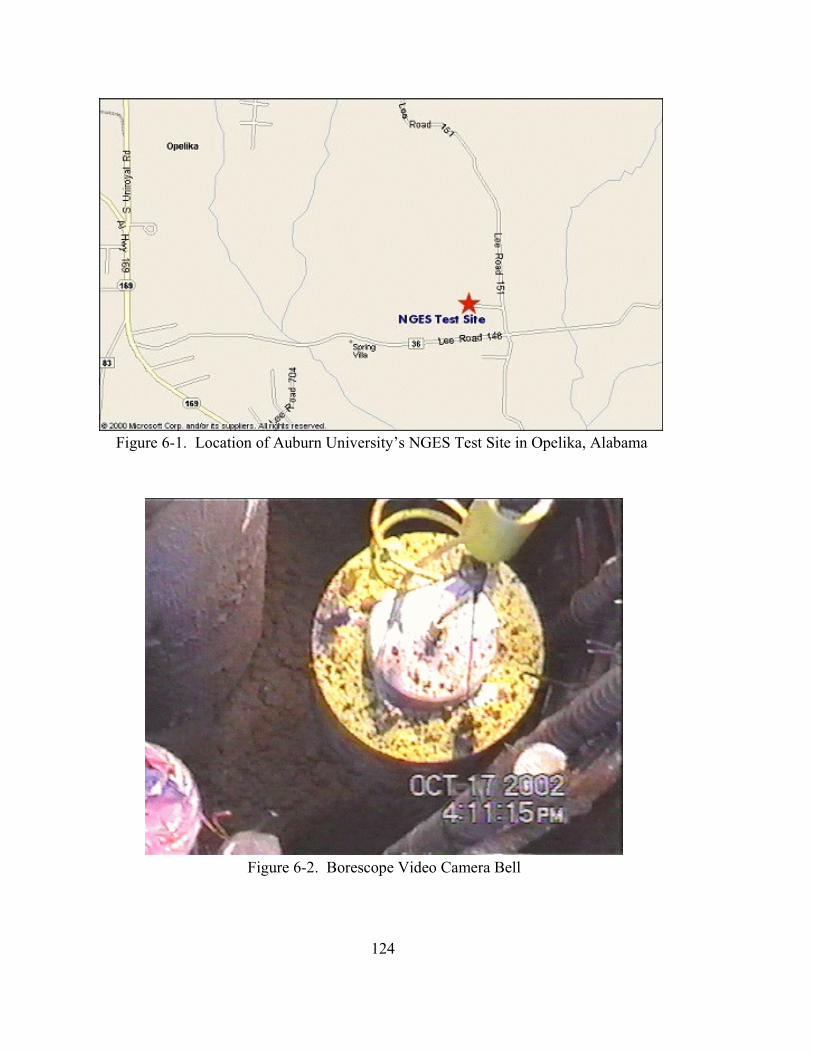
124
Figure 6-1. Location of Auburn University’s NGES Test Site in Opelika, Alabama
Figure 6-2. Borescope Video Camera Bell
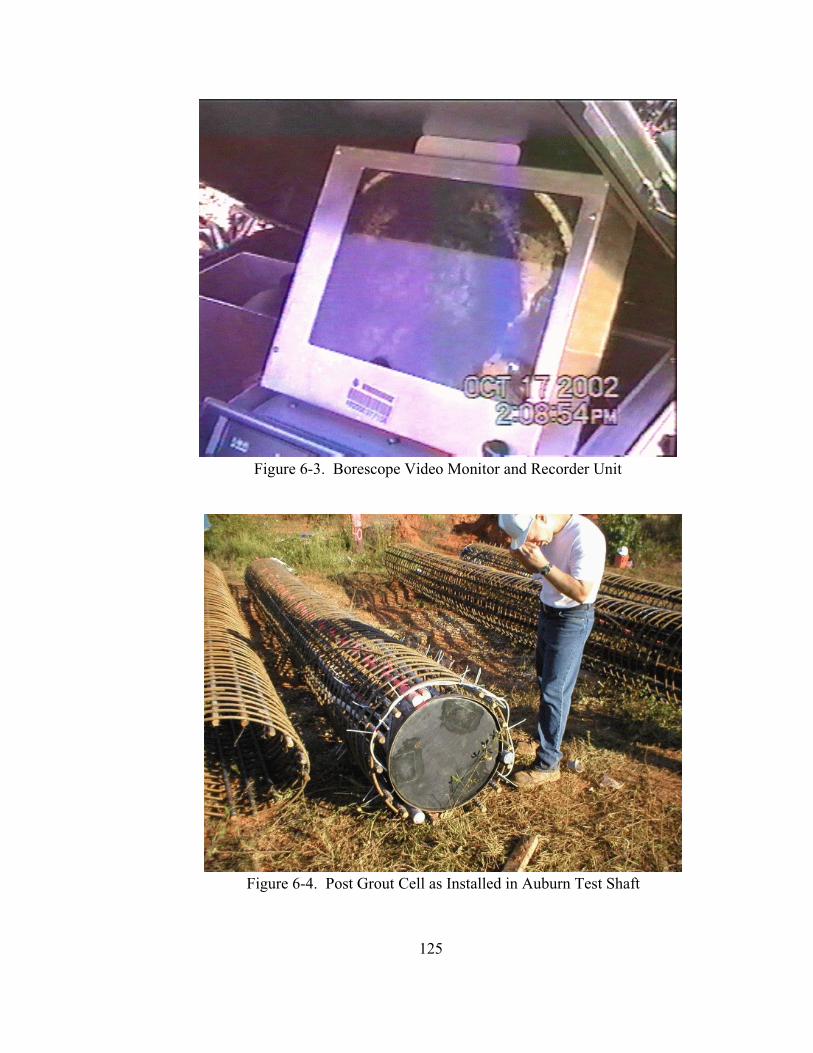
125
Figure 6-3. Borescope Video Monitor and Recorder Unit
Figure 6-4. Post Grout Cell as Installed in Auburn Test Shaft
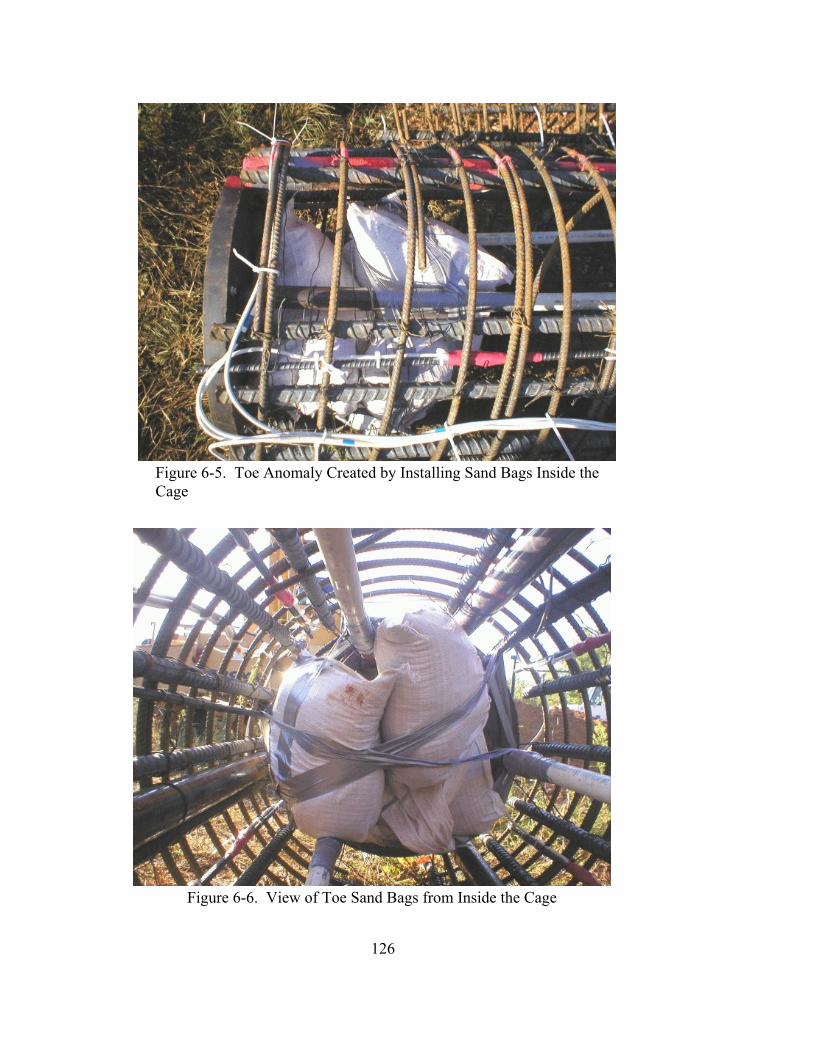
126
Figure 6-5. Toe Anomaly Created by Installing Sand Bags Inside theCage
Figure 6-6. View of Toe Sand Bags from Inside the Cage
127
Figure 6-7. Detail View of Sister Bars, CSL Tubes, and Grout Tubes
Figure 6-8. Auburn Site CPT Soundings in Test Area
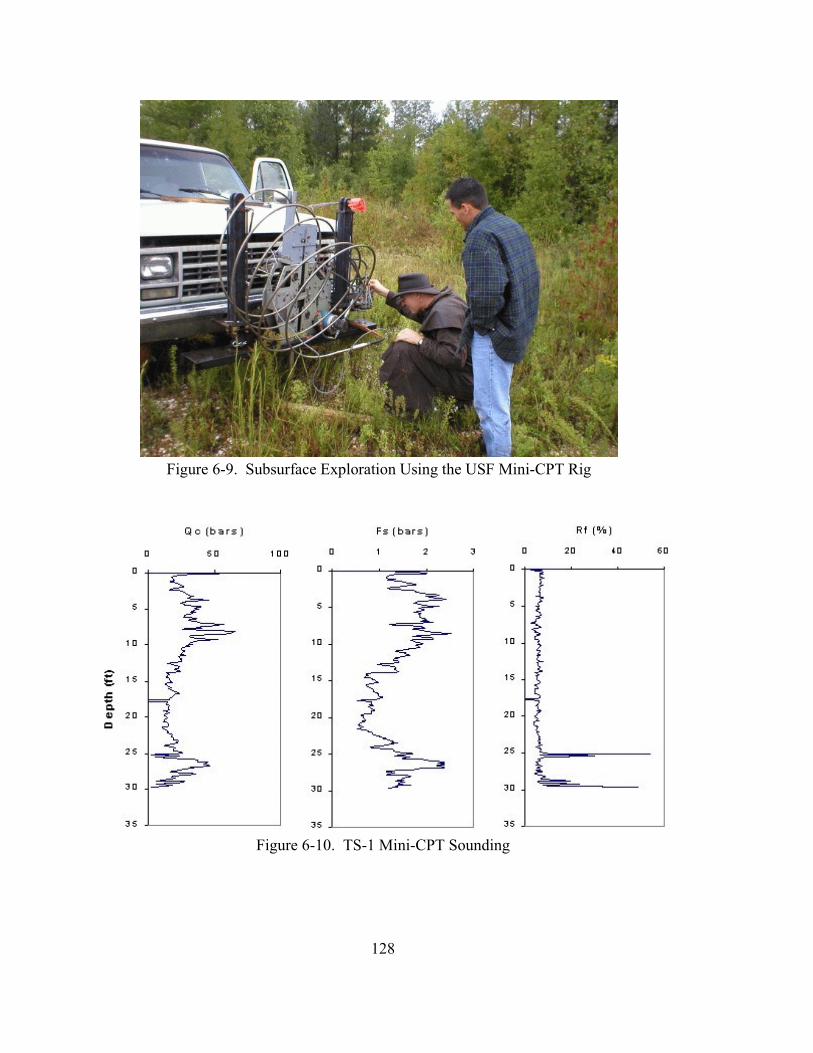
128
Figure 6-9. Subsurface Exploration Using the USF Mini-CPT Rig
Figure 6-10. TS-1 Mini-CPT Sounding

129
Figure 6-11. TS-2 Mini-CPT Sounding
Figure 6-12. TS-3 Mini-CPT Sounding

130
Figure 6-13. TS-4 Mini-CPT Sounding
Figure 6-14. TS-5 Mini-CPT Sounding

131
Figure 6-15. Auburn Test Site Layout
Figure 6-16. Rotary Drill Rig
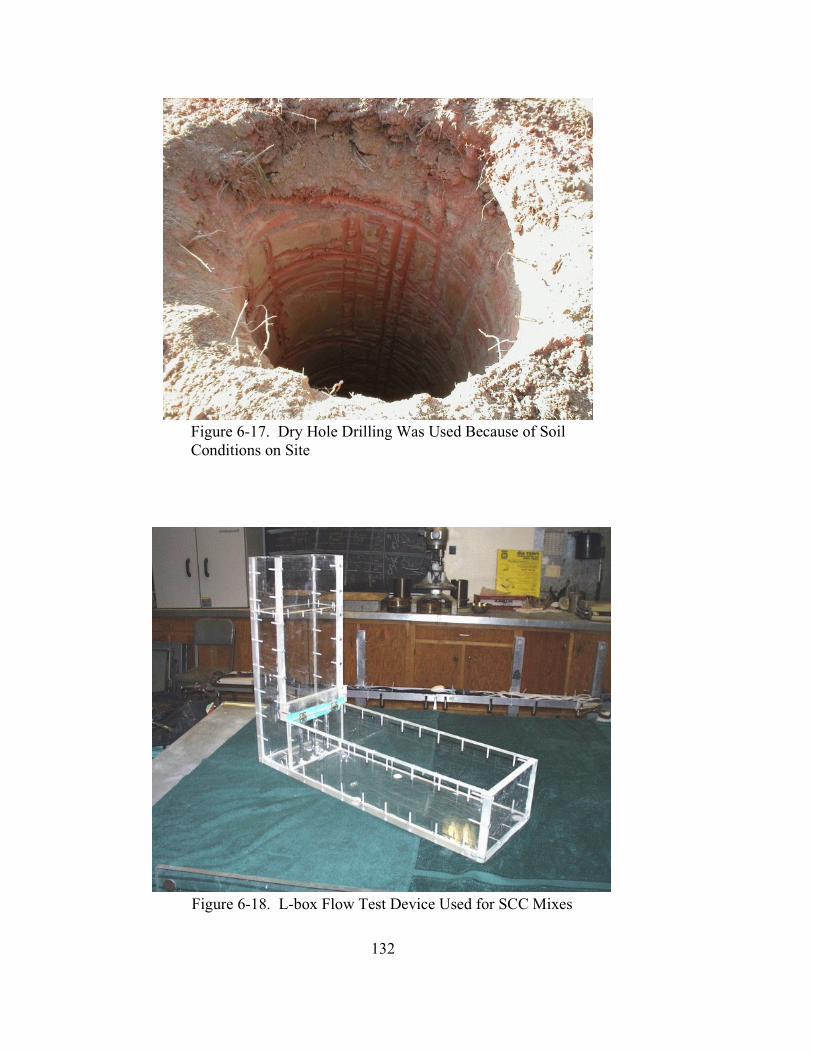
132
Figure 6-17. Dry Hole Drilling Was Used Because of SoilConditions on Site
Figure 6-18. L-box Flow Test Device Used for SCC Mixes
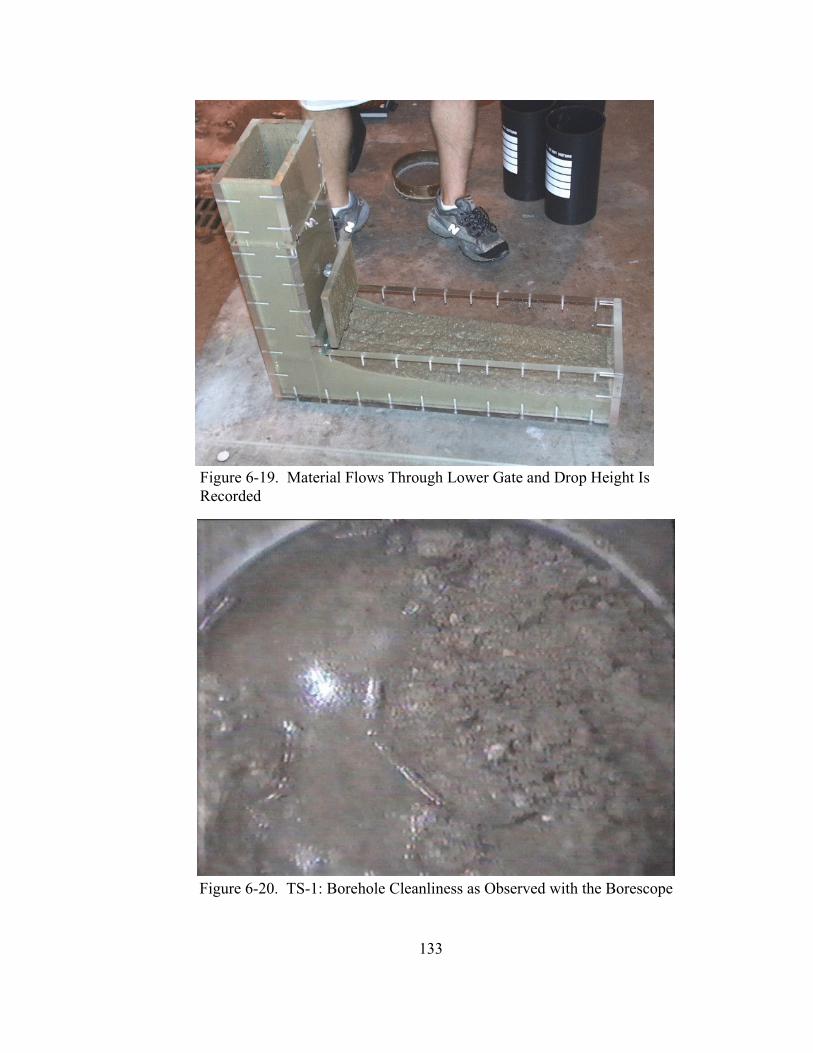
133
Figure 6-19. Material Flows Through Lower Gate and Drop Height IsRecorded
Figure 6-20. TS-1: Borehole Cleanliness as Observed with the Borescope
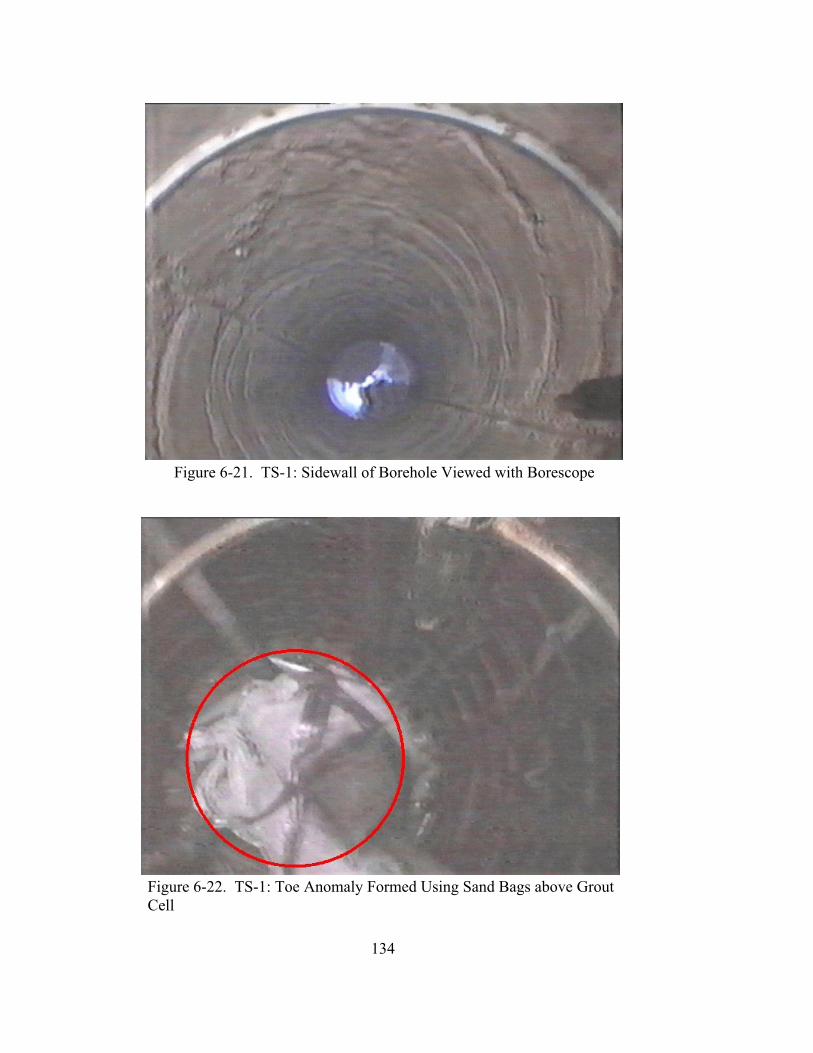
134
Figure 6-21. TS-1: Sidewall of Borehole Viewed with Borescope
Figure 6-22. TS-1: Toe Anomaly Formed Using Sand Bags above GroutCell

135
Figure 6-23. TS-1: #57 Stone Mix, High Slump, Showing Some Bindingnear Rebar
Figure 6-24. TS-1: Binding of Coarse Aggregate near Rebar

136
Figure 6-25. TS-1: Longitudinal Bars Create an Even Larger Area ofBinding
Figure 6-26. TS-2: #7 Stone Mix, High Slump, Good FlowCharacteristics

137
Figure 6-27. TS-2: Overall Flow for #7 Stone Mix Is More Uniform
Figure 6-28. TS-2: Tight Longitudinal Spacing but No Obvious Binding
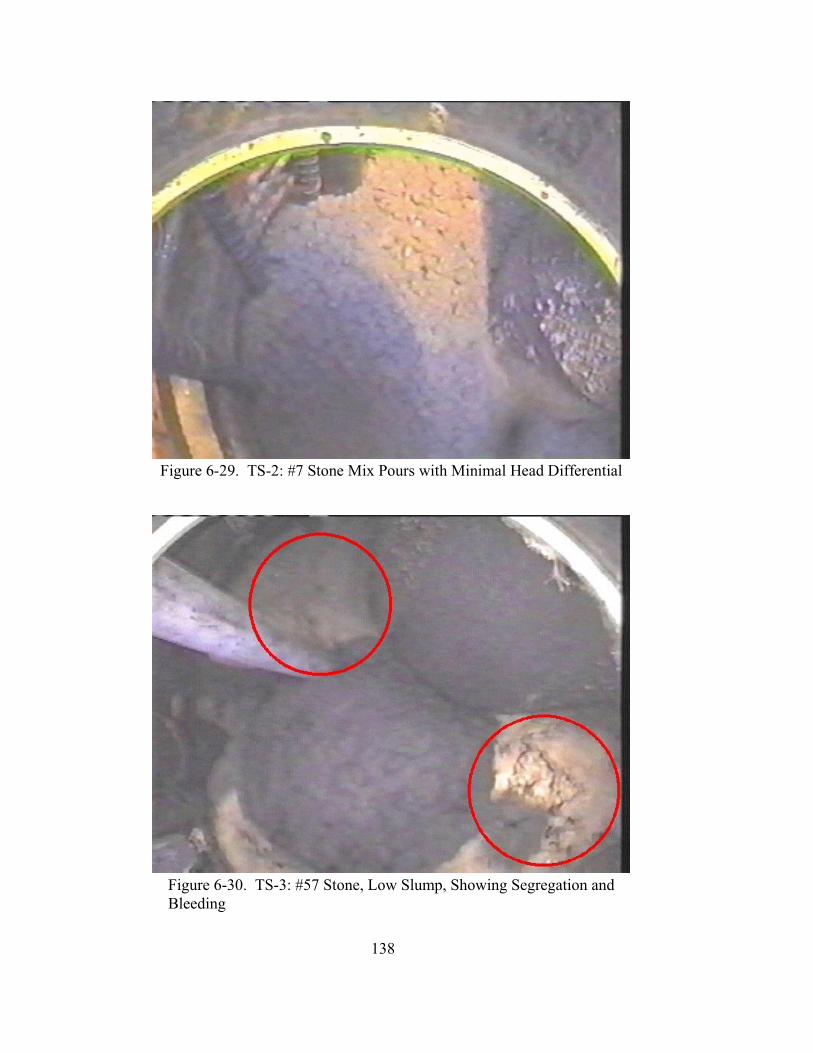
138
Figure 6-29. TS-2: #7 Stone Mix Pours with Minimal Head Differential
Figure 6-30. TS-3: #57 Stone, Low Slump, Showing Segregation andBleeding

139
Figure 6-31. TS-3: Obvious Segregation and Bleed off of Mix WaterDuring Pour
Figure 6-32. TS-3: Low Slump Mix Also Exhibits High Degree ofClumping

140
Figure 6-33. TS-5: SCC Mix Flows Well Around Tight Obstructions
Figure 6-34. TS-5: No Visible Binding Near Rebar for SCC Mixes
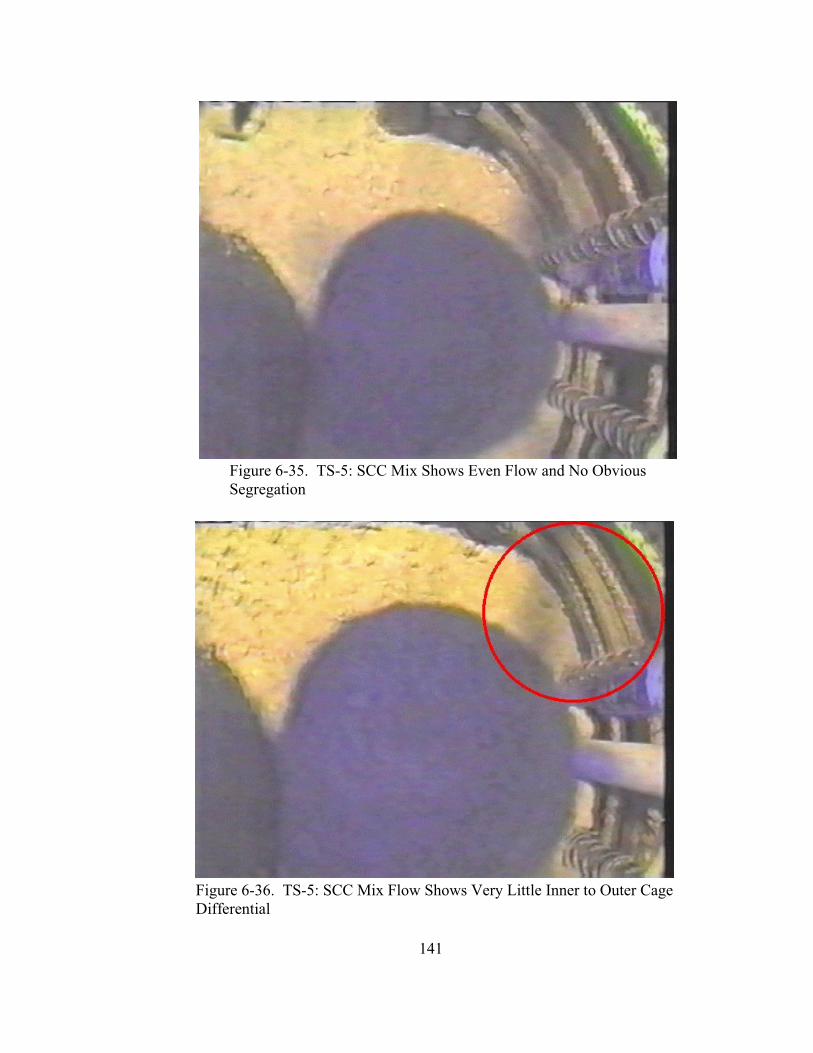
141
Figure 6-35. TS-5: SCC Mix Shows Even Flow and No ObviousSegregation
Figure 6-36. TS-5: SCC Mix Flow Shows Very Little Inner to Outer CageDifferential

142
Figure 6-37. TS-3 CSL Data (a) Initial Readings and (b) Final Readings
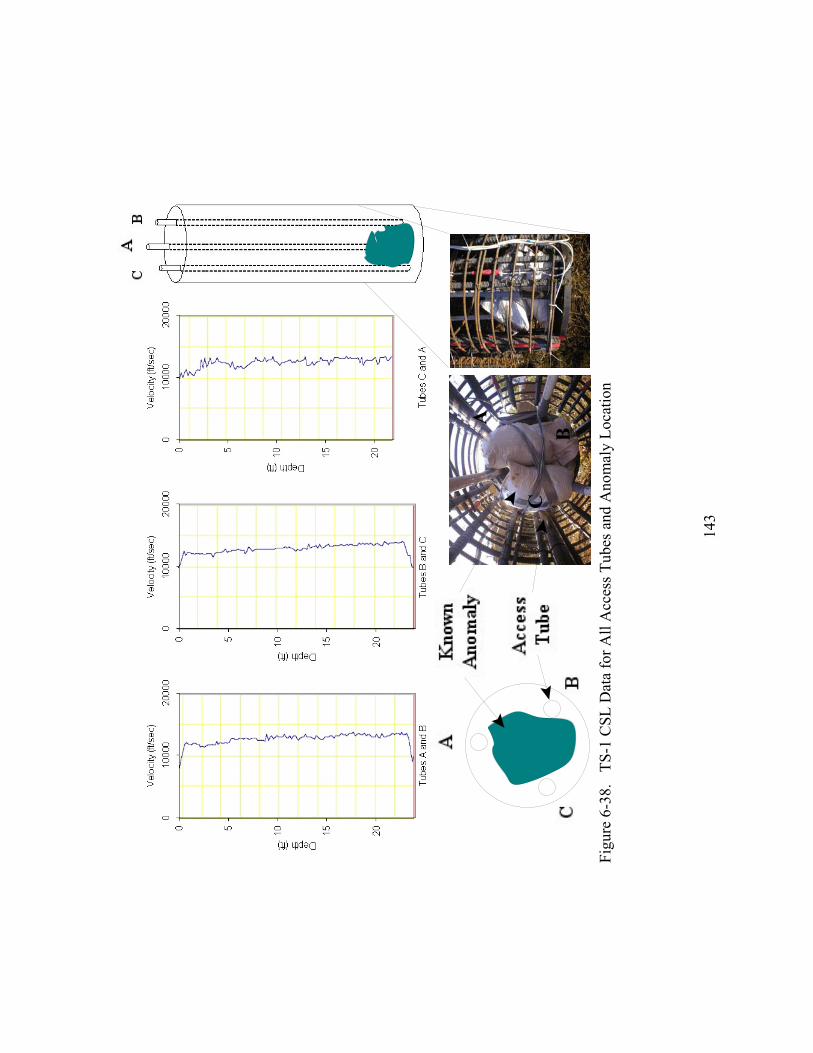
143
Fig
ure
6-38
. T
S-1
CS
L D
ata
for
All
Acc
ess
Tub
es a
nd A
nom
aly
Loc
atio
n

144
Fig
ure
6-39
. T
S-2
CS
L D
ata
for
All
Acc
ess
Tub
es a
nd A
nom
aly
Loc
atio
n
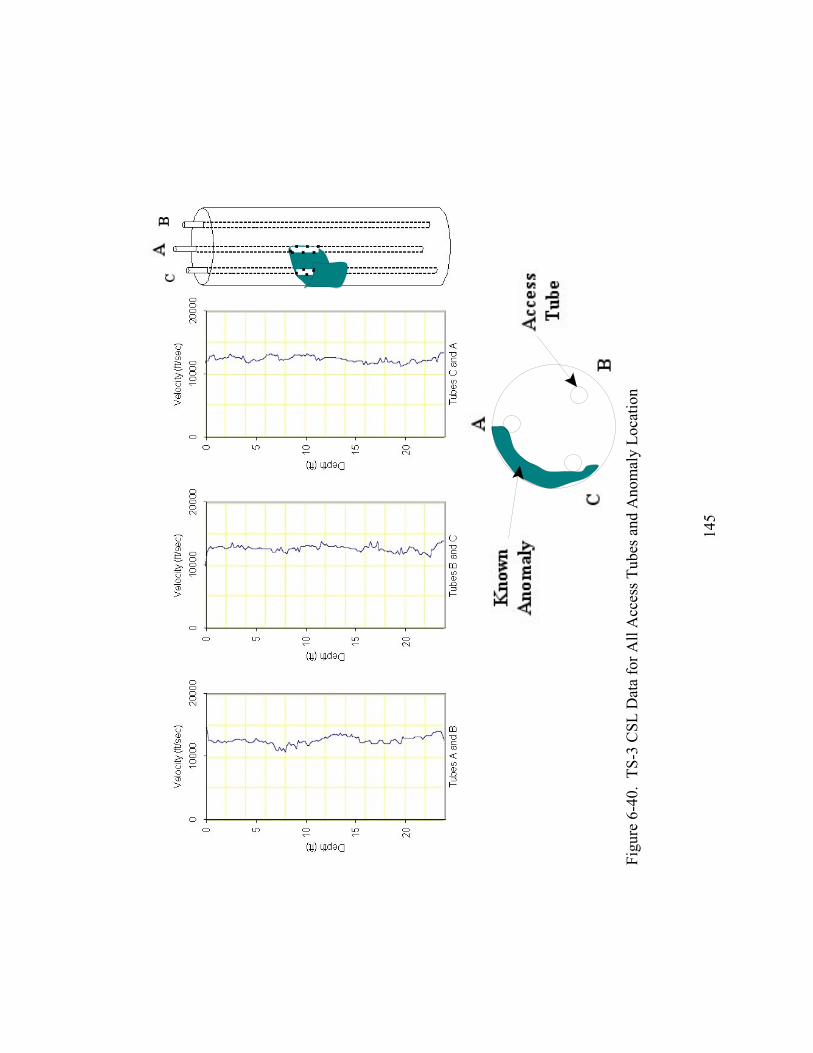
145
Fig
ure
6-40
. T
S-3
CS
L D
ata
for
All
Acc
ess
Tub
es a
nd A
nom
aly
Loc
atio
n
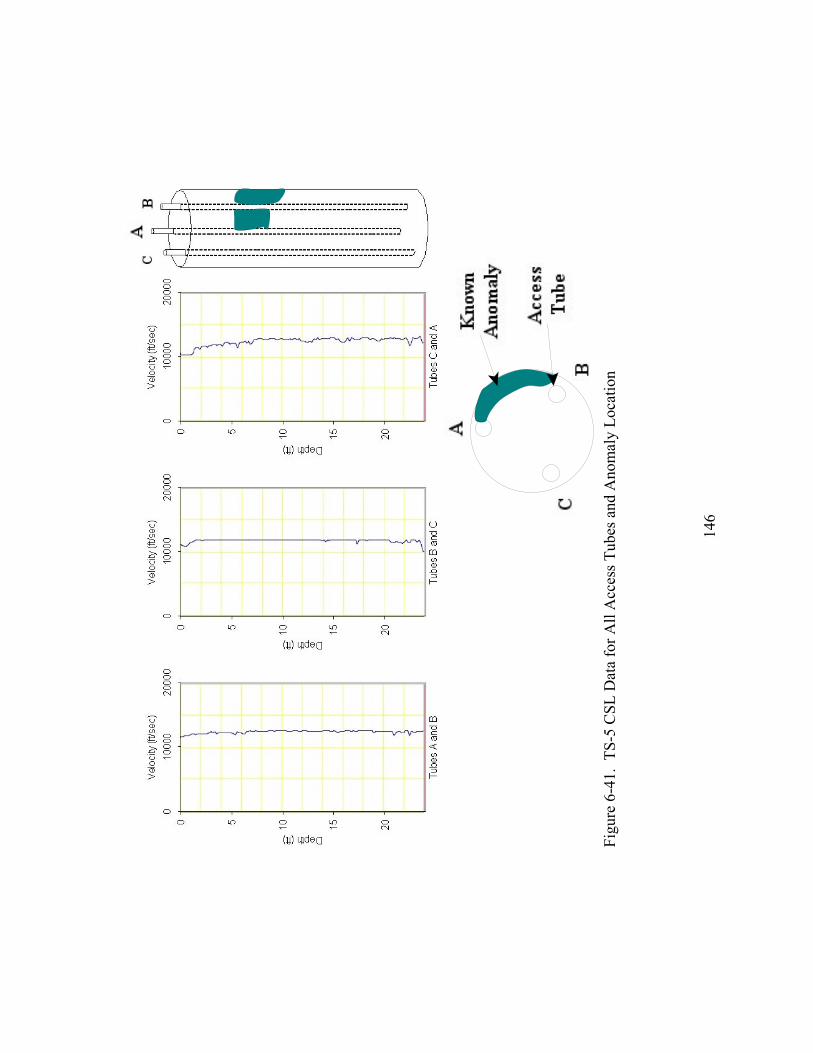
146
Fig
ure
6-41
. T
S-5
CS
L D
ata
for
All
Acc
ess
Tub
es a
nd A
nom
aly
Loc
atio
n

147
Fig
ure
6-42
. T
S-4
CS
L D
ata
for
All
Acc
ess
Tub
es (
Con
trol
Sha
ft, N
o A
nom
alie
s)

148
Figure 6-43. TS-4 Exhumed Shaft Tip
Figure 6-44. Thermal Integrity Testing of TS-2 (Tube B)

149
Figure 6-45. Fourier analysis of inward-facing sensor temperature data for shaft TS-3(Tube A)
Figure 6-46. Low-passed (“rebar-filtered”) temperature traces and one unfiltered trace ofthe inward-facing channel from shaft TS-3 (Tube A)

150
Figure 6-47. SIT data for TS-1 before grouting (top) and after load testing (bottom).
Figure 6-48. SIT data for TS-2 before grouting (top) and after load testing (bottom).
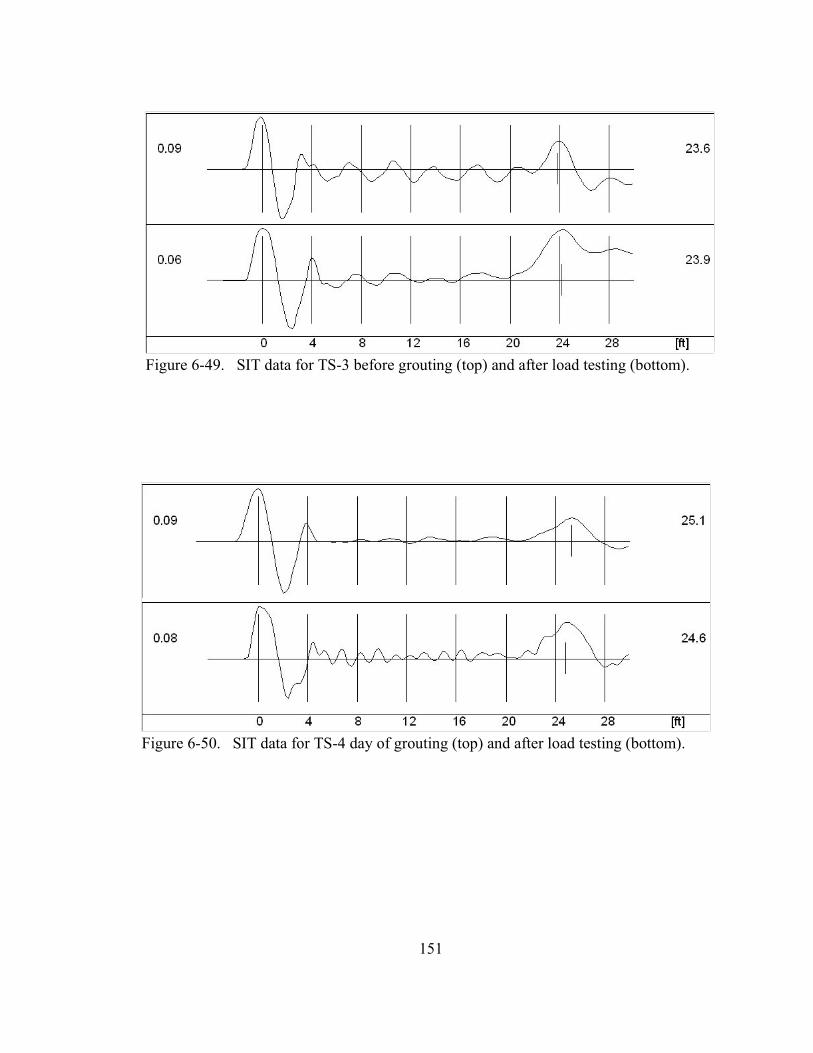
151
Figure 6-49. SIT data for TS-3 before grouting (top) and after load testing (bottom).
Figure 6-50. SIT data for TS-4 day of grouting (top) and after load testing (bottom).
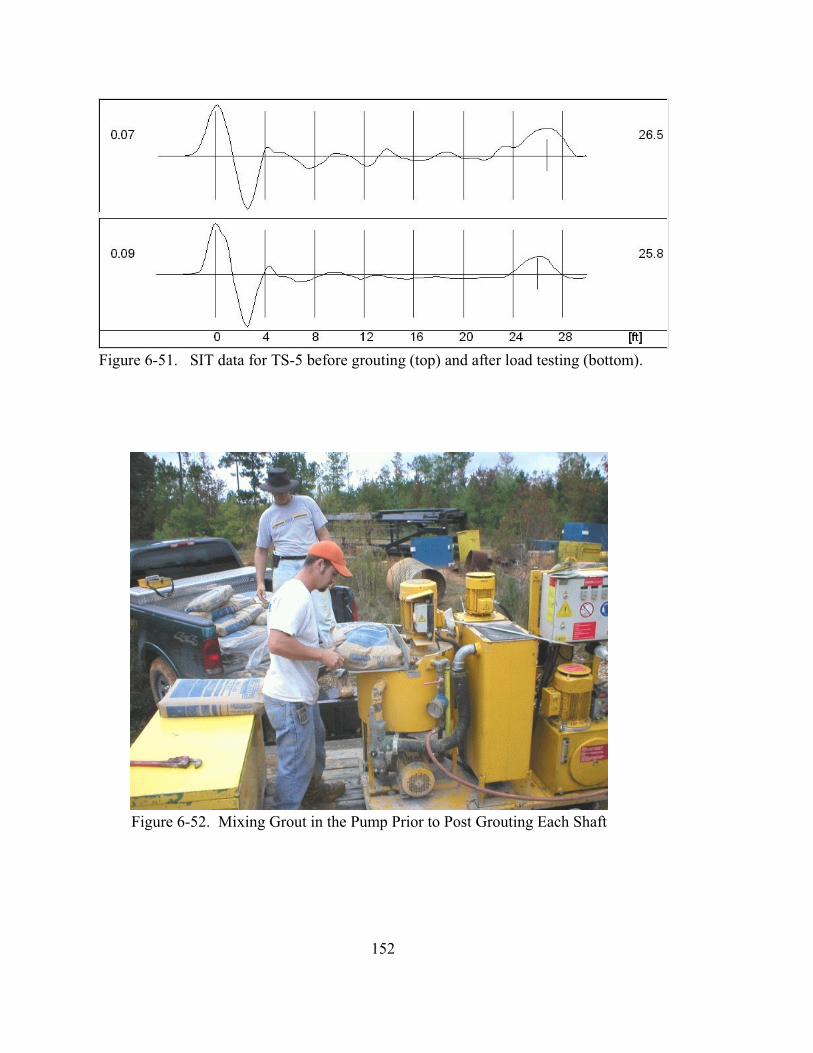
152
Figure 6-52. Mixing Grout in the Pump Prior to Post Grouting Each Shaft
Figure 6-51. SIT data for TS-5 before grouting (top) and after load testing (bottom).
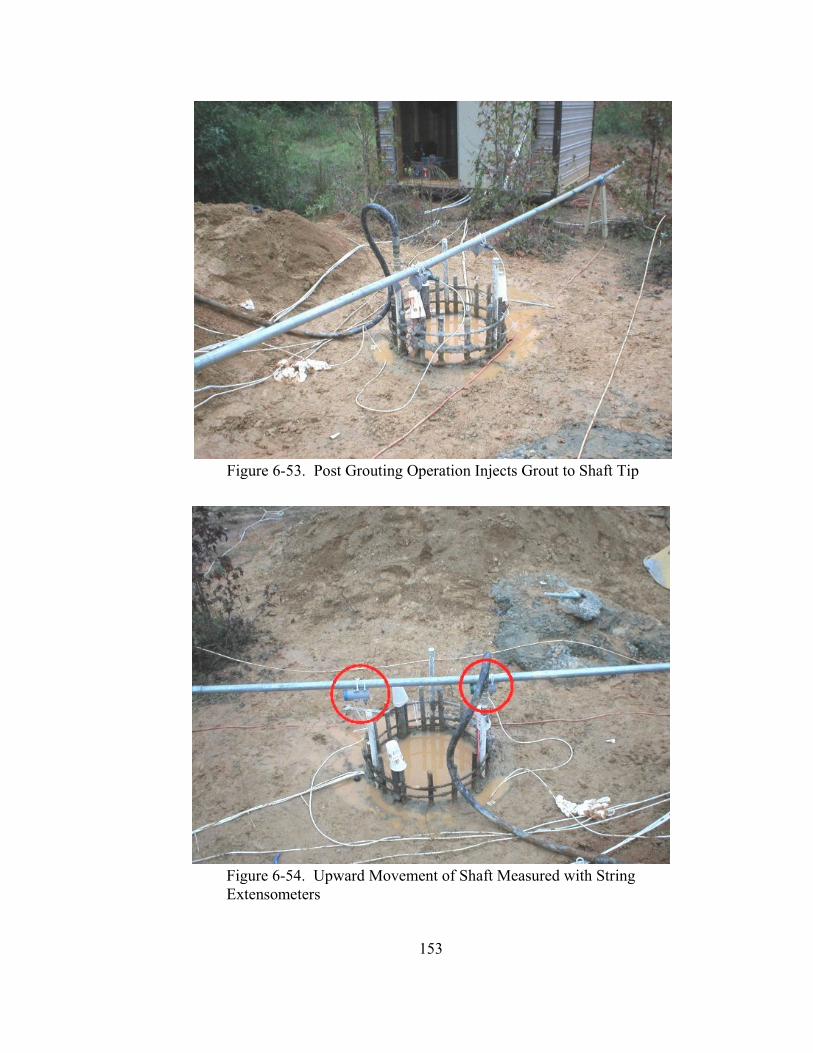
153
Figure 6-53. Post Grouting Operation Injects Grout to Shaft Tip
Figure 6-54. Upward Movement of Shaft Measured with StringExtensometers
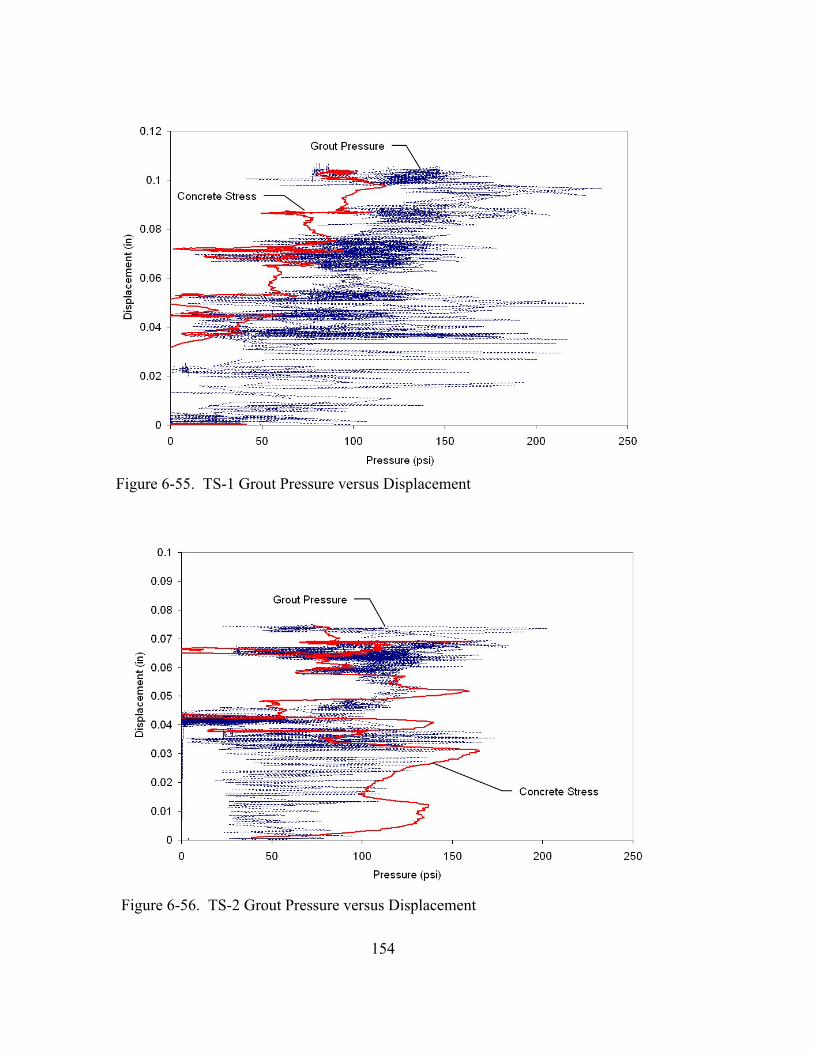
154
Figure 6-55. TS-1 Grout Pressure versus Displacement
Figure 6-56. TS-2 Grout Pressure versus Displacement
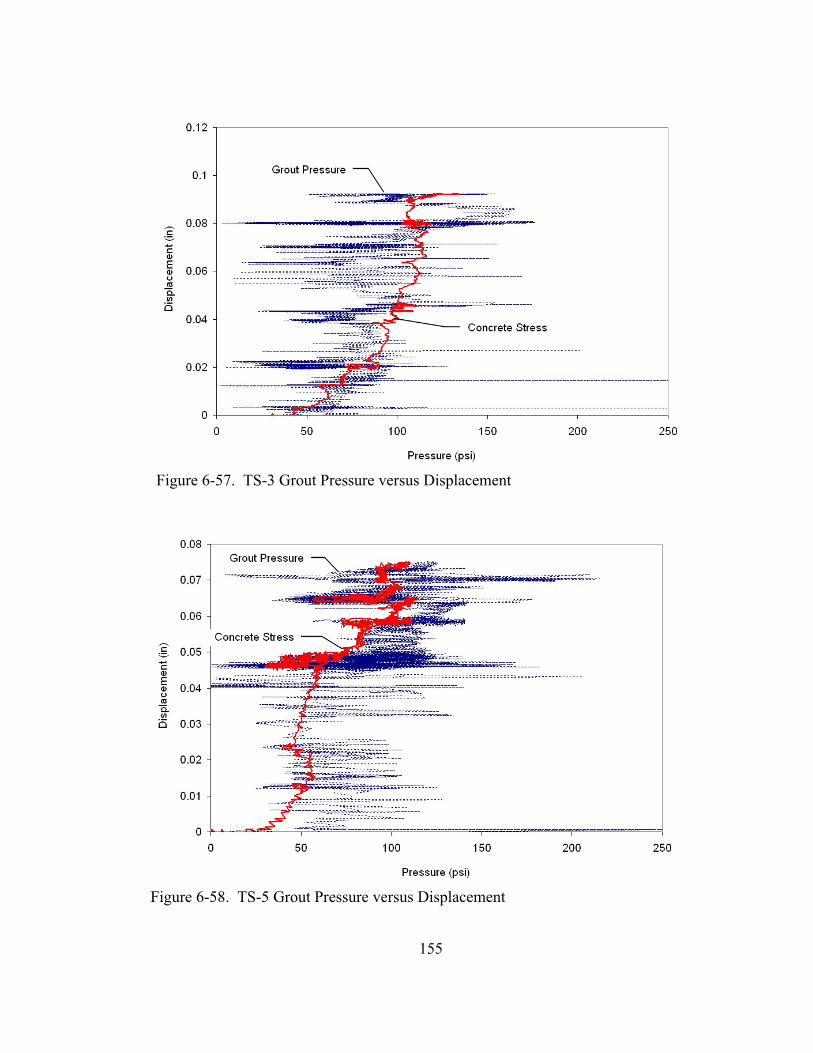
155
Figure 6-57. TS-3 Grout Pressure versus Displacement
Figure 6-58. TS-5 Grout Pressure versus Displacement
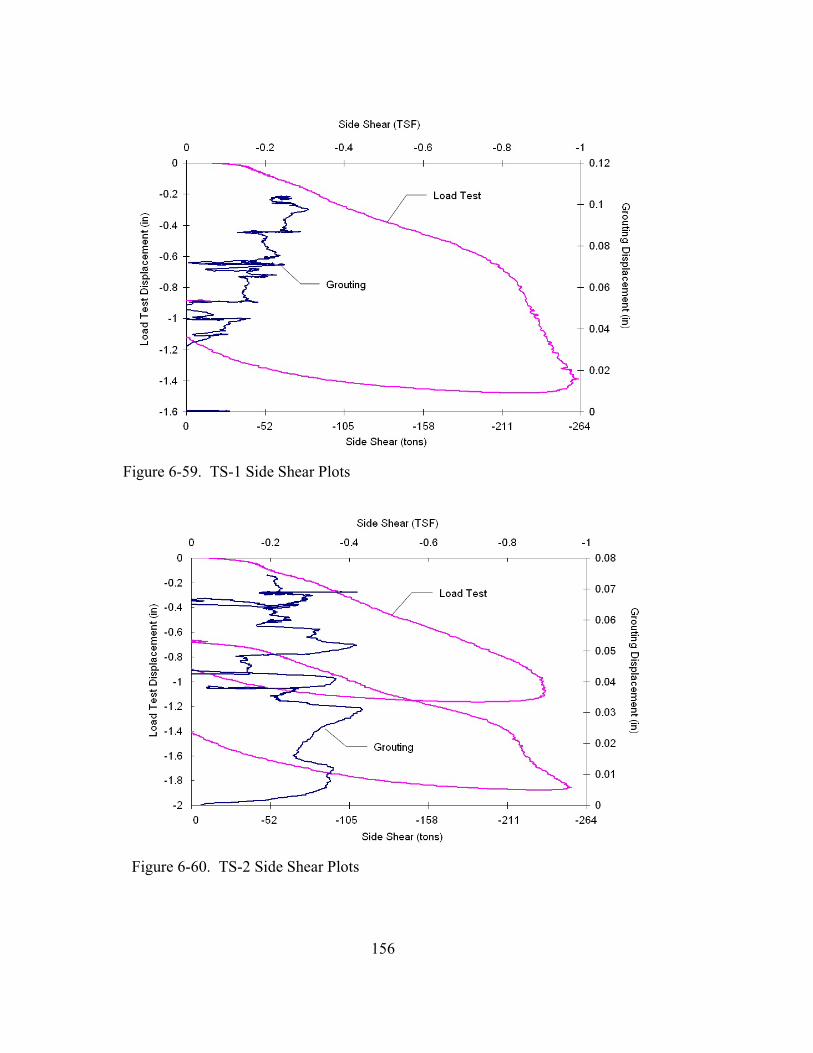
156
Figure 6-59. TS-1 Side Shear Plots
Figure 6-60. TS-2 Side Shear Plots

157
Figure 6-61. TS-3 Side Shear Plots
Figure 6-62. TS-5 Side Shear Plot during Grouting
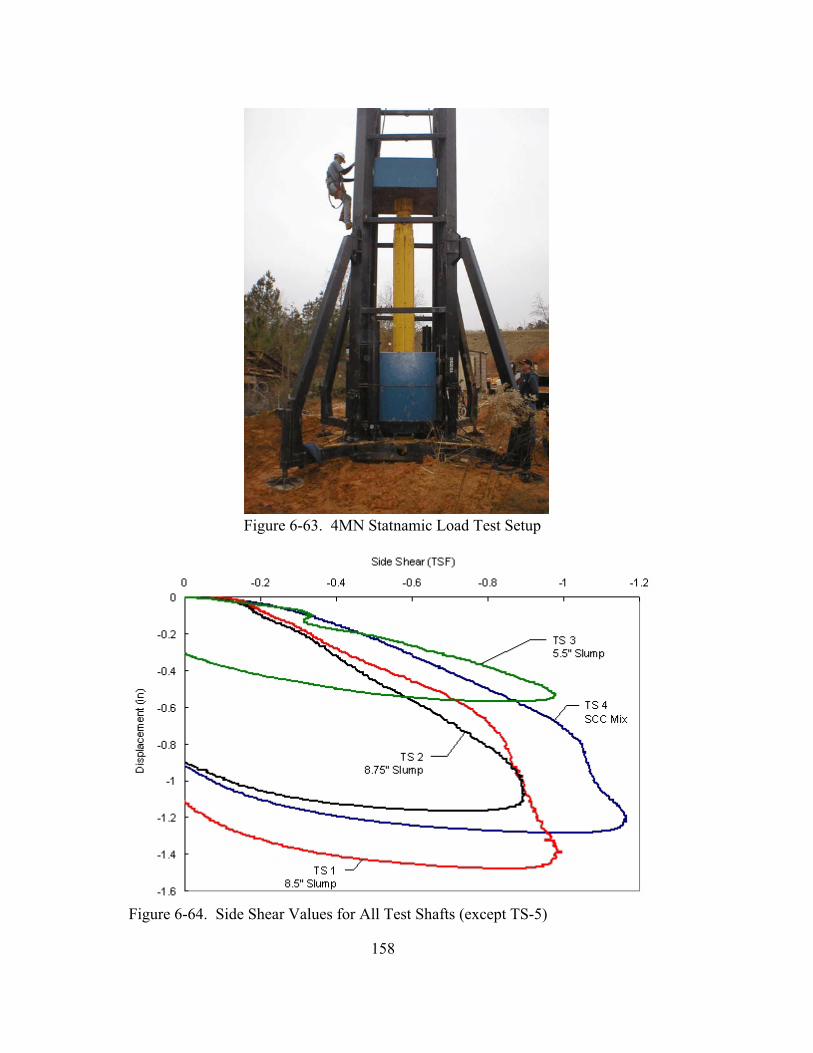
158
Figure 6-63. 4MN Statnamic Load Test Setup
Figure 6-64. Side Shear Values for All Test Shafts (except TS-5)

159
Figure 6-66. Coring of Test Shafts for Permeability Testing
Figure 6-65. Soil Excavation for Shaft Removal
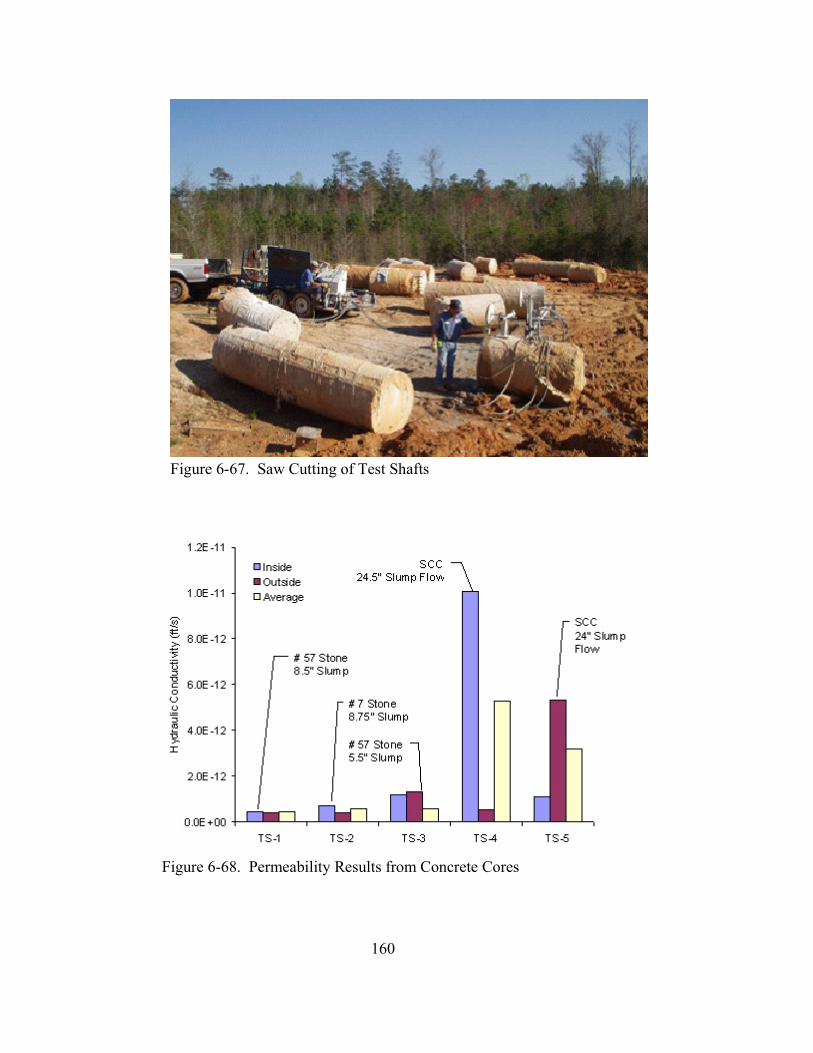
160
Figure 6-67. Saw Cutting of Test Shafts
Figure 6-68. Permeability Results from Concrete Cores

161
Figure 6-69. Core Sample from Shaft TS-1 Showing Material from Inner& Outer Cage
Figure 6-70. TS-1 Core Sample Before Splitting
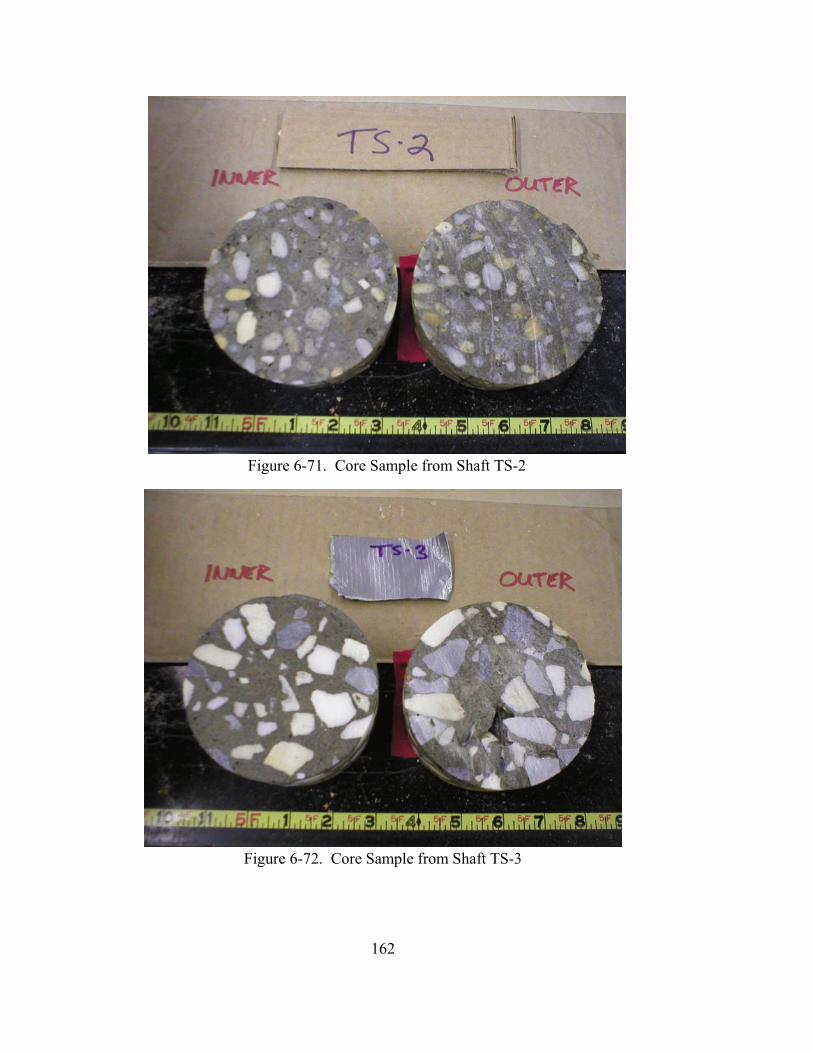
162
Figure 6-71. Core Sample from Shaft TS-2
Figure 6-72. Core Sample from Shaft TS-3
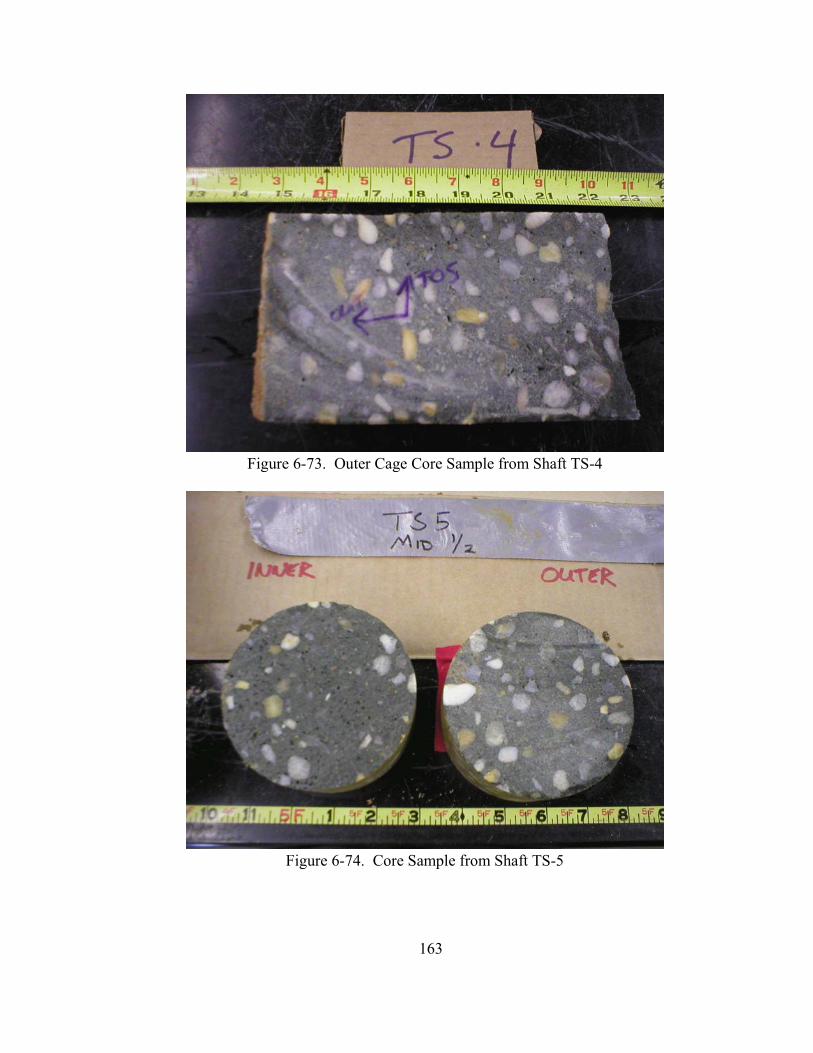
163
Figure 6-73. Outer Cage Core Sample from Shaft TS-4
Figure 6-74. Core Sample from Shaft TS-5

164
Figure 6-75. TS-3 Saw Cut
Figure 6-76. TS-5 Saw Cut

165
Figure 6-77. TS-2 Saw Cut

166
THIS PAGE IS INTENTIONALLY BLANK
167
7. FIELD HEAD DIFFERENTIAL MEASUREMENTS
7.1 Background
The discovery of a head differential in rising mortar between the inside and outside of thereinforcement cage during the LPC Testing Series III spawned the desire to better define andunderstand this behavior. To this end, a field testing program was established to survey ifthis behavior was observed in commercially constructed drilled shafts. The main objectiveof this testing was to quantify head differential behavior with variables such as CSD, risingconcrete velocity, and concrete properties and borehole characteristics.
Multiple field visits across several sites were conducted to ascertain the amount of wetconcrete head differential in various types of drilled shaft construction and to examine thecorrelation between this differential and rising concrete velocity. In order to obtain a varietyof data, researchers deliberately chose sites with varying shaft diameters and CSD ratios.This field testing allowed researchers to obtain data for the primary objective, and also tosurvey commercial construction of drilled shafts not only for highway construction, but alsoprivate construction. For each site, researchers collected as much information as possibleabout its unique characteristics so that all possible correlations could be explored.
7.2 Drilled Shaft Testing Procedure
Upon each visit, it was necessary to collect as much data as possible about the individualityof each site as it pertains to shaft design, mix design, and construction procedure. Rebarcage spacing, cage length, shaft depth, casing diameter and concrete data were collectedregularly, in addition to any other pertinent information. Acute observation of theconstruction process was critical to this research as well, and any unusual or exceptionalpractices were noted.
To accurately determine head differential, researchers used a weighted tape (Figure 7-1),similar to what drilled shaft inspectors use to measure rising concrete. Two tapes aredropped prior to the pouring of each truck, one inside the reinforcement cage and oneoutside, and initial readings taken with the top of the temporary casing as the reference.During pumping, head differential readings are taken every 30 seconds until the entire truckhas been pumped, then the final height is measured. This process is repeated until the entireshaft has been poured.
7.3 Field Sites
In addition to the data collected from the Auburn test shafts (Chapter 6), three local Tampabay area sites were visited. Figure 7-2 shows the locations of the each site visited. Theconstruction of each site is detailed in the following sections.

168
7.3.1 Port of Tampa (Essex Cement)
Construction of cement silos at Berth 219 in the Port of Tampa (Figures 7-3 through 7-4) forEssex Cement Company demanded a foundation consisting of 177 drilled shafts with 3 footdiameters. The shafts were drilled to a depth of approximately 78 feet and utilized fulllength temporary casing with a sidewall thickness of 1/2 inch. The reinforcing cages were52 feet in length and designed to terminate at the beginning of the rock socket. Stirrupspacing and mix specifications yielded a CSD of approximately 27. Each shaft was pouredvia a pump truck and had a volumetric requirement equivalent to 2 concrete trucks. Slumpranges for each truck fell between 8.5 and 9.5 inches. Due to the high water table, apparentin Figure 7-4, wet construction methods (natural slurry) were implemented.
The collection of 4 data sets were completed for this site. Figure 7-5 presents a graph of theCSD ratio versus measured head differential. It is interesting to note that the headdifferentials vary regardless of a constant CSD ratio. This suggests that another variable,rising concrete (uphole) velocity, could be key in measuring wet concrete behavior. Figure7-6 shows the uphole velocity versus measured head differential, however, it is difficult toderive any trend from such a small amount of data.
7.3.2 Crosstown Expressway Reversible Lanes Bridge
Construction on the Crosstown Expressway Reversible Lanes Bridge began in 2003(Figures 7-7 and 7-8). The bridge is designed to facilitate 3 lanes of traffic westward intoTampa during morning hours, then reverse flow eastward during the afternoon. The bridgeutilizes a mono-pier foundation system, meaning that each column rests atop a single largediameter drilled shaft. Shaft diameters range from 4 to 8 feet with depths up to 80 feet. Bynature of the design, the drilled shafts require a large amount of reinforcement with tightly-spaced cages; CSD ratios for all shafts were 6 and slumps ranged from 7 to 9 inches.
Three shafts were investigated at two points along the route that offered a significantvariation in the construction atmosphere. The first two shafts (167 and 156) were 6 and 8feet in diameter, respectively, and located within close proximity to an already-existingroadway (Site 1). The third shaft (18) was 8 feet in diameter and positioned over a waterway(Site 2). Construction methods were similar to those used at the Port of Tampa in that a fulllength temporary casing was vibrated to the rock layer, the reinforcing cages were designedto terminate at the rock socket, and concrete was pumped from concrete trucks through atremie. The large diameter shafts required upwards of 15 concrete trucks and 5 hours tocomplete, affording several data sets per shaft.
Plotting the recorded head differential against the uphole velocity reveals a trend betweenshafts of similar CSD ratios (Figure 7-9). This evidence suggests that perhaps a family ofcurves exists for different ranges of CSD ratios. Also, it is evident that another variable mayaffect the range of head differential fluctuation within a particular shaft, for it is easily seenthat the differential range in shaft 156 is twice as large as the range for shafts 18 and 167.
169
While waiting between the arrival of concrete trucks, differential measurements were takenin the stagnant boreholes. In time periods of up to one hour, it was observed that theconcrete differential did not decrease appreciably.
7.3.3 Alagon Condominiums
The Alagon is a 21-story condominium overlooking Hillsborough Bay. The foundation ofthis luxurious high-rise consists of 140 drilled shafts ranging from 2 to 5 feet in diameterwith CSD ratios of 10 and slumps of 8.5 to 9 inches. Shaft lengths vary depending on theelevation to rock (26 to 40 ft). The shafts were constructed in a similar fashion to those ofthe Port of Tampa and the Crosstown Expressway, with the exception that concrete wasplaced with a hopper instead of a pump truck (Figure 7-10). This deviation afforded anopportunity to examine very high uphole velocities due to the relatively small shaftdiameters and large capacity of the hopper.
Differential heights were measured at the end of each bucket pour due to safety concerns,thereby altering the standard measuring procedure. Since uphole velocities were unable tobe calculated, data collected for this site was not included in the final analysis. Also, mostshafts unexpectedly required more than two bucketfuls. Differential readings taken duringthese pours revealed that the surface of the advancing concrete actually fell between buckets.Since cased construction method was used, voids within the rock socket may have openedand allowed concrete to escape from the borehole.
7.4 Head Differential Summary
Figure 7-11 summarizes the data collected from the Port of Tampa, Crosstown, and NGESsite (TS-4) as a function of the CSD. Clearly the CSD is not the only parameter affectingthe build-up of concrete head inside the reinforcing cage. Figure 7-12 shows the same dataas a function of velocity for each group of common CSDs observed. Second-order trendsappear to exist for different CSD values, verifying the concept that head pressure is directlyproportional to the square of the velocity head. Given a constant uphole velocity, a drasticdifference in head differential occurs as the CSD increases from 6 to 8; once the CSDincreases beyond 8, the head differential does not significantly decrease (Figure 7-13).
Since there is little alternate configurations for a given reinforcement cage design andconcrete flow rate is highly uncontrollable, it is more rational to adjust the coarse aggregatesize so as to minimize concrete build-up inside the cage. This is preferable given the easein which a thick layer of sediment can be deposited at sand contents approaching 4%.

170
Figure 7-1. Weighted Tape (left) used in Taking Head Differential Measurements(right)
Figure 7-2. Location of the 4 Sites Visited for Head Differential Readings

171
Figure 7-3. Cage Installation at the Port of Tampa
Figure 7-4. High Water Table Visible at the Port of Tampa
172
Figure 7-5. Head Differential as a Function of the CSD Ratio for the Port ofTampa
Figure 7-6. Head Differential as a Function of the Velocity for the Port of Tampa

173
Figure 7-7. Mono-pier Cage Placement at the Crosstown Expressway
Figure 7-8. Head Differential Measurements at the Crosstown Expressway
174
Figure 7-10. Alagon Bucket Pours (left) and Field Measurements (right)
Figure 7-9. Head Differential as a Function of Velocity for the CrosstownExpressway
175
Figure 7-12. Summary of Head Differential as a Function of Velocity
Figure 7-11 Field Measurements Combined with Lab Data

176
Figure 7-13. Recommended CSD Range to Minimize Head Differential

177
8. CONCLUSIONS AND RECOMMENDATIONS
8.1 General Conclusions
The results from this study revealed that the location of the water table was not the primarycause of anomalies in the drilled shafts, but rather concrete properties and slurry propertiesshowed more significant effects. However, the presence of the water table requires sufficientslurry head over and above the water table and cannot be dismissed as being an importantfactor. As such, the scope of the project was widened to investigate the effects of otherfactors which would cause anomalies within drilled shafts. The following parameters wereinvestigated: borehole cleanliness, construction techniques, slump loss during concreteplacement, reinforcement cage spacing, slurry properties, sand content, and borehole opentime. The project was divided into five different laboratory and field testing phases: (1)Lateral Pressure Cell testing, (2) Frustum Confining Vessel testing, (3) Slurry/Sand Fallouttesting, (4) Full-scale Drilled Shaft testing, and (5) Full-scale Concrete Head Differentialmeasurements. A significant finding which potentially affects each of the above areas wasthe way in which concrete flows from the tremie pipe. Figure 8-1 helps to illustrate thedifference between the previously conceived flow and that observed in this study.
Figure 8-1. Comparison of Idealized Concrete Flow with Observed

178
8.1.1 Lateral Pressure Cell Testing
Three series of Lateral Pressure Cell testing were conducted to investigate: (1) the effect ofslump on lateral pressures, (2) reinforcement cage spacing and wet construction method, and(3) concrete head differentials inside versus outside the reinforcement cage. Series I oftesting showed that the lateral pressure of a final pour does not vary significantly with slump(from 7 to 11 inches). Series I and II of tests revealed the complexity of the flow of concreteout of the tremie and into the borehole. Although it is commonly assumed in practice thatconcrete rises in a uniform manner, this was never observed in the LPC. To the contrary,the material between the tremie pipe and the reinforcing cage always rose to a higher levelthan the material on the outside of the cage. This concrete head differential is affected bythe geometry of the reinforcing cage and also by the size and shape of the largest particlesin the concrete mix. Looking at the ratio of the smallest clear spacing in the cage to thelargest particle diameter of the mix, the CSD ratio was addressed. It was found that for CSDvalues that fall well within the currently acceptable design guidelines, large headdifferentials would develop. Compounding this problem is that under the influence of aslurry head in the borehole, the concrete leaving the tremie is further impeded and this headdifferential grows significantly larger. As the lab scale study only qualitatively addressedthe relationship, field testing was subsequently conducted to quantify the occurrence.
While the existence of a head differential between the inner and outer cage material is notitself a problem, the likelihood that anomalies will occur in the finished shaft increases asthe magnitude of this differential increases. This is due to the motion of the concretecolumn. Instead of a uniform surface rising from the bottom of the excavation, a differentialsurface exists. For all cases studied, the material inside the cage and in contact with thetremie rose, in an arched fashion, to a much higher level that the material outside the cage.At some critical differential, the material on the inside would slough downward and outwardthrough the cage. Segregation of the concrete constituents as well as entrapment of loosedebris in the borehole each become a major concern.
8.1.2 Frustum Confining Vessel Testing
Three series of Frustum Confining Vessel testing were conducted to investigate: (1) theeffects of water table location, (2) extraction rate of the temporary casing, and (3) the effectsof slump loss during concrete placement. The first series of testing showed that the watertable location had little to no effect on the quality of the drilled shaft. The second series oftests revealed the higher extraction rates caused anomalies to form in the shaft (taperedshafts) and impacted the final dimension (diameter) of the shafts. The third series of testsdemonstrated that the skin friction capacity of a drilled shaft is very sensitive to slump lossthat occurs during construction. Although currently the FDOT allows the slump of drilledshaft concrete to fall to as low as 4 inches during construction, data presented in this studyshows that below a slump of 5 inches there is significant reduction in the mobilized skinfriction of the model shafts (Figure 4-28). A 5 inch slump caused a 50% reduction and a 4inch slump caused a 75% reduction. All of the shafts presented herein were constructed at

179
values of slump either within the FDOT 7 to 9 inch recommendation, or above. However,the slump of several of the shafts was allowed to decrease prior to pulling the temporarycasing. The magnitude of this decrease varied, but slumps as low as 3.5 inches wereobtained. Relating the skin friction capacity of these shafts as a function of the slump at thetime of casing extraction, it is evident that the FDOT 4 inch lower bound is too low. Suchlow slump conditions produce a slip-forming effect when the casing is extracted leaving anannular void similar in shape and volume of the now-absent casing.
8.1.3 Slurry/Sand Fallout Testing
Four series of Concrete Pour Simulator testing were conducted to investigate sand falloutin bentonite slurry as a function of wait time, pour velocity and slurry properties. The firstseries of testing was conducted on slurry with 1% sand content and demonstrated that upholevelocity had minimal effect on sand fallout. The second series of testing was conducted onslurry with 2% sand content and showed that low viscosity (approximately 30-32 secondMarsh cone) slurry had much higher sand fallout relative to higher viscosity mixes (39-42second Marsh cone). It also establishes that longer wait times increase fallout of sand asfiner material is able to settle in the borehole. The third series of tests used slurry with asand content of 4%. These tests showed that wait time had minimal effect on fallout, withapproximately the same amount for periods of up to 12 hours. The fourth series of tests,conducted on slurry with 8% sand content confirmed the trend of constant fallout regardlessof wait time. It is apparent, as well, that as slurry sand content increases, the amount offallout relative to the total amount of sand increases. In general, an undisturbed column ofslurry deposited most of the material within the first 2 hours (which was up to 50% of thetotal suspended sand).
8.1.4 NGES Full-Scale Testing
The field testing at the NGES site test involved construction and quality monitoring of fivefull scale drilled shafts. The parameters investigated, included three different concrete mixdesigns, construction method (dry versus wet hole), and reinforcement cage spacing. Severalnon-destructive tests (cross-hole, impact echo, thermal, and post grouting) were performedon each test shaft to show the effectiveness of detecting known anomalies placed in theshafts. The drilled shafts served to reinforce what was found in the LPC testing. Videofootage of the complex flow of concrete out of the tremie and through the cage was obtainedalong with tape measurements to the top of the concrete (inside and outside thereinforcement cage). This footage agreed well with the information recorded in the LPCtesting program. Differentials as large as 2 feet were measured and the arching andsloughing of the rising concrete column was recorded using the borescope. With the strongagreement between lab and field results, the argument can be made that more care must betaken during the design stage to ensure the CSD ratio is adequate to avoid large headdifferentials during construction. By making some very small changes in either clear rebarspacing or maximum coarse aggregate size, this CSD ratio could be adjusted such that the
180
construction techniques employed in the field have much less effect on the integrity of thefinished shaft.
8.1.5 Full-Scale Head Differential Testing
Full-scale head differential measurements were conducted (involving over 40 data sets) atthree different construction sites in the Tampa area. The objective of this testing was toquantify head differential as a function of CSD ratio, uphole velocity, and concreteproperties. The full scale testing first showed that CSD ratio did not have a direct correlationwith head differential. Instead, it was found that as upward velocity increased, larger headdifferentials were observed. It was apparent that shafts with similar CSD ratios also showedsimilar head differentials with respect to velocity. The largest head differentials (upwardsof 2.5 feet) were observed for shafts with CSD ratios of approximately 6. As the CSD ratiodecreased, the head differential increased. Head differential measurements taken during waittimes between concrete trucks revealed that minimal decrease occurred for periods of up toone hour. This suggests that, in conjunction with rapid sand fallout, inclusions may formwhen pouring resumes, trapping settled material in the lower level concrete cover / annularareas.
8.2 Recommendations
(1) CSD > 5. Current FHWA recommendations suggest that a CSD as low as 3is reasonable. However, concrete flow observed in this study support anincrease in this recommended value. This applies to structural, geotechnical,and materials engineers alike. As the size and configuration of rebar indrilled shaft cages cannot always be altered, smaller maximum aggregatediameter may be appropriate. Smaller-sized coarse aggregate such as #7stone should be considered for tremie-placed drilled shaft construction. Thiswould help to increase the CSD and thereby lower the potential headdifferential that could develop. This means less concrete back pressurewould be needed to adequately penetrate the cage. Where practical, this limitshould be applied to the worst case in the cage such as spliced cagesegments.
(2) Slump Loss > 4 inches. Slump during construction should be carefullymonitored. The FDOT 7 to 9 inch criteria seems acceptable for concreteplacement, but the 4 inch lower bound on slump loss may be too lax. The labstudy showed that a final slump of 3.5 inches to 4 inches were on the vergeof being unable to construct, and produced near zero side shear. Further, dueto the interactive nature of the FCV’s constant bladder pressure, 4 inch slumpmay be under-conservative for field applications. Perhaps a more stringentvalue of 4.5 to 5 inches would be more appropriate for full-scale, casedconstruction. Considering the availability of admixtures on the market,maintaining a slump of 7 to 9 inches throughout the entire pour is notunreasonable, and perhaps this should be considered as well.
181
(3) Slurry Sand Content < 1%. When constructing shafts using slurry stabilizedconstructions, the sand content at the time of concreting should be reducedto a more restrictive value of 1% from the present value of 4%. The concretepour simulator used in this study showed that large amounts of sand can besuspended in the slurry but an almost equal amount can fall out of suspensionwithin the first 2 hours (e.g. a 60ft excavation at 4% sand content and witha 38% fallout would deposit up to 11inches of accumulation). Further, otherSoutheastern states have recently adopted similar requirements. This can bemet by either de-sanding or by maintaining two separate slurry tanks, onewith clean “concreting slurry” and a second with “excavating slurry.” The“excavating slurry” is then exchanged with the “concreting slurry” prior toconcreting. Slurry properties during excavation are far less important withregard to sand content provided that sufficient slurry head is maintained.Failure to maintain a stable borehole results in sloughing and a reduction insoil strength. In such cases, the anticipated design capacity is unrelated toactual capacity.
(4) Pre-charge Tremie with Mortar. At the onset of concreting the tremiecharged with concrete is lifted to begin concrete flow. The first several feetof concrete rise at the base of the excavation segregates to an unknowndegree due to the violent mixing action in the zone surrounding the end of thetremie. In some cases this segregation can cause blockage as the courseaggregates clump together, but in all cases some segregation occurs. Asolution to this occurrence involves pre-charging the tremie with neat cementor a fine-aggregate mortar mix before beginning the concreting. In manyinstances, when pump trucks are used, a slicking, neat cement mix is runthrough prior to concrete pumping which would suffice.

182
THIS PAGE IS INTENTIONALLY BLANK

183
REFERENCES
Alabama Department of Transporation (ADOT), Special Provision No. 01-0712, Section506, Drilled Shaft Construction, November 28, 2001.
American Society for Testing and Materials. (1995). C 143: Test Method for Slump of
Hydraulic Cement Concrete (Vol. 04.02). West Conshohocken, PA: AmericanSociety for Testing and Materials.
American Society for Testing and Materials. (1998). C 109-98: Standard Test Method for
Compressive Strength of Hydraulic Cement Mortars. Philadelphia, PA: AmericanSociety for Testing and Materials.
Ata, A.A. and M.W. O’Neill (1998). “Side-wall Stability and Side-shear Resistance in BoredPiles Constructed with High Molecular Weight Polymer Slurry.” Deep Foundations
on Bored and Auger Piles: Proceedings of the 3 International Geotechnicalrd
Seminar on Deep Foundations on Bored and Auger Piles. 111-118.
Baker, C. N., Parikh, G., Briaud, J-L., Drumright, E.E., Mensah, F. (1993). Drilled Shafts
for Bridge Foundations. Mountain View, CA: Federal Highway Administration.
Bandis, S. C., and Barton, N. (1986). Failure Modes of Deep Boreholes. Paper presented atthe U.S. Symposium on Rock Mechanics (27th), Tuscaloosa, Alabama.
Beresford, J.J., P.M. Cashman, and R.G. Hollamby (1989). “The Merits of Polymeric Fluidsas Support Slurries.” Proceedings of the International Conference on Piling and
Deep Foundations. A.A. Balkema, Rotterdam, 3-10.
Bernal, J. B., and Reese, L.C. (1983). Study of the Lateral Pressure of Fresh Concrete as
Related to the Design of Drilled Shafts. Unpublished Doctoral Dissertation,University of Texas at Austin, Austin.
Blitz, J. (1971). Ultrasonics: Methods and Applications, Van Nostrand Reinhold Company,New York, pp. 151.
Bowles, J. E. (1996). Foundation analysis and design (5th ed.). New York: McGraw-Hill.
Branagan & Associates, Inc.(2002), Using Crosshole Sonic Logging (CSL) To Test Drilled-
Shaft Foundations, Branagan & Associates, Inc., Las Vegaas, NV.
Brown, D. (2002). “Effect of Construction on Axial Capacity of Drilled Foundations inPiedmont Soils.” Journal of Geotechnical Engineering. 128(12), 967-973.

184
Brown, D. and Camp, B. (2002). Personal communication concerning Cooper River BridgeProject.
Brown, D., Muchard, M., and Khouri, B. (2002). The Effect of Drilling Fluid on Axial
Capacity, Cape Fear River, NC. Paper presented at the Deep Foundations InstituteAnnual Conference, San Diego, CA.
Brown, D. and Drew, C. (2000). “Axial capacity of auger displacement piles at AuburnUniversity.” GeoDenver 2000, New Technologies and Design Developments in
Deep Foundations, Geotechnical Special Publication, No. 100, pp.397-403, Reston,VA.
Brown, D.A. and Vinson, J. (1998). “Comparison of strength and stiffness parameters forPiedmont residual soil.” Geotechnical Site Characterizations, Proceedings of theFirst International Conference on Site Characterization, Atlanta, GA, April.
Camp, W.M., D.A. Brown, and P.W. Mayne (2002). “Construction Method Effects onAxial Drilled Shaft Performance.” Deep Foundations 2002: An International
Perspective on Theory, Design, Construction, and Performance. International DeepFoundations Congress, Orlando, FL., 193-208.
Carter, J. P. (1988). A Semi-Analytical Solution For Swelling Around A Borehole.International Journal for Numerical and Analytical Methods in Geomechanics, vol.
12, pp. 197-212.
Chadeisson, R. (1971). Influence of the Boring Method on the Behavior of Cast-in-Place
Bored Piles. Paper presented at the 5th International Conference on Soil Mechanicsand Foundation Engineering, Paris, France.
Crapps, D. K. (1992). Structures Foundations Construction Manual. Gainesville, FL:Prepared for the Florida Department of Transportation.
Dapp, S. D. (2002). Pressure grouting of drilled shaft tips in sand. Unpublished DoctoralDissertation, University of South Florida, Tampa.
Davis, A.G. & Hertlein, B.H. (1993), Evaluation of the Integerity of Some Large Concrete
Structures Using NDT,” American Concrete Institute Spring Convntion, Vancouver,March.
Davis, A.G., & Robertson, S.A. (1976), Vibration Testing of Piles,” Structural Engineering,June, pp. A7-A10.

185
Finno, R.J. & Prommer, P.J. (1994). Evaluation on Inaccessible Drilled Shafts Using the
Impulse Response Method: Northwestern University, Infrastructure TechnologyInstitute: ITI Publications Directory.
Florida Department of Transportation. (2000). Section 346: Portland Cement Concrete.Tallahassee, FL: FDOT.
Florida Department of Transportation. (2000). Section 455: Structures Foundations.Tallahassee, FL: FDOT.
Frederick, E. M. (2001). Pressure grouting drilled shaft tips : laboratory scale study in a
frustum confining vessel. Unpublished Master's Thesis, University of South Florida,Tampa.
Frizzi, R.P., M.E. Meyer, and L. Zhou (2004). “Full Scale Field Performance of DrilledShafts Constructed Using Bentonite and Polymer Slurries.” GeoSupport
Conference: Innovation and Cooperation in the Geo-industry, Drilled Shafts,
Micropiling, Deep Mixing, Remedial Methods, and Specialty Foundation Systems.
American Society of Civil Engineers, Reston, VA, 573-586.
Galperin, E.I. (1985), Vertical Seismic Profiling and its Exploration Potential, D. ReidelPublishing Company, Boston, p. 316.
Garbin, E.J. (2003), The Influence of Water Table in Drilled Shaft Construction, DoctoralDissertation, University of South Florida, Tampa, FL.
Garbin, E.J. (2001), Drilled Shaft Integrity Study, University of South Florida, Departmento f C i v i l a n d E n v i r o n m e n t a l E n g i n e e r i n g ,http://www.eng.usf.edu/~garbin/dshafts/background.htm
Grace Construction Products, 2003. Inter Office Memo. W. R. Grace & Co.-Conn, UnitedStates of America.
Gray, G. R., and Gill, J.A. (1974). Stabilizing Boreholes in Austrailian Offshore Drilling.Petroleum Engineer International, vol. 46(6), pp. 49-58.
Herne, T.M., Stokoe, K.H. & Reese, L.C. (1981). Drilled-Shaft Integrity by Wave
Propagation Method,” Journal of Geotechnical Engineering, American Socity ofCivil Engineers, Volume 107, No. 10, October, pp. 1327-1344.
Higgs, J.S. and Robertson, S.A. (1979), Integrity Testing of Concrete Piles by Shock
Method,” Concrete, October, pp. 31-33.

186
Hodgson, T. (2003). SCC Concrete Flow Testing In An L-Box. Auburn, AL: Unpublishede-mail correspondence to E. Garbin.
Horvath, R. G., and Stolle, D.,. (1996). Frustum for Testing Model Piles. Canadian
Geotechnical Journal, Vol. 33(3), 499-504.
Huerstel, G., Hix, Gary L., Gregory, F., Gregory, D. (1989). Using Reverse-Circulation ToDrill Monitoring Wells. Water Wells, 43(7), 57-59.
Kantro, D. L. (1980). Influence of Water-Reducing Admixtures on Properties of CementPaste - A Miniature Slump Test. Cement, Concrete, and Aggregates, Vol. 2(No. 2),95-102.
Kojima, I., Nishimura, S., Tanaka, M., and Kuwabara, F. (1999). Improvement of Pile ToeCapacity by the Statnamic Pre-loading on the Model Pile Test in a FrustumConfining Vessel. Unknown Source.
Lew, M.; Zadoorian, C.J.; Carpenter, L.D. (2002), Integerity Testing of Drilled Piles for Tall
Buildings, Structure, A joint publication of: National Council of Structural EngineersAssociations; Council of Americian Structural Engineers, Structural EngineeringInstitute, October, pp. 14-17.
MacGregor, J.G., Reinforced Concrete: Mechanics and Design (3 Edition), (1996),rd
Prentice Hall.
Majano, R.E., M.W. O’Neill, and K.M. Hassan (1994). “Perimeter Load Transfer in ModelDrilled Shafts Formed Under Slurry.” Journal of Geotechnical Engineering.120(12), 2136-2154.
Maury, V. M., and Sauzay, J-M. (1987). Borehole Instability: Case Histories, Rock
Mechanics Approach, and Results. Paper presented at the SPE/IADC DrillingConference, New Orleans.
Mayne, P.W., Brown, D., Vinson, J., Schneider, J.A., and Finke, K.A. (2000). “Sitecharacterization of Piedmont residual soils at the NGES, Opelika, Alabama.” A2KSpecialty Conference on Performance Verification of Constructed GeotechnicalFacilities, Geotechnical Special Publication, No. 93, pp.160-185, Amherst, MA.
Mindess, S., Young, J.F., and Darwin, D. (2002). Concrete (2 ed.). Upper Saddle River, NJ:Prentice Hall.
Mullins, G. and Winters, D. (2004). “Post Grouting Drilled Shaft Tips - Phase II FinalReport.” Final Report submitted Florida Department of Transportation, June.

187
Olson Engineer ing (2003) , Crosshole Son ic Logging (CSL) ,
www.olsonengineering.com/CSL.html.
O'Neill, M. W., & American Society of Civil Engineers. Geotechnical Engineering Division.(1981). Drilled piers and caissons : proceedings of a session. New York, N.Y.:American Society of Civil Engineers.
O'Neill, M. W., and Reese, Lymon C.,. (1999). Drilled Shafts: Construction Procedures and
Design Methods (Vol. I). Dallas, TX: ADSC: The International Assiociation ofFoundation Drilling.
Paquet, J. (1968). “Etude Vibratoire des Pieux en Beton: Response Harmonique,” Annales
Inst. Tech. Batim, 21 year, No. 245, May, pp. 789-803.st
Passe, P. D. (1993). Drilled Shaft Inspector's Manual. Tallahassee, FL: Florida Departmentof Transportation.
Petersson, A., and Skarendahl, O. (2000). State-of-the-Art Report of RILEM Technical
Committee 174-SCC, Self-Compacting Concrete (No. 23): RILEM Publications.
Poulos, H. G., & Davis, E. H. (1980). Pile foundation analysis and design. New York:Wiley.
Reese, L.C.and Tucker, K.L. (1985). Bentonitic Slurry in Constructing Drilled Piers.Drilled Piers and Caissons II. ASCE Press. May.
Rodin, S. (1952). Pressure of Concrete on Formwork. Paper presented at the Institution ofCivil Engineers, London, England.
Smart, B. G. D., Singh, R.N., and Issac, A.K. (1798). Borehole Instrumentation System forMonitoring Strata Displacement in Three Dimensions. International Journal of Rock
Mechanics and Mining Sciences, vol. 15(2), pp. 77-85.
Speer, D, The Use of NDE for Deep Shaft Foundation Construction Compliance, (1997), 5th
ITI Bridge NDE Users Group Conference (Proceedings), California Department ofTransportation (Caltrans) – Department of Transpiration – Office of StructuralFoundations – Foundations Testing and Instrumentation Section.
Stain, R.T. (1982), Integrity Testing, Civil Engineering, April and May, pp. 55-59 and 71-73.
Stain, R.T. and Williams, H.T. (1987), Integerity Testing of Piles – Horses for Courses,”
International Conference on Piling and Deep Foundations, London, March.

188
Stevens, Joseph E., 1956. “Hoover Dam: an American Adventure.” University ofOklahoma Press, Oklahoma.
STS Consultants Ltd. (1994). The Effects of Free Fall Concrete in Drilled Shafts - A Report
to the Federal Highway Administration. Dallas, TX: ADSC: The InternationalAssociation of Foundation Drilling.
Thasnanipan, N., G. Baskaran, and M.A. Anwar (1998). “Effect of Construction Time andBentonite Viscosity on Shaft Capacity of Bored Piles.” Deep Foundations on Bored
and Auger Piles. Balkerma, 171-180.
Thasnanpan, N., Z.Z. Aye, C. Submaneewong, and W. Teparaksa (2002). “Performance ofWet-Process Bored Piles Constructed with Polymer-Based Slurry in BangkokSubsoil.” ASCE Geotechnical Special Publication. American Society of CivilEngineers, 143-157.
US Federal Highway Administration. (1997). Guide to nondestructive testing of concrete.Washington, D.C.: Available to the public through the National TechnicalInformation Service.
Wagner, Robert, (2003). Unpublished Master’s Thesis. Civil and EnvironmentalEngineering, University of South Florida, Tampa, Florida.
W. R. Grace and Company. (2003). Inter-Office Memorandum. In R. V. Wagner (Ed.).Tampa: Grace Construction Products.
Winters, D. (2002). Discussion of Mini-slump Testing Procedure. Tampa, FL: Personalcommunication with E. Garbin.
189
BIBLIOGRAPHY
Altaee, A., and Fellenius, B.H. (1994). Physical Modeling In Sand. Canadian Geotechnical
Journal, 31, 420-431.
American Society for Testing and Materials. (1981). Standard method of testing piles under
static axial compressive load. Philadelphia, PA: ASTM.
American Society for Testing and Materials. (1996). C 192-95: Standard Practice for
Making and Curing Concrete Test Specimens in the Laboratory. WestConshohocken, PA: American Society for Testing and Materials.
American Society for Testing and Materials. (1998). D 422-98: Particle Size Analysis of
Soils. Philadelphia, PA: American Society of Testing and Materials.
American Society for Testing and Materials. (1999). Standard Test Method for Piles Under
Rapid Axial Compressive Load: Submitted - Unpublished.
American Society for Testing and Materials. (2001). Annual book of ASTM standards, 2001.
section 4 vol 04.08, Construction soil and rock (I) D 420-D 5779. WestConshohocken, PA: American Society for Testing and Materials.
Baker, C. N., & American Society of Civil Engineers. Geotechnical Engineering Division.(1985). Drilled piers and caissons II : construction under slurry/nondestructive
integrity evaluation/load testing/geotechnical behavior under load : proceedings of
a session. New York, N.Y.: ASCE.
Committee on Deep Foundations. (1984). Practical Guidelines for the Selection, Design and
Installation of Piles. New York, NY: American Society of Civil Engineers.
Das, B. M. (1993). Principles of soil dynamics. Boston: PWS-Kent Pub. Co.
Dunnicliff, J., & Green, G. E. (1988). Geotechnical instrumentation for monitoring field
performance. New York: Wiley.
Garbin, E. J. (1999). Data interpretation for axial statnamic testing and the development of
the statnamic analysis workbook. Unpublished Master's Thesis, University of SouthFlorida, Tampa.
Greer, D. M., & Gardner, W. S. (1986). Construction of drilled pier foundations. New York:Wiley.

190
Holtz, R. D., & Kovacs, W. D. (1981). An introduction to geotechnical engineering.Englewood Cliffs, N.J.: Prentice-Hall.
Huang, H.-C., Li, Zheng-Hua, and Usmani, Asif, S. (1999). Finite element analysis of non-
Newtonian flow : theory and software. London ; New York: Springer.
Kramer, S. L. (1996). Geotechnical earthquake engineering. Upper Saddle River, N.J.:Prentice Hall.
Lew, H. S., & ACI Committee 228--Nondestructive Testing of Concrete. (1988).Nondestructive testing. Detroit: American Concrete Institute.
Lewis, C. L. (2003). Personal Communication: Discussion of SIT Data Interpretation.
Liu, C., & Evett, J. B. (1998). Soils and foundations (4th ed.). Upper Saddle River, N.J.:Prentice Hall.
Malhotra, V. M. (1984). In situ/nondestructive testing of concrete. Detroit (P.O. Box 19150,Redford Station, Detroit 48219): American Concrete Institute.
Malhotra, V. M., & Carino, N. J. (1991). CRC handbook on nondestructive testing of
concrete. Boca Raton: CRC Press.
Nedderman, R. M. (1992). Statics and kinematics of granular materials. Cambridge ; NewYork: Cambridge University Press.
Oda, M., & Iwashita, K. (1999). Mechanics of granular materials : an introduction.Rotterdam: Balkema.
O'Neill, M. W., and Hassen, K. (1994). Drilled Shafts: Effects of Construction on
Performance and Design Criteria. Paper presented at the International Conferenceon Design and Construction of Deep Foundations.
Sedran, G. (1999). Experimental and Analytical Study of a Frustum Confining Vessel.
Unpublished Doctoral Dissertation, McMaster University, Hamilton, Ontario.
Sedran, G., Stolle, D.F.E., and Horvath, R.G. (1997). Modeling the Stress Fields in aFrustum Confining Vessel. Canadian Geotechnical Journal.
Sedran, G., Stolle, D.F.E., and Horvath, R.G. (1997). Physical Modeling of Load Tests onPiles. Canadian Geotechnical Journal.

191
Tanner, R. I. (1985). Engineering rheology. Oxford *Oxfordshire*: Clarendon Press.
The Joint Caisson - Drilled Shaft Committee. (1989). Drilled Shaft Inspector's Manual (1sted.). Dallas, TX: ADSC: The International Association of Foundation Drilling &DFI: Deep Foundation Institute.

192
THIS PAGE IS INTENTIONALLY BLANK

193
APPENDICES

194
THIS PAGE IS INTENTIONALLY BLANK

Appendix A. Section 455 A and C with Commentary
195
SECTION 455 A and C with Commentary
STRUCTURES FOUNDATIONS

Appendix A (Continued).
196
Index
A. General 455-1 through 455-2
C. Drilled Shafts 455-13 through 455-24
A. GENERAL
455-1 General Requirement.
The Contractor may examineavailable soil samples and/or rock coresobtained during the soil boring operationsat the appropriate District MaterialsOffice.

Appendix A (Continued).
197
455-1.1 Protection of Existing
Structures: When the plans requirefoundation construction operations inclose proximity to existing structures, takeall reasonable precautions to preventdamage to such structures. Therequirements described herein apply to alltypes of structures (on or off the right-of-way) that may be adversely affected byfoundation construction operations(including phase construction) due tovibrations, ground loss, ground heave, ordewatering. Protect utilities as describedin 7-11.6.
Monitor structures for settlementin a manner approved by the Engineer,recording elevations to 0.001 foot [0.5mm]. Monitor the following structures:
(1) shown in the plans.(2) within a distance, in feet, of
pile driving operations equal to 0.5 timesthe square root of the hammer energy, infoot-pounds [in meters, of pile drivingoperations equal to 4.14 times the squareroot of the hammer energy, in kilojoules].Take required measurements before theinitiation of driving and then daily on dayswhen driving occurs or as indicated in theplans and weekly for two weeks afterdriving has stopped.
(3) within a distance of ten shaftdiameters or the estimated depth ofexcavation, whichever is greater.
(4) within a distance of three timesthe depth of excavation for the footing.
Obtain the Engineer's approval ofthe number and location of monitoringpoints. Take elevation;
(1) before beginning construction,(2) daily during the driving of any
casings, piling, or sheeting,(3) weekly for two weeks after

Appendix A (Continued).
198
stopping driving,(4) during excavation,(5) during blasting,(6) or as directed by the Engineer.
Notify the Engineer of any movementsdetected and immediately take anyremedialmeasures required to prevent damage tothe existing structures.
Except as noted herein, employ aqualified Specialty Engineer to survey allstructures, or portions thereof, within:
(1) a distance, in feet, of piledriving operations equal to 0.25 times thesquare root of the hammer energy, in foot-pounds [in meters, of pile drivingoperations equal to 2.07 times the squareroot of the hammer energy, in kilojoules]
(2) a distance of ten shaftdiameters or the estimated depth ofexcavation, whichever is greater
(3) three times the excavationdepth
(4) or as shown in the plansThe Department will make the
necessary arrangements to provide right-of-way entry forthe Contractor's engineer to survey.Adequately document the condition of thestructures and all existing cracks withdescriptions and pictures. Prepare tworeports documenting the condition of thestructures: one report before beginningfoundation construction operations and asecond report after completing foundationconstruction operations. The Departmentwill take ownership of both reports. Donot performpre-driving and post-driving surveys ofthe condition of bridges owned by theDepartment except when shown in the
Appendix A (Continued).
199
Contract Documents.When shown in the Contract
Documents, employ a qualified SpecialtyEngineer to monitor and record vibrationlevels during the driving of casings,piling, sheeting, or blasting operations.Provide vibration monitoring equipmentcapable of detecting velocities of 0.1 in/s[2.5 mm/s] or less.
Upon detecting settlement of 0.005foot [1.5 mm], vibration levels reaching0.5 in/s [13 mm/s], levels otherwiseshown in the Contract Documents, ordamage to the structure, immediately stopthe source of vibrations, backfill any opendrilled shaft excavations, and contact theEngineer for instructions.
When the plans requireexcavations for construction of footings orcaps, the Contractor is responsible forevaluating the need for, design of, andproviding any necessary features toprotect adjacent structures. Constructsheeting and shoring as detailed in theplans. When sheeting and shoring are notdetailed in the plans, employ a SpecialtyEngineer to design the sheeting andshoring, and to sign and seal the plans andspecification requirements. Send thesedesigns to the Engineer for his recordbeforebeginning construction.
Also, when shown in the ContractDocuments or when authorized by theEngineer, install the piling to the depthrequired to minimize the effects ofvibrations or ground heave on adjacentstructures by approved methods other thandriving (preformed holes, predrilling,jetting, etc.). In the event the Departmentauthorizes the use of preformed pile holesto meet this requirement, the Department
Appendix A (Continued).
200
will pay for this work as described in 455-5.9.3.
Do not drive piles within 200 feet[60 m] of concrete less than two days oldunlessauthorized by the Engineer.
Also if not otherwise provided inthe plans, the Contractor is responsible forevaluating the need for, design of, andproviding all reasonable precautionaryfeatures to prevent damage, including, butnot limited to, selecting constructionmethods and procedures that will preventdamaging caving of the shaft excavationand monitoring and controlling thevibrations from construction activities,including driving of casings, driving ofsheeting, and blasting.
When shown in the plans ordirected by the Engineer, install apiezometer near the right-of-way line andnear any structure that may be affected bylowering the ground water whendewatering is required. Monitor thepiezometer and record the ground waterelevation level daily. Notify the Engineerofany ground water lowering near thestructure of 12 inches [300 mm] or more.
Appendix A (Continued).
201
455-1.2 Excavation: Complete allexcavation of the foundations prior toinstalling piles or shafts unless otherwiseauthorized by the Engineer. Aftercompleting pile/shaft installation, removeall loose and displaced materials fromaround the piles/shafts, leaving a clean,solid surface. Compact the soil surface onwhich concrete is to be placed or whichwill support the forming system for theconcrete to a density not less than 90% ofthe maximum density as determined byAASHTO T 180, and which will supportthe load of the plastic concrete withoutsettling or causing the concrete to crack,or as shown in the Contract Documents.The Engineer will not require theContractor to compact for excavationsmade below water for seals or when thefooting or cap or forming system(including supports) does not rest on theground surface.
Appendix A (Continued).
202
455-1.2.1 Abutment (End Bent) Fill:
Place and compact the fill beforeinstalling end-bent piling/shafts, exceptwhen:
(1) driving specified test piling inend bents or,
(2) the plans show uncased pilesthrough proprietary retaining wall fills.
When installing piles/shafts orcasing prior to placing fill, take necessaryprecautions to prevent displacement ofpiles/shafts during placing andcompacting fill materials within 15 feet[4.5 m] of the piles/shafts or casing.Reference and check the position of thepiles/shafts or casing at threeapproximately equal intervals duringconstruction of the embankment.
Place embankment material in 6inch [150 mm] loose lifts in the 15 foot[4.5 m] area around the piles/shafts orcasing. Compact embankment materialwithin the 15 foot [4.5 m] area adjacent tothe piles/shafts or casing to the requireddensity with compaction equipmentweighing less than 1,000 pounds [450 kg].When installing piles/shafts prior to thecompletion of the surrounding fills, do notcap them until placing the fills as near tofinal grade as possible, leaving only thenecessary working room for constructionof the caps.
Provide permanent casings for alldrilled shafts through mechanicallystabilized fills (for example, behindproprietary retaining walls). Providepermanent casings for conventional fills15 foot [4.5 m] or greater in height exceptwhen shown otherwise in the plans. Donot provide permanent casings forconventional fills less than 15 foot [4.5 m]in height except when shown in the plans

Appendix A (Continued).
203
or when directed by the Engineer. Installtemporary casings through the completedconventional fill when permanent casingsare not required.
Provide permanent casings, ifrequired, before the fill is placedextending a sufficient distance into theexisting ground to provide stability to thecasings during construction of theabutment fill.
Appendix A (Continued).
204
455-1.3 Cofferdams: Constructcofferdams as detailed in the plans. Whencofferdams are not detailed in the plans,employ a Specialty Engineer to designcofferdams, and to sign and seal the plansand specification requirements. Send thedesigns to the Engineer for his recordsbefore beginning construction.
Provide a qualified diver and asafety diver to inspect the conditions ofthe foundation enclosure or cofferdamwhen the Contract Documents require aseal for construction. Equip these diverswith suitable voice communications, andhave them inspect the foundationenclosure and cofferdam peripheryincluding each sheeting indentation andaround each piling or drilled shaft toensure that no layers of mud or otherundesirable materials were left above thebottom of seal elevation during theexcavation process. Also have the diverscheck to make sure the surfaces of thepiles or drilled shafts are sufficiently cleanto allow bond of the concrete down to theminimum bottom of seal elevation. Whenrequired, ensure that there are no moundsof stone, shell, or other authorized backfillmaterial left after placement and grading.Assist the Engineer as required to ensurethat the seal is placed as specified andevaluate the adequacy of the foundationsoils or rock. Correct any deficienciesfound by the divers. Upon completion ofinspection by the divers, the Departmentmay also elect to inspect the work beforeauthorizing the Contractor to proceed withsubsequent construction operations.Furnish the Engineer a written report bythe divers indicating the results of theirunderwater inspection before requestingauthorization to place the seal concrete.

Appendix A (Continued).
205
455-2 Static Compression Load Tests.
455-2.1 General: Employ a professionaltesting laboratory, or Specialty Engineerwith prior load test experience, to conductthe load test in compliance with theseSpecifications, to record all data, and tofurnish reports of the test results to theEngineer except when the ContractDocuments show that the Department willsupply a Geotechnical Engineer to providethese services.
Use a load for the test that is threetimes the design load, the maximum loadshown in the plans or as designated by theEngineer (within the limits of the testequipment provided), or the failure load,whichever occurs first.
Do not apply test loads to pilessooner than 48 hours (or the time intervalshown in the plans) after driving of thetest pile or reaction piles, whicheveroccurs last.
Allow up to four weeks after thelast load test for the analysis of the loadtest data and to provide all the estimated productiondrilled shaft tip elevations. If theContractor is willing to constructproduction shafts in areas designated bythe Engineer, he shall set shaft tipelevations as required to keep himworking, beginning one week after thefinal load test.
Do not begin static load testing ofdrilled shafts until the concrete hasattained a compressive strength of 3,400psi [23.5 MPa]. The Contractor may usehigh early strength concrete to obtain thisstrength at an earlier time to preventtesting delays.
Load test piles/shafts in the order
Appendix A (Continued).
206
directed by the Engineer. The Departmentwill furnish certain load test equipment and/orpersonnel when shown in the plans.Inspect all equipment to be furnished bythe Department at least 30 days prior touse, and notify the Engineer of anyequipment that is not in satisfactoryoperating condition. The Department willconsider any necessary repairs ordered bythe Engineer to place the equipment insatisfactory operating condition asUnforeseeable Work. Provide theremainder of the equipment and personnelneeded to conduct the load tests. Unlessshown otherwise in the ContractDocuments, provide all equipment,materials, labor, and technical personnelrequired to conduct the load tests,including determination of anchor reactionmember depths. In this case, provide aloading apparatus designed toaccommodate the maximum load plus anadequate safety factor.
While performing the load test,provide safety equipment, and employsafety procedures consistent with thelatest approved practices for this work.Include with these safety proceduresadequate support for the load test platesand jack to prevent them from falling inthe event of a release of load due to hydraulic failure, test shaft failure, or anyother cause.
Include in the bid the cost oftransporting load test equipment andinstrumentation supplied by theDepartment from their storage location tothe job site and back. Handle these itemswith care. The Contractor is responsiblefor the safe return of these items. Aftercompletion of the static load tests, return

Appendix A (Continued).
207
all Department furnished equipment insatisfactory operating condition. Repairall damage to the test equipment furnishedby the Department to the satisfaction ofthe Engineer. Clean all areas of rust onstructural steel items, and repaint thoseareas in accordance with Section 561.Return all load test equipment supplied bythe Department within 30 days aftercompleting the load tests.
The Contractor is responsible forthe equipment from the time it leaves itsstorage area until the time it is returned.During this time, insure the equipmentagainst loss or damage for the replacementcost thereof (the greater of $150,000 orthe amount shown in the plans) or for thefull insurable value if replacement costinsurance is not available.
Notify the Engineer at thepreconstruction conference or no later than 30days before beginning test pile installation ofthe proposed testing schedule so that itemssupplied by the Department may be reserved.Notify the Department at least ten workingdays before pick-up or return of theequipment. During pick-up, the Departmentwill complete a checklist of all equipmentplaced in the Contractor's possession. TheDepartment will later use this checklist toverify that the Contractor has returned allequipment. Provide personnel and equipmentto load or unload the equipment at theDepartment's storage location. Provide liftingtongs or nylon slings to handle Departmentowned test girders. Do not perform cutting,welding, or drilling on Department ownedgirders, jacks, load cells, or other equipment.

Appendix A (Continued).
208
455-2.2 Loading Apparatus: Provide anapparatus for applying the vertical loadsas described in one of the following:
(1) As shown and described in theContract Documents.
(2) As supplied by the Contractor,one of the following devices designed toaccommodate a load at least 20% higherthan that shown in the ContractDocuments or described herein for testloads:
(a) Load Applied byHydraulic Jack Acting Against WeightedBox or Platform: Construct a test box ortest platform, resting on a suitable support,over the pile, and load it with earth, sand,concrete, pig iron, or other suitablematerial with a total weight greater thanthe anticipated maximum test load. Locatesupports for the weighted box or platformat least 6 feet [2 m] or three pile/shaftdiameters, whichever is greater, measuredfrom the edge of the pile or shaft to theedge of the supports. Insert a hydraulicjack with pressure gauge between the testpile or shaft and the underside of thereaction beam, and apply the load to thepile or shaft by operating the jack betweenthe reaction beam and the top of the pileor shaft.
(b) Load Applied to theTest Pile or Shaft by Hydraulic JackActing Against Anchored ReactionMember: Construct reaction memberanchorages as far from the test piles/shaftsas practical, but in no case closer than thegreater of 3 pile/shaft diameters or 6 feet[2 m] from the edge of thetest pile/shaft. Attach a girder(s) ofsufficient strength to act as a reactionbeam to the upper ends of the anchor pilesor shafts. Insert a hydraulic jack with

Appendix A (Continued).
209
pressure gauges between the head of thetest pile/shaft and the underside of thereaction beam, and apply the test load tothe pile/shaft by operating the jack between the reaction beam and thepile/shaft head.
If using drilled shafts with bells asreaction member anchorages, locate thetop of the bell of any reaction shaftanchorage at least three shaft diametersbelow the bottom of the test shaft.
(c) Combination Devices:The Contractor may use a combination ofdevices (a) and (b), as described above, toapply the test load to the pile or shaft.
(d) Other SystemsProposed by the Contractor and Approvedby the Engineer:When necessary, provide horizontalsupports for loading the pile/shaft, andspace them so that the ratio of theunsupported length to the minimum radiusof gyration of the pile does not exceed 120for steel piles, and the unsupported lengthto the least cross-section dimension doesnot exceed 20 for concrete piles or drilledshafts. Ensure that horizontal supportsprovide full support without restrainingthe vertical movement of the pile in anyway.
When required by the ContractDocuments, apply a horizontal load to theshaft either separately or in conjunctionwith the vertical load. Apply the load tothe test shaft by hydraulic jacks, jackingagainst Contractor provided reactiondevices. After receiving the Engineer'sapproval of the proposed method of loadapplication, apply the horizontal load inincrements, and relieve it in decrements asrequired by the Contract Documents.

Appendix A (Continued).
210
455-2.2.1 Modified Quick Test:
(a) Loading Procedure - Piles:Place the load on the pile continuously, inincrements equal to approximately 5% ofthe maximum test load specified untilapproaching the failure load, as indicatedby the measuring apparatus and/orinstruments. Then, apply increments ofapproximately 2.5% until the pile"plunges" or attains the limiting load. TheEngineer may elect to stop the loadingincrements when he determines theContractor has met the failure criteria orwhen a settlement equal to 10% of the pilewidth or diameter is reached. Apply eachload increment immediately after takingand verifying the complete set of readingsfrom all gauges and instruments. Applyeach increment of load within theminimum length of time practical, andimmediately take the readings. Completethe addition of a load increment and thecompletion of the readings within five to15 minutes. The Engineer may elect tohold the maximum applied load up to onehour.
Remove the load in decrements ofabout 10% of the maximum test load.Remove each decrement of load withinthe minimum length of time practical, andimmediately take the readings. Completethe removal of a load decrement and thetaking of the readings within five to 15minutes. The Engineer may also requireup to two reloading cycles with fiveloading increments and three unloadingdecrements. Record the final recovery ofthe pile until movement is essentiallycomplete for a period up to one hour afterthe last unload interval.
(b) Failure Criteria and Safe-Load:Use the criteria described herein to

Appendix A (Continued).
211
establishthe failure load. The failure load isdefined as the load that causes a pile topdeflection equal to the calculated elasticcompression plus 0.15 inch [3.8 mm] plus1/120 of the pile minimum width or thediameter in inches [millimeters] for piles24 inches [610 mm] or less in width, andequal to the calculated elastic compressionplus 1/30 of the pile minimum width ordiameter for piles greater than 24 inches[610 mm] in width. Consider the safeallowable load of any pile so tested aseither 50% of the maximum applied loador 50% of the failure load, whichever issmaller.
Appendix A (Continued).
212
455-2.2.2 Loading Procedure -
Shafts: Apply vertical loads concentricwith the longitudinal axis of the testedshaft to accurately determine and controlthe load acting on the shaft at any time.
Place the load on the shaftcontinuously in increments equal toapproximately 5% of the maximum testload specified until approaching thefailure load, as indicated by theinstruments. Then, apply increments ofapproximately 2.5% until the shaft"plunges" or attains the limiting load. TheEngineer may elect to stop the loadingincrements when he determines that thefailure criteria has been met or asettlement equal to 10% of the shaft widthis reached. Apply each load incrementimmediately after taking and verifying thecomplete set of readings from all gaugesand instruments. Apply each increment ofload within the minimum length of timepractical, and immediately take theinstrument system readings. Complete theaddition of a load increment and thetaking of the instrument system readingswithin five to fifteen minutes. TheEngineer may elect to hold the maximumapplied load up to one hour.
Remove the load in decrements ofabout 10% of the maximum test load.Remove each decrement of load withinthe minimum length of time practical andtake the instrument system readingsimmediately. Complete the removal of aload decrement and the taking of theinstrument system readings within five tofifteen minutes. The Engineer may alsorequire up to two reloading cycles withfive loading increments and threeunloading decrements. Record the finalrecovery of the shaft until movement is

Appendix A (Continued).
213
essentially complete for a period up to onehour after the last unload interval.
Use the criteria described herein toestablish the failure load unless shownotherwise in the Contract Documents.The failure load is defined as follows:
(1) for shafts with diameters up to24 inches [610 mm], the load that causesa shaft top deflection equal to thecalculated elastic compression, plus 0.15inch [4 mm], plus 1/120 of the shaftdiameter in feet [millimeters],
(2) for shafts with diameters largerthan 24 inches [610 mm], the load thatcauses a shaft top deflection equal to thecalculated elastic compression, plus 1/30of the shaft diameter.
Consider the safe allowable loadof any shaft so tested as either 50% of themaximum applied load or 50% of thefailure load, whichever is smaller.
Appendix A (Continued).
214
455-2.3 Measuring Apparatus:
Provide an apparatus for measuringmovement of the testpiles/shafts that consists of all of thefollowing devices:
(1) Wire Line and Scale: Stretch awire as directed by the Engineer betweentwo supports located at a distance at least:
(a) 10 feet [3 m] from thecenter of the test pile but not less than 3.5times the pile diameter or width.
(b) 12 feet [3.7 m] from thecenterline of the shaft to be tested but notless than three shaft diameters.
Locate the wire supports as far aspractical from reaction beam anchorages.At over-water test sites, the Contractormay attach the wire line as directed by theEngineer to the sides of the serviceplatform. Mount the wire with a pulley onone support and a weight at the end of thewire to provide constant tension on thewire. Ensure that the wire passes acrossthe face of a scale mounted on a mirrorattached to the test pile/shaft so thatreadings can be made directly from thescale. Use the scale readings as a checkon an average of the dial readings. Whenmeasuring both horizontal and verticalmovement, mount separate wires toindicate each movement, horizontal orvertical. Measure horizontal movementsfrom two reference wires set normal toeach other in a horizontal.
(2) Wooden Reference Beams AndDial Gauges: Attach wooden referencebeams as detailed in the plans or approvedby the Engineer to independent supports.For piles, install the greater of 3.5 timesthe pile diameter or width or 10 feet [3 m]from the centerline of the test pile. Fordrilled shafts install the greater of three

Appendix A (Continued).
215
shaft diameters or 12 feet [3.7 m] from thecenterline of the shaft to be tested. Locatethe reference beam supports as far aspractical from reaction beam anchorages.For over-water test sites, the Contractormay attach the reference beams asdirected by the Engineer between twodiagonal platform supports. Attach dialgauges, with their stems resting either onthe top of the pile/shaft or on lugs orsimilar reference points on the pile/shaft,to the fixed beams to record the movementof the pile/shaft head. Ensure that the areaon the pile/shaft or lug on which the stembears is a smooth surface which will notcause irregularities in the dial readings.
For piles, the minimum acceptablemethod for measuring vertical movementis two dial gauges, each with 0.001 inch[0.025 mm] divisions and with 2 inch [50mm] minimum travel, placed at 180degrees or at the diagonal corners of thepile.
For shafts, ensure that three dialgauges, each with 0.001 inch [0.025 mm]divisions and with 2 inch [50 mm]minimum travel, placed at 120-degreeintervals around the shaft, are theminimum acceptable method formeasuring vertical movement. Ensurethat four dial gauges, each with 0.001 inch[0.025 mm] divisions and with 2 inch [50mm] minimum travel, placed at 90 degreeintervalsare the minimum required for measuringhorizontal movement.
(3) Survey Level: As a check onthe dial gauges, determine the elevation ofa point near the top of the test pile/shaft(on plan datum) by survey level at eachload and unload interval during the loadtest. Unless approved otherwise by the
Appendix A (Continued).
216
Engineer, level survey precision is 0.001foot [0.3 mm]. Alternately, the surveyormay read an engineer's 50 scale attachednear the pile/shaft head. Determine thefirst elevation before applying the firstload increment; make intermediatereadings immediately before a loadincrement or an unload decrement, andafter the final unload decrement thatcompletely removes the load. Make afinal reading at the time of the lastrecovery reading or as directed by theEngineer.
For over-water test sites, whenshown in the plans or directed by theEngineer, the Contractor shall drive an Hpile through a 36 inch [914 mm] casing toprovide a stable support for the level andto protect it against wave actioninterfering with level measurements.Provide a suitable movable jig for the surveyor to stand. Use a jig thathas a minimum of three legs, has a workplatform providing at least 4 feet [1.2 m]width of work area around the casing, andis approved by the Engineer before use.The described work platform may besupported by the protective casing whenapproved by the Engineer.
Appendix A (Continued).
217
455-2.4 Load Test Instrumentation:
(1) General: The intent of the loadtest instrumentation is to measure the testload on top of the pile and, when providedin the Contract Documents, its distributionbetween side friction and end bearing toprovide evaluation of the preliminarydesign calculations and settlementestimates and to provide information forfinal pile/shaft length design. Ensure thatthe instrumentation is as described in theContract Documents.
When requested by the Engineer,provide assistance during installation ofany instrumentation supplied by theDepartment. Supply 110 V, 60 Hz, 30 Aof AC electric power in accordance withthe National Electric Code to each testpile/shaft site during the installation of theinstrumentation, during the load testing,and during any instrumented redrivesordered by the Engineer.
Place all of the internalinstrumentation on the rebar cage beforeinstallation in the test shaft. Construct therebar cage at least two days before it isrequired for construction of the test shaft.Provide assistance during installation ofinstrumentation supplied by theDepartment, including help to string,place, and tie the instrumentation and anyassistance needed in moving orrepositioning the cage to facilitateinstallation. Place the rebar cage in ones e g m e n t c o m p l e t e w i t h i t sinstrumentation. The Engineer mayrequire multiple lift points and/or asuitable "stiffleg" (length of H pile orother suitable section) to get the cage in avertical position without causing damageto the instrumentation. Successfullydemonstrate the lifting and handling
Appendix A (Continued).
218
procedures before the installinginstrumentation.
(2) Hydraulic Jack and Load Cell:Provide hydraulic jack(s) of adequate sizeto deliver the required test load to thepile/shaft unless shown otherwise in theplans. Before load testing begins, furnisha certificate from a reputable testinglaboratory showing a calibration of gaugereadings for all stages of jack loading and unloading for jacksprovided. Ensure that the jack has beencalibrated within the preceding six monthsunless approved otherwise. Recalibratethe jack after completing load testing if sodirected by the Engineer. Ensure that theaccuracy of the gauge is within 5% of thetrue load.
Provide an adequate load cellapproved by the Engineer that has beencalibrated within the preceding sixmonths. Provide an approved electricalreadout device for the load cell. Beforebeginning load testing, furnish acertificate from a reputable testinglaboratory showing a calibration ofreadings for all stages of loading andunloading for load cells furnished by theContractor. Ensure that the accuracy ofthe load cell is within 1% of the true load.
If the Department supplies theContractor with the jack and/or load cell,have the equipment calibrated and includethe cost in the cost for static load test.
(3) Telltales: When shown in theContract Documents, provide telltales thatconsist of an unstressed steel rod placed,with appropriate clearance and greased forreducing friction and corrosion, inside aconstant-diameter pipe that rests on a flatplate attached to the end of the pipe at apoint of interest shown in the plans.
Appendix A (Continued).
219
Construct telltales in accordance withdetails shown in the Contract Documents.Install dial gauges reading to 0.001 inch[0.025 mm] with 1 inch [25 mm]minimum travel as directed by theEngineer to measure the movement of thetelltale with respect to the top of thepile/shaft.
(4) Embedded Strain Gauges:When shown in the Contract Documents,provide strain gauges which shall beplaced in the test shaft to measure thedistribution of the load. Ensure that thetype, number, and location of the straingauges are as shown in the plans or asdirected by the Engineer. Use straingauges that are waterproof and havesuitable shielded cable that is unsplicedwithin the shaft.
455-2.5 Support Facilities: Furnishadequate facilities for making load andsettlement readings 24 hours per day.Provide such facilities for theinstrumented area, and include lightingand shelter from rain, wind, and directsunlight.

Appendix A (Continued).
220
455-2.6 Load Test Personnel
Furnished by the Contractor: Providea certified welder, together with necessarycutting and welding equipment, to assistwith the load test setup and to make anynecessary adjustments during the load test.Provide personnel to operate the jack,generators, and lighting equipment, andalso provide one person withtransportation to assist as required duringload test setup and conducting of the loadtests. Provide personnel required to readthe dial gauges, take level measurements,and conduct the load test, except when theContract Documents show that theDepartment will provide these personnel.
455-2.7 Cooperation by the
Contractor: Cooperate with theDepartment, and ensure that theDepartment has access to all facilitiesnecessary for observation of the conductand the results of the test.

Appendix A (Continued).
221
455-2.8 Required Reports: Submit apreliminary static load test report to theEngineer within five days aftercompleting the load test. When theContract Documents do not requireinternal instrumentation, submit the finalreport within ten days after completing theload test. Furnish the final report of testresults for internally instrumented shaftswithin 30 days after completing the loadtest. Include in the report of the load testthe following information:
(1) A tabulation of the time of, andthe amount of, the load and settlementreadings, and the load and recoveryreadings taken during the loading andunloading of the pile.
(2) A graphic representation of thetest results, during loading and unloadingof pile top movement as measured by theaverage of the dial gauge readings, fromwireline readings and from level readings.
(3) A graphic representation of thetest results, when using telltales, showingpile compression and pile tip movement.
(4) The estimated failure and safeloads according to the criteria describedherein.
(5) Remarks concerning anyunusual occurrences during the loading ofthe pile.
(6) The names of those making therequired observations of the results of theload test, the weather conditionsprevailing during the load test, and theeffect of weather conditions on the loadtest.
(7) All supporting data includingjack and load cell calibrations andcertificates and other equipment requiringcalibration.
(8) When the Contract Document
Appendix A (Continued).
222
requires internal instrumentation of theshaft, furnish all of the data taken duringthe load test together with instrumentcalibration certifications. In addition,provide a report showing an analysis ofthe results of axial load and lateral loadtests in which soil resistance along andagainst the shaft is reported as a functionof deflection.
Provide the necessary report(s)prepared by a qualified GeotechnicalEngineer registered in Florida as aSpecialty Engineer except when theContract Documents show that theDepartment will provide a GeotechnicalEngineer.
C. DRILLED SHAFTS
455-13 Description.
Construct drilled shaft foundationsconsisting of reinforced, or unreinforced whenindicated in the plans, concrete drilled shaftswith or without bell footings.
455-14 Materials.
455-14.1 Concrete: For all concretematerials, meet the requirements of Section346. Use concrete that is specified in theplans.
C455-14.1: The concrete design should be inaccordance with the plans, but a typical water-cement ratio is less than or equal to 0.41.Section 346-3.2 states that the initial slumpmust be from 7” to 9”. The required concretestrength varies, but should be specified in theplans. Typically, 3400 psi is used in slightlyaggressive environments and 4000 psi inmoderate to extremely aggressiveenvironments. High-early cement is typicallyused in the mix if the shaft must be load testedbefore the strength reaches 3400 psi (455-2.1).Air contents range from 3 to 6 percent.
Appendix A (Continued).
223
455-14.2 Reinforcing Steel: Meet thereinforcing steel requirements of Section 415.Ensure that reinforcing steel is in accordancewith the sizes, spacing, dimensions, and thedetails shown in the plans.
455-15 Construction Methods and
Equipment.
455-15.1 General Requirements:
455-15.1.1 Templates: Provide a fixedtemplate, adequate to maintain shaft positionand alignment during all excavation andconcreting operations, when drilling from abarge. Do not use floating templates (attachedto a barge). The Engineer will not require atemplate for shafts drilled on land providedthe Contractor demonstrates satisfactorily tothe Engineer that shaft position and alignmentcan be properly maintained. The Engineerwill require a fixed template, adequate tomaintain shaft position and alignment duringall excavation and concreting operations, forshafts drilled on land when the Contractorfails to demonstrate satisfactorily that he canproperly maintain shaft position andalignment without use of a template.
Appendix A (Continued).
224
455-15.1.2 Drilled Shaft Installation
Plan: At the preconstruction conference or nolater than 30 days before beginning drilledshaft construction, submit a drilled shaftinstallation plan for approval by the Engineer.Include in this plan the following details:
C455-15.1.2: The purpose of a DrilledShaft Installation Plan is to detail the methodof construction and develop a contingencyshould obstacles arise during construction. Itshould provide sufficient information to theEngineer so that he/she may evaluate theconstruction equipment and methods, as wellas the experience of key personnel. The planshould be submitted no later than 30 daysprior to installation of any test hole, test shaft,or production shaft. This allows the Engineerand Contractor sufficient time to review theplan for potential problems beforeconstruction begins.
The plan may initially be tentative, butit should be refined during test shaftconstruction. Once the plan is refined to aworking state, strict adherence to the planshould be followed.
1. Name and experience record ofdrilled shaft superintendent or foreman inresponsible charge of drilled shaft operations.Ensure that the person in responsible chargeof day to day drilled shaft operations has priorexperience constructing shafts similar to thosedescribed in the Contract Documents. Finalapproval by the Engineer will be subject toperformance in the field.
In most cases, the success or failure ofa drilled shaft installation depends on theexperience of the person in charge, despitehaving proper equipment and a feasible plan.The Contractor should provide a resumewhich includes a summary of experienceinstalling similar drilled shafts. An importantfactor is knowing how well the Contractorhandles issues such as unusual site conditionsand equipment breakdown. Suitablereferences should be provided to help answerthese questions.
Appendix A (Continued).
225
2. List and size of proposedequipment, including cranes, drills, augers,bailing buckets, final cleaning equipment,desanding equipment, slurry pumps, coresampling equipment, tremies or concretepumps, casings, etc.
This allows the Drilled Shaft Inspectorand the contractor an itemized list to verifythat all necessary equipment is present at thebeginning of construction and that theequipment complies with Section 455-15.1.3.
All technical information and specificson the equipment should be included to allowthe Engineer to make a preliminary evaluationof the equipment’s ability to perform incompliance with the specifications.
3. Details of sequence of constructionoperations and sequence of shaft constructionin bents or shaft groups.
Sufficient details should be providedfor the Engineer to fully understand the orderof the Contractor’s anticipated operation andto evaluate whether the specified times will bemet.
Simultaneous construction of adjacentshafts should be avoided in areas wherelimestone formations are present. Difficultiesin placing the concrete may arise ifunforeseen caverns connecting theexcavations allow concrete to flow from onehole to another. If concrete flowing into theadjacent excavation freefalls, aggregatesegregation or soil entrapment may occur.Also, the concrete level may drop andincrease the risk of a breached tremie.
4. Details of shaft excavation methods. Sufficient detail of the Contractor’sproposed excavation methods should beprovided to the Engineer for evaluation of theadequacy of the tools and whether the timeschedule will be upheld.

Appendix A (Continued).
226
5. Details of slurry, includingproposed methods to mix, circulate, desand,test methods, and proposed testing laboratoryto document test results.
The type of slurry, when it will beintroduced, what head will be maintainedduring construction, and storage proceduresshould be included. Refer to Section 455-15.8.1.
As specified in Section 455-15.8.2,contractors must supply individuals from atesting laboratory if mineral slurries arespecified in the Drilled Shaft Installation Plan,but the contractor may supply an experiencedindividual to conduct the tests if naturalslurries are specified.
6. Details of proposed methods toclean shaft after initial excavation.
The Contractor should provide thedetails of the shaft cleaning operations. Thisshould include the use of any special cleaningbuckets, airlifts (where suitable), submersiblepumps, etc. See Section 455-15.11.4.
7. Details of shaft reinforcement,i n c l u d i n g m e t h o d s t o e n s u r ecentering/required cover, cage integrity duringplacement, placement procedures, cagesupport, and tie downs.
8. Details of concrete placement,including proposed operational procedures forconcrete tremie or pump, including initialplacement, raising during placement, andoverfilling of the shaft concrete. Also provideprovisions to ensure proper final shaft cutoffelevation.
9. Details of casing removal whenremoval is required, including minimumconcrete head in casing during removal.
The minimum intended concrete headshould be indicated if the casings will beextracted prior to an overpour.
10. Required submittals, includingshop drawing and concrete design mixes.
Slump loss data, the laboratory thatperformed the tests, and the date that theywere performed should be submitted alongwith the mix design.

Appendix A (Continued).
227
11. Details of any required load tests,including equipment and procedures, andrecent calibrations for any jacks or load cells.
Unless the Department supplies theload test equipment, design calculations anddrawings should be included. Erection detailsor assembly procedures should always beincluded.
12. Methods and equipment proposedto prevent displacement of casing and/orshafts during placement and compaction offill.
13. Details of environmental controlprocedures used to prevent loss of slurry orconcrete into waterways or other protectedareas.
Special permit requirements andproposed methods of slurry disposal must beaddressed for the Engineer’s evaluation.
14. Other information shown in theplans or requested by the Engineer.
Additional things to consider in theinstallation plan are:· What if the concrete pump breaks in themiddle of a pour? When faced with the optionof removing concrete from the hole andpouring again or preparing the surface of thecold joint, the contractor may decide toprovide an extra pump.· What if the concrete trucks are delayed inthe middle of a pour?· What if the crane breaks during the pour?
Appendix A (Continued).
228
The Engineer will evaluate the drilledshaft installation plan for conformance withthe Contract Documents. Within 20 days afterreceipt of the plan, the Engineer will notifythe Contractor of any additional informationrequired and/or changes that may be necessaryin the opinion of the Engineer to satisfy theContract Documents. The Engineer willreject any part of the plan that is unacceptable.Submit changes agreed upon for reevaluation.The Engineer will notify the Contractor withinseven days after receipt of proposed changesof their acceptance or rejection. All approvalsgiven by the Engineer are subject to trial andsatisfactory performance in the field.
Demonstrate the adequacy of methodsand equipment during construction of the firstdrilled shaft which shall be an out-of-positiontest hole generally constructed as anunreinforced shaft. Drill this test hole in theposition shown in the plans or as directed bythe Engineer and drill to the maximum depthfor any production shaft shown in the plans.Failure to demonstrate the adequacy ofmethods or equipment to the Engineer iscause for the Engineer to require appropriatealterations in equipment and/or method by theContractor to eliminate unsatisfactory results.Provide any additional test holes required todemonstrate the adequacy of methods orequipment at no expense to the Department.Make no changes in methods or equipmentafter initial approval without the consent ofthe Engineer.
A separate test hole is not required fordrilled shafts installed under mast arms,cantilever signs, overhead truss signs, highmast light poles or other miscellaneousstructures. The first production shaft willserve as a test hole for determiningacceptability of the installation method.
It is usually helpful for the Engineer tomeet with the Contractor and discuss theresults of the review. Discussing the resultsmay save time by decreasing the number ofresubmittals before an acceptable DrilledShaft Installation Plan is formulated.
Test holes are generally constructedwithout reinforcement (refer to C455-18),away from the foundation area, and preferablyin the area of greatest concern (i.e. work site’sworst conditions, suspected artesianconditions, and suspected cavities in rock).
The methods and equipment used inthe construction of the test shafts should notpractically vary from what is used for theproduction shafts. A drilled shaft’s capacityis largely dependent on the constructionmethods and equipment, so any variationcould result in a shaft with a lower capacitythan what is expected.

Appendix A (Continued).
229
455-15.1.3 General Methods and
Equipment: Perform the excavations requiredfor the shafts and bell footings, throughwhatever materials encountered, to thedimensions and elevations shown in theContract Documents, using methods andequipment suitable for the intended purposeand the materials encountered. Provideequipment capable of constructing shaftssupporting bridges to a depth equal to thedeepest shaft shown in the plans plus 15 foot[4.5 m] or plus three times the shaft diameter,whichever is greater, except when the plansrequire equipment capable of constructingshafts to a deeper depth. Provide equipmentcapable of constructing shafts supporting non-bridge structures, including mast arms,signals, signs and light supports to a depthequal to the deepest shaft shown in the plansplus 5 feet [1.5 m].
Construct drilled shafts according tothe Contract Documents using generally eitherthe dry method, wet method, casing method,or permanent casing method as necessary toproduce sound, durable concrete foundationshafts free of defects. Use the permanentcasing method only when required by theplans or authorized by the engineer. Whenthe plans describe a particular method ofconstruction, use this method except whenpermitted otherwise by the Engineer afterfield trial. When the plans do not describe aparticular method, propose a method on thebasis of its suitability to the site conditionsand submit it for approval by the Engineer.
Set a suitable temporary removablesurface casing. The minimum surface casinglength is the length required to prevent cavingof the surface soils and to aid in maintainingshaft position and alignment. The Engineermay require predrilling with slurry and/oroverreaming to the outside diameter of the
C455-15.1.3:
If it becomes necessary to excavatedeeper because of unexpected soil conditionsor exceeding the time limit of slurry in thehole, providing equipment that is able toconstruct shafts deeper than what is specifiedin the plans can save time and money. Priorplanning can possibly prevent poorperformance. Refer to 455-15.11.5
Appendix A (Continued).
230
casing to install the surface casing at somesites.
455-15.2 Dry Construction Method: Usethe dry construction method only at siteswhere the ground water table and soilconditions, generally stiff to hard clays orrock above the water table, make it feasible toconstruct the shaft in a relatively dryexcavation and where the sides and bottom ofthe shaft are stable and may be visuallyinspected by the Engineer prior to placing theconcrete.
In applying the dry constructionmethod, drill the shaft excavation, removeaccumulated seepage water and loose materialfrom the excavation and place the shaftconcrete in a relatively dry excavation.
Use the dry construction method onlywhen shaft excavations, as demonstrated in atest hole, have 12 inches [300 mm] or less ofseepage water accumulated over a four hourperiod, the sides and bottom remain stablewithout detrimental caving, sloughing, orswelling for a four hour period, and the loosematerial and water can be satisfactorilyremoved prior to inspection and prior toplacing concrete.
Use the wet construction method orthe casing construction method for shafts thatdo not meet the requirements for the dryconstruction method.
Provide temporary surface casings toaid shaft alignment and position and toprevent sloughing unless the Engineerdetermines by demonstration that the surfacecasing is not required.
C455-15.2: Though dry excavations are theeasiest to construct and inspect, due toFlorida’s high water table, this method isinappropriate for most sites. However, if thedry construction method is appropriate for asite, the Contractor should still have acontingency plan for the use of wet methodsshould conditions change from hole to hole.

Appendix A (Continued).
231
455-15.3 Wet Construction Method: Usethe wet construction method at all sites whereit is impractical to provide a dry excavationfor placement of the shaft concrete.
The wet construction method consistsof drilling the shaft excavation below thewater table, keeping the shaft filled with fluid(mineral slurry, natural slurry or water),desanding and cleaning the mineral slurry andfinal cleaning of the excavation by means ofa bailing bucket, air lift, submersible pump orother approved devices and placing the shaftconcrete (with a tremie or concrete pumpextending to the shaft bottom) which displacesthe water or slurry during concreting of theshaft excavation. Provide temporary surfacecasings to aid shaft alignment and positionand to prevent sloughing of the top of theshaft except when the Engineer declares thatthe surface casing is not required.
Where drilled shafts are located inopen water areas, construct the shafts by thewet method using exterior casings extendingfrom above the water elevation into theground to protect the shaft concrete fromwater action during placement and curing ofthe concrete. Install the exterior casing in amanner that will produce a positive seal at thebottom of the casing so that there is nointrusion or extrusion of water or othermaterials into or from the shaft excavation.
If proposed, demonstrate in a test hole,that split casings can produce a positive sealfor their entire length which will preventintrusion of water into the shaft or extrusionof concrete or other materials from the shaft.
C455-15.3: Soil conditions dictate thenecessity for using either mineral or naturalslurry when drilling using the wet method.Water may be sufficient for shafts constructedin limerock or cemented soils, but mineralslurry is required when drilling throughnoncohesive soils or loose sands. Some soilsmay have sufficient clay so that a slurrycapable of stabilizing the hole is formedduring the drilling process.
A positive head of water or mineralslurry must be maintained at all times whenusing the wet construction method. Failure todo so may cause the hole to become unstableand the walls may collapse. Refer to C455-15.8.1. Earlier commentaries state that“several feet” must be maintained, but therecent specification defines 4 feet to be theminimum maintainable head when usingmineral slurry.

Appendix A (Continued).
232
455-15.4 Casing Construction Method:
Use the casing method at all sites where it isinappropriate to use the dry or wetconstruction methods without the use oftemporary casings other than surface casings.In this method, the hole is advanced throughcaving material by the wet method asdescribed above. When a formation isreached that is nearly impervious, place acasing in the hole and seal in the nearlyimpervious formation. Proceed with drillingas with the dry method to the projected depth.Proceed with the placement of the concrete aswith the dry method except withdraw thecasing after placing the concrete. In the eventseepage conditions prevent use of the drymethod, complete the excavation and concreteplacement using wet methods.
Where drilling through materialshaving a tendency to cave, advance theexcavation by drilling in a mineral slurry. Inthe event that a caving layer or layers areencountered that cannot be controlled byslurry, install temporary removable casingthrough such caving layer or layers. TheEngineer may require overreaming to theoutside diameter of the casing. Take whateversteps are required to prevent caving duringshaft excavation including installation ofdeeper casings. If electing to remove a casingand replace it with a longer casing throughcaving soils, adequately stabilize theexcavation with slurry or backfill theexcavation. The Contractor may use soilpreviously excavated or soil from the site ifbackfilling the excavation. The Contractormay use other approved methods which willcontrol the size of the excavation and protectthe integrity of the foundation soils toexcavate through caving layers.
Before withdrawing the casing, ensurethat the level of fresh concrete is at such a
C455-15.4: It should be understood thatthough the specifications define separateconstruction methods for the use of temporaryand permanent casing, casing is usuallyimplemented with the wet and dry methods.Because of this, it is arguable that only twomethods of construction exist, wet and dry,each implementing casing when necessary.
Refer to C455-15.10.4 and C455-17.2.

Appendix A (Continued).
233
level that the fluid trapped behind the casingis displaced upward. As the casing iswithdrawn, maintain the level of concretewithin the casing so that fluid trapped behindthe casing is displaced upward out of the shaftexcavation without mixing with or displacingthe shaft concrete.
The Contractor may use the casingmethod, when approved by the Engineer, toconstruct shafts through weak caving soilsthat do not contribute significant shaft shearresistance. In this case, place a temporarycasing through the weak caving soils beforebeginning excavation. Conduct excavationusing the dry construction method whereappropriate for site conditions and the wetconstruction method where the dryconstruction method is not appropriate.Withdraw the temporary casing during theconcreting operations unless the Engineerapproves otherwise.
455-15.5 Permanent Casing Method: Usethe permanent casing method when requiredby the plans. In this method, place a casing tothe prescribed depth before beginningexcavation. If the Contractor cannot attainfull penetration, the Engineer may direct theContractor to excavate through the casing andadvance the casing until reaching the desiredpenetration. In some cases the Engineer mayrequire the Contractor to overream the outsidediameter of the casing before placing thecasing.
Cut the casing off at the prescribedelevation upon reaching the properconstruction sequence and leave theremainder of the casing in place.
C455-15.5: If the option is available, it ispreferable to use temporary casing instead ofpermanent casing. Not only is cost savingsincurred from reusing a temporary casing, butshaft side capacity is likely to be higher witha concrete/soil interface as opposed to asteel/soil interface. However, the capacity ofa smooth interface left behind by an extractedcasing may altogether be considerably lessthan a shaft having a rough interface leftbehind by the scarring of an auger.
Appendix A (Continued).
234
455-15.6 Excavations: The Contractor mayextend drilled shaft excavations deeper byextra depth excavation when the Engineerdetermines that the material encounteredwhile drilling the shaft excavation isunsuitable and/or is not the same asanticipated in the design of the drilled shaft.
Take cores when shown in the plans ordirected by the Engineer to determine thecharacter of the material directly below theshaft excavation. Cut the cores with anapproved core barrel to a minimum depth of 5feet [1.5 m] below the bottom of the drilledshaft excavation when completing the shaftexcavation. The Engineer may require theContractor to cut any core below the 5 foot[1.5 m] minimum depth and up to a totaldepth of 20 feet [6 m] below the bottom of thedrilled shaft excavation.
The Engineer will inspect the coresand determine the depth of requiredexcavation. When considered necessary bythe Engineer, take additional cores.
When shown in the plans, prior toexcavation, take a core (Shaft Excavation)through part or all of the shaft, to a depth upto 20 feet [6 m] below that shaft's planned tipelevation.
Use a core barrel designed:(a) to cut a core sample from 4 to 6
inches [100 to 150 mm] in diameter, (b) so that the sample of material
cored can be removed from the shaftexcavationand the core barrel in an undisturbed state,and
(c) in sufficient length to provide coresamples, as directed by the Engineer up to adepth of 20 feet [6 m] below the bottom of thedrilled shaft excavation.
When called for in the plans, substituteStandard Penetration Tests (SPT) for coring.

Appendix A (Continued).
235
In such cases, supply these tests at noadditional cost per foot [meter] to theDepartment above that bid for core (shaftexcavation).
Maintain a drilling log during shaftexcavation and during coring operations thatcontains information such as the descriptionof and approximate top and bottom elevationof each stratum encountered, depth ofpenetration, drilling time in each of thevarious strata, material description, andremarks. Classify, measure, and describe coresamples in the drilling log. Place the coresamples in suitable containers, identified byshaft location, elevation from and to, and jobnumber, and deliver to the Department within48 hours after cutting. Furnish two copies ofthe drilling log, signed by a designatedrepresentative of the Contractor and co-signedby a designated representative of theDepartment, to the Department at the time theshaft excavation is completed and accepted.
Provide areas for the disposal ofunsuitable materials and excess materials asdefined in 120-5 that are removed from shaftexcavations, and dispose of them in a mannermeeting all requirements pertaining topollution.
When shown in the plans, excavatebells to form a bearing area of the size andshape shown. Bell outlines varying fromthose shown in the plans are permissibleprovided the bottom bearing area equals orexceeds that specified. If the diameter of thebell exceeds three times the shaft diameter,drill the excavation deeper as directed andform a new bell footing. Excavate bells bymechanical methods.
Furnish the additional drilled shaftconcrete over the theoretical amount requiredto complete filling any excavations for bellsand shafts which are larger than required by
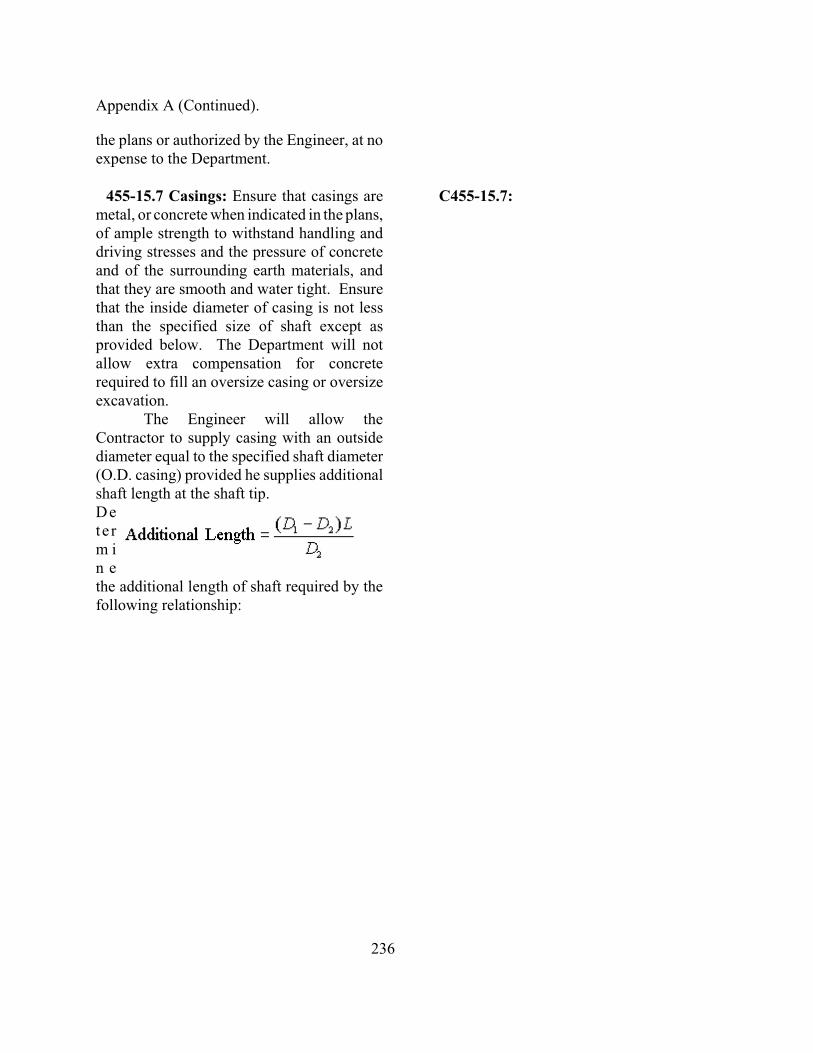
Appendix A (Continued).
236
the plans or authorized by the Engineer, at noexpense to the Department.
455-15.7 Casings: Ensure that casings aremetal, or concrete when indicated in the plans,of ample strength to withstand handling anddriving stresses and the pressure of concreteand of the surrounding earth materials, andthat they are smooth and water tight. Ensurethat the inside diameter of casing is not lessthan the specified size of shaft except asprovided below. The Department will notallow extra compensation for concreterequired to fill an oversize casing or oversizeexcavation.
The Engineer will allow theContractor to supply casing with an outsidediameter equal to the specified shaft diameter(O.D. casing) provided he supplies additionalshaft length at the shaft tip.Dete rm in ethe additional length of shaft required by thefollowing relationship:
C455-15.7:
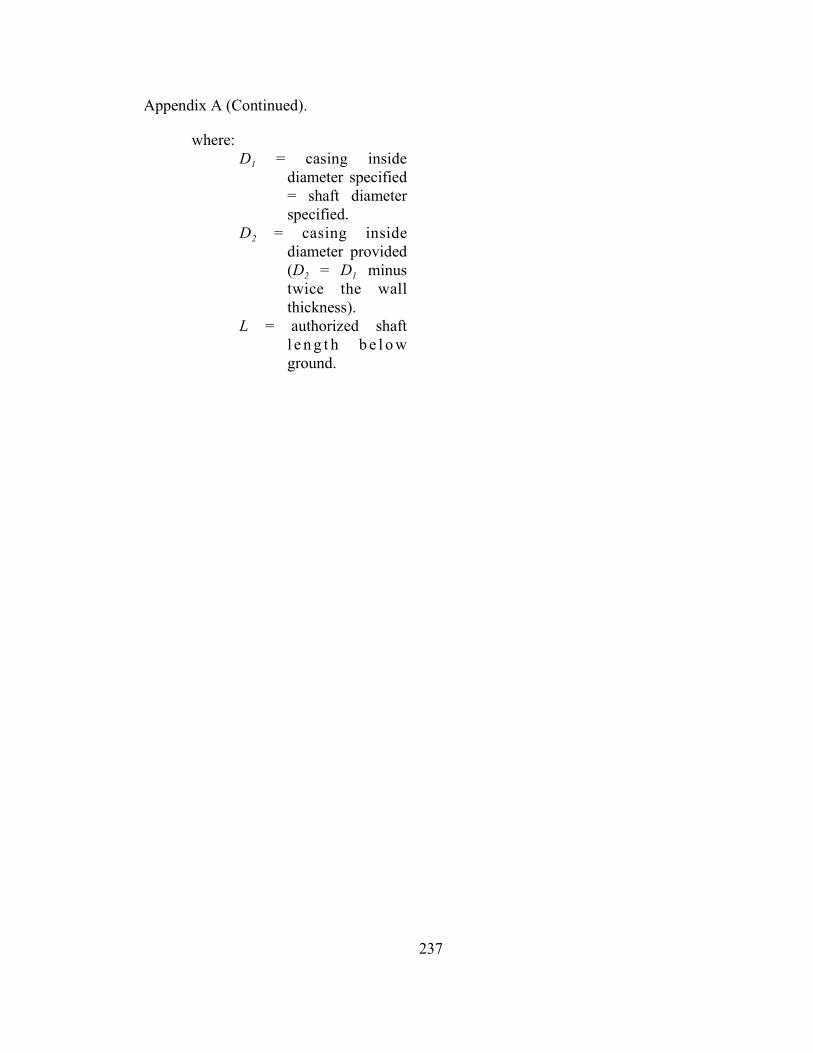
Appendix A (Continued).
237
where:
1D = casing insidediameter specified= shaft diameterspecified.
2D = casing insidediameter provided
2 1(D = D minustwice the wallthickness).
L = authorized shaftl e n g t h b e l o wground.

Appendix A (Continued).
238
Bear all costs relating to thisadditional length including but not limitedto the cost of extra excavation, extraconcrete, and extra reinforcing steel.
Remove all casings from shaftexcavations except those used for thePermanent Casing Method. Ensure thatthe portion of casings installed under thePermanent Casing Method of constructionbelow the shaft cut-off elevation remainsin position as a permanent part of theDrilled Shaft. The Contractor may leavecasings if in the opinion of the Engineerthe casings will not adversely affect theshaft capacity in place. When casings thatare to be removed become bound in theshaft excavation and cannot be practicallyremoved, drill the shaft excavation deeperas directed by the Engineer to compensatefor loss of capacity due to the presence ofthe casing. The Department will notcompensate for the casing remaining. TheDepartment will pay for the additionallength of shaft under Item No. 455-88[Item No. 2455-88] and the additionalexcavation under Item No. 455-125 [ItemNo. 2455-125].
When the shaft extends aboveground or through a body of water, theContractor may form the portion exposedabove ground or through a body of water,with removable casing except when thePermanent Casing Method is specified(see 455-23.10). When approved, theContractor may form drilled shaftsextending through a body of water withpermanent or removable casings.However, for permanent casings, removethe portion of metal casings between anelevation 2 feet [0.6 m] below the lowestwater elevation and the top of shaftelevation after the concrete is cured.
Since temporary casing extractionusually occurs after the concrete is placedand the reinforcing cage is already in thehole, it may be impossible to excavateddeeper to remove bound casing.

Appendix A (Continued).
239
Dismantle casings removed to expose theconcrete as required above in a mannerwhich will not damage the drilled shaftconcrete. Dismantle removable casings inaccordance with the provisions of 455-17.5.
Generally when removal of thetemporary casing is required, do not startthe removal until completing all concreteplacement in the shaft. The Engineer willpermit movement of the casing byrotating, exerting downward pressure, andtapping it to facilitate extraction, orextraction with a vibratory hammer.Extract casing at a slow, uniform rate withthe pull in line with the axis of the shaft.Withdraw temporary casings while theconcrete remains fluid.
When conditions warrant, theContractor may pull the casing in partialstages. Maintain a sufficient head ofconcrete above the bottom of the casing toovercome the hydrostatic pressure ofwater outside the casing. At all timesmaintain the elevation of the concrete inthe casing high enough to displace thedrilling slurry between the outside of thecasing and the edge of the hole whileremoving the casing.
The Contractor may use specialcasing systems in open water areas, whenapproved, which are designed to permitremoval after the concrete has hardened.Design special casings so that no damageoccurs to the drilled shaft concrete duringtheir removal.
Though no maximum extractionrate is specified, once the casingextraction begins, it should progress in acontinuous motion with no pauses.Pausing during a casing extraction canproduce anomalies on the surface of theshaft.

Appendix A (Continued).
240
455-15.8 Slurry and Fluid in Excavation
at Time of Concrete Placement:
455-15.8.1 Slurry: When slurry is used inan excavation, use only mineral slurry ofprocessed attapulgite or bentonite clays. TheEngineer will not allow polymer slurries. Useslurry having a mineral grain size such that itwill remain in suspension and havingsufficient viscosity and gel characteristics totransport excavated material to a suitablescreening system. Use a percentage andspecific gravity of the material to make thesuspension sufficient to maintain the stabilityof the excavation and to allow properplacement of concrete. Ensure that thematerial used to make the slurry is notdetrimental to concrete or surrounding groundstrata. During construction, maintain the levelof the slurry at a height sufficient to preventcaving of the hole. In the event of a suddensignificant loss of slurry such that the slurrylevel cannot practically be maintained byadding slurry to the hole, delay theconstruction of that foundation until analternate construction procedure has beenapproved.
Thoroughly premix the mineral slurrywith clean fresh water prior to introductioninto the shaft excavation. Ensure that thepercentage of mineral admixture used to makethe suspension is such as to maintain thestability of the shaft excavation. TheEngineer will require adequate water and/orslurry tanks when necessary to perform thework in accordance with these Specifications.The Engineer will not allow excavated pits onprojects requiring slurry tanks without the
C455-15.8: The term “slurry” is intended torepresent the water/clay mixture that has notyet been placed into the excavation andintroduced to cuttings. The term “fluid” refersto the water/clay mixture after it is placed inthe excavation and contains cuttings.
C455-15.8.1: Only 12 states currentlyallow the use of polymer slurries (as of 2003).Though prior research has shown that theyleave no filter cake and are environmentallyfriendly, undocumented instances of boreholecollapse due to induced vibrations havediscouraged their usage. In fact, very highhead differentials between the slurry and theGWT must be maintained under normalconditions to maintain borehole stability(FHWA recommends at least 2 meters).

Appendix A (Continued).
241
written permission of the Engineer. TheEngineer will require adequate desandingequipment when shown in the ContractDocuments. However, the Engineer will notrequire desanding equipment for drilled shaftsfor sign post or lighting mast foundationsunless shown in the Contract Documents.Take the steps necessary to prevent the slurryfrom "setting up" in the shaft, including butnot limited to agitation, circulation, and/oradjusting the composition and properties ofthe slurry. Provide suitable offsite disposalareas and dispose of all waste slurry in amanner meeting all requirements pertaining topollution.
Provide a qualified professional soiltesting laboratory approved by the Engineer toperform control tests using suitable apparatuson the mineral slurry mixture to determine thefollowing parameters:
(a) Freshly mixed mineral slurry:Measure the density of the freshly mixedmineral slurry regularly as a check on thequality of the suspension being formed usinga measuring device calibrated to read within±0.5 lb/ft3 [±8 kg/m3].
(b) Mineral slurry supplied to thedrilled shaft excavation: Perform thefollowing tests on the mineral slurry suppliedto the shaft excavation and ensure that theresults are within the ranges stated in the tablebelow:
Appendix A (Continued).
242
Item to be measured Range of Results at 68 F (20 C) Test Methodo o
Density - in freshwater 64 to 73 lb/ft (1030 to 1170 kg/m ) Mud density balance3 3
- in saltwater 66 to 75 lb/ft (1060 to 1200 kg/m ) FM 8-RP13B-13 3
Viscosity 28 to 40 seconds Marsh Cone MethodFM 8-RP13B-2
Electric pH meter or pHpH 8 to 11 indicator paper strips
FM 8-RP13B-4
Sand Content 4 % or less FM 8-RP13B-3
Appendix A (Continued).
243
The Contractor may adjust thelimits in the above table(s) when fieldconditions warrant as successfullydemonstrated in a Test Hole or with othermethods approved by the Engineer. TheEngineer must approve all changes inwriting before the Contractor can continueto use them.
Perform tests to determine density,viscosity, and pH value to establish aconsistent working pattern, taking intoaccount the mixing process and blendingof freshly mixed mineral slurry andpreviously used mineral slurry. Perform aminimum of four sets of tests to determinedensity, viscosity, and pH value during thefirst 8 hours mineral slurry is in use.
When the results show consistentbehavior, discontinue the tests for pHvalue, and only carry out tests todetermine density and viscosity duringeach four hours mineral slurry is in use. Ifthe consistent working pattern changes,reintroduce the additional tests for pHvalue for the time required to establishconsistency of the test values within therequired parameters.
(c) Furnish reports of all mineralslurry tests required above, signed andsealed by a Specialty Engineer,representing the soil testing laboratory tothe Department on completion of eachdrilled shaft.
(d) The Department may performcomparison tests as determined necessaryduring the mineral slurry operations.
During construction, maintain thelevel of mineral slurry in the shaftexcavation within the excavation and at alevel not less than 4 feet [1.2 m] above thehighest expected piezometric waterpressure along the depth of a shaft.
When using slurry, a minimumpositive head of four feet should bemaintained above the highest piezometrichead. This will ensure that a minimumconfining pressure of 1.7 psi acts on theshaft walls to prevent sloughing or caving.The calculations are based on the use offresh water for the drilling slurry. Theconfining pressure for slurries with higher
Appendix A (Continued).
244
At any time the wet constructionmethod of stabilizing excavations fails, inthe opinion of the Engineer, to producethe desired final result, discontinue thismethod of construction, and proposemodifications in procedure or alternatemeans of construction for approval.
Slurry testing is not required fordrilled shafts installed under mast arms,cantilever signs, overhead truss signs,high mast light poles or othermiscellaneous structures.
unit weights (salt water or mineralslurries) will be slightly larger, thus moreconservative.
Besides helping to suspend solidsand increasing the confining pressure,mineral additives are used in slurries toreduce the permeability of various soilstrata. This can reduce the loss of drillingfluid, making it easier to maintain apositive head.
If the slurry head is allowed to fallbelow the piezometric head, or the drillingfluid is introduced into the excavationafter the water table is reached, an inwardpressure may cause the shaft sides to cave.Once the walls of the excavation begin tocave, the confining pressure may not besufficient to stabilize the “ceiling” of thecave. The soil may continue to cave,especially in cohesionless soils, until:
� The hole is lost� Nearby structures are affected� It interferes with construction of
surrounding shafts
It is not required that premixeddrilling slurry used for miscellaneousstructures be tested prior to placement inthe excavation, but once the fluid entersthe hole, it must be tested in accordancewith Section 455-15.8.2.

Appendix A (Continued).
245
455-15.8.2 Fluid In Excavation At
Time Of Concrete Placement: Prior toplacing concrete in any shaft excavation,ensure that heavily contaminatedsuspensions, which could impair the freeflow of concrete from the tremie pipe,have not accumulated in the bottom of theshaft. Take samples of the fluid in theshaft from the base of the shaft and atintervals not exceeding 10 feet [3 m] upthe shaft, using an approved samplingtool. Ensure that the density of the fluidin the shaft excavation prior to concretingis less than 75 lb/ft [1,200 kg/m ]. The3 3
Engineer will not require tests for pH andviscosity when mineral slurry is not usedin the excavation. Ensure that projects thatrequire desanding equipment have a sandcontent not greater than 4% as determinedby FM 8-RP13B-3. Take whatever actionis necessary to modify the fluid in theshaft excavation prior to placing theconcrete to bring the fluid within thespecification requirements.
When using mineral slurry, theapplicable density test method andreporting requirements described in 455-15.8.1 apply to tests of slurry in the shaftprior to placing the concrete. Such testsshall be performed by an approved soiltesting laboratory engaged by theContractor in the presence of arepresentative of the Department. Whenmineral slurry is not used, testing may beperformed by an experienced personfurnished by the Contractor and approvedby the Engineer. The Department mayalso perform comparison tests. Provideequipment for such comparison tests whenrequested by the Engineer.
C455-15.8.2: More recent extracts fromthe 2000 version of these standards andspecifications used in teaching the DrilledShaft Inspector’s Qualification Coursereiterate that “any shaft excavation”includes shafts under miscellaneousstructures. A major culprit of shaftanomalies is a “dirty hole”, meaning thatthe excavation contains a large amount ofsuspension. Though standards andspecifications for miscellaneous structuresare typically more lax, removing heavilycontaminated suspension from the bottomof the excavation is a crucial step inensuring the production of a good qualityshaft. Refer to C455-15.10.4.
Reconsideration should be given tothe maximum sand content of 4% whendealing with large diameter drilled shaftexcavations. Though the theoreticalvolume of sand per unit slurry is the same,4% by volume of a large shaft (9 ftdiameter by 120 ft long) can reach a totalsand weight as large as 14 tons. Furtherresearch is required to define a morereasonable limit on the sand content oflarger shafts.

Appendix A (Continued).
246
455-15.9 Tremies:
455-15.9.1 General: The requirementsof 400-8.3 will apply when using a tremieto place drilled shaft concrete. Therequirements of 400-7.7 will apply whenusing a pump to place drilled shaftconcrete.
455-15.9.2 Dry Excavations: Ensure thatthe tremie for depositing concrete in a drydrilled shaft excavation consists of a tube ofsolid construction, a tube constructed ofsections which can be added and removed, ora tube of other approved design. TheContractor may pass concrete through ahopper at the top of the tube or through sideopenings as the tremie is retrieved duringconcrete placement. Support the tremie sothat the free fall of the concrete is less than 5feet [1.5 m] at all times. If the free fallingconcrete causes the shaft excavation to caveor slough, control the movement of concreteby reducing the height of free fall of theconcrete and/or reducing the rate of flow ofconcrete into the excavation.
455-15.9.2:
Free fall is considered as the distancethe concrete has to fall to reach the hopper.The distance through the tremie pipe is notincluded in the 5 ft. limit.

Appendix A (Continued).
247
455-15.9.3 Wet Excavations: Constructthe tremie or pump line used to depositconcrete beneath the surface of water so thatit is water-tight and will readily dischargeconcrete. Construct the discharge end of thetremie or pump line to prevent water intrusionand permit the free flow of concrete duringplacement operations. Ensure that the tremieor pump line has sufficient length and weightto rest on the shaft bottom before startingconcrete placement.
C455-15.9.3:
The discharge end of the tremie mustbe plugged to prevent water or slurry fromentering. If water or slurry is allowed to enterthe tremie, the concrete may segregate(cement washes off of the aggregate) as thetremie is charged, or initially filled.Segregation of the concrete will cause a pileof gravel to be left at the bottom. As a result,shaft capacity will be reduced, and largersettlements may result before reachingcapacity.
When the tremie is lowered to thebottom of the excavation, it is crucial to allowthe discharge end to rest on the bottom. Oncethe tremie is charged, it should be lifted onlya few inches. If the end is raised too high(several feet), the segregation problemsdiscussed above may occur.
Currently, traveling plugs are notallowed when sealing the tremie. A commonpractice for sealing the tremie is to cut acircular plate slightly larger than the diameterof the discharge end. Plastic wrap is used tohold the plate on and seal the seam. Duct tapecan be wrapped around the tremie to hold theplastic in place. When the tremie is loweredinto the wet excavation, hydrostatic pressurewill help keep the plug on and sealed. Theplate will also prevent soil from plugging theend of the tremie when resting the dischargeend on the bottom. Once the tremie ischarged and lifted a few inches, the weight ofthe concrete will break the seal.
Appendix A (Continued).
248
Ensure that the discharge end of the tremie orpump line is entirely immersed in concrete atall times during placement operations. Ensurethat the free fall of concrete into the hopper isless than 5 feet [1.5 m] at all times. Supportthe tremie so that it can be raised to increasethe discharge of concrete and lowered toreduce the discharge of concrete. TheEngineer will not allow rapid raising orlowering of the tremie to increase thedischarge of the concrete. Maintain acontinuous flow of concrete and a positivepressure differential of the concrete in thetremie or pump line at all times to preventwater or slurry intrusion into the shaftconcrete.
Throughout placement, ensure that thetremie does not raise out of the concrete. Ifthe concrete is allowed to free fall throughslurry, pockets of slurry or soil may becometrapped and create voids in the shaft.
Appendix A (Continued).
249
455-15.10 Excavation and Drilling
Equipment:
455-15.10.1 General: All shaftexcavation is Unclassified ShaftExcavation and extra depth excavation isUnclassified Extra Depth Excavation.The Engineer will require Drilled ShaftSidewall Overreaming when inspectionsshow it to be necessary. These terms aredefined in 455-15.10.2, 455-15.10.3, and455-15.10.4, respectively.
Use excavation and drillingequipment having adequate capacity,including power, torque, and downthrust,and excavation and overreaming tools ofadequate design, size, and strength toperform the work shown in the plans ordescribed herein. When the materialencountered cannot be drilled usingconventional earth augers and/orunderreaming tools, provide specialdrilling equipment, including but notlimited to rock augers, core barrels, rocktools, air tools, blasting materials, andother equipment as necessary to continuethe shaft excavation to the size and depthrequired. In the event blasting isnecessary, obtain all necessary permits.The Contractor is responsible for theeffects of blasting on already completedwork and adjacent structures. TheEngineer must approve all blasting.
Appendix A (Continued).
250
455-15.10.2 Unclassified Shaft
Excavation: Unclassified ShaftExcavation is defined as all processesrequired to excavate a drilled shaft of thedimensions shown in the ContractDocuments to the depth indicated in theplans or directed by the Engineer,completed and accepted. Include in thework all shaft excavation, whether thematerial encountered is soil, rock,weathered rock, stone, natural or man-made obstructions, or materials of otherdescriptions.
455-15.10.3 Unclassified Extra Depth
Excavation: Unclassified Extra DepthExcavation is defined as all processesrequired to excavate a drilled shaft of plandimensions below the elevation of thebottom of the shaft as indicated on theplans.

Appendix A (Continued).
251
455-15.10.4 Drilled Shaft Sidewall
Overreaming: Drilled Shaft SidewallOverreaming is defined as the unclassifiedexcavation required to roughen its surfaceor to enlarge the drilled shaft diameter dueto softening of the sidewalls or to removeexcessive buildup of slurry cake whenslurry is used. Increase the shaft radius aminimum of 1/2 inch [15 mm] and amaximum of 3 inches [75 mm] byoverreaming. The Contractor mayaccomplish overreaming with a groovingtool, overreaming bucket, or otherapproved equipment.
Meet the limit for depth ofsidewall overreaming into the shaftsidewall material and the elevation limitsbetween which sidewall overreaming isrequired.
C455-15.10.4:
Failure to remove excess slurrycake buildup on the walls of an excavationcan lead to a significant decrease in shaftside capacity. Research has shown thatthe “plug flow” concept, where a risingconcrete column scours the slurry off ofthe walls of the excavation, is not a goodrepresentation of how the concreteactually flows.
As the concrete column rises, theconcrete tends to “mushroom up” betweenthe outside of the tremie and the inside ofthe reinforcing cage. If the concrete has arelatively low slump (close to the 4"minimum) a head differential can developfrom the inside to outside of the cage.Concrete will tend to fall through the cageand press into the walls of the excavation.If the sand content of the slurry is high,the bottom of the excavation is not clean,or a slurry cake is allowed to develop onthe walls of the excavation, debris maybecome trapped between the concrete andsoil as the concrete presses outward.Voids left on the perimeter of the shaftcan invite corrosion and ultimatelydestroy the shaft.

Appendix A (Continued).
252
455-15.11 Inspection of Excavations:
455-15.11.1 Dimensions and Alignment:
Provide equipment for checking thedimensions and alignment of each permanentshaft excavation. Determine the dimensionsand alignment of the shaft excavation underthe observation and direction of theDepartment. Generally check the alignmentand dimensions by any of the followingmethods as necessary:
(a) Check the dimensions andalignment of dry shaft excavations usingreference stakes and a plumb bob.
(b) Check the dimensions andalignment of casing when inserted in theexcavation.
(c) Insert a casing in shaft excavationstemporarily for alignment and dimensionchecks.
(d) Insert a rigid rod or pipe assemblywith several 90-degree offsets equal to theshaft diameter into the shaft excavation foralignment and dimension checks.
Insert any casing, rod or pipeassembly, or other device used to checkdimensions and alignment into the excavationto full depth.
455-15.11.2 Depth: Generally reference thedepth of the shaft during drilling toappropriate marks on the Kelly bar or othersuitable methods. Measure final shaft depthswith a suitable weighted tape or otherapproved methods after final cleaning.

Appendix A (Continued).
253
455-15.11.3 Shaft Inspection Device: TheDepartment, when shown in the plans, mayuse a shaft inspection device (SID) comprisedof a television camera sealed inside a water-tight jacket to inspect the bottoms of theshafts. The Department may also use asidewall sampler attached to the shaftinspection device to sample the sides of theshafts. Cooperate with the Department inusing this device, including placing the devicein position for inspection and removing itafter the inspection. Furnish 110 V singlephase current (minimum 30 A service), 220 Vsingle phase current (minimum 15 A service),and a 150 psi [1.0 MPa] compressor (8 cfm[0.0038 m /s] minimum) to operate the SID.3
Include all cost related to the inspectiondevice in the cost of drilled shaft items.
Provide the projected drilled shaftconstruction schedule to the Engineer at thepreconstruction conference or no later than 30days before beginning drilled shaftconstruction so that the SID may bescheduled. Include in the bid the cost oftransporting the SID from its storage locationto the job site and back. Notify theDepartment at least ten days prior to thedesired pick-up date. During pick-up, theDepartment will complete a checklist of allequipment placed in the Contractor'spossession. The Department will later use thischecklist to verify that the Contractor hasreturned all equipment.
The Contractor is responsible for thedevice from the time it leaves its storage areauntil the time it is returned. During this time,insure the device against loss or damage forthe replacement cost thereof (the greater of$400,000 or the amount shown in the plans)or for the full insurable value if replacementcost insurance is not available.
Return the device in good working

Appendix A (Continued).
254
condition to its proper location within 30 daysafter completing the drilled shafts. Notify theDepartment at least ten working days prior toreturning the SID.
455-15.11.4 Shaft Cleanliness
Requirements: Adjust cleaning operations sothat a minimum of 50% of the base of eachshaft will have less than 1/2 inch [13 mm] ofsediment at the time of placement of theconcrete. Ensure that the maximum depth ofsedimentary deposits or any other debris atany place on the base of the shaft excavationdoes not exceed 1 1/2 inches [40 mm]. TheEngineer will determine shaft cleanliness byvisual inspection for dry shafts, using diversor SID or other methods the Engineer deemsappropriate for wet shafts.
When using slurry, meet therequirements of 455-15.8 at the time ofconcrete placement.
Ensure that the depth of sedimentarydeposits or other debris does not exceed 1inch [25 mm] over the base of the shaft wheninstalling drilled shafts under mast arms,overhead truss signs, high mast light poles orother miscellaneous structures.
C455-15.11.4: Refer to C455-15.10.4.
Appendix A (Continued).
255
455-15.11.5 Time of Excavation: Anyunclassified excavation work lasting morethan 36 hours (measured from the beginningof excavation for all methods except thePermanent Casing Method, which begins atthe time excavation begins below the casing)before placement of the concrete may requireoverreaming the sidewalls to the depth ofsoftening or removing excessive slurry cakebuildup as indicated by samples taken by thesidewall sampler or other test methodsemployed by the Engineer. Ensure that theminimum depth of overreaming the shaftdiameter is 1/2 inch [13 mm] and themaximum depth is 3 inches [75 mm]. Provideany overreaming required at no expense to theDepartment when exceeding the 36-hour limitunless the time limit is exceeded solely toaccomplish Unclassified Extra DepthExcavation ordered by the Engineer. TheDepartment will pay the Contractor forauthorized overreaming resulting fromsoftening or excessive slurry cake buildupwhich is indicated by sidewall samples orother test methods employed by the Engineerduring the initial 36-hour time period. TheDepartment will pay the Contractor forauthorized overreaming when sidewallsamples indicate softening or excessive filtercake buildup in shaft excavations whichexceed the 36-hour time limit in order toaccomplish Unclassified Extra DepthExcavation ordered by the Engineer.
When using slurry, adjust excavationoperations so that the maximum time thatslurry is in contact with the bottom 5 feet [1.5m] of the shaft (from time of drilling toconcreting) does not exceed 12 hours. Ifexceeding the 12-hour time limit, overreamthe bottom 5 feet [1.5 m] of shaft at noadditional expense to the Department prior toperforming other operations in the shaft.
C455-15.11.5:
Refer to C455-15.10.4.

Appendix A (Continued).
256
For drilled shafts installed under mastarms, cantilever signs, overhead truss signs,high mast light poles or other miscellaneousstructures, all references to a 36-hour timelimit is changed to a 12-hour time limit.
455-16 Reinforcing Steel Construction and
Placement.
455-16.1 Cage Construction and
Placement: Completely assemble and placeas a unit the cage of reinforcing steel,consisting of longitudinal bars, ties, and cagestiffener bars, immediately after the Engineerinspects and accepts the shaft excavation andimmediately prior to placing concrete. Tie allintersections of drilled shaft reinforcing steelwith cross ties or "figure 8" ties. Use doublestrand ties or ties with larger tie wire whennecessary. The Engineer will give finalapproval of the cage construction andplacement subject to satisfactory performancein the field.
455-16.2 Splicing Cage: If the bottom of theconstructed shaft elevation is lower than thebottom of the shaft elevation in the plans,extend a minimum of one half of thelongitudinal bars required in the upper portionof the shaft the additional length. Continuethe tie bars for the extra depth, spaced on 2foot [0.6 m] centers, and extend the stiffenerbars to the final depth. The Contractor maylap splice these bars or use unspliced bars ofthe proper length. Do not weld bars to theplanned reinforcing steel unless shown in theContract Documents.

Appendix A (Continued).
257
455-16.3 Support, Alignment, and
Tolerance: Tie and support the reinforcingsteel in the shaft so that the reinforcing steelwill remain within allowable tolerances asspecified in 455-8 and Section 415.
Use concrete wheels or other approvednoncorrosive spacing devices near the bottomand intervals not exceeding 15 feet [4.5 m] upthe shaft to ensure concentric spacing for theentire length of the cage. Do not use block orwire type spacers. Use a minimum of onespacer per 30 inches [750 mm] ofcircumference of cage with a minimum ofthree at each level. Provide concrete spacers,constructed as shown in the ContractDocuments, at the bottom of the drilled shaftreinforcing cage to maintain the specifieddistance between the bottom of the cage andthe bottom of the shaft is maintained. Use thenumber of bottom spacers as shown in theContract Documents. Use spacers constructedof approved material equal in quality anddurability to the concrete specified for theshaft. The Engineer will approve spacerssubject to satisfactory performance in thefield.
Check the elevation of the top of thesteel cage before and after placing theconcrete. If the rebar cage is not maintainedwithin the specified tolerances, correct it asdirected by the Engineer. Do not constructadditional shafts until modifying the rebarcage support in a manner satisfactory to theEngineer.
Appendix A (Continued).
258
455-17 Concrete Placement.
455-17.1 General: Place concrete inaccordance with the applicable portions ofSections 346 and 400, Standard OperatingProcedures for Quality Control of Concrete,Subarticles 455-15.2, 455-15.3, 455-15.4,455-15.5, 455-15.8, 455-15.9, and therequirements herein.
Place concrete as soon as possibleafter completing all excavation, cleaning theshaft excavation, inspecting and finding itsatisfactory, and immediately after placingreinforcing steel. Continuously place concretein the shaft to the top elevation of the shaft.Continue placing concrete after the shaft isfull until good quality concrete is evident atthe top of the shaft. Place concrete through atremie or concrete pump using approvedmethods.
If the pressure head is lost duringconcrete placement for any reason, theEngineer may direct the Contractor to performintegrity testing at no expense to theDepartment.
Appendix A (Continued).
259
455-17.2 Placement Time Requirements:
The elapsed time for placing drilled shaftconcrete includes the concrete mixing andtransit time, the concrete placement time, andthe time required to remove any temporarycasing that causes or could cause the concreteto flow into the space previously occupied bythe casing. Maintain a minimum slump of 4inches [100 mm] throughout the elapsed time.Use materials to produce and maintain therequired slump through the elapsed time thatmeets the class of concrete specified.
Provide slump loss tests that demonstrate tothe Engineer that the concrete will maintain a4 inch [100 mm] or greater slump for theanticipated elapsed time before beginningdrilled shaft construction.
C455-17.2: In the 1991 version of thisspecification, placement was restricted to twohours unless the contractor could demonstratethat the mix would maintain a slump of 4” orgreater over the longer placement time.Placement time was defined as the time fromwhen the concrete entered the tremie or pumpto removal of any temporary casings. Thespecifications no longer give a two hour timelimit, but the concrete must still maintain aslump of 4” or greater throughout placement.
Since atmospheric conditions greatlyaffect the slump of concrete, slump lossdemonstration tests should be performedunder conditions similar to what is expected atthe time of placement.
Though the specifications allow for aminimum slump of 4”, research shows adrastic reduction in shaft capacity, particularlyin side friction, when the slump falls near orbelow 4”. The most probable explanation isthe inability of a stiff concrete to flowoutward and occupy the void left behind by anextracted casing. If this happens, it is possiblethat the stiff concrete will not apply the samelateral pressure on the walls of the excavationas if it were more fluid. If concrete strengthrequirements do not interfere with the mixdesign, the initial slump should be targeted asclosely to the maximum 9” as possible.

Appendix A (Continued).
260
455-17.3 Forms: When the top of shaftelevation is above ground, form the portion ofthe shaft above ground with a removable formor another approved method to the dimensionsshown in the plans.
When the shaft extends above theground through a body of water, theContractor may form the portion through thewater with removable forms except when thePermanent Casing Method is specified.
When approved, the Contractor mayform the portion through the water withpermanent forms, provided the forms areremoved from 2 feet [0.6 m] below the lowestwater elevation to the top of shaft elevation.
C455-17.3:
When forming concrete shafts throughwater, an alternative to forming withpermanent casing is to use two concentrictemporary casings. The inner casing providesthe form for the concrete. The annular regionbetween the inner and outer casing is filledwith sand, so that when the inner casing isremoved after placement, the outer casingremains to protect the shaft against water andwave action. The sand acts as a barrier andprevents the concrete from bonding with thecasing. After the concrete is cured, the outercasing is removed.
455-17.4 Riser Blocks: The Contractor maycast a riser block of equal diameter as thecolumn and of a maximum height of 6 inches[150 mm] at the top of the completed shaft.When this option is chosen, extend any dowelsteel above the top of shaft an additional 6inches [150 mm].
455-17.5 Curing: Cure the top surface inaccordance with 400-16, and construct anyconstruction joint area as shown in the plans.Protect portions of drilled shafts exposed to abody of water from the action of water byleaving the forms in place for a minimum ofseven days after casting the concrete. TheContractor may remove forms prior to sevendays provided the concrete strength hasreached 2,500 psi [17 MPa] or greater asevidenced by cylinder breaks.

Appendix A (Continued).
261
455-18 Test Holes.
The Engineer will use the constructionof test holes to determine if the methods andequipment used by the Contractor aresufficient to produce a shaft excavationmeeting the requirements of the ContractDocuments. During test hole excavations, theEngineer will evaluate the ability to controldimensions and alignment of excavationswithin tolerances; to seal the casing intoimpervious materials; to control the size of theexcavation under caving conditions by the useof mineral slurry or by other means; toproperly clean the completed shaftexcavation; to construct excavations in openwater areas; to establish elevations for belling;to determine the elevation of ground water; toplace concrete meeting the requirements ofthese Specifications within the prescribedtime frame; and to execute any othernecessary construction operation. Revise themethods and equipment as necessary at anytime during the construction of the test holewhen unable to satisfactorily carry out any ofthe necessary operations described above orwhen unable to control the dimensions andalignment of the shaft excavation withintolerances.
Drill test holes out of permanentposition at the location shown in the plans oras directed by the Engineer. Ensure that thediameter and depth of the test hole or holesare the same diameter and depth as theproduction drilled shafts. Do not reinforce thetest hole, but fill the test hole with concrete inthe same manner that production reinforcedshafts will be constructed. The Contractormay backfill the test holes with suitable soil ina manner satisfactory to the Engineer. Leavethe concreted test holes in place, exceptremove the top of the shaft to a depth of 2 feet[0.6 m] below the ground line. Use the same
C455-18.
The requirement to reinforce test holesvaried from edition to edition of thisspecification, but the current edition does notrequire a reinforced test hole. The drivingfactor behind an unreinforced hole is the costsavings, but reinforcing a test hole may helpthe inspector and contractor identify potentialconcrete placement problems associated withtightly spaced cages, Osterberg cells, andmultiple access tubes (CSL).
Appendix A (Continued).
262
procedure for shafts constructed in water.Restore the disturbed areas at the sites of testholes drilled out of position as nearly aspractical to their original condition. When theContractor fails to demonstrate to theEngineer the adequacy of his methods orequipment, and alterations are required, heshall provide additional test holes at noexpense to the Department. Include the costof all test holes in the cost of the DrilledShafts.
Appendix A (Continued).
263
455-19 Test Bells.
Ream the bells at specified test holesto establish the feasibility of belling in aspecific soil strata. Use the diameter andshape of the test bell shown in the plans or asapproved in writing.
Appendix A (Continued).
264
455-20 Construction Tolerances.
Meet the following constructiontolerances for drilled shafts:
(a) Ensure that the top of the drilledshaft is no more than 3 inches [75 mm]laterally from the position indicated in theplans.
(b) Ensure that the vertical alignmentof the shaft excavation does not vary from thealignment shown in the plans by more than1/4 in/ft [20 mm/m] of depth.
(c) After placing all the concrete,ensure that the top of the reinforcing steelcage is no more than 6 inches [150 mm] aboveand no more than 3 inches [75 mm] belowplan position.
(d) Ensure that the reinforcing cage isconcentric with the shaft within a tolerance of1 1/2 inches [40 mm]. Ensure that concretecover is 6 inches ± 1 1/2 inches [150 ± 40mm] unless shown otherwise in the plans.
(e) All casing diameters shown in theplans refer to I.D. (inside diameter)dimensions. However, the Contractor mayuse casing with an outside diameter equal tothe specified shaft diameter if the extra lengthdescribed in 455-15.7 is provided. In thiscase, ensure that the I.D. of the casing is notless than the specified shaft diameter less 1inch [25 mm]. When approved, theContractor may elect to provide a casinglarger in diameter than shown in the plans tofacilitate meeting this requirement. Whencasing is not used, ensure that the minimumdiameter of the drilled shaft is 1 inch [25 mm]less than the specified shaft diameter. Whenconditions are such that a series of telescopingcasings are used, provide the casing sized tomaintain the minimum shaft diameters listedabove.
(f) Excavate the bearing area of bellsto the plan bearing area as a minimum.
Appendix A (Continued).
265
Ensure that the diameter of the bells does notexceed three times the specified shaftdiameter. The Contractor may vary all otherplan dimensions shown for the bells, whenapproved, to accommodate his equipment.
(g) Ensure that the top elevation of thedrilled shaft concrete has a tolerance of +1and - 3 inches [+25 and -75 mm] from the topof shaft elevation shown in the plans.
(h) The dimensions of casings aresubject to American Pipe Institute tolerancesapplicable to regular steel pipe.
(i) Use excavation equipment andmethods designed so that the completed shaftexcavation will have a flat bottom. Ensurethat the cutting edges of excavation equipmentare normal to the vertical axis of theequipment within a tolerance of ±3/8 in/ft[±30 mm/m] of diameter.

Appendix A (Continued).
266
455-21 Drilled Shaft Excavations
Constructed out of Tolerance.
Do not construct drilled shaftexcavations in such a manner that the concreteshaft cannot be completed within the requiredtolerances. The Contractor may makecorrections to an unacceptable drilled shaftexcavation by any combination of thefollowing methods:
(a) Overdrilling the shaft excavation toa larger diameter to permit accurate placementof the reinforcing steel cage with the requiredminimum concrete cover.
(b) Increasing the number and/or sizeof the steel reinforcement bars.
(c) Enlargement of the bearing area ofthe bell excavation within tolerance allowed.
When the tolerances are not met, theContractor may request design changes in thecaps or footings to incorporate shafts installedout of tolerance. The Contractor shall bearthe costs of redesign and Unforeseeable Workresulting from approved design changes toincorporate shafts installed out of tolerance.Employ a Specialty Engineer to perform anyredesign and who shall sign and seal theredesign drawings and computations. Do notbegin any proposed redesign until it has beenreviewed for acceptability and approved bythe Engineer.
Backfill any out of tolerance shafts inan approved manner when directed by theEngineer until the redesign is complete andapproved. Furnish additional materials andwork necessary, including engineeringanalysis and redesign, to effect corrections ofout of tolerance drilled shaft excavations at noexpense to the Department.

Appendix A (Continued).
267
455-22 Static Compression Load Tests.
455-22.1 General: When the plans includeload testing, perform all load tests inaccordance with 455-2.
455-22.2 Disposition of Loading Material:
After completing all load tests, clean, removeall rust on structural steel, repaint all areashaving damage to the paint in accordance withSection 561, and return all load test equipmentsupplied by the Department to its designatedstorage area. Notify the Department at leastten working days in advance so thatarrangements can be made to unload theequipment. The Contractor shall remove allequipment and materials which remains hisproperty from the site. Clean up and restorethe site to the satisfaction of the Engineer.
455-22.3 Disposition of Tested Shafts:
After completing testing, cut off the testedshafts and any reaction shafts at an elevation24 inches [610 mm] below the finishedground surface. Take ownership of the shaftcut-offs and provide areas for their disposal.

Appendix A (Continued).
268
455-23 Method of
Measurement.
455-23.1 Drilled Shafts: The quantity to bepaid for will be the length, in feet [meters], ofthe reinforced concrete drilled shaft of thediameter shown in the plans, completed andaccepted. The length will be determined asthe difference between the top of shaftelevation as shown in the plans and the finalbottom of shaft elevation as authorized andaccepted. When the Contractor elects toprovide outside diameter (O.D.) sized casingrather than inside diameter (I.D.) sized casingas allowed in 455-15.7, the pay quantitymeasured as described above will bemultiplied by a factor (F) determined asfollows:
where:F = factor to adjust pay
q u a n t i t i e s t ocompensate forsmaller shafts.
1D = casing insidediameter specified= shaft diameterspecified.
2D = casing insidediameter provided
2 1(D = D minustwice the wallthickness).

Appendix A (Continued).
269
4 5 5 - 2 3 . 2 D r i l l e d S h a f t s
(Unreinforced): The quantity to be paidfor will be the length, in feet [meters], ofunreinforced concrete drilled shaft of thediameters shown in the plans, completedand accepted. The length will bedetermined as the difference between thetop of shaft elevation as shown in theplans and the final bottom of shaftelevation as authorized and accepted.When the Contractor elects to use O.D.casing, the quantity as determined abovewill be multiplied by the factor "F"
determined as described in 455-23.1.
455-23.3 Unclassified Shaft
Excavation: The quantity to be paid forwill be the length, in feet [meters], ofunclassified shaft excavation of thediameter shown in the plans, completedand accepted, measured along thecenterline of the shaft from the groundsurface elevation to the plan bottom ofshaft elevation authorized and accepted.When drilled shafts are constructedthrough fills placed by the Contractor, theoriginal ground surface before the fill wasplaced will be used to determine thequantity of unclassified shaft excavation.When the Contractor elects to use O.D.casing, the quantity as determined abovewill be multiplied by the factor "F"
determined as described in 455-23.1.

Appendix A (Continued).
270
455-23.4 Unclassified Extra Depth
Excavation: The quantity to be paid forwill be the length, in feet [meters], ofunclassified shaft excavation of thediameter shown in the plans measuredalong the centerline of the shaft from thebottom of shaft elevation shown in theplans to the final authorized bottom ofshaft elevation when below the planbottom of shaft elevation. When theContractor elects to use O.D. casing, thequantity as determined above will bemultiplied by the factor "F" determined asdescribed in 455-23.1.
455-23.5 Drilled Shaft Sidewall
Overreaming: The quantity to be paid forwill be the length, in feet [meters], ofdrilled shaft sidewall overreamingauthorized, completed and accepted,measured between the elevation limitsshown in the plans or authorized by theEngineer. When the Contractor elects touse O.D. casing, the quantity asdetermined above will be multiplied bythe factor "F" determined as described in455-23.1.
455-23.6 Bell Footings: The quantity tobe paid for will be the number of bells ofthe diameter and shape shown in theplans, completed and accepted.
455-23.7 Test Holes: The cost of all testholes will be included in the cost ofDrilled Shafts.
455-23.8 Test Bells: The quantity to bepaid for will be the number of test bells,completed and accepted.
Appendix A (Continued).
271
455-23.9 Core (Shaft Excavation): Thequantity to be paid for will be the length,in feet [meters], measured from thebottom of shaft elevation to the bottom ofthe core-hole, for each authorized coredrilled below the shaft excavation,completed and accepted. When theEngineer authorizes Core (ShaftExcavation) extending through part or allof the shaft, prior to excavation, to somedepth below the shaft bottom, the quantitywill be the length in feet [meters],measured from the top elevation to thebottom elevation authorized by theEngineer, completed and accepted. WhenSPT tests are substituted for coring asprovided in 455-15.6, the quantity will bedetermined as described above for coring.

Appendix A (Continued).
272
455-23.10 Casings: The quantity to bepaid for will be the length, in feet[meters], of each size casing as directedand authorized to be used. The length willbe measured along the casing from the topof the shaft elevation or the top of casingwhichever is lower to the bottom of thecasing at each shaft location where casingis authorized and used, except asdescribed below when the top of casingelevation is shown in the plans. Casingwill be paid for only when the PermanentCasing Method is specified, when theplans show a casing that becomes apermanent part of the shaft, or when theEngineer directs the Contractor to leave acasing in place which then becomes apermanent part of the shaft. No paymentwill be made for casings which becomebound or fouled during shaft constructionand cannot be practically removed. TheContractor shall include the cost of alltemporary removable casings for methodsof construction other than that of thePermanent Casing Method in the bid pricefor Unclassified Shaft Excavation item.
When the Permanent CasingMethod and the top of casing elevation arespecified, the casing will be continuousfrom top to bottom. Authorization fortemporary casing will not be given unlessthe Contractor demonstrates that he canmaintain alignment of the temporaryupper casing with the lower casing to beleft in place during excavation andconcreting operations. When artesianconditions are or may be encountered, theContractor shall also demonstrate that hecan maintain a positive water-tight sealbetween the two casings duringexcavation and concreting operations.
Appendix A (Continued).
273
When the top of casing elevation isshown in the Contract Documents,payment will be from the elevation shownin the plans or from the actual top ofcasing elevation, whichever is lower, tothe bottom of the casing. When theContractor elects to use an approvedspecial temporary casing system in openwater locations, the length to be paid forwill be measured as a single casing asprovided above.
455-23.11 Protection of Existing
Structures: The quantity to be paid forwill be at the lump sum price.
455-23.12 Static Load Tests: Thequantity to be paid for will be the numberof load tests conducted.
455-23.13 Instrumentation and Data
Collection: The quantity to be paid forwill be at the lump sum price.
455-24 Basis of Payment.
455-24.1 Drilled Shafts: Price andpayment will be full compensation for alldrilled shafts, including the cost ofconcrete and reinforcing steel, includingall labor, materials, equipment, andincidentals necessary to complete thedrilled shaft.
4 5 5 - 2 4 . 2 D r i l l e d S h a f t s
(Unreinforced): Price and payment willbe full compensation for all drilled shafts(unreinforced), including the cost ofconcrete and all labor, equipment,materials, and incidentals necessary tocomplete the drilled shaft.

Appendix A (Continued).
274
455-24.3 Unclassified Shaft
Excavation: Price and payment will befull compensation for the shaft excavation(except for the additional costs includedunder the associated pay items for casing);removal from the site and disposal ofexcavated materials; restoring the site asrequired; cleaning and inspecting shaftexcavations; using slurry as necessary;using drilling equipment; blastingprocedures, special tools and specialdrilling equipment to excavate the shaft tothe depth indicated in the plans; andfurnishing all other labor, materials, andequipment necessary to complete the workin an acceptable manner.
455-24.4 Bell Footings: Price ndpayment will be full compensation forforming and excavating the bell beyondthe diameter of the drilled shaft,furnishing and casting additional concretenecessary to fill the bell outside the shafttogether with any extra reinforcing steelrequired, removing excavated materialsfrom the site, and all other expensesnecessary to complete the work.
455-24.5 Test Holes: No separatepayment will be made for Test Hole. Allcost of Test Holes will be included in thecost of Drilled Shafts.
455-24.6 Test Bells: Price and paymentwill be full compensation for forming thetest bell, providing inspection facilities,backfilling the bell when the test hole isdrilled out of position, and all otherexpenses necessary to complete the work.

Appendix A (Continued).
275
455-24.7 Core (Shaft Excavation):
Price and payment will be fullcompensation for drilling and classifyingthe cores, delivering them to theDepartment, furnishing drilled shaftconcrete to fill the core hole, and all otherexpenses necessary to complete the work.When SPT tests are substituted for coringas provided in 455-15.6, they will be paidfor at the price per foot [meter] for coring.
455-24.8 Casings: Price and paymentwill be full compensation for additionalcosts necessary for furnishing and placingthe casing in the shaft excavation abovethe costs attributable to the work paid forunder associated pay items forUnclassified Shaft Excavation andUnclassified Extra Depth Excavation.
455-24.9 Protection of Existing
Structures: Price and payment willinclude all cost of work shown in theplans or described herein for protection ofexisting structures. When the ContractDocuments do not include an item forprotection of existing structures, the costof settlement monitoring as required bythese Specifications will be included inthe cost of Unclassified Shaft Excavation;however, work in addition to settlementmonitoring will be paid for asUnforeseeable Work when such additionalwork is ordered by the Engineer.
455-24.10 Static Load Tests: Price andpayment will include all costs related tothe performance of the load test.

Appendix A (Continued).
276
455-24.11 Instrumentation and Data
Collection: Price and payment willinclude all labor, equipment, and materialsincidental to the instrumentation and datacollection, and, when required, the loadtest report.
455-24.12 Payment Items: will be madeunder:Item No. 455- 18- Protection ofExisting Structures - lump sum.Item No. 2455- 18- Protection ofExisting Structures - lump sum.Item No. 455- 88- Drilled Shaft - perfoot.Item No. 2455- 88- Drilled Shaft - permeter.Item No. 455- 90- Bell Footings - each.Item No. 2455- 90- Bell Footings - each.Item No. 455- 92- Test Bells - each.Item No. 2455- 92- Test Bells - each.Item No. 455-107- Casing - per foot.Item No. 2455-107- Casing - per meter.Item No. 455-111- Core (ShaftExcavation) - per foot.Item No. 2455-111- Core (ShaftExcavation) - per meterItem No. 455-119- Test Loads - each.Item No. 2455-119- Test Loads - each.Item No. 455-122- Unclassified ShaftExcavation - per foot.Item No. 2455-122- Unclassified ShaftExcavation - per meter.Item No. 455-129- Instrumentation andData Collection - lump sum.Item No. 2455-129- Instrumentation andData Collection - lump sum.