Anomaly detection through Probabilistic Support Vector Machine Classification
Upload
khangminh22Category
view
1download
0
Entropy 2015, 17, 2367-2408; doi:10.3390/e17042367OPEN ACCESS
entropyISSN 1099-4300
www.mdpi.com/journal/entropy
Article
An Entropy-Based Network Anomaly Detection MethodPrzemysław Berezinski 1, Bartosz Jasiul 1,* and Marcin Szpyrka 2
1 C4I Systems’ Department, Military Communication Institute, ul. Warszawska 22a, 05-130 Zegrze,Poland; E-Mail: [email protected]
2 Department of Applied Computer Science, AGH University of Science and Technology,al. Mickiewicza 30, 30-059 Krakow, Poland; E-Mail: [email protected]
* Author to whom correspondence should be addressed; E-Mail: [email protected];Tel.: +48-261-885-592.
Academic Editors: James Park and Wanlei Zhou
Received: 28 February 2015 / Accepted: 16 April 2015 / Published: 20 April 2015
Abstract: Data mining is an interdisciplinary subfield of computer science involvingmethods at the intersection of artificial intelligence, machine learning and statistics. One ofthe data mining tasks is anomaly detection which is the analysis of large quantities of data toidentify items, events or observations which do not conform to an expected pattern. Anomalydetection is applicable in a variety of domains, e.g., fraud detection, fault detection, systemhealth monitoring but this article focuses on application of anomaly detection in the field ofnetwork intrusion detection.The main goal of the article is to prove that an entropy-basedapproach is suitable to detect modern botnet-like malware based on anomalous patterns innetwork. This aim is achieved by realization of the following points: (i) preparation ofa concept of original entropy-based network anomaly detection method, (ii) implementationof the method, (iii) preparation of original dataset, (iv) evaluation of the method.
Keywords: anomaly detection; entropy; malware detection
1. Introduction
The first anomaly detection method for intrusion detection was proposed almost 40 years ago [1].Today, network anomaly detection is a very broad and heavily explored subject but the problem of
Entropy 2015, 17 2368
finding a generic method for a wide range of network anomalies is still unsolved. Widely used intrusiondetection systems are ineffective against a modern malicious software (malware). Such systems mostlymake use of common signature-based (or misuse-based) technique. This approach is known for itsshortcomings [2–5]. Signatures describe only illegal patterns in network traffic, so a prior knowledge isrequired [2]. Signature-based solutions do not cope with evasion techniques and not known yet attacks(0-days) [3]. Moreover, they are unable to detect a specific attack until a rule for the correspondingvulnerability is created, tested, released and deployed, which usually takes long time [4,5]. Therefore,a proper network anomaly detection as one of possible solutions to complement signature-basedsolutions is essential. Recently, entropy-based methods which rely on network feature distributions hasbeen of a great interest [6–11]. It is crucial to check if entropy-based approach is efficient in detection ofanomalous network activities caused by modern botnet-like malware [12]. Botnet is a group of infectedhosts (bots) controlled by Command and Cotrol (C&C) servers operated by cyber-criminals. The numberof such a malware as well as the level of its sophistication increases each year [13]. Damage from thistype of malware can take many serious forms including loss of important data, reputation or money.Moreover, nowadays such malware is also used in a warfare to cunduct sabotega and espionage [14].Entropy-based approach to detect anomalies caused by botnet-like malware in a local networks is notinvestigated area. Entropy-based methods proposed in the past e.g. [8,10,15] deals with a massivespreads of old types of worms (not botnet-like) or different types of Distributed Denial of Service(DDoS) attacks in a high-speed networks. In this article we propose an effective entropy based methodfor detection and categorization of network anomalies that indicate existence of the botnet-like malwarein the local networks. This type of anomalies are often very small and hidden in a network traffic volumeexpressed by the number of flows, packets or bytes, so their detection with popular solutions and methodswhich rely mostly on a traffic volume changes, e.g., [16–19] is highly difficult.
The main goal of this article is to prove that entropy-based approach is suitable to detect modernbotnet-like malware based on anomalous network patterns. The aim was achieved by realization thefollowing points: (i) preparation of a concept of original entropy-based network anomaly detectionmethod, (ii) implementation of the method, (iii) preparation of original dataset, (iv) evaluation ofthe method.
These steps are discussed in details in the further part of the article that is organized as follows:
• Section 2 reviews related work in the area of network anomaly detection.
• Section 3 introduces the definition of Shannon entropy and describes Renyi and Tsallisgeneralizations. Brief overview as well as comparison of entropy measures are provided.
• Section 4 presents the architecture of the proposed method. Detailed specification as well as resultsof implementation are given.
• Section 5 refers to the dataset developed in order to evaluate a performance of theproposed method.
• Section 6 presents results of verification of the method.
• Section 7 finishes this article providing conclusions and short summary. It also outlinesfurther work.

Entropy 2015, 17 2369
2. Related Work
This section reviews related work in the area of network anomaly detection. The section starts witha general overview of the latest advances in this broad subject. Then, more details on anomaly detectiontechniques that are closely related to the approach proposed in this article are presented and commentsare provided.
2.1. General Overview of Network Anomaly Techniques
The problem of anomaly detection in network traffic has been extensively studied. There are manysurveys, review articles, as well as books on this broad subject. A good number of research on anomalydetection techniques is found in several books, e.g. [20–23]. In surveys such as [24,25], authors discussanomaly detection in general and cover the network intrusion detection domain only briefly. In severalreview papers [26–32] various network anomaly detection methods have been summarized. Fromaforementioned surveys one can find that the most effective methods of network anomaly detectionare Principle Component Analysis [33–35], Wavelet analysis [36–38], Markovian models [39,40],Clustering [41–43], Histograms [44,45], Sketches [46,47], and Entropies [8,15,48].
2.2. Closely Related Work
In this paragraph a closer look at works strictly related to approach proposed in this article is taken.Analysis of detection methods based on summarizing feature distributions via entropy, histograms andsketches is provided. Special attention is devoted to the methods employing different forms of entropy.Some comments according noticed gaps are given. Section starts with the comparison of the featuredistributions approach to the older but still more popular detection via counters.
2.2.1. Detection via Counters
In the past, anomalies were treated as deviations in the traffic volume. Simple counters like: numberof flows, packets (total, forwarded, fragmented, discarded) and bytes (per packet, per second) wereused. These counters can be derived from network devices via Simple Network Management Protocol(SNMP) [49] or NetFlow [50].
Barford et al. [17] presented wavelet analysis to distinguish between predictable and anomalous trafficvolume changes using a very basic set of counters from NetFlow and SNMP data. They used ratheradvanced signal analysis technique combined with very simple metrics, i.e., number of flows, packetsand bytes. The authors reported some positive results in detection of high-volume anomalies like networkfailure, bandwidth flood and flash crowd.
Kim et al. [18] proposed a method where many different DDoS attacks [51,52] are described in termsof traffic patterns in a flow characteristics. In particular, the authors focused on counters like: numberof flows, packets, bytes, the flow and packet sizes, average flow size and number of packets per flow.In the presented TCP SYN flood example the following pattern was applied: a large number of flows,yet small number of small packets and no constraints on the bandwidth and the total amount of packets.This pattern differs significantly from the one generated for an ICMP/UDP flooding attacks, where high

Entropy 2015, 17 2370
bandwidth consumption and a large number of packets is involved. Although the authors reported somegood results, they also mentioned that common legitimate peer-to-peer (P2P) traffic [53] may result insome false alarms in their approach.
A threshold-based detector measuring the deviation from a mean value present in a traffic collectionalgorithm for frequent collection of SNMP data was proposed by Lee et al. [54]. To assess the algorithm,the authors examined how it impacts detection of volume anomalies. Only some minor differences werereported in comparison to the original traffic collection algorithm.
Casas et al. [55] introduced an anomaly detection algorithm based on SNMP data which dealswith abrupt and large traffic changes. The authors proposed a novel linear parsimonious model foranomaly-free network flows. This model makes it possible to treat the legitimate traffic as a nuisanceparameter, to remove it from the detection problem and to detect the anomalies in the residuals. Authorsreported that with this approach they slightly improved previously introduced approach based on PCAin terms of a false alarms.
Many commercial and open source solutions that relay on SNMP or NetFlow counters are available onthe market, e.g., NFSen [16], NtopNg [19], Plixer Scrutinizer [56], Peassler PRTG [57] , and SolarwindsNetwork Traffic Analyzer [58]. All of them provide more or less the same functionality, i.e., browsingand filtering network data, raporting and alerting. Several commercial solutions like, e.g., Invea-TechFlowMon [59] or AKMA Labs FlowMatrix [60] offer some advanced anomaly detection methods whichmostly rely on predefined set of rules for detection of undesirable behavior patterns and some simplelong-term network behavior profiles in terms of services, traffic volume and communication sides.
Concluding this subsection, we noticed that although there are many methods that rely on counters,their use is limited. The problem with a counter-based approach is that it is strictly connected witha traffic volume. Nowadays many anomalous network activities such as low-rate DDoS [61,62] stealthscanning or botnet-like worm propagation and communication do not result in substantial traffic volumechange. Presented above counter-based methods handles well large and abrupt traffic changes suchas bandwidth flooding attacks or flash crowds, but a large group of anomalies which do not causechanges of volume remains undetected. Moreover there is also some practical issue connected withcounters reported by Brauckhoff et al. [63] who stated that packets sampling used by many routers tosave resources when collecting data can influence a counter-based anomaly detection metrics, but doesnot significantly affect the distribution of traffic features.
2.2.2. Detection via Feature Distributions
Network anomaly detection via traffic feature distributions is becoming more and more popular.Several feature distributions, i.e., header-based (addresses, ports, flags), volume-based (host or servicespecific percentage of flows, packets and bytes) and behavior-based (in/out connections for particularhost) have been suggested in the past [8,15,64]. However, it is unclear which feature distributionsperform best. Nychis in [8], based on his results of pairwise correlation reported dependencies betweenaddresses and ports and recommended the use of volume-based and behavior-based feature distributions.In opposite, Tellenbach in [15] found no correlation among header-based features.
In this article, original results of feature correlation are presented and some interesting conclusionsare given in Section 6.

Entropy 2015, 17 2371
Shannon Entropy Entropy as the measure of uncertainty can be used to summarize featuredistributions in a compact form, i.e., single number. Many forms of entropy exist, but only a fewhave been applied to network anomaly detection. The most popular is the well-known Shannonentropy [65,66]. Application of Shannon measures like relative entropy and conditional entropy toconduct network anomaly detection were proposed by Lee and Xiang [67]. Also, Lakhina et al. [64]made use of Shannon entropy to sum up a feature distribution of network flows. By using unsupervisedlearning, the authors showed that anomalies can be successfully clustered. Wagner and Plattner [7]made use of the Kolmogorov Complexity (related to Shannon entropy) [68,69] in order to detect wormsin network traffic. Their work mostly focuses on implementation aspects and scalability and does notpropose any specific analysis techniques. The authors reported that their method is able to detect wormoutbreaks and massive scanning activities in a near real time. Ranjan et al. [70] suggested another wormdetection algorithm which measures Shannon entropy ratios for traffic feature pairs and issues an alarmon sudden changes. Gu et al. [71] made use of Shannon maximum entropy estimation to estimate thenetwork baseline distribution and to give a multi-dimensional view of network traffic. The authors claimthat with their approach they were able to distinguish anomalies that change the traffic either abruptlyor slowly.
Generalized entropy Besides Shannon entropy, some generalization of entropy have been recentlyintroduced in the context of network anomaly detection. Einman in [6,72,73] reported some positiveresults of using T-entropy [74] for intrusion detection based on packet analysis. T-entropy can beestimated from a string complexity measure called T-complexity. String complexity is a minimumnumber of steps required to construct a given string. In contrast to entropy, where probabilities (estimatedfrom frequencies) can be permuted, in a complexity-based approach, the order matters. A string iscompressed with some algorithm and the output length is used to estimate the complexity. Finally,the complexity becomes an estimate for the entropy. Because in this approach sequence of eventsis crucial, it fits to fine-grinded methods of network data analysis like full packet or header packetinspection. However, this type of inspection is not scalable in the context of network speed. Somedetails about T-entropy are also presented in our paper [75]. A parameterized generalization of entropyhave also been recently reported as very promising. The Shannon entropy assumes a tradeoff betweencontributions from the main mass of the distribution and the tail. With the parameterized Tsallis [76–78]or Renyi [79,80] entropy, one can control this tradeoff. In general, if the parameter denoted as α hasa positive value, it exposes the main mass, if the value is negative – it refers to the tail. Ziviani et al. [81]investigated Tsallis entropy in the context of the best value of α parameter in DoS attacks detection.They found that α-value around 0.9 is the best for detecting such attacks. Shafiq et al. [82] did the samefor port scan anomalies caused by malware. He reported that for scan anomalies α-value around 0.5 isthe best choice. A comparative study of the use of the Shannon, Renyi and Tsallis entropy for attributeselecting to obtain an optimal attribute subset, which increases the detection capability of decision treeand k-means classifiers was presented by Lima et al. [83]. The experimental results demonstrate thatthe performance of the models built with smaller subsets of attributes is comparable and sometimesbetter than that associated with the complete set of attributes for DoS and scan attack categories. Theauthors found, that for the DoS category, Renyi entropy with α-value around 0.5 and Tsallis entropy

Entropy 2015, 17 2372
with α-value around 1.2 are the best for decision tree classifier. We believe, the proper choice of theα-value depends either on the anomaly or the legitimate traffic used as a baseline, or for both, sincenone of the authors mentioned above reported similar results. Thus, such goals like finding the propervalue of parameter for entropy in order to improve detection of particular group of anomalies remainsunachieved. Some authors, e.g., Tellenbach et al. [9,15,84] employed a set of α-values in their methods.The authors proposed the Traffic Entropy Telescope prototype based on Tsallis entropy capable to detecta broad spectrum of anomalies in a backbone traffic including fast-spreading worms (not that commonnowadays), scans and different form of DoS/DDoS attacks. Although Tsallis entropy seems to be morepopular than Renyi entropy in the context of network anomaly detection the latter was also successfullyapplied in detection of different anomalies. An example is the work by Yang et al. [10] who employedRenyi entropy to early detection of low-rate DDoS attacks and Kopylova et al. [11] who reportedpositive results of using Renyi conditional entropy in detection of selected worms. We believe that withparameterized entropy some limitations of Shannon entropy caused by small descriptive capability [9]which results in a little ability to detect typical small or low-rate anomalies can be overcome. Moreover,we think that with some properly chosen spectrum of α-values this detection will be accurate in terms oflow false alarms and high detection rate. In this article we present original results of our research on themost suitable set of α-values as well as original results of research on the most suitable entropy type.
Others Techniques Apart from entropy, some other feature distributions summarization techniquesare successfully used in the context of network anomaly detection [85], namely sketches and histograms.Soule et al. [45] proposed a flow classification method based on modeling network flow histogramsusing Dirichlet Mixture Processes for random distributions. The authors validated their model againstthree synthetic test cases and achieved almost 100% classification accuracy. In [46], Stoecklin et al.introduced a two-layered sketch anomaly detection technique. The first layer models typical values ofdifferent feature components (e.g., typical number of flows connecting to a specific port) and the secondlayer evaluates the differences between observed feature distribution and the corresponding model. Theauthors claim that the main strength of their method is the construction of fine-grained models thatcapture the details of feature distributions, instead of summarizing it into an entropy value. A moregeneral approach was presented by Kind et al. [18]. In their method histogram-based baselines wereconstructed from selected essential network traffic features distributions like addresses and ports. Thiswork was augmented by Brauckhoff et al. in [47] who applied association rule mining, in order toidentify flows representing anomalous network traffic. The main problem with non-entropic featuredistributions summarization techniques is a proper tuning [9]. The performance of detection dependsto a great extent on the accuracy of a bin size. This may be difficult to manage while networktraffic changes.
3. Entropy
This chapter introduces theoretic fundamentals of entropy. It starts with a brief overview of Shannonentropy. Next, the parameterized generalizations are presented. Finally a comparison of entropymeasures is provided.

Entropy 2015, 17 2373
3.1. Shannon Entropy
Definition of entropy as a measure of disorder comes from thermodynamic and was proposed inthe early 1850s by Clausius [86]. In 1948 Shannon [65] adopted entropy to information theory. Ininformation theory, entropy is a measure of the uncertainty associated with a random variable The morerandom the variable, the bigger the entropy and in contrast, the greater certainty of the variable, thesmaller the entropy. For a probability distribution p(X = xi) of a discrete random variable X , theShannon entropy is defined as:
Hs(X) =n∑i=1
p(xi) loga1
p(xi)(1)
X is the feature that can take values {x1...xn} and p(xi) is the probability mass function of outcomexi. The entropy of X can be also interpreted as the expected value of loga
1p(X)
where X is drownaccording to probability mass function p(x). Depending on the base of the logarithm, different unitscan be used: bits (a = 2), nats (a = e) or hurtleys (a = 10). For the purpose of network anomalydetection, sampled probabilities estimated from a number of occurrences of xi in a time window t aretypically used. The value of entropy depends on randomness (it attains maximum when probability p(xi)for every xi is equal) but also on the value of n. In order to measure randomness only, normalized formshave to be employed. For example, an entropy value can be divided by n or by maximum entropy definedas loga(n). Some important properties of Shannon entropy are listed below:
• Nonnegativity ∀p(xi)∈[0,1]Hs(X) ≥ 0;
• Symmetry Hs(p(x1), p(x2), ...) = Hs(p(x2), p(x1), ...);
• Maximality Hs(p(x1), ..., p(xn)) ≤ Hs(1n, ..., 1
n) = loga(n);
• Additivity Hs(X, Y ) = Hs(X) +Hs(Y ) if X and Y are independent variables.
Much more properties of Shannon entropy can be found in [87,88].If not only the degree of uncertainty is important but also the extent of changes between assumed
and observed distributions, denoted as q and p respectively, a relative entropy, also known as theKullback-Leibler divergence [89] can be used:
DKL(p||q) =n∑i=1
p(i) logap(i)
q(i)(2)
This definition is not symmetric, DKL(p||q) 6= DKL(q||p) unless p = q.To measure how much uncertainty is eliminated in X by observing Y the conditional entropy (or
equivocation) [90] may be employed:
HS(X|Y ) =m∑i=1
n∑j=1
p(xi, yj) loga p(xi|yj) (3)

Entropy 2015, 17 2374
3.2. Parameterized Entropy
The Shannon entropy assumes a tradeoff between contributions from the main mass of the distributionand the tail [91]. To control this tradeoff, two parameterized Shannon entropy generalizations wereproposed, by Renyi (1970s) [79] and Tsallis (late 1980s) [76] respectively. If the parameter denoted asα (or q) has a positive value, it exposes the main mass (the concentration of events that occur often), ifthe value is negative – it refers to the tail (the dispersion caused by seldom events).
Both parameterized entropies (Renyi and Tsallis) derive from the Kolmogorov-Nagumogeneralization of an average [92,93]:
〈X〉φ = φ−1
(n∑i=1
p(xi)φ(xi)
), (4)
where φ is a function which satisfies the postulate of additivity (only affine or exponential functionssatisfy this) and φ−1 is the inverse function. Due to affine transformations φ(xi)→ γ(xi) = aφ(xi) + b
(where a and b are numbers), the inverse function φ(xi) is expressed as γ−1(xi) = φ−1(xi−ba
)
Renyi proposed the following function φ:
φ(xi) = 2(1−α)xi (5)
Renyi entropy can be obtained from the Shannon entropy with the following transformations [93]:
HRα(X) = φ−1
(n∑i=1
p(xi)φ(− log2 p(xi))
)(6)
Given φ(xi) = 2(1−α)xi and φ−1(xi) = 1(1−α) log2 xi
HRα(X) =1
1− αlog2
(n∑i=1
p(xi)2−(1−α) log2 p(xi)
)
=1
1− αlog2
(n∑i=1
p(xi)2log2 p(xi)
(α−1)
)
=1
1− αlog2
(n∑i=1
p(xi)p(xi)(α−1)
)
=1
1− αlog2
(n∑i=1
p(xi)α
)(7)
After transformation, a well-known form of Renyi entropy is obtained:
HRα(X) =1
1− αloga
(n∑i=1
p(xi)α
)(8)
The Renyi entropy satisfies the same postulates as the Shannon entropy and there are the followingrelation between these two:
HRα1(X) ≥ HS(X) ≥ HRα2(X) where α1 < 1 and α2 > 1 (9)

Entropy 2015, 17 2375
limα→1
1
1− αloga
(n∑i=1
p(xi)α
)= Hs(X) =
n∑i=1
p(xi) loga1
p(xi)(10)
Tsallis proposed the following function φ:
φ(xi) =2(1−α)xi − 1
1− α(11)
After transformation, a well-known form of Tsallis entropy is as follows:
HTα(X) =1
1− α
(n∑i=1
p(xi)α − 1
)(12)
As one can see this entropy is non logarithmic. There are the following relation between the Shannonand the Tsallis entropy:
HTα1(X) ≥ HS(X) ≥ HTα2(X), where α1 < 1 and α2 > 1 (13)
limα→1
1
1− α
(n∑i=1
p(xi)α − 1
)= log 2Hs(X) = log 2
n∑i=1
p(xi) loga1
p(xi)(14)
Moreover, Tsallis entropy is non-extensive i.e., it satisfies only pseudo-additivity criteria. For anindependent discrete random variables X ,Y :
HTα(X, Y ) = HTα(X) +HTα(Y ) + (1− α)HTα(X) +HTα(Y ). (15)
It means that:HTα(X, Y ) > HTα(X) +HTα(Y ) for α ∈ (−∞, 1)
andHTα(X, Y ) < HTα(X) +HTα(Y ) for α ∈ (1,∞)
To summarize parameterized (Renyi and Tsallis) entropies – both of them:
• expose concentration for α > 1 and dispersion for α < 1,
• converge to Shannon entropy for α→ 1,
3.3. Comparison
In order to understand, compare and successfully apply parameterized entropies in our approach someexperiments were conducted.
Firstly, a comparison of Shannon, Renyi and Tsallis entropy of a bi-nominal probability distributionswas performed. Then we compared calculated entropies for an uniform distribution to check how theydepends on number of equal probabilities and α-values. Next, the impact of rare and frequent events onthe value of entropy for different α-values was examined.

Entropy 2015, 17 2376
3.3.1. Binominal Distribution
Shannon, Renyi and Tsallis entropy for a bi-nominal probability distribution where the probabilityof success is p, and the probability of failure is 1 − p is depicted in Figure 1, Figure 2 and Figure 3respectively.
0.05 0.2 0.4 0.6 0.8 0.95
0.4
0.6
0.8
1
P
HS
Figure 1. Shannon entropy.
0.05 0.2 0.4 0.6 0.8 0.950
1
2
3
P
HRα
α = −2
α = −1
α = 0
α = 1
α = 2
Figure 2. Renyi entropy of several α-values.
0.05 0.2 0.4 0.6 0.8 0.950
1
2
3
P
HTα
α = −0.5
α = −0.1
α = 0
α = 1
α = 2
Figure 3. Tsallis entropy of several α-values.

Entropy 2015, 17 2377
As one can see both Renyi and Tsallis converge to the Shannon entropy for α→ 1. (Note: Accordingto Equation (14) Tsallis needs to be multiplied by 1
log 2to get the similar to Shannon curve for α → 1).
Tsallis entropy is much more sensitive than Renyi for negative α-values and less sensitive for positiveα-values. Moreover, Tsallis maximum entropy changes for different α-values, while Renyi is alwaysequal to 1.
3.3.2. Uniform Distribution
Shannon, Renyi and Tsallis entropy for a uniform probability distribution is depicted in Figure 4.In this distribution maximum entropy (case when probabilities are equal) is calculated for different nrepresenting number of equal probabilities.
2 4 6 8 100
2
4
6
8
10
n
H(X
)
Shannon =Renyi α ∈ (−∞,∞)
Tsallis α = −0.1
Tsallis α = 2
Figure 4. Shannon,Renyi and Tsallis entropy for an uniform distribution.
As one can see in contrast to Shannon and Renyi entropy, value of Tsallis entropy depends not onlyon n but also on value of α.
3.3.3. Impact of Frequent and Rare Events
Example 1. Let’s assume a discrete random variable X = ip addresses observed in network withinlast 1 min. X = {“10.1.0.1”, “10.1.0.2”, “10.1.0.3”, “10.1.0.4”, “10.1.0.5”}. Suppose the followingnumber of occurrences for the subsequent ip addresses Freq = {96, 1, 1, 1, 1}. Based on frequencieslet’s estimate the following probability distribution of X (see Table 1).
Table 1. Probability distribution of X .
X “10.1.0.1” “10.1.0.2” “10.1.0.3” “10.1.0.4” “10.1.0.5”p(X = x) 0.96 0.01 0.01 0.01 0.01
Let’s examine what is the impact of a frequent event p(X =“10.1.0.1”) = 0.96 and rare eventp(X =“10.1.0.2”) = 0.01 on the Renyi and Tsallis entropy when α = −2 and α = 2 are used. In order

Entropy 2015, 17 2378
to measure the impact of these events, we can check results of exponential expression p(xi)α existing inboth Renyi and Tsallis formulas in Equation (8), Equation (12). The results are presented in Table 2.
Table 2. Impact of frequent and rare events on the value of parameterized entropy.
p(xi)α −2 2
0.96 1.08 0.92
0.01 10000 0.0001
As one can see the impact of frequent events (expressed by p(xi) = 0.96) on the entropy is greaterthan impact of rare events (expressed by p(xi) = 0.01) when positive α-values are used and in oppositethe impact of rare events is greater than frequent events when negative α-values are used.
4. Anode—Entropy-Based Network Anomaly Detector
This chapter is focused on the proposed method and its implementation named Anode. Firstly, anoperating principle is presented. Then, results of implementation are given.
In order to verify if entropy-based approach is suitable to detect modern botnet-like malware basedon anomalous network patterns the entropy-based network anomaly detector named Anode has beenproposed. Operating principle of Anode is presented in Figure 5.
4.1. Architecture
The architecture of Anode is presented in Figure 5.
Figure 5. Anode—the architecture.
Anode analyzes network data captured by NetFlow probes. Typical probes like routers or dedicatedprobes, e.g., Softlowd [94] connected to TAPs [95] or SPAN ports [95] on switches are assumed. Flows

Entropy 2015, 17 2379
are analyzed within fixed time intervals (every 5 min by default). Bidirectional flows [96] are usedsince, according to some works (e.g. [8]), unidirectional flows may entail biased results. Collectedflows are recorded in the relational database and then analyzed. In order to limit the area of search foranomalies, filters per direction, protocol and subnet are provided. Next, depends on the mode, Tsallis orRenyi entropy of positive and negative α-values is calculated for traffic feature distributions presented inTable 3. (Note: the Shannon version of our method use internally Renyi entropy with α set to 1).
Table 3. Selected traffic feature distributions.
Feature Probability mass function
src(dst)address(port) number of xi as src(dst)address(port)total number of src(dst)addresses(ports)
flows duration number of flows with xi as durationtotal number of flows
packets, bytes number of pkts(bytes) with xi as src(dst) addr(port)total number of pkts(bytes)
in(out)-degree number of hosts with xi as in(out)−degreetotal number of hosts
There are two phases in our approach: training and detection. In the training phase profile oflegitimate traffic is built and model for classification is prepared. In the detection phase currentobservation are compared with the model. Initially, during the training phase, a dynamic profile isbuilt using min and max entropy values within a sliding time window for every 〈feature, α〉 pair. Thus,we can reflect traffic changes during the day but in the same time a margin for some minor differences,e.g., small delays between the profile and current traffic is provided. A way of building a profile basedon entropy values is presented in Figure 6
Figure 6. A way of building a profile.
In the detection phase, the observed entropy is compared with the min and max values stored in theprofile according to the following rule:
rα(xi) =Hα(xi)− k ∗minαk ∗ (maxa−minα)
, k ∈ 〈1..2〉 (16)

Entropy 2015, 17 2380
With the use of this rule, anomaly threshold is defined. Values rα(xi) < 0 or rα(xi) > 1 indicateabnormal concentration or dispersion. These abnormal dispersion or concentration for different featuredistributions are characteristic for anomalies. For example, during a port scan, a high dispersion in portnumbers and high concentration in addresses should be observed. Detection is based on the relative valueof entropy with respect to the distance between min and max. Coefficient k in the formula determinesa margin for min and max boundaries and may be used for tuning purposes. A high value of k, e.g.,k = 2, limits the number of false alarms (alarms where no anomaly has taken placed) while a lowvalue (k = 1) increases the detection rate (the percentage of anomalies correctly detected). Some otherapproaches to thresholding based on standard deviation – mean ± 2sdev, median absolute deviation –median ± 2mad [97] has been also taken into consideration but empirical results proved that proposedrule is the best choice. The detection is based on the results from all feature distributions presentedin Table 3. Classification is based on popular classifiers (decision trees, Bayes nets [98], rules andfunctions) employed in Weka [99]. Extraction of anomaly details is also assumed – related ports andaddresses are obtained by looking into the top contributors to the entropy value.
4.2. Implementation
A proof of concept implementation of Anode has been developed in Microsoft .NET environment inC# language. Currently it allows to detect anomalies in an off-line mode. All experiments presented inthis article has been conducted with this implementation. Our software produces Weka arff files basedon entropy calculations for each network feature. Recorded NetFlow data (e.g. whole day traffic) hasto be captured and labeled in advance. Classification performance is evaluated with Weka (ten-foldcross-validation mode) based on provided arff files.
Currently Anode is also a component of the anomaly detection and security event data correlationsystem developed in SECOR project [100]. A final implementation in SECOR has been developedin JAVA WSO2 (http://wso2.com) environment. This implementation allows on-line detection andclassification an anomalies based on NetFlow reports coming from probes deployed in network. SECORis not limited to network anomaly detection, e.g., PRONTO module [101,102] developed by anotherteam of the project detects obfuscated malware at infected hosts.
5. Dataset
This chapter presents the dataset developed to evaluate proposed method. This dataset is based ona real legitimate traffic and synthetic anomalies. It consist of labeled flows which are stored in therelational database. Chapter starts with the origin of the idea. Next, details concerning legitimate andanomalous traffic are presented.
5.1. Origin of the Idea
One of the main problem in network anomaly detection is the lack of realistic and publicly availabledatasets for evaluation purposes. The most valuable are real network traces but because of privacy issuesthey are rarely published even though some anonimization techniques exists. Another problem with real

Entropy 2015, 17 2381
traces is a proper labeling, which in many cases have to be done manually. Alternative approach aresynthetic datasets. To build such dataset a deep domain knowledge and appropriate methods and toolsare required in order to get a realistic data. Most authors do not disclose self-crafted traces used forevaluation of their methods. Real traffic traces can be found in some publicly available repositories likeInternet Traffic Archive [103], LBNL/ICSI Enterprise Tracing [104], SimpleWeb [105], Caida [106],MOME [107], WITS [108], UMASS [109]. Unfortunately, these traces are usually old, often unlabeledand they are not dedicated to anomaly detection. Lack of contemporary anomalies, e.g., traces ofbotnet activity in available datasets question thier timeliness. According to recent reports providedby cyber security organizations [13,110–112] botnets are one of the most sophisticated and populartypes of cybercrime today. So anomalies connected with botnet-like malware should be included incontemporary datasets and researches should address this anomalies in their methods. The numberof datasets containing modern malware traces is limited. Worth mentioning are ISOT [113] andCTU-13 [114]. The first one is a mixture of malicious and non-malicious datasets. Regrettably onlyone host in this dataset is infected with botnet-like malware. The second dataset which has just beenmade public is much richer and consist of traces of serveral bots, namely Neris, Rbot, Sogou, Murlo,Menti. Unfortunately, as this dataset has appeared recentlym, we had no chance to use it in our studies.Interesting flow-based traffic dataset has been recently made publicly available by Sperotto et al. [115].This set is based on data collected from a real honeypot (monitored trap) featuring HTTP, SSH andFTP services. The authors gathered about 14 million malicious flows but most of them referred toactivity of web and network scanners. Some details about particular anomalies in this dataset arealso presented in our research [116]. Instead of tracking anomalies caused by modern malware someauthors still make use of very old and criticized DARPA [117] data set and their modified versions,namely, KDD99 [118] and NSL-KDD [119] to evaluate their methods. Besides strong criticism byMcHugh [120], Mahoney et al. [121] or Thomas [122] for being unrealistic and not balanced, nowadaysDARPA dataset are simply out of date in the context of network services and attacks. According toBrauckhoff et al. [123], a realistic simulation of legitimate traffic is largely an unsolved problem todayand one of the solution is combining generated anomalies with real, legitimate traffic traces. In [123] andthen in [124], Brauckhoff et al. introduced the FLAME tool for injection of hand-crafted anomalies intoa given background traffic trace. This tool is freely available but the current distribution does not includeany models reflecting anomalies. Another interesting concept was introduced by Shiravi et al. [125].Authors proposed to describe network traffic (not only flows) by a set of so-called α and β profileswhich can subsequently be used to generate a synthetic dataset. The α-profiles consist of actions whichshould be executed to generate a given event in the network (such as attack) while in β-profiles certainentities (packet sizes, number of packets per flow) are represented by a statistical model. Regrettably,this tool is not freely available.
All things considered—the effort to build own dataset was taken due to:
• limited availability of such datasets;
• the lack of proper labeling in shared datasets;
• the fact that most of available datasets are obsolete in terms of legitimate traffic and anomalies;
• the absence of realistic data in synthetic datasets;
Entropy 2015, 17 2382
• small number of dataset with flows (conversion from packets is needed, labels are lost);
• incompleteness of data (narrow range of anomalies, lack of anomalies related to botnet-likemalware);
5.2. Legitimate Traffic
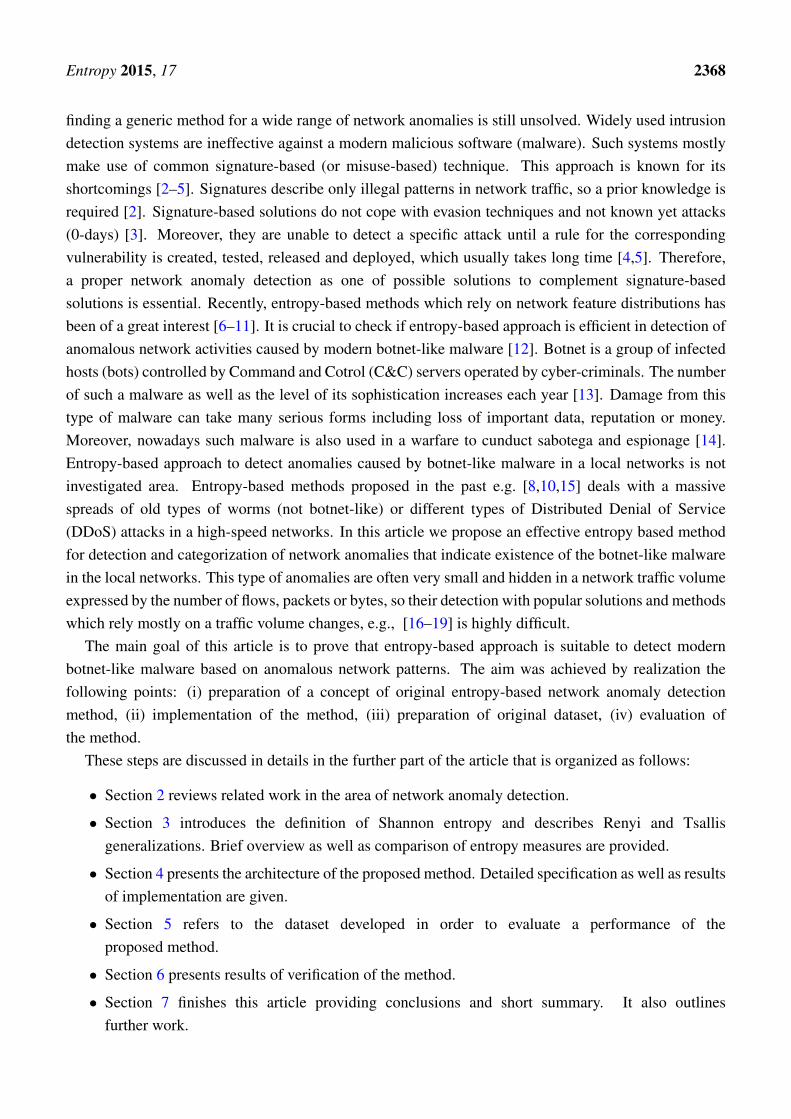
Firstly, one-week legitimate traffic from a medium size network connected to the Internet wascaptured. This was accomplished using open source software—Softflowd [94] and NfDump [16].Because daily profile of each working day in this traffic is similar (except some minor differences onMonday morning and Friday afternoon) one-day profiling approach was chosen. From the whole trafficit was enough to extract two days (Tuesday, Wednesday) in order to build the dataset. The first dayis reserved for a training (only legitimate traffic) and the second day for a detection (legitimate traffic+ injected anomalies). The profile expressed by the number of flows of this 2-day traffic (before anyinjection of anomalies) is depicted in Figure 7.
Figure 7. Legitimate traffic profile by number of flows.
We can see time t on x axis (5 min fixed time window) and the number of flows on y (log scale) axis.Working day starts around 7 am. and finishes around 4 pm. The volume of the traffic expressed by thenumber of flows for both days is similar.
In the next step implementation of different scenarios of malicious network activities has beenprepared. Synthetic anomalies typical for botnet-like network behavior were generated and then injected

Entropy 2015, 17 2383
into the legitimate traffic. To produce synthetic anomaly traces a dedicated tool in Python language wasdeveloped. More details about the tool and the generation process can be found in our research [126].
5.3. Scenario 1
In this scenario a small and slow ssh brute force, port scan, ssh network scan and TCP SYN floodDDoS anomalies in different variants were generated. These anomalies do not form any realistic tracesof malware but detection and proper classification of such set of anomalies is crucial because they aretypical for network behavior of botnet-like malware. Main characteristics of generated anomalies arepresented in Table 4.
Table 4. Characteristics of anomalies.
Type/kind No. of flows Duration [s] No. of victims No. of attackers
SSH brute force (bf)1 1K 300 1 12 1K 100 1 13 2K 300 1 1
TCP SYN flood DDoS (dd)1 2K 200 1 502 2K 200 1 2503 3K 300 1 504 3K 300 1 2505 4K 400 1 506 4K 400 1 250
SSH network scan (ns)1 6K 60 6K 12 6K 300 6K 13 8K 80 8K 14 8K 400 8K 1
Port scan (ps)1 1K 50 1 12 1K 100 1 13 2K 100 1 14 2K 200 1 1
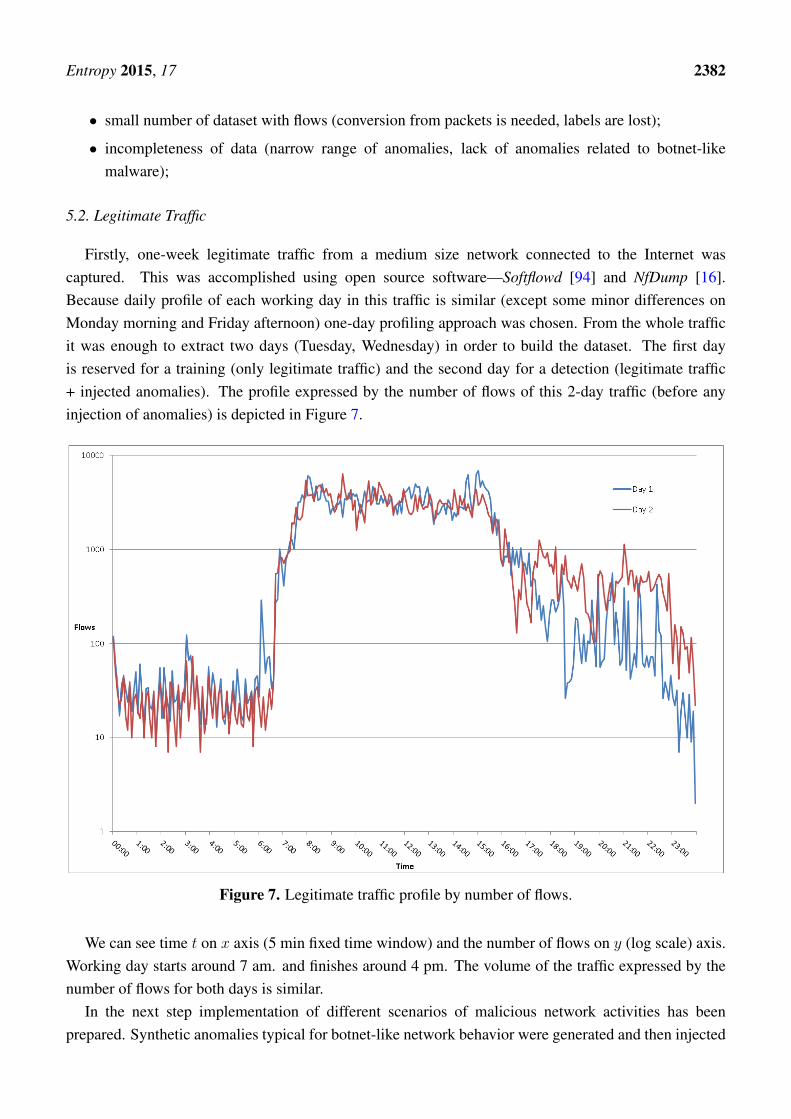
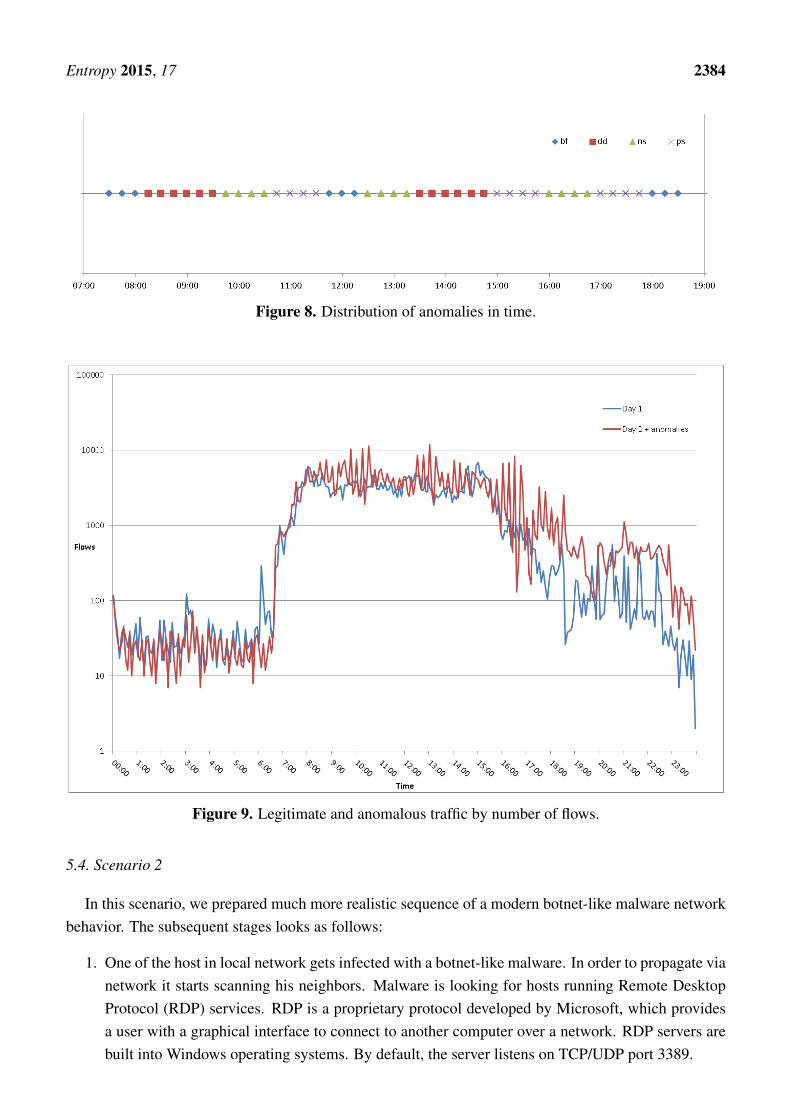
Generated anomalies were mixed with the legitimate traffic from Day2 (Wednesday) in the waypresented in Figure 8. Anomalies are not injected into the traffic from Day1 (Tuesday) as it is intendedfor the profile of a legitimate traffic. As one can see, each anomaly is injected every 15 min mainlyduring the working hours. After injection only a few anomalies are visible in the volume expressed bya number of flows as depicted in Figure 9 .
Entropy 2015, 17 2384
Figure 8. Distribution of anomalies in time.
Figure 9. Legitimate and anomalous traffic by number of flows.
5.4. Scenario 2
In this scenario, we prepared much more realistic sequence of a modern botnet-like malware networkbehavior. The subsequent stages looks as follows:
1. One of the host in local network gets infected with a botnet-like malware. In order to propagate vianetwork it starts scanning his neighbors. Malware is looking for hosts running Remote DesktopProtocol (RDP) services. RDP is a proprietary protocol developed by Microsoft, which providesa user with a graphical interface to connect to another computer over a network. RDP servers arebuilt into Windows operating systems. By default, the server listens on TCP/UDP port 3389.

Entropy 2015, 17 2385
2. Hosts serving Remote Desktop services are attacked with a dictionary attack (similarly to thetechnique found in MORTO worm [127]).
3. After successful dictionary attack vulnerable machines are infected and become a memberof botnet.
4. A peer-to-peer communication based on UDP transport protocol is established amonginfected hosts.
5. On C&C server command botnet members start a low rate Distributed Denial of Service attackcalled Slowrolis [128] on an external HTTP server. After a few min the server is blocked.
Main characteristics of generated anomalies are presented in Table 5.
Table 5. Characteristics of anomalies.
Type No. of flows Duration [s] No. of victims No. of attackers
Network scan (ns) 252 200 252 1
RDP brute force (bf) 720 550 53 1
Botnet p2p (p2p) 150 185 15 15
Slowrolis DDoS (dd) 1124 117 15 1
Anomalies generated for the scenario were mixed with the legitimate traffic from Day2 (Wednesday)in the way presented in Figure 10.
Figure 10. Distribution of anomalies in time.
One can see, the whole scenario which consists of four anomalies is injected every hour during theworking time. Anomalies in this scenario are low and slow. They represent only o small fraction of totaltraffic so after injection none of them is visible in the volume expressed by a number of flows as depictedin Figure 11.

Entropy 2015, 17 2386
Figure 11. Legitimate and anomalous traffic by number of flows.
5.5. Scenario 3
In this scenario, we prepared another realistic sequence of a modern botnet-like malware networkbehavior. The subsequent stages looks as follows:
1. One of the local host which is infected with a modern botnet malware starts scanning his neighborsin order to propagate via network. It uses similar network propagation mechanism as it is employedin Stuxnet worm [129,130]. Malware is looking for hosts with open TCP and UDP ports reservedfor Microsoft Remote Procedure Call (RPC). In Windows RPC is an interprocess communicationmechanism that enables data exchange and invocation of functionality residing in a differentprocess localy or via network. The list of ports used to initiate a connection with RPC is asfollows: UDP – 135, 137, 138, 445, TCP – 135, 139, 445, 593.
2. Hosts with an open RPC ports are attacked with a specially crafted RPC requests.
3. After successful attack, vulnerable machines are infected and become a member of botnet.
4. A direct communication to a single C&C server is established on each infected host.
5. On C&C server command botnet members start a DDoS amplification attack based on NetworkTime Protocol (NTP). This attack is targeted to an external server. Botnet members send packetswith a forged source IP address (set to this used by the victim). Because the source IP address is

Entropy 2015, 17 2387
forged the remote server replies and sends data to the victim. Moreover attack is amplified via NTP.Thus attackers send a small (234 bytes) packet "from" a forged source IP address with a commandto get a list of interacting machines and NTP server sends a large (up to 200 times bigger) replyto the victim. As a result attackers turn small amount of bandwidth coming from a few machinesinto a significant traffic load hitting the victim. More details regarding NTP amplification in DDoSattacks can be found in [131].
Main characteristics of generated anomalies are presented in Table 6.
Table 6. Characteristics of anomalies.
Type No. of flows Duration [s] No. of victims No. of attackersBlock scan (bs) 1.5K 80 168 1RPC attack (rpc) 650 200 90 1Botnet C&C communication (c&c) 125 190 63 1NTP DDoS (dd) 2.9K 580 1 63 (spoofed to 1)
Anomalies generated for the scenario were mixed with the legitimate traffic from Day2 (Wednesday)in the way presented in Figure 12.
Figure 12. Distribution of anomalies in time.
As one can see, the whole scenario which consists of four anomalies is injected every hour duringa working time. Similarly to Scenario 2 anomalies in this scenario are low and slow and they representonly a small fraction of total traffic. After injection none of them is visible in the volume expressed bya number of flows as depicted in Figure 13.

Entropy 2015, 17 2388
Figure 13. Legitimate and anomalous traffic by number of flows.
6. Verification of the Approach
This section presents verification of the proposed method. The aim of verification is to check if theproposed method is able to detect network anomalies and categorize them. Firstly, results of correlationtests performed in order to find the proper set of α-values and network features are presented. Next,the performance of the Tsallis, Renyi, Shannon and volume-based version of the method is evaluated.Finally conclusions are given.
6.1. Correlation
Firstly, correlation tests for various α-values and for various feature distributions were performed.This is important as strong correlation suggests that some results are closely related to each other andthus it may be sufficient to restrict the scope scope of α-values and network features without impairingvalidity of the method.
In the experiments Pearson and Spearman [132] correlation coefficients were used. For a sample ofdiscrete random variables X, Y the formula for Pearson coefficient is defined as:
rX,Y =
n∑i=1
(Xi − X)(Yi − Y )
sxsywhere X = 1
n
n∑i=1
Xi and sx =
√1
n−1
n∑i=1
(Xi − X)2 (17)

Entropy 2015, 17 2389
The formula for Spearman coefficient for a sample of discrete random variables X, Y is defined as:
rX,Y = corr(RX,RY ) (18)
where corr—Pearson correlation coefficient for a sample, RX—ranks of X, RY—ranks of Y.The results of correlation between entropy timeseries for different α-values are presented in Table 7.
This table shows the pairwise Tsallis α correlation scores from range 〈−1..1〉 where scopes |1− 0.9|,|0.9− 0.7|, |0.7− 0.5|, |0.5− 0| denote, respectively, strong, medium, weak, and no correlation. Thesign determines if the correlation is positive (no sign) or negative (-). The presented values (see Table 7)are an average from 15 different feature distributions scores. Only results based on Tsallis entropy arepresented as these obtained for the Renyi entropy were similar.
Table 7. Results of linear and rank correlation of α.
α = −3 α = −2 α = −1 α = 0 α = 1 α = 2 α = 3
Pear
son
α = −3 1 0.99 0.96 0.66 0.12 −0.06 −0.09
α = −2 - 1 0.98 0.69 0.13 −0.06 −0.09
α = −1 - - 1 0.75 0.16 −0.05 −0.08
α = 0 - - - 1 0.44 0.18 0.12α = 2 - - - - - 1 0.97α = 3 - - - - - - 1
Spea
rman
α = −3 1 0.97 0.837 0.46 0.06 −0.09 −0.11
α = −2 - 1 0.94 0.57 0.1 −0.07 −0.1
α = −1 - - 1 0.72 0.15 −0.06 −0.09
α = 0 - - - 1 0.49 0.2 0.15α = 2 - - - - - 1 0.9α = 3 - - - - - - 1
It should be noticed, that there is a strong positive linear (Pearson) and rank (Spearman) correlation fornegative α-values and strong positive correlation between α-values which are higher than 1. For α = 0there is some small positive correlation with negative values. For α = 1 (Shannon) there is a mediumcorrelation with α = 2 and α = 3. These results suggest that it is sufficient to use α-values from range〈−2..2〉 to obtain different and distinctive sensitivity levels of entropy.
Results of pairwise correlation between Tsallis entropy timeseries of different feature distributionsare presented in Table 8 and Table 9. The results obtained for the Renyi entropy are not presented as theyclosely reasemble these obtained for Tsallis.
The results for one positive and one negative value of α are presented because they differ significantly.Averaging (based on results from the whole range of α-values) would hide an essential property. It isnoticeable that there is a strong positive correlation of addresses and ports for negative values of α butno correlation for positive α-values.

Entropy 2015, 17 2390
Table 8. Results of correlation of features for α = −3.
Pearson src ip dst ip src port dst port in-degree out-degreesrc ip 1 0.89 0.89 0.91 0.37 0.35dst ip - 1 0.98 0.89 0.27 0.55
src port - - 1 0.86 0.15 0.5dst port - - - 1 0.41 0.53
ind-egree - - - - 1 0.27out-degree - - - - - 1Spearman src ip dst ip src port dst port in-degree out-degree
src ip 1 0.9 0.85 0.87 0.47 0.69dst ip - 1 0.96 0.89 0.43 0.83
src port - - 1 0.83 0.3 0.69dst port - - - 1 0.53 0.12
in-degree - - - - 1 0.48out-degree - - - - - 1
Table 9. Results of correlation of features for α = 3.
Pearson src ip dst ip src port dst port in-degree out-degreesrc ip 1 −0.07 −0.34 −0.02 −0.07 0.44dst ip - 1 −0.29 0.05 0.08 −0.28
src port - - 1 −0.42 0.59 −0.04
dst port - - - 1 −0.39 0.01in-degree - - - - 1 0.03
out-degree - - - - - 1Spearman src ip dst ip src port dst port in-degree out-degree
src ip 1 0.03 −0.21 0.07 0.21 0.37dst ip - 1 −0.31 0.07 0.08 −0.35
src port - - 1 −0.55 0.64 0.23dst port - - - 1 0.52 0.76
in-degree - - - - 1 0.18out-degree - - - - - 1
6.2. Performance Evaluation
Experiments were performed for Tsallis, Renyi and Shannon version of our method as well astraditional volume-based approach with flow, packet and byte counters. Final evaluation was performedwith Weka [99]. Experiments were performed with the dataset presented in Section 5. Exemplary resultsof entropies for a selected feature distributions are presented below. Abnormally high dispersion indestination addresses distribution for network scan anomalies exposed by negative value of α parametersis depicted in Figure 14. One can see time t on x axis (5-minute time windows), result r on y axis and

Entropy 2015, 17 2391
α-values on z axis. The r value corresponds to normalization applied in our method (Equation (16)).Values of r outside (0..1) threshold are considered as anomalous. Anomalies are marked with (A) onthe time axis. Values of Shannon entropy are denoted as S. Abnormal concentration of flows durationfor network scans is depicted in Figure 15. This concentration is typical for anomalies with a fixeddata stream, i.e., anomalies where all flows have similar size. Figure 16 shows ambiguous detection (nosignificant excess of 0−1 threshold) of port scan anomaly with volume-based approach using flow, packetand byte counters. While experimenting, we noticed that measurements for all feature distributions asa group work better than single ones or subsets. In our experiments, addresses, ports and duration featuredistributions turned out to be the most deterministic, although we believe that the proper set of networkfeatures is specific for particular anomalies.
Figure 14. Abnormally high dispersion in destination addresses for network scan anomalies(Renyi/Shannon).
Figure 15. Abnormally high concentration in flows duration for network scan anomalies(Tsallis/Shannon).

Entropy 2015, 17 2392
Figure 16. Ambiguous detection of port scan anomaly with a volume-based approach.
Overall (whole data set, all feature distributions) multi-class classification was performed with Weka.We defined n classes – one for each anomaly type and one class for the legitimate traffic. In orderto properly evaluate predictive performance 10-fold cross-validation method was used [99]. From theperformance point of view, every classification attempt can produce one of four outcomes presented inFigure 17
True PositiveTP
p′
p
False NegativeFN
n
P′
False PositiveFP
n′
P
True NegativeTN
N′
N
actu
al
predicted
Figure 17. Possible results of classification.
An ideal classifier should not produce False Positive (FP) and False Negative (FN) statisticalerrors. To evaluate non-ideal classifiers, one could measure proportion of correct assessments to allassessments—Accuracy (ACC), the share of benign activities reported as anomalous—False PositiveRate (FPR) and the share of anomalies missed by the detector—False Negative Rate (FNR). Usage ofPrecision (proportion of correctly reported anomalies) and Recall (share of correctly reported anomaliescompared to the total number of anomalies) is another option. Based on these measures some tools likeReceiver Operating Characteristics (ROC) and Precision vs Recall (PR) are typically used [133,134].

Entropy 2015, 17 2393
Formulas for mentioned metrics as well as some additional measures which can be also used to evaluatethe performance of classifier are presented in Table 10.
Table 10. Metrics used to evaluate performance of classification.
Name Formula
True Positive Rate (TPR) eqv. with Recall, Sensitivity TPR = TPTP+FN
True Negative Rate (TNR) eqv. with Specificity TNR = TNFP+TN
Positive Predictive Value (PPV) eqv. with Precision PPV = TPTP+FP
Negative Predictive Value (NPV) NPV = TNTN+FN
False Positive Rate (FPR) eqv. with Fall-out FPR = FPFP+TN = 1 − TNR
False Discovery Rate (FDR) FDR = FPFP+TP = 1 − PPV
False Negative Rate (FNR) FNR = FNFN+TP
Accuracy (ACC) ACC = TP+TNTP+FN+FP+TN
F1 score – harmonic mean of Precision and Recall F1 = 2TP2TP+FP+FN
In our approach we deal with multi-classification problem where more than two classes are utilized,instead of single binary classification (or detection) where only two classes, e.g., anomalous and notanomalous are used. We classify instances to be into one of many classes like port scan, network scan,brute force, etc. We use classifiers from Weka which transform internally multi-class problem intomultiple binary class one. One of the possible way to handle it is One-vs-All classification [135]. Theidea behind this method is:
• Take n binary classifiers (one for each class);
• For the ith classifier, let the positive examples be all the points in class i, and let the negativeexamples be all the points not in class i;
• Let fi be the ith classifier; Classify with the following rule:
f(x) = arg maxifi(x) (19)
Averaged Accuracy and avaraged FPR results based on Scenario 1 are presented in the Table 11.
Table 11. Averaged performance of classification—Scenario 1.
ZeroR Bayes Network Decision Tree J48 Random Forest Simple Logistic
Acc
urac
y Tsallis 0.66 0.89 0.90 0.93 0.93Renyi 0.66 0.88 0.89 0.90 0.93Shannon 0.66 0.84 0.86 0.90 0.92volume-based 0.66 0.72 0.77 0.76 0.80
FPR
Tsallis 0.66 0.07 0.08 0.07 0.06Renyi 0.66 0.08 0.09 0.11 0.09Shannon 0.66 0.08 0.11 0.12 0.08volume-based 0.66 0.21 0.15 0.22 0.20

Entropy 2015, 17 2394
As one can see the results for several popular classifiers are presented. ZeroR is a trivial classifierwhich classifies the whole traffic as not anomalous. We included it here as a reference to other results asit is expected that other classifiers should perform better. Using weighted Accuracy and weighted FPR isthe most popular way to measure the performance of multi-class classification but we also propose ownmeasurement tool, namely weighted ROC curves which are presented later in this section. Evaluationresults based on Scenario 2 and Scenario 3 are presented in the Table 12 and Table 13 respectively.
Table 12. Averaged performance of classification—Scenario 2.
ZeroR Bayes Network Decision Tree J48 Random Forest Simple Logistic
Acc
urac
y Tsallis 0.68 0.82 0.84 0.85 0.91Renyi 0.68 0.83 0.88 0.89 0.92Shannon 0.68 0.77 0.8 0.84 0.89volume-based 0.68 0.68 0.73 0.78 0.80
FPR
Tsallis 0.68 0.22 0.14 0.27 0.11Renyi 0.68 0.15 0.12 0.2 0.11Shannon 0.68 0.29 0.21 0.28 0.15volume-based 0.68 0.68 0.2 0.15 0.28
Table 13. Averaged performance of classification—Scenario 3.
ZeroR Bayes Network Decision Tree J48 Random Forest Simple Logistic
Acc
urac
y Tsallis 0.68 0.83 0.83 0.87 0.93Renyi 0.68 0.83 0.83 0.85 0.94Shannon 0.68 0.76 0.8 0.85 0.90volume-based 0.68 0.68 0.62 0.65 0.66
FPR
Tsallis 0.68 0.13 0.17 0.22 0.1Renyi 0.68 0.13 0.16 0.22 0.06Shannon 0.68 0.23 0.16 0.22 0.13volume-based 0.68 0.68 0.57 0.45 0.67
It is noticable that the best performance in each scenario was obtained by applying Simple Logistic.In Weka, SimpleLogistic is a classifier for building linear logistic regression models [136]. Logisticregression comes from the fact that linear regression [137] can also be used to perform classificationproblem. The idea of logistic regression is to make linear regression produce probabilities, thus insteadof class prediction, there is a prediction of class probabilities. More details on SimpleLogistic can befound in [136,138]. If we look at the detailed results of SimpleLogistic (Renyi entropy case) for allscenarios Table 14 one can see that different classes are characterized by rather different performance ofrecognition. For example, models for network scan and not anomalous are very strong, whereas this forp2p is much weaker.
As was mentioned before ROC plots can be also used to evaluate a performance of a classifier. Itpresents more detailed characteristic of a classifier than ACC. The ROC curve is obtained for a classifierby plotting TPR an x-axis and FPR on y-axis. The Area Under a Curve (UAC) is a scalar measurementmethod connected with a ROC. While evaluating the classifier, the ROC plot considers all possible

Entropy 2015, 17 2395
operating points (thresholds) in the classifier’s prediction in order to identify the operating point at whichthe best performance is achieved. A ROC curve does nor directly present the optimal value instead itshows a tradeoff between TPR and FPR. Depending on the goals one can change the optimal operatingpoint in order to limit FPR or to increase TPR. An examplary ROC for perfect (a), partially overlaped(b) and random (c) classifier is presented in Figure 18.
Table 14. Detailed performance of SimpleLogistic classifier (Renyi entropy case).
TPR/FPR
Scenario1 Scenario2 Scenario3
brute force 0.78/0 1/0.01 −network scan 0.92/0.02 0.9/0 −port scan 0.92/0.01 − −block scan − − 0.9/0.01
DDoS 0.67/0.01 0.9/0 0.9/0.01
p2p − 0.3/0.02 −c&c − − 0.9/0.01
RPC exploitation − − 0.7/0.01
not anomalous 0.98/0.13 0.97/0.16 0.97/0.08
Figure 18. Examplary Receiver Operating Characteristics (ROC) curves.
ROC is only applicable to the binary classification case. As in our approach more than two classesare considered we can analyze an individual ROC curves for each of the classes separately as presentedin Figure 19. Based on such analysis we can find what is a performance of particular classifier foreach class. This may be useful to find the best classifier for a specific anomaly but this is out of thescope of this article. In this work we are looking at classifiers which are (on average) the best for allclasses. This is typically measured by weighted ACC and weighted FPR, however these measures hidesome important characteristics. Thus, we propose a method of calculating a multi-class ROC based on

Entropy 2015, 17 2396
weighted results of binary ROC for each individual class. In Weka there is a feature to generate and savein files an individual ROC curves for each of the classes of multi-class classifier separately. Weka ROCfile consists of operating points (threshold values) and confusion matrices containing relevant TP, FN,TN, FP values for binary classification of particular class. Our approach is to take ROC files generated byWeka (one file for each class in the dataset) and perform processing in order to average the results. Theidea is to average the corresponding ROC for each class with respect to the number of class instances.As a result we received one weighted ROC based on all binary ROC results.
(a) brute force (b) network scan
(c) ddos (d) port scan
(e) not anomalous
Figure 19. ROC curves for SimpleLogistic classifier (Renyi) based on Scenario 1.

Entropy 2015, 17 2397
Weighted ROC curves for SimpleLogistic classifier for all scenarios are depicted in Figure 20, inFigure 21 and in Figure 22 respectively. It is noticeable that these for Tsallis and Renyi entropy arebetter than this for Shannon. ROC curves for volume-based shows that classifier based on this approachis really poor.
(a) Tsallis (b) Renyi
(c) Shannon (d) volume-based
Figure 20. Weighted ROC curves for SimpleLogistic classifier—Scenario 1.
(a) Tsallis (b) Renyi
(c) Shannon (d) volume-based
Figure 21. Weighted ROC curves for SimpleLogistic classifier—Scenario 2.

Entropy 2015, 17 2398
(a) Tsallis (b) Renyi
(c) Shannon (d) volume-based
Figure 22. Weighted ROC curves for SimpleLogistic classifier—Scenario 3.
7. Summary
7.1. Conclusions
General conslusions for our studies is that it is possible to detect modern botnet-like malware basedon anomalous patterns in network with entropy-based approach. Concluding particular results of ourstudies, we can observe that, based on our experiments:
• Tsallis and Renyi entropy performed best;
• Shannon entropy turned out to be worse both in Accuracy and False Positive Rate as well asweighted ROC curves;
• the volume-based approach performed poorly;
• using a broad spectrum of network traffic feature is essential to successfully detect and classifydifferent types of anomalies; this was proved both by results of features correlation and goodresults of classification of different anomalies in tested scenarios;
• using α-values from a set {−2,−1, 0, 1, 2} is a proper choice; it was proved by results of α-valuescorrelation and good results of classification of different anomalies in tested scenarios; usinga bigger set of α values is redundant; using one α-value is not enough to recognize differenttypes of anomalies;
• the most suitable classifier (among popular classifiers employed in Weka) to our approach is theSimpleLogistic which relay on linear regression.

Entropy 2015, 17 2399
While we admit that our experiments were limited to few number of cases, we also believe thatthese cases were representative. Our dataset contains traces of network malicious activities which aretypical for botnet-like malware propagation, communication and attacks performed by such a malware.Although, only one day legitimate traffic profile was built in our experiments, we have observed thatthis profile suits to each regular working day in the network we monitored so there was no need toprepare whole week profile. The weak performance of the Shannon entropy and poor performance ofvolume-based counters allows to question whether they are the right approach to detection of anomaliescaused by botnet-like malware.
7.2. Further Work
Multiclass classification usually means classifying a data point into only one of the many (more thantwo) classes possible. It is much more advanced and sophisticated the simple detection where only twoclasses, e.g., anomalous and not anomalous, exist. However multiclass approach does not solve theproblem when more than one class should be assign to one instance. For example instance may belongto port scan and brute force classes simultaneously because both anomalies appeared in the same time.With multi-label classification [139,140] one can classify a data point into more than one of the possibleclasses. In this work we do not cover multi-label problem, however this is one of the directions fora further work.
Acknowledgments
This work has been partially supported by the Polish National Centre for Research and Developmentproject no. PBS1/A3/14/2012 “Sensor Data Correlation Module for Attack Detection and DecisionSupport” and by the European Regional Development Fund the Innovative Economy OperationalProgramme, under the INSIGMA project no. 01.01.02-00-062/09 and under the project “Cyber SecurityLaboratory” no. 02.03.00-14-106/13.
Author Contributions
All authors have contributed to the study and preparation of the article. They have read and approvedthe final manuscript.
Conflicts of Interest
The authors declare no conflict of interest.
References
1. Denning, D.E. An intrusion-detection model. IEEE Trans. Softw. Eng. 1987, 13, 222–232.2. Li, Z.; Das, A.; Zhou, J. USAID: Unifying Signature-Based and Anomaly-Based Intrusion
Detection. In Advances in Knowledge Discovery and Data Mining; Ho, T., Cheung, D., Liu, H.,Eds.; Volume 3518, Lecture Notes in Computer Science; Springer: Berlin/Heidelberg, Germany,2005; pp. 702–712.

Entropy 2015, 17 2400
3. Cheng, T.H.; Lin, Y.D.; Lai, Y.C.; Lin, P.C. Evasion Techniques: Sneaking through YourIntrusion Detection/Prevention Systems. IEEE Commun. Surv. Tutor. 2012, 14, 1011–1020.
4. Jasiul, B.; Sliwa, J.; Gleba, K.; Szpyrka, M. Identification of malware activities with rules. InProceedings of the 2014 Federated Conference on Computer Science and Information Systems(FedCSIS), Warsaw, Poland, 7–10 September 2014; Ganzha, M., Maciaszek, L., Paprzycki, M.,Eds.; pp. 101–110.
5. Gascon, H.; Orfila, A.; Blasco, J. Analysis of update delays in signature-based network intrusiondetection systems. Comput. Secur. 2011, 30, 613–624.
6. Eimann, R. Network Event Detection with Entropy Measures. Ph.D. Thesis, University ofAuckland, Auckland, New Zealand, 2008.
7. Wagner, A.; Plattner, B. Entropy Based Worm and Anomaly Detection in Fast IP Networks. InProceedings of the 14th IEEE International Workshops on Enabling Technologies: Infrastructurefor Collaborative Enterprise (WETICE’05), Linköping University, Linköping, Sweden, 13–15June 2005; pp. 172–177.
8. Nychis, G.; Sekar, V.; Andersen, D.G.; Kim, H.; Zhang, H. An Empirical Evaluation ofEntropy-based Traffic Anomaly Detection. In Proceedings of the 8th ACM SIGCOMMConference on Internet Measurement (IMC ’08), Vouliagmeni, Greece, 20–22 October 2008 ;pp. 151–156.
9. Tellenbach, B. Detection, Classification and Visualization of Anomalies using GeneralizedEntropy Metrics. Ph.D. Thesis, ETH, Zürich, Switzerland, 2012; Ph.D. Dissertation Nr. 20929.
10. Xiang, Y.; Li, K.; Zhou, W. Low-Rate DDoS Attacks Detection and Traceback by Using NewInformation Metrics. IEEE Trans. Inf. Forensics Secur. 2011, 6, 426–437.
11. Kopylova, Y.; Buell, D.A.; Huang, C.T.; Janies, J. Mutual information applied to anomalydetection. J. Commun. Netw. 2008, 10, 89–97.
12. HP—The Bot Threat. Available online: http://www.bitpipe.com/detail/RES/1384218191_706.html (accessed on 16 April 2015).
13. Sophos—Security Threat Report 2014 Smarter, Shadier, Stealthier Malware. Availableonline: https://cccure.training/m/articles/view/Sophos-Security-Threat-Report-2014 (accessedon 16 April 2015).
14. Scanlon, M.; Kechadi, M.T. The Case for a Collaborative Universal Peer-to-Peer BotnetInvestigation Framework. In Proceedings of the 9th International Conference on Cyber Warfareand Security (ICCWS 2014), Purdue University, West Lafayette, IN, USA, 24–25 March 2014;pp. 287–293.
15. Tellenbach, B.; Burkhart, M.; Sornette, D.; Maillart, T. Beyond Shannon: CharacterizingInternet Traffic with Generalized Entropy Metrics. In Proceedings of the 10th InternationalConference on Passive and Active Network Measurement (PAM’09), Seoul, Korea, 1–3 April2009; pp. 239–248.
16. NfSen—Netflow Sensor. Available online: http://nfsen.sourceforge.net (accessed on 16 April2015).

Entropy 2015, 17 2401
17. Barford, P.; Kline, J.; Plonka, D.; Ron, A. A Signal Analysis of Network Traffic Anomalies.In Proceedings of the 2nd ACM SIGCOMM Workshop on Internet Measurement (IMW ’02),Marseille, France, 6–8 November 2002; pp. 71–82.
18. Kim, M.S.; Kong, H.J.; Hong, S.C.; Chung, S.H.; Hong, J. A flow-based method for abnormalnetwork traffic detection. Presented at IEEE/IFIP Network Operations and ManagementSymposium (NOMS 2004), Seoul, Korea, 19–23 April 2004; pp. 599–612.
19. NtopNg—High-Speed Web-based Traffic Analysis and Flow Collection. Available online:http://www.ntop.org (accessed on 16 April 2015).
20. Witten, I.H.; Frank, E.; Hall, M.A. Data Mining: Practical Machine Learning Tools andTechniques, 3rd ed.; Morgan Kaufmann Publishers Inc.: San Francisco, CA, USA, 2011.
21. Bhattacharyya, D.K.; Kalita, J.K. Network Anomaly Detection: A Machine Learning Perspective;Chapman & Hall/CRC: Boca Raton, FL, USA, 2013.
22. Aggarwal, C. Outlier Analysis; Springer: New York, NY, USA, 2013.23. Hastie, T.; Tibshirani, R.; Friedman, J. The Elements of Statistical Learning: Data Mining,
Inference and Prediction, 2 ed.; Springer: New York, NY, USA, 2009.24. Chandola, V.; Banerjee, A.; Kumar, V. Anomaly Detection: A Survey. ACM Comput. Surv.
2009, 41, 15:1–15:58.25. Hodge, V.; Austin, J. A Survey of Outlier Detection Methodologies. Artif. Intell. Rev. 2004,
22, 85–126.26. Estevez-Tapiador, J.M.; Garcia-Teodoro, P.; Diaz-Verdejo, J.E. Anomaly Detection Methods in
Wired Networks: A Survey and Taxonomy. Comput. Commun. 2004, 27, 1569–1584.27. Patcha, A.; Park, J.M. An Overview of Anomaly Detection Techniques: Existing Solutions and
Latest Technological Trends. Comput. Netw. 2007, 51, 3448–3470.28. Callegari, C. Statistical approaches for network anomaly detection. In Proceedings of the 4th
International Conference on Internet Monitoring and Protection (ICIMP), Venice/Mestre, Italy,24–28 May 2009.
29. Callado, A.; Kamienski, C.; Szabo, G.; Gero, B.; Kelner, J.; Fernandes, S.; Sadok, D. A Surveyon Internet Traffic Identification. IEEE Commun. Surv. Tutor. 2009, 11, 37–52.
30. Garcia-Teodoro, P.; Diaz-Verdejo, J.; Macia-Fernandez, G.; Vazquez, E. Anomaly-based networkintrusion detection: Techniques, systems and challenges. Comput. Secur. 2009, 28, 18–28.
31. Bhuyan, M.; Bhattacharyya, D.; Kalita, J. Network anomaly detection: methods, systems andtools. IEEE Commun. Surv. Tutor. 2013, 16, 1–34.
32. Sperotto, A.; Schaffrath, G.; Sadre, R.; Morariu, C.; Pras, A.; Stiller, B. An Overview of IPFlow-Based Intrusion Detection. IEEE Commun. Surv. Tutor. 2010, 12, 343–356.
33. Huang, L.; Nguyen, X.; Garofalakis, M.; Jordan, M.; Joseph, A.D.; Taft, N. In-Network PCAand Anomaly Detection; Technical Report UCB/EECS-2007-10; EECS Department, Universityof California: Berkeley, CA, USA, 2007.

Entropy 2015, 17 2402
34. Shyu, M.-L.; Chen, S.-C.; Sarinnapakorn, K.; Chang, L. A novel anomaly detectionscheme based on principal component classifier. In Proceedings of IEEE Foundations andNew Directions of Data Mining Workshop, in conjunction with the Third IEEE InternationalConference on Data Mining (ICDM’03), Melbourne, FL, USA, 19–22 November 2003;pp. 171–179.
35. Lee, Y.J.; Yeh, Y.R.; Wang, Y.C.F. Anomaly Detection via Online Oversampling PrincipalComponent Analysis. IEEE Trans. Knowl. Data Eng. 2013, 25, 1460–1470.
36. Lu, W.; Ghorbani, A.A. Network Anomaly Detection Based on Wavelet Analysis. EURASIP J.Adv. Sig. Proc. 2009, 2009, doi:10.1155/2009/837601.
37. Lu, W.; Tavallaee, M.; Ghorbani, A.A. Detecting Network Anomalies Using Different WaveletBasis Functions. In Proceedings of Sixth Annual Conference on Communication Networks andServices Research (CNSR 2008), Halifax, Nova Scotia, Canada, 5–8 May 2008; pp. 149–156.
38. Limthong, K.; Watanapongse, P.; Kensuke, F. A wavelet-based anomaly detection foroutbound network traffic. Presented at 8th Asia-Pacific Symposium on Information andTelecommunication Technologies (APSITT), Kuching, Sarawak, Malaysia, 15–18 June 2010;pp. 1–6.
39. Ye, N.; Zhang, Y.; Borror, C.M. Robustness of the Markov-chain model for cyber-attackdetection. IEEE Trans. Reliab. 2004, 53, 116–123.
40. Sha, W.; Zhu, Y.; Huang, T.; Qiu, M.; Zhu, Y.; Zhang, Q. A Multi-order Markov Chain BasedScheme for Anomaly Detection. In Proceedings of IEEE 37th Annual Computer Softwareand Applications Conference, COMPSAC Workshops 2013, Kyoto, Japan, 22–26 July 2013;pp. 83–88.
41. Syarif, I.; Prugel-Bennett, A.; Wills, G. Unsupervised Clustering Approach for NetworkAnomaly Detection. In Networked Digital Technologies; Volume 293, Communications inComputer and Information Science; Springer: Berlin/Heidelberg, Germany, 2012; pp. 135–145.
42. Riad, A.; Elhenawy, I.; Hassan, A.; Awadallah, N. Visualize Network Anomaly DetectionBy Using K-Means Clustering Algorithm. Int. J. Comput. Netw. Commun. 2013, 5,doi:10.5121/ijcnc.2013.5514.
43. Bazan, J.; Szpyrka, M.; Szczur, A.; Dydo, L.; Wojtowicz, H. Classifiers for Behavioral PatternsIdentification Induced from Huge Temporal Data. Fundam. Inform. 2015, in press.
44. Kind, A.; Stoecklin, M.P.; Dimitropoulos, X. Histogram-based Traffic Anomaly Detection. IEEETrans. Netw. Serv. Manag. 2009, 6, 110–121.
45. Soule, A.; Salamatia, K.; Taft, N.; Emilion, R.; Papagiannaki, K. Flow Classification byHistograms: Or How to Go on Safari in the Internet. In Proceedings of the Joint InternationalConference on Measurement and Modeling of Computer Systems (SIGMETRICS-Performance2004), Columbia University, New York, NY, USA, 12–16 June 2004; pp. 49–60.
46. Stoecklin, M.P.; Le Boudec, J.Y.; Kind, A. A Two-layered Anomaly Detection Technique Basedon Multi-modal Flow Behavior Models. In Proceedings of the 9th International Conference onPassive and Active Network Measurement (PAM’08), Cleveland, OH, USA, 29–30 April 2008;pp. 212–221.

Entropy 2015, 17 2403
47. Brauckhoff, D.; Dimitropoulos, X.; Wagner, A.; Salamatian, K. Anomaly Extraction in BackboneNetworks Using Association Rules. In Proceedings of the 9th ACM SIGCOMM Conferenceon Internet Measurement Conference (IMC ’09), Chicago, IL, USA, 4–6 November 2009;pp. 28–34.
48. Iglesias, F.; Zseby, T. Entropy-Based Characterization of Internet Background Radiation.Entropy 2014, 17, 74–101.
49. Harrington, D.; Presuhn, R.; Wijnen, B. An Architecture for Describing Simple NetworkManagement Protocol (SNMP) Management Frameworks. Available online: http://www.ietf.org/rfc/rfc3411.txt (accessed on 16 April 2015).
50. Claise, B. Cisco Systems NetFlow Services Export Version 9. Available online: http://tools.ietf.org/html/rfc3954 (accessed on 16 April 2015).
51. Kambourakis, G.; Kolias, C.; Gritzalis, S.; Park, J.H. DoS attacks exploiting signaling in{UMTS} and {IMS}. Comput. Commun. 2011, 34, 226 – 235.
52. Choi, K.; Chen, X.; Li, S.; Kim, M.; Chae, K.; Na, J. Intrusion Detection of NSM Based DoSAttacks Using Data Mining in Smart Grid. Energies 2012, 5, 4091–4109.
53. Liu, Y.; Xiong, N.; Park, J.; Yang, C.; Xu, K. Fair incentive mechanism with pyramidal structurefor peer-to-peer networks. IET Commun. 2010, 4, 1–12.
54. Lee, D.C.; Park, B.; Kim, K.E.; Lee, J.J. Fast Traffic Anomalies Detection UsingSNMP MIB Correlation Analysis. In Proceedings of the 11th International Conference onAdvanced Communication Technology (ICACT’09), Phoenix Park, Korea, 15–18 February 2009;Volume 1, pp. 166–170.
55. Casas, P.; Fillatre, L.; Vaton, S.; Nikiforov, I. Volume Anomaly Detection in Data Networks:An Optimal Detection Algorithm vs. the PCA Approach. In Traffic Management and TrafficEngineering for the Future Internet; Valadas, R., Salvador, P., Eds.; Volume 5464, Lecture Notesin Computer Science; Springer: Berlin/Heidelberg, Germany, 2009; pp. 96–113.
56. Plixer Scrutinizer—Incydent Response System. Available online: http://www.plixer.com(accessed on 16 April 2015).
57. Peassler PRTG—Network Monitor. Available online: http://www.paessler.com (accessed on 16April 2015).
58. Solarwinds Network Traffic Analyzer. Available online: http://www.solarwinds.com (accessedon 16 April 2015).
59. Invea-Tech FlowMon. Available online: https://www.invea.com (accessed on 16 April 2015).60. AKMA Labs FlowMatrix. Available online: http://www.akmalabs.com (accessed on 16 April
2015).61. Jingle, I.; Rajsingh, E. ColShield: An effective and collaborative protection shield for the
detection and prevention of collaborative flooding of DDoS attacks in wireless mesh networks.Human-centric Comput. Inf. Sci. 2014, 4, doi: 10.1186/s13673-014-0008-8.
62. Zhou, W.; Jia, W.; Wen, S.; Xiang, Y.; Zhou, W. Detection and defense of application-layer{DDoS} attacks in backbone web traffic. Future Gener. Comput. Syst. 2014, 38, 36–46.

Entropy 2015, 17 2404
63. Brauckhoff, D.; Tellenbach, B.; Wagner, A.; May, M.; Lakhina, A. Impact of Packet Sampling onAnomaly Detection Metrics. In Proceedings of the 6th ACM SIGCOMM Conference on InternetMeasurement (IMC ’06), Rio de Janeiro, Brazil, 25–27 October 2006; pp. 159–164.
64. Lakhina, A.; Crovella, M.; Diot, C. Mining Anomalies Using Traffic Feature Distributions. InProceedings of the 2005 Conference on Applications, Technologies, Architectures, and Protocolsfor Computer Communications (SIGCOMM’05), Philadelphia, PA, USA, 22–26 August 2005;pp. 217–228.
65. Shannon, C. A Mathematical Theory of Communication. Bell Syst. Tech. J. 1948, 27, 379–423.66. Baez, J.C.; Fritz, T.; Leinster, T. A Characterization of Entropy in Terms of Information Loss.
Entropy 2011, 13, 1945–1957.67. Lee, W.; Xiang, D. Information-theoretic measures for anomaly detection. In Proceedings
of 2001 IEEE Symposium on Security and Privacy, Oakland, CA, USA, 14–16 May 2001; pp.130–143.
68. Grünwald, P.; Vitányi, P. Kolmogorov Complexity and Information Theory. With anInterpretation in Terms of Questions and Answers. J. Logic Lang. Inf. 2003, 12, 497–529.
69. Teixeira, A.; Matos, A.; Souto, A.; Antunes, L. Entropy Measures vs. Kolmogorov Complexity.Entropy 2011, 13, 595–611.
70. Ranjan, S.; Shah, S.; Nucci, A.; Munafo, M.; Cruz, R.; Muthukrishnan, S. DoWitcher: EffectiveWorm Detection and Containment in the Internet Core. In Proceedings of 26th IEEE InternationalConference on Computer Communications (INFOCOM 2007), Anchorage, AL, USA, 6-12 May2007; pp. 2541–2545.
71. Gu, Y.; McCallum, A.; Towsley, D. Detecting Anomalies in Network Traffic Using MaximumEntropy Estimation. In Proceedings of the 5th ACM SIGCOMM Conference on InternetMeasurement (IMC ’05), Berkeley, CA, USA, 19–21 October 2005; pp. 32–32.
72. Speidel, U.; Eimann, R.; Brownlee, N. Detecting network events via T-entropy. In Proceedingsof 6th International Conference on Information, Communications Signal Processing, Singapore,Singapore, 10–13 December 2007 , 2007; pp. 1–5.
73. Eimann, R.; Speidel, U.; Brownlee, J. A T-entropy Analysis of the Slammer Worm Outbreak. InProceedings of Asia-Pacific Network Operations and Management Symposium, Okinawa, Japan,27–30 September 2005; pp. 434–445.
74. Titchener, M.R.; Nicolescu, R.; Staiger, L.; Gulliver, T.A.; Speidel, U. Deterministic Complexityand Entropy. Fundam. Inform. 2005, 64, 443–461.
75. Pawelec, J.; Berezinski, P.; Piotrowski, R.; Chamela, W. Entropy Measures For Internet TrafficAnomaly Detection. In Proceedings of 16th International Conference on Computer SystemsAided Science, Industry and Transport (TransComp), hlcity, country, date 2012; pp. 309–318.
76. Tsallis, C. Possible generalization of Boltzmann-Gibbs statistics. J. Stat. Phys. 1988,52, 479–487.
77. Tsallis, C. The Nonadditive Entropy Sq and Its Applications in Physics and Elsewhere: SomeRemarks. Entropy 2011, 13, 1765–1804.
78. Prehl, J.; Essex, C.; Hoffmann, K.H. Tsallis Relative Entropy and Anomalous Diffusion. Entropy2012, 14, 701–716.

Entropy 2015, 17 2405
79. Renyi, A. Probability Theory; Enlarged version of Wahrscheinlichkeitsrechnung,Valoszinusegszamitas and Calcul des probabilites. English translation by Laszlo Vekerdi;North-Holland: Amsterdam, The Netherlands, 1970.
80. Csiszár, I. Axiomatic Characterizations of Information Measures. Entropy 2008, 10, 261–273.81. Ziviani, A.; Gomes, A.; Monsores, M.; Rodrigues, P. Network anomaly detection using
nonextensive entropy. IEEE Commun. Lett. 2007, 11, 1034–1036.82. Shafiq, M.Z.; Khayam, S.A.; Farooq, M. Improving Accuracy of Immune-inspired Malware
Detectors by Using Intelligent Features. In Proceedings of the 10th Annual Conference onGenetic and Evolutionary Computation (GECCO ’08), Atlanta, GA, USA, 12–16 July 2008;pp. 119–126.
83. Lima, C.F.L.; de Assis, F.M.; de Souza, C.P. A Comparative Study of Use of Shannon, Rényiand Tsallis Entropy for Attribute Selecting in Network Intrusion Detection. In Proceedings ofthe 13th Intl Conf. on Intelligent Data Engineering and Automated Learning (IDEAL’12), Natal,Brazil, 29-31 August 2012; pp. 492–501.
84. Tellenbach, B.; Burkhart, M.; Schatzmann, D.; Gugelmann, D.; Sornette, D. Accurate NetworkAnomaly Classification with Generalized Entropy Metrics. Comput. Netw. 2011, 55, 3485–3502.
85. Zhang, J.; Chen, X.; Xiang, Y.; Zhou, W.; Wu, J. Robust Network Traffic Classification.IEEE/ACM Trans. Netw. 2014, PP, 1–1.
86. Clausius, R.; Hirst, T. The Mechanical Theory of Heat: With its applications to the steam-engineand to the physical properties of bodies; J. van Voorst: London, UK, 1867.
87. Karmeshu, J. Entropy Measures, Maximum Entropy Principle and Emerging Applications;Springer: New York, NY, USA, 2003.
88. Harremoes, P.; Topsoe, F. Maximum Entropy Fundamentals. Entropy 2001, 3, 191–226.89. Kullback, S. Information Theory and Statistics; Wiley: New York, NY, USA, 1959.90. Cover, T.; Thomas, J. Elements of Information Theory; Wiley: Hoboken, NJ, USA, 2006.91. Maszczyk, T.; Duch, W. Comparison of Shannon, Renyi and Tsallis Entropy Used in
Decision Trees. In Artificial Intelligence and Soft Computing—ICAISC 2008; Rutkowski, L.,Tadeusiewicz, R., Zadeh, L., Zurada, J., Eds.; Volume 5097, Lecture Notes in Computer Science;Springer: Berlin/Heidelberg, Germany, 2008; pp. 643–651.
92. Marco, M. A step beyond Tsallis and Rényi entropies. Phys. Lett. A 2005, 338, 217–224.93. Wedrowska, E. Miary entropii i dywergencji w analizie struktur; Wydawnictwo Uniwersytetu
Warminsko-Mazurskiego: Olsztyn, Poland, 2012.94. Softflowd—Flow-based Network Traffic Analyser. Available online: http://code.google.com/p/
softflowd/(accessed on 16 April 2015).95. Gigamon—SPAN Port Or TAP? White Paper. Available online: https://www.netdescribe.com/
downloads/span_port_or_tap_web.pdf (accessed on 16 April 2015).96. Trammell, B.; Wagner, A.; Claise, B. Flow Aggregation for the IP Flow Information Export
(IPFIX) Protocol. Available online: http://tools.ietf.org/html/rfc7015 (accessed on 16 April2015).
97. Reimann, C.; Filzmoser, P.; Garrett, R.G. Background and threshold: critical comparison ofmethods of determination. Sci. Total Environ. 2005, 346, 1–16.

Entropy 2015, 17 2406
98. Szpyrka, M.; Jasiul, B.; Wrona, K.; Dziedzic, F. Telecommunications Networks Risk Assessmentwith Bayesian Networks. In Computer Information Systems and Industrial Management;Saeed, K., Chaki, R., Cortesi, A., Wierzchon, S., Eds.; Volume 8104, Lecture Notes in ComputerScience; Springer: Berlin/Heidelberg, Germany, 2013; pp. 277–288.
99. Hall, M.; Frank, E.; Holmes, G.; Pfahringer, B.; Reutemann, P.; Witten, I. The WEKA DataMining Software: An Update. SIGKDD Explor. Newslett. 2009, 11, 10–18.
100. Jasiul, B.; Szpyrka, M.; Sliwa, J. Detection and Modeling of Cyber Attacks with Petri Nets.Entropy 2014, 16, 6602–6623.
101. Jasiul, B.; Szpyrka, M.; Sliwa, J. Malware Behavior Modeling with Colored Petri Nets. InComputer Information Systems and Industrial Management; Saeed, K., Snasel, V., Eds.; Volume8838, Lecture Notes in Computer Science; Springer: Berlin/Heidelberg, Germany, 2014;pp. 667–679.
102. Jasiul, B.; Szpyrka, M.; Sliwa, J. Formal Specification of Malware Models in the Form of ColoredPetri Nets. In Computer Science and its Applications; Park, J.J.J.H., Stojmenovic, I., Jeong, H.Y.,Yi, G., Eds.; Volume 330, Lecture Notes in Electrical Engineering; Springer: Berlin/Heidelberg,Germany, 2015; pp. 475–482.
103. ACM Sigcomm Internet Traffic Archive. Available online: http://www.sigcomm.org/ITA(accessed on 16 April 2015).
104. Lawrence Berkeley National Laboratory/International Computer Science Institute EnterpriseTracing. Available online: http://www.icir.org/enterprise-tracing/ (accessed on 16 April 2015).
105. SimpleWeb. Available online: http://www.simpleweb.org/wiki/Traces (accessed on 16 April2015).
106. Center for Applied Internet Data Analysis (CAIDA). Available online: http://www.caida.org/data/overview (accessed on 16 April 2015).
107. Cluster of European Projects aimed at Monitoring and Measurement (MoMe). Available online:http://www.ist-mome.org/database/MeasurementData (accessed on 16 April 2015).
108. Waikato Internet Traffic Storage (WITS). Available online: http://wand.net.nz/wits (accessed on16 April 2015).
109. UMass Trace Repository (UMass). Available online: http://traces.cs.umass.edu (accessed on 16April 2015).
110. Verizon Data Breach Investigations Report. Available online: http://www.verizonenterprise.com/DBIR/2014/(accessed on 16 April 2015).
111. Symantec Internet Security Threat Report. Available online: http://www.symantec.com/security_response/publications/threatreport.jsp (accessed on 16 April 2015).
112. CERT Poland Raport. Availableonline:http://www.cert.pl/PDF/Report_CP_2013.pdf (accessedon 16 April 2015).
113. Saad, S.; Traore, I.; Ghorbani, A.A.; Sayed, B.; Zhao, D.; Lu, W.; Felix, J.; Hakimian, P.Detecting P2P botnets through network behavior analysis and machine learning. In Proceedingsof 2011 Ninth Annual International Conference on Privacy, Security and Trust (PST), Montreal,QC, Canada, 19–21 July 2011; pp. 174–180.

Entropy 2015, 17 2407
114. García, S.; Grill, M.; Stiborek, J.; Zunino, A. An Empirical Comparison of Botnet DetectionMethods. Comput. Secur. 2014, 45, 100–123.
115. Sperotto, A.; Sadre, R.; Vliet, F.; Pras, A. A Labeled Data Set for Flow-Based IntrusionDetection. In Proceedings of the 9th IEEE International Workshop on IP Operations andManagement (IPOM ’09), Venice, Italy, 29–30 October 2009; Springer: Berlin/Heidelberg,Germany, 2009; pp. 39–50.
116. Berezinski, P.; Pawelec, J.; Małowidzki, M.; Piotrowski, R. Entropy-Based Internet TrafficAnomaly Detection: A Case Study. In Proceedings of the Ninth International Conference onDependability and Complex Systems DepCoS-RELCOMEX, Brunów, Poland, 30 June – 4 July2014; Zamojski, W., Mazurkiewicz, J., Sugier, J., Walkowiak, T., Kacprzyk, J., Eds.; Volume 286,Advances in Intelligent Systems and Computing; Springer: Cham, Switzerland, 2014; pp. 47–58.
117. Haines, J.; Lippmann, R.; Fried, D.; Zissman, M.; Tran, E.; Boswell, S. 1999DARPA Intrusion Detection Evaluation: Design and Procedures; Technical Report1062; MIT Lincoln Laboratory: Lexington, MA, USA, 2001; Available online:https://www.ll.mit.edu/mission/communications/cyber/CSTcorpora/files/TR-1062.pdf,(accessed on 16 April 2015).
118. The Third International Knowledge Discovery and Data Mining Tools (KDD) Cup 1999Data. Available online: http://kdd.ics.uci.edu/databases/kddcup99/kddcup99.html (accessed on16 April 2015).
119. Tavallaee, M.; Bagheri, E.; Lu, W.; Ghorbani, A.A. A Detailed Analysis of the KDD CUP 99Data Set. In Proceedings of the 2nd IEEE Intl Conference on Computational Intelligence forSecurity and Defense Applications, Ottawa, ON, Canada, 8–10 July 2009; pp. 53–58.
120. McHugh, J. Testing Intrusion Detection Systems: A Critique of the 1998 and 1999 DARPAIntrusion Detection System Evaluations As Performed by Lincoln Laboratory. ACM Trans. Inf.Syst. Secur. 2000, 3, 262–294.
121. Mahoney, M.V.; Chan, P.K. An Analysis of the 1999 DARPA/Lincoln Laboratory EvaluationData for Network Anomaly Detection. In Recent Advances in Intrusion Detection; Vigna, G.;Kruegel, C., Jonsson, E., Eds.; Volume 2820, Lecture Notes in Computer Science; Springer:Berlin/Heidelberg, Germany, 2003; pp. 220–237.
122. Thomas, C.; Sharma, V.; Balakrishnan, N. Usefulness of DARPA dataset for intrusion detectionsystem evaluation. SPIE Proc. 2008, doi:10.1117/12.777341.
123. Brauckhoff, D.; Wagner, A.; May, M. FLAME: A Flow-level Anomaly Modeling Engine. InProceedings of the Conference on Cyber Security Experimentation and Test (CSET’08), SanJose, CA, USA, 28 July 2008; pp. 1–6.
124. Brauckhoff, D. Network traffic anomaly detection and evaluation. Ph.D. Thesis, ETH Zürich,Switzerland, 2010; PhD Dissertation Nr. 18835.
125. Shiravi, A.; Shiravi, H.; Tavallaee, M.; Ghorbani, A.A. Toward Developing a SystematicApproach to Generate Benchmark Datasets for Intrusion Detection. Comput. Secur. 2012,31, 357–374.

Entropy 2015, 17 2408
126. Berezinski, P.; Szpyrka, M.; Jasiul, B.; Mazur, M. Network Anomaly Detection UsingParameterized Entropy. In Computer Information Systems and Industrial Management;Saeed, K., Snasel, V., Eds.; Volume 8838, Lecture Notes in Computer Science; Springer:Berlin/Heidelberg, Germany, 2014; pp. 465–478.
127. Tomer, B. Morto Post Mortem: Dissecting a Worm; Available online: http://blog.imperva.com/2011/09/morto-post-mortem-a-worm-deep-dive.html (accessed on 16 April 2015).
128. Damon, E.; Dale, J.; Laron, E.; Mache, J.; Land, N.; Weiss, R. Hands-on Denial of ServiceLab Exercises Using SlowLoris and RUDY. In Proceedings of the 2012 Information SecurityCurriculum Development Conference (InfoSecCD ’12), Kennesaw, GA, USA, 12–13 October2012; pp. 21–29.
129. Bencsáth, B.; Pék, G.; Buttyán, L.; Félegyházi, M. The Cousins of Stuxnet: Duqu, Flame, andGauss. Future Internet 2012, 4, 971–1003.
130. Denning, D.E. Stuxnet: What Has Changed? Future Internet 2012, 4, 672–687.131. Kührer, M.; Hupperich, T.; Rossow, C.; Holz, T. Exit from Hell? Reducing the Impact of
Amplification DDoS Attacks. In Proceedings of the 23rd USENIX Security Symposium, SanDiego, CA, USA, 20–22 August 2014.
132. Hauke, J.; Kossowski, T. Comparison of Values of Pearson’s and Spearman’s CorrelationCoefficients on the Same Sets of Data. Quaest. Geogr. 2011, 30, 87–93.
133. Davis, J.; Goadrich, M. The Relationship Between Precision-Recall and ROC Curves. InProceedings of the 23rd International Conference on Machine Learning (ICML’06), Pittsburgh,PA, USA, 25–29 June 2006; pp. 233–240.
134. Wu, Y.; Cai, S.; Yang, S.; Zheng, F.; Xiang, N. Classification of Knee Joint Vibration SignalsUsing Bivariate Feature Distribution Estimation and Maximal Posterior Probability DecisionCriterion. Entropy 2013, 15, 1375–1387.
135. Rifkin, R. MIT—Multiclass Classification. Available online: http://www.mit.edu/~9.520/spring09/Classes/multiclass.pdf (accessed on 16 April 2015).
136. Sumner, M.; Frank, E.; Hall, M. Speeding up Logistic Model Tree Induction. In Proceedingsof 9th European Conference on Principles and Practice of Knowledge Discovery in Databases,Porto, Portugal, 3–7 October 2005; pp. 675–683.
137. Seber, G.; Lee, A. Linear Regression Analysis; Wiley Series in Probability and Statistics; Wiley:Hoboken, NJ, USA, 2012.
138. Landwehr, N.; Hall, M.; Frank, E. Logistic Model Trees. Mach. Learn. 2005, 59, 161–205.139. Madjarov, G.; Kocev, D.; Gjorgjevikj, D.; Deroski, S. An Extensive Experimental Comparison
of Methods for Multi-label Learning. Pattern Recogn. 2012, 45, 3084–3104.140. MEKA: A Multi-label Extension to WEKA. Available online: http://meka.sourceforge.net/
(accessed on 16 April 2015).
c© 2015 by the authors; licensee MDPI, Basel, Switzerland. This article is an open access articledistributed under the terms and conditions of the Creative Commons Attribution license(http://creativecommons.org/licenses/by/4.0/).
Copyright © 2022 FDOKUMEN