Anomaly Detection Through Explanations Leilani Hendrina ...
230
Anomaly Detection Through Explanations by Leilani Hendrina Gilpin B.S., University of California, San Diego (2011) M.S., Stanford University (2013) Submitted to the Department of Electrical Engineering and Computer Science in partial fulfillment of the requirements for the degree of Doctor of Philosophy in Electrical Engineering and Computer Science at the MASSACHUSETTS INSTITUTE OF TECHNOLOGY September 2020 © Massachusetts Institute of Technology 2020. All rights reserved. Author ................................................................ Department of Electrical Engineering and Computer Science August 28, 2020 Certified by ............................................................ Gerald Jay Sussman Panasonic Professor of Electrical Engineering Thesis Supervisor Certified by ............................................................ Lalana Kagal Principal Research Scientist in CSAIL Thesis Supervisor Accepted by ........................................................... Leslie A. Kolodziejski Professor of Electrical Engineering and Computer Science Chair, Department Committee on Graduate Students
-
Upload
khangminh22 -
Category
Documents
-
view
0 -
download
0
Transcript of Anomaly Detection Through Explanations Leilani Hendrina ...
Anomaly Detection Through Explanationsby
Leilani Hendrina GilpinB.S., University of California, San Diego (2011)
M.S., Stanford University (2013)
Submitted to the Department of Electrical Engineering and ComputerScience
in partial fulfillment of the requirements for the degree of
Doctor of Philosophy in Electrical Engineering and Computer Science
at the
MASSACHUSETTS INSTITUTE OF TECHNOLOGY
September 2020
© Massachusetts Institute of Technology 2020. All rights reserved.
Author . . . . . . . . . . . . . . . . . . . . . . . . . . . . . . . . . . . . . . . . . . . . . . . . . . . . . . . . . . . . . . . .Department of Electrical Engineering and Computer Science
August 28, 2020Certified by. . . . . . . . . . . . . . . . . . . . . . . . . . . . . . . . . . . . . . . . . . . . . . . . . . . . . . . . . . . .
Gerald Jay SussmanPanasonic Professor of Electrical Engineering
Thesis SupervisorCertified by. . . . . . . . . . . . . . . . . . . . . . . . . . . . . . . . . . . . . . . . . . . . . . . . . . . . . . . . . . . .
Lalana KagalPrincipal Research Scientist in CSAIL
Thesis Supervisor
Accepted by . . . . . . . . . . . . . . . . . . . . . . . . . . . . . . . . . . . . . . . . . . . . . . . . . . . . . . . . . . .Leslie A. Kolodziejski
Professor of Electrical Engineering and Computer ScienceChair, Department Committee on Graduate Students

2

Anomaly Detection Through Explanations
by
Leilani Hendrina Gilpin
Submitted to the Department of Electrical Engineering and Computer Scienceon August 28, 2020, in partial fulfillment of the
requirements for the degree ofDoctor of Philosophy in Electrical Engineering and Computer Science
Abstract
Under most conditions, complex machines are imperfect. When errors occur, as theyinevitably will, these machines need to be able to (1) localize the error and (2) takeappropriate action to mitigate the repercussions of a possible failure. My thesis con-tributes a system architecture that reconciles local errors and inconsistencies amongstparts. I represent a complex machine as a hierarchical model of introspective sub-systems working together towards a common goal. The subsystems communicate ina common symbolic language. In the process of this investigation, I constructed aset of reasonableness monitors to diagnose and explain local errors, and a system-wide architecture, Anomaly Detection through Explanations (ADE), which reconcilessystem-wide failures. The ADE architecture contributes an explanation synthesizerthat produces an argument tree, which in turn can be backtracked and queried forsupport and counterfactual explanations. I have applied my results to explain incor-rect labels in semi-autonomous vehicle data. A series of test simulations show theaccuracy and performance of this architecture based on real-world, anomalous drivingscenarios. My work has opened up the new area of explanatory anomaly detection,towards a vision in which: complex machines will be articulate by design; dynamic,internal explanations will be part of the design criteria, and system-level explanationswill be able to be challenged in an adversarial proceeding.
Thesis Supervisor: Gerald Jay SussmanTitle: Panasonic Professor of Electrical Engineering
Thesis Supervisor: Lalana KagalTitle: Principal Research Scientist in CSAIL
3

4

Acknowledgments
“You can do it, only you can do it, you can’t do it alone.”
– Patrick Henry Winston
I would like to thank the many people who helped me to develop, shape, and write
this dissertation.
I am indebted to my advisor, Gerald Jay Sussman, who taught me how to think
slowly and clearly. Jerry reinvigorated my love of programming and organization (in
Emacs, of course)! I am grateful to him for his guidance, support, tea, and direct
feedback these many years. Although we will continue to learn together, I am humbled
to have been a Sussman student.
Many of the implementation choices came from Lalana Kagal, the co-advisor of
this thesis. Lalana provided the strategic ideas to shape this work into conference
papers and reusable artifacts.
Patrick H. Winston taught me how to effectively communicate ideas. He showed
me the power of a good demo. He provided me with encouragement and a research
family: the Genesis group, a research community where everyone helped.
Jacob Andreas, Julie Shah, and Howard Shrobe were my dissertation committee
members. They supported an idea composed of many parts, ideas, and disciplines.
Thank you for the relentless encouragement throughout this process.
Many people shaped my academic journey before coming to MIT. I worked at Palo
Alto Research Center (PARC), where I learned from from Juan (Julia) Liu, Johan de
Kleer, and others in the Intelligent Systems Laboratory (ISL). Karianne Bergen and
Qian Yang from the Stanford ICME 2011 cohort are lifelong colleagues and friends.
The UCSD CSE tutor community sparked my interests in teaching and debugging,
and provided me with a close-knit community.
I worked closely with collaborators in the Internet Policy Research Initiative
(IPRI) at MIT CSAIL. Julius Adebayo, Sam DeLaughter, Natalie Lao, Mike Specter,
and Jessica Van Brummelen read and edited early versions of this thesis. Ben Z. Yuan
encouraged me to “make almost anything.” Cecilia Testart was my office mate, coau-
5

thor, and coffee companion. Cecilia is one of the women in the 2015 EECS cohort; a
remarkable group of women with whom I shared weekly coffees and brunches. With
that, I want to acknowledge the numerous coffee shops around the Kendall Square
area, where I was a regular customer. Thank you for the caffeinated support.
I called MIT CSAIL home for five years, and I spent four of those years in Burton-
Conner as a Graduate Student Advisor (GRA) on Burton 4. My role was to support
undergraduate students, but the students ended up supporting me and giving me a
sense of purpose. Another home was the MIT Rowing Club (MITRC), where I made
some of my closest friends: Elise, Muriel, Ray, and Richard. Rowing on the Charles
in the mornings was where I developed some of my best research ideas.
My family has relentlessly supported my academic pursuits. Thank you to Brian
and Patty Gilpin, my parents who taught me how to be patient, thoughtful, and
resilient. My younger brother, Cory Gilpin, the unofficial copy editor of this thesis,
inspires me to be creative every day.
I moved across the country to pursue my doctorate, leaving a previous life in
California. Graham Lockett and Alex Toschi visited Boston numerous times. Thank
you for bringing California sunshine during the cold, winter months. My boyfriend,
Răzvan Valentin Marinescu, exemplifies what it means to be a supportive partner.
Thank you for being my reasonableness monitor in all things technical, and my anchor
point in life.
And finally, thank you to the sources of funding for this work: Toyota Research
Institute (TRI) and Sloan UCEM. Thank you for seeing the potential in me, this
work, and its impact.
6

Contents
1 Introduction 21
1.1 Definitions . . . . . . . . . . . . . . . . . . . . . . . . . . . . . . . . . 25
1.2 Thesis Contributions . . . . . . . . . . . . . . . . . . . . . . . . . . . 25
1.2.1 Local Sanity Checks . . . . . . . . . . . . . . . . . . . . . . . 26
1.2.2 System-wide Communication . . . . . . . . . . . . . . . . . . 26
1.2.3 Explanation Feedback . . . . . . . . . . . . . . . . . . . . . . 26
1.3 Thesis Overview . . . . . . . . . . . . . . . . . . . . . . . . . . . . . . 27
2 Background 29
2.1 Anomaly Detection . . . . . . . . . . . . . . . . . . . . . . . . . . . . 29
2.1.1 Diagnostics . . . . . . . . . . . . . . . . . . . . . . . . . . . . 30
2.1.2 Monitoring . . . . . . . . . . . . . . . . . . . . . . . . . . . . 31
2.2 Knowledge Representation and Reasoning . . . . . . . . . . . . . . . 31
2.2.1 Frame-based Representations . . . . . . . . . . . . . . . . . . 31
2.2.2 Ontology . . . . . . . . . . . . . . . . . . . . . . . . . . . . . . 32
2.2.3 Commonsense Knowledge and Reasoning . . . . . . . . . . . . 32
2.2.4 Reasoning . . . . . . . . . . . . . . . . . . . . . . . . . . . . . 32
2.2.5 Cognitive Architectures . . . . . . . . . . . . . . . . . . . . . . 33
2.2.6 Theory of Mind . . . . . . . . . . . . . . . . . . . . . . . . . . 33
2.3 Multi-agent Systems . . . . . . . . . . . . . . . . . . . . . . . . . . . 33
2.4 Integrating Perception and Reasoning . . . . . . . . . . . . . . . . . . 33
7

3 Ex post facto Explanations 35
3.1 Introduction . . . . . . . . . . . . . . . . . . . . . . . . . . . . . . . . 36
3.1.1 Definition of Vehicle Specific Components . . . . . . . . . . . 36
3.2 Method Overview . . . . . . . . . . . . . . . . . . . . . . . . . . . . . 37
3.2.1 Data Generation and Analysis . . . . . . . . . . . . . . . . . . 38
3.2.2 Qualitative Algebras . . . . . . . . . . . . . . . . . . . . . . . 42
3.2.3 Models . . . . . . . . . . . . . . . . . . . . . . . . . . . . . . . 42
3.2.4 Vehicle Modeling with the Propagator System . . . . . . . . . 43
3.2.5 Qualitative Mechanical Model . . . . . . . . . . . . . . . . . . 45
3.2.6 Semi-quantitative Physics Model . . . . . . . . . . . . . . . . 46
3.2.7 Reasoning . . . . . . . . . . . . . . . . . . . . . . . . . . . . . 47
3.3 Experiment Results . . . . . . . . . . . . . . . . . . . . . . . . . . . . 47
3.3.1 Examples from the Mechanical Model . . . . . . . . . . . . . . 48
3.3.2 Examples from the Physics Model . . . . . . . . . . . . . . . . 49
3.4 Applying this Methodology . . . . . . . . . . . . . . . . . . . . . . . 51
3.5 Related Work . . . . . . . . . . . . . . . . . . . . . . . . . . . . . . . 51
3.6 Limitations . . . . . . . . . . . . . . . . . . . . . . . . . . . . . . . . 52
3.7 Contributions . . . . . . . . . . . . . . . . . . . . . . . . . . . . . . . 53
4 Reasonableness Monitors 55
4.1 Introduction . . . . . . . . . . . . . . . . . . . . . . . . . . . . . . . . 56
4.2 Method Overview . . . . . . . . . . . . . . . . . . . . . . . . . . . . . 56
4.2.1 Input Parsing . . . . . . . . . . . . . . . . . . . . . . . . . . . 57
4.2.2 Representation: Conceptual Primitives . . . . . . . . . . . . . 57
4.3 Adaptable Implementation . . . . . . . . . . . . . . . . . . . . . . . . 62
4.3.1 Log Generation and Ontology . . . . . . . . . . . . . . . . . . 62
4.3.2 Rule Input . . . . . . . . . . . . . . . . . . . . . . . . . . . . . 64
4.3.3 Reasoning and Explanations . . . . . . . . . . . . . . . . . . . 65
4.4 Evaluation . . . . . . . . . . . . . . . . . . . . . . . . . . . . . . . . . 66
4.4.1 Validation . . . . . . . . . . . . . . . . . . . . . . . . . . . . . 66
8

4.4.2 User Study . . . . . . . . . . . . . . . . . . . . . . . . . . . . 67
4.4.3 Example Explanations . . . . . . . . . . . . . . . . . . . . . . 69
4.5 Applying Reasonableness Monitors . . . . . . . . . . . . . . . . . . . 70
4.6 Limitations . . . . . . . . . . . . . . . . . . . . . . . . . . . . . . . . 70
4.7 Ongoing Work . . . . . . . . . . . . . . . . . . . . . . . . . . . . . . . 71
4.8 Related Work . . . . . . . . . . . . . . . . . . . . . . . . . . . . . . . 72
4.9 Contributions . . . . . . . . . . . . . . . . . . . . . . . . . . . . . . . 74
5 Interpreting Sensor Data 77
5.1 Introduction . . . . . . . . . . . . . . . . . . . . . . . . . . . . . . . . 78
5.1.1 LiDAR Sensor Limitations . . . . . . . . . . . . . . . . . . . . 79
5.2 LiDAR Sensor Overview . . . . . . . . . . . . . . . . . . . . . . . . . 80
5.2.1 Simulated LiDAR format . . . . . . . . . . . . . . . . . . . . . 80
5.2.2 LiDAR format in Collected Data Sets . . . . . . . . . . . . . . 81
5.2.3 Related Work on LiDAR Processing . . . . . . . . . . . . . . . 83
5.3 Method . . . . . . . . . . . . . . . . . . . . . . . . . . . . . . . . . . 86
5.3.1 Edge Detection for Object Detection . . . . . . . . . . . . . . 86
5.3.2 Angle Estimation . . . . . . . . . . . . . . . . . . . . . . . . . 87
5.3.3 Object Tracking: Describing Movement . . . . . . . . . . . . . 90
5.3.4 Parking Rules . . . . . . . . . . . . . . . . . . . . . . . . . . . 90
5.4 Experiment Results . . . . . . . . . . . . . . . . . . . . . . . . . . . . 92
5.4.1 Simulated LiDAR challenge scenarios . . . . . . . . . . . . . . 92
5.4.2 Data Set LiDAR Challenge Results . . . . . . . . . . . . . . . 94
5.5 Applying Sensor Interpretation . . . . . . . . . . . . . . . . . . . . . 98
5.6 Limitations . . . . . . . . . . . . . . . . . . . . . . . . . . . . . . . . 98
5.7 Contributions . . . . . . . . . . . . . . . . . . . . . . . . . . . . . . . 99
6 Learning from Explanations 101
6.1 Introduction . . . . . . . . . . . . . . . . . . . . . . . . . . . . . . . . 102
6.2 Method . . . . . . . . . . . . . . . . . . . . . . . . . . . . . . . . . . 103
6.2.1 Monitoring Architecture . . . . . . . . . . . . . . . . . . . . . 103
9

6.2.2 Rule Learning . . . . . . . . . . . . . . . . . . . . . . . . . . . 104
6.2.3 RACECAR Architecture . . . . . . . . . . . . . . . . . . . . . 105
6.3 Experiments . . . . . . . . . . . . . . . . . . . . . . . . . . . . . . . . 106
6.3.1 Experiment Design . . . . . . . . . . . . . . . . . . . . . . . . 106
6.3.2 Experiment Results . . . . . . . . . . . . . . . . . . . . . . . . 108
6.3.3 Challenges . . . . . . . . . . . . . . . . . . . . . . . . . . . . . 108
6.4 Applying Rule Learning . . . . . . . . . . . . . . . . . . . . . . . . . 111
6.5 Limitations . . . . . . . . . . . . . . . . . . . . . . . . . . . . . . . . 111
6.6 Ongoing Work . . . . . . . . . . . . . . . . . . . . . . . . . . . . . . . 113
6.7 Contributions and Discussion . . . . . . . . . . . . . . . . . . . . . . 113
7 System-wide Anomaly Detection 115
7.1 The Problem . . . . . . . . . . . . . . . . . . . . . . . . . . . . . . . 116
7.2 System Monitoring Architecture . . . . . . . . . . . . . . . . . . . . . 116
7.2.1 Inspiration from Human Committee Structures . . . . . . . . 117
7.2.2 Generating Qualitative Descriptions . . . . . . . . . . . . . . . 119
7.2.3 Monitoring for Reasonableness within Each Subsystem . . . . 120
7.2.4 Reconcile Inconsistencies with a Synthesizer . . . . . . . . . . 121
7.3 Explanation Synthesizer . . . . . . . . . . . . . . . . . . . . . . . . . 121
7.3.1 Priority Hierarchy . . . . . . . . . . . . . . . . . . . . . . . . . 122
7.3.2 Underlying Logic Language . . . . . . . . . . . . . . . . . . . 123
7.3.3 Abstract Rules . . . . . . . . . . . . . . . . . . . . . . . . . . 124
7.4 Evaluation . . . . . . . . . . . . . . . . . . . . . . . . . . . . . . . . . 126
7.4.1 Simulation Setup . . . . . . . . . . . . . . . . . . . . . . . . . 127
7.4.2 Uber Accident Scenario . . . . . . . . . . . . . . . . . . . . . . 127
7.4.3 Reasoning . . . . . . . . . . . . . . . . . . . . . . . . . . . . . 131
7.4.4 Adding Mistakes to Existing Data . . . . . . . . . . . . . . . . 132
7.4.5 Evaluation of Inserted Errors . . . . . . . . . . . . . . . . . . 133
7.5 Challenges and Benchmarks . . . . . . . . . . . . . . . . . . . . . . . 136
7.5.1 Other Potential Evaluations . . . . . . . . . . . . . . . . . . . 137
10

7.6 Requirements to Apply ADE . . . . . . . . . . . . . . . . . . . . . . . 137
7.7 Related Work . . . . . . . . . . . . . . . . . . . . . . . . . . . . . . . 138
7.8 Limitations . . . . . . . . . . . . . . . . . . . . . . . . . . . . . . . . 138
7.9 Conclusion and Future Work . . . . . . . . . . . . . . . . . . . . . . . 139
8 Philosophy of Explanations: A Review with Recommendations 141
8.1 Background and Foundational Concepts . . . . . . . . . . . . . . . . 142
8.1.1 What is an Explanation? . . . . . . . . . . . . . . . . . . . . . 142
8.1.2 Interpretability vs. Completeness . . . . . . . . . . . . . . . . 143
8.1.3 Explainability of Deep Networks . . . . . . . . . . . . . . . . . 145
8.2 Review . . . . . . . . . . . . . . . . . . . . . . . . . . . . . . . . . . . 145
8.2.1 Explanations of Deep Network Processing . . . . . . . . . . . 145
8.2.2 Explanations of Deep Network Representations . . . . . . . . 148
8.2.3 Explanation-Producing Systems . . . . . . . . . . . . . . . . . 150
8.3 Related Work . . . . . . . . . . . . . . . . . . . . . . . . . . . . . . . 153
8.3.1 Interpretability . . . . . . . . . . . . . . . . . . . . . . . . . . 153
8.3.2 Explainable AI for HCI . . . . . . . . . . . . . . . . . . . . . . 154
8.3.3 Explanations for Black-Box Models . . . . . . . . . . . . . . . 156
8.3.4 Explainability in Other Technical Domains . . . . . . . . . . . 157
8.3.5 Explanations for Society . . . . . . . . . . . . . . . . . . . . . 158
8.4 Taxonomy . . . . . . . . . . . . . . . . . . . . . . . . . . . . . . . . . 158
8.5 Evaluation . . . . . . . . . . . . . . . . . . . . . . . . . . . . . . . . . 160
8.5.1 Processing . . . . . . . . . . . . . . . . . . . . . . . . . . . . . 161
8.5.2 Representation . . . . . . . . . . . . . . . . . . . . . . . . . . 162
8.5.3 Explanation-Producing . . . . . . . . . . . . . . . . . . . . . . 162
8.6 Societal Expectations for Explanations . . . . . . . . . . . . . . . . . 163
8.6.1 Definitions . . . . . . . . . . . . . . . . . . . . . . . . . . . . . 164
8.6.2 Current Limitations . . . . . . . . . . . . . . . . . . . . . . . . 165
8.7 A Big Problem: Opaque Perception Processes . . . . . . . . . . . . . 166
8.7.1 Hallucinating Information . . . . . . . . . . . . . . . . . . . . 166
11

8.7.2 Imagining Possible Futures . . . . . . . . . . . . . . . . . . . . 167
8.7.3 Commonsense Reasoning . . . . . . . . . . . . . . . . . . . . . 168
8.8 The Risk of Deploying Opaque Models . . . . . . . . . . . . . . . . . 169
8.9 Conclusions . . . . . . . . . . . . . . . . . . . . . . . . . . . . . . . . 170
9 Contributions and Future Work 171
9.1 Explanations as a Debugging Language . . . . . . . . . . . . . . . . . 172
9.2 Future Applications . . . . . . . . . . . . . . . . . . . . . . . . . . . . 173
9.2.1 Hybrid Approaches to Intelligent Systems . . . . . . . . . . . 174
9.2.2 Using Explanations as Internal Narrative . . . . . . . . . . . . 174
9.2.3 Explanations for Society . . . . . . . . . . . . . . . . . . . . . 175
9.2.4 Security Applications . . . . . . . . . . . . . . . . . . . . . . . 175
9.3 Reevaluating Evaluations . . . . . . . . . . . . . . . . . . . . . . . . . 176
9.3.1 Tasks that Require Explanations . . . . . . . . . . . . . . . . 176
9.3.2 Challenges for Imagining and Explaining Possible Futures . . 177
9.4 Implications . . . . . . . . . . . . . . . . . . . . . . . . . . . . . . . . 179
9.5 A Salute . . . . . . . . . . . . . . . . . . . . . . . . . . . . . . . . . . 180
A Auxiliary Information 183
A.1 Qualitative Algebras . . . . . . . . . . . . . . . . . . . . . . . . . . . 183
A.2 Conceptual Primitive Descriptions . . . . . . . . . . . . . . . . . . . . 185
B Code 189
B.1 Vehicle Specific Artifacts . . . . . . . . . . . . . . . . . . . . . . . . . 189
B.2 Adaptable Code Artifacts . . . . . . . . . . . . . . . . . . . . . . . . 192
B.2.1 Conceptual Dependency Parsing . . . . . . . . . . . . . . . . . 192
B.2.2 Commonsense Data Querying . . . . . . . . . . . . . . . . . . 192
B.3 Interpreting LiDAR data . . . . . . . . . . . . . . . . . . . . . . . . . 195
B.4 Synthesizer . . . . . . . . . . . . . . . . . . . . . . . . . . . . . . . . 196
B.5 Sample Results . . . . . . . . . . . . . . . . . . . . . . . . . . . . . . 197
B.5.1 NuScenes Examples . . . . . . . . . . . . . . . . . . . . . . . . 197
12

B.5.2 Parsing Examples . . . . . . . . . . . . . . . . . . . . . . . . . 197
C Data Samples 201
C.1 LiDAR Data . . . . . . . . . . . . . . . . . . . . . . . . . . . . . . . . 201
C.2 Simulations . . . . . . . . . . . . . . . . . . . . . . . . . . . . . . . . 210
13

14
List of Figures
3-1 Ex post facto explanation generation process . . . . . . . . . . . . . . 38
3-2 A difficult driving scenario inspired by the off-ramp of Route 95 in
Massachusetts. The yellow star signifies the starting point, and blue
arrows show the vehicle’s ideal trajectory. . . . . . . . . . . . . . . . . 39
3-3 A sample CAN bus data record. Each line has a time stamp, CAN
bus code, and parameter information. The mappings for the CAN bus
codes are in Appendix B-1. . . . . . . . . . . . . . . . . . . . . . . . . 40
3-4 A diagram of the mechanical model that describes the interactions
between the vehicle’s mechanical parts. . . . . . . . . . . . . . . . . . 45
3-5 The forces that are calculated and used in the semi-quantitative physics
model. Shown from the lateral and top-down view. . . . . . . . . . . 46
4-1 The system diagram schematic of a reasonableness monitor as an adapt-
able framework. . . . . . . . . . . . . . . . . . . . . . . . . . . . . . . 63
4-2 Average rating of 40 explanations over 100 user trials. There are 4 sets
of explanations (from left to right): reasonable vehicle plans, unrea-
sonable vehicle plans, reasonable perception descriptions, and unrea-
sonable perception descriptions . . . . . . . . . . . . . . . . . . . . . 68
5-1 The 4th, 5th, and 8th beams of nuScenes LiDAR data for one sample.
The 4th beam is in blue, the 5th beam is in green, and the 8th beam
is in red. The 8th beam, seen in red, is hitting the ground. . . . . . . 82
15
5-2 The 1st, 10th, and 20th beams of nuScenes LiDAR data. The 1st beam
is blue, the 10th beam is green and the 20th beam is red. The first and
10th beam are reflecting off parts of the vehicle. And the 20th beam
is too scattered. . . . . . . . . . . . . . . . . . . . . . . . . . . . . . . 82
5-3 A top-down view of all the LiDAR beams. . . . . . . . . . . . . . . . 84
5-4 A view of all the LiDAR beams on top of the front-facing camera image. 85
5-5 The geometric definitions for an object detected precisely in front. . . 88
5-6 The geometric definitions for a vehicle detected to the front and to
the side. The precise setup is shown on the left, and the estimated
definitions are shown on the right. . . . . . . . . . . . . . . . . . . . . 89
5-7 Visual diagram for the variables for the parallel parking scenario. . . 91
5-8 Screenshots of the four stages of parallel parking from the Unity game
engine. . . . . . . . . . . . . . . . . . . . . . . . . . . . . . . . . . . 93
5-9 Various sensor outputs for a nuScenes scene snapshot. . . . . . . . . . 94
5-10 The nuScenes metadata for an annotated object. . . . . . . . . . . . . 96
5-11 A visualization of a raw data and bounding box for a traffic cone behind
the vehicle. . . . . . . . . . . . . . . . . . . . . . . . . . . . . . . . . 96
5-12 A visualization of a raw data and bounding box for a pedestrian. . . . 97
5-13 A visualization of a raw data and bounding box for a vehicle. . . . . . 97
5-14 LiDAR density between 2015 and 2020. . . . . . . . . . . . . . . . . . 99
6-1 A flow diagram of the experiment design. The RACECAR system
outputs a log file after a running through a specific sequence of cones.
That log file is then processed by the rule learning system, which either
creates a new rule for the existing monitoring system, or not In the case
of a normal test run no rule is made. . . . . . . . . . . . . . . . . . . 107
6-2 A subset of a repeated error log. . . . . . . . . . . . . . . . . . . . . 109
6-3 The output of the rule learning system for the repeated error in Figure
6-2 that should be parsed into a new rule. The resulting rule text is
appended to the rule file and updated in the monitoring system. . . . 110
16

6-4 The dynamic reasonableness monitoring architecture. . . . . . . . . . 112
7-1 The ADE architecture model for a simplified self-driving vehicle. It
is composed of reasonableness monitors (dotted borders) around each
subsystem and explanation synthesizer . . . . . . . . . . . . . . . . . 119
7-2 The conditions for passenger safety as a natural language abstract goal. 123
7-3 A screenshot of the Uber accident simulation (in segmentation mode)
on the Carla Platform. . . . . . . . . . . . . . . . . . . . . . . . . . . 128
7-4 The qualitative description outputs from my simulation of the Uber
accident in the ADE architecture. . . . . . . . . . . . . . . . . . . . . 129
7-5 The symbolic reasons that are used in the explanation synthesizer. . . 132
7-6 The “true” annotation of a pedestrian. . . . . . . . . . . . . . . . . . 135
9-1 My vision for articulate machines that can coherently communicate to
each other and to a human. . . . . . . . . . . . . . . . . . . . . . . . 172
9-2 A difficult driving scenario for a self-driving vehicle. . . . . . . . . . . 178
A-1 An example of qualitative addition for the qualitative direction algebra. 185
B-1 CAN bus mapping code for the vehicle simulation in Chapter 3 . . . 189
B-2 A subset of the edge detection rules for the “intervals of interest” in
Chapter 3. . . . . . . . . . . . . . . . . . . . . . . . . . . . . . . . . . 190
B-3 A labeled data sample from NuScenes. . . . . . . . . . . . . . . . . . 197
B-4 The parse tree for “A mailbox crossing the street.” . . . . . . . . . . . 197
B-5 The parse tree for a real image caption from “A man looks at his
cellphone while standing next to a motorcycle.” . . . . . . . . . . . . 198
C-1 A sample of the simulated LiDAR data extracted from a simulated
vehicle log. This corresponds to a subset of a single snapshot (or point
in time). . . . . . . . . . . . . . . . . . . . . . . . . . . . . . . . . . 208
C-2 A screenshot of the Uber accident simulation (with similar lighting to
the report) on the Carla Platform. . . . . . . . . . . . . . . . . . . . 210
17

18

List of Tables
3.1 The complete set of the possible relationships among time intervals, as
determined by James F. Allen [6]. . . . . . . . . . . . . . . . . . . . . 41
3.2 Summary of the “intervals of interest” accumulated during an over-
steering skid. . . . . . . . . . . . . . . . . . . . . . . . . . . . . . . . 42
4.1 The Conceptual Dependency (CD) “physical” primitives used, and the
ConceptNet anchor points used to bind them to incoming verbs. . . . 59
4.2 List of ConceptNet anchor points used for actor and object roles in the
CD transframe, and constraints on where a concept may reasonably
serve in the role. . . . . . . . . . . . . . . . . . . . . . . . . . . . . . 60
4.3 Comparison of explanation descriptions for the four types of expla-
nations tested: reasonable vehicle plans, unreasonable vehicle plans,
reasonable perception descriptions, and unreasonable perception de-
scriptions. . . . . . . . . . . . . . . . . . . . . . . . . . . . . . . . . . 69
4.4 A analysis of the causes of the 18 misclassifications on the 100 test cases. 70
5.1 A raw data table of the LiDAR traces. The LiDAR unit starts at 0
azimuth degrees and emits 11 pulses at 0,-1, ...,-10 degrees elevation
for every two azimuth degrees. . . . . . . . . . . . . . . . . . . . . . . 81
19

6.1 A table of the 15 distinct sequences that were tested on the RACE-
CAR platform. The error logs had specified errors, which are deemed
exceptions to the rule and so no new rules are made. Normal tests were
explained to be reasonable, and so no new rules are made. Repeated
errors are explained and so new rules are made, as expected. . . . . . 106
7.1 A comparison of the ADE results on different synthesizer constraints.
The “no synthesizer” option signifies that all subsystem errors are re-
ported. The “single subystem” option means that one subsystem is
arbitrarily chosen to always be given preference. The “safety” con-
straint is our default, where “threatening” objects are given a higher
priority (to be classified as erroneous.) . . . . . . . . . . . . . . . . . 134
7.2 A comparison of the ADE system on regular and scrambled outputs.
The regular output is a summary supporting that the judgement or
action is reasonable. The scrambled output (where a different label
than the true label is used) shows that the architecture can correctly
identify judgements or actions that are incorrect. . . . . . . . . . . . 135
8.1 The classifications of explanation methods by the focus of the expla-
nation. . . . . . . . . . . . . . . . . . . . . . . . . . . . . . . . . . . . 160
8.2 Strengths, benefits, and challenges of current DNN XAI systems . . . 165
C.1 A full, simulated Lidar trace. . . . . . . . . . . . . . . . . . . . . . . 201
C.2 A raw data table of a subset of the NuScenes LiDAR traces. . . . . . 209
20
Chapter 1
Introduction
Complex machines, like all things, are imperfect. Testing and proving properties
can harden these systems, but they are inadequate–it is impossible to test all failure
modes. Consider a human crossing the street. It is considered “safe”, if you look both
ways and do not detect an oncoming vehicle. But this protocol does not include the
6.25 × 10⁻⁷ chance of being struck by a local meteorite, asteroid, or comet impact1.
Instead of building provable test cases, my research is a complementary approach: I
work on the methodologies and underlying technologies of monitoring architectures
that can mitigate underlying system failures.
Society has built reasonably stable structures to minimize the occurrence and the
consequences of bad human behavior. One such mechanism is a human organization:
where each kind of work that is to be done is given to a committee of personnel
who work together on said task. Another mechanism is the legal system. It enforces
the minimal norms of the society, subject to a set of rules. The legal system in-
vestigates reports of bad behavior after-the-fact, or ex post facto, and takes action
to mitigate and to prevent the recurrence of that behavior through an investigation.
This investigation is dependent on evidence: stories recounting the bad behavior and
explanations from the alleged bad actor. Currently, complex machines do not have
the ability to provide this sort of evidence (without substantial effort).
1In 2014, Professor Stephen A. Nelson calculated the lifetime odds of dying from a local mete-orite, asteroid, or comet impact as 1 in 1,600,000: http://www.tulane.edu/~sanelson/Natural_Disasters/impacts.htm
21

For complex machines to be robustly intelligent, they must keep internal reports
of their behavior. I decompose a complex machine into an organization of subsystems
working towards a common goal: an architecture, similar to human committees. The
architecture is able to detect and reconcile local failures (within a committee), as well
as inconsistencies amongst subsystems using explanations as a technical language.
An explanation synthesizer produces an argument tree, which can in turn produce
counterfactual explanations for an adversarial proceeding. The synthesizer depends
on the underlying subsystem’s ability to tell its own coherent story about the reasons
for its decisions or actions.
Some subsystems are so opaque (e.g., deep neural networks) that there may be no
way to explain the subsystem’s behavior. Perception is an example. In self-driving
cars, there may be a vision system interpreting images from an optical camera. Com-
puter vision systems are susceptible to be fooled [170] and lack commonsense2. If a
vision system reports that it observes a mailbox walking across the street [79], that is
clearly not possible. If it observes an elephant in the sky, that does not make sense.
Labeling the same object as three very different things at the same time (e.g., a ve-
hicle, an unknown object, a bicycle) is unreasonable3; that is a confused judgement
that should be discounted. To combat these types of nonsensical judgements, I devel-
oped a reasonableness monitor [73], which supplements opaque decision making with
rules, an ontology, and commonsense knowledge. With the addition of a reasoner, the
reasonableness monitor produces a judgement of reasonableness and an explanation
supporting that judgement. I present the technical details of this local commonsense
sanity check in Chapter 4. I extended the end-to-end reasonableness monitor into
an adaptable framework [78] that can impose sanity checks on all subsystems of a
complex machine. This includes sensory LiDAR4, after applying a sensor interpreter,
which I present in Chapter 5.
2The “AI” in a self-driving vehicle mistakes woman on bus for jay-walking: https://slashdot.org/story/18/11/26/0527259
3This labeling scenario actually happened in the Uber self-driving car accident in 2016 [180].4LiDAR is the commonly used acronym for Light Detection and Ranging. It is a sensor that uses
light from a pulsed laser to measure distance from the source point. The aggregated detections fromseveral light pulses form a point cloud.
22
Complex machines also lack internal communication. When the underlying parts
disagree, they cannot justify their behavior. In the Uber self-driving vehicle acci-
dent5, an unresolved disagreement among parts lead to a pedestrian fatality [180].
In summary, the vision system perceived an oscillating label where the pedestrian
was located, although the LiDAR system detected a moving object in that region.
The mechanism for combining this information chose to ignore the object. Instead,
I created a system-wide explanatory monitoring architecture, Anomaly Detection
Through Explanations (ADE). The architecture consists of local reasonableness mon-
itors around subsystems, constructed into a system hierarchy, similar to how human
organizations are structured. An explanation synthesizer reconciles disagreements.
In the Uber example, the synthesizer is able to validate the vision system’s detection
of an object, while discounting the oscillating labels of that object, because they are
inconsistent. The synthesizer constructs a reason why, by examining the explanations
from the underlying subsystems that support the judgement. The ADE architecture
is presented in Chapter 7.
Explainability under uncertainty, which can learn from explained failures in dy-
namic situations, is an unexplored area. Explanatory artificial intelligence (XAI) has
become a popular research agenda under the DARPA XAI program [88] and the EU’s
GDPR on the “right to explanation” [84]. Although, it is not without criticism [193]:
explanatory systems are all explaining different processes, lacking common evaluation
metrics [76] and intervention mechanisms. Instead, the majority of explanatory tools
are after-the-fact analysis tools, like the model-based, qualitative reasoning expla-
nation generation method presented in Chapter 3. This approach is similar to the
sensor-data interpreter in Chapter 5, in which raw sensor data is translated into a
(mostly symbolic) list of descriptions.
I contribute a common language for reconciling system-wide failures. The pieces
of a complex machine report their state at various levels of detail: the vision sub-
system reports high-level labels, and the sensors output low-level log traces. By
5Uber self-driving car ignores objects: https://www.theinformation.com/articles/uber-finds-deadly-accident-likely-caused-by-software-set-to-ignore-objects-on-road
23

producing explanations of their behavior, the subsystems are able to speak the same
language, argue amongst themselves, and use these explanations to support or chal-
lenge high-level decisions. These monitoring pieces may have different conclusions;
they may directly conflict and contradict each other. But since the monitors are con-
stantly inspecting the behavior of their neighboring subsystems (and themselves), the
explanations are dynamic. They can be augmented, changed, and challenged with
alternative context, more evidence, and in different scenarios. For example, with
various weather sensor information, the LiDAR monitor’s explanations can become
stronger or weaker, since LiDAR is unreliable in rain, fog, or snow6. A formerly
strong LiDAR monitor explanation can be weakened by this information, encourag-
ing the other sensors and subsystems to reevaluate their explanations. A series of
test scenarios demonstrating this kind of dynamic behavior are in Section 7.5.
Some of the most compelling applications of this work include people: shared
autonomy, social structures, government structures, and others, which are elaborated
in Chapter 8. But whether humans are involved is irrelevant. My methodologies
monitor every subsystems’ behavior, even if one or more of the subsystems is a human!
I argue that the novel use of explanations is for the machine itself, which is a
novel perspective compared to previous work [88]. My thesis enables complex ma-
chines to reason about new scenarios, even if they have not seen that circumstance
before. The current successes of autonomous vehicles are completely dependent on
their ability to learn through (previously observed) experiences [243]. Instead, I model
an autonomous vehicle as committees of introspective subsystems working together
towards a common goal. This results in a self-explaining architecture, where au-
tonomous vehicles can reason and explain the ever-growing, long tail of failures in
real-world environments7.
6LiDAR is unreliable in certain weather conditions: https://www.draper.com/news-releases/new-lidar-detector-enables-self-driving-cars-see-sun-rain-fog-and-snow
7Errors and failures are different kinds of bugs. The Hacker’s Dictionary defines a “bug” as “anunwanted and unintended property of a program or piece of hardware, especially one that causes itto malfunction.” An error is a technical property. Most errors are harmless, such as an “undesirable”search query results, or a typo. A failure is an error with consequences. A failure occurs whenthere is a difference from the expected result. In self-driving cars, failures can be fatal. I work onexplaining system-wide failures and detecting local errors.
24

1.1 Definitions
My dissertation contributes a local error detection monitor, and a system-wide failure
detection architecture. The output of the monitor is a justification of unreasonable-
ness, and the output of the architecture is an explanation. I define the following key
terms to be consistent with the IEEE software engineering literature [100], using the
running example of an off-by-one error8.
1. An error produces an incorrect internal state [100]. For example, an off-by-one
error that changes a location outside of memory, where no one cares about that
location, is just an error. I detect and justify local subsystem errors.
2. A failure is an “external, incorrect behavior with respect to the expected behav-
ior (observed)” [100]. A failure has consequences. Consider an off-by-one error
that clobbers a location whose value is essential to a safety-critical process–that
is a failure. I detect and explain system-wide failures.
My thesis contributes methods that explain themselves and justify their behavior.
1. A justification is a description of whether something is right or reasonable (or
not). Reasonableness monitors (in Chapter 4) provide justifications supporting
an unreasonable or reasonable judgement of an intended subsystem behavior.
2. An explanation is a justification that also describes the causes, context, and/or
consequences of an error, failure, or stable system state. An explanation answers
“why questions” (see Section 8.1.1).
1.2 Thesis Contributions
I use symbolic internal subsystem representations, or explanations, to enable complex
machines to introspect, reason, and reconcile their own failures. I contribute to8An off-by-one error (OBOE, OBO, OB1 and OBOB) is a logic error in computer programming.
It typically occurs when an iterative loop iterates one too many or one too few times. It can alsooccur due to an incorrect inequality symbol (< instead of ≤ or > instead of ≥ and vice versa), ordue to array indexing, in which the programmer mistakes that an array starts at 0 instead of 1 (andvice versa).
25

three technical aspects of an introspective system: local sanity checks, system-wide
communication, and explanation feedback. While my dissertation focuses on the
domain of self-driving cars, the methodologies are applicable to any complex machine
that is composed of multiple parts.
1.2.1 Local Sanity Checks
Complex machines can fail in two distinct ways. One type of failure could be localized
to a specific subsystem. Most local failures are due to flaws that a human would never
make. In order to provide the individual subsystems of this complex machines with
a last-pass “reasonableness” check, I developed a commonsense monitoring system:
reasonableness monitors. Reasonableness monitors process the output of a (possibly
opaque) subsystem and use a set of rules, ontology and commonsense knowledge
leading to a judgement and justification of reasonableness.
1.2.2 System-wide Communication
The second type of complex machine failure is due to flawed communication amongst
subsystems. There is limited internal communication in complex machines: the un-
derlying subsystems perform tasks at different levels of abstraction, therefore report-
ing their decisions, states, and world views in different forms of communication. To
provide a common language for subsystem communication, I implemented a system
architecture: Anomaly Detection Through Explanations (ADE), that can reconcile
subsystem inconsistencies in a common explanation language. A series of test simu-
lations show the accuracy and performance of this architecture based on simulated,
anomalous driving scenarios.
1.2.3 Explanation Feedback
Explanations should make complex machines work better. I show how explanations
can be fed back into a monitoring architecture to improve decision making with a
“rule learning” prototype method. Test simulations on a real robot, in Section 6.3.2,
26

show that explanations can be used to explore new environments and learn reasonable
behaviors.
1.3 Thesis Overview
Chapter 2 positions this thesis in the context of related research in the methodologies
and underlying technologies related to anomaly detection, knowledge representation,
explanation9, and introspection.
• Chapter 3 describes an ex post facto model-based reasoning methodology to
explain and summarize vehicle logs post accident.
• Chapter 4 introduces reasonableness monitors: a local sanity check that sup-
plements decisions with commonsense reasoning and rules.
• Chapter 5 describes a sensor interpreter to produce qualitative descriptions from
LiDAR traces.
• Chapter 6 introduces an algorithm for incorporating feedback into an explana-
tory monitor.
• Chapter 7 describes Anomaly Detection through Explanation (ADE): a system-
wide architecture that can reconcile inconsistencies amongst subsystems.
Chapter 8 reviews and defines the types of machine explanations that important
to society. I also discuss the ethical implications of artificial intelligence, and argue
that explanations can mitigate societal fears of intelligent machines. I conclude in
Chapter 9 by reviewing the contributions of this dissertation, and proposing future
research directions and applications.
9In Chapter 8, I exclusively review the eXplanatory artificial intelligence (XAI) literature, in-cluding recommendations for societal explanations.
27

28

Chapter 2
Background
“A lot can go wrong when we put blind faith in big data.”
– Cathy O’Neil
In this chapter, I provide a literature review of relevant work in anomaly detection,
diagnostics, knowledge representation and reasoning, and multi-agent systems. I also
review previous work on integrating perception and reasoning, which is a motivating
application of my thesis work.
In subsequent chapters, I review the specific components of self-driving vehicles.
I review research ideas from the philosophy literature in Chapter 8.
2.1 Anomaly Detection
Anomaly detection is a data mining process that finds rare or mysterious instances.
It is used to identify fraud [143], intrusion [130], and event detection in sensor net-
works [4]. In machine learning, when there is a large amount of training data available,
these methods are either “supervised” (the training data has labels of anomalous or
non-anomalous) or “unsupervised” (the training data does not have labels). The ma-
jority of machine learning methods for anomaly detection are unsupervised, so that
methods look for instances outside of the distribution and/or trends in the train-
ing data. The most popular and successful of these unsupervised methods include
29
density-based techniques that detect outliers by clustering together similar points.
This includes k-nearest neighbor [118, 139, 10], local methods [28, 202, 45], cluster-
analysis detection [94, 34] and isolation forests [141, 142].
Similar approaches have been proposed for high-dimensional data [260], where
there are so many dimensions of the data, that it may be unscalable to cluster (or
group) similar data points together. When the data is too large or high-dimensional
to process at once, some methods project the data onto a subspace [121, 108], or use
tensor processing techniques [59], or interpret correlations [123]. Anomaly data may
also be available as a graph, which leads to a multitude of graph-based techniques [5].
Other approaches detect anomalies by creating scores or formulas that can point
to “atypical” data points or events. One score is an “interestingness” score [71], which
is regardless of the kind of patterns being mined. More precise logic-based techniques
can find anomalies that do not satisfy some predicate for typical behavior. In real-
world environments (driving, robotics, network intrusion, etc.) the exact claims may
not be precise. Therefore less precise, approximate reasoning like fuzzy logic [36]
allows inference on less well-defined topics.
And if there is a multitude of data, processing power, and models available, en-
semble techniques combine multiple models for better anomaly detection results [258,
259]. This includes feature bagging [131, 171] to find the features most correlated to
fraud, or score normalization [122, 201].
2.1.1 Diagnostics
In model-based reasoning, anomaly detection is referred to as diagnostics. In diagnos-
tics, it is assumed that there is little or no training data, and so finding errors aligns
with detecting “symptoms” that align with an expert model. This is performed with
either consistency-based diagnosis [188, 52] that finds diagnoses that are consistent
with symptoms. Or detecting novel faults by suspending constraints [48, 70], which
makes no presumption about faulty subsystem behavior.
30

2.1.2 Monitoring
In diagnostics, monitoring is used around plans (or goal states) and components to
anticipate failures. In a multi-step execution plan, causal-link monitoring consistently
checks rules and preconditions once the desired output is established for each step,
where these causal links can be qualitative [51] and input back into qualitative reason-
ing systems. If the monitoring system is examining actions, then action monitoring
can verify preconditions right before specific actions are executed, this is typically
done in RosPlan [35].
Once a symptom is detected, a system may want to repair itself. These types
of self-configuring [236] systems have a flexible representation that needs to uphold
some consistent design choices and principles. A self-configuring system may focus on
reconfiguring components modes [235], or have a meta-process that selects between
program choices [114] .
2.2 Knowledge Representation and Reasoning
A goal of my work is to create self-explaining mechanisms that are flexible and adapt-
able. This relies on using flexible representations of data, inspired by frame-based
representation, a formal ontology to reason about high-level concepts, and various
reasoning approaches that cater to multiple types of data. My research is focused on
representations that cater to uncertainty.
2.2.1 Frame-based Representations
Frames [157] are a typically symbolic representation that enable a system to reason
easily. Frames were derived from semantic networks [183], as a way to represent
memories and knowledge, especially for language. This extended into representing
language as these sorts of trans-frames or scripts [199], which reduced search space and
memory. This type of representation relies on a structure in subsumption hierarchies
like IsA [27] or a structured ontology.
31

2.2.2 Ontology
An ontology an organization of a concept (or domain) into relations: how differ-
ent concepts are related to the target concept. An ontology is a specification of a
shared conceptualization. Domain ontologies are specific to an application or domain,
whereas “upper” ontologies are domain-independent, more prevalent for the seman-
tic web [22] including the Web Ontology Language (OWL) [13], Friend of a Friend
(FOAF) [29], and Yago [216]. Some upper ontologies are the basis for commonsense
knowledge bases [57, 155].
2.2.3 Commonsense Knowledge and Reasoning
Commonsense knowledge is difficult to define. In the simplest terms, common-
sense knowledge consists of facts about the everyday world that are self-evident;
for example “lemons are yellow” or “animals can move.” Commonsense knowledge
bases [135, 212, 62] provide these sorts of intuitive statements. Whereas common-
sense reasoning models the human process of using these statements to solve problems,
like the Winograd Schema challenge [137]. Other more formal approaches [163] use
“event calculus” to reduce commonsense reasoning to first-order logic approaches.
2.2.4 Reasoning
In addition to commonsense reasoning, other types of classical reasoning approaches
cater well to finding anomalies. Hypothetical reasoning [98] is an extension of abduc-
tive reasoning [175], in which a hypothetical is deemed plausible by verifying each of
its logical consequences. Another approach to reasoning about uncertainties is to look
at analogies [72]: an inductive reasoning process that examines similar concepts to
understand new concepts. If we consider that humans understand new circumstances
by examining stories, then story-understanding [240] can be applied to understand
new scenarios in complex machines.
32

2.2.5 Cognitive Architectures
The types of mechanisms that I present in this thesis are complex cognitive architec-
tures. Cognitive architectures, first coined by Allen Newell [167], aim to understand
human intelligence by mimicking the human reasoning process in a computer model.
An implementation of a cognitive architecture is SOAR [125], which is still prevalent
today. Society of Mind [158] is a theoretical framework for a cognitive architecture,
along with its successor, The Emotion Machine [160], which incorporates ideas from
theory of mind.
2.2.6 Theory of Mind
Theory of mind, or using insights from one’s thought-processes to understand that
of others is an important theory for anticipating behavior [7]. This is especially
important to anticipate complex situations [117], which are prevalent in the self-
driving vehicle domain.
2.3 Multi-agent Systems
Multi-agent systems [218] are a complex system, which are composed of multiple in-
teractive agents. This is similar to my organizational approach of a complex system
as being made of multiple subsystems that interact via explanations. Another vari-
ant of multi-agent systems is modeling collective behavior [232], where the observed
environment is used to construct rules for a decentralized system of robots.
2.4 Integrating Perception and Reasoning
The integration of perception, recognition, and higher reasoning capability is a hall-
mark of human intelligence modeling–from Gestalt psychology [153] and early ma-
chine vision systems [190, 228] to cutting-edge standardized models of human cogni-
tion [124]. Human cognition integrates perception and “pure” object recognition with
33
reasoning and symbolic manipulation. Humans are able to process sensory inputs
both “top-down” and “bottom-up”1
Some cognitive theories emphasize the influence of symbolic processes on per-
ception. Scientific evidence supports the view that normal perceptual experiences
may rely more on knowledge than modes of sensation [226]. Winston’s [239] “in-
ner” language hypothesis says that humans construct complex symbolic descriptions
of situations, knowledge, and events; enabling humans to understand the world and
problem solve2. The development of reasonableness monitors is devoted to integrat-
ing subsystems that represent the “inner”, physical, non-linguistic representation and
reasoning domains of mental models [103] and imagery [176] that are theorized to be
distinct from humans’ “outer” language of familiar lexical items and linguistic forms.
1A top-down processing approaches starts from the general and moves to the specific. A bottom-up processing approach starts from the specific and moves to the general.
2The strong story hypothesis inspired the idea of “story-enabled intelligence”: systems that canrecount their own story “exhibit intelligence of a higher order.” http://logical.ai/story/.
34

Chapter 3
Ex post facto Explanations
“...an adequate account that tells us all we want to know about explanations
in general must wait until prior problems have been solved.”
– Sylvain Bromberger in On What We Know We Don’t Know [30].
When autonomous systems malfunction, different stakeholders require a diagnosis
of the failures that led to the malfunction. For example, when autonomous vehicles
get into fatal accidents, as in the Uber self-driving car accident1, it is important to
diagnose why the malfunction occurred quickly and precisely. When an accident hap-
pens in a car that is co-driven by a person and a machine, police officials, insurance
companies, and the people who are harmed will want to know who or what is ac-
countable for the accident. In this chapter, I present a methodology to analyze and
understand vehicle logs after-the-fact.
I present two model-based reasoning systems, which are initialized with measured
data from a simulation environment. The qualitative mechanical model diagnoses spe-
cific mechanical component failures. The semi-qualitative physics model diagnoses
unusual physical forces on the vehicle, which can lead to erratic driving behavior.
The models are able to abstract information from data to produce concise and under-
standable explanations of vehicle actions–a summary that is simple enough for users
1A self-driving Uber test vehicle struck and killed a pedestrian in March 2018 [151]. For morecases, refer to this dynamic list of self-driving vehicle fatalities: https://en.wikipedia.org/wiki/List_of_self-driving_car_fatalities
35

to understand. This chapter was previously published as a conference proceeding [75].
3.1 Introduction
Modern automobiles are highly sophisticated, complex, and interconnected electro-
mechanical systems. However, the existing tools for signaling errors are imprecise.
For example, the “check engine” light indicates the plausible existence of problems
without providing any justification.
As society moves towards semi-autonomous and, ultimately, fully autonomous ve-
hicles, there is a need for vehicles to be capable of producing explanations of their
behavior and internal state. These explanations will help in performing maintenance,
analyzing driver behavior, and determining accountability for problematic actions.
With the addition of sensors and software, pinpointing problems–even simple ones like
low tire pressure, becomes difficult; due to the increased range of potential causes. In
semi-autonomous driving, understanding the relative contributions of humans and/or
mechanisms to an unwanted event, like a car accident, will be important for failure
analysis and determination of accountability. Creating the ability for an autonomous
agent to provide a coherent explanation of its own behavior is an essential prereq-
uisite to building the necessary trust and confidence in such agents. If autonomous
agents cannot reason about their decisions, then they will not be able to correct
themselves, especially when things go wrong. This chapter explores the development
of a methodology for developing ex post facto, i.e., after-the-fact, explanations from
vehicle logs.
3.1.1 Definition of Vehicle Specific Components
When I refer to “vehicle” logs, I am referring to a Controller Area Network (CAN bus)
log. This internal network of the vehicle is decentralized: it allows Electronic Control
Units (ECUs), the embedded controller of one or more of the electrical systems or
subsystems in a vehicle, and devices to communicate their state amongst each other
without a host computer. These communications are recorded on a CAN bus log,
36

which is mimicked in the simulated CAN bus log. For each ECU component, a
“snapshot” is recorded at each time stamp. This includes the CAN bus code and
“parameter information,” which varies between ECU components. For the braking
ECU, it is binary: 0 (brakes not engaged) or 1 (brakes engaged). But for other ECUs,
like drive mode or wheel speeds, the parameter information is a list. The difficulty is
providing a common language to process these parameters into a meaningful, symbolic
story.
Since the CAN bus logs record ECU data at various levels of detail, I processed
and represented CAN bus data in terms of qualitative descriptions. These qualitative
descriptions, e.g., inc (increasing) or dec (decreasing), are a description of the first
derivative change. In Section 3.2.2, I define an extended definition of qualitative terms
based on the qualitative algebras first proposed by Johan de Kleer [49]. I apply abduc-
tive reasoning: I start from an observation or result to deduce the likely explanation
for the observations, using a model of the vehicle system to find (mis)behaviors. My
method provides understandable, symbolic, simulated vehicle log descriptions.
3.2 Method Overview
My system is a three-component process and methodology. The system is visualized
in Figure 3-1.
1. Data processing produces “intervals of interest,” in Section 3.2.1.
2. Models describe the expected behavior of the underlying vehicle system, in Sec-
tion 3.2.3. The models are initialized with “intervals of interest.”
3. Reasoning explains an “interval of interest” by running the models, and exam-
ining the outputs and dependencies in Section 3.2.7.
I applied this methodology to a simulated vehicle. I show a series of test simula-
tions that show the ability of the methodology to explain skids in Section 3.3. In the
next sections, I review the technical specifications and artifacts.
37

Figure 3-1: Ex post facto explanation generation process
3.2.1 Data Generation and Analysis
My method relies on collecting data from a plausible vehicle simulation. My col-
laborators and I developed a basic vehicle simulation using the Unity game engine
[75]. The simulated vehicle has physical properties like tire friction and basic vehicle
internals, at a level of fidelity sufficient to test my analysis pipeline.
Data Log Generation
The vehicle simulation, in response to user control of a simulated vehicle, produces
data traces corresponding to quantities that are tracked by commonly installed vehicle
sensors communicating on a typical vehicle CAN bus, like accelerometer data, wheel
rotation rates, and driver input state. To generate the necessary data corresponding
to an accident scenario, I built a model highway interchange in the simulation, and
then drove the simulated vehicle in a variety of accident regimes. A mock up of this
highway interchange is in Figure 3-2.
Figure 3-2 shows a car entering an oversteering skid on a freeway off-ramp. A
skid occurs when the vehicle tires lose traction on the road surface. An oversteering
skid occurs when the rear wheels of the vehicle lose traction but the front wheels do
not. An oversteering skid can occur when brakes are applied during an otherwise
controlled turn while the vehicle is moving at high velocity resulting in loss of friction
38

Figure 3-2: A difficult driving scenario inspired by the off-ramp of Route 95 in Mas-sachusetts. The yellow star signifies the starting point, and blue arrows show thevehicle’s ideal trajectory.
39
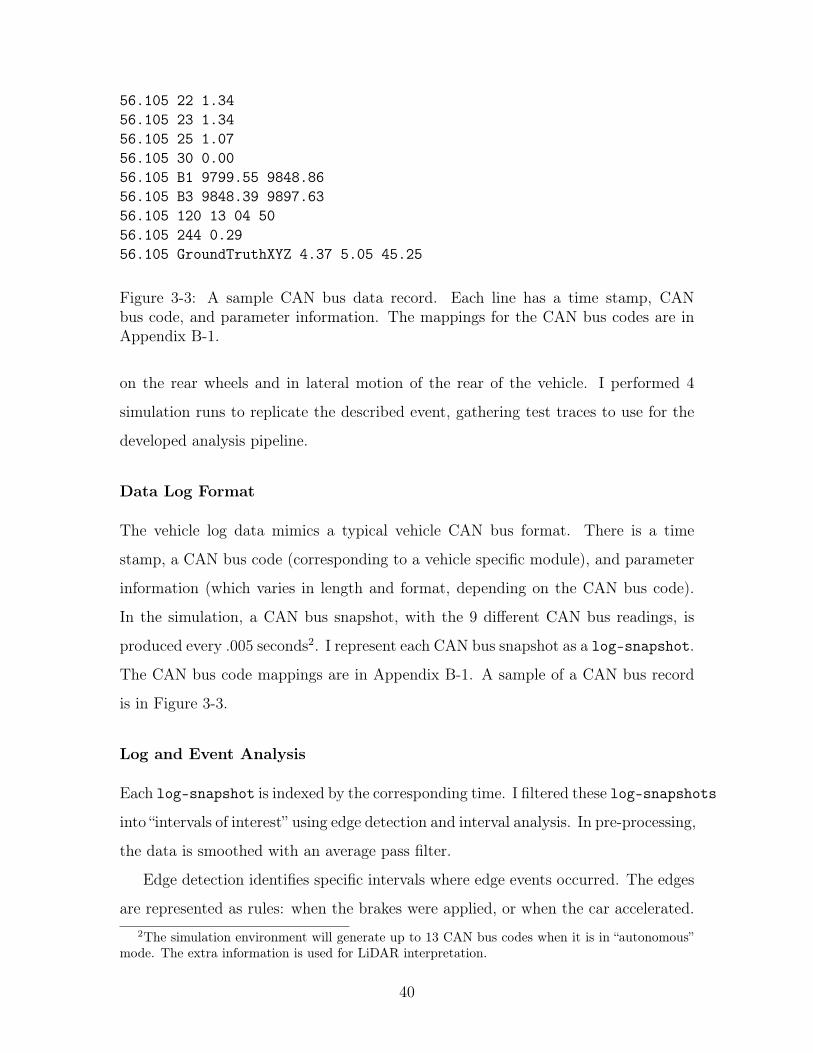
56.105 22 1.3456.105 23 1.3456.105 25 1.0756.105 30 0.0056.105 B1 9799.55 9848.8656.105 B3 9848.39 9897.6356.105 120 13 04 5056.105 244 0.2956.105 GroundTruthXYZ 4.37 5.05 45.25
Figure 3-3: A sample CAN bus data record. Each line has a time stamp, CANbus code, and parameter information. The mappings for the CAN bus codes are inAppendix B-1.
on the rear wheels and in lateral motion of the rear of the vehicle. I performed 4
simulation runs to replicate the described event, gathering test traces to use for the
developed analysis pipeline.
Data Log Format
The vehicle log data mimics a typical vehicle CAN bus format. There is a time
stamp, a CAN bus code (corresponding to a vehicle specific module), and parameter
information (which varies in length and format, depending on the CAN bus code).
In the simulation, a CAN bus snapshot, with the 9 different CAN bus readings, is
produced every .005 seconds2. I represent each CAN bus snapshot as a log-snapshot.
The CAN bus code mappings are in Appendix B-1. A sample of a CAN bus record
is in Figure 3-3.
Log and Event Analysis
Each log-snapshot is indexed by the corresponding time. I filtered these log-snapshots
into “intervals of interest” using edge detection and interval analysis. In pre-processing,
the data is smoothed with an average pass filter.
Edge detection identifies specific intervals where edge events occurred. The edges
are represented as rules: when the brakes were applied, or when the car accelerated.2The simulation environment will generate up to 13 CAN bus codes when it is in “autonomous”
mode. The extra information is used for LiDAR interpretation.
40

(define (isBraking? snapshot)(eqv? (log-snapshot-brake snapshot) 0))
(define (isAccelerating? snapshot)(eqv? (log-snapshot-accel snapshot) 'inc))
Listing 1: Braking and accelerating rules for edge detection. Note that braking isindicated by a 0 reading. The inc reading indicates that the reading has increasedbetween the the last snapshot and the current snapshot.
X before Y XXX YYY
X equals Y XXXYYY
X meets Y XXXYYY
X overlaps Y XXXYYY
X during Y XXXYYYYY
X starts Y XXXYYYYY
X finishes Y XXXYYYYY
Table 3.1: The complete set of the possible relationships among time intervals, asdetermined by James F. Allen [6].
These specific edge examples are in Listing 1, and a comprehensive list of edge rules
are in Appendix B-2. I filtered the data to find intervals that adhere to these edge
detection rules over successive log-snapshots. This results in braking intervals,
accelerating intervals, right turning intervals, etc. I filter the edge event intervals
that satisfy the temporal relationship description of particular events. For example,
once I have braking intervals, I want to find the intervals within that where the vehicle
is turning, or where the vehicle came to a complete stop. I represented these events
as a combination of intervals using Allen’s Interval Algebra [6] shown in Table 3.1 to
find intervals that work together to make an “interval of interest.” An example is in
Table 3.2. I use these intervals of interest as input to the models, which form a story
of what happened during a particular time span.
41

18:10:25.333 GPS: Heading 321.16, Speed 60.3mph18:10:26.500 Operator: Brake 0.35, Steer 5.018:10:26.560 Driver assist: Brake 0.418:10:27.867 GPS: Heading 353.84, Speed 52.1 mph18:10:29.970 Operator: Brake 0.90, Steer 9.318:10:30.010 Wheel Rate Monitor: Skid18:10:30.040 GPS: Heading 28.27, Speed 0.0mph18:10:30.070 Wheel Rate Monitor: Skid18:10:30.170 Operator: Brake 0.91, Steer 6.618:10:32.933 GPS: Heading 129.08, Speed 0.2mph18:10:35.140 Operator: Brake 0.93, Steer 0.018:10:35.467 GPS: Heading 121.52, Speed 0.0mph18:10:38.670 Stopped
Table 3.2: Summary of the “intervals of interest” accumulated during an over-steeringskid.
3.2.2 Qualitative Algebras
I define a set of qualitative algebras3 to explain my vehicle scenarios. My first and
most used algebra, the qualitative increment, was first defined in de Kleer’s PhD the-
sis [49]. However, in my vehicle models, I also needed qualitative actions: tightening
and loosening, and descriptions of vector forces on the vehicles’ wheels. Therefore,
I developed a set of four qualitative algebras to represent the descriptions of me-
chanical components and force vectors: qualitative increment, action, direction, and
magnitude. The algebras are described in Appendix A.1.
3.2.3 Models
I constructed two models, which combined with generated data, provide human-
readable explanations of vehicle behavior. The fully qualitative mechanical model has
implicit rules that describe the relationships among the mechanical components of the
vehicle. For example, when the tire brake pads are engaged, what other mechanical
components are affected? The code for these constraints is shown in Listing 2, which3A qualitative algebra is a description of change with algebraic properties like addition, subtrac-
tion, multiplication, etc. It is usually used to represent continuous quantities of the world, suchas space, time, and quantity with little “precise” information. For example, representing time withevents: event a occurred “before” event b, event b occurred “after” event a, etc. These types ofrepresentations can support reasoning, even without precise details.
42

shows the causal properties of tire component of mechanical model. Consider that
pressure is the pressure of air in the tire. The following are facts:
1. With low air tire pressure (or decreasing pressure), the axle is closer to the road:
and the radius of rotation is reduced, causing the rotation rate to increase.
2. This was inspired by the idea that some cars have systems that warn you when
your tire pressure is low. This works by measuring the rotation rate of the tires.
3. With under-pressured tires, the speedometer will display a value greater than
your actual speed.
And these facts are expressed qualitatively in Listing 2, so that tire pressure is the
inverse of the qualitative value of the rotation rate. This builds on other “common
sense” facts: when the tire brake pads are engaged, the wheel rotation rate is certainly
decreasing. However, if the wheel rotation rate is decreasing, that does not necessarily
imply that the tire brake pads were engaged. The vehicle could be going uphill, or
the vehicle could slowing down due to the force of friction on the tires.
To provide detailed explanations of why a particular event occurred, I developed
a semi-quantitative physics-based model which quantitatively calculates forces on
the vehicles wheels and combines that information with measured data to provide
qualitative explanations. Both models are written in MIT/GNU Scheme and rely on
the existing propagator system, described in Section 3.2.4.
3.2.4 Vehicle Modeling with the Propagator System
The Art of the Propagator System is a qualitative reasoning system that maintains
dependencies that can be used to construct an explanation of how a command to the
effectors or an intermediate value was determined. Part of those dependencies are
causal chains that come from the expectations determined by the model, and some
will be constraints coming from recorded data. The propagator system [184] can
merge measurements with deductive reasoning and track dependencies. Propagators
43

(define (tire-object diameter-input pressure #!optional given-name)(physob (list diameter-input)
(lambda ()(let-cells (rotation friction (diameter diameter-input))
(copier pressure friction)(inverter pressure rotation)(define (insides-name message)
(case message((diameter) diameter)((pressure) pressure)((rotation) rotation)((friction) friction)(else #f)))
insides-name))(if (default-object? given-name)
`(,type ,(map name diameter-input))given-name)))
Listing 2: Propagator code that shows the causal properties of a tire object. The tirepressure is the inverse of the qualitative value of the rotation rate.
implement a way to build distributed, concurrent computational models intercon-
nected by shared cells. Each propagator continuously examines its neighbor cells
adding information to some, based on deductions it can make from the information
in others.
Consider, for example, the block diagram of the throttle control system in Figure 3-
4. A qualitative model of this system can be made from this diagram. Each wire
can be modeled by a propagator cell that holds information about the signals on that
line. Each block in the diagram can be modeled by a propagator that constrains
information contained in the cells that model the wires incident on it. Although the
diagram indicates that information flows in specific directions, propagators can make
deductions about inputs from information about outputs as well as in the indicated
direction.
In any particular situation the models and the data will converge to some ap-
proximate agreement if the models are good enough. There will be many points of
agreement where the data will be what is expected and there may be points of dis-
44

Figure 3-4: A diagram of the mechanical model that describes the interactions be-tween the vehicle’s mechanical parts.
agreement. Points of disagreement indicate inadequacies of the models or failures of
some part of the real mechanism to do what is expected of it.
3.2.5 Qualitative Mechanical Model
The qualitative mechanical model describes the interactions among the vehicle’s me-
chanical parts. The mechanical components are modeled from the diagrams and
descriptions in an automotive handbook [187]. Currently, the mechanical model is
relatively simple, only modeling the braking system, steering system, and engine as
shown in Figure 3-4. The sensor output is not yet implemented in my system. While
my model is a simplification of real-life behavior of a car, its lower complexity enables
intuitive explanations, which users can understand. Therefore, the rules of the system
45

fric>onfric>onnormal normal
weight
iner>alforce
iner>alforce
centrifugalforce
**Intheframeofreferenceofthecar**
accelera>on
fric>on
fric>on
fric>on
fric>on
accelera>on
Figure 3-5: The forces that are calculated and used in the semi-quantitative physicsmodel. Shown from the lateral and top-down view.
are intuitive, and the system does not require complex equation.
The mechanical model is initialized with a specific time interval, where each data
value (e.g., brake pad pressure change, steering change, etc.) is a qualitative incre-
ment, representing the qualitative change during that time span. The model is then
run by propagating the data-initialized qualitative values through the system. Spe-
cific model values can be queried using explain-readable and inquire-readable,
described further in Section 3.2.7.
3.2.6 Semi-quantitative Physics Model
The physics model calculates forces on the vehicle’s wheels, and then constructs causal
chains; some coming from expectations determined by the model, and some coming
from recorded data. Unlike the mechanical model, which is initialized by recorded
data, and then queried for values and explanations, the physics model is initialized by
the log data, but also uses that log data values to provide evidence in its deductions.
The forces that are calculated and then explained are shown in Figure 3-5. Recall,
this model is a simplification, so that I can use rules of naive physics [92], without
solving complex equations.
46

The models are used at the same time. Therefore, the physics model is especially
important when the vehicle’s actions are unexpected and not interesting from the
mechanical model standpoint. For example, if a skid occurs, the mechanical model
will only be able to describe the wheel rotation rates in terms of qualitative increments,
which does not provide the explanation for a skid. Instead, using the physics model,
a skid can be identified by the rear or front wheels losing traction. The wheels lose
traction by a decrease in normal force.
3.2.7 Reasoning
My system outputs readable explanations from the dependency tracking elements
of the propagator system. Most of these explanations are rule-based: outputting a
more readable version of an explain command, which is implemented in the propa-
gator system. The propagator has two explanatory functions: inquire and explain.
The inquire command displays the immediate values of the inquired cell, and the
explain command recursively displays every dependency in that cell’s inquiry in
the system. I implemented two other explanatory functions, inquire-readable and
explain-readable, which display the dependencies tracked through the system in
more readable language. For example, the inquire and explain display the cell’s de-
pendent functions and values without explaining them, whereas inquire-readable
and explain-readable explicitly cite the reasons, inputs, outputs, premises, and
displays the cell value in readable form.
It is important to note the distinction between deductions and expectations. In
my work, I deduce based on a casual chain of expectations. My assumptions are
certain; I expect the mechanical devices within the car to act a certain way, and at
the same time, I can expect the physics of the vehicle to act a certain way.
3.3 Experiment Results
The experiments displayed in this section, although not all inclusive, highlight the
more “interesting” events that my system can detect and explain.
47

3.3.1 Examples from the Mechanical Model
The mechanical model propagates observed data through the different mechanical
subsystems of the vehicle. The model is initialized by the observed data, and then
those values are propagated through the system appropriately. Consequently, the
user is able to query specific components of the system, and a readable explanation
can be displayed through the appropriate command.
I provide two examples below from the same interval in a normal driving scenario
where the vehicle is braking. During a braking interval, I expect that the anti-lock
brakes are engaged (so that the hydraulic brake pressure is increasing and the wheel
rotation rates are decreasing). In the first call to inquire-readable, I check the
hydraulics on the antilock-brakes are increasing. The model also finds the premises, or
root causes for this change: there is a braking change in that interval (from the method
brake-change-from-initialized-interval)). In the second call, I examine the
same interval and find that the wheel rates (specifically the left-front wheel) is decreas-
ing. Further, the model is able to pinpoint why this change happened; by pointing to
the specific interval event change: wheel-change-from-initialized-interval.
>> (inquire-readable
(hydraulic antilock-brakes))
(hydraulic antilock-brakes) has the value
increasing change
Reason: function (+)
inputs: front-brakes-pressure
(booster antilock-brakes)
outputs: (hydraulic antilock-brakes)
Premises:
(brake-change-from-initialized-interval)
>> (inquire-readable left-front-wheel)
left-front-wheel has the value
48
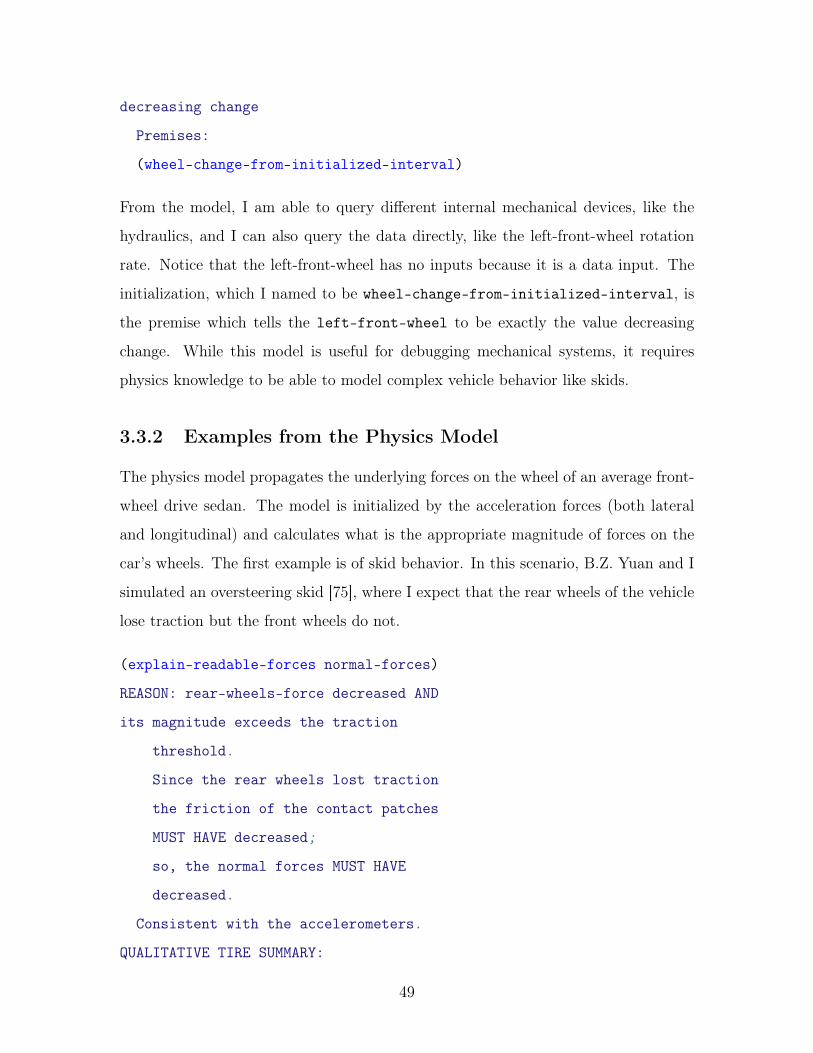
decreasing change
Premises:
(wheel-change-from-initialized-interval)
From the model, I am able to query different internal mechanical devices, like the
hydraulics, and I can also query the data directly, like the left-front-wheel rotation
rate. Notice that the left-front-wheel has no inputs because it is a data input. The
initialization, which I named to be wheel-change-from-initialized-interval, is
the premise which tells the left-front-wheel to be exactly the value decreasing
change. While this model is useful for debugging mechanical systems, it requires
physics knowledge to be able to model complex vehicle behavior like skids.
3.3.2 Examples from the Physics Model
The physics model propagates the underlying forces on the wheel of an average front-
wheel drive sedan. The model is initialized by the acceleration forces (both lateral
and longitudinal) and calculates what is the appropriate magnitude of forces on the
car’s wheels. The first example is of skid behavior. In this scenario, B.Z. Yuan and I
simulated an oversteering skid [75], where I expect that the rear wheels of the vehicle
lose traction but the front wheels do not.
(explain-readable-forces normal-forces)
REASON: rear-wheels-force decreased AND
its magnitude exceeds the traction
threshold.
Since the rear wheels lost traction
the friction of the contact patches
MUST HAVE decreased;
so, the normal forces MUST HAVE
decreased.
Consistent with the accelerometers.
QUALITATIVE TIRE SUMMARY:
49

The left front normal force decreased.
The right front normal force increased.
The left back normal force decreased.
The right back normal force decreased.
The above explanation was automatically generated by explaining the normal forces
during an oversteering skid interval. The more detailed explanations are generated by
aggregating quantities and qualitative reasons that are set after running the physics
model.
(explain-readable-forces normal-forces)
REASON: right-wheels-force increased AND
its magnitude is within traction threshold.
Since the right wheels are gaining
traction
the friction of the contact patches
MUST HAVE increased.
so the normal forces MUST HAVE
increased
So the car is turning left safely.
Consistent with the steering
and accelerometers.
QUALITATIVE TIRE SUMMARY:
The left front normal force decreased.
The right front normal force increased.
The left back normal force decreased.
The right back normal force increased.
The above explanation was automatically generated by explaining the normal forces
during a left turn.
50

3.4 Applying this Methodology
The results I presented are for specific vehicle models on a specific simulated data.
In this section I describe the requirements to apply this methodology to a new ap-
plication. This methodology is designed for complex systems (systems with multiple
parts) and time-series data.
1. Data: A data schema has to be defined, like the log-snapshot that I used
for the simulated vehicle data. Specific edge-detection rules need to be defined
(based on the data schema).
2. Models: The models have to be defined for each system. I have defined a number
of vehicle modules which can be re-used. For other applications, the complex
systems needs to be decomposed into separate propagators (corresponding to
each part), and cells (representing the shared communication between parts).
3. Reasoning: The reasoning process uses the data and defined models. The rea-
soning artifacts: explain, explain-readable, inquire, and inquire-readable
are applicable to other propagator models.
3.5 Related Work
There have been many contributions in the space of reasoning for qualitative change.
The term incremental qualitative (IQ) analysis was coined in Johan de Kleer’s PhD
thesis [49]. Incremental qualitatives represent quantities by how they change when
a system itself is changing. Incremental qualitatives are represented by four values:
increasing, decreasing, no change, unknown change. In his thesis, de Kleer describes
this qualitative algebra, which I extend in this work to represent different algebraic
operations. De Kleer and Forbus also wrote a book on efficient logic truth mainte-
nance systems (LTMSs) [61] to propagate constraints, however, it lacks the verbose
explanatory capability necessary for my system’s verbose goals.
Using back propagation to reason about complex behavior has also been well
studied in the field. Models that can merge measurements with deductive reasoning
51

and that can track dependencies are captured with propagators [184]. This language
is a way to build distributed, concurrent computational models, based on the idea that
computational elements, called propagators, are autonomous machines interconnected
by shared cells. Each propagator continuously examines its neighbor cells adding
information to some, based on deductions it can make from the information in others.
These models are implemented in MIT/GNU scheme with the propagator framework.
In vehicle specific modeling, Stuss and Fracci presented a qualitative model of a
vehicle braking system [214]. Their major contribution is a model-based automation
of failure-modes-and-effects analysis (FMEA), with the specific application to a ve-
hicle braking system. While their results do not include explanations, their model
motivated my own research. They are able to infer braking component behavior from
the models’ inputs, similar to the way that my models can infer changes. This chapter
is a more comprehensive application of the same process. As far as I know, this is
the first application of qualitative reasoning to provide explanations of complex and
comprehensive vehicle actions.
3.6 Limitations
One limitation of the system is that the physics and mechanical models are separate.
With a combined model, and more detailed sensor data, I could model more complex
physics over complex terrain. For example, for a turning radius and a friction coeffi-
cient for what speed will the car skid? And if we observe that the car is decelerating,
is this caused by the brakes, or by the hill or both? I developed a naive query lan-
guage to find edge cases, but a more sophisticated language is required for different
parts. Another limitation is that the CAN bus data is simulated. Simulated data
cannot represent all possible failures. Applying this methodology on a real vehicle
may be explored in future work.
The explanations presented in this chapter are static. To be used in a running
vehicle, my models would need to provide dynamic explanations. This would require
some optimization in order to be used in real time. But the qualitative deductions
52
from the running logs might be used to improve the control strategies in vehicles with
significant autonomy. I explore the use of explanations to improve decision making
in Chapter 6.
3.7 Contributions
In modeling a system of a modern vehicle, I have really created a model of the “mind”
of a car. This is similar to the methodology in the Society of Mind [158]; a “modern”
vehicle is a system made up of lots of pieces that individually handle different tasks,
like anti-lock braking, power steering, and obstacle detection. Similarly, the human
mind can be thought of as a set of various pieces that do different jobs and speak very
different internal languages. My goal is to construct a model of a car mind made of
up different parts that can “share stories” with each other. I explore this idea in our
work so far in a limited setting with cells in a propagator-based system, where the
“sharing” of information is done via the propagator rules. I take this a step further
by applying these ideas to full-sized systems, in which the communicating parts are
entire electromechanical modules, and the stories shared with each other collectively
contain enough detail to permit reconstruction of adequate explanations of particular
phenomena.
But what happens when we cannot create models? Some of the best problem
solvers, like AlphaGo and Deep Blue, are impossible to model: they are opaque. They
cannot explain their actions, or justify their reasoning. In the next chapter, I propose
a solution for opaque subsystems, “reasonableness monitors,” an explanatory sanity
check that justifies decisions with commonsense knowledge and rules. This builds on
the key idea of this chapter: every agent is constantly developing a plausible story
about its neighbors.
53

54
Chapter 4
Reasonableness Monitors
“We can often enhance our ability to deal with a complex problem by adopting
a new language that enables us to describe (and hence to think about) the
problem in a different way, using primitives, means of combination, and
means of abstraction that are particularly well suited to the problem at hand.”
– The Structure and Interpretation of Computer Programs [3]
One component of a complex machine, such as a self-driving vehicle, can be an
opaque subsystem. Most of these opaque subsystems are machine learning models
that are tailored for a particular problem. When applied to unexpected scenarios in
critical domains, these models make fatal mistakes [11].
I present a sanity check for opaque subsystems: a monitoring framework that can
judge and justify whether the underlying opaque decision or action is reasonable or
not. This monitoring framework, called reasonableness monitors, can be customized
for different domains, since it utilizes a standard vocabulary and rule language. The
input to the monitoring system is the output from an opaque learning system: an
intended behavior, which is parsed into a common representation. The monitor uses
a reasoner to find the important concepts leading to contradictions between expected
behavior and anomalous behavior, which is tracked back to a constraint or rule.
The output of a reasonableness monitor is a human-readable explanation suc-
cinctly describing the core reasons and support for an intended behavior. The goal
55
of reasonableness monitors is to improve the performance of individual (i.e. local)
opaque subsystems, by performing a "last-pass" check for clearly unreasonable out-
puts. In this chapter, I contribute two implementations of reasonableness monitors.
1. An end-to-end prototype for machine perception [79, 74] in Section 4.2.
2. A generalized framework [78] in Section 4.3.
4.1 Introduction
When opaque subsystems make mistakes, we would like to know why the error oc-
curred. But diagnostic systems [53] require access and knowledge about the under-
lying mechanism, which may be implausible [149]: the underlying subsystem may be
uninterpretable (black-box), or inaccessible (proprietary or trade-secret). Therefore,
I monitor a subsystem’s output, assuming limited knowledge of underlying processing
or method.
How does this monitor ensure that the underlying subsystem is acting reasonably?
The monitor needs a lot of world knowledge. But that knowledge also needs to be
structured, so that the monitor can find the important concepts leading to unreason-
able behavior. The monitor is able to judge whether a behavior is reasonable or not
by tracking the behavior back to a constraint or rule. This relies on a rule language
for constraints/policies, ontologies for representing data/knowledge, and a reasoner
all leading to an explanation of reasonableness.
The ability to provide coherent explanations of complex behavior is important in
the design and debugging of such systems, and it is essential for societal confidence in
technology: explanations support reasoning, leading to the belief of competence and
integrity of algorithms.
4.2 Method Overview
I describe an end-to-end reasonableness monitor for machine perception. A machine
perception system, or an image captioning system, produces perception descriptions.
56

In this section, I refer to the input to a reasonableness monitor as a description.
4.2.1 Input Parsing
The input of the reasonableness monitor is a perceived scene description that contains
a subject (or actor) and a verb, at minimum. I used the Python NLTK part-of-speech
(POS) tagger [24] to tag each word of the description. I wrote a regular expression
parser which maps the POS tags to specific noun, verb and object phrases. The
parsing code is in Listing 3.
def parse_with_regex(words):tags = nltk.pos_tag(words)
parser = nltk.RegexpParser('''NP: {<DT|PRP$>? <JJ>* <NN|NNP|PRP>*} # NPP: {<IN|TO>} # PrepositionV: {<V.*>} # VerbPP: {<P> <NP>} # PP -> P NPAdv: {<RB|RBR|RBS>} # AdverbsVP: {<V V*> <NP|PP>*} # VP -> V (NP|PP)*''')result = parser.parse(tags)result.draw()return result
Listing 3: Regex parser for the end-to-end reasonableness monitoring system. Theresult.draw() command will display the parse tree. A sample parse tree is inAppendix B-4.
4.2.2 Representation: Conceptual Primitives
The parsed description is processed into abstract role frames. In the end-to-end repre-
sentation, I used Roger Schank’s Conceptual Dependency (CD) [198]. I chose Schank’s
representation because it represents physical acts in a universal, language-free con-
ceptual base. The CD primitives are also small in number, and only six “physical”
57
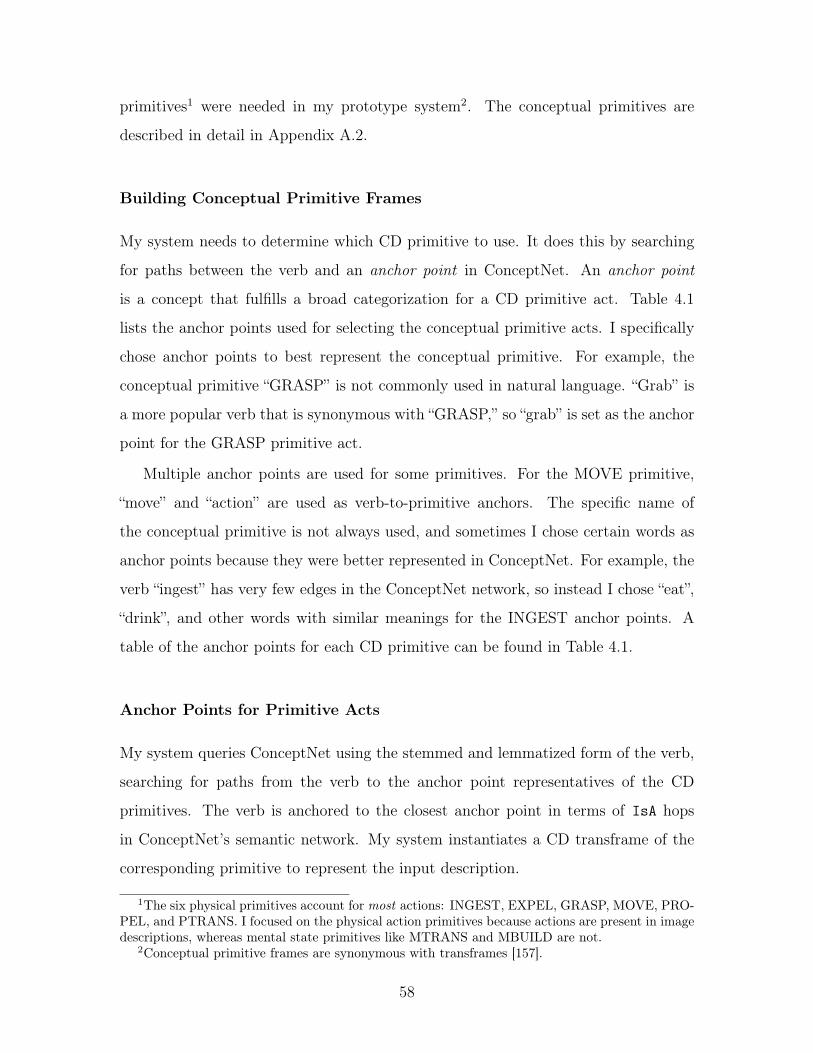
primitives1 were needed in my prototype system2. The conceptual primitives are
described in detail in Appendix A.2.
Building Conceptual Primitive Frames
My system needs to determine which CD primitive to use. It does this by searching
for paths between the verb and an anchor point in ConceptNet. An anchor point
is a concept that fulfills a broad categorization for a CD primitive act. Table 4.1
lists the anchor points used for selecting the conceptual primitive acts. I specifically
chose anchor points to best represent the conceptual primitive. For example, the
conceptual primitive “GRASP” is not commonly used in natural language. “Grab” is
a more popular verb that is synonymous with “GRASP,” so “grab” is set as the anchor
point for the GRASP primitive act.
Multiple anchor points are used for some primitives. For the MOVE primitive,
“move” and “action” are used as verb-to-primitive anchors. The specific name of
the conceptual primitive is not always used, and sometimes I chose certain words as
anchor points because they were better represented in ConceptNet. For example, the
verb “ingest” has very few edges in the ConceptNet network, so instead I chose “eat”,
“drink”, and other words with similar meanings for the INGEST anchor points. A
table of the anchor points for each CD primitive can be found in Table 4.1.
Anchor Points for Primitive Acts
My system queries ConceptNet using the stemmed and lemmatized form of the verb,
searching for paths from the verb to the anchor point representatives of the CD
primitives. The verb is anchored to the closest anchor point in terms of IsA hops
in ConceptNet’s semantic network. My system instantiates a CD transframe of the
corresponding primitive to represent the input description.
1The six physical primitives account for most actions: INGEST, EXPEL, GRASP, MOVE, PRO-PEL, and PTRANS. I focused on the physical action primitives because actions are present in imagedescriptions, whereas mental state primitives like MTRANS and MBUILD are not.
2Conceptual primitive frames are synonymous with transframes [157].
58

Table 4.1: The Conceptual Dependency (CD) “physical” primitives used, and theConceptNet anchor points used to bind them to incoming verbs.
CD Primitive Anchor Point(s)INGEST eat, drink, ingestEXPEL expelGRASP grasp, grab
MOVE-PTRANS move, action, goPROPEL propel, hit
Anchor Points for Primitive Roles
A different set of anchor points is used on the concepts filling the actor, object and
direction roles of the frame to determine if they satisfy or violate the frame’s con-
straints. I set constraints for the subject and the object, using the definitions of each
CD primitive frame.
The reasonableness monitor uses six anchor points for these roles: person, plant,
animal, object, vehicle, and weather. These anchor points were chosen for two reasons.
The first reason is that they fit the use case of autonomous vehicles. The second, more
significant reason is that each anchor point is broad enough to include a variety of
items, but just restrictive enough so that each anchor point has different properties
that allow it to perform certain actions.
For example, an animal can move on its own, and thus it can serve as the actor
role in a MOVE-PTRANS CD transframe, but an object cannot move on its own,
unless it is a vehicle. I assume that vehicles are controlled by humans and therefore
they can move, so I also have an anchor point so that cars or other automobiles will
not be categorized as objects, but as vehicles specifically.
Primitive Act Constraints
All physical primitive acts are subject to constraints that can be applied to the actor,
object, and direction cases of the frame to determine reasonableness. For all of these
primitives:
59

Table 4.2: List of ConceptNet anchor points used for actor and object roles in theCD transframe, and constraints on where a concept may reasonably serve in the role.
Anchor Point Actor Constraints Object Constraintsperson EXPEL, GRASP, INGEST, MOVE, PROPEL GRASP, MOVE, PROPELanimal EXPEL, GRASP, INGEST, MOVE, PROPEL GRASP, INGEST, MOVE, PROPELplant none GRASP, INGEST, MOVE, PROPELobject GRASP GRASP, INGEST, MOVE, PROPELplace none none
weather PROPEL noneconfusion PROPEL nonevehicle EXPEL, GRASP, INGEST, MOVE, PROPEL MOVE, PROPEL
• The actor must be an “animate” object or thing capable of
1. making other objects move (in the case of MOVE, INGEST, EXPEL).
2. moving or applying a force in order to GRASP another object (in the case
of GRASP).
3. applying forces to other objects (in the case of PROPEL).
• The object must be a physical object, thing, substance, or person.
• The direction case should represent a direction in reference to a physical object
or a physical location or place.
There are several additional constraints for particular primitive frames and the com-
plete constraints for actor and object cases of the CD primitives are shown in Ta-
ble 4.2. Based on its definition, each primitive imposes constraints on the types of
anchor points that the subject and object can be categorized as. In order for the
statement to be reasonable, both the subject and the object must share an edge with
one of their respective permitted anchor points. If either of them do not share any
edge with the permitted anchor points, there is a contradiction and the statement is
deemed unreasonable.
For example, in the description: “a mailbox crosses the street”, “mailbox” violates
the constraint that the actor in the MOVE primitive be animate. Taking another
60

example, for the statement “A man pushes the wind,” my system creates a PROPEL
primitive, and “man” will be categorized as a person anchor point, which fits the
subject constraint. However, no edge exists between any of the permitted anchor
points and the object, “wind”, because wind is not a thing (a person, animal, vehicle,
or object). Therefore the statement will be deemed unreasonable.
Compound Primitive Frames
A reasonableness monitor can also construct a Conceptual Dependency transform
using multiple primitives. For example, in the description “Lisa kicked the ball,”
there are two primitive acts. Firstly, Lisa applies a force (PROPEL), and secondly,
the ball is moved (MOVE-PTRANS). Although my system cannot automatically
decompose this sentence into compound primitive frames, I hard-coded select verbs
to be compound by default (instead of using ConceptNet or anchor points), so that
kick decomposes into a PROPEL and MOVE-PTRANS. The resulting justification
does not change, but the explanation is more verbose [79].
Establishing Context
It is possible for the context of a sentence to change its reasonability. For example,
weather may change the reasonability of a statement, as it can easily change the CD
primitive chosen. To illustrate, I refer to the example: “a mailbox crossed the street.”
This is deemed unreasonable since “cross” is a MOVE-PTRANS type and a mailbox
is an object, which conflicts with the actor constraints of MOVE-PTRANS. If instead
the description were “a mailbox crossed the street in a hurricane,” then the description
becomes more reasonable. An outside force, such as a hurricane, can move objects,
which corresponds to the definition of PROPEL. Therefore, the CD primitive frame
becomes a PROPEL rather than MOVE-PTRANS. Since the mailbox satisfies the
constraints for PROPEL, this statement is now classified as reasonable.
My system also checks for prepositional phrases as added context for establishing
reasonableness. When the sentence is parsed, prepositional phrases are identified and
stored as contexts which are additional evidence in the CD primitive structure. In a
61

case like “in a hurricane,” the noun phrase within the prepositional phrase is bound
to another anchor point, in this case “hurricane”. There are also anchor points for ex-
treme conditions that are hard coded, where ConceptNet is not used, i.e., hurricanes,
earthquakes, tornadoes, and floods. In the reasonableness checking phase, the moni-
tor also examines this context to determine if the additional context can ameliorate
a previously unreasonable description.
4.3 Adaptable Implementation
In this section, I describe an adaptable implementation of reasonableness monitors. I
show results on two use cases: descriptions of perception (which could be generated
from a machine learning scene understanding systems), and vehicle plans (from an
autonomous vehicle planning system, which could be proprietary). I describe how to
apply this framework to other domains in Section 4.5. A schematic of the reasonable-
ness monitor as an adaptable framework is in Figure 4-1.
4.3.1 Log Generation and Ontology
In the adaptable implementation, I require that the log, or data, is constructed in
RDF, which is a World Wide Web Consortium (W3C) standard3. RDF allows for
data descriptions and relationships between data in terms of triples4. The RDF
log contains the system state in terms of symbolic triple relations. An example
RDF log is in Listing4. It contains the subject, predicate and object of the input
description, and relevant descriptions aggregated from the commonsense database.
This aggregation utilizes RDFS (the RDF Schema), a semantic extension of RDF,
allowing for additional mechanisms for describing groups of related resources and the
relationships between these resources.
For perception, I generate the RDF log for a description by parsing for relevant
concepts. From the input of a natural language description, I use a regex parser in3RDF Documentation: https://www.w3.org/TR/rdf-schema/4Triples suffice for the reasoning in this chapter. Note that a problem with RDF is that you
cannot have information that refers to another triple. In Chapter 7, I use triples with added indexes
62

Figure 4-1: The system diagram schematic of a reasonableness monitor as an adapt-able framework.
Python to extract the noun phrase, verb phrase, context information (prepositional
phrases) to identify the actor, object, and action of the description. The development
of an ontology is incorporated with the process of developing the log data. For this
perception description use case, I develop a set of anchor points to extract common-
sense knowledge from ConceptNet, and primitive actions represented as a conceptual
dependency primitives. This conceptual dependency primitive will be used to con-
struct rules, with the actor, object, and context information as input. An example
of a parsed description represented as an RDF log is in Listing 4. An example of an
RDF log for a vehicle sample is in Listing 19 in Appendix B.5.2.
For vehicle planning, the process is extended with the same parsing process, the
representation is extended to include vehicle primitive actions like yield, move (with
speed and direction), stop and turn. Context is also extended to cover external factors
that are specific to vehicle planning like stop lights, pedestrians, and weather.
63
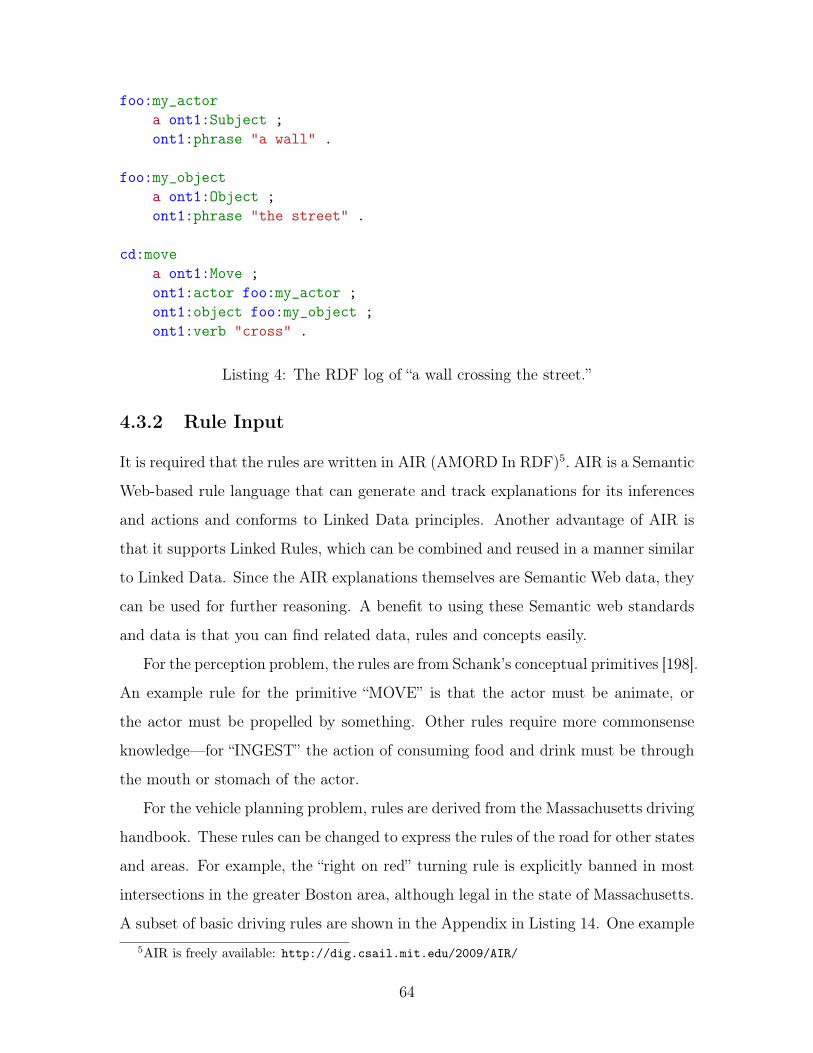
foo:my_actora ont1:Subject ;ont1:phrase "a wall" .
foo:my_objecta ont1:Object ;ont1:phrase "the street" .
cd:movea ont1:Move ;ont1:actor foo:my_actor ;ont1:object foo:my_object ;ont1:verb "cross" .
Listing 4: The RDF log of “a wall crossing the street.”
4.3.2 Rule Input
It is required that the rules are written in AIR (AMORD In RDF)5. AIR is a Semantic
Web-based rule language that can generate and track explanations for its inferences
and actions and conforms to Linked Data principles. Another advantage of AIR is
that it supports Linked Rules, which can be combined and reused in a manner similar
to Linked Data. Since the AIR explanations themselves are Semantic Web data, they
can be used for further reasoning. A benefit to using these Semantic web standards
and data is that you can find related data, rules and concepts easily.
For the perception problem, the rules are from Schank’s conceptual primitives [198].
An example rule for the primitive “MOVE” is that the actor must be animate, or
the actor must be propelled by something. Other rules require more commonsense
knowledge—for “INGEST” the action of consuming food and drink must be through
the mouth or stomach of the actor.
For the vehicle planning problem, rules are derived from the Massachusetts driving
handbook. These rules can be changed to express the rules of the road for other states
and areas. For example, the “right on red” turning rule is explicitly banned in most
intersections in the greater Boston area, although legal in the state of Massachusetts.
A subset of basic driving rules are shown in the Appendix in Listing 14. One example5AIR is freely available: http://dig.csail.mit.edu/2009/AIR/
64

:pedestrian-rule a air:Belif-rule;rdfs:comment "Ensure that pedestrians are safe.";air:if {
:EVENT a :V;car_ont:InPathOf :V.
};air:then [
air:description ("There is a pedestrian");air:assert [air:statement{:Event
air:compliant-with :safe_car_policy .}]] .air:else [
air:description ("There is not a pedestrian");air:assert [air:statement{:Event
air:non-compliant-with :safe_car_policy .}]] .
Listing 5: The “pedestrian right-of-way” rule in AIR.
is the “pedestrian right-of-way” rule in Listing 5.
Rules were constructed automatically and manually validated. In the automatic
part, I wrote a script to read in and process the Massachusetts driving handbook6.
From the natural text, sentences were flagged as “probable” rules if they contained
“rule” keywords: if, then, else, because. Air rules were constructed from natural text
using a parser. The automatic rule extraction is covered in more detail in Chapter 6.
In the automatic process, my script generated 221 rules, which I filtered down to 90
rules7.
4.3.3 Reasoning and Explanations
AIR captures the reasons and descriptions necessary to output explanations. Using
Python and RDFLIB8, the output RDF file is parsed for the justifications and rule
descriptions, which are combined together into a human-readable explanation. For
example, if the pedestrian rule is violated, then the resulting description is “pedestrian
6The Driver’s manual was accessed here: https://driving-tests.org/wp-content/uploads/2020/03/MA_Drivers_Manual.pdf
7I may examine how to automatically combine and filter rules in future work. The goal of thischapter is using rules, and not necessary creating rules. Creating rules is discussed in Chapter 6.The implementation is in the Appendix in Listing 20.
8https://github.com/RDFLib/rdflib
65
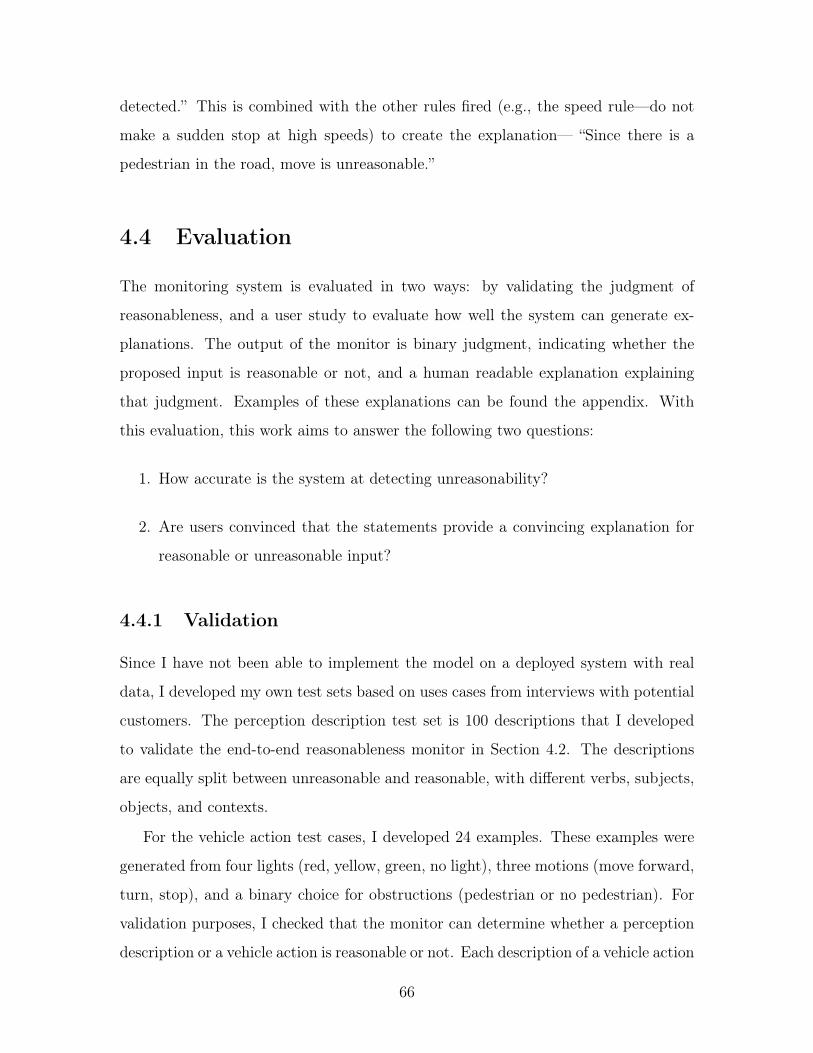
detected.” This is combined with the other rules fired (e.g., the speed rule—do not
make a sudden stop at high speeds) to create the explanation— “Since there is a
pedestrian in the road, move is unreasonable.”
4.4 Evaluation
The monitoring system is evaluated in two ways: by validating the judgment of
reasonableness, and a user study to evaluate how well the system can generate ex-
planations. The output of the monitor is binary judgment, indicating whether the
proposed input is reasonable or not, and a human readable explanation explaining
that judgment. Examples of these explanations can be found the appendix. With
this evaluation, this work aims to answer the following two questions:
1. How accurate is the system at detecting unreasonability?
2. Are users convinced that the statements provide a convincing explanation for
reasonable or unreasonable input?
4.4.1 Validation
Since I have not been able to implement the model on a deployed system with real
data, I developed my own test sets based on uses cases from interviews with potential
customers. The perception description test set is 100 descriptions that I developed
to validate the end-to-end reasonableness monitor in Section 4.2. The descriptions
are equally split between unreasonable and reasonable, with different verbs, subjects,
objects, and contexts.
For the vehicle action test cases, I developed 24 examples. These examples were
generated from four lights (red, yellow, green, no light), three motions (move forward,
turn, stop), and a binary choice for obstructions (pedestrian or no pedestrian). For
validation purposes, I checked that the monitor can determine whether a perception
description or a vehicle action is reasonable or not. Each description of a vehicle action
66

or perception description is labeled with a 1 or 0 as reasonable (1) or unreasonable
(0).
The adaptable monitoring system judges reasonableness with 100% accuracy on
the vehicle action test set. Since there are a countable number of rules and combina-
tions, this makes sense. If the system is deployed in a working vehicle simulation or
platform, more sophisticated and complex rules may be needed. This is discussed in
Section 4.6.
4.4.2 User Study
I recruited 100 users from Amazon Mechanical Turk to evaluate the explanations.
The study participants were instructed to rate each explanation on a five point Likert
scale from “not convincing” to “very convincing.”
Participants were presented with 40 explanations, evenly split between reasonable
and unreasonable judgments. There were 20 vehicle planning explanations, and 20
perception description examples. I presented only 40 explanations to avoid exhaus-
tion. Participants were instructed to rate how convincing the explanations were, on
a scale from 1 to 5. The average score over all explanations was 3.94, indicating
that most users were moderately convinced that the explanations. The survey also
included an optional question for users to explain why they choose their indicated
rating for each explanation. A table of a sample of explanations for the four types of
explanations tested: reasonable vehicle plans, unreasonable vehicle plans, reasonable
perception descriptions, and unreasonable perception descriptions is in Table 4.3.
Users were convinced of the monitor’s explanations, since all explanations were
rated at an average above 3.5. A distribution of ratings can be found in Figure 4-2.
In general, users were slightly more convinced by two factors. Firstly, reasonable were
rated higher than unreasonable statements. This could be due to positive bias [105],
demonstrating that people are generally more favorable to positive examples. Sec-
ondly, perception description explanations (both reasonable and unreasonable) were
rated higher than vehicle planning explanations. This could be attributed to users
being less familiar with vehicle rules. Both differences were not statistically signifi-
67

Figure 4-2: Average rating of 40 explanations over 100 user trials. There are 4 setsof explanations (from left to right): reasonable vehicle plans, unreasonable vehicleplans, reasonable perception descriptions, and unreasonable perception descriptions
68

Reasonable Unreasonable
Vehicle Plans Although green means go,green also means yields topedestrian in the road. Sincethere is a pedestrian in theroad, waiting is reasonable.So it is reasonable for the ve-hicle to wait.
A yellow light means ’stopif safe’, which is inconsistentwith go. So it is unreasonablefor the vehicle to go.
Perception Descrip-tions
Although a tree cannot propelsomething on its own, a stormcan propel a stationary objectto move. So it is reasonablefor a tree to hit a car in astorm.
A laptop is an object that can-not move on its own. So it isunreasonable for a laptop tomove without context.
Table 4.3: Comparison of explanation descriptions for the four types of explanationstested: reasonable vehicle plans, unreasonable vehicle plans, reasonable perceptiondescriptions, and unreasonable perception descriptions.
cant.
4.4.3 Example Explanations
The reasonableness monitor fails on some examples. The majority of these failures
are due to ConceptNet: the relations are not well-defined. A breakdown of failure
cases (and their root causes) is shown in Table 4.4. Table 4.3 displays a few stable
explanations. One interesting example of a reasonableness monitor failure is below:
Input: A hamburger crossing the street.
This perception is REASONABLE:
A hamburger is an animal that can move on its own. So it is
reasonable for a hamburger to cross the street.
This case is interesting because the monitor judgement is wrong, although the rea-
soning is sound. The problem is that there is a chain of IsA relationships in the
commonsense knowledge base that attached hamburger to an animal: (hamburger
IsA food) AND (food IsA animal).
69

Classify as:Reasonable Unreasonable
Label as:Reasonable Parser: 2
ConceptNet: 8
Unreasonable Parser: 2ConceptNet: 6
Table 4.4: A analysis of the causes of the 18 misclassifications on the 100 test cases.
4.5 Applying Reasonableness Monitors
The adaptable implementation (Section 4.3) can be applied to new applications and
domains. The monitoring framework is designed for opaque subsystems where output
can be logged9. These are the requirements to apply reasonableness monitors to a
new application.
1. Data schema: A data schema for model outputs (e.g. labels) and context (e.g.
input or meta data) needs to be defined. Commonsense data (or reasonable
data) for the domain also needs to be given or defined10.
2. Reasonableness rules: Commonsense rules for the domain need to be provided
in AIR.
4.6 Limitations
I define reasonableness as a binary value: it satisfies a set of commonsense rules. In the
case of vehicle planning, these are the rules of the road. For the perception example,
these are commonsense rules for the actor and object of the input description. In
reality, reasonableness should be a score. Reasonableness scoring is being explored
in ongoing work with vector representations of words from GloVe [178], which can
calculate the distances between words or concepts.
9It is preferable if the output is not time dependent. Otherwise, the methodologies in Chapter 3can be used.
10The commonsense data can also be queried; the search code for ConceptNet in the Ap-pendix B.2.2
70

This system has has not been validated on machine-generated image captions, such
as Microsoft’s Common Objects in Context (COCO) database [140]. One challenge
is that these captions are not necessary unreasonable in the sense that our monitor
expects: they are often reasonable because they describe reasonable visual scenes,
but incorrect because the description is not correlated with the input image. Another
concern is that ConceptNet nodes are identified by words and phrases in “outer”
natural language, while CD primitives are meant to be inner-language conceptual
representations.
Although this system works fairly well in practice, it does have some obstacles to
overcome to become a deployable system. I developed a parser to represent the data
in RDF, but this may have to be done manually in different applications, as it may
not generalize. The use case of a perceptual “scene understander,” sometimes referred
to as an opaque, deep neural network, is over-simplified for demonstration purposes.
In future work, I may want to apply this system to an actual image captioning system,
although their description of “reasonableness” is slightly different. In that context,
reasonableness is a caption that accurately describes the intended photo. That kind
of monitoring is much harder to enforce than the reasonableness rules that I have
defined in this Chapter.
The use cases are simplified for demonstration purposes. The vehicle actions
have limited context and perceptual use case is simplified. For a deployed system,
these cases will be expanded to cover complex corner cases that are typically not
well-represented in the training data.
4.7 Ongoing Work
In ongoing work, I am combining reasonableness monitoring with the causal reasoning
models from Chapter 3. Imagine monitors that could not only justify their behav-
ior with commonsense, but also justify their behavior with a causal story. This will
71

require organizational knowledge about the underlying subsystem11. I will also use
explanatory methods [19, 112] that examine internal representations of an opaque sub-
systems. Then, I will create a model of the casual links among those representations.
Finally, I will incorporate that model into a reasonableness monitor, to explain (1)
the internal representations supporting the input subsystem’s decision (or not) and
to (2) build a symbolic story supporting the subsystem’s decision with commonsense
and causal reasoning.
4.8 Related Work
One goal of reasonableness monitors is to create safe, trustworthy autonomous sys-
tems made out of subsystems that themselves are made out of parts: a “multi-agent
system” [158]. Marvin Minsky used the term “agent” to describe any component,
subsystem, or part of a cognitive process that is simple enough to understand [210].
Since no single method of problem solving will always work, Minsky suggested that
we also need to know about pitfalls and corner cases. He encouraged the use of neg-
ative expertise in the form of censor and suppressor agents [159]. Minsky explains
that negative knowledge and examples are important to create intelligent systems.
He suggested implementing negative knowledge by dividing a complex system into
parts that can monitor each other, similar to my monitoring framework.
This chapter imposes sanity checks by monitoring subsystems for reasonable out-
puts. Monitoring for reasonability is an open topic in computer science. Although
formal approaches are provably correct, they do not lend themselves well to an im-
plementation. Collins formal approach based in logic [42] lacks a structural imple-
mentation. Cohen’s logical theory of reasonable actions [41] represents “language as
action,” but it is specific to the defined set of reasonable action expressions from logic.
While methodological approaches are more generalized, they remain specific to the
machine specifications [2] or software specs.
11Recall from Chapter 3 that the propagator models need structure. They are, after all, model-based reasoning systems.
72

Reasonableness monitors represent the input description in terms of conceptual
primitives. Roger Schank introduced Conceptual Dependency theory and its concep-
tual primitives for natural language understanding [198]. Similar work in computa-
tional semantics [101], shows that it is necessary to represent these kinds of conceptual
structures or thoughts and not simply study language in isolation. There are other
choices for compositional decompositions representations [234, 233], including prim-
itives that describe transition space change [26]. Since my domain is a self-driving
car, primitives of physical change, like Schank’s Conceptual Dependency theory are
most applicable.
Reasonable knowledge is provided to the monitoring system from a commonsense
knowledge base. In the adaptable monitoring system, this knowledge is parsed into
a web standard. Commonsense knowledge bases are key tools for developing systems
that understand natural language descriptions and produce explanations. Although
CYC is regarded as the world’s longest-lived artificial intelligence project [135], with a
comprehensive ontology and knowledge base with basic concepts and “commonsense
rules,” there have been significant challenges to using CYC for NLP [148]. Speer
and Havasi [212] demonstrate the usage of ConceptNet5, a freely-available seman-
tic network of commonsense knowledge. Research on SenticNet [32] was inspired by
primitive decomposition theories [198], and links ConceptNet concepts to conceptual
primitives that help generalize them to overcome linguistic variation. Combining
knowledge bases and web standards has been implemented as ConceptRDF; a con-
version of ConceptNet to RDF/XML format [166], although the rules are not applied
to working system. ConceptNet and rules have been combined for emotion recogni-
tion [205], but this work is a combination of rules and common sense for detecting
and explaining reasonableness.
Reasonableness is validated and checked with an existing reasoning system. A
production quality reasoners keep track of consistencies. Since the adaptable monitor
is focused on making a generic monitor using semantic web technologies with RDF
(explained below) to represent logs and AMORD In RDF (AIR) [111] as a rule lan-
guage that supports AMORD-like constructs [116]. AMORD is a rule-based problem
73

solver that keeps track of dependencies, similar to truth maintenance systems [50].
AIR describes properties that can be used to define policies and a reasoner to pro-
vide reasons and explanations. RDF12 is an acronym for the Resource Description
Framework, which is a World Wide Web Consortium (W3C) standard. W3C is the
main international standards organization for the World Wide Web. While RDF is
used mainly for managing and representing data in web frameworks and resources, it
is also used in a variety of knowledge engineering tasks due to its triple-store format.
This format is useful for representing language (as subject-predicate-object) and for
representing premises.
Reasonableness monitors are a system-methodology to identify and explain anoma-
lies in perception, using commonsense knowledge to determine the reasonableness of
perception-derived scene descriptions [74, 79]. This work was extended to validate
scene descriptions from an immersive virtual reality environment [82]. By contrast, in
this chapter, I concentrate on the methodologies, rather than potential applications.
4.9 Contributions
In general, opaque machines and complex algorithms work well in practice. In this
chapter, I presented reasonableness monitors : a final “sanity-check” for autonomous
machines and algorithms, especially those making mission-critical or safety-critical
tasks. In Section 4.2, I used conceptual primitive decomposition as the core repre-
sentation for a monitoring system. I showed how this systems provides succinct, con-
vincing explanations of unreasonable (or reasonable) perceived scenes. In Section 4.3,
I extended the CD representation to an adaptable framework, so that reasonableness
monitors can be utilized to impose reasonableness sanity checks on various subsys-
tems’ outputs.
The key idea here is that monitoring should not be invasive; it should provide an
additional set of quick “checks” to ensure more reliability and safety. Automobiles
and their autonomous counterparts are engineering marvels, and they work quite well
12https://www.w3.org/RDF/
74

most of the time. The idea of reasonableness monitoring is to make them work better
by removing blatantly unreasonable situations that can have bad consequences. But
monitoring can also be used to alert for help and for developing better benchmarks
for safety-critical decisions.
As we add more parts and computational power to these vehicles we not only
increase the number of ways for the machine to fail, but also the number of ways
the system can be infiltrated. Consider the recent increase in vehicle hijacks [154].
Although monitors may not directly minimize the security vulnerabilities, they will
allow infiltrations to be detected in a novel way. Self-monitoring constructs, like the
one proposed in this chapter, are a small step towards developing machines without
errors, that are more trustworthy, and that perform reasonably, as we expect them
to.
75

76

Chapter 5
Interpreting Sensor Data
“You could claim that moving from pixelated perception, where the robot looks
at sensor data, to understanding and predicting the environment is a Holy
Grail of artificial intelligence.”
– Sebastian Thrun
A complex mechanism, like a self-driving car, is made out of subsystems that are
made out of parts. In Chapter 4, I discussed how to monitor opaque subsystems,
e.g, deep neural networks or a proprietary planning algorithm, with commonsense
knowledge and rules. But there are other components of a complex mechanism; in
fact, almost all complex machines have sensors at various levels of detail. Unlike the
opaque subsystems, these sensors output large amounts of data. However, the trouble
is understanding that data, particularly, in a way that can be understood at a higher,
symbolic level, requires an interpreter: a program or method that can analyze sensor
data and translate it into a symbolic description.
In this chapter, I present a qualitative sensor interpreter. This sensor interpreter
builds upon the event-based detection and qualitative reasoning from Chapter 3. It
processes a short (10-20 second) sensor interval and outputs a description of what
it perceives; particularly the size and movement of objects. A series of test parallel
parking simulations show the accuracy and performance of the interpreter on sensory
Light Detection and Ranging (LiDAR) data.
77
There are two phases of this chapter. The first is a proof-of-concept sensor in-
terpreter for simulated LiDAR data. The proof-of-concept is demonstrated on par-
allel parking examples. The second phase is how to extend the sensor interpreter
to current-day LiDAR traces, which have increased in scale and complexity. In Sec-
tion 5.6, I discuss this problem in detail, and in Section 5.7, I suggest future research
directions to incorporate these types of symbolic sensor interpreters into existing point
cloud classification methods.
5.1 Introduction
All complex mechanisms have sensors. As a broad definition, "a sensor is a device,
module, machine, or subsystem whose purpose is to detect events or changes in its
environment and send the information to other electronics, frequently a computer
processor. A sensor is always used with other electronics."1 Sensors are rarely used
in isolation. They are necessary inputs to sophisticated subsystems e.g., the anti-lock
braking system (ABS), in which the tire sensor consistently monitors wheel rotation
rates and recognizes when a sudden change occurs. For example, if the tire sensor
detects that the wheels are locking up, the anti-lock braking system attempts to
prevent a skid by repeatedly applying and releasing the brakes, automatically [152].
These automatic safety measure can save lives [60].
Outside of the vehicle domain, people interact with sensors everyday. There are
sensors in touch-sensitive electronics, e.g., smart phones2, 3 or even the keys on a
keyboard. Sensors are important for my thesis work because they perceive small
changes. A humidity sensor can signify changes in weather. A LiDAR sensor uses
laser light and reflections to measure distances from neighboring objects.
1Wikipedia provides a comprehensive definition of a "sensor" in different applications: https://en.wikipedia.org/wiki/Sensor.
2One example of a smart phone sensor is the accelerometer which indicates howto rotate your screen: https://www.nytimes.com/2018/08/07/technology/personaltech/screen-rotate-isnt-working.html.
3Other sensors have implications to personal privacy: https://www.nytimes.com/interactive/2019/12/19/opinion/location-tracking-cell-phone.html, but that is out of the scope of thisthesis.
78
5.1.1 LiDAR Sensor Limitations
LiDAR systems have changed the landscape of self-driving vehicle, but LiDAR is ex-
pensive to process in real-time. LiDAR can make high resolution maps [33], which has
a new purpose applied to detecting obstacles in self-driving vehicles [138, 173]. While
image data provides detailed, high-resolution information, it is expensive to process
in time and computational resources, leading to decrease the input resolution [244],
which may obfuscate crucial information.
LiDAR sensors provide detailed depth information that is difficult to interpret.
The output of a LiDAR sensor: a “point cloud” represents the surrounding environ-
ment in 3D space. But these signals are noisy and difficult to interpret: point clouds
do not embed the high-level qualitative descriptions that would be useful in diagnosis.
The state-of-the-art in LiDAR “understanding” to detect and classify objects, which
suppresses depth information.
Neural networks are able to process LiDAR data for single-task classification [127].
For self-driving cars, the single tasks is object detection and labelling. While neural
networks are very good at detection and labeling if there is a lot of training data,
they also lack the ability to do multiple tasks.
For multi-task classification, neural networks have been lagging. Neural networks
can only perform one task, and they do not have commonsense. For example, LiDAR
data is useful for tracking objects and describing their movement. But object detec-
tion and tracking are separate tasks: tracking is typically done by another model or
process [215]. However, the type of object detected and its movement or trajectory
are deeply correlated. Detection and tracking should be incorporated in the same
process, along with commonsense. For example, if a skateboard is observed moving
near a neighborhood, someone (probably a child) is chasing after it. I show how
to interpret sensor data to perform multiple tasks: qualitative object detection and
tracking, which is supported with commonsense knowledge.
In this chapter, I present a sensor interpreter that takes a point cloud as input
and produces a qualitative description of what it has perceived. This method has
79

been tested exclusively on simulated LiDAR data, but the method is applicable to
other sensor outputs, as well. Although the density of the data matters, as described
in Section 5.6, this method is a first step towards interpretable, rule-based symbolic
interpretation of noisy sensor data.
5.2 LiDAR Sensor Overview
LiDAR is an active remote sensing system. It is a way that autonomous systems
can perceive the world4. LiDAR works similarly to radar5 and sonar6. The LiDAR
unit emits infrared light (also known as "laser beams") and measures how long each
light beam takes to come back after hitting a nearby object. The LiDAR unit does
this millions of times a second to create a "point cloud": a 3-D map of the LiDAR’s
perceived world. LiDAR detection range varies, for example, the Luminar7 LiDAR
unit has a 200 meter radius and is used by the Toyota Research Institute8 and Volvo.
5.2.1 Simulated LiDAR format
LiDAR units are typically placed on the top of vehicles. They emit infrared light at
various degrees elevation9 and azimuth degree. An azimuth is an angular measure-
ment in a spherical coordinate system. Each LiDAR "hit" (the distance in meters to
the detected object) has a corresponding degree elevation and azimuth degree.
In simulation, LiDAR data was generated using the same vehicle simulation system
described in Chapter 3. The LiDAR output is represented by the keyword lidar
and is output on the vehicle log every tenth of a second. Each row contains 1980
4I argue that the greatest challenge in autonomous driving is perception. In the safety-criticaldriving environment, robust vision and LiDAR processing is essential. But these systems are brittle,and require careful signal processing.
5Radar uses radio-waves to determine the range, angle, or velocity of objects. It is used in shipsand air crafts.
6Sonar uses sound to determine the range, angle, or velocity of objects underwater. It is used insubmarines.
7https://www.luminartech.com.8Perception Technology for TRI Platform 3.0: https://www.tri.global/news/toyota-research-
institute-introduces-next-generation-automated-driving-research-vehicle-at-ces-2018-1-4.9In my work, the LiDAR starts from a neutral degree elevation and rotates down to -10 degrees.
80

Degrees Elevation0 -1 -2 -3 -4 -5 -6 -7 -8 -9 -10
0 N0 N0 N0 46.6 53.4 40 31.9 26.3 22.6 20 182 N0 N0 46.9 46.6 54.1 40.1 31.7 26.1 22.5 20 184 N0 N0 N0 79.6 54.6 40.1 31.6 25.9 22.5 20 186 N0 N0 N0 79.6 54.6 41.1 32.9 25.7 22.5 20 18
Azimuth 8 N0 N0 N0 79.5 54.7 41.1 32.7 26.3 23.1 20 18Degrees 10 N0 N0 N0 79.4 54.7 41.1 32.5 26.1 23 20.6 18.4
12 N0 N0 N0 79.3 54.7 41.1 32.5 26 22.9 20.6 18.414 N0 N0 N0 81.6 54.6 41.1 32.6 26 22.9 20.6 18.316 N0 N0 99.7 81.5 54.6 41.1 32.8 26.5 23 20.6 18.318 N0 N0 101.7 81.3 54.5 41 32.8 27 23.2 20.6 18.3
Table 5.1: A raw data table of the LiDAR traces. The LiDAR unit starts at 0 azimuthdegrees and emits 11 pulses at 0,-1, ...,-10 degrees elevation for every two azimuthdegrees.
values: it reports a value for every 2 azimuth degrees (0,2,4,. . . azimuth degrees)
for 11 degrees elevation10. The raw data trace format starts in front of the vehicle
at 0 degrees elevation and 0 degrees azimuth. For each azimuth it sends emits 11
pulses at descending degrees elevation (starting at 0-neutral and descending to -10
degrees elevation). From the point of reference of the vehicle, the LiDAR unit rotates
clockwise and repeats the process every 2 degrees: it emits 11 pulses at 0,-1,. . . ,-10
degrees elevation. It continues this process until the unit has made a full rotation. A
raw data table of values for a subset of one LiDAR row is in Table 5.1. The values are
rounded to the nearest tenth of a meter, and a value of N0 indicates that no object
was hit. A full row of data is in the Appendix in Table C.1.
5.2.2 LiDAR format in Collected Data Sets
Nuscenes [31] and other self-driving data sets report LiDAR data as a PointCloud
object. The PointCloud object is a list of LidarPointCloud instances: (x, y, z,
intensity), where x, y, and z are coordinates, and intensity is the return strength
of the laser pulse that generated the point. The x direction is left and right, the y di-
10Since the LiDAR unit is on the top of the vehicle, the degrees elevation start at 0 and pointdown. So that the elevation is negative.
81

Figure 5-1: The 4th, 5th, and 8th beams of nuScenes LiDAR data for one sample.The 4th beam is in blue, the 5th beam is in green, and the 8th beam is in red. The8th beam, seen in red, is hitting the ground.
Figure 5-2: The 1st, 10th, and 20th beams of nuScenes LiDAR data. The 1st beamis blue, the 10th beam is green and the 20th beam is red. The first and 10th beamare reflecting off parts of the vehicle. And the 20th beam is too scattered.
82

rection is front and back, and the z direction is up and down. The raw LidarPointCloud
instance also has a beam number (sometimes called a ring number) which corresponds
to the beam which sent out the returned point. The LiDAR unit is located at (0,0,0).
NuScenes uses 32 beams (or rings). Each beam samples a cone around the detec-
tor. The axis of the cone is a vertical line. There is a cone for each of 32 altitude
angles from -30° (peering down) to +10° degrees (looking up). The beam is rotated
around 360° in azimuth, sampling 1084 points at that altitude in each rotation. This
results in 34,688 LidarPointCloud instances for each timestamp. But, this LiDAR
data is noisy, which is shown in Figure 5-1. In red, the 8th beam is a circle in the x-y
plane at 𝑧 = 2 meters. This can be interpreted as hitting the ground, since the origin
of the LiDAR unit is on top of the vehicle at (0,0,0) and the height of a vehicle
is around 2 meters. The average angle of ring 8 is -20 degrees. This makes sense,
because the circle is on the ground and the average distance to the ground is -1.77
meters
Some beams are more useful than others. In my analysis, I do not use the early
beams (e.g. 1,2,3) and later (e.g. 20+) beams, as illustrated in Figure 5-2. These
beams are particularly difficult to understand. In particular, the first beam is too
close, hitting the top of the vehicle. The tenth beam hits the ground, and the 20th
beam is too far away. The code to generate these visualizations are in the Ap-
pendix 16.
The nuScenes LiDAR traces are intended to be visualized with the vision data, as
seen in Figure 5-4. In the top-down LiDAR view in Figure 5-3, there is a slight tilt
in the vehicle’s position. This can also be detected from the difference between the
angle on the left of the car and the angle on the right of the car, which I do in my
analysis.
5.2.3 Related Work on LiDAR Processing
In the literature, point cloud interpretation is defined as an "object detection" tasks.
This detection task is defined as creating a "tight" bounding box around perceived
objects. This is difficult due to the amount of noise in point cloud data. One way
83

Figure 5-3: A top-down view of all the LiDAR beams.
84

Figure 5-4: A view of all the LiDAR beams on top of the front-facing camera image.
to decrease noise is to supplement LiDAR with vision data. Frustum PointNets [181]
uses LiDAR data to expand 2-D image detection to 3D bounding boxes. This is an
extension of [182], a unified neural network architecture to segment point cloud data.
I focus on nuScenes because the data set is the most realistic. The nuScenes data
set is long-tailed, highlighting the imbalance between common and rare object classes.
Although the nuScenes challenges are the “closest” to real-world scenarios due to the
data distribution, the challenges do not require abstract thinking11.
As of July 2020, the top performing algorithms on the nuScenes detection task
using only LiDAR 12 were the following algorithms:
1. CVCNET, which is based on Class-based Grouping and Sampling (CBGS) [255],
the algorithm used by the third-rank MEGVII team.
2. DTIF, which is developed by Shanghai JiaoTong University (SJTU), but not11The major problem in self-driving is the gap between reality and a vehicle’s representation of
it. This gap makes it impossible to represent all failure cases in training data (regardless of how“close” that data is to real-world data distribution) and creates the need for anticipatory thinkingin autonomous driving. I argue that self-driving challenges should encourage methods that canidentify possible failure cases and manage the vehicle’s risk exposure to them under the uncertaintyin real-world environments.
12The real time results on the nuScenes challenge is updated dynamically: https://www.nuscenes.org/object-detection?externalData=no&mapData=no&modalities=Lidar. Note thatthese algorithms only use LiDAR data.
85

published.
3. The MEGVII team from Tsinghua University that uses "Class-based Grouping
and Sampling" (CBGS) [255]. The goal is to extract features from the data
(using a 3D convolutional CNN), and then use a class-balanced sampling and
augmentation strategy for a more balanced data distribution.
Recently, state-of-the-art methods have been published that outperform the pre-
viously mentioned algorithms. CBGS recently outperformed PointPillars [127], which
was previously the leading algorithm on the nuScenes detection challenge. Pointpil-
lars is an encoder method, which utilizes PointNets to learn a representation of point
clouds indexed by vertical columns, which they call pillars. These features are then
incorporated into a 2D CNN architecture for object detection.
Mohammad Sanatkar provided a very comprehensive overview of the state-of-the-
art in LiDAR interpretation [196] in a blog post13. Most of these methods combine
vision data and LiDAR data for more data and features in CNN object detection. To
my knowledge, my work is the first method to qualitatively understand dense point
clouds using edge detection, rather that neural network architectures.
5.3 Method
In order to describe the "point clouds" that a LiDAR sensor perceives, I created
thresholds to find "edges," or a cluster of points signaling an object. Thresholds were
made on a trial by trial basis that depended on the application, frequency of LiDAR
data, and objects in question. I describe this process for detecting vehicles below.
5.3.1 Edge Detection for Object Detection
For my use case, I was interested in detecting vehicles and people. Therefore, I had to
define a rule for detecting vehicles, and another rule for detecting pedestrians based13During this thesis work, most of the leading LiDAR interpretation methods were developed in
industry and trade-secret. So most of the "cutting-edge" algorithms are described in blog postsinstead of academic papers.
86

on their size in the frame of reference of the vehicle. I focused on these two concepts
because the specific motivating problem was to detect errors in parallel parking. For
detecting other vehicles, I used simple geometry to figure out how many LiDAR
hits (or detections) are necessary to confirm there is a car in front (in the frame of
reference of the vehicle). I could also use this information to create a short list of
rules to classify the detected objects based on their approximate geometry, and not
necessarily rely on training data. This is important especially for objects that may
not be present in a training data set. For example, if the autonomous vehicle has
never seen a pedestrian walking a bicycle before, it may not be able to classify it, but
it will know it’s an important "object of interest" because it’s wide (~2 meters wide
and moving).
5.3.2 Angle Estimation
Simulated LiDAR readings report the distance from the LiDAR indexed by an az-
imuth and an altitude. In my analysis, I calculated and estimated the angles between
successive LiDAR points. I filtered for the edges of successive LiDAR hits, at specific
distances (𝑑1 and 𝑑2) and the angle between them, 𝜃, to classify detected objects. This
method is faster and more interpretable than opaque learning systems that classify
objects: the detections and classifications have implicit reasons (e.g., this perceived
object is a vehicle because it is 2 meters wide, which is too wide to be a pedestrian,
etc.)
This estimation setup is visualized in Figure 5-5. The Law of Cosines, in equa-
tion 5.1, shows the relation between the detected distances at the endpoints (𝑑1 and
𝑑2) from the LiDAR log, and the angle between the edges of that object, 𝜃. Consider
if the detected object is directly in front of the simulated (self) vehicle. This is useful
for parking and stopping distance estimation. For the remainder of this section, I
focus on the use case of parallel parking.
𝑥2 = 𝑑21 + 𝑑22 − 2𝑑1𝑑2 cos 𝜃 (5.1)
87

x
δ
y
x2
x2
l2
lCar in front
self
x
θd1 d2
l
θd1 d2
Figure 5-5: The geometric definitions for an object detected precisely in front.
To understand how Equation 5.1 can be used for detecting another car parked in
front of the self-driving car, see Figure 5-5, where there is an object detected directly
in front of the vehicle. I approximated the number of hits to determine that the
object is a vehicle at various distances by using: cos−1 𝜃 = 1 − 𝑥2
2𝑑21, where 𝑥 is the
approximate width of the object in front. I assume that the LiDAR unit is in the
middle of the vehicle14. Then if the estimated width, 𝑥, is hypothesized to be the
width of a standard vehicle, and 𝑙 is the length of a standard vehicle, let 𝑥 = 2 meters,
14This is a fairly good estimation, as most LiDAR units are mounted on the top of the vehicle,showing a global view of the LiDAR traces radiating from the center of the vehicle. An example ofthis “global” LiDAR view is at the end of this chapter in Figure 5-9
88

θ′�
x′�d′�1
d′�2
γ
y = δ + l2
δ
l2
Car in front
self
θ′�
x′�d1
d2
l2
self
x
Car in front
Figure 5-6: The geometric definitions for a vehicle detected to the front and to theside. The precise setup is shown on the left, and the estimated definitions are shownon the right.
and 𝑑1, 𝑑2 = 4 meters to get 𝜃 = .505 radians = 29.0 degrees.
This is an educated estimate. While the exact number of hits depends on the
scale of LiDAR hits, the conclusion is that I will need to have about 29 degrees of
consistent detections to be confident in the detection of a standard vehicle at 4 meters
distance from the vehicle (at the edges).
Zoe Liu and I extended this analysis for general parallel parking scenarios [146].
Consider if the vehicle is not directly in front, but to the side, as seen in Figure 5-6.
Using the same equation, I get an estimate for 𝑥′, the chordal distance between 𝑑1
and 𝑑2 at angle 𝜃. Since I was focused on estimating this distance, I choose to use
the same equation, and let 𝑥′ ≈ 𝑥. For my scenarios, this worked well, especially
because the rules are in specific ranges corresponding to qualitative values; so the
exact measurements need to only be estimated.
Note that 𝑥 can be more precisely estimated from 𝑥′, 𝑑′1 and 𝑑′2: the corners of the
89

object, classified by the nearest detection. But, this is not always feasible, especially
when there are multiple objects detected, as is typical in most urban, self-driving
environments. This may be explored in future work.
5.3.3 Object Tracking: Describing Movement
Once an object has been detected, tracking movement of objects from the simulation
is straight forward. A propagation model is used with a set a rules that define quali-
tative movement changes, which is describe in Chapter 3. The first step is alignment:
finding the detection of the same object that moves across a scene. This is done
by collecting the object detection across snapshots and qualitatively describing the
movement across several seconds.
5.3.4 Parking Rules
The use case to evaluate this LiDAR interpreter is a parallel parking scenario, shown
in Figure 5-8. This scenario was chosen because it relies on LiDAR information,
concrete rules, and it extends the work in Chapter 3.
I defined the minimum space needed by Equation 5.2 [25]. Let self be the vehicle
doing the parking, where 𝑙 = length of the self vehicle, 𝑥 = width of the vehicle in
front, 𝑘 = distance from the front wheel to the front of self, 𝑏 = the length of the car’s
wheel base, and 𝑟 is the radius of the vehicle parking’s curb-to-curb turning circle.
These are shown in Figure 5-7 and the equation for minimum space needed is given
by Equation 5.2.
minimum space =
√(𝑟2 − 𝑙2) + (𝑙 + 𝑘)−
(√𝑟2 − 𝑙2 − 𝑥
)2
− 𝑙 − 𝑘 (5.2)
The parallel parking rules can be expressed as following four thresholds (and an
optional fifth threshold).
1. Minimum space needed: threshold given by Equation 5.2.
90

Figure 5-7: Visual diagram for the variables for the parallel parking scenario.
2. Backup threshold: the distance between the front of our car and the back of
the car we are aligned with.
3. Turning threshold: theta between our right front wheel and the back left wheel
of the car we are aligned with (r = radius of our car’s curb-to-curb turning
circle).
4. Straightening out threshold: theta between our right back wheel and the hori-
zontal
5. (OPTIONAL) Driving forward threshold: optional, minimum space needed -
the length of our car.
Screen shots of these stages are seen in Figure 5-8. Note that checking whether there
is enough space to park is done as the car approaches a potential parking space. After
91
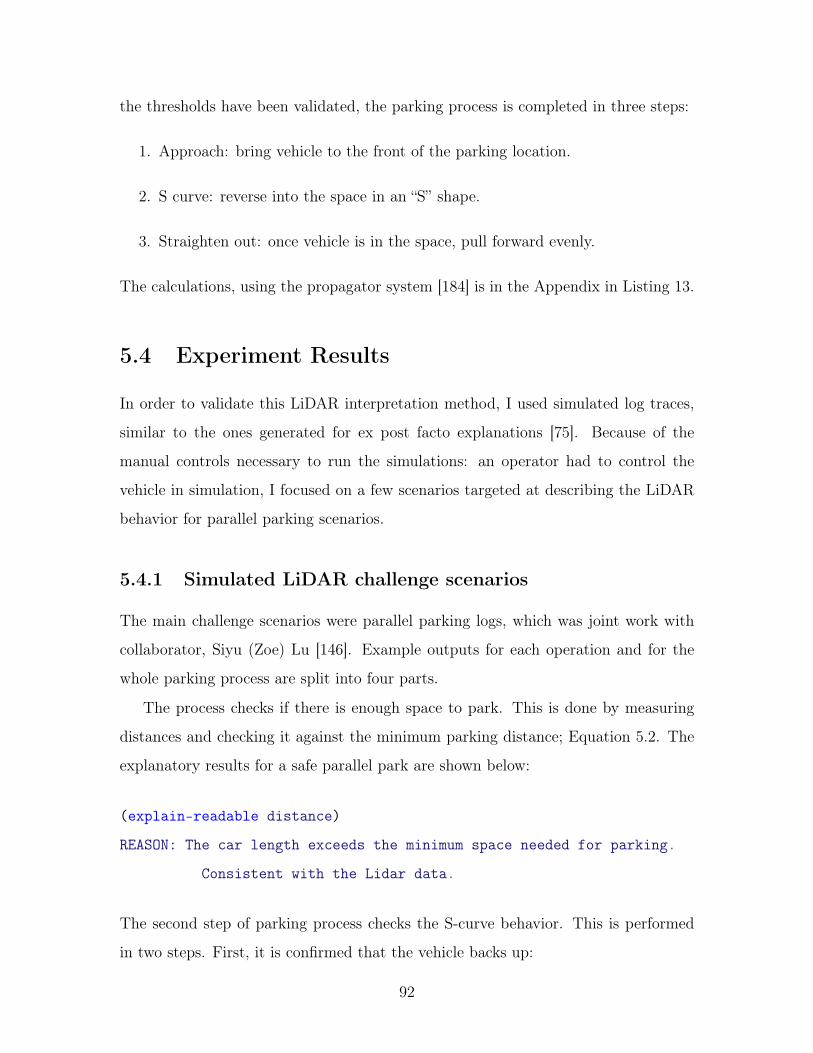
the thresholds have been validated, the parking process is completed in three steps:
1. Approach: bring vehicle to the front of the parking location.
2. S curve: reverse into the space in an “S” shape.
3. Straighten out: once vehicle is in the space, pull forward evenly.
The calculations, using the propagator system [184] is in the Appendix in Listing 13.
5.4 Experiment Results
In order to validate this LiDAR interpretation method, I used simulated log traces,
similar to the ones generated for ex post facto explanations [75]. Because of the
manual controls necessary to run the simulations: an operator had to control the
vehicle in simulation, I focused on a few scenarios targeted at describing the LiDAR
behavior for parallel parking scenarios.
5.4.1 Simulated LiDAR challenge scenarios
The main challenge scenarios were parallel parking logs, which was joint work with
collaborator, Siyu (Zoe) Lu [146]. Example outputs for each operation and for the
whole parking process are split into four parts.
The process checks if there is enough space to park. This is done by measuring
distances and checking it against the minimum parking distance; Equation 5.2. The
explanatory results for a safe parallel park are shown below:
(explain-readable distance)
REASON: The car length exceeds the minimum space needed for parking.
Consistent with the Lidar data.
The second step of parking process checks the S-curve behavior. This is performed
in two steps. First, it is confirmed that the vehicle backs up:
92

Figure 5-8: Screenshots of the four stages of parallel parking from the Unity gameengine.
(explain-readable wheel-acceleration)
REASON: Front wheels and rear wheels accelerated backwards.
Consistent with the steering wheel and accelerometers.
Since the forward acceleration of the car is negative,
the car MUST HAVE backed up.
The second step of the S-curve makes sure that the correct motions took place to
complete the action:
(explain-readable wheel-acceleration)
REASON: Front wheels and rear wheels accelerated backwards AND
Left wheels accelerated more than right wheels.
Since the forward acceleration of the car is negative,
the car MUST HAVE backed up.
Since the magnitude of acceleration of left wheels are
larger than the magnitude of acceleration of right wheels,
the car MUST HAVE turned in.
93

And at the end, successful parking is verified and explained:
(explain-readable parking)
REASON: Regular parking process within all thresholds.
Since the car has backed up, turned in, straightened out,
and driven forward within thresholds,
the car MUST HAVE parked safely.
There are also examples of unsuccessful parking. This is one example of an error
during the backup (first step in the S-curve procedure):
(explain-readable parking)
REASON: Error in backing up.
Since the position of the car before and after backing up exceeded
the backup threshold,
the car MUST HAVE made an error in the backup step.
5.4.2 Data Set LiDAR Challenge Results
Figure 5-9: Various sensor outputs for a nuScenes scene snapshot.
The task to interpret LiDAR in collected data sets is different than the parallel
parking example. In this task, I was interested in qualitatively describing LiDAR
traces. Figure 5-9 shows various sensor outputs that are difficult to interpret. The
labeled outputs is "Pedestrian with a pet, bicycle, car making a u-turn, lane changes,
94

pedestrian crossing in a crosswalk." The task is to interpret LiDAR point clouds and
output a qualitative description.
The first step is to separate the LiDAR point clouds into distinct objects. This
is done with edge detection, as described in Section 5.3.1. However, this method
changes for the scale of collected LiDAR data15 for two reasons.
1. Edge detection is applied for each beam or ring. The early beams are dis-
regarded, as the points reflect off the top of the car, as seen in Figure 5-2.
Similarly, later beams are also disregarded as they reflect off the ground. The
width of an object is the edge length of the earliest beam. The depth is calcu-
lated by finding the last beam where the object of "similar" length was detected.
This method succeeds in finding about 50 percent of all the objects in a scene.
The method fails on objects that are far away, multiple objects being classified
as a single object, and due to the lack of non-hit points. Down sampling will
be revisited in future work, although initial attempts failed.
2. Collected data sets are quite dense; in a single snapshot or scene, there are very
few "non-hits," or LidarPointCloud points that do not hit any object. The
number of non-hits in a scene is between 40-50 points. Therefore, I could not
apply edge detection directly, since nearly all the points are continuous hits.
Due to the difficulties in applying the method directly, an intermediate "bounding-
box" method was used. "Bounding box" methods or "object detection" methods for
point cloud data, are used to generate a tight box around objects. These methods are
described in Section 5.2.3. The nuScenes data set has metadata for these bounding
boxes in each annotated object, as the size property, seen in Figure 5-10. These
boxes are then qualitatively described using threshold rules for size, location, and
movement (by tracking the object across a scene).
movable_object.trafficcone
[1345.3609354399998, 3926.40104428, 2.15223104]15In simulated data, there are 1,980 points per snapshot, and in collected data sets, there are
34,688 points per snapshot.
95
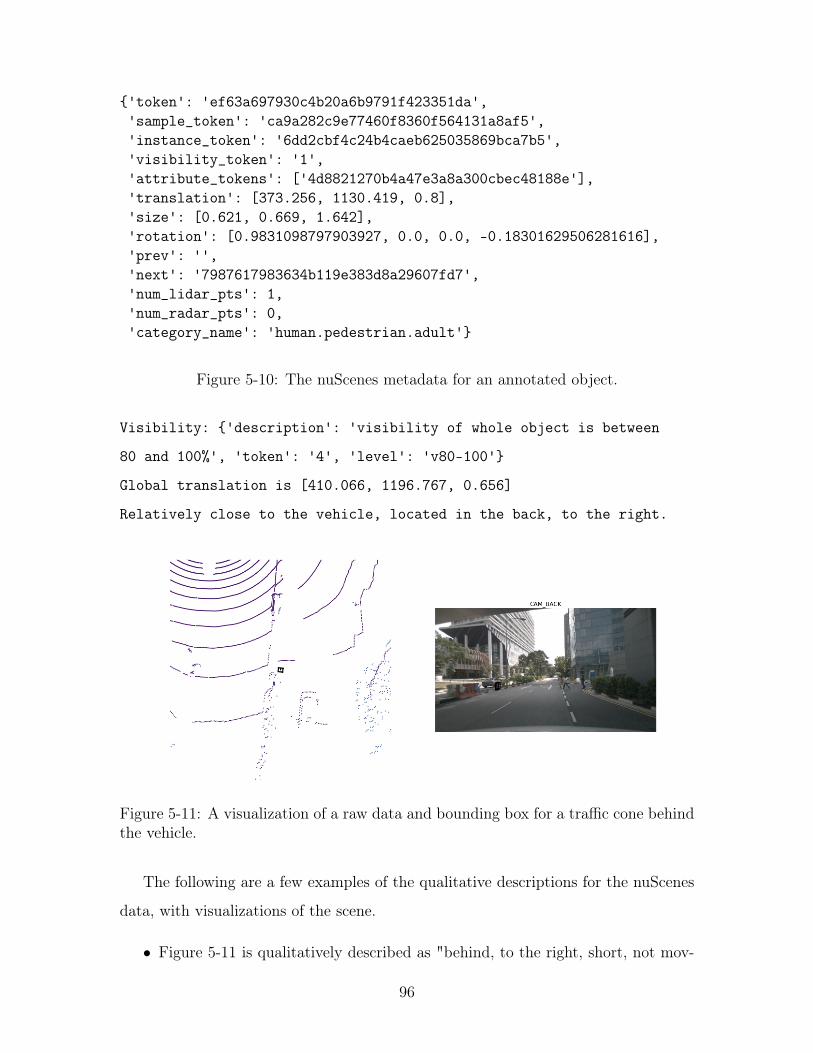
{'token': 'ef63a697930c4b20a6b9791f423351da','sample_token': 'ca9a282c9e77460f8360f564131a8af5','instance_token': '6dd2cbf4c24b4caeb625035869bca7b5','visibility_token': '1','attribute_tokens': ['4d8821270b4a47e3a8a300cbec48188e'],'translation': [373.256, 1130.419, 0.8],'size': [0.621, 0.669, 1.642],'rotation': [0.9831098797903927, 0.0, 0.0, -0.18301629506281616],'prev': '','next': '7987617983634b119e383d8a29607fd7','num_lidar_pts': 1,'num_radar_pts': 0,'category_name': 'human.pedestrian.adult'}
Figure 5-10: The nuScenes metadata for an annotated object.
Visibility: {'description': 'visibility of whole object is between
80 and 100%', 'token': '4', 'level': 'v80-100'}
Global translation is [410.066, 1196.767, 0.656]
Relatively close to the vehicle, located in the back, to the right.
Figure 5-11: A visualization of a raw data and bounding box for a traffic cone behindthe vehicle.
The following are a few examples of the qualitative descriptions for the nuScenes
data, with visualizations of the scene.
• Figure 5-11 is qualitatively described as "behind, to the right, short, not mov-
96

Figure 5-12: A visualization of a raw data and bounding box for a pedestrian.
Figure 5-13: A visualization of a raw data and bounding box for a vehicle.
97

ing." Note that this object is described to the right, although it appears in the
left of the photo. This is because it’s detected in the rear-facing camera.
• Figure 5-12 is qualitatively described as "to the right, far away, small, slowly
moving."
• Figure 5-13 is qualitatively described as "to the right, somewhat close, long and
deep, not moving."
5.5 Applying Sensor Interpretation
This sensor interpretation should be able to be applied directly to various sensor
outputs. The following parts may need to be tuned for different applications.
1. Edge detection: As described, the edge detection method cannot be directly
applied to a LidarPointCloud data type. In other applications where the sensor
data is especially dense, this method may have to be re-defined.
2. Qualitative Rules: The qualitative descriptions are output from a set of rules
and thresholds. I qualitatively describe size, location (in terms of the vehicle),
and movement. Other qualitative descriptions will have to be defined.
5.6 Limitations
LiDAR data has changed drastically in the last few years. Firstly, the number of
LiDAR hits has increased by orders of magnitude. This results in the density of
the LiDAR point cloud to increase, as shown in Figure 5-14. But the increase in
LiDAR points also adds to complexity in processing. It is no longer possible to use
geometry estimations to detect object sizes. Firstly, since there are more LiDAR
points, the resulting point cloud is noisy and the edges of objects are not easily
detected. Secondly, with more LiDAR points, there are more false detections: due to
noise and because of the density of points, close-by detection are grouped together.
98
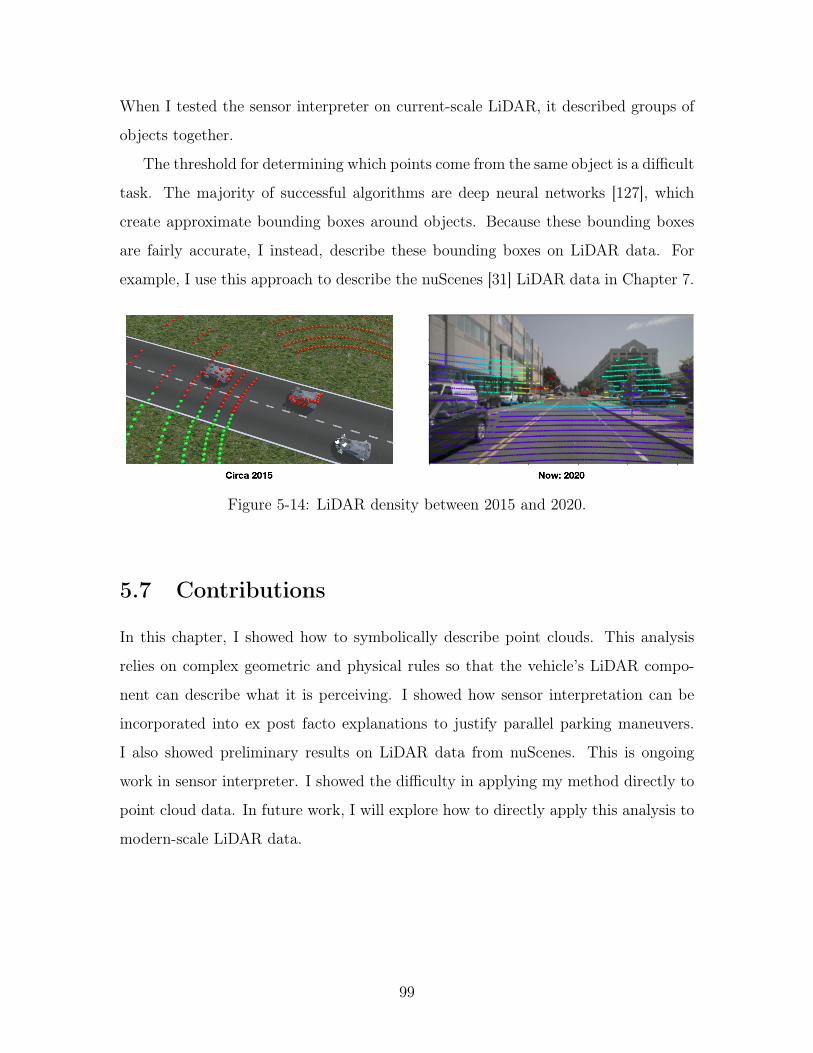
When I tested the sensor interpreter on current-scale LiDAR, it described groups of
objects together.
The threshold for determining which points come from the same object is a difficult
task. The majority of successful algorithms are deep neural networks [127], which
create approximate bounding boxes around objects. Because these bounding boxes
are fairly accurate, I instead, describe these bounding boxes on LiDAR data. For
example, I use this approach to describe the nuScenes [31] LiDAR data in Chapter 7.
Figure 5-14: LiDAR density between 2015 and 2020.
5.7 Contributions
In this chapter, I showed how to symbolically describe point clouds. This analysis
relies on complex geometric and physical rules so that the vehicle’s LiDAR compo-
nent can describe what it is perceiving. I showed how sensor interpretation can be
incorporated into ex post facto explanations to justify parallel parking maneuvers.
I also showed preliminary results on LiDAR data from nuScenes. This is ongoing
work in sensor interpreter. I showed the difficulty in applying my method directly to
point cloud data. In future work, I will explore how to directly apply this analysis to
modern-scale LiDAR data.
99

100
Chapter 6
Learning from Explanations
“But surely to understand must involve the formation of a descriptive plateau
of knowledge lying somewhere between raw, totally unprocessed data and de-
tailed answers to problems.”[238]
– Patrick Henry Winston
Rule-based systems are interpretable and explainable, but they are time-consuming
to create and maintain, since rules are generally hand-coded. In this chapter, I present
a method to learn symbolic rules from ex post facto explanations for autonomous
vehicles. My method is able to learn that certain explanations and behaviors are
exceptions to existing rules, and other explanations and behaviors suggest the need
for new rules. These rules can be integrated into an existing monitoring system to
detect and explain anomalies, with limited augmentation to an existing system. I
evaluated my method on a small self-driving car, a custom MIT RACECAR [39], and
I discuss how rules can be used to infer constraints of reasonable behavior in other
complex environments.
There are two contributions in this chapter. First, I show a new application: I
apply reasonableness monitoring to machine actions instead of machine perception.
Secondly, I build upon the reasonableness monitoring system to make it more dy-
namic: I add a rule-learning method so that rules can be added, augmented, and
retracted. This work contributes to "closing the loop" on explainability, where the
101

output explanations are used to improve and learn reasonableness rules in new con-
texts and environments.
6.1 Introduction
Autonomous vehicles are susceptible to failures. There many ways to "fool" an au-
tonomous vehicle [11], and the failure cases cannot be enumerated1. There have been
developments towards test suites of plausible failure modes [223]2. But creating “bet-
ter” failure detection techniques is not enough. The underlying systems need the
capability to introspect about their own behavior and learn through experience. For
example, in the Uber self-driving accident, a software system ignored the pedestrian
detected by the LiDAR sensor to be a false positive detection, resulting in a pedestrian
fatality [151]. The software system lacked the commonsense necessary to know that
an object moving in the middle of the road is likely a pedestrian. The autonomous
vehicle should learn from this mistake and ensure it will not be a repeated failure.
Human drivers are also susceptible to failures. But human drivers fail differently
than autonomous drivers. Human drivers are able to adapt to driving in new envi-
ronments. Humans learn new driving rules by examining context and reflecting on
their behavior: they explain the best action or alternative to themselves. Take for
example, the behavior of "flashing high beams." Based on the location, context, and
social rules, we may apply an existing rule (if a neighboring car is flashing their high
beams, then turn on the vehicle’s headlights), or we may create a new rule based on
a new explanation (e.g. since they are flashing their high beams aggressively, that
means to watch out for something).
In this chapter, I present a rule-learning method that is inspired by the way that
humans learn to drive. I show how to enhance autonomous driving systems with a
dynamic reasonableness monitor that can learn from explanations of perceived errors
that are clearly wrong. My rule-learning method is validated on a real-world robot:
1Some examples are security hacks, adversarial attacks and lack of commonsense knowledge,which are detailed in Chapter 7.
2Recall from Section 1.1, that an error is a technical mistake and a failure has consequences.
102
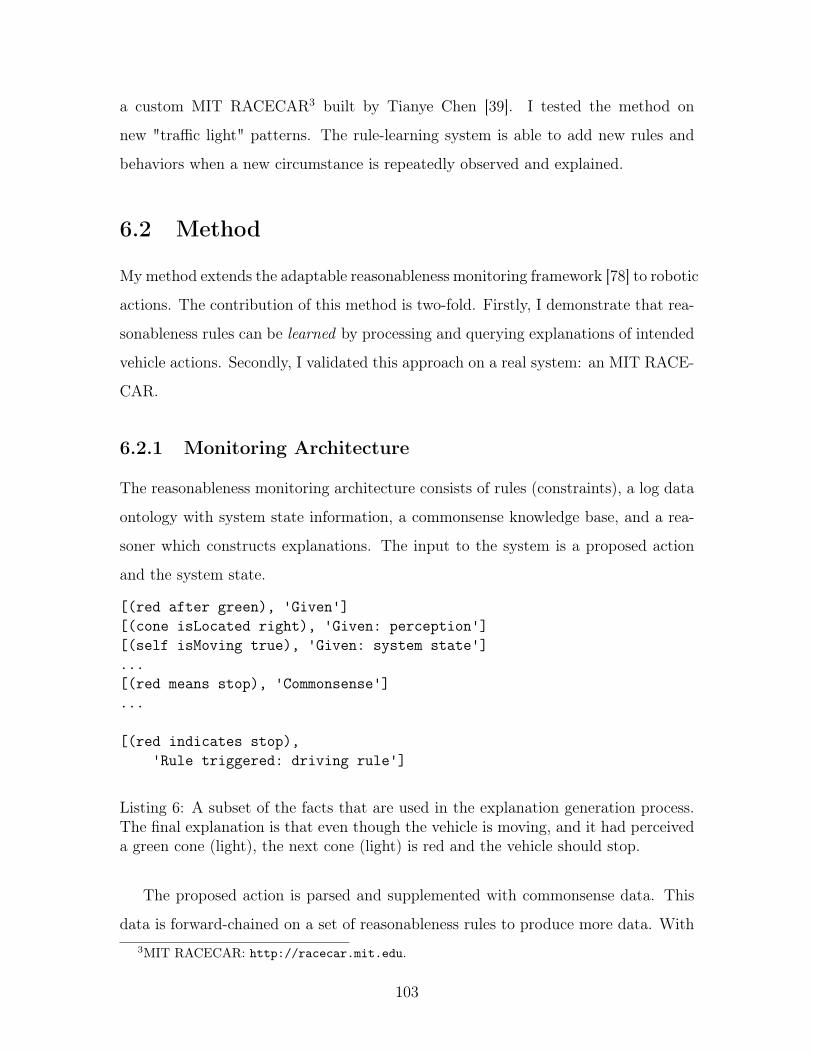
a custom MIT RACECAR3 built by Tianye Chen [39]. I tested the method on
new "traffic light" patterns. The rule-learning system is able to add new rules and
behaviors when a new circumstance is repeatedly observed and explained.
6.2 Method
My method extends the adaptable reasonableness monitoring framework [78] to robotic
actions. The contribution of this method is two-fold. Firstly, I demonstrate that rea-
sonableness rules can be learned by processing and querying explanations of intended
vehicle actions. Secondly, I validated this approach on a real system: an MIT RACE-
CAR.
6.2.1 Monitoring Architecture
The reasonableness monitoring architecture consists of rules (constraints), a log data
ontology with system state information, a commonsense knowledge base, and a rea-
soner which constructs explanations. The input to the system is a proposed action
and the system state.
[(red after green), 'Given'][(cone isLocated right), 'Given: perception'][(self isMoving true), 'Given: system state']...[(red means stop), 'Commonsense']...
[(red indicates stop),'Rule triggered: driving rule']
Listing 6: A subset of the facts that are used in the explanation generation process.The final explanation is that even though the vehicle is moving, and it had perceiveda green cone (light), the next cone (light) is red and the vehicle should stop.
The proposed action is parsed and supplemented with commonsense data. This
data is forward-chained on a set of reasonableness rules to produce more data. With3MIT RACECAR: http://racecar.mit.edu.
103

from afinn import Afinnafinn = Afinn()
>>> afinn.score('I saw a yellow light and nothing good happened')3.0>>> afinn.score('I saw a yellow light and nothing bad happened')-3.0>>> afinn.score('I saw a yellow light and nothing happened')0.0>>> afinn.score('I saw a green light')0.0>>> afinn.score('red appeared after green')0.0>>> afinn.score('I saw another car')0.0>>> afinn.score('I saw another speeding car')0.0>>> afinn.score('I saw a car run a red light')0.0
Listing 7: Examples of the sentiment scoring on vehicle explanations.
this comprehensive set of data (or facts) as evidence, the action is deemed to be
reasonable or unreasonable and an explanation is provided. The explanation is a chain
of facts: a symbolic triple with an associated reason4. An example explanation in is
Listing 6. With a natural language generation (NLG) template, the explanation can
be shown to a user in readable text.
6.2.2 Rule Learning
My rule-learning system integrates into the adaptable reasonableness monitoring
prototype [78]. The rule learning system processes an error text file: it parses the
explanations and state at the time of the error (time, system state, sensor data,
etc). After aggregating together this information, the rule learning system judges
whether the explanation in the log data and system state should constitute a new
rule, or whether it is an exception to an existing rule. The system determines this
4Note that each fact has a triple and a reason. They are stored in a pandas DataFrame object,which includes an index for each fact.
104

by examining the sentiment of the explanation, and it checks if any of the errors are
similar to each other. If any of the errors happen multiple times. If there is more
than one instance, then it uses the error information to create a new rule.
The sentiment analysis determines whether a new rule should be learned. For the
self-driving domain, I used an existing model [172, 90] that scores the sentiment of
the explanation text in a range from -5 (very negative sentiment) to 5 (very positive
sentiment). Most of the explanations that I used were neutral with a score of 0, shown
in Figure 7, so I grouped neutral and positive scores together. Any explanation with
a neutral or positive score is created as a new rule. Note that sentiment analysis is
an open problem, and the accuracy of this analysis is out of scope of this chapter.
A new rule is created by parsing the error log text. The rule learner looks for
specific symbolic relations in the error explanation, for example, “before,” “after,”
“because.” If it finds any of those symbolic relations, it then processes the text before
and after that word for the rule binding. This creates a symbolic triple, composed of
the text before the keyword, the keyword itself, and the text after the keyword. This
triple is used in the new rule text, which is output into the AIR rule Language. The
end result is a new Air rule, written in N3 that is appended to the existing rule file
in the monitoring system.
6.2.3 RACECAR Architecture
The real-world robotic system for validation is a custom, Traxxas Slash RC racing
car, modified to include a JetsonTX2, a Hoyoku lidar, a ZED stereo camera, a inertial
measurement unit (IMU), and a VESC based motor controller5. ROS Kinetic runs
on the JetsonTX2 and takes care of the computation and planning decision making
for the vehicle.
A stereo camera on board is used to detect cones and place them on the map
accordingly. The camera images are processed at a rate of 5hz, the car drives slowly.
The experiment relies on the camera’s detection of cones straight ahead. Therefore,
I removed the top and bottom third of the image, as cones could not possibly appear5https://vesc-project.com/
105

above the ground or be blocking the car. The image is converted to HSV values and
masked using empirically tested red, green and yellow thresholds to find and locate
the cones in the image. If a contour is found, the distance and angle from the car is
calculated using the left and right images of the car.
6.3 Experiments
The main goal of the experiment was to validate the rule learning system with various
traffic light scenarios with and without errors. There are three possible scenarios for
traffic light transitions: red to green, yellow to red, or green to yellow. I generated
five sequences for each type of sequence and allowed the RACECAR to drive through
the given course three times, which generates a sum total of 45 tests.
Test type Sequences Ground Truth Systemerror 5 exception no rule
normal 5 reasonable no rulerepeat 5 new rule new rule
Table 6.1: A table of the 15 distinct sequences that were tested on the RACECARplatform. The error logs had specified errors, which are deemed exceptions to therule and so no new rules are made. Normal tests were explained to be reasonable,and so no new rules are made. Repeated errors are explained and so new rules aremade, as expected.
6.3.1 Experiment Design
The experiment was performed in a lab basement with cones four feet apart from
each other. I used three cone colors: red, yellow, and green, corresponding to existing
traffic lights. My goal was to validate the monitor’s rule learning ability on new cone
sequences, to mimic new traffic light sequences. For example, traffic light sequences
typically use “yellow” as a transition from green to red (i.e. green, yellow, red). This is
important to monitor because there are different light patterns in different contexts6.6It has been shown that AVs learn patterns not meaning: https://medium.com/@swaritd/
red-means-stop-traffic-lights-for-driverless-vehicles-f972b14990e3. AVs cannot sim-ply memmorize these mundane light patterns
106

Figure 6-1: A flow diagram of the experiment design. The RACECAR system outputsa log file after a running through a specific sequence of cones. That log file is thenprocessed by the rule learning system, which either creates a new rule for the existingmonitoring system, or not In the case of a normal test run no rule is made.
There were 15 unique sequences of cones that were tested. For each sequence, the
RACECAR is navigated around all of the traffic cones in a single cone sequence. The
log file is saved and the process is repeated for each sequence. This experiment flow
process is demonstrated in Figure 6-1.
A test breakdown of the different cases are seen in Table 6.1. I tested for three
different types of behaviors. The first test sequence was with errors specifically intro-
duced. The second test sequence were normal sequences without errors. The third
test sequence were repeated behaviors that would trigger errors in the log, but should
be learned as new rules.
The RACECAR is connected to a game joystick, and the R1 button gives control
of the VESC motor controller to the autonomous system. When the button is not
pressed, the joystick sends a command of 0 speed to the VESC. This is to ensure the
safety of the car as the testing area is an active hallway with foot traffic. The car is
in autonomous control when it navigates around cones. When it completes a set of
cones representing a traffic light, the R1 button is released to signal to the system
that it has completed a single traffic light and to reset it’s queue of light sightings for
the next traffic light
107

6.3.2 Experiment Results
The RACECAR was able to navigate through the cones successfully and detect errors
as they occurred. At times the RACECAR erroneously detected a cone twice, but
that did not significantly affect the experiment, as it is valid to see the same traffic
light color more than once. The error does not induce an unwanted transition error.
Example log files from each of the runs can be found in Figure 6-2 The error log is
fed into the rule learning system [78] and the resulting rules are integrated into the
monitoring system. The output rules for the corresponding log can be seen in Figure
6-3.
The rule learning system output corresponds to the repeat error log listed Figure
6-2. The rule learning system found the repeated transition errors and created a new
rule that green can be expected to come after yellow. The rule learning system was
able to successfully detect the recurring light transition errors in each log and update
the rule file in the monitoring system.
6.3.3 Challenges
This work focused on building and using the RACECAR platform to evaluate the
performance of anomaly detection in autonomous vehicles based on symbolic rules
and reasonableness. A far more expansive set of rules can also be applied to the car’s
behavior and observations. The set of rules should originate from a driving handbook,
which details the literal rules set for the vehicles on the road. Additionally, given that
autonomous vehicles interact with other vehicles and it would be interesting to apply
the anomaly detection and adaptable monitoring system to an autonomous vehicle in
the presence of other possibly non-autonomous vehicles.
108
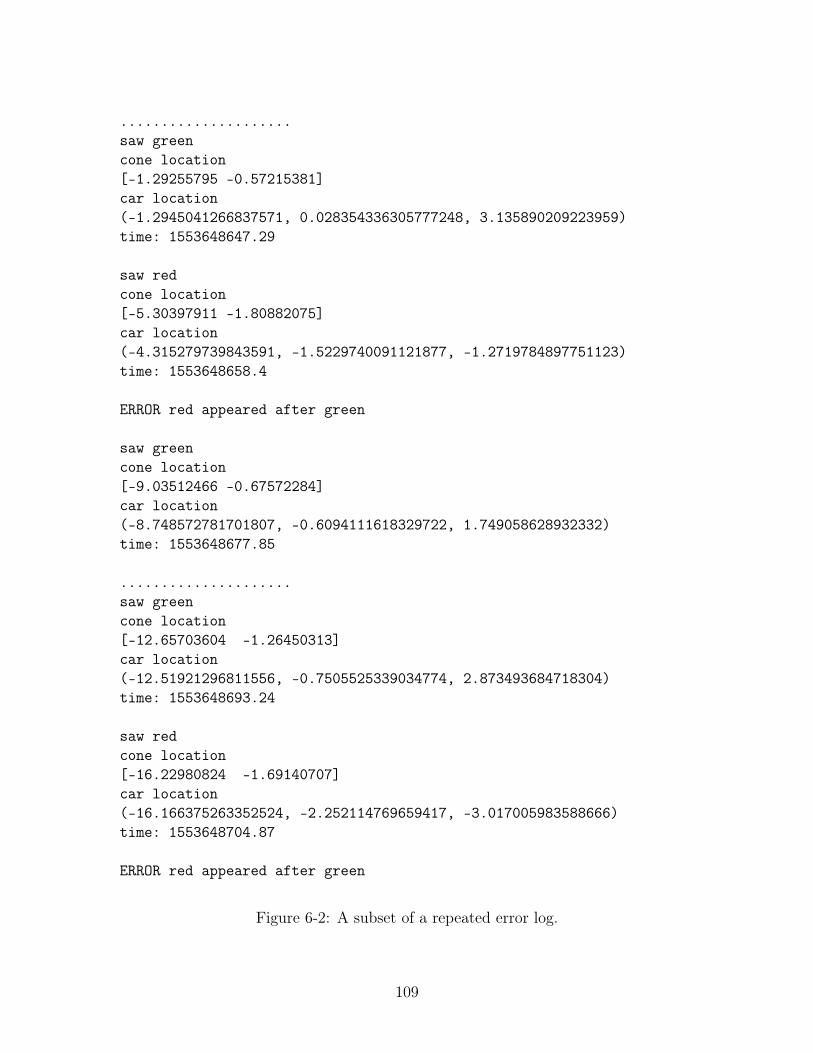
.....................saw greencone location[-1.29255795 -0.57215381]car location(-1.2945041266837571, 0.028354336305777248, 3.135890209223959)time: 1553648647.29
saw redcone location[-5.30397911 -1.80882075]car location(-4.315279739843591, -1.5229740091121877, -1.2719784897751123)time: 1553648658.4
ERROR red appeared after green
saw greencone location[-9.03512466 -0.67572284]car location(-8.748572781701807, -0.6094111618329722, 1.749058628932332)time: 1553648677.85
.....................saw greencone location[-12.65703604 -1.26450313]car location(-12.51921296811556, -0.7505525339034774, 2.873493684718304)time: 1553648693.24
saw redcone location[-16.22980824 -1.69140707]car location(-16.166375263352524, -2.252114769659417, -3.017005983588666)time: 1553648704.87
ERROR red appeared after green
Figure 6-2: A subset of a repeated error log.
109

The following events are repeats and shouldbe new rules.Found the explanation
ERROR red appeared after greenFound triple ['red', 'after', 'green']
:added-rule-1 a air:Belief-rule;air:if {
foo:red ontology:after foo:green. };air:then[
air:description("ERROR red appeared after green");
air:assert[air:statement{foo:coneair:compliant-with:learned_policy .}]] ;
air:else [air:assert[air:statement{foo:coneair:non-compliant-with
:learned_policy .}]] ;
Figure 6-3: The output of the rule learning system for the repeated error in Figure6-2 that should be parsed into a new rule. The resulting rule text is appended to therule file and updated in the monitoring system.
110

6.4 Applying Rule Learning
The results presented are for a specific hardware robot in a simplified real-world
environment. In this section, I outline the requirements to apply this methodology
to a new hardware specification, task, or domain. This methodology is designed to
be incorporated with the reasonableness monitoring system. For an arbitrary system,
rule-learning can be applied as long as these constraints are met:
• Data: The system being monitored needs to be able to log its system state. An
ontology for the log needs to be defined.
• Monitoring system: The system should be wrapped in a reasonableness monitor.
This requires an ontology for data (described above), and reasonableness rules.
• Explanation "evaluation": The rule-learning prototype needs a given metric
to determine what is anomalous or not. In the autonomous driving domain, I
used a sentiment score that ranked whether the explanation had a dangerous
or erroneous sentiment.
6.5 Limitations
The traffic light experiment presented here is a simple example of how anomaly de-
tection coupled with a rule updating framework could work together in real life to
inform the car of unreasonable and strange sightings. However, to be applicable to
the complex series of actions and language for autonomous vehicles, the system will
need a human-in-the-loop for verification.
The explanation "evaluation" for the RACECAR application is oversimplified. It
does not utilize the contextual information from the vehicle’s state and surroundings
in making the decision as to whether or not to add the rule to the rule set. Adding
context to each anomaly helps explain why the rule was broken. For example, one
rule of the road states that vehicles shall not drive through red lights. However, if
a car happens to observe multiple times that an emergency vehicle drives through a
111

red light, it should not add to its own rule set that it should be able to drive through
a red light. The context of the rule breaking situation, in this case it is an emergency
vehicle that drove through the red light and not other vehicles, is an important factor
in deciding whether to augment the given rule set based on observations.
My system has trouble with the cases mentioned in Section 6.3.3, and it also
has trouble with out of vocabulary explanations. The current rule-learning platform
examines the sentiment of an explanation and then parses the explanation into the
appropriate rule format. The goal is to take a human readable explanation in plain
text, and parse that into an “if this then that” format rule. Usually, this relies on
looking for symbolic causal terms in the explanation, like “because” or time-varying
symbolic terms like “before” and “after.” If these keywords are not found in the
explanation, the system fails to construct a rule. Dealing with out-of-vocabulary
explanations and complex actions will be examined in future work.
Figure 6-4: The dynamic reasonableness monitoring architecture.
112

6.6 Ongoing Work
Currently, the experiment is setup in a series of steps, and it is not a “real-time” sys-
tem. The goal is for the monitor to be constantly running along side the RACECAR
(or other autonomous system) so that is learning and monitoring more effectively.
This process is visualized in Figure 6-4. The grey arrows designated ongoing work in
closing the loop for the rule leaning system to work dynamically with the monitoring
system in real-time.
In the current iterations of this system, the explanations are generated separately,
incorporated into the log, and then processed by the rule learning system. If a new
rule is generated, then the rule list is augmented with the new rule, and the monitor is
updated. In future iterations of the system, I will add explanations from the monitor
to the rule learning system. The key idea is that the monitor is adaptable; not just
to multiple applications, but also to multiple domains and situations. The behavior
of the monitor (and all similar agents) should be flexible and self-aware; so that its
own explanations can be used to justify similar actions in the future.
6.7 Contributions and Discussion
Driving is a complex task, and corner cases lack the large volume of training data nec-
essary for models to make the correct decision based on input. Instead of exhausting
all possibilities for driving corner cases, I propose that the autonomous system can
evaluate a new situation using two components - commonsense and a set of driving
rules - and then explain its decision based on this information. Analogous to how
humans approach a new situation, the autonomous vehicle would make a decision
using prior knowledge and applicable driving rules. Those driving rules can then be
updated as the car witnesses new situations.
My system, implemented as a dynamic monitor around the self driving unit, checks
vehicle data and decisions for expected validity and reasonableness. The decision
is reasonable if follows the rules set and commonsense knowledge base for the au-
113

tonomous system. Similarly to how biologists are able to classify newly discovered
species using a set of taxonomy rules, the set of driving rules can be applied to un-
foreseen situations that the system has never encountered before and make inferences
about what driving actions are reasonable. As the autonomous vehicle encounters
new situations, the set of driving rules can be updated to reflect acceptable behavior
and expected encounters in the driving world. I propose that the information gap
created by the incompleteness of anomalous training data can be supplemented by
commonsense along with a set of rules regarding appropriate behavior. It is based on
the system in Chapter 4.
This chapter focuses on building and using the RACECAR platform to evaluate
the performance of the reasonableness monitor in dynamic and new environments.
This was an initial study and the work can be expanded to include a richer set of
data used in decision making, such as vehicle position, cone position, vehicle speed,
information from potential other vehicles around the autonomous vehicle. A far more
expansive set of rules can also be applied to the car’s behavior and observations.
The set of rules should originate from a driving handbook, which details the literal
rules set for the vehicles on the road. Additionally, given that autonomous vehicles
interact with other vehicles and it would be interesting to apply the anomaly detection
and adaptable monitoring system to an autonomous vehicle in the presence of other
possibly non-autonomous vehicles.
114

Chapter 7
System-wide Anomaly Detection
“We’ll show you that you can build a mind from many little parts, each
mindless by itself...” 1
– Marvin Minsky
A previously working mechanism can fail in two distinct ways. One way is a local
failure, caused by an error that can be localized to a single subsystem or compo-
nent. I discussed how to localize opaque subsystem errors in Chapter 4 and how to
localize sensor errors in Chapter 5. The second way a mechanism can fail is due to
a failed communication amongst subsystems, which was the root cause of the Uber
self-driving vehicle accident2 [134]. In this chapter, I present an organizational ar-
chitecture: Anomaly Detection through Explanations (ADE), which enables internal
communication amongst the subsystems of a complex machine. It is inspired by the
structure of successful human organizations. As Herb Simon said, “communication is
‘absolutely essential to organizations’ ” [208].
1The revelation of Marvin Minsky’s connection with Jeffrey Epstein came at the pinnacle of myPhD research. Because of that association, I was conflicted about whether to include Minsky’s wordsand his prior work. I believe that it is important to be intellectually honest: I acknowledge thatthis chapter is inspired by Minsky’s research. My inclusion of Minsky’s words does not imply mysupport for any of Epstein’s behavior or that of his associates.
2When inconsistent judgements arise, an arbitrary subsystem is ignored:https://www.theinformation.com/articles/uber-finds-deadly-accident-likely-caused-by-software-set-to-ignore-objects-on-road
115

7.1 The Problem
Complex mechanisms have limited internal reasoning. In some cases, they have none;
so they have no ability to reason. For self-driving vehicles, adversarial attacks using
a few pieces of tape tricked a vision system into classifying a perceived a stop sign
as a 45 mph sign [58]. Biased facial recognition algorithms3 have been extended to
pedestrian detection [237]. It is well known that the “best performing” AI algorithms
are brittle, “deep learning” subsystems [170]. But when these algorithms are connected
to self-driving applications or other mission-critical, safety-critical applications, these
mistakes have consequences.
I created a system-wide architecture that facilitates communication amongst parts.
The communication is a symbolic explanation. The key idea is that the explanation
is for the machine4; the underlying explanations to reconcile inconsistencies amongst
subsystems.
But how does the architecture decide for itself which subsystem or component is
the most “correct” or “reasonable?” To deal with conflicting explanations, I built an
explanation synthesizer; which examines the input explanations, and validates that
the underlying reasons do not violate the high-level rules from a priority hierarchy.
In this chapter, I demonstrate the ADE on a critical example: the Uber self-driving
vehicle accident [180]. For quantitative analysis, I inserted failures in an existing
self-driving vehicle data set [31]. My analysis in Section 7.4.5 shows that using ADE,
with an explanation synthesizer results in more robust failure detection.
7.2 System Monitoring Architecture
The ADE architecture is composed of reasonableness monitors around each subsys-
tem and a explanation synthesizer to reconcile inconsistencies amongst underlying
3Facial recognition systems misidentify people with darker skin tones 5-10 times more than lighterskin tones [86].
4In Chapter 4, I showed the output of a reasonableness monitor: a natural-language explanationsfor an end user. I mentioned that the explanations are also symbolic. This chapter contributes anovel use of symbolic, dynamic explanations for machine diagnosis.
116

subsystems. The ADE reasoning method detects failures and anomalies in three
steps:
1. Generating qualitative descriptions for each committee or subsystem.
2. Monitoring the outputs of each committee or subsystem.
3. Detecting, reconciling, and explaining inconsistencies5.
The ADE architecture in Figure 7-1 is a simplified model of a self-driving car6. It
is the minimal architecture needed to (1) detect and explain the cause of the Uber
self-driving accident (in Section 7.4.2) and to (2) diagnose the mistakes I inserted, in
Section 7.4.4. The dotted borders around the subsystems are reasonableness monitors.
The translucent red component is the actuation committee, which reports to the
tactics monitor. The grey component is the explanation synthesizer, which monitors
explanation outputs from the vision, LiDAR, and tactics subsystems.
There is a difference between a committee and a subsystem. A committee is a
group of subsystems working together on a common task in the same language. For
example, the tactics subsystem in Figure 7-1 contains the actuation committee. The
actuation committee is composed of the braking, steering, and power subsystems.
These subsystems work on the common task of moving and controlling the mechanics
for driving a car. They communicate in the same CAN bus message language (from
Section 3.1.1). For readability of the reasoning process, I refer to the actuation
committee as the tactics subsystem.
7.2.1 Inspiration from Human Committee Structures
I have represented a complex system as a hierarchical model of introspective sub-
systems working together towards a common goal. This idea is inspired by human
committee structures. In a human organization, tasks are distributed to committees
5If no inconsistencies are detected, then a summary is produced. The summary is a synthesizedstory of the underlying subsystem explanations.
6A comprehensive architecture may enable more effective reasoning in real-world environments.
117
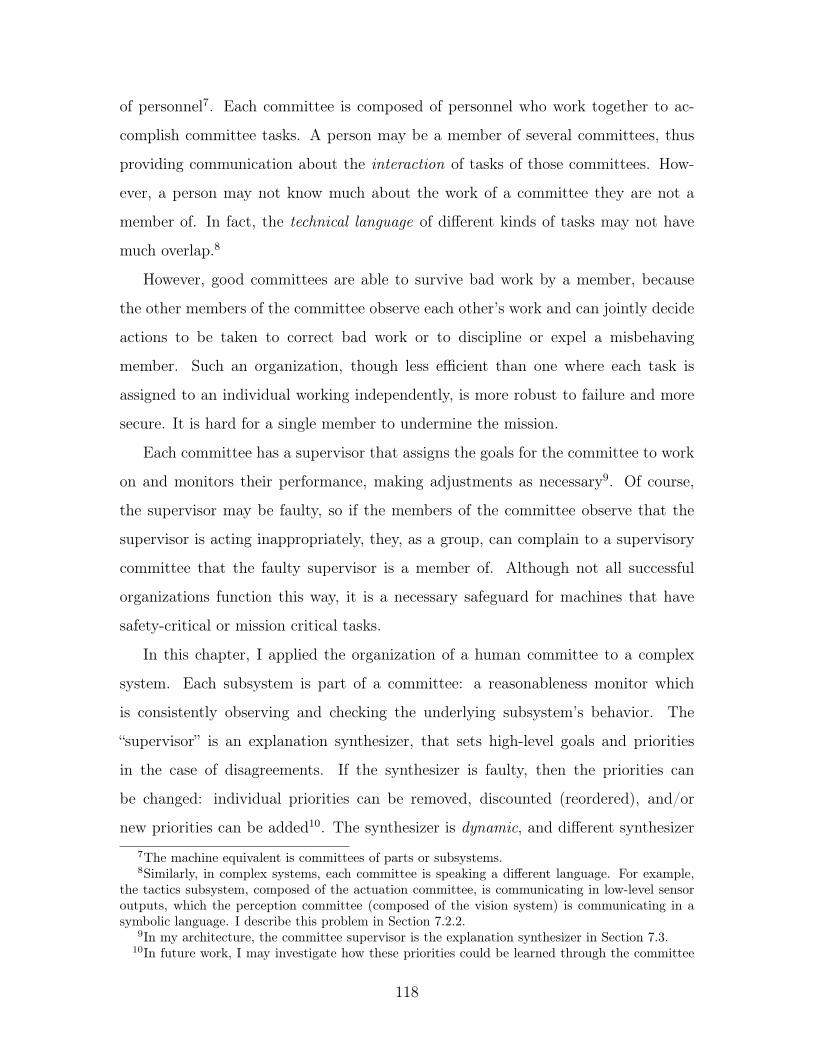
of personnel7. Each committee is composed of personnel who work together to ac-
complish committee tasks. A person may be a member of several committees, thus
providing communication about the interaction of tasks of those committees. How-
ever, a person may not know much about the work of a committee they are not a
member of. In fact, the technical language of different kinds of tasks may not have
much overlap.8
However, good committees are able to survive bad work by a member, because
the other members of the committee observe each other’s work and can jointly decide
actions to be taken to correct bad work or to discipline or expel a misbehaving
member. Such an organization, though less efficient than one where each task is
assigned to an individual working independently, is more robust to failure and more
secure. It is hard for a single member to undermine the mission.
Each committee has a supervisor that assigns the goals for the committee to work
on and monitors their performance, making adjustments as necessary9. Of course,
the supervisor may be faulty, so if the members of the committee observe that the
supervisor is acting inappropriately, they, as a group, can complain to a supervisory
committee that the faulty supervisor is a member of. Although not all successful
organizations function this way, it is a necessary safeguard for machines that have
safety-critical or mission critical tasks.
In this chapter, I applied the organization of a human committee to a complex
system. Each subsystem is part of a committee: a reasonableness monitor which
is consistently observing and checking the underlying subsystem’s behavior. The
“supervisor” is an explanation synthesizer, that sets high-level goals and priorities
in the case of disagreements. If the synthesizer is faulty, then the priorities can
be changed: individual priorities can be removed, discounted (reordered), and/or
new priorities can be added10. The synthesizer is dynamic, and different synthesizer7The machine equivalent is committees of parts or subsystems.8Similarly, in complex systems, each committee is speaking a different language. For example,
the tactics subsystem, composed of the actuation committee, is communicating in low-level sensoroutputs, which the perception committee (composed of the vision system) is communicating in asymbolic language. I describe this problem in Section 7.2.2.
9In my architecture, the committee supervisor is the explanation synthesizer in Section 7.3.10In future work, I may investigate how these priorities could be learned through the committee
118

Figure 7-1: The ADE architecture model for a simplified self-driving vehicle. It iscomposed of reasonableness monitors (dotted borders) around each subsystem andexplanation synthesizer
configurations yield different safeguards. I show the results of different configurations
in Section 7.4.5.
I call this idea “committee-based anomaly detection with explanations.” I show
that using (1) a common symbolic explanation language (2) a system organization of
introspective committees (reasonableness monitors applied to full subsystem design),
results in a more robust system. The subsystems monitor each other’s behavior, and
disagreements amongst parts are identified with less ambiguity, since the internal
communication is in a common language.
7.2.2 Generating Qualitative Descriptions
The outputs11 of the parts of any complex machine vary in abstraction. For example,
the labels output by an opaque vision processing systems in Chapter 4 are a mostly
symbolic list of high-level concepts. The sensor subsystems, e.g., LiDAR or weather
sensors, output a (possibly uninterpretable) log of data12. But to reconcile inconsis-
tencies between subsystems, the subsystems need to argue amongst themselves. The
arguments must be in the same language, otherwise vital reasons may be discounted
member’s explanations.11The outputs of a subsystem may be an action (e.g. a mechanical action like tightening a pinion)
or a log (e.g. the readings of a tire pressure sensor over a time interval).12These sensor output logs are typical of other “lower level” subsystems of the vehicle, like braking,
steering, power control, etc. I explained how to interpret these basic outputs after-the-fact inChapter 3. Another example is the “point cloud” output from the LiDAR subsystem in Chapter 5.
119

IF( AND('(?x) is moving''(?x) isA animal',THEN('(?x) is reasonable.'))
Listing 8: A reasonableness rule for perception. If an object is perceived as movingand the object is an animal, then it is a reasonableness perception.
arbitrarily.
The subsystem’s output is translated into a qualitative description. For the vision
system, these are the output labels from the vision processing subsystem. For the
LiDAR system, this is the sensor interpretation from Chapter 5, and for the tactics
subsystem (which corresponds to the brakes, steering, and power control) it is the
qualitative summary and analysis generated from the ex post facto explanation system
from Chapter 3. A list of the qualitative descriptions from each subsystem are input
into a reasonableness monitor [73]. Each monitor outputs for symbolic support and a
justification of reasonableness. These justifications are the basis for each subsystem’s
argument.
7.2.3 Monitoring for Reasonableness within Each Subsystem
Recall from Chapter 4 that a reasonableness monitor is a sanity check for the outputs
of a subsystem. The list of qualitative descriptions forward-chained with common-
sense rules to extract more data. Each subsystem has its own set of commonsense
rules. For lower-level components (e.g., the tactics subsystem) these are safe-driving
rules. For example, if a vehicle is traveling at a high speed, then the vehicle should
not make a sudden stop. Other safe-driving rules implement a qualitative physics
idea: if the vehicle slows down and changes direction slowly, then the resulting turn
is safe13.
After forward-chaining, the monitor checks the data against a set of reasonableness
rules. Similarly to commonsense, each subsystem has its own set of reasonableness
rules. The monitor outputs a judgement and justification of whether the input de-
scription is reasonable or not. An input is deemed “unreasonable” if there is no data13This is defined precisely in first-order logic.
120

to support a reasonable claim, i.e., no data fires a rule that leads to a “reasonable”
consequent. An example of a reasonableness rule for perception is in Listing 8.
Note that an unreasonable judgement does not necessarily indicate that a sub-
system should be completely ignored. An unreasonableness judgement indicates that
the subsystem’s output should be discounted in future decisions. For example, in the
Uber self-driving car accident, which is described in Section 7.4.2, the vision process-
ing subsystem perceived several different objects where the pedestrian was located: a
bicycle, a vehicle, and an unknown object. The vision subsystem is acting unreason-
ably, it is not possible to perceive three different objects in the same location. The
vision system outputs should be discounted, but not completely disregarded. The
vision system is not corrupted, it’s confused. The detection of an object in that place
is reasonable and correct, and the detection is used in the explanation synthesizer as
evidence. The technical details of this reasoning is in Section 7.4.3.
7.2.4 Reconcile Inconsistencies with a Synthesizer
If there are conflicts between explanations, the explanation synthesizer decides which
subsystem to trust or discount. The synthesizer uses a priority hierarchy, which
indicates, in order, which priorities are the most important. If any of those priori-
ties are violated, then that subsystem should be examined and its output should be
discounted for in future decisions.
7.3 Explanation Synthesizer
The explanation synthesizer is an explanation compiler. It processes the explanations
from its underlying parts, and synthesizes (or summarizes) the explanations. If there
are conflicting explanations, the synthesizer constructs an argument tree. The argu-
ment tree contains all the reasons that need to be tested to validate each priority.
The argument tree is dynamic. If more information is available, it can be added. If
data is deemed invalid, that data can be removed. Since the arguments are a tree,
the synthesizer can also be queried for counterfactual support. This may useful in an
121

adversarial proceeding, which is discussed in Chapter 8.
7.3.1 Priority Hierarchy
Erroneous driving is prevalent in human and autonomously operated vehicles. Per-
haps the operator glides through a stop sign (even though that conflicts with a driv-
ing rule) since no one is around. The behavior does not have consequences, and it
is supported by a reasonable explanation, “since no one was around, the operator
proceeded through a stop sign, even though the operator should have stopped due to
the stop-sign rule.” Since there are no consequences, this erratic behavior should not
be classified as a failure14.
However, some errors can cause system failures. For example, if the vehicle op-
erator cannot identify a large object in the road, it should stop regardless. Large
objects, especially ones that are moving, are threats to the vehicle and the people
inside. Whereas smaller unidentified objects are not usually harmful to the vehicle.
For example, moving transparent objects, like plastic bags, should be ignored. But
small sharp objects, like nails, or potholes and uneven paving can can flat tires, lead-
ing to accidents and passenger discomfort. Most autonomous vehicles struggle with
this sort of reasoning, causing consistent starting and stopping behavior15.
I created a priority hierarchy to apply high-level safety constraints in self-driving.
The priorities are as follows (in order):
1. Passenger Safety
2. Passenger Perceived Safety
3. Passenger Comfort
4. Efficiency (e.g. Route efficiency)
14Of course, this behavior should be recorded to avoid a repeated error in a critical environment.15“Herky jerky” or constant starting and stopping has become an “Achilles heal” for self-
driving: https://www.wired.com/story/ride-general-motors-self-driving-car/. This dis-comfort lead many vehicle manufacturers to explicitly ignore objects detected with low confidencescores, instead of trying to reason about which objects are threats (or not).
122

A passenger is safe if:The vehicle proceeds at the same speed and direction, AND
The vehicle avoids threatening objects.
Figure 7-2: The conditions for passenger safety as a natural language abstract goal.
In this chapter, I specifically focus on the first priority: passenger safety16. Pas-
senger safety can be expressed as an abstract goal in Figure 7-2. It requires two
conditions: the vehicle needs to be proceeding “safely”: there does not exist any sud-
den changes in vehicle speed or direction. The other condition is that there are no
threats : large moving objects close to the vehicle. The major cause of failures in
autonomous driving have been due to violating these two constraints [151].
7.3.2 Underlying Logic Language
Let’s focus on the high level goal for the first priority: passenger safety, in Figure 7-2.
This goal can be strongly defined in first-order logic. Let 𝑠 and 𝑡 be successive states,
and let 𝑣 be a qualitative description of the vehicle’s velocity. Then Equation 7.1
defines the sufficient conditions for passenger safety.
(∀𝑠, 𝑡 ∈ 𝑆𝑇𝐴𝑇𝐸, 𝑣 ∈ 𝑉 𝐸𝐿𝑂𝐶𝐼𝑇𝑌
((𝑠𝑒𝑙𝑓,𝑚𝑜𝑣𝑖𝑛𝑔, 𝑣), state, 𝑠)∧
(𝑡, isSuccesorState, 𝑠)∧
((𝑠𝑒𝑙𝑓,𝑚𝑜𝑣𝑖𝑛𝑔, 𝑣), state, 𝑡)∧
(@𝑥 ∈ 𝑂𝐵𝐽𝐸𝐶𝑇𝑆 s.t.
((𝑥, 𝑖𝑠𝐴, 𝑡ℎ𝑟𝑒𝑎𝑡), state, 𝑠)∨
((𝑥, 𝑖𝑠𝐴, 𝑡ℎ𝑟𝑒𝑎𝑡), state, 𝑡)))
⇒ (passenger, hasProperty, safe)
(7.1)
As long as the vehicle is moving at the same speed, and there are no threatening
16I worked on a short technical report about different metrics of efficiency. I co-authored a short article on different navigation “efficienty” metrics: https://aipulse.org/mob-ly-app-makes-driving-safer-by-changing-how-drivers-navigate/
123
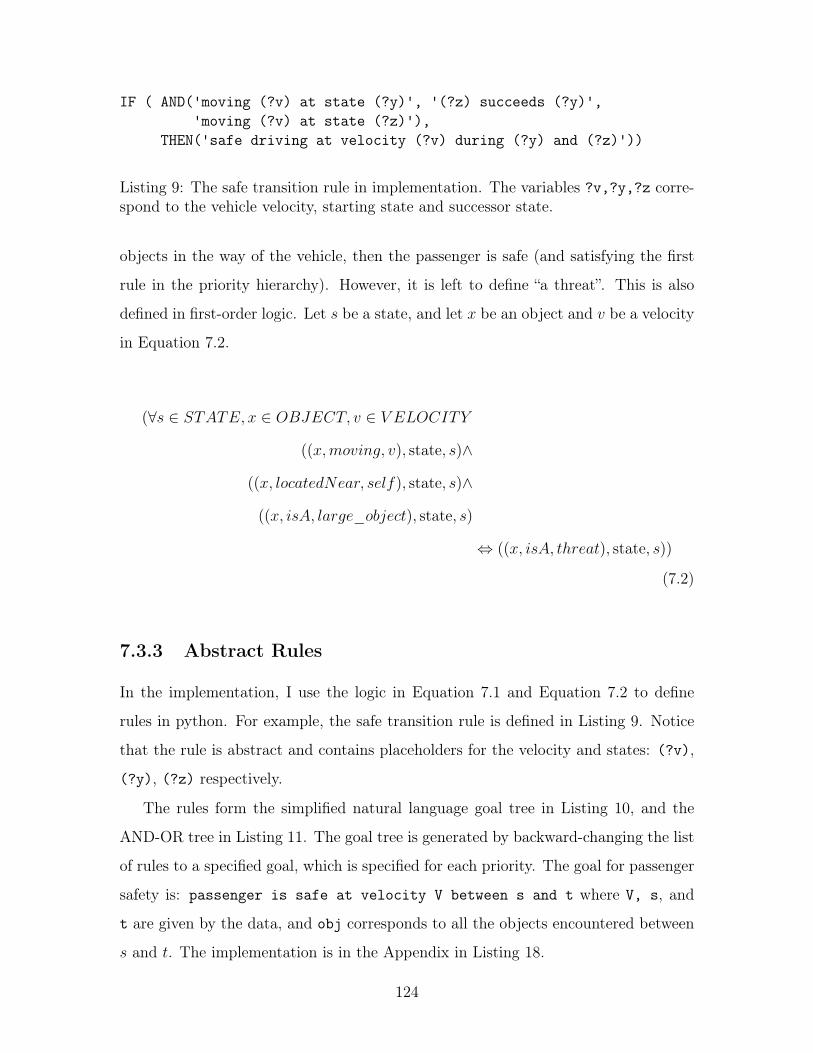
IF ( AND('moving (?v) at state (?y)', '(?z) succeeds (?y)','moving (?v) at state (?z)'),
THEN('safe driving at velocity (?v) during (?y) and (?z)'))
Listing 9: The safe transition rule in implementation. The variables ?v,?y,?z corre-spond to the vehicle velocity, starting state and successor state.
objects in the way of the vehicle, then the passenger is safe (and satisfying the first
rule in the priority hierarchy). However, it is left to define “a threat”. This is also
defined in first-order logic. Let 𝑠 be a state, and let 𝑥 be an object and 𝑣 be a velocity
in Equation 7.2.
(∀𝑠 ∈ 𝑆𝑇𝐴𝑇𝐸, 𝑥 ∈ 𝑂𝐵𝐽𝐸𝐶𝑇, 𝑣 ∈ 𝑉 𝐸𝐿𝑂𝐶𝐼𝑇𝑌
((𝑥,𝑚𝑜𝑣𝑖𝑛𝑔, 𝑣), state, 𝑠)∧
((𝑥, 𝑙𝑜𝑐𝑎𝑡𝑒𝑑𝑁𝑒𝑎𝑟, 𝑠𝑒𝑙𝑓), state, 𝑠)∧
((𝑥, 𝑖𝑠𝐴, 𝑙𝑎𝑟𝑔𝑒_𝑜𝑏𝑗𝑒𝑐𝑡), state, 𝑠)
⇔ ((𝑥, 𝑖𝑠𝐴, 𝑡ℎ𝑟𝑒𝑎𝑡), state, 𝑠))
(7.2)
7.3.3 Abstract Rules
In the implementation, I use the logic in Equation 7.1 and Equation 7.2 to define
rules in python. For example, the safe transition rule is defined in Listing 9. Notice
that the rule is abstract and contains placeholders for the velocity and states: (?v),
(?y), (?z) respectively.
The rules form the simplified natural language goal tree in Listing 10, and the
AND-OR tree in Listing 11. The goal tree is generated by backward-changing the list
of rules to a specified goal, which is specified for each priority. The goal for passenger
safety is: passenger is safe at velocity V between s and t where V, s, and
t are given by the data, and obj corresponds to all the objects encountered between
𝑠 and 𝑡. The implementation is in the Appendix in Listing 18.
124

passenger is safe,AND(
safe transitions,NOT(threatening objects)
Listing 10: The high-level goal tree for passenger safety. It ensures that the thevehicle avoids threatening objects (large, moving objects located close to the vehicle)and it makes smooth transitions (there is not a large or sudden qualitative changebetween two successive state).
passenger is safe at velocity V between s and tAND( AND( moving V at state s
t succeeds smoving V at state t )
AND(OR ( obj is not moving at s
obj is not locatedNear at sobj is not a large object at s)
OR ( obj is not moving at tobj is not locatedNear at tobj is not a large object at t ) ) )
Listing 11: The implemented goal tree used for passenger safety in the explanationsynthesizer. ‘safe transitions’ and ‘threatening objects’ have been expanded, as de-fined in Equation 7.1 and Equation 7.2.
125

passenger perceived safe,AND(
cautious transitions,NOT(ominous objects) )
Listing 12: The high-level natural language goals for passenger perceived safety.
The other abstract rules for the other properties are not used in this implemen-
tation. The focus of this work is to detect failures that can cause harm, and the first
priority is sufficient to ensure that. But for sake of example, the natural language
abstract goal tree for perceived safety is in Listing 12. Note it is assumed that the
first priority has been met for all transitions. So that this priority checks for different
behaviors: cautious transitions (which is defined as avoiding reckless driving) and not
avoiding ominous objects17.
7.4 Evaluation
In order to evaluate ADE, I relied on two studies. My colleagues and I simulated the
Uber accident and generated a log that was similar to the accident data from their
report [80, 180]. I validated that the algorithm (1) detected the inconsistency and (2)
could explain the inconsistency and why it is critical (in terms of the given priority
hierarchy). I also wanted to ensure that the explanation was “similar” to the to the
Uber accident testimony; that the explanation was true to the failure explained in
the Uber report. The second evaluation is a quantitative study to detect and explain
simulated failures. To my knowledge, this is the first data set of multimodal failures
in the self-driving vehicle domain18.
17This was not explored. But an ominous object may be something with a big shadow: someillusion that appears larger than it actually appears.
18A self-driving vehicle has multimodal interaction (multiple modes of interaction) with an oper-ator: haptic feedback, video, etc.
126
7.4.1 Simulation Setup
The simulation modeled the events of the Uber Accident Scenario described in detail
below. This simulation was performed using CARLA, an open-source simulator for
self-driving research [56]. The primary data recorded in this simulation included raw
images, semantic-segmented images, and LiDAR point clouds.
The simulation was performed on a machine running Ubuntu 18.04 LTS. The
version of CARLA running on the machine at the time of testing was 0.9.6. In
addition, CARLA renders the simulation using Unreal Engine, which has was installed
separately. I used Unreal Engine version 4.22 for testing.
7.4.2 Uber Accident Scenario
On March 18, 2018, the first reported self-driving pedestrian fatality occurred. The
vehicle was an Uber Technologies, Inc. test vehicle: a modified 2017 Volvo XC90
with a self-driving system in computer control mode. At approximately 9:58 p.m
that evening, the vehicle struck a pedestrian on northbound Mill Avenue, in Tempe,
Maricopa County, Arizona. Although the test vehicle had a human safety driver, the
driver was not paying attention at the moments before impact. The following is from
the Uber accident preliminary report.
“According to data obtained from the self-driving system, the system first
registered radar and LiDAR observations of the pedestrian about 6 sec-
onds before impact, when the vehicle was traveling at 43 mph. As the
vehicle and pedestrian paths converged, the self-driving system software
classified the pedestrian as an unknown object, as a vehicle, and then
as a bicycle with varying expectations of future travel path. At 1.3 sec-
onds before impact, the self-driving system determined that an emergency
braking maneuver was needed to mitigate a collision. According to Uber,
emergency braking maneuvers are not enabled while the vehicle is under
computer control, to reduce the potential for erratic vehicle behavior. The
vehicle operator is relied on to intervene and take action. The system is
127
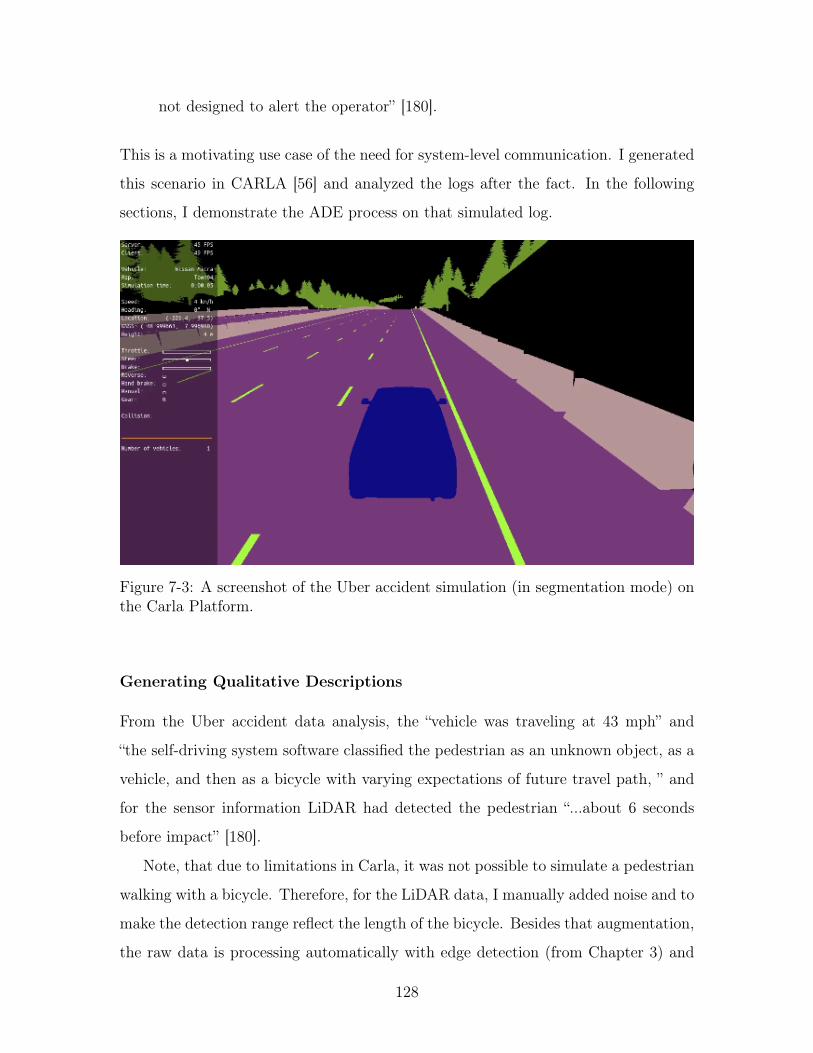
not designed to alert the operator” [180].
This is a motivating use case of the need for system-level communication. I generated
this scenario in CARLA [56] and analyzed the logs after the fact. In the following
sections, I demonstrate the ADE process on that simulated log.
Figure 7-3: A screenshot of the Uber accident simulation (in segmentation mode) onthe Carla Platform.
Generating Qualitative Descriptions
From the Uber accident data analysis, the “vehicle was traveling at 43 mph” and
“the self-driving system software classified the pedestrian as an unknown object, as a
vehicle, and then as a bicycle with varying expectations of future travel path, ” and
for the sensor information LiDAR had detected the pedestrian “...about 6 seconds
before impact” [180].
Note, that due to limitations in Carla, it was not possible to simulate a pedestrian
walking with a bicycle. Therefore, for the LiDAR data, I manually added noise and to
make the detection range reflect the length of the bicycle. Besides that augmentation,
the raw data is processing automatically with edge detection (from Chapter 3) and
128

Figure 7-4: The qualitative description outputs from my simulation of the Uberaccident in the ADE architecture.
sensor interpretation (from Chapter 5). Since the vision system outputs symbolic
concepts, I represented the outputs of the vision system as oscillating among: vehicle,
bike, and an unknown object. This is shown in a diagram of the ADE architecture
in Figure 7-4.
Monitoring
Each qualitative description is input into reasonableness monitor. The monitored
outputs are as follows (in human readable form):
1. VISION: This vision perception is unreasonable. There is no commonsense data
supporting the similarity between a vehicle, bike and unknown object except
that they can be located at the same location. This component’s output should
be discounted.
2. LIDAR: This lidar perception is reasonable. An object moving of this size is a
large moving object that should be avoided.
129

3. TACTICS: This system state is reasonable given that the vehicle has been
moving quickly and proceeding straight for the last 10 second history.
Note, that these are also represented in symbolic triples to be used by the synthe-
sizer. The triples are stored in a pandas table so they are also indexed19.
Synthesizing
The explanations are symbolic. Below are a few highlights of these reasons (the ones
that are deemed “important” for the synthesizer).
1. VISION:
(monitor, judgement, unreasonable)
(input, isType, labels)
(all_labels, inconsistent, negRel)
(all_labels, notProperty, nearMiss)
(all_labels, locatedAt, consistent)
(monitor, recommend, discount)
2. LIDAR:
(monitor, judgement, reasonable)
(input, isType, sensor)
(input_data[4], hasSize, large)
(input_data[4], IsA, large_object)
(input_data[4], moving, True)
(input_data[4], hasProperty, avoid)
(monitor, recommend, avoid)
Note: input_data[4] corresponds to the detection of the pedestrian with the
bicycle. There were other, smaller objects detected that were not deemed
threats.19Indexing is essential, so that the triples can refer to other triples. Although, the lat-
est version of RDF, published in 2014, allows for RDF Quads https://www.w3.org/TR/2014/REC-rdf11-concepts-20140225/.
130

3. TACTICS:
(monitor, judgement, reasonable)
(input, isType, history)
(input_data, moving, True)
(input_data, direction, forward)
(input_data, speed, fast)
(input_data, consistent, True)
(monitor, recommend, proceed)
These symbolic reasons are passed to the explanation synthesizer, which finds that
the LiDAR’s data, specifically, the object described in input_data[4], violates the
goal: NOT (‘threatening objects’). The final output, is the follow explanation,
in human readable form:
The best option is to veer and slow down.
The vehicle is traveling too fast to suddenly stop.
The vision system is inconsistent, but the LiDAR system
has provided a reasonable and strong claim to avoid the object
moving across the street.
This is shown graphically in Figure 7-5, where the corresponding reasons are high-
lighted in the final judgment and explanation.
7.4.3 Reasoning
How does the synthesizer reason about threatening objects? We see that the LiDAR
detection: input_data[4] is a threat. But how does the synthesizer know that? The
synthesizer checks if the goal tree is satisfied. But a statement is not met: OR ( obj
is not moving at s, obj is not locatedNear at s, obj is not a large object
at s) from Listing 11 is not satisfied. This fires the threat rule. Now the synthesizer
has added new data: (input_data[4], IsA, threat). This new piece of data is
131

Figure 7-5: The symbolic reasons that are used in the explanation synthesizer.
a “strong” reason. It is the argument in the synthesizer’s explanation to trust the
LiDAR subsystem and discount the vision subsystem.
7.4.4 Adding Mistakes to Existing Data
Self-driving data sets [31, 110, 69] do not contain errors that could lead to failures.
They are hand-curated, so that the labelings and bounding boxes are error-free. The
vehicle tactics operation is also smooth, so that there are not egregious mistakes in
driving behavior. Since the data sets themselves do not have failures to explain, I
added failures20. I scrambled labels and added noise. I hypothesized that the ADE
architecture’s explanation synthesizer would (1) more robustly identify a failure (2)
explain which subsystem failed and why.
To valdiate my hypothesis, I added mistakes to the NuScenes data set [31].
NuScenes data was collected in various conditions, including dense traffic and chal-
lenging driving scenarios21. It also has a more complete 360 view camera, rather than
20In Section 1.1, I described an error as a technical property, and a failure as an error withconsequences. While I cannot add “true” failures because the data set is already curated (i.e. themistakes I add do not have consequences), I refer to these as failure since if the mistakes wereoccurred in an existing self-driving vehicle, they could cause system failures.
21NuScenes data was collected in Boston and Singapore; two very difficult (and different) drivingenvironments).
132

the front facing camera data on KITTI [69]. NuScenes has 1000 different scenes (20
clips of driving) where each scene is split into frames (I refer to frames as snapshots).
I define two types of mistakes: a frame error (a single point in time where obstacles
are incorrectly labeled) and a scene error (a prolonged error over several frames).
I invoked errors at the frame level. For each frame, 50% of the objects in that frame
are scrambled. This is performed randomly: when a frame is loaded, a scrambleFlag
vector is randomized with 1’s and 0’s; corresponding to whether the object in question
should be “scrambled” or not. I invoked two types of errors:
1. Label Errors: The “true” object label is replaced with another label.
2. “Noise” Errors: The object size is perturbed.
Label errors are chosen at random and retain the same label distribution on the
data set. Noise errors are also chosen at random, but require careful manipulation.
Naively adding random numbers to the object size clearly results in an error. For
example, a car that is over 20 meters wide is clearly wrong. So instead, I added
random noise from the range [0, 2𝜎], where 𝜎 is the standard deviation of the object
size in meters. Therefore I generate a set of noisy sizes, which are not “clearly wrong,”
but near misses [238].
A series of experiments are in Table 7.1. The table has three different configu-
rations of the explanation synthesizer: no synthesizer (baseline), a naive preference
(choosing one component over the other), and the “safety” priority explained in Sec-
tion 7.3.1. The accuracy and analysis is shown in Table 7.1. This table contains the
average of 10 randomized runs on the 18,538 annotations (objects detected) in the
NuScenes mini data set.
7.4.5 Evaluation of Inserted Errors
Synthesizing increases correctness of accuracy of detecting errors. Note that the
method is susceptible to false positives and negatives. Since I add noise in a reasonable
range, i.e., [0, 2𝜎], to scramble the data, it is difficult to separate errors from noise. If
133

instead, I added noise that is significantly greater than 2𝜎, then the number of false
positives and false negatives approaches zero, since the subsystem explanation clearly
identifies a local error, and the synthesizer can confidently determine which system
to discount.
Priority Correctness False Positives False NegativesNo synthesizer 85.6% 7.1% 7.3%
Single subsystem 88.9% 7.9% 3.2%Safety 93.5% 4.8% 1.7%
Table 7.1: A comparison of the ADE results on different synthesizer constraints. The“no synthesizer” option signifies that all subsystem errors are reported. The “singlesubystem” option means that one subsystem is arbitrarily chosen to always be givenpreference. The “safety” constraint is our default, where “threatening” objects aregiven a higher priority (to be classified as erroneous.)
Example explanations are in Table 7.2 of the object detected in Figure 7-6. I
created an error by scrambling the label of a pedestrian to a “traffic cone.” In the
case that no errors are detected, the synthesizer outputs a summary. I focused on
inserting frame (i.e, snapshot) errors because generating scene errors (i.e., video)
requires careful tracking of objects, which is out of the scope of this thesis.
Examples
The scene monitor uses the explanation synthesizer to summarize the findings.
This scene with with 225 distinct annotations 2018-07-23
23:29:06.797517 is reasonable. Explanation synthesized: Reasonable
scene with a car proceeding forward, turning left, and following a
van. Perceived a parked truck, construction, and intersection.
This explanation can be compared with the description from the data set; where
parked truck, construction and intersection are part of the scene description (amongst
a few other concepts).
134

Figure 7-6: The “true” annotation of a pedestrian.
Regular Output Scrambled Output
This sample’s 69 labeled objects arereasonable. Sample explanations:The human.pedestrian.adult locatedat [373.256, 1130.419, 0.8] is approx-imately the right size. It is some-what close, located to the right.
At least one of this sample’s 69 la-beled objects are unreasonable. Un-reasonable explanations: The mov-able_object.trafficcone located at[373.256, 1130.419, 0.8] is not a rea-sonable size: it is too tall. Thereis no commonsense supporting thisjudgement. Ignoring objects de-tected to the right.
The vehicle.car located at is[353.794, 1132.355, 0.602] is ap-proximately the right size. It issomewhat close, located to theright, past the movable_object.
The human.pedestrian.adult locatedat is [353.794, 1132.355, 0.602] is nota reasonable size: it is too wide andit is too deep. It’s location is too faraway to be close to a street. Ignoringobjects detected to the right.
Table 7.2: A comparison of the ADE system on regular and scrambled outputs. Theregular output is a summary supporting that the judgement or action is reasonable.The scrambled output (where a different label than the true label is used) shows thatthe architecture can correctly identify judgements or actions that are incorrect.
135

7.5 Challenges and Benchmarks
There are threeways to evaluate the ADE architecture:
1. Detection: Generate logs from scenarios to detect failures.
2. Invoke errors: Scrambling multiple labels on existing data sets.
3. Real errors: Examining errors on the validation dataset of NuScenes leader-
board.
I validated the first detection task by simulating the Uber Carla scenario and ex-
plaining it. I discussed preliminary results for inserting errors in Section 7.4.4. The
second validation is to examine the outputs of existing algorithms that are trained
on some of these self-driving data sets. I wanted to find common failure scenarios by
finding where existing algorithms failed. NuScenes [31] has several different online
challenges including detection, tracking, and prediction. The testing sets of these
challenges are private. I researched if I could acquire any of the top-performing algo-
rithms and examine their validation errors. Unfortunately, most of these algorithms
are not open source. Secondly, even if the source code was available, the source code
requires significant changes to be applied to nuScenes22. While I was able to find
many pre-trained models, I was not able to find one for the nuScenes challenges. This
may be examined again in future work.
Other anomaly detection data sets are not applicable to my method. These data
sets are are single modal: they contain outputs from a single subsystem with a con-
sistent data distribution. The key contribution of ADE is that it examines multiple
subsystems to make a judgement. These types of multimodal, anomalous data sets
do not currently exist.
22Most of these algorithms are pre-trained on KITTI [69], the predecessor to nuScenes.
136

7.5.1 Other Potential Evaluations
Other evaluations could be performed in simulation. There are a number of challenge
scenarios proposed23 that have not been simulated or released. I am currently working
on a set of challenge problems for anticipatory thinking in autonomous driving24.
The goal is to develop scenarios that that require abstract, high-level anticipatory
thinking [7], similar to the type of reasoning that humans do in difficult situations.
In other domains, I argue that explaining errors should be evaluated on tasks in-
stead of data. Unlike other explanatory methods that are evaluated for end-users [76],
my explanations for the machine. In future work, I will design tasks that require
machine explanations to complete tasks. This is discussed in the Conclusion in Sec-
tion 9.3.
7.6 Requirements to Apply ADE
Recall that ADE is an architecture and a reasoning process. The ADE architecture
is application-dependent. The hierarchical model needs to be defined for each ap-
plication. This requires constructing reasonableness monitors for each component
(specifications in Section 4.5), and composing components into committees. In this
Chapter, I showed one synthesizer that reconciles outputs from three committees. My
methodology can also be applied to multiple committees with multiple synthesizers.
The explanation synthesizer, can be utilized without or without an underlying
architecture definition. The explanation synthesizer has its own set of requirements.
1. Multiple pieces of information (e.g. vision, LiDAR, vehicle state) about corre-
sponding things25.
2. Priorities (e.g. safety) and associated rules.
23Carla challenges: https://carlachallenge.org/challenge/nhtsa/24AAAI Fall Symposium on Anticipatory Thinking: https://www.anticipatorythinking.ai.25The multiple pieces of information should overlap. If there is no overlapping information between
the monitored parts, then the explanation synthesizer cannot synthesize anything ; it will simplysummarize disparate information. Test cases of this behavior are shown in Appendix B.4
137
Note that the explanation synthesizer can be utilized without the architecture,
as long as it is provided with multiple explanations or justifications, and a priority
hierarchy.
7.7 Related Work
The main goal of this work is to use internal subsystem explanations to decrease
the number of false positives in anomaly detection. Anomaly detection is a data
science and machine learning discipline [37]. Although, anomaly detection is also
used in security to combat intrusion detection in networks [68]. Real-time anomaly
detection requires scoring algorithms to dynamically detect “anomalous” streaming
data, including a series of benchmarks [129]. The goal of anomaly detection is to be
accurate, and reduce the number of false-positives and false-negatives. Some tactics
include smoothing the output [85], or piece-wise approximations [229].
The final goal of this work is to provide interpretable explanations. Within
the context of self-driving car, previous work has used reasoning systems, propa-
gation [184], and models of expected vehicle physics and electromechanical behavior
to create causal chains that explain the events leading up to and in an accident [75].
This work is also being extended to include commonsense rules of vehicle actions, so
that it could monitor planning systems for inconsistent tactics.
My approach and position is similar to that proposed in Explainable Agency [128].
This refers to the ability of autonomous agents to explain their decisions and be
questioned. Although I adhere to many of the principles of explainable agency, my
goal is to extend these principles to full system design.
7.8 Limitations
ADE decomposes a complex machine into introspective committees or subsystems.
This requires knowledge of the underlying complex machine structure. For the self-
driving domain, I simplified a self-driving car into the three committees (vision, Li-
138

DAR, tactics) that are essential for planning. I also choose these committees since
they are well-represented in self-driving vehicle data [31]. A similar architecture is
applicable to other autonomous robotic systems like home robotics (without LiDAR),
and autonomous flight (with additional sensor information and Radar).
Priorities have to be manually set. For self-driving, this was straight-forward, as
the priority is safety of the passenger inside the vehicle. I cases where there is a
variety of external distractions and near-perfect information, it may be important to
consider which outside factors to prioritize; which reduces to the trolley problem [16].
One interesting area of future work would be to investigate whether these priorities
can be learned from experience. This requires a human-in-the-loop to provide proper
feedback. I will explore the right ways to incorporate human preferences into ADE.
This has implications for system debugging, but also for personalizing autonomy.
Each passenger may have their own preferences and priorities. There may be other
meaningful priorities besides passenger safety (i.e., passenger comfort, or limited in-
terruptions, or a smooth route). I will explore whether these can be learned through
user feedback in ongoing work.
7.9 Conclusion and Future Work
Complex machines have insufficient communication between parts. I showed how to
use dynamic explanations along with a logic system to reason between the subsys-
tems of a complex system. This enables allows better system-wide communication,
even with limited information, uninterpretable information, or receiving conflicting
information from the underlying subsystems. I have motivated this use case with a
self-driving failure example. I showed a quantitative evaluation on a data set where
I inserted errors.
This chapter motivates a new view of anomaly detection. A view in which failures
and errors are not necessarily outliers, but inexplicable instances. When an explana-
tion is inadequate or inappropriate, the underlying subsystem or process should be
corrected or disabled. The novel idea is using symbolic explanations as an internal
139

language. The explanations facilitate better communication. Better communications
can yield better performance; failures and errors are explicitly, logged, debugged, and
reconciled. This applies to complex systems that include humans.
As machines and humans share control of tasks, communication is necessary. This
is important for debugging, so that humans can improve complex systems, but also
for education, where complex could “improve” or teach humans. Imagine a system
where human interventions are well-communicated. The explanation supports the
intervention, and the explanation is used to improve the system. The machine is
introspective: the machine reflects and reasons about its behavior. The machine is
articulate: the machine explains and describes its behavior to other systems (including
a human) and itself. For most definitions, the machine is intelligent. This chapter is
a first step towards articulate machines that can coherently explain themselves and
learn from their mistakes: machines that are self-aware problem solvers.
140

Chapter 8
Philosophy of Explanations: A
Review with Recommendations
“The word explanation occurs so continuously and has so important a place
in philosophy, that a little time spent in fixing the meaning of it will be
profitably employed.”1
– J.S. Mill
During my PhD, there was a surge of work in explanatory artificial intelligence
(XAI). This research area tackles the important problem that complex machines and
algorithms often cannot provide insights into their behavior and thought processes.
XAI allows users and parts of the internal system to be more transparent, providing
explanations of their decisions in some level of detail. These explanations are impor-
tant to ensure algorithmic fairness, identify potential bias/problems in the training
data, and to ensure that the algorithms perform as expected. However, explanations
produced by these systems is neither standardized nor systematically assessed. In an
effort to create best practices and identify open challenges, I describe foundational
concepts of explainability and show how they can be used to classify existing lit-
erature. I discuss why current approaches to explanatory methods for deep neural
networks are insufficient. An earlier version of this review is available on arXiv [77]
1This is the first quote in the Chapter 1 of Sylvain Bromberger’s book on explanations [30].
141

and as a conference proceeding [76]. The ideas about the ethical implications of
explainability were part of a workshop paper [81].
8.1 Background and Foundational Concepts
This section provides background information about the key concepts of interpretabil-
ity and explanability, and elaborates and details the meaningful differences between
them.
8.1.1 What is an Explanation?
Philosophical texts show much debate over what constitutes an explanation. Of par-
ticular interest is what makes an explanation “good enough” or what really defines an
explanation. Sylvain Bromberger says that good explanation depends on the question.
In Bromberger’s set of essays [30], he discusses the nature of explanation, theory, and
the foundations of linguistics. Although for my work, the most important and inter-
esting work is on “why questions.” In particular, when you can phrase what you want
to know from an algorithm as a why question, there is a natural qualitative represen-
tation of when you have answered said question–when you can no longer keep asking
why. There are two why-questions of interest; why and why-should. Similarly to the
explainable planning literature, philosophers wonder about the why-shouldn’t and
why-should questions, which can give the kinds of explainability requirements society
desires. The details of the societal requirement for explanations are in Section 8.6.
There is also discussion in philosophy about what makes the best explanation.
Gilbert Harman says it is a type of abductive reasoning.
“In general, there will be several hypotheses which might explain the ev-
idence, so one must be able to reject all such alternative hypotheses be-
fore one is warranted in making the inference. Thus one infers, from the
premise that a given hypothesis would provide a ‘better’ explanation for
the evidence than would any other hypothesis, to the conclusion that the
142

given hypothesis is true.” [91]
This is slightly different than Charles Pierce’s definition of abduction2, which is to
infer a premise from a conclusion [177]. While Paul R. Thagard agrees that “inductive
inference is inference to the best explanation” [221], he also suggests three new criteria
to evaluate the “best” explanation: consilience (converging to a conclusion), simplicity,
and analogy.
Interactive Explanations
I argue that a good explanation is interactive. The user or program should be able to
ask for details, inquire for more information, and collaborate on tasks. I argue that
these types of interactive, collaborative tasks are also appropriate for evaluation3.
8.1.2 Interpretability vs. Completeness
I argue that an explanation can be evaluated in two ways: according to its inter-
pretability, and according to its completeness.
The goal of interpretability is to describe the internals of a system in a way that
is understandable to humans. The success of this goal is tied to the cognition, knowl-
edge, and biases of the user: for a system to be interpretable, it must produce de-
scriptions that are simple enough for a person to understand using a vocabulary that
is meaningful to the user4.
The goal of completeness is to describe the operation of a system in an accurate
way. An explanation is more complete when it allows the behavior of the system to be
anticipated in more situations. When explaining a self-contained computer program
2Pierce’s classic example of “abduction” explains rain. If it is observed that the grass is wet, itprobably rained. He states that rain is the best explanation for wet grass, especially in his nativearea of New England. But this is not the best explanation in a desert location, where the bestexplanation may be a the result of a sprinkler system (especially if the grass is wet but the pavementis not.)
3I describe how to develop these evaluations, by designing collaborative tasks (between a humanand machine) that require explanations for success, in Section 9.3
4If there is no “simple” explanation that supports a decision, this could be worrisome, and possiblyunethical. I describe this and other ethical implications of XAI systems in Section 8.6.
143
such as a deep neural network, a perfectly complete explanation can always be given
by revealing all the mathematical operations and parameters in the system.
The challenge facing explainable AI is in creating explanations that are both
complete and interpretable: it is difficult to achieve interpretability and completeness
simultaneously. The most accurate explanations are not easily interpretable to people;
and conversely the most interpretable descriptions often do not provide predictive
power.
Herman notes that we should be wary of evaluating interpretable systems using
merely human evaluations of interpretability, because human evaluations imply a
strong and specific bias towards simpler descriptions [96]. He cautions that reliance
on human evaluations can lead researchers to create persuasive systems rather than
transparent systems. He presents the following ethical dilemmas that are a central
concern when building interpretable systems:
1) When is it unethical to manipulate an explanation
to better persuade users?
2) How do we balance our concerns for transparency and
ethics with our desire for interpretability?
I believe that it is fundamentally unethical to present a simplified description of a
complex system in order to increase trust. The explanation may be optimized to hide
undesirable attributes of the system. Such explanations are inherently misleading,
and may result in the user justifiably making dangerous or unfounded conclusions.
To avoid this trap, explanations should allow a trade-off between interpretability
and completeness. Rather than providing only simple descriptions, systems should
allow for descriptions with higher detail and completeness at the possible cost of
interpretability. Explanation methods should not be evaluated on a single point
on this trade-off, but according to how they behave on the curve from maximum
interpretability to maximum completeness.
144
8.1.3 Explainability of Deep Networks
Explanations of the operation of deep networks have focused on either explaining the
processing of the data by a network, or explaining the representation of data inside a
network. An explanation of processing answers “Why does this particular input lead
to that particular output?” and is analogous to explaining the execution trace of a
program. An explanation about representation answers “What information does the
network contain?” and can be compared to explaining the internal data structures of
a program.
A third approach to interpretability is to create explanation-producing systems
with architectures that are designed to simplify interpretation of their own behavior.
Such architectures can be designed to make either their processing, representations,
or other aspects of their operation easier for people to understand.
8.2 Review
Due to the growing number of sub-fields, as well as the policy and legal ramifications
[83] of opaque systems, the volume of research in interpretability is quickly expanding.
Since it is intractable to review all the papers in the space, I focus on explainable
methods in deep neural architectures, and briefly highlight review papers from other
sub-fields.
8.2.1 Explanations of Deep Network Processing
Deep networks derive their decisions using a large number of elementary operations.
For example, ResNet [93], a popular architecture for image classification, incorporates
about 5 × 10⁷ learned parameters and executes about 1010 floating point operations
to classify a single image. Thus the fundamental problem facing explanations of such
processing is to find ways to reduce the complexity of all these operations. This can be
done by either creating a proxy model which behaves similarly to the original model,
but in a way that is easier to explain, or by creating a salience map to highlight a
145

small portion of the computation which is most relevant.
Linear Proxy Models
LIME is a model-agnostic5 proxy method [189]. With LIME, a black-box system
is explained by probing behavior on perturbations of an input, and then that data
is used to construct a local linear model that serves as a simplified proxy for the
full model in the neighborhood of the input. The method can be used to identify
regions of the input that are most influential for a decision across a variety of types
of models and problem domains. Proxy models such as LIME are predictive: the
proxy can be run and evaluated according to its faithfulness to the original system.
Proxy models can also be measured according to their model complexity, for example,
number of nonzero dimensions in a LIME model. Because the proxy model provides a
quantifiable relationship between complexity and faithfulness, methods can be bench-
marked against each other, making this approach attractive.
Decision Trees
Another appealing type of proxy model is the decision tree. Efforts to decompose neu-
ral networks into decision trees have recently extended work from the 1990s, which fo-
cused on shallow networks, to generalizing the process for deep neural networks. One
such method is DeepRED [257], which demonstrates a way of extending the CRED
[197] algorithm (designed for shallow networks) to arbitrarily many hidden layers.
DeepRED utilizes several strategies to simplify its decision trees: it uses RxREN [15]
to prune unnecessary input, and it applies algorithm C4.5 [195], a statistical method
for creating a parsimonious decision tree. Although DeepRED is able to construct
complete trees that are closely faithful to the original network, the generated trees
can be quite large, and the implementation of the method takes substantial time and
memory and is therefore limited in scalability.
Another decision tree method is ANN-DT [200] which uses sampling to create
a decision tree: the key idea is to use sampling to expand training using a nearest5Model-agnostic means that the method (in this case, LIME) can be applied to any model.
146

neighbor method.
Automatic-Rule Extraction
Automatic rule extraction is another well-studied approach for summarizing decisions.
Andrews et al. [9] outlines existing rule extraction techniques, and provides a useful
taxonomy of five dimensions of rule-extraction methods including their expressive
power, translucency and the quality of rules. Another useful survey can be found in
the master’s thesis by Zilke [256].
Decompositional approaches work on the neuron-level to extract rules to mimic the
behavior of individual units. The KT method [66] goes through each neuron, layer-
by-layer and derives an if-then rule by finding a threshold. Similar to DeepRED, there
is a merging step which creates rules in terms of the inputs rather than the outputs
of the preceding layer. This is an exponential approach which is not feasible for deep
neural networks. However, a similar approach proposed by Tsukimoto [227] achieves
polynomial-time complexity, and may be more tractable. There has also been work
on transforming neural network to fuzzy rules [21], by transforming each neuron into
an approximate rule.
Pedagogical approaches aim to extract rules by directly mapping inputs to out-
puts rather than considering the inner workings of a neural network. These treat
the network as a black box, and find trends and functions from the inputs to the
outputs. Validity Interval Analysis is a type of sensitivity analysis to mimic neu-
ral network behavior [222]. This method finds stable intervals, where there is some
correlation between the input and the predicted class. Another way to extract rules
using sampling methods [102, 44]. Some of these sampling approaches only work on
binary input [219] or use genetic algorithms to produce new training examples [89].
Other approaches aim to reverse engineer the neural network, notably, the RxREN
algorithm, which is used in DeepRED[257].
Other notable rule-extraction techniques include the MofN algorithm [225], which
tries to find rules that explain single neurons by clustering and ignoring insignificant
neurons. Similarly, The FERNN [204] algorithm uses the C4.5 algorithm [195] and
147
tries to identify the meaningful hidden neurons and inputs to a particular network.
Although rule-extraction techniques increase the transparency of neural networks,
they may not be truly faithful to the model. With that, there are other methods that
are focused on creating trust between the user and the model, even if the model is
not “sophisticated.”
Salience Mapping
The salience map approach is exemplified by occlusion procedure by Zeiler [246],
where a network is repeatedly tested with portions of the input occluded to create a
map showing which parts of the data actually have influence on the network output.
When deep network parameters can be inspected directly, a salience map can be cre-
ated more efficiently by directly computing the input gradient (Simonyan [209]). Since
such derivatives can miss important aspects of the information that flows through a
network, a number of other approaches have been designed to propagate quantities
other than gradients through the network. Examples are LRP [17], DeepLIFT [207],
CAM [254], Grad-CAM [203], Integrated gradients [217], and SmoothGrad [211].
Each technique strikes a balance between showing areas of high network activation,
where neurons fire strongest, and areas of high network sensitivity, where changes
would most affect the output. A comparison of some of these methods can be found
in Ancona [8].
8.2.2 Explanations of Deep Network Representations
While the number of individual operations in a network is vast, deep networks are in-
ternally organized into a smaller number of subcomponents: for example, the billions
of operations of ResNet are organized into about 100 layers, each computing between
64 and 2048 channels of information per pixel. The explanation of deep network rep-
resentations aims to understand the role and structure of the data flowing through
these bottlenecks. This work can be divided by the granularity examined: represen-
tations can be understood by layer, where all the information flowing through a layer
148

is considered together, and by unit, where single neurons or single filter channels are
considered individually, and by vector, where other vector directions in representation
space are considered individually.
Role of Layers
Layers can be understood by testing their ability to help solve different problems from
the problems the network was originally trained on. For example Razavian [185] found
that the output of an internal layer of a network trained to classify images of objects
in the ImageNet data set produced a feature vector that could be directly reused
to solve a number of other difficult image processing problems including fine-grained
classification of different species of birds, classification of scene images, attribute
detection, and object localization. In each case, a simple model such as an SVM was
able to directly apply the deep representation to the target problem, beating state-
of-the-art performance without training a whole new deep network. This method of
using a layer from one network to solve a new problem is called transfer learning,
and it is of immense practical importance, allowing many new problems to be solved
without developing new data sets and networks for each new problem. Yosinksi [245]
described a framework for quantifying transfer learning capabilities in other contexts.
Role of Individual Units
The information within a layer can be further subdivided into individual neurons or
individual convolutional filters. The role of such individual units can be understood
qualitatively, by creating visualizations of the input patterns that maximize the re-
sponse of a single unit, or quantitatively, by testing the ability of a unit to solve a
transfer problem. Visualizations can be created by optimizing an input image us-
ing gradient descent [209], by sampling images that maximize activation [253], or by
training a generative network to create such images [169]. Units can also be charac-
terized quantitatively by testing their ability to solve a task. One example of a such a
method is network dissection [19], which measures the ability of individual units solve
a segmentation problem over a broad set of labeled visual concepts. By quantifying
149
the ability of individual units to locate emergent concepts such as objects, parts, tex-
tures, and colors that are not explicit in the original training set, network dissection
can be used characterize the kind of information represented by visual networks at
each unit of a network.
A review of explanatory methods focused on understanding unit representations
used by visual CNNs can be found in [247], which examines methods for visualization
of CNN representations in intermediate network layers, diagnosis of these representa-
tions, disentanglement representation units, the creation of explainable models, and
semantic middle-to-end learning via human-computer interaction.
Pruning of networks [64] has also been shown to be a step towards understanding
the role of individual neurons in networks. In particular, large networks that train
successfully contain small subnetworks with initializations conducive to optimization.
This demonstrates that there exist training strategies that make it possible to solve
the same problems with much smaller networks that may be more interpretable.
Role of Representation Vectors
Closely related to the approach of characterizing individual units is characterizing
other directions in the representation vector space formed by linear combinations
of individual units. Concept Activation Vectors (CAVs) [112] are a framework for
interpretation of a neural net’s representations by identifying and probing directions
that align with human-interpretable concepts.
8.2.3 Explanation-Producing Systems
Several different approaches can be taken to create networks that are designed to be
easier to explain: networks can be trained to use explicit attention as part of their
architecture; they can be trained to learn disentangled representations ; or they can
be directly trained to create generative explanations.
150

Attention Networks
Attention-based networks learn functions that provide a weighting over inputs or in-
ternal features to steer the information visible to other parts of a network. Attention-
based approaches have shown remarkable success in solving problems such as allowing
natural language translation models to process words in an appropriate non-sequential
order [230], and they have also been applied in domains such as fine-grained image
classification [242] and visual question answering [145]. Although units that control
attention are not trained for the purpose of creating human-readable explanations,
they do directly reveal a map of which information passes through the network, which
can serve as a form of explanation. Data sets of human attention have been created
[46], [174]; these allow systems to be evaluated according to how closely and their
internal attention resembles human attention.
While attention can be observed as a way of extracting explanations, another
interesting approach is to train attention explicitly in order to create a network that
has behavior that conforms to desired explanations. This is the technique proposed
by Ross [192], where input sensitivity of a network is adjusted and measured in order
to create networks that are “right for the right reasons”; the method can be used to
steer the internal reasoning learned by a network. They also propose that the method
can be used to learn a sequence of models that discover new ways to solve a problem
that may not have been discovered by previous instances.
Disentangled Representations
Disentangled representations have individual dimensions that describe meaningful
and independent factors of variation. The problem of separating latent factors is
an old problem that has previously been attacked using a variety of techniques such
as Principal Component Analysis [104], Independent Component Analysis [99], and
Nonnegative Matrix Factorization [23]. Deep networks can be trained to explicitly
learn disentangled representations. One approach that shows promise is Variational
Autoencoding [115], which trains a network to optimize a model to match the input
151

probability distribution according to information-theoretic measures. Beta-VAE [97]
is a tuning of the method that has been observed to disentangle factors remarkably
well. Another approach is InfoGAN [40], which trains generative adversarial networks
with an objective that reduces entanglement between latent factors. Special loss func-
tions have been suggested for encouraging feed-forward networks to also disentangle
their units; this can be used to create interpretable CNNs that have individual units
that detect coherent meaningful patches instead of difficult-to-interpret mixtures of
patterns [249]. Disentangled units can enable the construction of graphs [248] and
decision trees [250] to elucidate the reasoning of a network. Architectural alternatives
such as capsule networks [194] can also organize the information in a network into
pieces that disentangle and represent higher-level concepts.
Generated Explanations
Finally, deep networks can also be designed to generate their own human-understandable
explanations as part of the explicit training of the system. Explanation generation
has been demonstrated as part of systems for visual question answering [12] as well
as in fine-grained image classification [95]. In addition to solving their primary task,
these systems synthesize a “because” sentence that explains the decision in natural
language. The generators for these explanations are trained on large data sets of
human-written explanations, and they explain decisions using language that a person
would use.
Multimodal explanations that incorporate both visual pointing and textual ex-
planations can be generated; this is the approach taken in [174]. This system builds
upon the winner of the 2016 VQA challenge [67], with several simplification and addi-
tions. In addition to the question answering task and the internal attention map, the
system trains an additional long-form explanation generator together with a second
attention map optimized as a visual pointing explanation. Both visual and textual
explanations score well individually and together on evaluations of user trust and ex-
planation quality. Interestingly, the generation of these highly readable explanations
is conditioned on the output of the network: the explanations are generated based on
152

the decision, after the decision of the network has already been made.
The rise of dialog systems and chatbots for customer care have lead to research in
how to build trust between users and technology. The most straightforward methods
eschew sophisticated natural language understanding techniques and mimic conver-
sations to build trust [179] either by scripted conversation6 or wizard-of-oz methods
[109].
8.3 Related Work
This section contains a summary of review papers, and an overview of interpretability
and explainability in other domains.
8.3.1 Interpretability
A previous survey attempted to define taxonomies and best practices for a “strong
science” of interpretability [54]. The authors define interpretability as “the ability to
explain or to present in understandable terms to a human” and suggest a variety of
definitions for explainability, converging on the notion that interpretation is the act of
discovering the evaluations of an explanation. The main contribution of the paper is
a taxonomy of modes for interpretability evaluations: application-grounded, human-
grounded, and functionally grounded. The authors state interpretability is required
when a problem formulation is incomplete, when the optimization problem – the key
definition to solve the majority of machine learning problems – is disconnected from
evaluation. Since their problem statement is the incompleteness criteria of models,
resulting in a disconnect between the user and the optimization problem, evaluation
approaches are key.
The first evaluation approach is application-grounded, involving real humans on
real tasks. This evaluation measures how well human-generated explanations can aid
other humans in particular tasks, with explanation quality assessed in the true context
6Juergen Pirner, creator of the 2003 Loebner prize winner Jabberwock, has been outspoken aboutthe scripting process behind a chatbot.
153
of the explanation’s end tasks. For instance, a doctor should evaluate diagnosis
systems in medicine. The second evaluation approach is human-grounded, using
human evaluation metrics on simplified tasks. The key motivation is the difficulty
of finding target communities for application testing. Human-grounded approaches
may also be used when specific end-goals, such as identifying errors in safety-critical
tasks, are not possible to realize fully. The final evaluation metric is functionally
grounded evaluation, without human subjects. In this experimental setup, proxy
or simplified tasks are used to prove some formal definition of interpretability. The
authors acknowledge that choosing which proxy to use is a challenge inherent to this
approach. There lies a delicate trade-off between choosing an interpretable model and
a less interpretable proxy method which is more representative of model behavior;
the authors acknowledge this point and briefly mention decision trees as a highly
interpretable model. In my XAI taxonomy, Table 8.1, decision trees and proxy models
explain the same part of an underlying model (namely, the model’s processing).
8.3.2 Explainable AI for HCI
One previous review paper of explainable AI performed a sizable data-driven literature
analysis of explainable systems [1]. In this work, the authors move beyond the classical
AI interpretability argument, focusing instead on how to create practical systems
with efficacy for real users. The authors motivate AI systems that are “explainable
by design” and present their findings with three contributions: a data-driven network
analysis of 289 core papers and 12,412 citing papers for an overview of explainable
AI research, a perspective on trends using network analysis, and a proposal for best
practices and future work in HCI research pertaining to explainability.
Since most of the paper focuses on the literature analysis, the authors highlight
only three large areas in their related work section: explainable artificial intelligence
(XAI), intelligibility and interpretability in HCI, and analysis methods for trends in
research topics.
The major contribution of this paper is a sizable literature analysis of explain-
able research, enabled by the citation network the authors constructed. Papers were
154

aggregated based on a keyword search on variations of the terms “intelligible,” “in-
terpretable,” “transparency,” “glass box,” “black box,” “scrutable,” “counterfactuals,”
and “explainable,” and then pruned down to 289 core papers and 12,412 citing pa-
pers. Using network analysis, the authors identified 28 significant clusters and 9
distinct research communities, including early artificial intelligence, intelligent sys-
tems/agents/user interfaces, ambient intelligence, interaction design and learnability,
interpretable ML and classifier explainers, algorithmic fairness, accountability, trans-
parency, policy, journalism, causality, psychological theories of explanations, and cog-
nitive tutors. In contrast, my work is focused on the research in interpretable ML
and classifier explainers for deep learning.
With the same sets of core and citing papers, the authors performed LDA-based
topic modeling on the abstract text to determine which communities are related. The
authors found the largest, most central and well-studied network to be intelligence
and ambient systems. In my research, the most important subnetworks are the Ex-
plainable AI: Fair, Accountable, and Transparent (FAT) algorithms and Interpretable
Machine Learning (iML) subnetwork and the theories of explanations subnetworks.
In particular, the authors provide a distinction between FATML and interpretability;
while FATML is focused on societal issues, interpretability is focused on methods.
Theory of explanations joins causality and cognitive psychology with the common
threads of counterfactual reasoning and causal explanations. Both these threads are
important factors in my taxonomy analysis.
In the final section of their paper, the authors name two trends of particular inter-
est to us: ML production rules and a road map to rigorous and usable intelligibility.
The authors note a lack of classical AI methods being applied to interpretability,
encouraging broader application of those methods to current research. Though this
paper focused mainly on setting an HCI research agenda in explainability, it raises
many points relevant to my work. Notably, the literature analysis discovered subtopics
and subdisciplines in psychology and social science, not yet identified as related in
my analysis.
155

8.3.3 Explanations for Black-Box Models
A recent survey on methods for explaining black-box models [87] outlined a taxonomy
to provide classifications of the main problems with opaque algorithms. Most of
the methods surveyed are applied to neural-network based algorithms, and therefore
related to my work.
The authors provide an overview of methods that explaining decision systems
based on opaque and obscure machine learning models. Their taxonomy is detailed,
distinguishing small differing components in explanation approaches (e.g. Decision
tree vs. single tree, neuron activation, SVM, etc.) Their classification examines four
features for each explanation method:
1. The type of the problem faced.
2. The explanatory capability used to open the black box.
3. The type of black box model that can be explained.
4. The type of input data provided to the black box model.
They primarily divide the explanation methods according to the types of problem
faced, and identify four groups of explanation methods: methods to explain black
box models; methods to explain black box outcomes; methods to inspect black boxes;
and methods to design transparent boxes. Using their classification features and these
problem definitions, they discuss and further categorize methods according to the type
of explanatory capability adopted, the black box model “opened”, and the input data.
Their goal is to review and classify the main black box explanation architectures,
so their classifications can serve as a guide to identifying similar problems and ap-
proaches. I find this work a meaningful contribution that is useful for exploring the
design space of explanation methods. my classification is less finely-divided; rather
than subdividing implementation techniques, I examine the focus of the explanatory
capability and what each approach can explain, with an emphasis on understanding
how different types of explainability methods can be evaluated.
156

8.3.4 Explainability in Other Technical Domains
Explainable planning [63] is an emerging discipline that exploits the model-based
representations that exist in the planning community. Some of the key ideas were
proposed years ago in plan recognition [107]. Explainable planning urges the familiar
and common basis for communication with users, while acknowledging the gap be-
tween planning algorithms and human problem-solving. In this paper, the authors
outline and provide examples of a number of different types of questions that expla-
nations could answer, like “Why did you do A” or ”Why DIDN’T you do B”, ”Why
CAN’T you do C”, etc. In addition, the authors emphasize that articulating a plan
in natural language is NOT usually the same thing as explaining the plan. A request
for explanation is “an attempt to uncover a piece of knowledge that the questioner
believes must be available to the system and that the questioner does not have”. I
discuss the questions an explanation can and should answer in the conclusion.
Automatic explanation generation is also closely related to computers and ma-
chines that can tell stories. In John Reeves’ thesis [186], he created the THUNDER
program to read stories, construct character summaries, infer beliefs, and understand
conflict and resolution. Other work examines how to represent the necessary struc-
tures to do story understanding [162]. The Genesis Story-Understanding System
[241] is a working system that understands, uses, and composes stories using higher-
level concept patterns and commonsense rules. Explanation rules are used to supply
missing causal or logical connections.
At the intersection of human robot interaction and story-telling is verbalization;
generating explanations for human-robot interaction [191]. Similar approaches are
found in abductive reasoning; using a case-based model [132] or explanatory coherence
[168]. This is also a well-studied field in brain and cognitive science by filling in the
gaps of knowledge by imagining new ideas [147] or using statistical approaches [120].
157

8.3.5 Explanations for Society
Explanations have been proposed as an artifact to build societal trust. Recent work
has looked at ways to correct neural network judgments [251] and different ways to
audit such networks by detecting biases [220]. But these judgments are not enough
to completely understand the model’s decisions-making. Other work answers why
questions by finding similar data points [38]. Although these methods are clearly
interpretable, they do not provide any unique insights into why the model made
those decisions. Other work examining best practices for explanation [206] provides a
set of categories, but does not evaluate the questions that explanatory systems should
be able to answer; which is necessary for policy makers and societal trust in DNN
decision processes.
The desire for explanations in certain sectors of the law is not new. For example,
the U.S. Fair Credit Reporting Act creates obligations for transparency in certain
financial decision-making processes, even if they are automated [126]. The role of
explanation has been examined to enforce accountability under the law [55]. Similar
recommendations in using explanations in law have been examined in promoting
ethics for design [164], for privacy [165], and liability for machines [231].
In this chapter, I explicitly examine DNNs, even though there have been impor-
tant developments in explanatory systems not tailored to DNNs, such as randomized
importance [144], rule lists [136], partial dependence plots [252, 65, 161], Shapely
scores [213, 161], and Bayesian case based models [113].
8.4 Taxonomy
The approaches from the literature that I have examined fall into three different cat-
egories. Some papers propose explanations that, while admittedly non-representative
of the underlying decision processes, provide some degree of justification for emitted
choices that may be used as response to demands for explanation in order to build
human trust in the system’s accuracy and reasonableness. These systems emulate
the processing of the data to draw connections between the inputs and outputs of the
158
system.
The second purpose of an explanation is to explain the representation of data
inside the network. These provide insight about the internal operation of the network
and can be used to facilitate explanations or interpretations of activation data within
a network. This is comparative to explaining the internal data structures of the
program, to start to gain insights about why certain intermediate representations
provide information that enables specific choices.
The final type of explanation is explanation-producing networks. These networks
are specifically built to explain themselves, and they are designed to simplify the
interpretation of an opaque subsystem. They are steps towards improving the trans-
parency of these subsystems; where processing, representations, or other parts are
justified and easier to understand.
The taxonomy I present is useful given the broad set of existing approaches for
achieving varying degrees of interpretability and completeness in machine learning
systems. Two distinct methods claiming to address the same overall problem may, in
fact, be answering very different questions. My taxonomy attempts to subdivide the
problem space, based on existing approaches, to more precisely categorize what has
already been accomplished.
I show the classifications of my reviewed methods per category in Table 8.1. Notice
that the processing and explanation-producing roles are much more populated than
the representation role. I believe that this disparity is largely due to the fact that it
is difficult to evaluate representation-based models. User-study evaluations are not
always appropriate. Other numerical methods, like demonstrating better performance
by adding or removing representations, are difficult to facilitate.
The position of my taxonomy is to promote research and evaluation across cate-
gories. Instead of other explanatory and interpretability taxonomies that assess the
purpose of explanations [54] and their connection to the user [1], I instead assess
the focus on the method, whether the method tries to explain the processing of the
data by a network, explain the representation of data inside a network or to be a
self-explaining architecture to gain additional meta predictions and insights about
159

the method.
I promote this taxonomy, particularly the explanation-producing sub-category, as
a way to consider designing neural network architectures and systems. I also highlight
the lack of standardized evaluation metrics, and propose research crossing areas of
the taxonomy as future research directions.
Processing Representation ExplanationProducing
Proxy Methods Role of layers Scripted conversationsDecision Trees Role of neurons Attention-based
Salience mapping Role of vectors Disentangled rep.Automatic-rule extraction Human evaluation
Table 8.1: The classifications of explanation methods by the focus of the explanation.
8.5 Evaluation
Although I outline three different focuses of explanations for deep networks, they do
not share the same evaluation criteria. Most of the work surveyed conducts one of
the following types of evaluation of their explanations.
1. Completeness compared to the original model. A proxy model can be evalu-
ated directly according to how closely it approximates the original model being
explained.
2. Completeness as measured on a substitute task. Some explanations do not
directly explain a model’s decisions, but rather some other attribute that can
be evaluated. For example, a salience explanation that is intended to reveal
model sensitivity can be evaluated against a brute-force measurement of the
model sensitivity.
3. Ability to detect models with biases. An explanation that reveals sensitivity to
a specific phenomenon (such as a presence of a specific pattern in the input)
160

can be tested for its ability to reveal models with the presence or absence of a
relevant bias (such as reliance or ignorance of the specific pattern).
4. Human evaluation. Humans can evaluate explanations for reasonableness, that
is how well an explanation matches human expectations. Human evaluation
can also evaluate completeness or substitute-task completeness from the point of
view of enabling a person to predict behavior of the original model; or according
to helpfulness in revealing model biases to a person.
The trade-off between interpretability and its completeness can be seen not only
as a balance between simplicity and accuracy in a proxy model. The trade-off can also
be made by anchoring explanations to substitute tasks or evaluating explanations in
terms of their ability to surface important model biases. Each of the three types of
explanation methods can provide explanations that can be evaluated for completeness
(on those critical model characteristics), while still being easier to interpret than a
full accounting for every detailed decision of the model.
8.5.1 Processing
Processing models can also be regarded as emulation-based methods. Proxy meth-
ods should be evaluated on their faithfulness to the original model. A handful of
these metrics are described in [189]. The key idea is that evaluating completeness
to a model should be local. Even though a deep neural network, is too complex
globally, you can still explain in a way that makes sense locally by approximating
local behavior. Therefore, processing model explanations want to minimize the “com-
plexity” of explanations (essentially, minimize length) as well as “local completeness”
(error of interpretable representation relative to actual classifier, near instance being
explained).
Salience methods that highlight sensitive regions for processing are often evaluated
qualitatively. Although they do not directly predict the output of the original method,
these methods can also be evaluated for faithfulness, since their intent is to explain
model sensitivity. For example, [8] conducts an occlusion experiment as ground truth,
161

in the model is tested on many version of an input image where each portion of
the image is occluded. This test determines in a brute-force but computationally
inefficient way which parts of an input cause a model to change its outputs the most.
Then each salience method can be evaluated according to how closely the method
produces salience maps that correlate with this occlusion-based sensitivity.
8.5.2 Representation
Representation-based methods typically characterize the role of portions of the rep-
resentation by testing the representations on a transfer task. For example, represen-
tation layers are characterized according to their ability to serve as feature input for
a transfer problem, and both Network Dissection representation units and Concept
Activation Vectors are measured according to their ability to detect or correlate with
specific human-understandable concepts.
Once individual portions of a representation are characterized, they can be tested
for explanatory power by evaluating whether their activations can faithfully reveal a
specific bias in a network. For example, Concept Activation Vectors [112] are evalu-
ated by training several versions of the same network on data sets that are synthesized
to contain two different types of signals that can be used to determine the class (the
image itself, and an overlaid piece of text which gives the class name with varying
reliability). The faithfulness of CAVs to the network behavior can be verified by
evaluating whether classifiers that are known to depend on the text (as evidenced
by performance on synthesized tests) exhibit high activations of CAV vectors corre-
sponding to the text, and that classifiers that do not depend on the text exhibits low
CAV vectors.
8.5.3 Explanation-Producing
Explanation-producing systems can be evaluated according to how well they match
user expectations. For example, network attention can be compared to human at-
tention [46], and disentangled representations can be tested on synthetic data sets
162

that have known latent variables, to determine whether those variables are recovered.
Finally, systems that are trained explicitly to generate human-readable explanations
can be tested by similarity to test sets, or by human evaluation.
One of the difficulties of evaluating explanatory power of explanation-producing
systems is that, since the system itself produces the explanation, evaluations neces-
sarily couple evaluation of the system along with evaluation of the explanation. An
explanation that seems unreasonable could indicate either a failure of the system to
process information in a reasonable way, or it could indicate the failure of the ex-
planation generator to create a reasonable description. Conversely, an explanation
system that is not faithful to the decision making process could produce a reasonable
description even if the underlying system is using unreasonable rules to make the
decision. An evaluation of explanations based on their reasonableness alone can miss
these distinctions. In [54], a number of user-study designs are outlined that can help
bridge the gap between the model and the user.
8.6 Societal Expectations for Explanations
Imagine you do not receive a loan, you would want to know what was the key attribute
that limited the algorithm. You would want to know why you were denied a loan.
But further, you may also want a sensitivity analysis: what would you need to change
to be able to get the loan. There may be several possibilities. For example, you may
have received a loan if you made $1,000 more per month; something you may be able
to change in the future. However, other factors may be things you cannot control,
such as the specific time you applied or your gender or ethnicity. So, in this case, we
would like to have system that is able to explain why it decided to give or not a loan
to each person.
Moreover, consider again the AI system example mentioned earlier of a self-driving
car involved in an accident. The first thing we would want to know is why the accident
happened. In this case there are many algorithms interacting. Finding if there was a
faulty component is extremely challenging, making it even more relevant for each part
163
of the system to be able to explain its decisions. In the recent Uber accident where
the vehicle struck and killed a pedestrian, detecting the root-cause of the accident
took several weeks to uncover in the complex AI software system [151, 150].
But the other, more challenging question we would want to ask is if the accident
could have been avoided. This is a more difficult question than the previous, single
algorithm question. In complex systems, an error could be local (caused by a single
failure), or it could be caused by an inconsistency between parts working together.
The latter is much more difficult to detect, diagnosis, and explain.
In the Uber case, since the accident was caused by a false positive [134] on the error
detection monitoring the pedestrian, several explanations could provide evidence of
how this could have been avoided. Again, some inconsistencies are easier to fix than
others (which may not be possible). Perhaps the sensitivity on the error detection
monitor should be decreased or increased. Or perhaps the pedestrian would have been
detected with higher certainty during the daytime, or if they were walking slower. It
is still left to question whether the training data was at fault, which introduces a new
set of questions.
8.6.1 Definitions
I follow the definition from Section 8.1.2 that a proper explanation should be both
interpretable and complete. By interpretable, I mean that the explanation should
be understandable to humans. That does not necessarily imply that the explanation
must be in human-readable form, in fact, visual cues are well-understood by humans.
When I say that the methods must be complete, I mean the resulting explanation
should be true to the model. For example, while using a simplified model that is
explainable (like a linear model) to fit the input to the output results in a nice
explanation, it is not a true and complete representation of the internal concepts,
representations, and decisions of the model.
I refer to inside and outside explanations for explaining DNNs. When I refer to
inside explanations, I am referring to the type of explanations that currently exist,
that are catered towards AI developers and experts. They are tailored to people
164
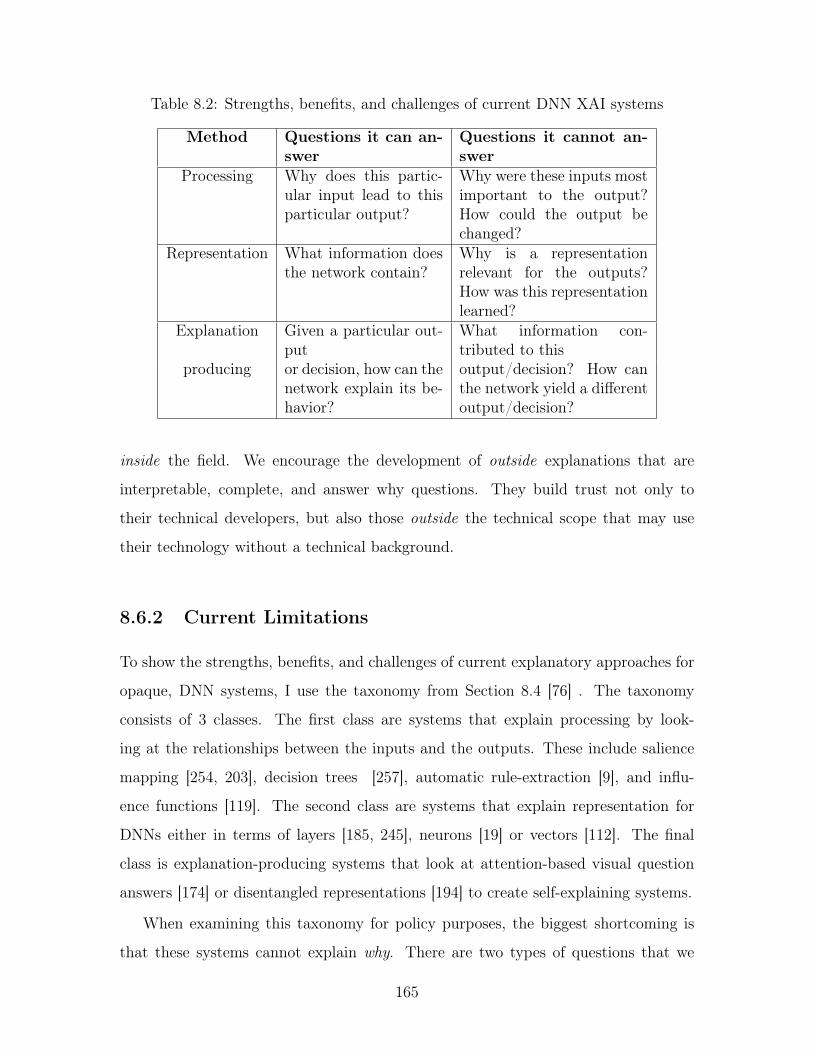
Table 8.2: Strengths, benefits, and challenges of current DNN XAI systems
Method Questions it can an-swer
Questions it cannot an-swer
Processing Why does this partic-ular input lead to thisparticular output?
Why were these inputs mostimportant to the output?How could the output bechanged?
Representation What information doesthe network contain?
Why is a representationrelevant for the outputs?How was this representationlearned?
Explanation Given a particular out-put
What information con-tributed to this
producing or decision, how can thenetwork explain its be-havior?
output/decision? How canthe network yield a differentoutput/decision?
inside the field. We encourage the development of outside explanations that are
interpretable, complete, and answer why questions. They build trust not only to
their technical developers, but also those outside the technical scope that may use
their technology without a technical background.
8.6.2 Current Limitations
To show the strengths, benefits, and challenges of current explanatory approaches for
opaque, DNN systems, I use the taxonomy from Section 8.4 [76] . The taxonomy
consists of 3 classes. The first class are systems that explain processing by look-
ing at the relationships between the inputs and the outputs. These include salience
mapping [254, 203], decision trees [257], automatic rule-extraction [9], and influ-
ence functions [119]. The second class are systems that explain representation for
DNNs either in terms of layers [185, 245], neurons [19] or vectors [112]. The final
class is explanation-producing systems that look at attention-based visual question
answers [174] or disentangled representations [194] to create self-explaining systems.
When examining this taxonomy for policy purposes, the biggest shortcoming is
that these systems cannot explain why. There are two types of questions that we
165

should ask of a decision making algorithm:
1. Why did this output happen?
2. How could this output have changed?
A summary of the types of questions that current DNN XAI systems can and
cannot answer are in Table 8.2. Explanation producing systems nearly answer the
first question we would want to ask a decision making algorithm: why did this output
happen? But the problem is that their explanation may not be complete and true to
the model’s internal decisions and processes.
8.7 A Big Problem: Opaque Perception Processes
Some of the best performing AI mechanisms are opaque. I showed how to monitor
these approaches in Chapter 4, most complex statistical computations are not ex-
plainable. Although some “concept-level” explanations exist [112, 19], these are based
on partial explanations are a set of numerical weights. There is immediate “story”
available.
But humans have the same problem. We cannot make a symbolic justification of
a perception. If we perceive something hazardous, such as the smell of smoke in a
building, we cannot explain why. However, we are able to describe this perception in
the context of a longer story: “There are many people in my apartment. I smelled
smoke and so I told the occupants to evacuate.” Every decision or action may depend
on some primitive perceptions but the combination that led to the result can be
explained, if we have the right symbolic descriptions for the primitive perceptions.
In the next few sections, I describe methods that attempt to “fill in the gaps” of
perception.
8.7.1 Hallucinating Information
Expectation is essential to perception. The idea is that the expectation generates
a “hallucination:” a reasonable interpretation of constrained sensory data. In fact,
166

Andy Clark has said that “Perception itself is a kind of controlled hallucination”7.
Beale and Sussman actually showed a proof-of-concept of this idea [20]. Computers
struggle to perceive Kanizsa’s triangle or other illusionary contours that are are visible
to humans. Humans can also “fill in the gaps” and use context to classify blurry
photos [224].
The key idea is that expectation needs to be constructed in a way that is anal-
ogous to the domain-specific language. Consider the domain of stage-acting. Scene
descriptions (the domain-specific language) describe the characters and how they ap-
pear (e.g. “Hamlet enters stage right”. This description produces an expectation that
is aligned with our perception.
8.7.2 Imagining Possible Futures
Sound decisions are not made based on some single instant in time; rather, they are
made with careful consideration of their consequences. Sometimes these consequences
may not be known beforehand. This was stated nicely by Donald Rumsfled8:
There are known knowns. These are things we know that we know. There
are known unknowns. That is to say, there are things that we know we
don’t know. But there are also unknown unknowns. There are things we
don’t know we don’t know.
Thus, a system must be able to imagine each possible future that may result from
its choices, and evaluate whether that future might be reasonable. To do this well, the
system must be able to simulate the behavioral and physical consequences of acting
on any set of premises that may be chosen by committee arbitration, particularly
in the case where it will have accepted premises that in fact represent the wrong
situation.
Given a set of premises whose relative validity may not be obvious, it can be
difficult to decide which premises to accept. There are of course situations in which
7https://www.edge.org/conversation/andy_clark-perception-as-controlled-hallucination8Gerald Jay Sussman introduced me to this idea of “Rumsfledian reasoning.”
167

premises can be identified as faulty – for example, if they lead to violations of rea-
sonableness constraints or contradictions of systematic axioms. Often, though, we
cannot reject any of the available premises outright. In such cases we need a way to
decide which system of premises, out of equally plausible-looking possibilities, is to
be accepted in practice – and, as a corollary, what future our system pursues.
One can try to treat this problem as one of simulation-based search, with a pos-
sible objective being to find the choice of premises resulting in the “least bad” set of
consequences given the set of possible realities under consideration. It is of course
impossible to consider every potentially available reality; for instance, one cannot, in
this process, reasonably account for events like a meteor strike during the interval
under consideration, where no evidence exists to support the notion of incoming me-
teors. However, information reported by onboard perception supporting the existence
of an “unusual” object, like a lawnmower, provides at least two possibilities – the ex-
istence of a lawnmover, or a defect in the onboard perception – whose consequences
must be examined.
8.7.3 Commonsense Reasoning
Humans are opaque systems. When something goes wrong, we cannot always say
why. For example, when we are ill or malfunctioning, we cannot always point to the
exact subsystem causing the error. But we can form a coherent explanation of what
we believe we are suffering from, by querying previous data and commonsense. If we
have a fever, we can usually come up with a reason: we feel hot, then cold, and that
is similar to a previous time when we had a fever. We can also create explanations
with commonsense. If we have a stomach ache, perhaps it was the spicy food that
caused the pain. Or, it was the fact that we ate a heavy meal on a previously [starved]
stomach.
One way to mitigate perception errors is to supplement decisions with common-
sense. For example, in the stomach ache example, we can use commonsense to come
up with multiple explanations. This requires the availability of a commonsense knowl-
edge base. I can formulate explanations using “nearby” information: the stomach is
168
close to the appendix, which may be ruptured. Or we can create other causal expla-
nations: stomach aches can be caused by spicy food, or stomach aches can be caused
by eating too much on an empty stomach. It is difficult to determine which one of
these explanations is “most” correct or plausible, which is left to future work. But, the
ability for intelligent machines to use commonsense to formulate these explanations
themselves is a promising area of research.
8.8 The Risk of Deploying Opaque Models
Generally explaining model behavior is not enough to build trust in these sorts of
models. Another way these algorithms and systems can behave badly is due to a
inconsistency in the training data and/or knowledge bases. This does not necessarily
mean that the training data is “bad” per say, but that there is a misalignment between
the expected data and the actual training data used. We have seen this recently
with the Amazon recruiting algorithm [47]. This algorithm was eventually disbanded
because the results were extremely biased; since the algorithm had been trained on
applicants data for the past 10 years (where males are dominant), it was teaching
itself to choose male candidates. Even if the algorithm was modified, there was no
way to ensure it was unbiased. Although this is an extremely compelling case for
inquisitive explanatory systems, an even more persuasive case is for safety-critical
tasks.
Consider a machine learning classifier to diagnose breast cancer from an image,
where the training set was carefully selected to be fairly close to a 50-50 split of breast
cancer and non-breast cancer scans. Even if the classifier is very accurate, without
having access to complete explanations to understand how decisions are made in
the model, it is not certain that it is making decisions for the right reasons—the
model may in fact, learn a feature it should not rely on despite predicting breast
cancer very accurately. In [106], one classifier learned the resolution of the scanner
camera, therefore predicting cancerous images from a high resolution very accurately.
Figuring out this sort of data problem is extremely difficult. It requires either an
169

attuned intuition of the model’s inner workings or the model to be able to answer
questions to do a fine-grain sensitivity analysis.
8.9 Conclusions
One common viewpoint in the deep neural network community is that the level of
interpretability and theoretical understanding needed to for transparent explanations
of large DNNs remains out of reach; for example, as a response to Ali Rahimi’s Test of
Time NeurIPS address, Yann LeCunn responded that “The engineering artifacts have
almost always preceded the theoretical understanding” [133]. However, I assert that,
for machine learning systems to achieve wider acceptance among a skeptical populace,
it is crucial that such systems be able to provide or permit satisfactory explanations
of their decisions. The progress made so far has been promising, with efforts in
explanation of deep network processing, explanation of deep network representation,
and system-level explanation production yielding encouraging results.
I find, though, that the various approaches taken to address different facets of
explainability are siloed. Work in the explainability space tends to advance a par-
ticular category of technique, with comparatively little attention given to approaches
that merge different categories of techniques to achieve more effective explanation.
Given the purpose and type of explanation, it is not obvious what the best type of
explanation metric is and should be. I encourage the use of diverse metrics that
align with the purpose and completeness of the targeted explanation. My position is
that, as the community learns to advance its work collaboratively by combining ideas
from different fields, the overall state of system explanation will improve dramati-
cally, resulting in methods that provide behavioral extrapolation, build trust in deep
learning systems, and provide usable insight into deep network operation enabling
system behavior understanding and improvement.
170
Chapter 9
Contributions and Future Work
“Human beings are symbolic creatures. Inside their heads they break down the
outside world into a mass of mental symbols, then recombine those symbols
to recreate that world.”1
– Ian Tattersall via Patrick Henry Winston
Failures in autonomous machines, whether fatal2 or uncomfortable3, are due to
mistakes that a human would never make. Such increased level of harm on human lives
is undesirable and completely untenable. Consequently, assessing pre-deployment
reliability is important for autonomous agents that are responsible for decisions in
critical settings. One solution is to provide a reason or justification for the decision of
the autonomous agent being assessed: an explanation. But most of these explanations
are static, and not representative of the underlying agent’s processing.
In this thesis, I present a novel methodology, implementation, and evaluation that
utilizes explanations in two distinct ways. System-wide explanations are provided to
an end-user for analysis, while internal explanations are used among subsystems to
defend their actions and ensure robust higher-level decisions. Therefore, I differen-
tiate between (i) an internal subsystem explanation (or internal explanation), the1This quote is from Patrick H. Winston’s last public talk at the celebration of MIT’s new
Swartzman College of Computing. Available at: https://people.csail.mit.edu/phw/video/NewCollegeTalk.mp4
2An uber self-driving vehicle strikes and fatally kills a pedestrian [151].3Mall robot injures a toddler: https://qz.com/730086/
a-robot-mall-cop-did-more-harm-than-good/
171

symbolic reasons and dependencies for a specific local subsystem’s behavior, and (ii)
a system-wide narrative explanation (or system explanation), a (mostly causal) chain
of reasoning generated from the underlying subsystems. Since the underlying reasons
and dependencies are symbolic, they can be translated into a human-understandable
explanation with various degrees of detail: for anomaly detection, legal analysis, and
diagnosis.
My thesis contributes a new perspective on anomaly detection. Instead of viewing
anomalies as outliers in some coordinate system, I define anomalies as circumstances
which cannot be explained away by a consensus of neighboring subsystems. If a sub-
system provides an explanation that is inadequate or inappropriate, the subsystem
should either be corrected or disabled. In Chapter 7, I applied this methodology to
an autonomous vehicle. Through simulated erroneous test cases, I demonstrated that
ADE can reconcile inconsistencies between subsystems by examining the underlying
subsystem explanations. The key idea is that ADE is a general methodology; all com-
plex mechanisms should have the ability to reason, abstract from data, and explain
their behavior. Imagine if computer debugging was communicative: the computer
works with the human user to reconcile and diagnose errors. Computers could teach
their human counterparts new skills by explaining themselves clearly and coherently.
9.1 Explanations as a Debugging Language
Figure 9-1: My vision for articulate machines that can coherently communicate toeach other and to a human.
In Chapter 7, I used internal explanations as a debugging language between sub-
systems. But the larger goal is to facilitate better communication amongst subsys-
172

tems. In fact, there is limited internal reasoning and communication amongst the
subsystems of a complex machine. One reason is that the subsystems speak differ-
ent languages. In Chapter 5, I showed the log traces from a sensor and how those
low-level “point clouds” are quite different from the high-level vision processing labels.
However, LiDAR and vision systems are both perceiving the world. Even though they
process perception at different levels of abstraction, both systems should be able to
reason about their results in the same language.
I view symbolic reasons, justifications, and explanations as a communication lan-
guage. My vision is two-fold, as seen in Figure 9-1. On the left, I argue that system-
level explanations can facilitate better communication among systems to complete
tasks, e.g., a hybrid reasoning system, described in Section 9.2.1. On the right, I
argue that explanations are a debugging language, for systems and tasks that include
people. I discuss some of these tasks in Section 9.3.1.
In this thesis, I developed symbolic systems to monitor opaque learning systems,
but the symbolic systems do not currently change the internal state of the opaque
learning system. However, imagine if they could learn from each other. Symbolic
systems excel at abstraction, while learning systems excel at finding trends in data.
What if they could work together and communicate between themselves to infer
abstract trends in data? I believe that combining symbolic and learning approaches,
by facilitating a communication language for them to work together, is a concrete
step towards artificial intelligence [156]4.
9.2 Future Applications
My research vision is for complex machines to be articulate by design. Dynamic in-
ternal explanations will be part of the design criteria, and system-level explanations
will be able to be challenged in an adversarial proceeding. Further, explanations
are dynamic: if the explanation is inadequate or inappropriate, the underlying pro-
4Examining Minsky’s classic steps towards artificial intelligence paper, there are both symbolicand data-driven learning approaches. If we are to learn anything from Minsky, it is that neitherapproach can solve all the AI problems alone.
173

cess should be corrected or disabled. With this vision, all machines will be able to
explain themselves at various levels of detail. This requires progress in reasoning
and representation, narrative intelligence and natural language processing (NLP),
and human-centered computing. These types of articulate systems are applicable to
many domains, including computer security (see Section 9.2.4).
9.2.1 Hybrid Approaches to Intelligent Systems
In critical applications, multiple methods are used to check and validate solutions.
The financial realm has double-entry bookkeeping, and airplanes have multiple en-
gines and checks for safety-critical components. We should also require machines to
be able to reason about their decisions in multiple ways. But reasoning systems and
approaches currently function in isolation. My work relies on techniques from com-
monsense reasoning, case-based reasoning, and hypothetical reasoning. Many of these
techniques are used in isolation, but as a first step, I will try to incorporate these
approaches together in a hybrid-reasoning system that uses rules, commonsense, and
hypotheticals for more robust decision making.
Systems that use higher-level representations are restrictive; they are typically
human-curated, static, and specific to the target application or input data. In my
reasonableness monitoring system [74], I represented the input descriptions as a com-
position of conceptual primitives. This representation is difficult to learn automat-
ically. As a first step, I will look at more flexible representations of knowledge and
language, and how representations can be learned with limited human-curated infor-
mation.
9.2.2 Using Explanations as Internal Narrative
Machines should be able to tell stories like people do. The types of explanations
that I develop serve two purposes: their symbolic representation is used internally
by the parts of a machine to reconcile their errors, and is then constructed into a
human-readable explanation documenting what happened and why. Processing, un-
174

derstanding, and building these types of explanations is still an open area of research.
9.2.3 Explanations for Society
When autonomous machines share control with a human operator, there will be some
explaining to do. If the autonomous operator intervenes, the human will ask why. If
the machine operator does not provide a proper explanation, the collaboration will
be flawed. They will need to speak a common language, and be able to process,
understand, interpret, and intervene based on this language in real-time. I am inter-
ested in using explanations shared between a human and machine operator for more
streamlined and trustworthy decision making. This relies on better system design
and mechanisms for humans to intervene based on explanations.
Another societal problem is that the legal realm does not support the upcoming
transition to autonomous decision making (e.g., AVs). These decision making sys-
tems have been shown to cause harm, including racial bias [237] and in some cases
even physical harm. In safety-critical and mission-critical decisions, AVs will need
to be able to defend their actions and testify in an adversarial proceeding. As an
interdisciplinary direction, I could encode the legal requirements for these machines
to be able to explain themselves to abide by legal rules and infrastructure.
In this thesis, I created a system architecture that is inspired by the structure of hu-
man committees. The methodology can be applied to complex human organizations:
imagine a social or government structure where every intended action is supplemented
with a corresponding reason. Inconsistencies amongst committees are reconciled by
comparing the committees’ proposed actions and their underlying justifications to a
priority hierarchy. Automatic reasoning and negotiation (with explanations) will help
to mitigate societal conflicts.
9.2.4 Security Applications
Computer security systems are imperfect. Intrusion detection software is good at
catching single points of failure and other local vulnerabilities, but most security
175

software fails when there is a faulty connection or an inexplicable communication be-
tween parts. Using symbolic subsystem explanations can mitigate these intrusions by
constantly and consistently monitoring the reasonableness of subsystem communica-
tion and checking the behavior against prior data. This approach is also relevant for
IoT systems, in which independent entities work together, making common commu-
nication key to diagnosing errors.
9.3 Reevaluating Evaluations
A common question is “who is the explanation for?” This is a difficult question to
answer because it depends on the applications and the use case. For the critical,
self-driving application, I argue that the explanations are for the machine: they are
used as evidence to reconcile system-wide errors. I argue that the type of evaluation
is dependent on what the explanation is actually explaining (see Table 8.1). Since my
explanation procedures are explaining inconsistencies, it is important to consider the
types of tasks where these explanations are essential. In this section, I propose tasks
that require explanations: software debugging, collaborative games, and autonomous
vehicle challenges.
9.3.1 Tasks that Require Explanations
A way to evaluate explanations is to design tasks that rely on explanations to be
completed. For example, a task for which a human operator and computer system
have to work together, and the explanations (from and to a human) are necessary
for task completion. A nice example would be computer debugging, where the error
is communicated through a series of explanations from a computer. The debugging
program and the human communicate back and forth until the root cause is correctly
identified. Other types of collaborative tasks would also be reasonable benchmarks.
Hanabi is a collaborative card game. It has recently been proposed as an important
new challenge for artificial intelligence [18]. It has imperfect information, as the
players can view other players’ cards but not their own. The goal is to play a series of
176

cards in a specific order, and players are allowed to give information to each other in
a specific language. This game has been solved mathematically [43], but I argue that
it is still an important task due to the fact that collaboration is necessary to succeed.
Further, self-explanation is important in these kinds of games, and in card games in
general. In poker, expert players use a “theory of mind”5.
9.3.2 Challenges for Imagining and Explaining Possible Fu-
tures
Human drivers are able to reason about circumstances they have not seen before,
exactly the ones that confound autonomous vehicles. But these “difficult autonomous
scenarios,” are not yet characterized or bench-marked. I argue that careful writing of
challenge scenarios will ensure safety, trust, and reliability in widespread autonomous
vehicle adoption.
There is a complete void of erroneous autonomous vehicle data. The current self-
driving data sets are hand-curated and perfectly labeled [31, 110, 69]. Autonomous
driving challenges6 are vaguely constructed (e.g., avoid a neighboring car or switch
lanes), but a successfully completed challenge would be precise in execution. The
successes of autonomous vehicles are completely dependent on their ability to learn
through (previously observed) experiences. Instead, I aim to create a set of self-driving
error scenarios that require abstract, high-level anticipatory thinking: the same type
of reasoning humans do in difficult situations. In the same way humans can learn
without experiencing, I will develop scenarios that ensure autonomous vehicles can
also learn new things, without failing first.
These challenges may include meta-tasks like theory of mind (e.g., what is the
neighboring vehicle trying to accomplish) or self-introspection (e.g., after observing
a new highway sign, retroactively analyzing one’s actions). These error scenarios,
although not fully representative of all the failure cases, will encapsulate the types5Poker players using theory of mind to imagine their opponents https://www.forbes.com/
sites/alastairdryburgh/2015/08/20/how-theory-of-mind-can-make-or-lose-you-money6Carla autonomous driving challenge scenarios: https://carlachallenge.org/challenge/
nhtsa/
177

Figure 9-2: A difficult driving scenario for a self-driving vehicle.
of abstract anticipatory thinking that autonomous machines (and especially vehicles)
need to possess for safety-critical or mission-critical tasks. Developing this capability
results in adaptive autonomous vehicles that can reason and address the ever-growing
long tail of errors.
Consider the cross-walk example in Figure 9-2. Large trucks typically block the
field of view of neighboring drivers. In suburban areas, the truck may block a pedes-
trian or another critical, moving object. Human drivers can “imagine” this scenario,
but autonomous agents cannot. The key question is how an autonomous agent could
“haluccinate” this hidden threat, especially if it has not seen it before. This is a
scenario that requires abstract reasoning and anticipatory thinking7.
Other difficult scenarios are “corner cases” that humans learn from experience.
Consider an autonomous vehicle stopped on an incline. When I was learning to drive
in San Francisco (a city that is known for its hills), I was shocked to learn that you
want to engage the brakes and the gas at the same time when accelerating up a hill
from a stop. It is left to consider whether this type of behavior could be learned.
But these types of intuitive physics “corner cases” are important to reason about,
especially in difficult driving conditions.
7The idea of Anticipatory Thinking (AT) is an emerging area. I have been defining this idea interms of autonomous vehicle challenge problems: https://www.anticipatorythinking.ai.
178

9.4 Implications
My thesis contributes a new vision of anomaly detection; in which anomalies are not
outliers, but instances that cannot be explained away by the consensus of neighboring
parts. These errors are actually beneficial for the system, and can be used to mitigate
future problems. For example, if LiDAR fails when it is raining, then the high-level
planner can discount the LiDAR component in inclement weather. If the vehicle
continuously skids on left turns, then parts that contribute to the turning sequence
(e.g., the tires, vehicle alignment, brakes, steering, power control, etc.) can be re-
evaluated. If the vision system consistently confuses turtles with weapons [14], then
it should have to explain why. It is only in the case where the machine cannot explain
its failure that the error becomes a bug.
I have presented two ideas towards system-wide anomaly detection. First are
sanity checks, or reasonableness monitors, that uphold subsystems to a set of rea-
sonable rules and behaviors. Second is to facilitate better communication amongst
parts through explanation. When those two ideas are combined into a system-wide
architecture, namely Anomaly Detection Through Explanations (ADE) in Chapter 7,
I discovered that explanations facilitate a common debugging language for inconsis-
tencies amongst subsystems.
My work has opened up the new area of explanatory anomaly detection, towards a
vision in which: complex mechanisms will be articulate by design; dynamic, internal
explanations will be part of the design criteria, and system-level explanations will be
able to be challenged in an adversarial proceeding. I have discussed how these expla-
nations aid in system-level debugging, but imagine a world in which an autonomous
agent can defend itself. The system-wide explanations are a story: an unbiased
account of what happened and why. By querying the explanation synthesizer, infor-
mation can be retracted and added; possibly creating a way to fix a formerly broken
complex machine. While not all complex machines will work this way, it ensures safer,
more robust monitored machines in safety-critical and mission-critical tasks.
In summary, autonomous agents are making decisions with consequences. For
179

stakeholders (e.g., insurance companies, police overseers) and society (e.g., the peo-
ple who may be harmed) to trust these autonomous thought-partners, the agents need
to provide concise and understandable explanations of their actions. This explana-
tory ability requires significant technical developments in reasoning, representation,
and narrative, while also exploring societal questions in HCI and policy-making. In
the current interim of shared autonomy (between human and machines), a path of
adoption includes the use of monitoring, learning from explanations, and adaptable
representations towards system-wide deployment of self-explaining systems. By focus-
ing on limited autonomy, like a car that drives itself, complex machines are learning
details and trends rather than abstracting and learning from their mistakes. Instead,
my approach is to create the capability for a complex machine, like a car, to be aware
of its internal state as well as its environment. In other words, a car that knows and
can explain that it is driving.
9.5 A Salute
In Patrick Winston’s “How to Speak” lecture, he suggested that you end each talk
(or document) with a salute. The salute thanks the audience (or the reader) for their
attention, questions, and participation.
I have been fortunate to work on a problem that is unsolved. Errors in autonomous
vehicles, whether fatal [151] or uncomfortable8, are difficult to represent. In fact, there
is a complete void of erroneous autonomous vehicle data. The current self-driving data
sets are hand-curated and perfectly labeled [31, 110, 69]. At the same time, current
challenges9 are vague in approach, but precise in execution. In my thesis work, I
have defined a methodology for complex machines to reason about their own errors.
It utilizes abstract, high-level reasoning; the same type of reasoning humans do in
difficult situations.
8Consistent starting and stopping self-driving behavior: https://www.wired.com/story/ride-general-motors-self-driving-car/.
9NTHSA inspired autonomous vehicle challenges: https://carlachallenge.org/challenge/nhtsa/.
180

I have evaluated my methodology on simulated errors. In ongoing work, I will cre-
ate a set of self-driving error scenarios that embed abstract, high-level anticipatory
thinking. These challenges may include meta-tasks like theory of mind (i.e. what is
the neighboring vehicle trying to accomplish) or self-introspection (i.e. in new ex-
periences, how does one reason to itself). These error scenarios, although not fully
representative of all the failure cases, will personify the types of abstract, anticipa-
tory thinking that autonomous machines (and especially vehicles) need to possess
for safety-critical or mission-critical tasks. This long list of errors demonstrates that
complex machines need the ability to reason, abstract, and explain.
I alluded that this section is a salute, which thanks the reader. At his last public
lecture, my mentor Patrick Henry Winston said, “Now that’s the end of my story for
today, but I hope it will be just the beginning of a story that will be told in the days
and years to come”10. But this is not the end of the story, as Neil Gershenfeld11 once
said: a thesis is not finished, rather, it is abandoned. And while there are many more
errors to justify, machines to monitor, and rules to learn; I leave the next explanation
to a curious reader.
10This quote is from Patrick Henry Winston’s last public lecture: https://people.csail.mit.edu/phw/video/NewCollegeTalk.mp4. This thesis greatly benefited from his guidance and leader-ship.
11I learned “How To Make Almost Anything” from Professor Gershenfeld: http://ng.cba.mit.edu. In this course, I witnessed, debugged, and made complex machine errors, first hand.
181

182

Appendix A
Auxiliary Information
A.1 Qualitative Algebras
• The qualitative increment algebra is essentially a qualitative description of the
first derivative. In this chapter, these qualitative descriptions of the first deriva-
tive were sufficient to explain the vehicle phenomena. However, for future work,
I may need to use more precise quantitative descriptions. In anticipation, I de-
veloped a system to keep track of derivative values on the cells in the art of the
propagator system.
• The qualitative action describes mechanical changes within an interval as a set
of four actions: tightening, loosening, no action, and unknown action. It may
appear as if the qualitative action is unnecessary, since it has a surjective map-
ping to the qualitative increment, where tightening is a qualitative increment
value of increasing, loosening is a qualitative increment value of decreasing,
no action maps to no change, and unknown action maps to unknown change.
However, having the qualitative action makes our explanations much easier to
report: while the description of “tightening a caliper” is easy to understand,
“increasing a caliper” is a bit ambiguous.
• The qualitative direction has two values: an incremental change description and
a direction description. The incremental change is defined as the qualitative
183

increment. The second value, the direction description, describes a lateral di-
rection in four values: left, right, neutral, and unknown direction. This direction
is with respect to a point of reference. In our research, the point of reference is
usually the center of mass of the vehicle.
• The qualitative position also has two values: a lateral description and a longitu-
dinal description. The lateral description is defined with respect to the direction
description defined in the qualitative direction. The longitudinal direction is de-
fined with respect to four values: front, back, neutral and unknown.
After defining the algebras, it is necessary to define the combinations of these
values so that the algebraic descriptions can work together to provide a comprehensive
explanation. It then becomes important to define the resulting qualitative type from
different combinations, so if two qualitative values are added, the resulting qualitative
value makes sense. For example, if a qualitative increment and a qualitative action
are added together, the resulting value with be a qualitative increment, because the
qualitative action can be directly mapped to the qualitative increment. An example
additive algebraic function for the qualitative-direction is shown in Figure A-1.
Since there are only one type of combinations of different qualitative algebras in our
model so far: combining qualitative increments and qualitative actions, defining a
qualitative hierarchy is left to future work1.
1It is an open problem to create an ontology or organization of qualitative values. In fact, mostontologies are domain-dependent, which is why I defined four different qualitative values for vehiclechanges.
184

(define (add-qualitative-direction x y)(let ((x-desc (qualitative-direction-description x))
(y-desc (qualitative-direction-description y))(x-turn (qualitative-direction-turn x))(y-turn (qualitative-direction-turn y)))
(let ((added-desc (qualitative-description(generic-+ (make-qualitative x-desc)
(make-qualitative y-desc)))))(cond ((equal? x-turn y-turn)
(make-qualitative-direction added-desc x-turn))((or (equal? x-turn '?) (equal? y-turn '?))(make-qualitative-direction added-desc '?))
((equal? x-turn '0)(make-qualitative-direction added-desc y-turn))
((equal? y-turn '0)(make-qualitative-direction added-desc x-turn))
(else (make-qualitative-direction added-desc '?))))))
Figure A-1: An example of qualitative addition for the qualitative direction algebra.
A.2 Conceptual Primitive Descriptions
• PTRANS : The PTRANS act primitive represents the event of a thing changing
location from one place to another. The PTRANS act typically has an object
case, representing the thing which moved or was moved, an actor case repre-
senting the actor which performed or caused the movement, and a direction
case indicating the start and end point of the movement.
• MOVE : The MOVE act primitive represents the event of a thing moving a part
of its body or part of itself. The MOVE act has an object case, representing
the body part that was moved, an actor case representing the actor which
performed the MOVE, and a direction case indicating the start and end point
of the movement.
• PROPEL: The PROPEL act primitive represents the event of a thing applying
a force to another thing, or a moving thing striking or impacting another thing.
The PROPEL act typically has an object case, representing the object which
was struck or has a force applied to it, an actor case representing the actor
185
which performed or caused the PROPEL, and a direction case indicating the
direction of the force.
• INGEST : The INGEST act primitive represents the event of a thing moving,
being forced, or forcing itself to go from the outside to the inside of another
thing.
The INGEST act has an object case, representing the thing which moved or
was moved to the inside of another thing, an actor case representing the actor
which performed or caused the movement, and a direction case indicating the
start and end point of the movement. Often the end point of an INGEST is a
part of the body of the actor. Eating, for example, is an INGEST of something
where the end point of the object’s movement is the mouth or stomach of the
actor.
• EXPEL: The EXPEL act primitive represents the event of a thing moving, being
forced, or forcing itself to go from the inside to the outside of another thing.
The EXPEL act has an object case, representing the thing which moved or was
moved from inside to the outside of another thing, an actor case representing the
actor which performed or caused the movement, and a direction case indicating
the start and end point of the movement. Often the start point of an EXPEL
is a part of the body of the actor. If a surgeon removes a bullet, a tumor, or a
parasite from another person’s body, however, the surgeon is the actor, but the
start point of the movement of the object is a body part of another individual.
• GRASP : The GRASP act primitive represents the event of a thing grasping
or becoming attached to another thing. The GRASP act has an object case,
representing the thing which is being GRASPed, and an actor case representing
the actor which performed the GRASPing.
PTRANS and MOVE are very similar primitives because they both involve movement
from one place to another: for PTRANS an entire thing moves, while for MOVE, an
animate thing only moves part of its body. In building the reasonableness monitor
186

prototype system, I found it difficult to find ConceptNet anchors allowing us to de-
termine whether a verb should instantiate a PTRANS or MOVE. Because of this, I
chose to combine the PTRANS and MOVE primitives into a single primitive, which
I call MOVE-PTRANS, or simply MOVE. Any referral to MOVE in this thesis is the
MOVE-PTRANS primitive.
187

188

Appendix B
Code
B.1 Vehicle Specific Artifacts
(define (make-bus-code-mapping #!optional mapping-file)(set! *bus-code-mapping* (make-strong-eq-hash-table))(hash-table/put! *bus-code-mapping* 22 'lateral)(hash-table/put! *bus-code-mapping* 23 'acceleration)(hash-table/put! *bus-code-mapping* 25 'steering)(hash-table/put! *bus-code-mapping* 30 'brakes)(hash-table/put! *bus-code-mapping* '3e 'gear-rotation)(hash-table/put! *bus-code-mapping* 'b1 'front-wheels)(hash-table/put! *bus-code-mapping* 'b3 'back-wheels)(hash-table/put! *bus-code-mapping* 'b4 'speed)(hash-table/put! *bus-code-mapping* 120 'drive-mode)(hash-table/put! *bus-code-mapping* 244 'gas-pedal)(hash-table/put! *bus-code-mapping* 'groundtruthxyz 'ground-truth)(hash-table/put! *bus-code-mapping* 'groundtruthheading 'heading))
Figure B-1: CAN bus mapping code for the vehicle simulation in Chapter 3
189

(define (isBraking? snapshot)(eqv? (log-snapshot-brake snapshot) 0))
(define (isAccelerating? snapshot)(eqv? (log-snapshot-accel snapshot) 'inc))
(define (isTurningRight? snapshot)(eqv? (log-snapshot-steering snapshot) 'inc))
(define (isTurningLeft? snapshot)(eqv? (log-snapshot-steering snapshot) 'dec))
Figure B-2: A subset of the edge detection rules for the “intervals of interest” inChapter 3.
(define w) ;; width of the car in front from lidar sensor(define k) ;; distance from the front wheel to self(define l) ;; self's wheel base(define r) ;; radius of self(define d) ;; lenth of self
(define rlsqdiff (e:- (e:square r) (e:square l)))(define lksumsq (e:square (e:+ l k)))(define c (e:square (e:- (e:sqrt rlsqdiff) w)))(define sqrtres (e:sqrt(e:-(e:+ rlsqdiff lksumsq) c)))
;;minimum space needed(define m (e:+ d (e:- (e:- sqrtres l) k)))(add-content w 2.43) ;;m;;estimate based on l and d(add-content k 0.8)(add-content l 2.8804)(add-content r 10.82)(add-content d 4.8285)
(define distance-threshold m)(define actual-distance) ; read from processed log snapshot
Listing 13: Propagator code to calculate the minimum space needed to parallel park.
190

:safe_car_policy a air:Policy;air:rule :light-rule;air:rule :pedestrian-rule;air:rule :right-turn-rule;air:rule :speed-rule .
:pedestrian-rule a air:Belief-rule;air:if {
foo:some_pedestrianont1:InPathOf foo:my_car.
};air:then [
air:description ("Pedestrian detected");air:assert [air:statement{
foo:my_carair:non-compliant-with
:safe_car_policy .}]];air:else [
air:description ("No obstructions");air:assert [air:statement{
foo:my_carair:compliant-with:safe_car_policy .}]] .
:light-rule a air:Belief-rule;air:if { :EVENT a :V;
ont1:Locationfoo:some_traffic_light.
};air:then [air:rule :traffic-light-rule].
Listing 14: A subset of the safe-driving rules written in AIR.
191

B.2 Adaptable Code Artifacts
These are independent code “snippets” that can be used in multiple domains.
B.2.1 Conceptual Dependency Parsing
tokens = annotation.split()tree = rep.parse_with_regex(tokens)
IPython.core.display.display(tree)all_annotations.append(annotation['caption'])
concepts = rep.get_concepts(tree)
(noun, noun_phrase, adjectives) = rep.get_noun_phrase(tree)(verb, obj, context, phrase_dict) = rep.get_verbs(tree, True)
Listing 15: The parsing process that creates a CD primitive frame.
B.2.2 Commonsense Data Querying
192

def find_anchor(concept_phrase, anchors):"""Search for a specific anchor from a set of anchors"""logging.debug("searching for an anchor point for %s" % concept_phrase)
for anchor in anchors:if anchor in concept_phrase:
logging.debug("anchor point %s is partof the concept phrase: %s"% (anchor, concept_phrase))
triple = [concept_phrase, 'IsA', anchor]return make_fact(triple, "direct search")
for anchor in anchors:if type(concept_phrase) is list:
concept = concept_phrase[-1]else:
concept = concept_phrasereturn get_closest_anchor(concept, 'IsA', anchors)
193

def get_closest_anchor(concept, relation, anchors):"""Goes through all the relations and tries to find the closest one.If the anchor point is in the isA hierarchy at all, it"""for anchor in anchors:
logging.debug("Searching for an IsA link between %s and %s" \% (concept, anchor))
obj = requests.get(query_prefix + concept + rel_term + 'IsA' +\limit_suffix).json()
edges = obj['edges']if edges:
for edge in edges:if check_IsA_relation(concept, anchor, edge):
triple = [concept, 'IsA', anchor]return make_fact(triple, "ConceptNet IsA link")
else:return "not found" # TODO this needs a better message
# If it is never found, make default objecttriple = [concept, 'IsA', default_anchor]return make_fact(triple, "Default anchor point")
def make_fact(triple, reason):"""Makes a basic data fact base in pandas data"""logging.debug("Making a new fact: %s with reason: %s" % (triple, reason))[subject, predicate, obj] = triplefact_term = "%s %s %s" % (subject, predicate, clean_phrase(obj))return [fact_term, reason]
194

B.3 Interpreting LiDAR data
def get_raw_lidar(sample):"""Loads LIDAR data from binary numpy format.Data is stored as (x, y, z, intensity, ring index)."""lidar_data = nusc.get('sample_data', sample['data']['LIDAR_TOP'])file_path = nuscenes_root+data_name+'/'+lidar_data['filename']scan = np.fromfile(file_path, dtype=np.float32)return scan
def with_ring(sample):"""Retuns (x, y, z, intensity, ring index)."""scan = get_raw_lidar(sample)points = scan.reshape((-1,5))print(np.shape(points))return points
def visualize_rings(rings, ring_nums):"""takes in the rings and the ring numbers"""fig = plt.figure()ax = fig.add_subplot(111, projection='3d')ax.set_xlabel('X')ax.set_ylabel('Y')ax.set_zlabel('Z')
for ring in ring_nums:temp = rings[rings[:,RING_IND]==ring]x = temp[:,0]y = temp[:,1]z = temp[:,2]
ax.scatter(x,y,z, marker='o')plt.show()
Listing 16: Visualization code for examining specified beams.
195

my_sample_token = my_scene['first_sample_token']my_sample = nusc.get('sample', my_sample_token)
raw = get_raw_lidar(my_sample)rings = with_ring(my_sample)
visualize_rings(rings, [4,5,8])visualize_rings(rings, [1,10,20])
Listing 17: Minimal working code for the LiDAR point cloud ring visualization.
B.4 Synthesizer
passenger is safe at velocity V between s and tAND( OR( safe driving at velocity V during s and t
AND( moving V at state st succeeds smoving V at state t ) )
OR( obj is not a threat between s and tAND( OR( obj not a threat at s
obj is not movingobj is not located nearobj is not a large object )
OR( obj not a threat at tobj is not movingobj is not located nearobj is not a large object ) ) ) ) )
Listing 18: The implemented goal tree used for passenger safety in the explanationsynthesizer. “safe transitions” and “threatening objects” have been expanded, as de-fined in Equation 7.1 and Equation 7.2.
Note that there are multiple AND (OR (...) statements in Figure 11. This due to
my backward-chaining algorithm. These statements can also be simplified, but they
are left for readability; so the reader can see where the rules are expanded. For exam-
ple, in line 2 of Listing 11, “safe transitions”: safe driving at velocity V during
s and t is met only if AND( moving V at state s, t succeeds s, moving V at
state t ) )
196

B.5 Sample Results
B.5.1 NuScenes Examples
Figure B-3: A labeled data sample from NuScenes.
B.5.2 Parsing Examples
Figure B-4: The parse tree for “A mailbox crossing the street.”
197

Figure B-5: The parse tree for a real image caption from “A man looks at his cellphonewhile standing next to a motorcycle.”
@prefix foo: <http://foo#>.@prefix car_ont: <http://car_ont#>.
foo:my_cara car_ont:Vehicle ;car_ont:LastState "stop" ;car_ont:CurrentState "stop" ;car_ont:direction foo:some_traffic_light .
foo:some_pedestriansa car_ont:Pedestrian ;car_ont:label "woman" ;car_ont:CurrentState "move" ;car_ont:propel foo:woman-object ;car_ont:InPathOf foo:my_car .
a car_ont:Pedestrian ;car_ont:label "man" ;car_ont:CurrentState "move" ;car_ont:NextTo foo:woman-object ;car_ont:InPathOf foo:my_car .
foo:woman-objecta car_ont:Object ;car_ont:CurrentState "propel" ;car_ont:InPathOf foo:my_car .
foo:some_traffic_lighta car_ont:TrafficLight ;car_ont:LightColor "red" .
Listing 19: The RDF log associated with Figure B-3.
198

import PyPDF2from nltk.tokenize import word_tokenize
IF = 'if'THEN = 'then'BC = 'because'RULE_KEYWORDS = [IF,THEN,BC]
def read_manual(file_name='MA_Drivers_Manual.pdf'):"""File located athttps://driving-tests.org/wp-content/uploads/2020/03/MA_Drivers_Manual.pdf"""pdfFile = open(LOCAL_PATH+file_name, 'rb')# creating a pdf reader objectpdfReader = PyPDF2.PdfFileReader(pdfFile)
# printing number of pages in pdf fileMAX_PAGES = pdfReader.numPagesSTART_PAGE = 10 # The beginning few pages are indexes
total_automatic = 0for page in range(START_PAGE, MAX_PAGES):
pageObj = pdfReader.getPage(page)pageText = pageObj.extractText()total_automatic+=extract_if_then(pageText)
# closing the pdf file objectprint("Found %d potential rules"%total_automatic)pdfFile.close()
def extract_if_then(page_text):"""Check for rule keywords in text"""if_counter = 0sentences = page_text.split('.')for sentence in sentences:
tokens = word_tokenize(sentence.lower())if IF in tokens:
words = [word for word in tokens if word.isalpha()]if_counter +=1
return if_counter
Listing 20: Script for counting the number of probable rules in a driving manual.
199

200
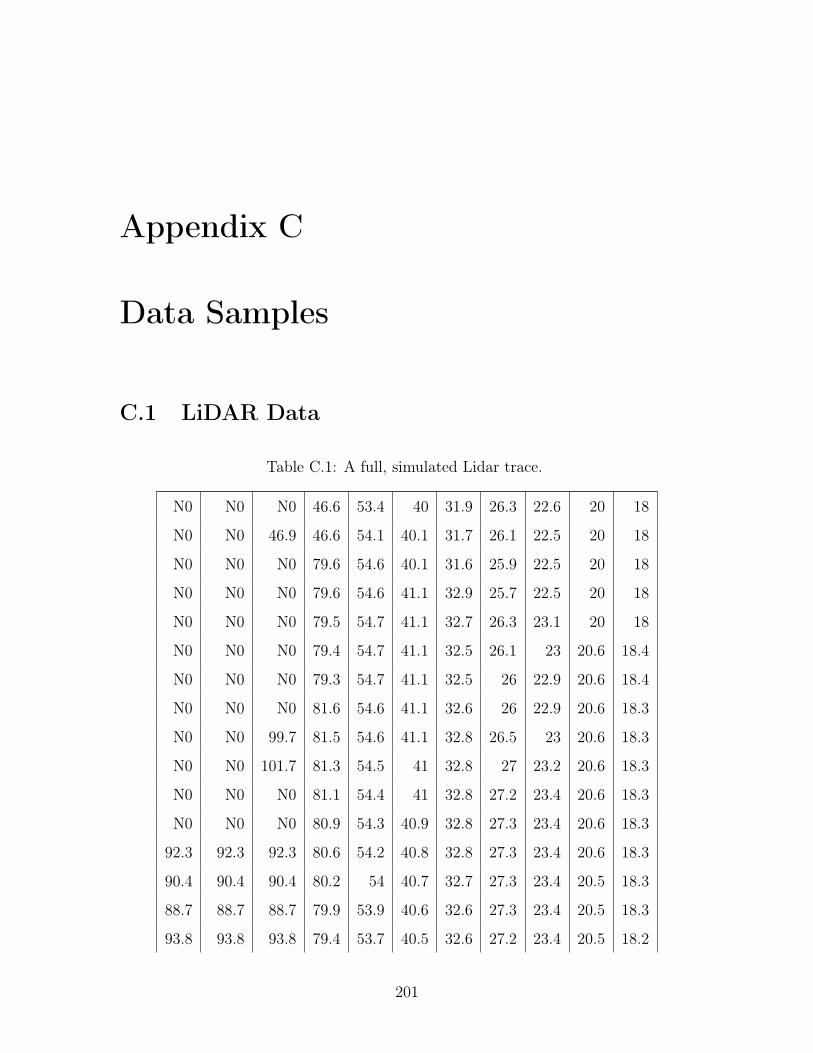
Appendix C
Data Samples
C.1 LiDAR Data
Table C.1: A full, simulated Lidar trace.
N0 N0 N0 46.6 53.4 40 31.9 26.3 22.6 20 18
N0 N0 46.9 46.6 54.1 40.1 31.7 26.1 22.5 20 18
N0 N0 N0 79.6 54.6 40.1 31.6 25.9 22.5 20 18
N0 N0 N0 79.6 54.6 41.1 32.9 25.7 22.5 20 18
N0 N0 N0 79.5 54.7 41.1 32.7 26.3 23.1 20 18
N0 N0 N0 79.4 54.7 41.1 32.5 26.1 23 20.6 18.4
N0 N0 N0 79.3 54.7 41.1 32.5 26 22.9 20.6 18.4
N0 N0 N0 81.6 54.6 41.1 32.6 26 22.9 20.6 18.3
N0 N0 99.7 81.5 54.6 41.1 32.8 26.5 23 20.6 18.3
N0 N0 101.7 81.3 54.5 41 32.8 27 23.2 20.6 18.3
N0 N0 N0 81.1 54.4 41 32.8 27.2 23.4 20.6 18.3
N0 N0 N0 80.9 54.3 40.9 32.8 27.3 23.4 20.6 18.3
92.3 92.3 92.3 80.6 54.2 40.8 32.8 27.3 23.4 20.6 18.3
90.4 90.4 90.4 80.2 54 40.7 32.7 27.3 23.4 20.5 18.3
88.7 88.7 88.7 79.9 53.9 40.6 32.6 27.3 23.4 20.5 18.3
93.8 93.8 93.8 79.4 53.7 40.5 32.6 27.2 23.4 20.5 18.2
201

N0 N0 N0 79 53.5 40.4 32.5 27.2 23.3 20.5 18.2
N0 N0 N0 78.5 53.2 40.3 32.4 27.1 23.3 20.4 18.2
N0 N0 N0 78 53 40.2 32.3 27 23.3 20.4 18.2
N0 N0 N0 77.4 52.8 40 32.2 27 23.2 20.4 18.1
N0 N0 N0 76.8 52.5 39.8 32.1 26.9 23.1 20.3 18.1
N0 N0 N0 76.2 52.2 39.7 32 26.8 23.1 20.3 18.1
N0 N0 N0 75.6 51.9 39.5 31.9 26.8 23 20.2 18
N0 N0 N0 74.9 51.6 39.3 31.8 26.7 23 20.2 18
N0 N0 N0 74.2 51.3 39.1 31.7 26.6 22.9 20.1 18
N0 N0 N0 73.5 50.9 38.9 31.5 26.5 22.8 20.1 17.9
N0 N0 N0 72.8 50.6 38.7 31.4 26.4 22.8 20 17.9
N0 N0 N0 72.1 50.2 38.5 31.3 26.3 22.7 20 17.8
N0 N0 N0 71.4 49.9 38.3 31.1 26.2 22.6 19.9 17.8
N0 N0 N0 70.6 49.5 38.1 31 26.1 22.5 19.9 17.7
N0 N0 N0 69.8 49.1 37.9 30.8 26 22.5 19.8 17.7
N0 N0 118.6 69.1 48.7 37.7 30.7 25.9 22.4 19.7 17.6
N0 N0 116.3 68.3 48.4 37.4 30.5 25.8 22.3 19.7 17.6
N0 N0 114.1 67.5 48 37.2 30.4 25.7 22.2 19.6 17.5
N0 N0 111.9 66.8 47.6 37 30.2 25.6 22.1 19.5 17.5
N0 N0 109.8 66 47.2 36.7 30.1 25.4 22.1 19.5 17.4
N0 N0 107.6 65.2 46.8 36.5 29.9 25.3 22 19.4 17.4
N0 N0 105.6 64.5 46.4 36.2 29.7 25.2 21.9 19.3 17.3
N0 N0 103.5 63.7 46 36 29.6 25.1 21.8 19.3 17.3
N0 N0 101.6 62.9 45.6 35.8 29.4 25 21.7 19.2 17.2
N0 N0 99.6 62.2 45.2 35.5 29.2 24.9 21.6 19.1 17.2
N0 N0 97.7 61.5 44.8 35.3 29.1 24.7 21.5 19.1 17.1
N0 N0 95.9 60.7 44.4 35 28.9 24.6 21.4 19 17
N0 N0 94.1 60 44 34.8 28.8 24.5 21.3 18.9 17
N0 N0 92.4 59.3 43.7 34.5 28.6 24.4 21.3 18.8 16.9
N0 N0 90.7 58.6 43.3 34.3 28.4 24.3 21.2 18.8 16.9
202

N0 N0 89.1 57.9 42.9 34.1 28.3 24.1 21.1 18.7 16.8
N0 N0 87.5 57.2 42.5 33.8 28.1 24 21 18.6 16.8
N0 N0 85.9 56.6 42.2 33.6 27.9 23.9 20.9 18.6 16.7
N0 N0 84.4 55.9 41.8 33.4 27.8 23.8 20.8 18.5 16.6
N0 N0 83 55.3 41.4 33.2 27.6 23.7 20.7 18.4 16.6
N0 N0 81.6 54.7 41.1 32.9 27.5 23.6 20.6 18.4 16.5
N0 N0 80.3 54.1 40.8 32.7 27.3 23.5 20.5 18.3 16.5
N0 N0 79 53.5 40.4 32.5 27.2 23.3 20.5 18.2 16.4
N0 N0 77.7 52.9 40.1 32.3 27 23.2 20.4 18.1 16.4
N0 N0 76.5 52.3 39.8 32.1 26.9 23.1 20.3 18.1 16.3
N0 N0 75.4 51.8 39.4 31.9 26.7 23 20.2 18 16.3
N0 N0 74.2 51.3 39.1 31.7 26.6 22.9 20.1 18 16.2
N0 N0 73.2 50.7 38.8 31.5 26.4 22.8 20 17.9 16.1
N0 N0 72.1 50.2 38.5 31.3 26.3 22.7 20 17.8 16.1
N0 N0 71.1 49.7 38.3 31.1 26.2 22.6 19.9 17.8 16
N0 N0 70.2 49.3 38 30.9 26 22.5 19.8 17.7 16
N0 119 69.2 48.8 37.7 30.7 25.9 22.4 19.7 17.6 15.9
N0 116.5 68.4 48.4 37.4 30.5 25.8 22.3 19.7 17.6 15.9
N0 114 65.5 48 37.2 30.4 25.7 22.2 19.6 17.5 15.9
N0 111.7 64.6 47.5 36.9 30.2 25.5 22.1 19.5 17.5 15.8
N0 109.6 63.7 47.1 36.7 30 25.4 22 19.4 17.4 15.8
N0 107.5 63 46.4 36.5 29.9 25.2 21.8 19.3 17.3 15.7
N0 105.6 62.2 45.8 36.2 29.7 25.1 21.7 19.2 17.3 15.7
N0 103.8 61.3 45.4 35.4 29.6 25 21.6 19.2 17.2 15.6
N0 102.1 62.8 44.9 35.2 29.5 24.9 21.5 19.1 17.2 15.6
N0 100.5 62.1 44.6 35 28.5 24.9 21.5 19 17.2 15.6
N0 99 61.7 44.3 34.7 28.4 23.9 21.5 19 17.1 15.5
N0 97.6 61.4 44 34.6 28.3 23.9 21.5 19 17.1 15.5
N0 96.3 60.9 44.5 34.4 28.2 23.8 20.7 19 17 15.5
N0 95 60.4 44.2 34.2 28.2 23.8 20.7 18.9 17 15.4
203

N0 93.9 59.9 44 34.1 28.1 23.8 20.8 18.5 17 15.4
N0 92.8 59.5 43.7 34 28.1 23.8 20.8 18.5 16.6 15.4
N0 91.8 59 43.5 34.5 28.1 23.8 20.8 18.4 16.6 15.2
N0 90.8 58.6 43.3 34.3 28.1 23.8 20.9 18.4 16.6 15.2
N0 89.9 58.3 43.1 34.2 28.1 23.8 20.8 18.4 16.5 15.1
N0 89.1 57.9 42.9 34.1 28.1 23.8 20.7 18.3 16.5 15.1
N0 88.4 57.6 42.7 34 28.1 23.9 20.6 18.3 16.5 15.1
N0 87.7 57.3 42.6 33.9 28.1 23.7 20.6 18.3 16.5 15
N0 87.1 57.1 42.4 33.8 28.1 23.6 20.5 18.3 16.5 15
N0 86.5 56.8 42.3 33.7 28 23.5 20.5 18.2 16.5 15
N0 86 56.6 42.2 33.6 27.9 23.4 20.5 18.2 16.4 14.9
N0 85.6 56.4 42.1 33.6 27.9 23.4 20.4 18.1 16.3 14.9
N0 85.2 56.2 42 33.5 27.9 23.8 20.4 18.2 16.2 14.9
N0 84.8 56.1 41.9 33.4 27.8 23.8 20.3 18.1 16.2 14.8
N0 84.5 56 41.8 33.4 27.8 23.8 20.3 18 16.2 14.7
N0 84.3 55.9 41.8 33.4 27.8 23.8 20.3 17.9 16.1 14.6
N0 84.1 55.8 41.7 33.3 27.7 23.8 20.8 17.8 16 14.6
N0 84 55.7 41.7 33.3 27.7 23.8 20.8 17.8 15.9 14.5
N0 83.9 55.7 41.7 33.3 27.7 23.7 20.7 17.7 15.9 14.5
N0 83.9 55.7 41.7 33.3 27.7 23.7 20.7 17.6 15.8 14.4
N0 83.9 55.7 41.7 33.3 27.7 23.7 20.6 18.1 15.7 14.3
N0 83.9 55.7 41.7 33.3 27.7 23.7 20.5 18 15.6 14.2
N0 84.1 55.8 41.7 33.3 27.7 23.7 20.4 17.9 15.5 14.1
N0 84.2 55.8 41.7 33.3 27.8 23.7 20.4 17.8 16 14.1
N0 84.5 55.9 41.8 33.4 27.8 23.8 20.4 17.8 15.9 14
N0 84.7 56 41.9 33.4 27.8 23.8 20.4 17.7 15.8 14.4
N0 85 56.2 41.9 33.5 27.8 23.8 20.5 17.8 15.7 14.4
N0 85.4 56.3 42 33.5 27.9 23.9 20.7 17.8 15.6 14.3
N0 85.9 56.5 42.1 33.6 27.9 23.9 20.7 17.9 15.6 14.2
N0 86.3 56.7 42.3 33.7 28 23.9 20.8 17.9 15.5 14.2
204
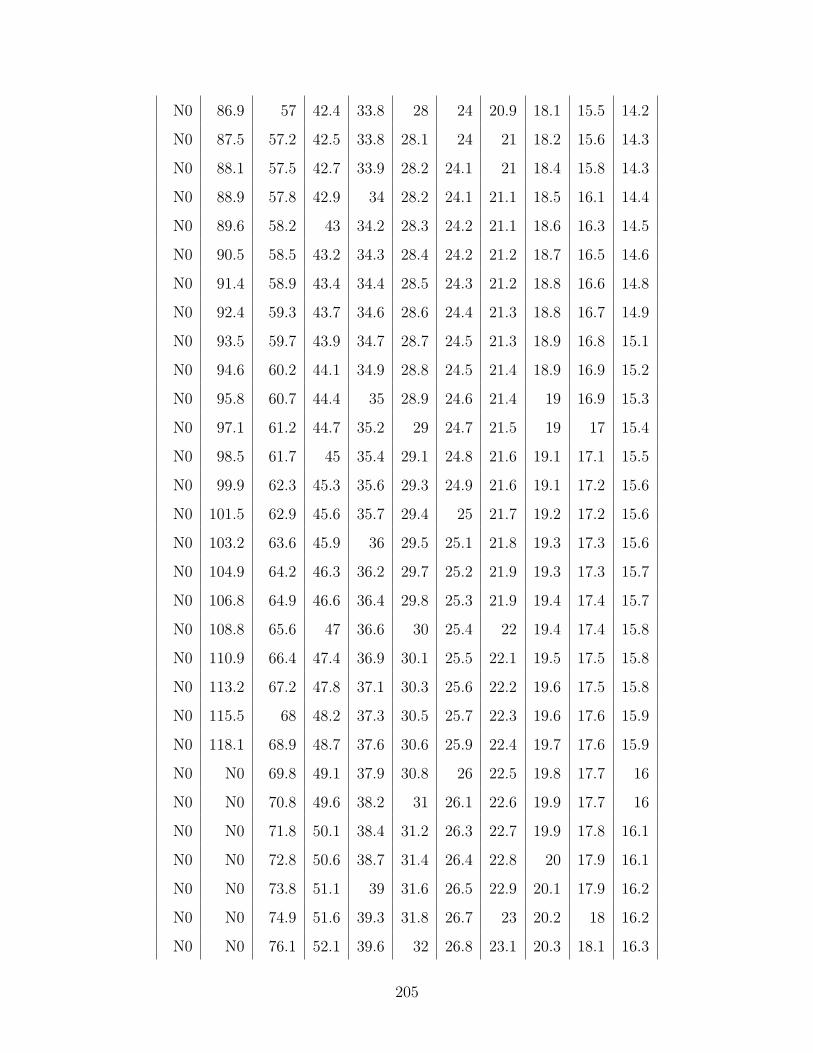
N0 86.9 57 42.4 33.8 28 24 20.9 18.1 15.5 14.2
N0 87.5 57.2 42.5 33.8 28.1 24 21 18.2 15.6 14.3
N0 88.1 57.5 42.7 33.9 28.2 24.1 21 18.4 15.8 14.3
N0 88.9 57.8 42.9 34 28.2 24.1 21.1 18.5 16.1 14.4
N0 89.6 58.2 43 34.2 28.3 24.2 21.1 18.6 16.3 14.5
N0 90.5 58.5 43.2 34.3 28.4 24.2 21.2 18.7 16.5 14.6
N0 91.4 58.9 43.4 34.4 28.5 24.3 21.2 18.8 16.6 14.8
N0 92.4 59.3 43.7 34.6 28.6 24.4 21.3 18.8 16.7 14.9
N0 93.5 59.7 43.9 34.7 28.7 24.5 21.3 18.9 16.8 15.1
N0 94.6 60.2 44.1 34.9 28.8 24.5 21.4 18.9 16.9 15.2
N0 95.8 60.7 44.4 35 28.9 24.6 21.4 19 16.9 15.3
N0 97.1 61.2 44.7 35.2 29 24.7 21.5 19 17 15.4
N0 98.5 61.7 45 35.4 29.1 24.8 21.6 19.1 17.1 15.5
N0 99.9 62.3 45.3 35.6 29.3 24.9 21.6 19.1 17.2 15.6
N0 101.5 62.9 45.6 35.7 29.4 25 21.7 19.2 17.2 15.6
N0 103.2 63.6 45.9 36 29.5 25.1 21.8 19.3 17.3 15.6
N0 104.9 64.2 46.3 36.2 29.7 25.2 21.9 19.3 17.3 15.7
N0 106.8 64.9 46.6 36.4 29.8 25.3 21.9 19.4 17.4 15.7
N0 108.8 65.6 47 36.6 30 25.4 22 19.4 17.4 15.8
N0 110.9 66.4 47.4 36.9 30.1 25.5 22.1 19.5 17.5 15.8
N0 113.2 67.2 47.8 37.1 30.3 25.6 22.2 19.6 17.5 15.8
N0 115.5 68 48.2 37.3 30.5 25.7 22.3 19.6 17.6 15.9
N0 118.1 68.9 48.7 37.6 30.6 25.9 22.4 19.7 17.6 15.9
N0 N0 69.8 49.1 37.9 30.8 26 22.5 19.8 17.7 16
N0 N0 70.8 49.6 38.2 31 26.1 22.6 19.9 17.7 16
N0 N0 71.8 50.1 38.4 31.2 26.3 22.7 19.9 17.8 16.1
N0 N0 72.8 50.6 38.7 31.4 26.4 22.8 20 17.9 16.1
N0 N0 73.8 51.1 39 31.6 26.5 22.9 20.1 17.9 16.2
N0 N0 74.9 51.6 39.3 31.8 26.7 23 20.2 18 16.2
N0 N0 76.1 52.1 39.6 32 26.8 23.1 20.3 18.1 16.3
205

N0 N0 77.3 52.7 40 32.2 27 23.2 20.3 18.1 16.3
N0 N0 78.5 53.3 40.3 32.4 27.1 23.3 20.4 18.2 16.4
N0 N0 79.8 53.8 40.6 32.6 27.3 23.4 20.5 18.3 16.4
N0 N0 81.1 54.4 41 32.8 27.4 23.5 20.6 18.3 16.5
N0 N0 82.5 55.1 41.3 33.1 27.6 23.6 20.7 18.4 16.6
N0 N0 83.9 55.7 41.7 33.3 27.7 23.8 20.8 18.5 16.6
N0 N0 85.4 56.3 42 33.5 27.9 23.9 20.9 18.5 16.7
N0 N0 86.9 57 42.4 33.8 28 24 21 18.6 16.7
N0 N0 88.5 57.7 42.8 34 28.2 24.1 21 18.7 16.8
N0 N0 90.1 58.3 43.1 34.2 28.4 24.2 21.1 18.7 16.8
N0 N0 91.8 59 43.5 34.5 28.5 24.3 21.2 18.8 16.9
N0 N0 93.4 59.7 43.9 34.7 28.7 24.5 21.3 18.9 17
N0 N0 95.1 60.4 44.3 34.9 28.8 24.6 21.4 19 17
N0 N0 96.9 61.1 44.6 35.2 29 24.7 21.5 19 17.1
N0 N0 98.8 61.9 45 35.4 29.2 24.8 21.6 19.1 17.1
N0 N0 100.7 62.6 45.4 35.7 29.3 24.9 21.7 19.2 17.2
N0 N0 102.7 63.4 45.8 35.9 29.5 25 21.8 19.2 17.2
N0 N0 104.7 64.1 46.2 36.1 29.7 25.2 21.8 19.3 17.3
N0 N0 106.7 64.9 46.6 36.4 29.8 25.3 21.9 19.4 17.3
N0 N0 108.8 65.6 47 36.6 30 25.4 22 19.4 17.4
N0 N0 110.9 66.4 47.4 36.8 30.1 25.5 22.1 19.5 17.5
N0 N0 113.1 67.2 47.8 37.1 30.3 25.6 22.2 19.6 17.5
N0 N0 115.3 67.9 48.2 37.3 30.5 25.7 22.3 19.6 17.6
N0 N0 117.5 68.7 48.6 37.5 30.6 25.8 22.4 19.7 17.6
N0 N0 119.7 69.5 48.9 37.8 30.8 25.9 22.4 19.8 17.7
N0 N0 N0 70.2 49.3 38 30.9 26 22.5 19.8 17.7
N0 N0 N0 71 49.7 38.2 31.1 26.2 22.6 19.9 17.8
N0 N0 N0 71.7 50 38.4 31.2 26.3 22.7 19.9 17.8
N0 N0 N0 72.5 50.4 38.6 31.3 26.3 22.7 20 17.8
N0 N0 N0 73.2 50.7 38.8 31.5 26.4 22.8 20 17.9
206

N0 N0 N0 73.9 51.1 39 31.6 26.5 22.9 20.1 17.9
N0 N0 N0 74.6 51.4 39.2 31.7 26.6 22.9 20.2 18
N0 N0 N0 75.2 51.7 39.4 31.8 26.7 23 20.2 18
N0 N0 N0 75.9 52 39.6 31.9 26.8 23.1 20.2 17.8
N0 N0 N0 76.5 52.3 39.8 32.1 26.9 23.1 20.1 17.8
N0 N0 N0 77.1 52.6 39.9 32.2 26.9 23.2 20.1 17.8
N0 N0 N0 77.6 52.9 40.1 32.3 27 23.2 20.1 17.9
N0 N0 N0 78.2 52.8 40.2 32.4 27.1 23.3 20.1 17.9
N0 N0 N0 78.7 52.4 40.3 32.4 27.1 23.3 20.1 17.9
N0 N0 N0 79.1 51.6 40.5 32.4 27.2 23.2 20.1 17.9
N0 N0 N0 79.6 52.1 39.5 32.3 27.1 23.1 20.1 17.9
N0 N0 N0 80 51.2 39.7 32.2 26.9 23 20 17.9
N0 N0 N0 80.3 52 39.8 32.1 26.7 22.9 20 18
N0 N0 N0 80.6 52.8 39.8 32 26.5 22.8 20 18
207
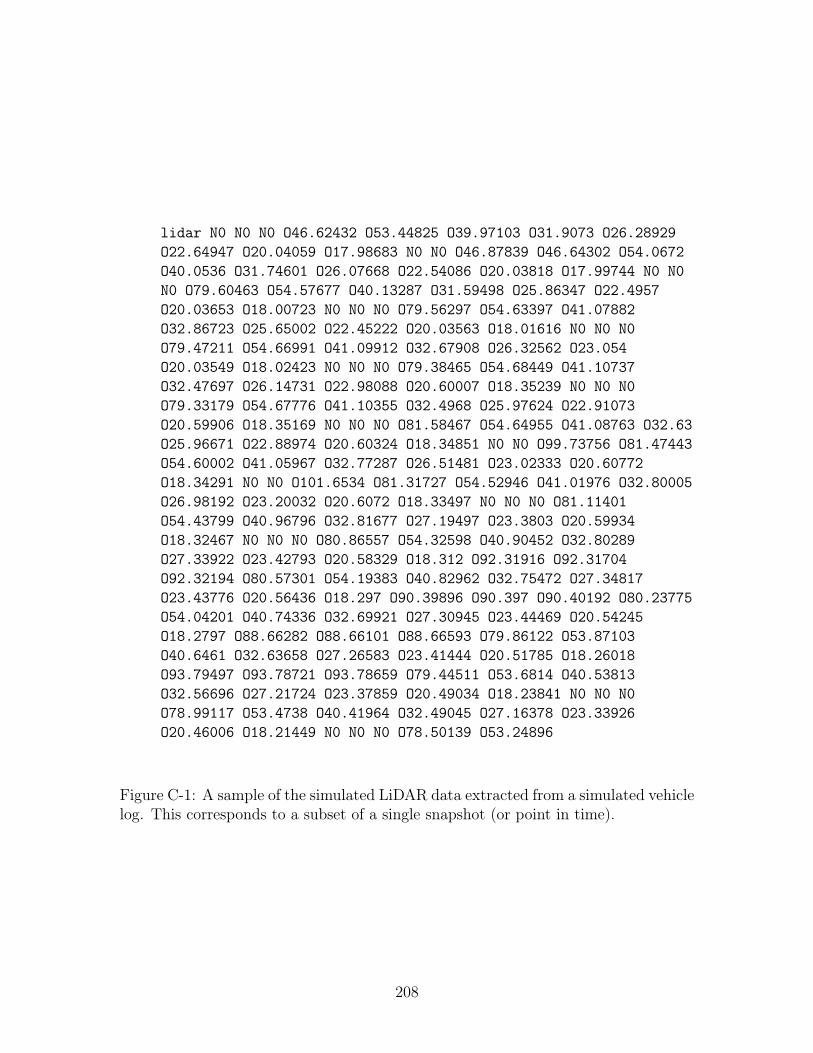
lidar N0 N0 N0 O46.62432 O53.44825 O39.97103 O31.9073 O26.28929O22.64947 O20.04059 O17.98683 N0 N0 O46.87839 O46.64302 O54.0672O40.0536 O31.74601 O26.07668 O22.54086 O20.03818 O17.99744 N0 N0N0 O79.60463 O54.57677 O40.13287 O31.59498 O25.86347 O22.4957O20.03653 O18.00723 N0 N0 N0 O79.56297 O54.63397 O41.07882O32.86723 O25.65002 O22.45222 O20.03563 O18.01616 N0 N0 N0O79.47211 O54.66991 O41.09912 O32.67908 O26.32562 O23.054O20.03549 O18.02423 N0 N0 N0 O79.38465 O54.68449 O41.10737O32.47697 O26.14731 O22.98088 O20.60007 O18.35239 N0 N0 N0O79.33179 O54.67776 O41.10355 O32.4968 O25.97624 O22.91073O20.59906 O18.35169 N0 N0 N0 O81.58467 O54.64955 O41.08763 O32.63O25.96671 O22.88974 O20.60324 O18.34851 N0 N0 O99.73756 O81.47443O54.60002 O41.05967 O32.77287 O26.51481 O23.02333 O20.60772O18.34291 N0 N0 O101.6534 O81.31727 O54.52946 O41.01976 O32.80005O26.98192 O23.20032 O20.6072 O18.33497 N0 N0 N0 O81.11401O54.43799 O40.96796 O32.81677 O27.19497 O23.3803 O20.59934O18.32467 N0 N0 N0 O80.86557 O54.32598 O40.90452 O32.80289O27.33922 O23.42793 O20.58329 O18.312 O92.31916 O92.31704O92.32194 O80.57301 O54.19383 O40.82962 O32.75472 O27.34817O23.43776 O20.56436 O18.297 O90.39896 O90.397 O90.40192 O80.23775O54.04201 O40.74336 O32.69921 O27.30945 O23.44469 O20.54245O18.2797 O88.66282 O88.66101 O88.66593 O79.86122 O53.87103O40.6461 O32.63658 O27.26583 O23.41444 O20.51785 O18.26018O93.79497 O93.78721 O93.78659 O79.44511 O53.6814 O40.53813O32.56696 O27.21724 O23.37859 O20.49034 O18.23841 N0 N0 N0O78.99117 O53.4738 O40.41964 O32.49045 O27.16378 O23.33926O20.46006 O18.21449 N0 N0 N0 O78.50139 O53.24896
Figure C-1: A sample of the simulated LiDAR data extracted from a simulated vehiclelog. This corresponds to a subset of a single snapshot (or point in time).
208
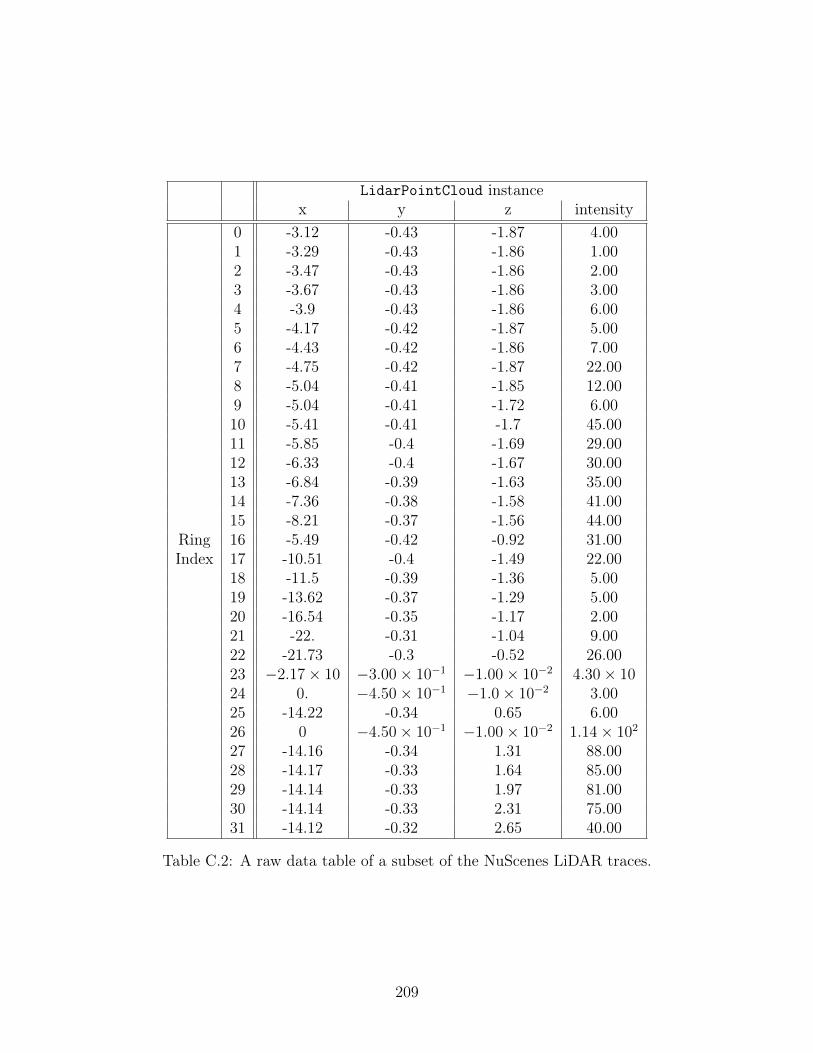
LidarPointCloud instancex y z intensity
0 -3.12 -0.43 -1.87 4.001 -3.29 -0.43 -1.86 1.002 -3.47 -0.43 -1.86 2.003 -3.67 -0.43 -1.86 3.004 -3.9 -0.43 -1.86 6.005 -4.17 -0.42 -1.87 5.006 -4.43 -0.42 -1.86 7.007 -4.75 -0.42 -1.87 22.008 -5.04 -0.41 -1.85 12.009 -5.04 -0.41 -1.72 6.0010 -5.41 -0.41 -1.7 45.0011 -5.85 -0.4 -1.69 29.0012 -6.33 -0.4 -1.67 30.0013 -6.84 -0.39 -1.63 35.0014 -7.36 -0.38 -1.58 41.0015 -8.21 -0.37 -1.56 44.00
Ring 16 -5.49 -0.42 -0.92 31.00Index 17 -10.51 -0.4 -1.49 22.00
18 -11.5 -0.39 -1.36 5.0019 -13.62 -0.37 -1.29 5.0020 -16.54 -0.35 -1.17 2.0021 -22. -0.31 -1.04 9.0022 -21.73 -0.3 -0.52 26.0023 −2.17× 10 −3.00× 10−1 −1.00× 10⁻² 4.30× 1024 0. −4.50× 10⁻¹ −1.0× 10⁻² 3.0025 -14.22 -0.34 0.65 6.0026 0 −4.50× 10⁻¹ −1.00× 10⁻² 1.14× 10²
27 -14.16 -0.34 1.31 88.0028 -14.17 -0.33 1.64 85.0029 -14.14 -0.33 1.97 81.0030 -14.14 -0.33 2.31 75.0031 -14.12 -0.32 2.65 40.00
Table C.2: A raw data table of a subset of the NuScenes LiDAR traces.
209

C.2 Simulations
Figure C-2: A screenshot of the Uber accident simulation (with similar lighting tothe report) on the Carla Platform.
210
Bibliography
[1] Ashraf Abdul, Jo Vermeulen, Danding Wang, Brian Y Lim, and Mohan Kankan-halli. Trends and trajectories for explainable, accountable and intelligible sys-tems: An hci research agenda. In Proceedings of the 2018 CHI Conference onHuman Factors in Computing Systems, page 582. ACM, 2018.
[2] Jose Vicente Abellan-Nebot and Fernando Romero Subirón. A review of ma-chining monitoring systems based on artificial intelligence process models. TheInternational Journal of Advanced Manufacturing Technology, 47(1-4):237–257,2010.
[3] Harold Abelson and Gerald Jay Sussman. Structure and interpretation of com-puter programs. MIT Press, 1996.
[4] Leman Akoglu and Christos Faloutsos. Anomaly, event, and fraud detection inlarge network datasets. In Proceedings of the sixth ACM international confer-ence on Web search and data mining, pages 773–774, 2013.
[5] Leman Akoglu, Hanghang Tong, and Danai Koutra. Graph based anomalydetection and description: a survey. Data mining and knowledge discovery,29(3):626–688, 2015.
[6] James F Allen. Maintaining knowledge about temporal intervals. In Readingsin qualitative reasoning about physical systems, pages 361–372. Elsevier, 1990.
[7] Adam Amos-Binks and Dustin Dannenhauer. Anticipatory thinking: Ametacognitive capability. arXiv preprint arXiv:1906.12249, 2019.
[8] Marco Ancona, Enea Ceolini, A. Cengiz Öztireli, and Markus H. Gross. Aunified view of gradient-based attribution methods for deep neural networks.CoRR, abs/1711.06104, 2017.
[9] Robert Andrews, Joachim Diederich, and Alan B Tickle. Survey and cri-tique of techniques for extracting rules from trained artificial neural networks.Knowledge-based systems, 8(6):373–389, 1995.
[10] Fabrizio Angiulli and Clara Pizzuti. Fast outlier detection in high dimensionalspaces. In European Conference on Principles of Data Mining and KnowledgeDiscovery, pages 15–27. Springer, 2002.
211
[11] Samuel English Anthony. The trollable self-driving car.https://slate.com/technology/2016/03/google-self-driving-cars-lack-a-humans-intuition-for-what-other-drivers-will-do.html, March 2016. (Accessed on07/01/2020).
[12] Stanislaw Antol, Aishwarya Agrawal, Jiasen Lu, Margaret Mitchell, Dhruv Ba-tra, C Lawrence Zitnick, and Devi Parikh. Vqa: Visual question answering. InProceedings of the IEEE International Conference on Computer Vision, pages2425–2433, 2015.
[13] Grigoris Antoniou and Frank Van Harmelen. Web ontology language: Owl. InHandbook on ontologies, pages 67–92. Springer, 2004.
[14] Anish Athalye, Logan Engstrom, Andrew Ilyas, and Kevin Kwok. Synthesizingrobust adversarial examples. volume 80 of Proceedings of Machine Learning Re-search, pages 284–293, Stockholmsmässan, Stockholm Sweden, 10–15 Jul 2018.PMLR.
[15] M Gethsiyal Augasta and Thangairulappan Kathirvalavakumar. Reverse engi-neering the neural networks for rule extraction in classification problems. Neuralprocessing letters, 35(2):131–150, 2012.
[16] Edmond Awad, Sohan Dsouza, Richard Kim, Jonathan Schulz, Joseph Henrich,Azim Shariff, Jean-François Bonnefon, and Iyad Rahwan. The moral machineexperiment. Nature, 563(7729):59–64, 2018.
[17] Sebastian Bach, Alexander Binder, Grégoire Montavon, Frederick Klauschen,Klaus-Robert Müller, and Wojciech Samek. On pixel-wise explanations fornon-linear classifier decisions by layer-wise relevance propagation. PloS one,10(7):e0130140, 2015.
[18] Nolan Bard, Jakob N Foerster, Sarath Chandar, Neil Burch, Marc Lanctot,H Francis Song, Emilio Parisotto, Vincent Dumoulin, Subhodeep Moitra, Ed-ward Hughes, et al. The hanabi challenge: A new frontier for ai research.Artificial Intelligence, 280:103216, 2020.
[19] David Bau, Bolei Zhou, Aditya Khosla, Aude Oliva, and Antonio Torralba.Network dissection: Quantifying interpretability of deep visual representations.In Computer Vision and Pattern Recognition, 2017.
[20] Jacob Beal and Gerald Jay Sussman. Engineered robustness by controlled hal-lucination. In AAAI Fall Symposium: Naturally-Inspired Artificial Intelligence,pages 9–12, 2008.
[21] José Manuel Benítez, Juan Luis Castro, and Ignacio Requena. Are artificial neu-ral networks black boxes? IEEE Transactions on neural networks, 8(5):1156–1164, 1997.
212

[22] Tim Berners-Lee, James Hendler, and Ora Lassila. The semantic web. Scientificamerican, 284(5):34–43, 2001.
[23] Michael W Berry, Murray Browne, Amy N Langville, V Paul Pauca, andRobert J Plemmons. Algorithms and applications for approximate nonnegativematrix factorization. Computational statistics & data analysis, 52(1):155–173,2007.
[24] Steven Bird, Ewan Klein, and Edward Loper. Natural language processing withPython: analyzing text with the natural language toolkit. " O’Reilly Media,Inc.", 2009.
[25] Simon R Blackburn. The geometry of perfect parking, 2009.
[26] Gary C Borchardt. Thinking Between the Lines: Computers and the Compre-hension of Causal Descriptions. MIT Press, Cambridge, MA, 1994.
[27] Ronald J. Brachman. What IS-A is and isn’t: An analysis of taxonomic linksin semantic networks. IEEE Computer, 16(10):30–36, 1983.
[28] Markus M Breunig, Hans-Peter Kriegel, Raymond T Ng, and Jörg Sander.Lof: identifying density-based local outliers. In Proceedings of the 2000 ACMSIGMOD international conference on Management of data, pages 93–104, 2000.
[29] Dan Brickley and Libby Miller. Foaf vocabulary specification 0.91, 2007.
[30] Sylvain Bromberger. On what we know we don’t know: Explanation, theory,linguistics, and how questions shape them. University of Chicago Press, 1992.
[31] Holger Caesar, Varun Bankiti, Alex H. Lang, Sourabh Vora, Venice Erin Li-ong, Qiang Xu, Anush Krishnan, Yu Pan, Giancarlo Baldan, and Oscar Bei-jbom. nuscenes: A multimodal dataset for autonomous driving. arXiv preprintarXiv:1903.11027, 2019.
[32] Erik Cambria, Soujanya Poria, Devamanyu Hazarika, and Kenneth Kwok. Sen-ticNet 5: Discovering conceptual primitives for sentiment analysis by means ofcontext embeddings. In Proceedings of the Thirty-Second AAAI Conference onArtificial Intelligence, New Orleans, LA, February 2018. AAAI Press.
[33] James B Campbell and Randolph H Wynne. Introduction to remote sensing.Guilford Press, 2011.
[34] Ricardo J. G. B. Campello, Davoud Moulavi, Arthur Zimek, and Jörg Sander.Hierarchical density estimates for data clustering, visualization, and outlier de-tection. ACM Trans. Knowl. Discov. Data, 10:5:1–5:51, 2015.
[35] Michael Cashmore, Maria Fox, Derek Long, Daniele Magazzeni, Bram Ridder,Arnau Carrera, Narcis Palomeras, Natalia Hurtos, and Marc Carreras. Ros-plan: Planning in the robot operating system. In Twenty-Fifth InternationalConference on Automated Planning and Scheduling, 2015.
213
[36] Silvia Cateni, Valentina Colla, and Marco Vannucci. A fuzzy logic-based methodfor outliers detection. In Artificial Intelligence and Applications, pages 605–610,2007.
[37] Varun Chandola, Arindam Banerjee, and Vipin Kumar. Anomaly detection: Asurvey. ACM computing surveys (CSUR), 41(3):15, 2009.
[38] Chaofan Chen, Oscar Li, Alina Barnett, Jonathan Su, and Cynthia Rudin. Thislooks like that: deep learning for interpretable image recognition. arXiv preprintarXiv:1806.10574, 2018.
[39] Tianye Chen. Augmenting anomaly detection for autonomous vehicles withsymbolic rules. Master’s thesis, MIT, 2019.
[40] Xi Chen, Yan Duan, Rein Houthooft, John Schulman, Ilya Sutskever, and PieterAbbeel. Infogan: Interpretable representation learning by information maximiz-ing generative adversarial nets. In Advances in Neural Information ProcessingSystems, pages 2172–2180, 2016.
[41] Philip R Cohen and Hector J Levesque. Rational interaction as the basis forcommunication. Technical report, SRI International, 1988.
[42] Allan Collins and Ryszard Michalski. The logic of plausible reasoning: A coretheory. Cognitive science, 13(1):1–49, 1989.
[43] Christopher Cox, Jessica De Silva, Philip Deorsey, Franklin H. J. Kenter, TroyRetter, and Josh Tobin. How to make the perfect fireworks display: Two strate-gies for hanabi. Mathematics Magazine, 88(5):323–336, 2015.
[44] Mark W Craven. Extracting comprehensible models from trained neural net-works. PhD thesis, University of Wisconsin, Madison, 1996.
[45] Xuan Hong Dang, Barbora Micenková, Ira Assent, and Raymond T Ng. Localoutlier detection with interpretation. In Joint European Conference on MachineLearning and Knowledge Discovery in Databases, pages 304–320. Springer, 2013.
[46] Abhishek Das, Harsh Agrawal, Larry Zitnick, Devi Parikh, and Dhruv Batra.Human attention in visual question answering: Do humans and deep networkslook at the same regions? Computer Vision and Image Understanding, 163:90–100, 2017.
[47] Jeffrey Dastin. Amazon scraps secret AI recruiting tool that showed bias againstwomen. Reuters, October 2018.
[48] Randall Davis. Diagnostic reasoning based on structure and behavior. Artificialintelligence, 24(1-3):347–410, 1984.
[49] Johan De Kleer. Causal and teleological reasoning in circuit recognition. Techni-cal report, MASSACHUSETTS INST OF TECH CAMBRIDGE ARTIFICIALINTELLIGENCE LAB, 1979.
214

[50] Johan De Kleer. An assumption-based tms. Artificial intelligence, 28(2):127–162, 1986.
[51] Johan De Kleer and John Seely Brown. Theories of causal ordering. Artificialintelligence, 29(1):33–61, 1986.
[52] Johan De Kleer, Alan K Mackworth, and Raymond Reiter. Characterizingdiagnoses and systems. Artificial intelligence, 56(2-3):197–222, 1992.
[53] Johan De Kleer and Brian C Williams. Diagnosing multiple faults. Artificialintelligence, 32(1):97–130, 1987.
[54] Finale Doshi-Velez and Been Kim. Towards a rigorous science of interpretablemachine learning. arXiv, 2017.
[55] Finale Doshi-Velez, Mason Kortz, Ryan Budish, Chris Bavitz, Sam Gershman,David O’Brien, Stuart Schieber, James Waldo, David Weinberger, and Alexan-dra Wood. Accountability of AI under the law: The role of explanation. CoRR,abs/1711.01134, 2017.
[56] Alexey Dosovitskiy, German Ros, Felipe Codevilla, Antonio Lopez, and VladlenKoltun. CARLA: An open urban driving simulator. In Proceedings of the 1stAnnual Conference on Robot Learning, pages 1–16, 2017.
[57] Charles Elkan and Russell Greiner. Building large knowledge-based systems:Representation and inference in the cyc project: Db lenat and rv guha, 1993.
[58] Kevin Eykholt, Ivan Evtimov, Earlence Fernandes, Bo Li, Amir Rah-mati, Chaowei Xiao, Atul Prakash, Tadayoshi Kohno, and Dawn Song.Robust physical-world attacks on deep learning models. arXiv preprintarXiv:1707.08945, 2017.
[59] Hadi Fanaee-T and João Gama. Tensor-based anomaly detection: An interdis-ciplinary survey. Knowledge-Based Systems, 98:130–147, 2016.
[60] Charles M Farmer, Adrian K Lund, Rebecca E Trempel, and Elisa R Braver.Fatal crashes of passenger vehicles before and after adding antilock brakingsystems. Accident Analysis & Prevention, 29(6):745–757, 1997.
[61] Kenneth D Forbus and Johan De Kleer. Building problem solvers, volume 1.MIT press, 1993.
[62] Kenneth D Forbus and Thomas Hinrich. Analogy and relational representationsin the companion cognitive architecture. AI Magazine, 38(4):34–42, 2017.
[63] Maria Fox, Derek Long, and Daniele Magazzeni. Explainable planning. CoRR,abs/1709.10256, 2017.
[64] Jonathan Frankle and Michael Carbin. The lottery ticket hypothesis: Trainingpruned neural networks. CoRR, abs/1803.03635, 2018.
215
[65] Jerome H Friedman. Greedy function approximation: a gradient boosting ma-chine. Annals of statistics, pages 1189–1232, 2001.
[66] LiMin Fu. Rule generation from neural networks. IEEE Transactions on Sys-tems, Man, and Cybernetics, 24(8):1114–1124, 1994.
[67] Akira Fukui, Dong Huk Park, Daylen Yang, Anna Rohrbach, Trevor Darrell,and Marcus Rohrbach. Multimodal compact bilinear pooling for visual questionanswering and visual grounding. arXiv preprint arXiv:1606.01847, 2016.
[68] Pedro Garcia-Teodoro, J Diaz-Verdejo, Gabriel Maciá-Fernández, and EnriqueVázquez. Anomaly-based network intrusion detection: Techniques, systems andchallenges. computers & security, 28(1-2):18–28, 2009.
[69] Andreas Geiger, Philip Lenz, and Raquel Urtasun. Are we ready for autonomousdriving? the kitti vision benchmark suite. In Conference on Computer Visionand Pattern Recognition (CVPR), 2012.
[70] Michael R. Genesereth. The use of design descriptions in automated diagnosis.Artificial Intelligence, 24(1):411 – 436, 1984.
[71] Liqiang Geng and Howard J Hamilton. Interestingness measures for data min-ing: A survey. ACM Computing Surveys (CSUR), 38(3):9–es, 2006.
[72] Dedre Gentner, Sarah Brem, Ronald W Ferguson, Arthur B Markman, Bjorn BLevidow, Phillip Wolff, and Kenneth D Forbus. Analogical reasoning and con-ceptual change: A case study of johannes kepler. The journal of the learningsciences, 6(1):3–40, 1997.
[73] Leilani Gilpin. Reasonableness monitors. In The Twenty-Third AAAI/SIGAIDoctoral Consortium at AAAI-18, New Orleans, LA, 2018. AAAI Press.
[74] Leilani Gilpin. Reasonableness monitors. In The Twenty-Third AAAI/SIGAIDoctoral Consortium at AAAI-18, New Orleans, LA, 2018. AAAI Press.
[75] Leilani Gilpin and Ben Yuan. Getting up to speed on vehicle intelligence. AAAISpring Symposium Series, 2017.
[76] Leilani H Gilpin, David Bau, Ben Z Yuan, Ayesha Bajwa, Michael Specter,and Lalana Kagal. Explaining explanations: An overview of interpretability ofmachine learning. In 2018 IEEE 5th International Conference on data scienceand advanced analytics (DSAA), pages 80–89. IEEE, 2018.
[77] Leilani H Gilpin, David Bau, Ben Z Yuan, Ayesha Bajwa, Michael Specter,and Lalana Kagal. Explaining explanations: An overview of interpretability ofmachine learning. arXiv preprint arXiv:1806.00069, 2018.
216

[78] Leilani H. Gilpin and Lalana Kagal. An adaptable self-monitoring framework forcomplex machines. Proceedings of the 16th Conference on Autonomous Agentsand MultiAgent Systems, AAMAS 2019, Montreal, Quebec, May 13-17, 2019,page 3, 2019.
[79] Leilani H. Gilpin, Jamie C. Macbeth, and Evelyn Florentine. Monitoringscene understanders with conceptual primitive decomposition and commonsenseknowledge. Advances in Cognitive Systems, 6, 2018.
[80] Leilani H. Gilpin, Vishnu Penuparthi, and Lalana Kagal. Explanation-basedanomaly detection for complex machines. Under Review, 2020.
[81] Leilani H Gilpin, Cecilia Testart, Nathaniel Fruchter, and Julius Adebayo. Ex-plaining explanations to society. arXiv preprint arXiv:1901.06560, 2019.
[82] Leilani H. Gilpin, Cagri Zaman, Danielle Olson, and Ben Z. Yuan. Reasonableperception: Connecting vision and language systems for validating scene de-scriptions. In Proceedings of the Thirteenth Annual ACM/IEEE InternationalConference on Human Robot Interaction, HRI ’18, Chicago, IL, 2018. ACM.
[83] Bryce Goodman and Seth Flaxman. European union regulations on algorithmicdecision-making and a" right to explanation". arXiv preprint arXiv:1606.08813,2016.
[84] Bryce Goodman and Seth Flaxman. European union regulations on algorithmicdecision-making and a “right to explanation”. AI Magazine, 38(3):50–57, 2017.
[85] Martin Grill, Tomáš Pevny, and Martin Rehak. Reducing false positives ofnetwork anomaly detection by local adaptive multivariate smoothing. Journalof Computer and System Sciences, 83(1):43–57, 2017.
[86] Patrick J Grother, Mei L Ngan, and Kayee K Hanaoka. Ongoing face recognitionvendor test (frvt) part 2: identification. Technical report, NIST, 2018.
[87] Riccardo Guidotti, Anna Monreale, Franco Turini, Dino Pedreschi, and FoscaGiannotti. A survey of methods for explaining black box models. arXiv preprintarXiv:1802.01933, 2018.
[88] David Gunning. Darpa’s explainable artificial intelligence (xai) program. InProceedings of the 24th International Conference on Intelligent User Interfaces,IUI ’19, page ii, New York, NY, USA, 2019. Association for Computing Ma-chinery.
[89] Tameru Hailesilassie. Rule extraction algorithm for deep neural networks: Areview. arXiv preprint arXiv:1610.05267, 2016.
[90] Lars Kai Hansen, Adam Arvidsson, Finn Årup Nielsen, Elanor Colleoni, andMichael Etter. Good friends, bad news-affect and virality in twitter. In Futureinformation technology, pages 34–43. Springer, 2011.
217

[91] Gilbert H Harman. The inference to the best explanation. The philosophicalreview, 74(1):88–95, 1965.
[92] PJ Hayes. The naive physics manifesto. Colchester, Essex, UK: Department ofComputer Science, University of Essex, 1975.
[93] Kaiming He, Xiangyu Zhang, Shaoqing Ren, and Jian Sun. Deep residual learn-ing for image recognition. In Proceedings of the IEEE conference on computervision and pattern recognition, pages 770–778, 2016.
[94] Zengyou He, Xiaofei Xu, and Shengchun Deng. Discovering cluster-based localoutliers. Pattern Recognition Letters, 24(9-10):1641–1650, 2003.
[95] Lisa Anne Hendricks, Zeynep Akata, Marcus Rohrbach, Jeff Donahue, BerntSchiele, and Trevor Darrell. Generating visual explanations. In European Con-ference on Computer Vision, pages 3–19. Springer, 2016.
[96] Bernease Herman. The promise and peril of human evaluation for model inter-pretability. arXiv preprint arXiv:1711.07414, 2017.
[97] Irina Higgins, Loic Matthey, Arka Pal, Christopher Burgess, Xavier Glorot,Matthew Botvinick, Shakir Mohamed, and Alexander Lerchner. beta-vae:Learning basic visual concepts with a constrained variational framework, 2016.
[98] Dylan Alexander Holmes. Story-enabled hypothetical reasoning. PhD thesis,Massachusetts Institute of Technology, 2017.
[99] Aapo Hyvärinen and Erkki Oja. Independent component analysis: algorithmsand applications. Neural networks, 13(4-5):411–430, 2000.
[100] Ieee standard glossary of software engineering terminology, 1990.
[101] Ray S Jackendoff. Semantics and Cognition. MIT Press, Cambridge, MA, 1983.
[102] Ulf Johansson, Rikard Konig, and Lars Niklasson. Automatically balancingaccuracy and comprehensibility in predictive modeling. In Information Fusion,2005 8th International Conference on, volume 2, pages 7–pp. IEEE, 2005.
[103] Philip Nicholas Johnson-Laird. Mental models: Towards a Cognitive Science ofLanguage, Inference, and Consciousness. Harvard University Press, Cambridge,MA, 1983.
[104] Ian T Jolliffe. Principal component analysis and factor analysis. In Principalcomponent analysis, pages 115–128. Springer, 1986.
[105] Yaakov Kareev. Positive bias in the perception of covariation. Psychologicalreview, 102(3):490, 1995.
218

[106] Shachar Kaufman, Saharon Rosset, Claudia Perlich, and Ori Stitelman. Leakagein data mining: Formulation, detection, and avoidance. ACM Transactions onKnowledge Discovery from Data (TKDD), 6(4):15, 2012.
[107] Henry A. Kautz and James F. Allen. Generalized plan recognition. In Proceed-ings of the Fifth AAAI National Conference on Artificial Intelligence, AAAI’86,page 32–37. AAAI Press, 1986.
[108] Fabian Keller, Emmanuel Muller, and Klemens Bohm. Hics: High contrastsubspaces for density-based outlier ranking. In 2012 IEEE 28th internationalconference on data engineering, pages 1037–1048. IEEE, 2012.
[109] Alice Kerly, Phil Hall, and Susan Bull. Bringing chatbots into education: To-wards natural language negotiation of open learner models. Knowledge-BasedSystems, 20(2):177–185, 2007.
[110] R. Kesten, M. Usman, J. Houston, T. Pandya, K. Nadhamuni, A. Ferreira,M. Yuan, B. Low, A. Jain, P. Ondruska, S. Omari, S. Shah, A. Kulkarni,A. Kazakova, C. Tao, L. Platinsky, W. Jiang, and V. Shet. Lyft level 5 avdataset 2019. urlhttps://level5.lyft.com/dataset/, 2019.
[111] Ankesh Khandelwal, Jie Bao, Lalana Kagal, Ian Jacobi, Li Ding, and JamesHendler. Analyzing the air language: a semantic web (production) rule lan-guage. In International Conference on Web Reasoning and Rule Systems, pages58–72. Springer, 2010.
[112] Been Kim, Justin Gilmer, Fernanda Viegas, Ulfar Erlingsson, and Martin Wat-tenberg. Tcav: Relative concept importance testing with linear concept activa-tion vectors. arXiv preprint arXiv:1711.11279, 2017.
[113] Been Kim, Cynthia Rudin, and Julie A Shah. The bayesian case model: Agenerative approach for case-based reasoning and prototype classification. InAdvances in Neural Information Processing Systems, pages 1952–1960, 2014.
[114] Phil Kim, Brian C Williams, and Mark Abramson. Executing reactive, model-based programs through graph-based temporal planning. IJCAI, pages 487–493,2001.
[115] Diederik P Kingma and Max Welling. Auto-encoding variational bayes. arXivpreprint arXiv:1312.6114, 2013.
[116] Johan de Kleer, Jon Doyle, Charles Rich, Guy L Steele Jr, and Ger-ald Jay Sussman. Amord: A deductive procedure system. Technical report,MASSACHUSETTS INST OF TECH CAMBRIDGE ARTIFICIAL INTELLI-GENCE LAB, 1978.
[117] Gary Klein, David Snowden, and Chew Lock Pin. Anticipatory thinking. In-formed by knowledge: Expert performance in complex situations, pages 235–245,2011.
219

[118] Edwin M Knorr, Raymond T Ng, and Vladimir Tucakov. Distance-based out-liers: algorithms and applications. The VLDB Journal, 8(3-4):237–253, 2000.
[119] Pang Wei Koh and Percy Liang. Understanding black-box predictions via in-fluence functions. arXiv preprint arXiv:1703.04730, 2017.
[120] Jorie Koster-Hale and Rebecca Saxe. Theory of mind: a neural predictionproblem. Neuron, 79(5):836–848, 2013.
[121] Hans-Peter Kriegel, Peer Kröger, Erich Schubert, and Arthur Zimek. Outlierdetection in axis-parallel subspaces of high dimensional data. In Pacific-AsiaConference on Knowledge Discovery and Data Mining, pages 831–838. Springer,2009.
[122] Hans-Peter Kriegel, Peer Kroger, Erich Schubert, and Arthur Zimek. Interpret-ing and unifying outlier scores. In Proceedings of the 2011 SIAM InternationalConference on Data Mining, pages 13–24. SIAM, 2011.
[123] Hans-Peter Kriegel, Peer Kröger, Erich Schubert, and Arthur Zimek. Outlierdetection in arbitrarily oriented subspaces. In 2012 IEEE 12th internationalconference on data mining, pages 379–388. IEEE, 2012.
[124] John E Laird, Christian Lebiere, and Paul S Rosenbloom. A standard modelof the mind: Toward a common computational framework across artificial in-telligence, cognitive science, neuroscience, and robotics. AI Magazine, 38(4),2017.
[125] John E Laird, Allen Newell, and Paul S Rosenbloom. Soar: An architecturefor general intelligence. Technical report, STANFORD UNIV CA DEPT OFCOMPUTER SCIENCE, 1986.
[126] Susan Landau. Control use of data to protect privacy. Science, 347(6221):504–506, 2015.
[127] Alex H Lang, Sourabh Vora, Holger Caesar, Lubing Zhou, Jiong Yang, andOscar Beijbom. Pointpillars: Fast encoders for object detection from pointclouds. In Proceedings of the IEEE Conference on Computer Vision and PatternRecognition, pages 12697–12705, 2019.
[128] Pat Langley, Ben Meadows, Mohan Sridharan, and Dongkyu Choi. Explainableagency for intelligent autonomous systems. In AAAI, pages 4762–4764, 2017.
[129] Alexander Lavin and Subutai Ahmad. Evaluating real-time anomaly detectionalgorithms–the numenta anomaly benchmark. In Machine Learning and Appli-cations (ICMLA), 2015 IEEE 14th International Conference on, pages 38–44.IEEE, 2015.
220

[130] Aleksandar Lazarevic, Levent Ertoz, Vipin Kumar, Aysel Ozgur, and JaideepSrivastava. A comparative study of anomaly detection schemes in networkintrusion detection. In Proceedings of the 2003 SIAM international conferenceon data mining, pages 25–36. SIAM, 2003.
[131] Aleksandar Lazarevic and Vipin Kumar. Feature bagging for outlier detec-tion. In Proceedings of the eleventh ACM SIGKDD international conference onKnowledge discovery in data mining, pages 157–166, 2005.
[132] David B Leake. Focusing construction and selection of abductive hypotheses. InProceedings of the 13th international joint conference on Artifical intelligence-Volume 1, pages 24–29, 1993.
[133] Yann LeCun. My take on ali rahimi’s test of time award talk at nips, 2017.
[134] Timothy B. Lee. Report: Software bug led to death in Uber’s self-driving crash,May 2018.
[135] Douglas B Lenat, Ramanathan V. Guha, Karen Pittman, Dexter Pratt, andMary Shepherd. CYC: Toward programs with common sense. Communicationsof the ACM, 33(8):30–49, 1990.
[136] Benjamin Letham, Cynthia Rudin, Tyler H McCormick, David Madigan, et al.Interpretable classifiers using rules and bayesian analysis: Building a betterstroke prediction model. The Annals of Applied Statistics, 9(3):1350–1371, 2015.
[137] Hector Levesque, Ernest Davis, and Leora Morgenstern. The winograd schemachallenge. In Thirteenth International Conference on the Principles of Knowl-edge Representation and Reasoning, 2012.
[138] Bo Li, Tianlei Zhang, and Tian Xia. Vehicle detection from 3d lidar using fullyconvolutional network. arXiv preprint arXiv:1608.07916, 2016.
[139] Yihua Liao and V Rao Vemuri. Use of k-nearest neighbor classifier for intrusiondetection. Computers & security, 21(5):439–448, 2002.
[140] Tsung-Yi Lin, Michael Maire, Serge Belongie, James Hays, Pietro Perona, DevaRamanan, Piotr Dollár, and C Lawrence Zitnick. Microsoft COCO: Commonobjects in context. In European Conference on Computer Vision, pages 740–755,Zurich, 2014. Springer.
[141] Fei Tony Liu, Kai Ming Ting, and Zhi-Hua Zhou. Isolation forest. In 2008Eighth IEEE International Conference on Data Mining, pages 413–422. IEEE,2008.
[142] Fei Tony Liu, Kai Ming Ting, and Zhi-Hua Zhou. Isolation-based anomalydetection. ACM Transactions on Knowledge Discovery from Data (TKDD),6(1):1–39, 2012.
221

[143] Juan Liu, Eric Bier, Aaron Wilson, John Alexis Guerra-Gomez, TomonoriHonda, Kumar Sricharan, Leilani Gilpin, and Daniel Davies. Graph analy-sis for detecting fraud, waste, and abuse in healthcare data. AI Magazine,37(2):33–46, 2016.
[144] Gilles Louppe, Louis Wehenkel, Antonio Sutera, and Pierre Geurts. Under-standing variable importances in forests of randomized trees. In Advances inneural information processing systems, pages 431–439, 2013.
[145] Jiasen Lu, Jianwei Yang, Dhruv Batra, and Devi Parikh. Hierarchical question-image co-attention for visual question answering. In Advances In Neural Infor-mation Processing Systems, pages 289–297, 2016.
[146] Siyu Lu. “the car can explain”–propagators for autonomous vehicles. Technicalreport, MIT CSAIL, 2018.
[147] Rachel W Magid, Mark Sheskin, and Laura E Schulz. Imagination and thegeneration of new ideas. Cognitive Development, 34:99–110, 2015.
[148] Kavi Mahesh, Sergei Nirenburg, Jim Cowie, and David Farwell. An assessmentof CYC for natural language processing. Memoranda in computer and cognitivesciences MCCS-96-296, Computing Research Laboratory, New Mexico StateUniversity, Las Cruces, NM, 1996.
[149] Gary Marcus. Deep learning: A critical appraisal. arXiv preprintarXiv:1801.00631, 2018.
[150] Aarian Marshall. The Uber Crash Won’t Be the Last Shocking Self-DrivingDeath. Wired, March 2018.
[151] Aarian Marshall and Alex Davies. Uber’s Self-Driving Car Saw the WomanIt Killed, Report Says. https://www.wired.com/story/uber-self-driving-crash-arizona-ntsb-report/.
[152] Norman S. Mayersohn. Antilock brakes at last. Popular Mechnaics, 1988.
[153] A E Michotte. The perception of causality. Basic Books, New York, 1963.
[154] Charlie Miller and Chris Valasek. Remote exploitation of an unaltered passengervehicle. Black Hat USA, 2015:91, 2015.
[155] George A Miller. WordNet: An electronic lexical database. MIT press, 1998.
[156] Marvin Minsky. Steps toward artificial intelligence. Proceedings of the IRE,49(1):8–30, 1961.
[157] Marvin Minsky. A framework for representing knowledge. MIT-AI LaboratoryMemo 306, 1974.
[158] Marvin Minsky. Society of Mind. Simon & Schuster, Inc., New York, 1988.
222
[159] Marvin Minsky. Negative Expertise. International Journal of Expert Systems,7(1):13–19, 1994.
[160] Marvin Minsky. The emotion machine: Commonsense thinking, artificial intel-ligence, and the future of the human mind. Simon and Schuster, 2007.
[161] Christoph Molnar. Interpretable Machine Learning. 2019. https://christophm.github.io/interpretable-ml-book/.
[162] Erik T Mueller. Story understanding. Encyclopedia of Cognitive Science, 2006.
[163] Erik T Mueller. Commonsense reasoning: an event calculus based approach.Morgan Kaufmann, 2014.
[164] Deirdre K Mulligan and Kenneth A Bamberger. Saving governance-by-design.Calif. L. Rev., 106:697, 2018.
[165] Deirdre K Mulligan, Colin Koopman, and Nick Doty. Privacy is an essentiallycontested concept: a multi-dimensional analytic for mapping privacy. Phil.Trans. R. Soc. A, 374(2083):20160118, 2016.
[166] Erfan Najmi, Zaki Malik, Khayyam Hashmi, and Abdelmounaam Rezgui. Con-ceptrdf: An rdf presentation of conceptnet knowledge base. In Information andCommunication Systems (ICICS), 2016 7th International Conference on, pages145–150. IEEE, 2016.
[167] Allen Newell. Unified theories of cognition. Harvard University Press, 1994.
[168] Hwee Tou Ng and Raymond J Mooney. The role of coherence in construct-ing and evaluating abductive explanations. In Working Notes, AAAI SpringSymposium on Automated Abduction, Stanford, California, 1990.
[169] Anh Nguyen, Alexey Dosovitskiy, Jason Yosinski, Thomas Brox, and Jeff Clune.Synthesizing the preferred inputs for neurons in neural networks via deep gen-erator networks. In Advances in Neural Information Processing Systems, pages3387–3395, 2016.
[170] Anh Nguyen, Jason Yosinski, and Jeff Clune. Deep neural networks are easilyfooled: High confidence predictions for unrecognizable images. In Proceedingsof the 2015 IEEE Conference on Computer Vision and Pattern Recognition,pages 427–436, Boston, MA, 2015. IEEE.
[171] Hoang Vu Nguyen, Hock Hee Ang, and Vivekanand Gopalkrishnan. Miningoutliers with ensemble of heterogeneous detectors on random subspaces. InInternational Conference on Database Systems for Advanced Applications, pages368–383. Springer, 2010.
[172] F. Å. Nielsen. Afinn, mar 2011.
223
[173] Takashi Ogawa and Kiyokazu Takagi. Lane recognition using on-vehicle lidar.In 2006 IEEE Intelligent Vehicles Symposium, pages 540–545. IEEE, 2006.
[174] Dong Huk Park, Lisa Anne Hendricks, Zeynep Akata, Anna Rohrbach, BerntSchiele, Trevor Darrell, and Marcus Rohrbach. Multimodal explanations: Jus-tifying decisions and pointing to the evidence. CoRR, abs/1802.08129, 2018.
[175] Gabriele Paul. Approaches to abductive reasoning: an overview. Artificialintelligence review, 7(2):109–152, 1993.
[176] Joel Pearson and Stephen M Kosslyn. The heterogeneity of mental represen-tation: Ending the imagery debate. Proceedings of the National Academy ofSciences, 112(33):10089–10092, 2015.
[177] Charles Sanders Peirce. Collected papers of charles sanders peirce, volume 2.Harvard University Press, 1960.
[178] Jeffrey Pennington, Richard Socher, and Christopher D. Manning. Glove:Global vectors for word representation. In Empirical Methods in Natural Lan-guage Processing (EMNLP), pages 1532–1543, 2014.
[179] Maria João Pereira, Luísa Coheur, Pedro Fialho, and Ricardo Ribeiro.Chatbots’ greetings to human-computer communication. arXiv preprintarXiv:1609.06479, 2016.
[180] Preliminary report highway hwy18mh010. https://www.ntsb.gov/investigations/AccidentReports/Reports/HWY18MH010-prelim.pdf,2018.
[181] Charles R Qi, Wei Liu, Chenxia Wu, Hao Su, and Leonidas J Guibas. Frustumpointnets for 3d object detection from rgb-d data. In Proceedings of the IEEEconference on computer vision and pattern recognition, pages 918–927, 2018.
[182] Charles R Qi, Hao Su, Kaichun Mo, and Leonidas J Guibas. Pointnet: Deeplearning on point sets for 3d classification and segmentation. In Proceedings ofthe IEEE conference on computer vision and pattern recognition, pages 652–660,2017.
[183] M Ross Quillan. Semantic memory. Technical report, BOLT BERANEK ANDNEWMAN INC CAMBRIDGE MA, 1966.
[184] Alexey Radul and Gerald Jay Sussman. The art of the propagator. In Proceed-ings of the 2009 international lisp conference, pages 1–10, 2009.
[185] Ali Sharif Razavian, Hossein Azizpour, Josephine Sullivan, and Stefan Carlsson.Cnn features off-the-shelf: an astounding baseline for recognition. In ComputerVision and Pattern Recognition Workshops (CVPRW), 2014 IEEE Conferenceon, pages 512–519. IEEE, 2014.
224

[186] John Fairbanks Reeves. Computational morality: A process model of beliefconflict and resolution for story understanding. 1991.
[187] K. Reif, K.H. Dietsche, STAR Deutschland GmbH, and Robert Bosch GmbH.Automotive Handbook. Robert Bosch GmbH, 2014.
[188] Raymond Reiter. A theory of diagnosis from first principles. Artificial intelli-gence, 32(1):57–95, 1987.
[189] Marco Tulio Ribeiro, Sameer Singh, and Carlos Guestrin. Why should i trustyou?: Explaining the predictions of any classifier. In Proceedings of the 22ndACM SIGKDD International Conference on Knowledge Discovery and DataMining, pages 1135–1144. ACM, 2016.
[190] Lawrence G Roberts. Machine perception of three-dimensional solids. PhDthesis, Massachusetts Institute of Technology, Cambridge, MA, 1963.
[191] Stephanie Rosenthal, Sai P Selvaraj, and Manuela M Veloso. Verbalization:Narration of autonomous robot experience. In IJCAI, volume 16, pages 862–868, 2016.
[192] Andrew Slavin Ross, Michael C Hughes, and Finale Doshi-Velez. Right for theright reasons: Training differentiable models by constraining their explanations.arXiv preprint arXiv:1703.03717, 2017.
[193] Cynthia Rudin. Please stop explaining black box models for high stakes deci-sions. arXiv preprint arXiv:1811.10154, 2018.
[194] Sara Sabour, Nicholas Frosst, and Geoffrey E Hinton. Dynamic routing betweencapsules. In Advances in Neural Information Processing Systems, pages 3859–3869, 2017.
[195] Steven L Salzberg. C4. 5: Programs for machine learning by j. ross quinlan.morgan kaufmann publishers, inc., 1993. Machine Learning, 16(3):235–240,1994.
[196] Mohammad Sanatkar. Lidar 3d object detection methods | by mohammadsanatkar | jun, 2020 | towards data science. https://towardsdatascience.com/lidar-3d-object-detection-methods-f34cf3227aea, June 2020.
[197] Makoto Sato and Hiroshi Tsukimoto. Rule extraction from neural networksvia decision tree induction. In Neural Networks, 2001. Proceedings. IJCNN’01.International Joint Conference on, volume 3, pages 1870–1875. IEEE, 2001.
[198] Roger C Schank. Conceptual dependency: A theory of natural language under-standing. Cognitive Psychology, 3(4):552–631, 1972.
[199] Roger C. Schank and Robert P. Abelson. Scripts, plans, goals and understanding: an inquiry into human knowledge structures. L. Erlbaum Associates, Hillsdale,NJ, 1977.
225

[200] Gregor PJ Schmitz, Chris Aldrich, and Francois S Gouws. Ann-dt: an algo-rithm for extraction of decision trees from artificial neural networks. IEEETransactions on Neural Networks, 10(6):1392–1401, 1999.
[201] Erich Schubert, Remigius Wojdanowski, Arthur Zimek, and Hans-Peter Kriegel.On evaluation of outlier rankings and outlier scores. In Proceedings of the 2012SIAM International Conference on Data Mining, pages 1047–1058. SIAM, 2012.
[202] Erich Schubert, Arthur Zimek, and Hans-Peter Kriegel. Local outlier detec-tion reconsidered: a generalized view on locality with applications to spatial,video, and network outlier detection. Data Mining and Knowledge Discovery,28(1):190–237, 2014.
[203] Ramprasaath R Selvaraju, Michael Cogswell, Abhishek Das, RamakrishnaVedantam, Devi Parikh, and Dhruv Batra. Grad-cam: Visual explana-tions from deep networks via gradient-based localization. See https://arxiv.org/abs/1610.02391 v3, 7(8), 2016.
[204] Rudy Setiono and Wee Kheng Leow. Fernn: An algorithm for fast extractionof rules from neural networks. Applied Intelligence, 12(1-2):15–25, 2000.
[205] S. Shaheen, W. El-Hajj, H. Hajj, and S. Elbassuoni. Emotion recognition fromtext based on automatically generated rules. In 2014 IEEE International Con-ference on Data Mining Workshop (ICDMW), volume 00, pages 383–392, Dec.2014.
[206] Raymond Sheh and Isaac Monteath. Defining explainable ai for requirementsanalysis. KI-Künstliche Intelligenz, pages 1–6, 2018.
[207] Avanti Shrikumar, Peyton Greenside, and Anshul Kundaje. Learning im-portant features through propagating activation differences. arXiv preprintarXiv:1704.02685, 2017.
[208] Herbert A Simon. Administrative behavior. Simon and Schuster, 2013.
[209] Karen Simonyan, Andrea Vedaldi, and Andrew Zisserman. Deep inside convo-lutional networks: Visualising image classification models and saliency maps.arXiv preprint arXiv:1312.6034, 2013.
[210] Push Singh. Examining the Society of Mind. Computing and Informatics,22(6):521–543, 2012.
[211] Daniel Smilkov, Nikhil Thorat, Been Kim, Fernanda B. Viégas, and Mar-tin Wattenberg. Smoothgrad: removing noise by adding noise. CoRR,abs/1706.03825, 2017.
[212] Robert Speer and Catherine Havasi. ConceptNet 5: A large semantic networkfor relational knowledge. In The People’s Web Meets NLP, pages 161–176.Springer, New York, 2013.
226

[213] Erik Štrumbelj and Igor Kononenko. Explaining prediction models and individ-ual predictions with feature contributions. Knowledge and information systems,41(3):647–665, 2014.
[214] Peter Struss and Alessandro Fraracci. Modeling hydraulic components for au-tomated fmea of a braking system. Technical report, Tech. Univ. of MunichGarching Germany, 2014.
[215] Muhammad Sualeh and Gon-Woo Kim. Dynamic multi-lidar based multipleobject detection and tracking. Sensors, 19(6):1474, 2019.
[216] Fabian M Suchanek, Gjergji Kasneci, and Gerhard Weikum. Yago: A largeontology from wikipedia and wordnet. Journal of Web Semantics, 6(3):203–217, 2008.
[217] Mukund Sundararajan, Ankur Taly, and Qiqi Yan. Axiomatic attribution fordeep networks. arXiv preprint arXiv:1703.01365, 2017.
[218] Katia P Sycara. Multiagent systems. AI magazine, 19(2):79–79, 1998.
[219] Ismail A Taha and Joydeep Ghosh. Symbolic interpretation of artificial neuralnetworks. IEEE Transactions on knowledge and data engineering, 11(3):448–463, 1999.
[220] Sarah Tan, Rich Caruana, Giles Hooker, and Yin Lou. Detecting biasin black-box models using transparent model distillation. arXiv preprintarXiv:1710.06169, 2017.
[221] Paul R Thagard. The best explanation: Criteria for theory choice. The journalof philosophy, 75(2):76–92, 1978.
[222] Sebastian Thrun. Extracting rules from artificial neural networks with dis-tributed representations. In Advances in neural information processing systems,pages 505–512, 1995.
[223] Yuchi Tian, Kexin Pei, Suman Jana, and Baishakhi Ray. Deeptest: Automatedtesting of deep-neural-network-driven autonomous cars. In Proceedings of the40th International Conference on Software Engineering, ICSE ’18, pages 303–314, New York, NY, USA, 2018. ACM.
[224] Antonio Torralba. Contextual priming for object detection. International jour-nal of computer vision, 53(2):169–191, 2003.
[225] Geoffrey G Towell and Jude W Shavlik. Extracting refined rules fromknowledge-based neural networks. Machine learning, 13(1):71–101, 1993.
[226] Rebecca Traynor. Seeing-in-for-action: The cognitive penetrability of percep-tion. In Proceedings of the Fifth Annual Conference on Advances in CognitiveSystems, Troy, NY, 2017. The Cognitive Systems Foundation.
227

[227] Hiroshi Tsukimoto. Extracting rules from trained neural networks. IEEE Trans-actions on Neural Networks, 11(2):377–389, 2000.
[228] Shimon Ullman. Aligning pictorial descriptions: an approach to object recog-nition. Cognition, 32(3):193–254, 1989.
[229] Owen Vallis, Jordan Hochenbaum, and Arun Kejariwal. A novel technique forlong-term anomaly detection in the cloud. In HotCloud, 2014.
[230] Ashish Vaswani, Noam Shazeer, Niki Parmar, Jakob Uszkoreit, Llion Jones,Aidan N Gomez, Łukasz Kaiser, and Illia Polosukhin. Attention is all you need.In Advances in Neural Information Processing Systems, pages 6000–6010, 2017.
[231] David C Vladeck. Machines without principals: liability rules and artificialintelligence. Wash. L. Rev., 89:117, 2014.
[232] Justin Werfel, Kirstin Petersen, and Radhika Nagpal. Designing collective be-havior in a termite-inspired robot construction team. Science, 343(6172):754–758, 2014.
[233] Anna Wierzbicka. Semantics: Primes and Universals. Oxford University Press,New York, 1996.
[234] Yorick Wilks and Dann Fass. The preference semantics family. Computers &Mathematics with Applications, 23(2-5):205–221, 1992.
[235] Brian C Williams and P Pandurang Nayak. Immobile robots ai in the newmillennium. AI magazine, 17(3):16–16, 1996.
[236] Brian C Williams and P Pandurang Nayak. A model-based approach to reactiveself-configuring systems. In Proceedings of the national conference on artificialintelligence, pages 971–978, 1996.
[237] Benjamin Wilson, Judy Hoffman, and Jamie Morgenstern. Predictive inequityin object detection. arXiv preprint arXiv:1902.11097, 2019.
[238] Patrick H Winston. Learning structural descriptions from examples. PhD thesis,Massachusetts Institute of Technology, 1970.
[239] Patrick Henry Winston. The right way. Advances in Cognitive Systems, 1:23–36,2012.
[240] Patrick Henry Winston. The genesis story understanding and story telling sys-tem a 21st century step toward artificial intelligence. Technical report, Centerfor Brains, Minds and Machines (CBMM), 2014.
[241] P.H. Winston and D. Holmes. The genesis manifesto: Story understanding andhuman intelligence, 2017.
228

[242] Tianjun Xiao, Yichong Xu, Kuiyuan Yang, Jiaxing Zhang, Yuxin Peng, andZheng Zhang. The application of two-level attention models in deep convolu-tional neural network for fine-grained image classification. In Computer Visionand Pattern Recognition (CVPR), 2015 IEEE Conference on, pages 842–850.IEEE, 2015.
[243] Huazhe Xu, Yang Gao, Fisher Yu, and Trevor Darrell. End-to-end learningof driving models from large-scale video datasets. In Proceedings of the IEEEconference on computer vision and pattern recognition, pages 2174–2182, 2017.
[244] Ming Yang, Shige Wang, Joshua Bakita, Thanh Vu, F Donelson Smith, James HAnderson, and Jan-Michael Frahm. Re-thinking cnn frameworks for time-sensitive autonomous-driving applications: Addressing an industrial challenge.In 2019 IEEE Real-Time and Embedded Technology and Applications Sympo-sium (RTAS), pages 305–317. IEEE, 2019.
[245] Jason Yosinski, Jeff Clune, Yoshua Bengio, and Hod Lipson. How transfer-able are features in deep neural networks? In Advances in neural informationprocessing systems, pages 3320–3328, 2014.
[246] Matthew D Zeiler and Rob Fergus. Visualizing and understanding convolutionalnetworks. In European conference on computer vision, pages 818–833. Springer,2014.
[247] Quan-shi Zhang and Song-Chun Zhu. Visual interpretability for deep learn-ing: a survey. Frontiers of Information Technology & Electronic Engineering,19(1):27–39, 2018.
[248] Quanshi Zhang, Ruiming Cao, Ying Nian Wu, and Song-Chun Zhu. Growinginterpretable part graphs on convnets via multi-shot learning. In Proceedings ofthe Thirty-First AAAI Conference on Artificial Intelligence, pages 2898–2906,2017.
[249] Quanshi Zhang, Ying Nian Wu, and Song-Chun Zhu. Interpretable convolu-tional neural networks. In Computer Vision and Pattern Recognition, 2018.
[250] Quanshi Zhang, Yu Yang, Yuchen Liu, Ying Nian Wu, and Song-Chun Zhu.Unsupervised learning of neural networks to explain neural networks. arXivpreprint arXiv:1805.07468, 2018.
[251] Xin Zhang, Armando Solar-Lezama, and Rishabh Singh. Interpreting neu-ral network judgments via minimal, stable, and symbolic corrections. CoRR,abs/1802.07384, 2018.
[252] Qingyuan Zhao and Trevor Hastie. Causal interpretations of black-box models.Journal of Business & Economic Statistics, 0(0):1–10, 2019.
229

[253] Bolei Zhou, Aditya Khosla, Agata Lapedriza, Aude Oliva, and AntonioTorralba. Object detectors emerge in deep scene cnns. arXiv preprintarXiv:1412.6856, 2014.
[254] Bolei Zhou, Aditya Khosla, Agata Lapedriza, Aude Oliva, and Antonio Tor-ralba. Learning deep features for discriminative localization. In Computer Vi-sion and Pattern Recognition (CVPR), 2016 IEEE Conference on, pages 2921–2929. IEEE, 2016.
[255] Benjin Zhu, Zhengkai Jiang, Xiangxin Zhou, Zeming Li, and Gang Yu. Class-balanced grouping and sampling for point cloud 3d object detection, 2019.
[256] Jan Ruben Zilke. Extracting Rules from Deep Neural Networks. Master’s thesis,Technische Universitat Darmstadt, 2016.
[257] Jan Ruben Zilke, Eneldo Loza Mencía, and Frederik Janssen. Deepred–ruleextraction from deep neural networks. In International Conference on DiscoveryScience, pages 457–473. Springer, 2016.
[258] Arthur Zimek, Ricardo J. G. B. Campello, and Jörg Sander. Ensembles forunsupervised outlier detection: challenges and research questions a positionpaper. SIGKDD Explorations, 15:11–22, 2014.
[259] Arthur Zimek, Ricardo JGB Campello, and Jörg Sander. Data perturbation foroutlier detection ensembles. In Proceedings of the 26th International Conferenceon Scientific and Statistical Database Management, pages 1–12, 2014.
[260] Arthur Zimek, Erich Schubert, and Hans-Peter Kriegel. A survey on unsuper-vised outlier detection in high-dimensional numerical data. Statistical Analysisand Data Mining: The ASA Data Science Journal, 5(5):363–387, 2012.
230