automatic anomaly detection and root cause analysis for ...
46
AUTOMATIC ANOMALY DETECTION AND ROOT CAUSE ANALYSIS FOR MICROSERVICE CLUSTERS Viktor Forsberg Master esis, 30 credits Supervisor: Johan Tordsson External supervisor: Johan Tordsson C ¨ 2019
-
Upload
khangminh22 -
Category
Documents
-
view
1 -
download
0
Transcript of automatic anomaly detection and root cause analysis for ...

AUTOMATIC ANOMALY
DETECTION AND ROOT CAUSE
ANALYSIS FOR MICROSERVICE
CLUSTERS
Viktor Forsberg
Master �esis, 30 creditsSupervisor: Johan Tordsson
External supervisor: Johan TordssonCivilingenjorsprogrammet i teknisk datavetenskap
2019


Abstract
Large microservice clusters deployed in the cloud can be very di�cult to bothmonitor and debug. Monitoring theses clusters is a �rst step towards detectionof anomalies, deviations from normal behaviour. Anomalies are o�en indicatorsthat a component is failing or is about to fail and should hence be detected assoon as possible. �ere are o�en lots of metrics available to view. Furthermore,any errors that occur o�en propagate to other microservices making it hard tomanually locate the root cause of an anomaly, because of this automatic methodsare needed to detect and correct the problems. �e goal of this thesis is to createa solution that can automatically monitor a microservice cluster, detect anoma-lies, and �nd a root cause. �e anomaly detection is based on an unsupervisedclustering algorithm that learns the normal behaviour of each service and thenlook for data that falls outside that behaviour. Once an anomaly is detected theproposed method tries to match the data against prede�ned root causes. �e pro-posed solution is evaluated in a real microservice cluster deployed in the cloud,using Kubernetes together with a service mesh and several other tools to helpgather metrics and trace requests in the system.


Acknowledgements
I would like to thank everyone at Elastysis for giving me an interesting thesis and a nice placeto work at. I have had fun and learned a lot thanks to them.
My supervisor, Johan Tordsson, deserves a separate thanks. His help has been very important,he always gave good feedback and ideas during our discussions.
Lastly I also want to thank my family and friends for their overall support and pushing me toget things done during this project.


Contents
1 Introduction 1
1.1 Motivation 1
1.2 Problem formulation and goals 1
2 Background 3
2.1 Microservices 3
2.2 Containers and container orchestration 3
2.3 Service mesh 5
2.4 Related work 6
3 Method 9
3.1 Algorithm for anomaly detection and root cause analysis 9
3.2 Metrics and tracing 10
3.3 Anomaly detection 11
3.4 Root cause analysis 12
4 Evaluation 15
4.1 Testbed 15
4.2 Experiment design 17
4.3 Results 18
4.3.1 Test 1 - CPU shortage 19
4.3.2 Test 2 - increased number of users 23
4.3.3 Test 3 - network delay 25
4.3.4 Test 4 - network error 27
4.3.5 Test 5 - memory shortage 29
5 Conclusions 31
5.1 Algorithmic considerations 32
5.2 System aspects 32
5.3 Future work 33


1 Introduction
1.1 Motivation
Today there are many large applications that use the microservice architecture to split theirapplication into small pieces. �e applications are then also o�en deployed on clusters inthe cloud. �ese can be very complex, see Figure 1, and hard to monitor and debug. Butmonitoring these systems are crucial as it provides very valuable information on how thesystem is performing. �e monitoring is a �rst step towards detecting anomalies, deviationsfrom normal behaviour. Anomalies are o�en indicators that a component is failing or is aboutto fail and these anomalies should hence be detected as soon as possible. A variety of anomalytypes exists, such as intrusions, fraud, bad performance, and more, However, this thesis willonly focus on performance anomalies. �ere are o�en lots of metrics available to monitorand any errors that occur o�en propagate to other microservices making it hard to manuallylocate the root cause of an anomaly, because of this automatic methods are needed to detectand correct the problems.
Figure 1: Examples of large microservice clusters in use today. Figure from [1].
1.2 Problem formulation and goals
�e main purpose of this thesis is to investigate to what extent it is possible to create a so-lution that can automatically detect when an application in a microservice cluster has badperformance (anomaly detection) and why (root cause analysis). �e thesis has the followinggoals to ful�ll that purpose.
• Goal 1: Create a system that monitors a microservice cluster and gathers relevant met-rics about it.
1
• Goal 2: Add an anomaly detection algorithm that uses the metrics to detect when themicroservices have performance issues.
• Goal 3: Add a root cause analysis algorithm to �nd why the microservices have per-formance issues.
• Goal 4: (Optional) Add automatic remediation that takes actions to resolve the per-formance issues once the root cause is found.
• Goal 5: Evaluate the developed system in a real microservice cluster by injecting per-formance anomalies and measuring how well the system detects anomalies and deter-mines their root cause.
�e optional goal will be pursued if there is enough time le� once the earlier goals are ful-�lled. �e optional goal will only be pursued if there is enough time to do both that and theevaluation once the earlier goals are ful�lled. Otherwise only the evaluation will be done.
2

2 Background
2.1 Microservices
�e microservice architecture is a way to structure an application into small separated pieces,microservices. �is is contrasted by the traditional way of building so�ware as a monolith ap-plication, see Figure 2 for an illustrated comparison. Each microservice should be responsiblefor a speci�c part of the application and only loosely coupled to other services, communicat-ing over the network using lightweight protocols such as HTTP/REST or gRPC[2]. It shouldalso be possible to develop, test, maintain, and deploy each microservice independently of oth-ers. �is architecture results in a system where each individual piece is easy to understandand where developers can rapidly make changes. However compared to a monolith applica-tion there are some additional complexity that’s added in the communication between mi-croservices. Handling delays or failures could be problematic and if the API of a microservicechanges all other microservices that interacts with this API also needs to change accordingly.[3][4]
Figure 2: A monolith application (le�) compared to a microservice application (right). �ebusiness logic and data access from the le� side are split up and put into the di�erentmicroservices on the right side. Figure from [3].
2.2 Containers and container orchestration
A popular way to facilitate the deployment of a microservice application is to use containersand container orchestration.
A container is a packaged piece of so�ware together with a list of dependencies that can berun in a standardized way. �ey are run inside a container engine that virtualizes the un-derlying operating system and also isolates each container from each other and the outside
3

environment. In this project Docker[5] is used to containerize the microservices. Containersare similar to virtual machines in the sense that both makes it possible to run several isolatedapplications on the same machine. �e di�erence is that a virtual machine is virtualizing theunderlying hardware and then running an operating system in each virtual machine. �ismakes containers more lightweight, e�cient, and faster to start, see Figure 3 for an illustra-tion. [5]
Figure 3: Running applications in containers are more e�cient and lightweight than runningthem in separate virtual machines. Figure from [6].
Each microservice is then provisioned in their own containers that can be replicated to scaleup capacity. �ese containers are o�en also spread out on several machines, called nodes, ina cluster. In order to manage many containers across multiple nodes a container orchestra-tion tool is o�en needed. Such a tool helps with the deployment, management, scaling, andnetworking for the containers. �e tool that is used in this project is called Kubernetes[7].
Figure 4: �e general components in a Kubernetes cluster. Figure from [8].
4

�e basic unit in Kubernetes is called a pod. A pod contains one or more containers thatruns on the same node and that can share some resources. On each node Kubernetes hasa container engine that runs the containers in the pods. �ere is also a component calledkubelet that controls the pods and containers. Lastly, Kubernetes adds kubeproxy - a compo-nent that provides some network functionality that simpli�es communication between pods.Kubernetes controls the nodes in the cluster from a separate master node. �e master con-sists of three major parts, the apiserver, the scheduler, and some controllers. �e apiserver isthe api that can control other objects in the cluster, such as pods, nodes, and deployments.�is is what an administrator connects to when making changes to a cluster. �e apiserveris stateless and instead stores the state in a distributed key-value store, etcd. �e scheduleris responsible for scheduling all pods on the available nodes, in a way that does not overloadany node while following any other placement restrictions set by the developers. �e possi-ble restrictions include that pods should/should not be placed on a set of nodes (node selectoror node a�nity/anti-a�nity), that pods should/should not be placed with other speci�c pods(pod a�nity/anti-a�nity), or that no pods may be placed on a node unless they are speci�-cally allowed (taints and tolerations). Lastly, the controllers watches the state of the clustersand tries to change it into the desired state, e.g. ensuring that the correct number of pods arerunning. Figure 4 shows the components in a Kubernetes cluster. To control the tra�c com-ing into the cluster an ingress is o�en added. �e ingress can give external URLs to servicesand load balance the tra�c to the services. Likewise an egress can control the tra�c that goesout from the cluster.
2.3 Service mesh
A service mesh can be used for load balancing, routing, monitoring, security, and more. In aservice mesh the microservice instances, the pods in this case, are paired with proxies thatsimpli�es the communication between services. �e tra�c to and from each pod goes troughthese proxies, le�ing them control and monitor the network. In the service mesh there is alsoa control plane that manages these proxies and their interactions[9][10].
�is project uses the service mesh Istio[10]. Istio uses Envoy[11] as the proxy of choice, asidecar container with Envoy is added to each microservice pod. A sidecar container is simplyand extra container added to a pod. Istio then adds some components that acts as the controlplane, enabling the tra�c management, security, and con�guration for the proxies. Figure 5shows the di�erent components in Istio. Istio also has the option for ingress/egress gatewaysto control the tra�c coming into and going out of the cluster.
5

Figure 5: �e general components in the Istio service mesh. Figure from [10].
2.4 Related work
�e approach of using machine learning to do automatic anomaly detection in computer sys-tems have been researched extensively. Previous work in the are can be divided broadly intosupervised and unsupervised methods. Anomaly detection is also used in several other areasas diverse as fraud detection, intrusion detection, errors in patient records due to instrumen-tation errors or recording errors, and error detection in factory machines [12].
One paper focusing on intrusion detection compared both supervised and unsupervised anomalydetection. It found that supervised methods outperformed unsupervised methods when deal-ing with known a�acks. But on unknown a�acks the methods performed similarly, makingthe unsupervised method preferable due to the need for labeled data in supervised methods[13].
Another paper researched the use of combining both unsupervised and supervised machinelearning, in particular k-means clustering and ID3 decision trees. �e combined method wascompared to the individual methods on test data from three di�erent anomaly detection do-mains, network anomaly data, du�ng equation data, and mechanical system data. �e paperconcluded that the combined method’s performance was mostly in between the other meth-ods’ performance [14].
Researchers at TU Berlin studies several anomaly detection systems with the goal to create asystem that can do automatic real time anomaly detection, root cause analysis, and recovery[15]. �ey have looked into using mostly unsupervised methods to implement the anomalydetection. Some of their research includes using deep packet inspection in virtualized services
6

[16], online Arima (regression model) in cloud monitoring [17], and distance-based onlineclustering for black-box services [18]. �e last paper have signi�catly in�uenced the anomalydetection methods used in this project. One key di�erence in this project is the focus on higherlevel metrics from a service mesh and tracing, that closely relate to user experience, insteadof hardware metrics.
Another recent paper also used clustering to detect anomalies in microservice clusters [19].Similar to the other papers mentioned, that paper used hardware metrics to detect anomaliesinstead of higher level metrics.
�ere are also several commercial solutions for anomaly detection and/or root cause analysis.One of them is Moogso� [20] that can take anomaly reports from other tools and then reducethem and correlate them into a reduced number of anomalies. �ey also run root cause anal-ysis to �nd the problem. Another tool called Grok [21] can run anomaly detection on manymetrics in a cluster and integrate this anomaly detection with other tools. Both Moogso� andGrok also use machine learning, primarily unsupervised, in order to achieve their anomalydetection and/or root cause analysis. A third tool called Dynatrace [22] o�ers a full suiteof monitoring, anomaly detection, and root cause analysis. Dynatrace’s anomaly detectionand root cause analysis seems to be based on a deterministic AI with some added machinelearning.
7

8

3 Method
�is chapter describes the developed system to detect anomalies and determine their rootcauses from an algorithmic perspective. �e following sections in turn focuses on an algo-rithm for the overall operation of the system, how the metrics are gathered, how the anomalydetection works, and how the root cause analysis works.
�e system has two main phases. A learning phase that tries to learn the normal behaviour ofthe microservice application, and a detection phase that tries to detect anomalies and then �ndtheir root causes. In order to accomplish this the system uses monitoring metrics gatheredfrom the microservice cluster.
3.1 Algorithm for anomaly detection and root cause analysis
Below is an algorithm for the overall system, the di�erent parts are described in the followingsections.
Algorithm 1: Overall operation of the systemSet iteration length TSet number of iterations I needed to learn normal behaviour/* Learning normal behaviour */for I iterations do
Gather metrics for last T secondsNormalize metricsAdd them to clustering algorithmSave metrics for root cause analysis if a new maximum is foundWait T seconds
Get �nished clusters
/* Anomaly detection and root cause analysis */Set M to suitable value for �ltering out possible anomalies close to clusterswhile true do
Gather metrics for last T secondsNormalize metricsCalculate distance to closest cluster for normalized metricsif distance >M * radius of cluster then
/* Anomaly detected */Calculate scores for de�ned root causesNotify about most likely root causes
Wait T seconds
9

3.2 Metrics and tracing
In general, monitoring information about the state of a microservice cluster can be dividedinto three levels.
• Cluster: Metrics for the cluster as a whole or individual nodes in the cluster. �isprimarily includes hardware metrics for each node, such as CPU, memory, and disk, butit can also be container orchestration metrics such as the number of nodes in the cluster,number of pods on a node, resources allocated on a node, and number of pending pods.
• Pod: Metrics for individual pods and containers. �is primarily includes hardwaremetrics for the pod or container, such as CPU, memory, and disk.
• Application: Speci�c performance metrics for the application, such as response times,error rates, number of requests, and size of request payloads.
Figure 6: �e setup for gathering metrics from a microservice cluster.
For this project the monitoring information is gathered in two ways, see Figure 6 for an illus-tration. Firstly, there are tools, such as cAdvisor[23] that are used to monitor the nodes in thecluster to gather metrics about the node and the containers/pods running there. �is coversmetrics from the cluster level and pod level. �e metrics can then be saved and aggregatedin Prometheus[24] or a similar tool. With Prometheus one can query metrics for speci�c timeintervals, averages, rate of change, etc.
Secondly, distributed tracing can be used to monitor the tra�c within the cluster. Tracing isthe process of tracking a request as it moves through the system. �is is done by adding somemeta information when a request comes to the ingress gateway and then also add it to allcommunication within the cluster that is initiated for the speci�c request. �e proxies thatrun in each node can then look at that meta information and collectively determine the paththat the request took through the system. With other information saved at the proxies, such astimestamps and status codes, the tracing can provide information about latencies, error rates,number of requests, and more. �is covers metrics from the application level. In this project,Jaeger is used, a tool that enables distributed tracing by gathering all of the information andthen compiling the traces for each request[25].
Each iteration of the system, both in the learning phase and the detection phase, lasts T sec-onds and in each iteration the system uses metrics from the last T seconds. �us larger valuesof T means that the system uses older metrics, which in turn means that it can take longer
10
to detect anomalies. Conversely, smaller values of T instead increases overhead while gath-ering metrics as frequent monitoring uses more computation and also more data storage. Tohandle this tradeo� the system should strive to iterate as o�en as possible, while keepingthe overhead at an acceptable level. With a system like this where data goes through multiplecomponents before metrics can be used, there is also added overhead for each step in the mon-itoring chain, e.g. some data in this system goes from cAdvisor on each node to Prometheusand then to the anomaly detection. Some steps are usually necessary as they provide fea-tures that makes the process more e�cient in other ways, e.g. by o�ering centralized access,condensing the data, or running queries. But too many might slow down the system if theoverhead outweighs the e�ciency improvements from the new features. �e current versionof the system iterates once every other second, a frequency determined empirically as therewere problems during development to update metrics more frequently.
3.3 Anomaly detection
Anomalies in a system can be de�ned as deviations from normal behaviour. Anomalies areo�en indicators that a component is failing or is about to fail and should hence be detectedas soon as possible. Anomaly detection is the process of trying to detect anomalies so thatsomeone or something can react to them and �x any underlying problem.
�ere are many ways to do anomaly detection, though the core is looking at di�erent metricsfrom the system to �nd deviations. �is can be done both manually by system administratorsor automatically by so�ware. As microservice applications o�en produce a large amount ofmetrics to analyze, a manual process is impractical. Looking at automatic solutions there areseveral types that have been tried and are used today, e.g. some sort of machine learning algo-rithm, either supervised or unsupervised. Using supervised machine learning requires labeledtraining data which can be hard to produce and furthermore cannot capture every possibleanomaly. �is project instead focuses on unsupervised machine learning where unlabeleddata is used by the algorithm. �is reduces the amount of domain speci�c knowledge neededand could provide a system that is able to detect unexpected types of anomalies.
�e general idea for the anomaly detection in this system is to learn the normal behaviourin the microservice application, then look for any deviations from this behaviour. �is isdone per instance of each microservice to look for anomalies at each pod instead of in themicroservice cluster as a whole. �is narrows down the location of each anomaly and thusmakes the root cause analysis more focused.
�is solution uses a clustering algorithm to learn the normal behaviour of each microservice.Multiple metrics from the components are given to the algorithm each second, both duringthe learning phase and detection phase. During the learning phase the algorithm uses themetrics to form a set of multidimensional clusters that represent the state of the system. �eclusters are then a representation of the normal behaviour. Later during the detection phasethis representation is used to detect anomalies by checking if the the newly gathered metricsfall inside the clusters or not. If they do not then it is treated as an anomaly, see Figure 7 foran illustration.
11
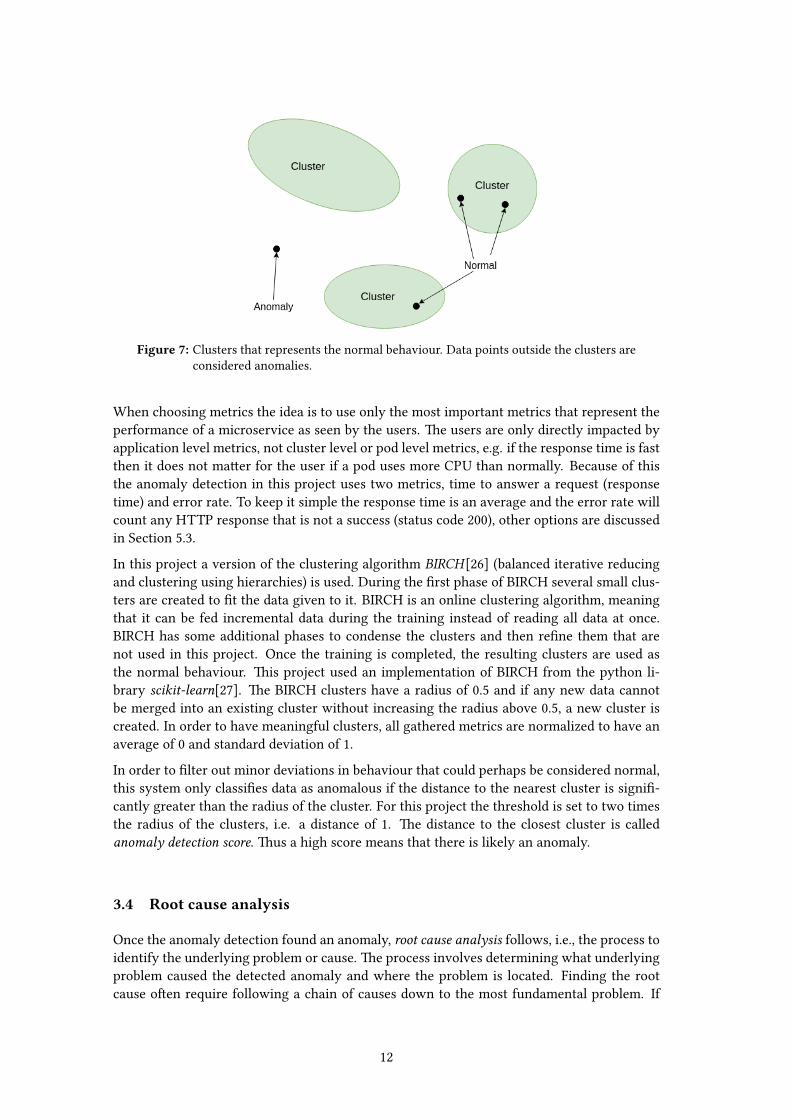
Figure 7: Clusters that represents the normal behaviour. Data points outside the clusters areconsidered anomalies.
When choosing metrics the idea is to use only the most important metrics that represent theperformance of a microservice as seen by the users. �e users are only directly impacted byapplication level metrics, not cluster level or pod level metrics, e.g. if the response time is fastthen it does not ma�er for the user if a pod uses more CPU than normally. Because of thisthe anomaly detection in this project uses two metrics, time to answer a request (responsetime) and error rate. To keep it simple the response time is an average and the error rate willcount any HTTP response that is not a success (status code 200), other options are discussedin Section 5.3.
In this project a version of the clustering algorithm BIRCH[26] (balanced iterative reducingand clustering using hierarchies) is used. During the �rst phase of BIRCH several small clus-ters are created to �t the data given to it. BIRCH is an online clustering algorithm, meaningthat it can be fed incremental data during the training instead of reading all data at once.BIRCH has some additional phases to condense the clusters and then re�ne them that arenot used in this project. Once the training is completed, the resulting clusters are used asthe normal behaviour. �is project used an implementation of BIRCH from the python li-brary scikit-learn[27]. �e BIRCH clusters have a radius of 0.5 and if any new data cannotbe merged into an existing cluster without increasing the radius above 0.5, a new cluster iscreated. In order to have meaningful clusters, all gathered metrics are normalized to have anaverage of 0 and standard deviation of 1.
In order to �lter out minor deviations in behaviour that could perhaps be considered normal,this system only classi�es data as anomalous if the distance to the nearest cluster is signi�-cantly greater than the radius of the cluster. For this project the threshold is set to two timesthe radius of the clusters, i.e. a distance of 1. �e distance to the closest cluster is calledanomaly detection score. �us a high score means that there is likely an anomaly.
3.4 Root cause analysis
Once the anomaly detection found an anomaly, root cause analysis follows, i.e., the process toidentify the underlying problem or cause. �e process involves determining what underlyingproblem caused the detected anomaly and where the problem is located. Finding the rootcause o�en require following a chain of causes down to the most fundamental problem. If
12
the root cause is found, that can then be used to select some remediation steps to revert thesituation. As an example this system could detect an anomaly, that pod-A has slow responsetime, and try to �nd the root cause of that anomaly. Analyzing metrics from the pod could �ndthat pod-A is slow because it is dependant on pod-B that is also slow to respond. Analyzingpod-B could then show that it has had slow response times since a recent deployment of anew version of pod-B. �e code could then be analyzed, but this is outside the scope of thisthesis. �us the conclusion in this example is that a bad version of the code in pod-B was theroot cause. �e remediation could then be to update to a newer, �xed version of the code orto roll back to a previous version.
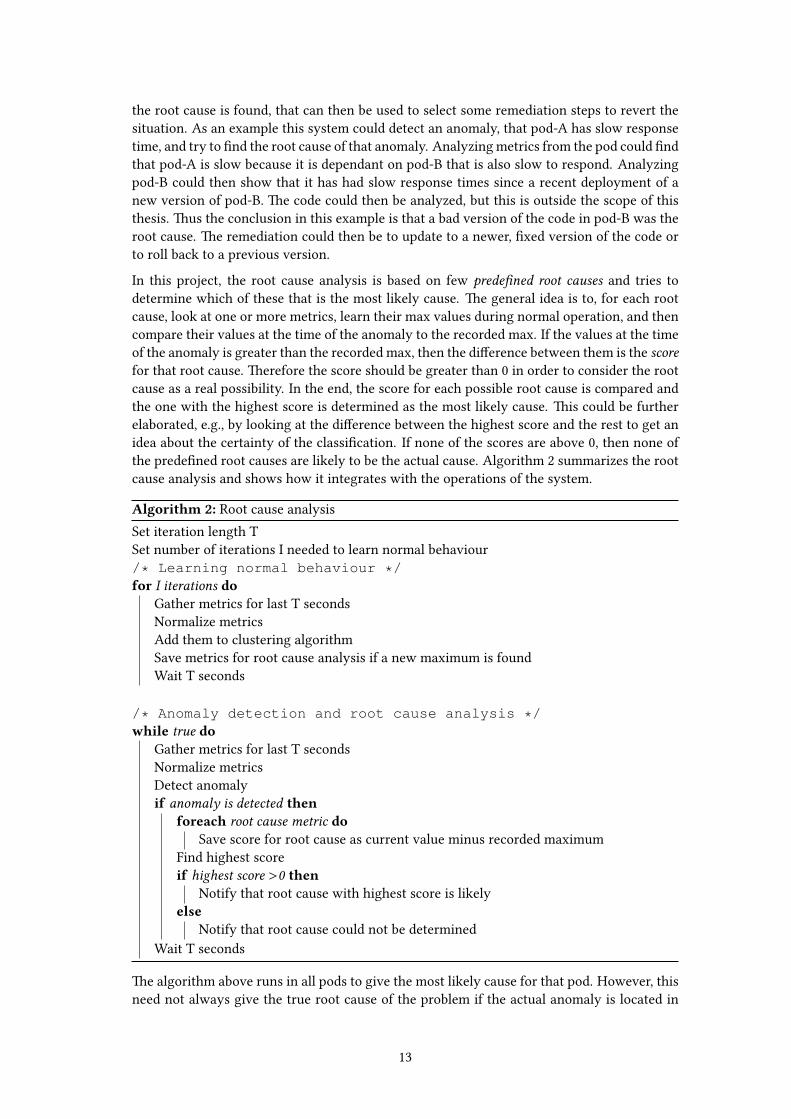
In this project, the root cause analysis is based on few prede�ned root causes and tries todetermine which of these that is the most likely cause. �e general idea is to, for each rootcause, look at one or more metrics, learn their max values during normal operation, and thencompare their values at the time of the anomaly to the recorded max. If the values at the timeof the anomaly is greater than the recorded max, then the di�erence between them is the scorefor that root cause. �erefore the score should be greater than 0 in order to consider the rootcause as a real possibility. In the end, the score for each possible root cause is compared andthe one with the highest score is determined as the most likely cause. �is could be furtherelaborated, e.g., by looking at the di�erence between the highest score and the rest to get anidea about the certainty of the classi�cation. If none of the scores are above 0, then none ofthe prede�ned root causes are likely to be the actual cause. Algorithm 2 summarizes the rootcause analysis and shows how it integrates with the operations of the system.
Algorithm 2: Root cause analysisSet iteration length TSet number of iterations I needed to learn normal behaviour/* Learning normal behaviour */for I iterations do
Gather metrics for last T secondsNormalize metricsAdd them to clustering algorithmSave metrics for root cause analysis if a new maximum is foundWait T seconds
/* Anomaly detection and root cause analysis */while true do
Gather metrics for last T secondsNormalize metricsDetect anomalyif anomaly is detected then
foreach root cause metric doSave score for root cause as current value minus recorded maximum
Find highest scoreif highest score >0 then
Notify that root cause with highest score is likelyelse
Notify that root cause could not be determinedWait T seconds
�e algorithm above runs in all pods to give the most likely cause for that pod. However, thisneed not always give the true root cause of the problem if the actual anomaly is located in
13

another pod or node. �us, the cause reported from one pod should be analysed together withreports from all other pods in order to draw conclusions about the cluster as a whole. Reusingthe above example for general root cause analysis, the scenario is that if pod-A reports thatan anomaly is caused by slow responses from one of its dependencies, pod-B and pod-B inturn reports that it is running slow due to new versions of its code. Combining these reportswith the knowledge that pod B is a dependency of pod A, it can be concluded that the rootcause is located in pod B.
14

4 Evaluation
4.1 Testbed
�e testbed is composed of four major components: the microservices and clients, a servicemesh and monitoring tools to gather metrics, an anomaly detection and root cause analysisprogram, and an anomaly injector to evaluate the solution.
�is project have used Google Cloud as the cloud provider and more speci�cally Google Ku-bernetes Engine to get a cluster with Kubernetes pre-deployed. Onto this cluster Istio wasdeployed as the service mesh together with Prometheus and a cAdvisor daemonset for met-rics and Jaeger for tracing. Next the microservices were deployed, with sidecar containersinjected by Istio. Depending on the tests, some additional applications were sometimes addedto inject anomalies into the system. In total the system used �ve nodes, where two nodeswere dedicated to the microservices and cadvisor, with the three remaining nodes dedicatedto the other components (Istio, Prometheus, the anomaly detection program, etc.).
Figure 8: �e architecture for the microservice application used in the experiments.
�e application used in these experiments consisted of nine di�erent microservices. �e ap-plication is supposed to mimic some internal human resource system for a company. �ree ofthese microservices (Company, Employee-salary, and Greet-employee) are user-facing, whilethe others are only used internally by other services. �e communication between the mi-
15

croservices uses regular HTTP requests and JSON payloads. �e application is only a dummyapplication developed for the evaluation of the anomaly detection and root cause analysismethods proposed in this thesis, not an application that is actually in use by any company.See Figure 8 for an illustration of the architecture for the microservices. �e microservicesare built using the programming language Ballerina[28]. Ballerina was chosen because it waseasy to build small network applications and because it had native support for Docker, Ku-bernetes, and Istio that can generate the necessary artefacts needed to deploy an application.In order to make the experiments easier to run and reproduce the microservices were de-ployed on speci�c nodes. �e speci�c deployment used taints and tolerations to ensure thatunwanted pods were placed on the other three nodes and node selector to place the applica-tion pods on speci�c nodes. Figure 9 shows how the microservices were distributed over thetwo nodes. Note that one microservice was replicated and deployed with one pod per node.
Figure 9: �e microservices used in the experiment, distributed over 2 nodes.
During the experiments user tra�c is injected using Locust[29]. Locust was set up to varythe numbers of users between 30 and 60. Each user randomly sends a request to one of theexposed microservices, with a bias towards ”Company” where 50% of all requests go andthe other two receives 25% each. Each client then sleeps between 500 ms and 2000 ms beforerepeating the same steps again. �is number of users was selected to not exceed the maximumcapacity that the nodes can handle before slowing down signi�cantly, but it is a signi�cantload and at 60 concurrent users the nodes are using almost all of their CPU resources.
Version 1.1.0 of Istio was deployed using Helm charts and the values �le values-istio-demo-auth.yaml. Metrics from the microservices are gathered each second to quickly pick up changes.�is required changes to Prometheus’s scrape interval and cAdvisor’s housekeeping interval.As this project used Google Kubernetes Engine, it was not possible to con�gure the cAdvisordirectly in the kubelet. Instead a new daemonset with cAdvisor was deployed with the new
16

con�guration, from which Prometheus could scrape metrics.
�e implementation of BIRCH from ”scikit-learn” was used with the default options exceptfor the se�ing ”n clusters=None”, which limits the algorithm to only run the �rst phase.
For these tests there are �ve di�erent de�ned root causes. �ere are only used as a proof ofconcept and a real production system would need many more possible causes to look for. �e�rst two root causes are a shortage of CPU on the pods node or a shortage of memory on thenode. �ese are meant to mimic the ”noisy neighbor” e�ect where another application is usingup a lot of resources on the node, in this case either CPU or memory. �e third root cause issimply having having a higher request load than normal from the users. �e fourth and ��hroot causes are that other services respond slower or return more errors than normal to a pod.All of these root causes are based on problems outside the pod, not any internal problem suchas bugs in the code. Given this selection of root causes, if none of the scores are above 0, thenthe default assumption could be that there is an internal problem at the pod that reported theanomaly. Perhaps there is some bug causing the code to run slow or produce more errors.
�e conclusions drawn from the reports of the root cause analysis at each pod is done by theauthor of this thesis for these tests.
4.2 Experiment design
�ere were �ve experiments planned to test the system, one for each of the root causes thatcan be identi�ed by the system. �e tests start by having the anomaly detection system learnthe normal behaviour of the microservices. �e �rst anomaly is then introduced and theoutput of the anomaly detection and root cause system is recorded for about 20 minutes beforethe anomaly is removed. �e microservices then have a chance to stabilize at normal levelsagain before the next anomaly is introduced. �is continues until all �ve anomalies have beentested. �ese tests are only used as a �rst step to see if the system can work correctly in simplesituations.
�e �rst experiment involves creating a CPU shortage on one of the nodes, Node 2 in Figure 9.�e shortage is created by adding pods running the tool stress[30] that tries to use up as muchCPU as possible. �is should increase the response time of any pod running in the a�ectednode as well as any pods depending on pods in Node 2.
In the second experiment the added anomaly is simply that the number of simulated usersare increased from between 30 and 60 to between 130 and 160. �is should slow down theresponse time for all or most of the pods due to a lack of capacity in the nodes. �e ”Employee”pods are generally a bo�leneck for the microservices and this experiment should thus at leasttrigger an anomaly in them and their dependencies, whereas other microservices such as”Time” might not be slowed down.
For the third experiment a network delay is added to the ”Randomize” microservice, such thatany response from it is delayed by 500 ms. �is should slow down any microservices thatis depending on ”Randomize”. �e delay is introduced using Istio, the proxy sidecar in the”Randomize” pod adds the delay to any outgoing responses. �is does however not increasethe time that the ”Randomize” pod itself reports for each request.
�e fourth experiment is similar to the third but it uses network errors instead of networkdelays. �e sidecar proxies in the ”Employee” pods are con�gured to respond with an error in10% of all incoming requests instead of sending the requests to the ”Employee” microservices.
17

�is causes any depending microservices to also produce errors, due to bad error handling,which should be detected as anomalies. Similarly to Test 3 the ”Employee” pods does not seethis as responding with errors, they only notice this in terms of a reduction in the number ofrequests.
In the ��h experiment the anomaly is a resource shortage as in the �rst experiment, exceptit is a memory shortage instead of a CPU shortage. �e resource shortage will be located inNode 1, see Figure 9. �e shortage is again created by adding pod that run the tool stress,though this time the tool is con�gured to focus on using up memory instead of CPU. �isshould increase the response time for any pods in the a�ected node or cause them to produceerrors. Any pod depending on pods in Node 1 should also see an increase in response time orerrors.
4.3 Results
Each test produced anomaly data for each pod that indicates if there was an anomaly or not.�is data can be displayed in a graph, see Figure 11a and Figure 11b for examples, to estimateif the system detected an anomaly or not. For each test there will be a diagram similar to 9that shows which pods detected an anomaly or not. �e tests also produced root cause datathat indicates which root cause that was responsible for the anomaly. �is data can also bedisplayed as graphs to see if the system detected the correct root cause and how sure it was.
18

4.3.1 Test 1 - CPU shortage
Figure 10: �is shows which pods that detected an anomaly in the �rst experiment. �e podsmarked in red clearly detected an anomaly, the pods marked in yellow had incon-clusive results, and the pods marked in white clearly did not detect an anomaly.�e orange pods indicate that there were additional pods in Node 2 that werecausing a CPU shortage on the node.
�e �rst scenario evaluates an anomaly in the form of noisy neighbors - vicious pods thatconsume CPU in one of the nodes. Figure 10 shows which pods that detected an anomalyduring the test. �e pods marked in red clearly detected an anomaly and the pods in yellowwere not clear if they detected an anomaly or not. �e orange pods are the ones that aretrying to use up the CPU resources on Node 2 and thus the cause of the anomaly. All pods inNode 2 except for ”Time” reported anomalies and the pods ”Greet employee” and ”Company”,that depends on pods in Node 2, also reported anomalies as expected. However ”Calc-salary”should not have reported any anomalies, even though the data is a bit inconclusive. Valuesfrom the anomaly detection data that are above 1 could be considered an anomaly, but dueto the volatile nature of this data there should be multiple grouped values above 1 before itsconsidered an anomaly.
Figure 11 shows the execution of the anomaly detection in all pods. In general, as data isnormalized, scores (much) larger than 1 are considered to be signi�cant. �e data from thepod ”Employee2”, shown in Figure 11a, clearly shows high values throughout the test, thelow values at the beginning and end are before the anomaly is introduced and a�er it hasbeen removed. Likewise the data from the pod ”Randomize”, shown in Figure 11b, shows lowvalues below 1 except for a few isolated spikes that goes slightly above 1. Figure 11c displaysthe data from the pod ”Calc-salary” and that data is a bit inconclusive. Most of the values areclearly below 1 as expected, but there are many more spikes that goes above 1 than in the
19

data from ”Randomize” and they are more grouped. Similarly the data from the pod ”Time”,shown in Figure 11d and again, cropped in 11e to more clearly show when values goes above1, are also inconclusive. Here the values are also mostly below 1 but contain some groupedspikes that goes above 1. �is data also have a few values that are more extreme and goes alot higher than the values from ”Calc-salary”.
�e root cause classi�cation data for the pods ”Company” and ”Greet employee”, shown inFigure 12a and 12b respectively, clearly shows that the anomaly’s root cause have been clas-si�ed as increased response time from other services. �is makes sense as neither of themare located on the a�ected node but instead are dependant on pods in Node 2. �e data forthe pods ”Department” and ”Employee salary”, shown in Figure 12d and 12c respectively, alsoclearly shows that the anomaly would be classi�ed as increased response time from otherservices. �ough both also have a small increase in the score for CPU shortage. �is is alsoas expected because both are dependant on ”Employee2”, that acts as a bo�leneck, causingthe primary classi�cation. Both are also located in the a�ected node, which is causing the in-creased score for CPU shortage. Lastly, the data for the pods ”Employee2” and ”Time”, shownin Figure 12e and 12f respectively, shows a high score for CPU shortage as expected. Bothalso show increased scores for memory shortage, especially ”Time”, but that will be ignoreddue to reasons stated in Section 5.1. Using the dependencies of the pods one can see that”Greet employee”, ”Company”, ”Department”, and ”Employee salary” point to ”Employee2”being slow which, together with ”Time”, in turn points to a CPU shortage on Node 2.
In total, the system managed to correctly detect or not detect anomalies as expected in 8 outof 10 pods, where the remaining 2 were inconclusive. All pods that were expected to detectan anomaly correctly classi�ed the root cause of the anomaly - abnormal CPU usage.
20

(a) Anomaly detection data for the ”Employee2”pod.
(b) Anomaly detection data for the ”Randomize”pod.
(c) Anomaly detection data for the ”Calc-salary”pod.
(d) Anomaly detection data for the ”Time” pod.
(e) Anomaly detection data for the ”Time” pod,zoomed in to show the scores with low valuesin more detail.
Figure 11: Anomaly detection data from some of the pods during the test with a CPUanomaly.
21

(a) Root cause analysis data for the ”Company”pod.
(b) Root cause analysis data for the ”Greet em-ployee” pod.
(c) Root cause analysis data for the ”Employeesalary” pod.
(d) Root cause analysis data for the ”Depart-ment” pod.
(e) Root cause analysis data for the ”Employee 2”pod.
(f) Root cause analysis data for the ”Time” pod.
Figure 12: Root cause classi�cation data from some of the pods during the test with a CPUanomaly.
22

4.3.2 Test 2 - increased number of users
Figure 13: �is shows which pods that detected an anomaly in the second experiment. �epods marked in red clearly detected an anomaly and the pods marked in whiteclearly did not detect an anomaly. �e users are marked in orange to indicate thatthey are the source of the anomaly. �e number of simulated users have increasedsigni�cantly.
�e second scenarios introduces an anomaly in the form of an increased number of usersaccessing the front-end services. Figure 13 shows which pods that detected an anomaly duringthe test. �e pods marked in red clearly detected an anomaly. �e users are marked in orangeto indicate that they are the source of the anomaly. �e pods ”Greet employee”, ”Company”,”Employee salary”, ”Department”, ”Employee1”, and ”Employee2” all detected anomalies. Asthe ”Employee” pods are acting as a bo�leneck for the microservices this result is as expected.
�e root cause data from ”Company”, ”Greet employee”, ”Employee salary”, and ”Depart-ment”, shown in Figure 14a, 14b, 14c, and 14d respectively, all classify their root cause asincreased response time from other services as expected. �e data from ”Employee2”, shownin Figure 14f, classi�es the root cause as an increase in requests, also as expected. However,the data from ”Employee1”, shown in Figure 14e, does not have a high score that indicates theroot cause being an increase in requests. �at score does increase, compared to before anda�er the anomaly, but values below 0 should be classi�ed as inconclusive.
In total the system managed to correctly detect or not detect anomalies in all pods. 5 out of 6pods that detected an anomaly then correctly classi�ed the root cause of the anomaly.
23

(a) Root cause analysis data for the ”Company”pod.
(b) Root cause analysis data for the ”Greet em-ployee” pod.
(c) Root cause analysis data for the ”Employeesalary” pod.
(d) Root cause analysis data for the ”Depart-ment” pod.
(e) Root cause analysis data for the ”Employee 1”pod.
(f) Root cause analysis data for the ”Employee 2”pod.
Figure 14: Root cause classi�cation data from some of the pods during the test with increasedrequests as the anomaly.
24

4.3.3 Test 3 - network delay
Figure 15: �is shows which pods that detected an anomaly in the third experiment. �epods marked in red clearly detected an anomaly and the pods marked in whiteclearly did not detect an anomaly. �e orange marking around the ”Randomize”node indicate that there is a network delay injected at that node, which is thesource of the anomaly. �e network delay a�ects all responses going out fromthat node.
�e overall setup and results of the network delay anomaly experiment is shown in Figure 15.�e pods marked in red clearly detected an anomaly. �e orange box around ”Randomize”indicates that a network delay at that pod is the source of the anomaly. �e pods ”Greetemployee”, ”Employee salary”, ”Greeting”, and ”Calc-salary” all detected anomalies. �ose areall the pods depending on ”Randomize”, which are the ones expected to detect anomalies. Asthe anomaly only a�ects the time between ”Randomize” and its dependants, the ”Randomize”pod itself is not expected to detect the anomaly.
�e root cause data from ”Greet employee”, ”Employee salary”, ”Greeting”, and ”Calc-salary”,shown in Figure 16a, 16b, 16c, and 16d respectively, all classify their root cause as increasedresponse time from other services as expected. Since ”Greeting” and ”Calc-salary” both onlyhave ”Randomize” as their sole dependency and ”Randomize” does not experience any anomaly,we can conclude that the network between these pods is the root cause.
In total the system managed to correctly detect or not detect anomalies in all pods. All podsthat detected an anomaly then also correctly classi�ed the root cause of the anomaly.
25

(a) Root cause analysis data for the ”Greet em-ployee” pod.
(b) Root cause analysis data for the ”Employeesalary” pod.
(c) Root cause analysis data for the ”Greeting”pod.
(d) Root cause analysis data for the ”Calc-salary”pod.
Figure 16: Root cause classi�cation data from some of the pods during the test with a networkdelay as the anomaly.
26

4.3.4 Test 4 - network error
Figure 17: �is shows which pods that detected an anomaly in the fourth experiment. �epods marked in red clearly detected an anomaly and the pods marked in whiteclearly did not detect an anomaly. �e orange marking around the ”Employee”nodes indicate that there is a network error injected at those nodes, which is thesource of the anomaly. �e network errors a�ects some of the requests going tothose nodes, returning an error instead of le�ing the request go to the nodes.
In the fourth and last scenario, an anomaly in the form of network errors was introduced.Figure 17 shows which pods that detected an anomaly during the test. �e pods marked inred clearly detected an anomaly. �e orange ”Employee” service indicate that a network errorat those pods is the source of the anomaly, some of the requests gets error responses insteadof going to the ”Employee” containers. �e pods ”Greet employee”, ”Company”, ”Employeesalary”, and ”Department” all detected anomalies. �ose are all the pods depending on the”Employee” pods, which are the ones expected to detect anomalies. As the errors occur beforethe requests arrives at the ”Employee” containers, the ”Employee” pods are not expected tosee the anomaly.
�e root cause data from ”Greet employee”, ”Company”, ”Employee salary”, and ”Depart-ment”, shown in Figure 18a, 18b, 18c, and 18d respectively, all classify their root cause asincreased number of errors from other services as expected. �e ”Department” pods onlydependency are the ”Employee” pods, which implies that the anomaly is located there. How-ever ”Greet employee” and ”Employee salary” also have other dependencies, which meansthat other pods could also be returning errors. �ough the likely conclusion to draw is thatthere are network errors for requests to the ”Employee” pods.
In total the system managed to correctly detect or not detect anomalies in all pods. All podsthat detected an anomaly then also correctly classi�ed the root cause of the anomaly.
27

(a) Root cause analysis data for the ”Greet em-ployee” pod.
(b) Root cause analysis data for the ”Company”pod.
(c) Root cause analysis data for the ”Employeesalary” pod.
(d) Root cause analysis data for the ”Depart-ment” pod.
Figure 18: Root cause classi�cation data from some of the pods during the test with a networkerror as the anomaly.
28

4.3.5 Test 5 - memory shortage
Figure 19: �is shows the results from testing during development of this experiment. �epods marked with a cross was randomly evicted by Kubernetes due to lack ofmemory on the node, the pod marked in yellow had inconclusive results as itsdependency was occasionally evicted, and the pods marked in white clearly didnot detect an anomaly. �e orange pods indicate that there were additional podsin Node 1 that were causing a memory shortage on the node.
Unfortunately this test was not possible to perform and get any meaningful data. �e maine�ect of adding the anomaly was not causing the pods to run slower or produce errors. Insteadwhen the node ran out of memory Kubernetes would evict (shut down) a pod on the node.When the pod restarted the node would eventually run out of memory again and a pod wouldbe evicted again. �is made the scenario very hard to test given that the anomaly detectionis based on looking at speci�c pods and starts to fail if any of those pods are evicted.
29

30
5 Conclusions
Overall this project has produced a system that is capable of gathering relevant metrics, detectanomalies, and �nd root causes in a microservice cluster. �e anomaly detection and rootcause analysis have also been evaluated using a real microservice cluster with real injectedanomalies. However, no automatic remediation have been added to the system. �us all goalsset for the project in Section 1.2, except the optional goal related to automatic remediation,have been ful�lled to some extent. �is chapter will discuss to what extent the goals are met,algorithmic considerations, system aspects, and future work.
�e �rst goal states that the system should be able to monitor the microservice cluster andgather relevant metrics from it. �e system monitors the cluster through cAdvisor and theservice mesh Istio together with the tracing from Jaeger. cAdvisor provides hardware metricsfor all nodes and pods in the cluster while Jaeger and Istio provides di�erent applicationmetrics. Together they provide thorough monitoring and gathers the key metrics for all threemonitoring levels (cluster, pod, and application), thus the �rst goal is achieved.
�e second goal states that the system should have an anomaly detection algorithm that candetect performance issues in the microservices. �e implemented anomaly detection based onthe BIRCH clustering algorithm can detect anomalies given relevant metrics. �e proposedmetrics of average response time and error rate represent the performance of the services asexperienced by the users. �is rather simple anomaly detection method should thus be ableto detect a broad range of anomalies. Due to the volatile nature of the used metrics there aresudden increases or decreases in score for the anomaly detection. �e system should contain away to mitigate this behavior in order to have reliable anomaly detection. In total, the secondgoal is partially achieved.
�e third goal states that the system should have a root cause analysis algorithm that candetermine why an anomaly occurred. �e provided root cause analysis can for each pod �ndthe most likely cause of that pods anomaly, if it is included in a prede�ned list of causes.Given the output from the root cause analysis for each pod combined with information aboutthe microservice cluster architecture, the true root cause can be found, as outlined in thediscussions of the tests in Section 4.3. �is is currently not automated by the system, whichwould be needed for this goal to be completely achieved. �erefore, the third goal is partiallyachieved.
�e fourth, optional goal states that the system should also have automatic remediation thatcan take actions to resolve the issues that the root cause analysis �nds. Due to a lack of timethis goal was not pursued and not achieved.
�e ��h and last goal states that the system should be tested in a real microservice clus-ter to see how well the anomaly detection and root cause analysis works. �e system wastested with the experiments described in Chapter 4 and the overall results were positive.Most anomalies were detected as expected and the root cause analysis also worked as ex-pected. �e goal is achieved, but it would be interesting to have evaluated an automated rootcause analysis system with more tests and more prede�ned root causes.
31

5.1 Algorithmic considerations
As the anomaly detection and root cause analysis is run for each pod, the location of theanomaly is usually easy to obtain. Depending on the type of anomaly this might not beentirely true, e.g. in the case of a CPU shortage the system might not know which pod is thetrue root cause, but at least the node that has the CPU shortage should be located.
As the whole system is based on learning the normal behaviour of the microservice clus-ter, problems arises if the normal behaviour changes over time, so called model dri�. In thegeneral case that tra�c increases slowly due to an increase in users, this problem can behandled by periodically re-training the system. However, if the microservices’ normal be-haviour varies o�en, such as low usage during the night but high during the day, it couldbe impractical to retrain the system several times per day. A possible �x to this would be tohave several trained models that the system could cycle through during the day, but such asolution requires knowledge of when to change models.
�e system has been built to work in a cluster where pods can come and go, thanks to hav-ing the anomaly detection and root cause analysis look at microservice pods separately. Butthis does require highly speci�c models that describe the normal behaviour. �us each newmicroservice pod requires training a new model. �is problem is ampli�ed by the problemdescribed in the previous paragraph, causing the system to potentially retrain several modelseach time the normal behaviour changes.
During the development and testing of the di�erent root causes, some problems were foundwith the root cause indicating memory shortage on the node. In general the memory metricwas hard to normalize properly, the recorded averages and standard deviations were o�en notvery representative of the values during the test. �is lead to the metrics o�en being too highor sometimes too low to use with the other metrics. During tests the score for this root causecould therefore be much higher than any other root cause, but when looking at the actualamount of memory used by the pod and the node they did not seem to be unusually highor low. �e score could also be high without adding any anomalies. A high or low memoryload can be a good indication that something is wrong, perhaps there is a memory leak inthe system. Unfortunately this is not always the case. As an example, the Java runtime isnotorious for allocating all memory that it can, no ma�er the actual load on the application.�at of course makes memory usage a very poor indication of performance. �e way memoryusage was used as a metric in this project was not useful. For future versions it would needto be incorporated in a di�erent way.
5.2 System aspects
�is system is designed to work with most microservice clusters. If the microservice cluster isrunning on Kubernetes and could add Istio, Prometheus, Jaeger, and cAdvisor (or preferablyhave access to modify the cAdvisor in kubelet), then it should be compatible. Depending onhow the communication between services work, there will be some modi�cations needed tothe code. �is would mostly a�ect tracing, although with h�p requests, this only requirescopying some headers from the incoming request to any resulting outgoing requests.
�is system is basing most metrics on traces from Jaeger, which requires handling of a lot ofdata. �e traces from Jaeger that these microservices produce in around two seconds are of-ten several megabytes large. �is leads to some practical challenges depending on where theanomaly detection so�ware runs. If the so�ware runs outside the microservice cluster then
32
the amount of time required to get data from Jaeger might be too long. During development,responses from Jaeger could sometimes take more than two seconds when the microservicecluster is running on Google Kubernetes Engine and the anomaly detection so�ware is run-ning on a local computer, which is obviously not acceptable when the so�ware is supposedto iterate once every two seconds. �is was �xed by moving the anomaly detection so�wareonto the microservice cluster, greatly increasing network speed, but alternative solutions alsoexists, as discussed in Section 5.3.
5.3 Future work
As mentioned earlier the current system only considers each pod in isolation during rootcause analysis and then requires a human to analyze the results of several instances in orderto get a complete understanding of the root cause of a given anomaly. In essence, this followsthe procedure outlined in the discussions of the four anomaly scenarios in Section 4. �isshould be automated by extending the system to include a module that does fully automatedcluster-wide root cause analysis. �e system should then be able to report a more completepicture of the situation that can be used to determine the most suitable remediation action(s).�e remediation process that tries to resolve the root cause could also be automated or doneby humans.
�e scores from both the anomaly detection and root cause analysis can be rather volatile.More importantly, they can contain spikes where the scores are very high one iteration beforegoing back to a relatively stable level again, which can be seen in the test results in Section 4.3.�ese spikes and unstable values are a problem for the system, as the system should not warnabout an anomaly if there was just a spike in the score. �e system should instead onlysend warnings when it has su�ciently high scores for a period of time. �e spikes in thescores are likely partially caused by having a rather short monitoring and detection intervalof two seconds. Higher intervals should smooth out these spikes, but then the system mightnot respond as quickly to anomalies. A possible solution would be to implement some sortof state machine that has two modes, anomaly present or anomaly not present, plus somecounter that increments or decrements when it gets a high or low score. �en whenever thescore becomes su�ciently high or low the state machine would change state. Alternativesolutions might exist and the speci�cs would need to be tested, but the general idea to notwarn about anomalies because of one spike should be implemented.
�e two de�ned root causes in the system that indicates that another service is slow or isproducing errors could be improved. Currently those root causes analyses are based on alloutgoing requests to other services that are aggregated into the same metric. �is is probablynot optimal when a service sends requests to many other services. In such scenarios, it isharder to locate which service is actually causing the slowdown. An improvement would beto instead dynamically create two metrics, one for response times and one for errors, for eachdependency. Such a solution would make it much clearer which service is the slow one. Ifthe service is replicated in several pods this then still creates a problem, as the metric wouldnot point at a speci�c pod if any particular pod is the root cause. A possible solution to thisproblem is to split the metric again for each pod. Depending on the amount of replicas and theamount of tra�c to those replicas, this could be quite unstable if the load balancer changes theamount of tra�c that goes to each replica. Some iterations one replica might receive manyrequests and the next iteration the requests goes to other replicas. It could perhaps work, butit de�nitely requires some testing.
33

Currently the anomaly detection only looks at average response time and error rate for themicroservice. �is seems like a good approximation of the overall performance, but theremight be room for improvement. For response times the system could be looking at per-centiles, preferably a few di�erent percentiles, to get more representative data[31]. For errorsthe system could choose to classify errors into categories. �ere might also be other usefulmetrics than response time and error rates, but keeping the number of metrics as low as possi-ble is bene�cial. �e anomaly detection should only have the most important metrics that aredirectly tied to customer performance, whereas other metrics can be used in the root causeanalysis.
As mentioned in Section 5.2 there is a lot of data produced by Jaeger. �e current systemrequests all relevant data and processes it for each pod and each iteration. However, Jaegersends complete traces from the exposed front end service down to the lowest back end serviceeven though the anomaly detection system only requires a fraction of that information. Tomake this more e�cient, another so�ware scrapes all traces from Jaeger and let the anomalydetection system query more speci�c information. �is would reduce the amount of networktra�c and would make the anomaly detection a bit simpler, possibly allowing the anomalydetection and root cause analysis to run outside the cluster without a�ecting the performanceof deployed services by acquisition of tracing data.
34

References
[1] Yan Cui. Capture and forward correlation IDs through di�erent Lambdaevent sources. h�ps://hackernoon.com/capture-and-forward-correlation-ids-through-di�erent-lambda-event-sources-220c227c65f5 (visited 2019-05-23).
[2] gRPC. gRPC main page. h�ps://grpc.io/ (visited 2019-05-21).
[3] Weaveworks. What are Microservices? h�ps://www.weave.works/blog/what-are-microservices/ (visited 2019-04-17).
[4] AWS. Microservices on AWS. h�ps://docs.aws.amazon.com/whitepapers/latest/microservices-on-aws/introduction.html (visited 2019-05-21).
[5] Docker. What is a container? h�ps://www.docker.com/resources/what-container (vis-ited 2019-04-16).
[6] Doug Chamberlain. Containers vs. Virtual Machines (VMs): What’s the Di�erence?h�ps://blog.netapp.com/blogs/containers-vs-vms/ (visited 2019-04-17).
[7] Kubernetes. Learn Kubernetes basics. h�ps://kubernetes.io/docs/tutorials/kubernetes-basics/ (visited 2019-04-16).
[8] Elastisys. Se�ing up highly available Kubernetes clusters. h�ps://elastisys.com/wp-content/uploads/2018/01/kubernetes-ha-setup.pdf (visited 2019-04-17).
[9] NGINX. What Is a Service Mesh? h�ps://www.nginx.com/blog/what-is-a-service-mesh/(visited 2019-04-17).
[10] Istio. What is Istio? h�ps://istio.io/docs/concepts/what-is-istio/ (visited 20019-04-16).
[11] Envoy. Envoy main page. h�ps://www.envoyproxy.io/ (visited 2019-05-21).
[12] Varun Chandola, Arindam Banerjee, and Vipin Kumar. Anomaly detection: A survey.ACM Comput. Surv., 41(3):15:1–15:58, July 2009.
[13] Pavel Laskov, Patrick Dussel, Christin Schafer, and Konrad Rieck. Learning intrusiondetection: Supervised or unsupervised? In ICIAP, 2005.
[14] Shekhar R. Gaddam, Vir V. Phoha, and Kiran S. Balagani. K-means+id3: A novel methodfor supervised anomaly detection by cascading k-means clustering and id3 decision treelearning methods. IEEE Trans. on Knowl. and Data Eng., 19(3):345–354, March 2007.
[15] Anton Gulenko, Florian Schmidt, Marcel Wallschlager, Alexander Acker, Odej Kao, andSoren Backer. Self-healing cloud platform. h�ps://www.researchgate.net/project/Self-Healing-Cloud-Platform (visited 2019-05-25).
[16] Marcel Wallschlager, Anton Gulenko, Florian Schmidt, Odej Kao, and Feng Liu. Auto-mated anomaly detection in virtualized services using deep packet inspection. ProcediaComputer Science, 110:510–515, 12 2017.
35

[17] Florian Schmidt, Florian Suri-Payer, Anton Gulenko, Marcel Wallschlager, AlexanderAcker, and Odej Kao. Unsupervised anomaly event detection for cloud monitoring usingonline arima. 11 2018.
[18] Anton Gulenko, Florian Schmidt, Alexander Acker, Marcel Wallschlager, Odej Kao, andFeng Liu. Detecting anomalous behavior of black-box services modeled with distance-based online clustering. 09 2018.
[19] Roman Nikiforov. Clustering-based anomaly detection for microservices. CoRR,abs/1810.02762, 2018.
[20] Moogso�. Moogso� product page. h�ps://www.moogso�.com/product/ (visited 2019-05-27).
[21] Grok. How Grok works. h�ps://www.grokstream.com/how-grok-works/ (visited 2019-05-27).
[22] Dynatrace. Dynatrace platform page. h�ps://www.dynatrace.com/platform/ (visited2019-05-27).
[23] cAdvisor. Github page for cAdvisor. h�ps://github.com/google/cadvisor (visited 2019-04-17).
[24] Prometheus. Prometheus documentation - Overview.h�ps://prometheus.io/docs/introduction/overview/ (visited 2019-04-17).
[25] Jaeger. Jaeger documentation - Introduction. h�ps://www.jaegertracing.io/docs/1.11/(visited 2019-04-17).
[26] Tian Zhang, Raghu Ramakrishnan, and Miron Livny. Birch: An e�cient data clusteringmethod for very large databases. SIGMOD Rec., 25(2):103–114, June 1996.
[27] scikit learn. Birch class documentation. h�ps://scikit-learn.org/stable/modules/generated/sklearn.cluster.Birch.html (visited 2019-05-08).
[28] Ballerina. Ballerina main page. h�ps://ballerina.io/ (visited 2019-05-23).
[29] Locust. Locust main page. h�ps://locust.io/ (visited 2019-05-13).
[30] Amos Waterland. Stress tool. (visited 2019-05-27).
[31] Je�rey Dean and Luiz Andre Barroso. �e tail at scale. Commun. ACM, 56(2):74–80,February 2013.
36

37