Root Cause Analysis 10-2013
14
Ahmed Bassyouni Page 1 Title: ROOT CAUSE ANALYSIS TECHNIQUE Author: Dr. Ahmed Bassyouni, Principal Reliability Engineer Date: 10/12/2103 Rev. 0001
-
Upload
independent -
Category
Documents
-
view
1 -
download
0
Transcript of Root Cause Analysis 10-2013

Ahmed Bassyouni Page 1
Title: ROOT CAUSE ANALYSIS TECHNIQUE
Author: Dr. Ahmed Bassyouni, Principal Reliability Engineer Date: 10/12/2103 Rev. 0001
Ahmed Bassyouni Page 2
ROOT CAUSE ANALYSIS TECHNIQUE
Objective
The Root Cause Analysis (RCA) methodology has broad application to general problems. This
RCA document describes a proven easy technique for technical problem analysis. Use of the
format provides explicit data for the systematic evaluation of postulated failure modes. Rigid
adherence to this technique makes the root cause of the problem obvious through the process of
elimination and assures that the source of the problem, not the symptoms, is dealt with. An
analysis method is described and a format presented which is aimed at the systematic solution of
failures. The proposed RCA technique is efficient enough to be applied to the expected failure
problems in Pit Bull project, and other programs to achieve recommended actions and solutions
for true resolution. This document as I believe, will establish a standard approach for doing RCA
tasks in Joy Global products.
1. Introduction
Throughout any technical design and development activity, hardware failures occur. In some
cases the failure is catastrophic, such as an explosion or crash, and in others the failure is subtle,
i.e., in the form of an out of specification value of performance of some component or
subsystem. The determination of the cause of failure is often the most formidable task presented
to engineers during a development. Failures are often the result of the unexpected and the intense
pressure to meet schedule and cost goals. Significant costs in dollars, time, and anxiety can be
incurred each time a corrective action is inadequate.
It has become evident that a technique which assures that the root cause of a failure is detected
and removed is essential. System development cancellation is a real threat, and is the reason for
development of this best practice.
The Root Cause Analysis (RCA) technique can produce dramatic and effective results. The basic
root cause for each failure should be clearly established and demonstration of a complete
understanding of the failure mechanism should precede any attempts at engineering solutions.
Solutions to known specific problems, whose phenomena are clearly understood, are generally
straightforward and need to be applied only once with complete confidence that the problem will
not have to be encountered again. This report presents a description of the root cause analysis
technique and explores many of the related factors and approaches to teamwork in problem
solving activities.
2. Technique of Root Cause Analysis
The technique of root cause analysis has proven to be a significant engineering management tool.

Ahmed Bassyouni Page 3
The technique involves a thorough, organized, and rigorous analysis of each hardware failure, or
apparent failure, to firmly establish the one root cause. To support the analysis and to assure an
explicit understanding of the root cause of failure, each failure is duplicated. The next step after
establishing the mechanism of failure is to apply solutions and corrective actions.
The problem begins with the occurrence of an apparent hardware failure. With a brief description
of the problem, reliability and testing manger is designated to organize a team of engineers with
expertise in a broad range of fields to perform the first of many critical steps in the analysis.
All available data should be gathered for review and cataloged in terms of its validity, i.e.,
personal observations which are or are not collaborated, instrumentation data, recovered
hardware modules etc. To provide a ”statement of the problem,” the initial task is to specify the
problem in terms of what happened and the sequence of events leading to the problem.
Furnished with the essential knowledge of the item under investigation, a group (not more than
five persons) lists every conceivable cause for failure. This technique utilizes brainstorming to
produce a list of postulated modes of failure. In general, brainstorming employs the deferring of
judgment as a means for obtaining a large number of possibilities or alternatives, i.e., discussion
and ideas are freely evolved and recorded without evaluation of the idea at the time of its
expression. Thus, the procedure permits a large quantity of possibilities to be recorded in a short
period of time, and the broadest view of the problem is obtained before a conclusion is reached.
The separation of the production of failure possibilities from their evaluation provides a greater
opportunity for detecting subtle causes and reduces shortsightedness in examining failure modes
which may be remote but possible. Even the most remote possibilities should be listed since
there are no real data constraints or boundary conditions. From this list (which may be added to
at any time but never subtracted from) the root cause of the failure will be determined.
To augment the brainstorming technique discussed above, software tools may be obtained from
the internet at www.rootcause.com.
The format of the root cause analysis chart (Figure 1) is a simple one; however, it must be
conscientiously completed and updated to be effective in keeping the progress and the results of
the analysis before the team. The column headings of the chart are as follows:
a) Failure mode – All potential failure modes from the initial postulated list are entered, one to a
page, and added to as additional modes are evolved.
b) Failure sequence – The mechanism of the postulated failure mode is briefly described for each
failure mode entered.
c) Supporting data – Actual test data ”facts” and substantiated analyses that are established from
detailed investigation of the failure mode are listed. All facts that support the mode are listed in
enough detail to be understood by the team.
d) Refuting data – All facts established during the detailed analysis of all data that refute the
postulated failure mode are entered.

Ahmed Bassyouni Page 4
e) Additional data and tests required – As the investigation proceeds it will become clear that
there are gaps in the analysis or data available which, if filled in, would produce a basis for a
firm conclusion relative to likelihood of the postulated failure mode being the cause of the
observed failure. The estimated completion of those additional investigations will be entered so
that the team objectives are understood and timely input is maintained. The charts shall be
updated when additional data are made available, prior entries are deleted (lined through) and the
results entered in either the supporting or refuting data columns.
There is a space on the chart where a simplified statement of the observed failure indication may
be entered. Other entries that may be used for summary notations are also provided. The failure
mode cause probability estimate should be stated in terms of ”not cause,” ”probable
contributor,” ”unlikely cause,” ”likely cause,” and ”root cause.” An indication as to whether
corrective action is required should be entered together with any conclusive statements
considered desirable.
FAILURE INDICATION: CAUSE PROBABILITY ESTIMATE:
SPECULATION EVALUATION
FAILURE
MODE
FAILURE SEQUENCE SUPPORTING
DATA
REFUTING
DATA
ADD’L TEST DATA
REQUIRED
CORRECTIVE ACTION: NONE REQUIRED CONCLUSION: (CHECK ONE)
Figure 1 – Root Cause Analysis Chart
FAILURE INDICATION: Enter Brief Statement CAUSE PROBABILITY ESTIMATE: Used during
of failure indication early stages to indicate cause probability when little
is known about the failure
Figure 2 is a root cause analysis chart with instructions for making entries where appropriate.
Since the instructional entries are included, this root cause analysis chart instruction format can

Ahmed Bassyouni Page 5
be provided as a ”handout” to root cause team members to help them understand the intent of the
root cause analysis chart.
SPECULATION EVALUATION
FAILURE MODE FAILURE
SEQUENCE
SUPPORTING DATA REFUTING DATA ADD’L TEST DATA
REQUIRED
List all possible
modes of failure.
Mode is defined as the
basic cause of the
observed failure.
Failure is defined as
the inability of the
system, sub-system
component or part to
perform its required
function. The
descriptions chosen
should be specific.
List only mode per
page.
List all conceivable
mechanisms which
could cause the
failure mode to
occur. There may be
several mechanisms
that could cause a
given failure mode to
occur.
Enter all data which
support the postulated
mode and sequences.
Each entry should be
numbered to agree
with the failure
sequence entry it
supports.
Enter all data which
refute the postulated
mode and sequences.
Each entry should be
numbered to agree with
the failure sequence
entry it supports.
(There may be
supporting and refuting
entries for each mode
and sequence.
As a result of entries in any
of the columns, enter
specific description of
what facts or data must be
collected to complete the
problem solving process.
CORRECTIVE ACTION: NONE REQUIRED- List the steps or measures CONCLUSION: Enter Final estimate of the (CHECK ONE) that can be taken to prevent cause probability and summary statements
a failure in this mode, e.g. based on the content of each mode analysis.
Design Change, Add’l
Quality Control, Test
Operations, etc.
Figure 2- Root Cause Analysis Chart Instruction Format
Figure 3 is a root cause worksheet. Since the root cause analysis chart is cramped for space,
thereby requiring effective summarization of key points, a worksheet has proved helpful to the

Ahmed Bassyouni Page 6
individual investigators for whom summarization is not easy. By providing more space for
supporting and refuting data, the investigator can write a complete thought for the use of other
members of the team. Summarization of those thoughts for entry into the root cause analysis
chart can be accomplished later by the subteam or team leader.
FAILURE INDICATION: FAILURE MODE AND
SEQUENCE:
ADDITIONAL DATA TESTS
REQUIRED:
SUPPORTING DATA REFUTING DATA
CAUSE PROBABILITY ESTIMATE
CONCLUSION
Figure 3 – Root Cause Worksheet
The root cause analysis chart format fulfills several significant purposes:
a) Provides a prompt overview of the status of any point during the failure analysis process. This
is valuable to the team and to management.
b) Describes and plans follow–on activity required to complete the analysis.
c) Provides an auditable review record in the simplest terms.
d) Concisely presents the balance between confirming and refuting data upon which
determinations are based.
e) When the root cause is identified, the information on the format explicitly describes the failure
process and demonstrates that other causes are eliminated from contention.
This technique requires discipline to produce solutions. It takes patience and discipline at all
levels of management to allow the analysis team to do the thorough diagnostic job that is
required. The saying ‘do it right’ the first time and you will not have to do it again” continues to
hold true. The tool has been described. The techniques for its use and realizing its full utility now
need to be discussed.
3. Organizing Root Cause Team
The ability to identify what problems require what magnitude of effort is obtained through

Ahmed Bassyouni Page 7
experience however and some ideas to assist in this area will be presented in this section.
Figure 4 presents a typical block diagram of an ad hoc root cause analysis organization. The ad
hoc team approach is shown because it represents an organization appropriate for the
investigation of the most difficult types of failures, i.e., those where the data base is small, the
known facts are few, the areas of possibility are many, and the time to reach a total
understanding is expected to be more than 2 months. After the initial failure modes are listed on
the root cause analysis chart and the initial failure data are reviewed, it is generally apparent
what type and magnitude of organization is necessary. Simplifications of this basic organization
are obvious.
Figure 4 – Typical Block Diagram of Ad Hoc Root Cause Organization
When a problem is of such magnitude as to require long term involvement of personnel from
several major organizations, it may prove beneficial to have an understanding at the highest
levels of those organizations so that the support required and provided will be the type and
RCA
RELIABILITY
ENGINEERS
ROOT CAUSE
TEAM LEADER
EXECUTIVE
SECRETARY
SUPPORT STAFF
(OPTIONAL)
TASK TEAM
ELECTRICAL
TASK TEAM
MECHANICAL
TASK TEAM
INSTRUMENTATION
TECHNICAL
SPECIALIST
SUPPORT
Ahmed Bassyouni Page 8
quality needed and will be continuous. Customers, sub–contractors and consultants may also be
involved. A charter of operations prepared by the primary organization and signed by the heads
of the supporting organizations and the root cause team leader can prepare an effective and
efficient analysis.
Factors to be presented in a charter of operations are:
a) A brief statement of the problem
b) A statement of the significance of the problem
c) Designation of the root cause team leader
d) Designation of the site for the team’s operations
e) Definition of the support required of each supporting organization; names of specific
individuals, if practicable
f) Best estimate of the duration of the investigation.
The root cause team leader should have the drive to keep the analysis on course with as high a
rate of progress. Some of the techniques used by team leaders are discussed in subsequent
sections.
The root cause team leader will perform the following functions:
a) Direct and control the activities of the team
b) Prepare the ad hoc team charter if required
c) Arrange for the team staffing
d) Describe the root–cause analysis technique using this reference of a typical example for the
problem under study.
e) Establish task teams
f) Distribute RCA charts to task teams
g) Assure that assignment due dates are met
h) Prepare cost estimates and authorizations for management as required
i) Arrange for technical specialist support as necessary
j) Arrange for red team or blue ribbon panel reviews if the problem warrants that magnitude of
independent review.
Each team should have an executive secretary whose duties should include the following:
a) Prepare listing of participants with addresses and phone numbers
b) Arrange meetings

Ahmed Bassyouni Page 9
c) Assure preparation of minutes of meetings
d) Distribute minutes, reports, and data to the team members
e) Prepare and update the root cause analysis chart and report
f) Maintain a chronological file of all material to serve as a reference information bank and allow
the various task teams to acquire data without slowing up other teams. This can be very
important because the regular cross–feeding of information among the task teams speeds up the
analysis process.
g) Summarize the findings of the various task teams and issue interim data to the teams
h) Prepare visual aids of briefings, conferences, etc.
i) Direct the preparation of the final report of root cause.
The executive secretary will require secretarial support as a minimum and additional support will
be dependent upon the magnitude of the problem under study and the size of the group.
The task teams may consist of one or more, with a given area of expertise to evaluate the
available data ant develop supporting ant refuting data for the root cause analysis chart on those
failure modes that are within their area of expertise. The task teams will also determine what
additional data are required to resolve each failure mode. They should arrange or perform the
necessary analyses or tests to be conducted and write individual fact sheet reports on their
findings.
The task teams may add to the failure modes list as the investigation provides new insights.
Failure modes, once stated, cannot be arbitrarily deleted.
Technical specialist support of the activities may be necessary to perform specific analyses or
tests.
Task team leaders should perform the following functions in conjunction with team members:
a) Present established facts describing the problem
b) Assist in listing” failure modes”
c) Complete” failure sequence” on root cause analysis charts
d) Fill in ” supporting data” and ”refuting data” columns on root cause analysis charts
e) Develop follow–on activities test and analysis requirements with due dates
f) Obtain support of technical specialists as necessary
g) Provide data outputs and findings to root cause team leader and other task teams –
h) Iteratively update RCA in assigning probability estimates for each failure mode.
Consultants of reliability engineering panel shall bring widely recognized expertise to the
analysis critique. They perform the following functions in support of a root cause analysis:
a) Independently critique the facts ant approach taken by the team at periodic intervals after the
root cause is determined
b) Review the root cause findings
c) Provide guidance on possible approaches not accounted for by the team
d) Issue a written report of the findings (which may be appended to the root cause final report).
From the root cause analysis flow diagram shown in Figure 5, it is clear that the ultimate
definition of the root cause may occasionally occur after a cursory review; however, the bulk of
Ahmed Bassyouni Page 10
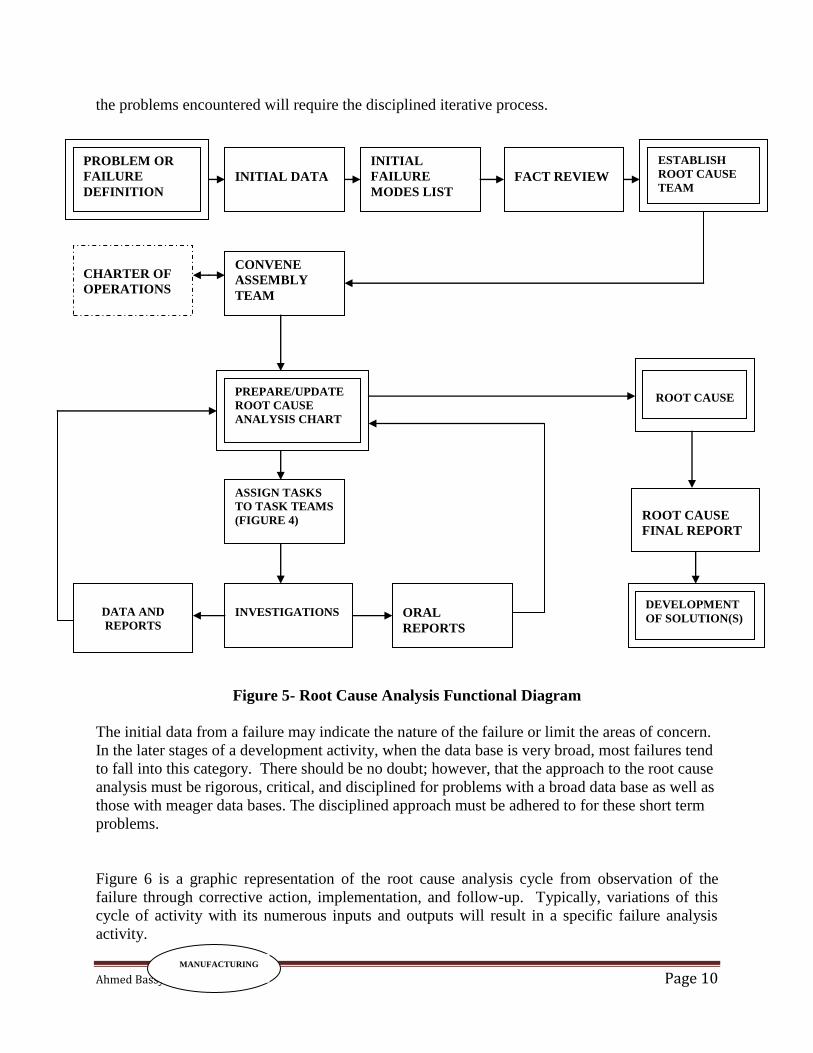
the problems encountered will require the disciplined iterative process.
Figure 5- Root Cause Analysis Functional Diagram
The initial data from a failure may indicate the nature of the failure or limit the areas of concern.
In the later stages of a development activity, when the data base is very broad, most failures tend
to fall into this category. There should be no doubt; however, that the approach to the root cause
analysis must be rigorous, critical, and disciplined for problems with a broad data base as well as
those with meager data bases. The disciplined approach must be adhered to for these short term
problems.
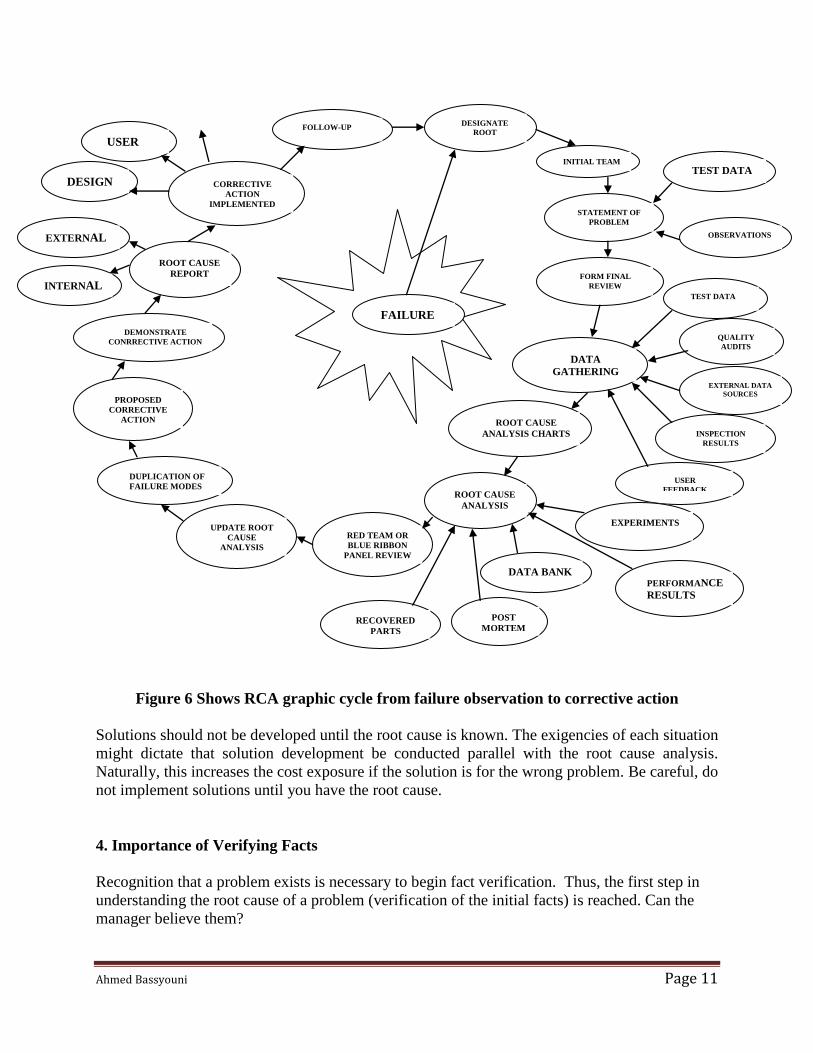
Figure 6 is a graphic representation of the root cause analysis cycle from observation of the
failure through corrective action, implementation, and follow-up. Typically, variations of this
cycle of activity with its numerous inputs and outputs will result in a specific failure analysis
activity.
PROBLEM OR
FAILURE
DEFINITION
INITIAL DATA
ASSIGN TASKS
TO TASK TEAMS
(FIGURE 4)
ORAL
REPORTS
INVESTIGATIONS
DATA AND
REPORTS
FACT REVIEW
CHARTER OF
OPERATIONS
INITIAL
FAILURE
MODES LIST
ESTABLISH
ROOT CAUSE
TEAM
CONVENE
ASSEMBLY
TEAM
ROOT CAUSE
ROOT CAUSE
FINAL REPORT
PREPARE/UPDATE
ROOT CAUSE
ANALYSIS CHART
DEVELOPMENT
OF SOLUTION(S)
MANUFACTURING
Ahmed Bassyouni Page 11
Figure 6 Shows RCA graphic cycle from failure observation to corrective action
Solutions should not be developed until the root cause is known. The exigencies of each situation
might dictate that solution development be conducted parallel with the root cause analysis.
Naturally, this increases the cost exposure if the solution is for the wrong problem. Be careful, do
not implement solutions until you have the root cause.
4. Importance of Verifying Facts
Recognition that a problem exists is necessary to begin fact verification. Thus, the first step in
understanding the root cause of a problem (verification of the initial facts) is reached. Can the
manager believe them?
USER
FOLLOW-UP
DESIGN
FORM FINAL
REVIEW
DESIGNATE
ROOT
CAUSE MGR.
DATA
GATHERING
EXTERNAL
ROOT CAUSE
REPORT
DUPLICATION OF
FAILURE MODES
DEMONSTRATE
CONRRECTIVE ACTION
PROPOSED
CORRECTIVE
ACTION
INTERNAL
UPDATE ROOT
CAUSE
ANALYSIS
CHARTS
FAILURE
RED TEAM OR
BLUE RIBBON
PANEL REVIEW
ROOT CAUSE
ANALYSIS
ROOT CAUSE
ANALYSIS CHARTS
INITIAL TEAM
STATEMENT OF
PROBLEM
TEST DATA
OBSERVATIONS
TEST DATA
QUALITY
AUDITS
EXTERNAL DATA
SOURCES
USER
FEEDBACK
EXPERIMENTS
RECOVERED
PARTS ANALYISI
POST
MORTEM
DATA BANK PERFORMANCE
RESULTS
CORRECTIVE
ACTION
IMPLEMENTED
INSPECTION
RESULTS
Ahmed Bassyouni Page 12
It does not matter what the source of the data is (sales reports, instrumentation data, personnel
turnover, or the stated observations of individuals); it is necessary to challenge those facts as to
their validity. It is paramount for a manager or investigator to know the difference between the
facts available and the assumptions.
The sources of data useful in establishing facts relative to a failure are numerous. Some of the
data will be available within moments of the failure, while other data may take weeks to
assemble or develop. The following is a listing of some of the key sources of data:
a) Test data – Data taken on specifically measured performance parameters.
b) Telemetry data – Measurements of specific performance parameters of interest.
c) Preliminary test reports – A quick assessment of the test results generally available from the
test team in 2 to 3 days.
This report will normally provide the history of the test item at the test site and give the
conditions and timing of the test, in addition to initial data results.
Environmental test results– Often a test is preceded by imposition of required environmental
exposures to be expected during the normal life of the test item. Often the environment induced
(generally artificially) can produce the condition for failure. The records of the test facility,
conditions, and results are essential.
e) Compatibility tests – When an item under test is instrumented, data are taken to assure that the
instrumentation has no effect on the item performance and, conversely, that the item under test
produces no unwanted feedback into the recording system.
f) Preflight test results – Generally there are checkout tests run on the item prior to the actual test
to assure that the item is performing prior to test and to verify that all of the instrumentation
systems are functioning normally. The data from these tests can produce interesting facts about
the validity of the test at its initiation.
Generally, these are the type data that must be verified before a valid statement of the problem
can be made. Some considerations for establishing the validity of the data involved in a problem
are presented in the following paragraphs.
In some cases it may be necessary to conduct specific experiments to establish the accuracy of
data from a given source. Competent test activities establish these values and document them as
a matter of record. When the application is special, the data accuracy should be a matter of
specific note. Where computer simulations of the item under test are available, a particularly
valuable verification capability exists. It is possible with this tool to put recorded performance
into the simulator to see if the resulting simulation produces the same results as did the item
under test.
Some of the sources of–data are as follows:
1) Manufacturing records
2) Assembly instructions
3) Inspection data
4) Quality assurance data
5) Reject reports
6) Waivers and deviations

Ahmed Bassyouni Page 13
7) Critical component data
8) Laboratory simulations
9) Previous test reports
10) Historical failure summaries
11) Failure history data banks.
Although the preceding list is not all inclusive, it serves to show that there are many sources of
applicable data that may provide insights and facts when performing a root cause analysis.
Use verified data from all available sources. Take steps to verify all data used as rapidly as
possible. Be sure to record assumptions and unverified data as they are, so that they do not
become confused with facts. Do not discard data as invalid without proving that the data are
incorrect. Data are always communicating with us: it shouts, it whispers, and one must be alert
and perceptive enough to recognize its message.
5. Root Cause Team Management
How often have you participated in a trouble shooting team to solve a technical problem?
How many times have you been selected to lead a trouble shooting team? Analysis of faults in
today’s technology environment is becoming much more complex.
Figure 7 – Root Cause Analysis Accuracy Diagram
6. Conclusion
Root cause analysis is a systematic technique for the attack and positive resolution of such
problems. The proposed RCA technique is a proven one that could be applied to Joy Global
mining machines. Because of the lack of firm failure event data, it is often prohibitive from a
cost/time standpoint to establish the root cause based on that one event. In such cases, it has
proven effective to address the “most probable” modes of failure on subsequent tests, being alert
to any indications that would resolve the problem to its root cause.

Ahmed Bassyouni Page 14