
Comparison of data science workflows for root cause analysis ...
Upload
khangminh22Category
view
4download
0
sustainability
Article
Root Cause Analysis in Post Project Phasesas Application of Knowledge Management
Radek Doskocil 1,* and Branislav Lacko 2
1 Department of Informatics, Faculty of Business and Management, Brno University of Technology,Kolejní 2906/4, 612 00 Brno, Czech Republic
2 Institute of Automation and Computer Science, Faculty of Mechanical Engineering,Brno University of Technology, Technická 2896/2, 616 69 Brno, Czech Republic, [email protected]
* Correspondence: [email protected]; Tel.: +420-541-143-722
Received: 20 February 2019; Accepted: 17 March 2019; Published: 19 March 2019�����������������
Abstract: This paper is focused on the root cause analysis of post project phases. The research has beenlinked to the identification of the 21 most common reasons for not executing post project phases.The main aim of this paper is to identify the root causes of not executing selected post projectphases. The empirical research was performed as qualitative research employing the observationand inquiry methods in the form of a controlled semi-structured interview. The research wasrealised in the Czech Republic in 2017 and 2018. The key performances for ensuring a functional,effective and systematic post project process are based on the principles of knowledge management.The identified causes were used as inputs for the proposed measures with the aim to make the postproject process more effective. The main contribution of the paper is the overview of techniquesthat may be recommended for post project analysis. These techniques are demonstrated in detailon particular examples of the analysis of the most common reasons for failure to implement postproject phases. The described examples demonstrate the procedure to be followed in order to identifythe root cause of the analysed phenomenon. At the same time, the paper also describes proposalsof recommended measures that should minimize the root causes resulting in negative outcomes.The paper explicitly emphasizes and shows the connection between knowledge management and postproject phase effectiveness.
Keywords: project management; knowledge management; post project phases; root cause analysis;complex project management; Pareto analysis; 5 Whys method; Ishikawa diagram; Tree diagram
1. Introduction
The Agenda for Sustainable Development, adopted by the United Nations General Assemblyin 2015, introduced a new coherent way of thinking concerning the connection between the issuesconcerning 17 Sustainable Development Goals (SDGs) as an “indivisible whole.” These ambitiousgoals can be achieved (among other things), especially and just by using the knowledge managementand project management principles [1,2]. In their article, Nilsson, Griggs and Visbeck point outthat the creators of the global sustainable development projects lack tools to determine which goalinteractions are the most significant with regard to the solutions of current problems [3,4]. The authorsof this paper believe that apart from the information in the SDG material of the International Councilfor Science, high quality execution of post project phases of implemented sustainability projects maybe very helpful.
The paper elaborates on previous research of the authors focused on identification of criticalsuccess factors of sustainability projects. In particular, it follows from the 21 reasons for failure of postproject phase implementation in project practice identified earlier. The main objective of the paper is
Sustainability 2019, 11, 1667; doi:10.3390/su11061667 www.mdpi.com/journal/sustainability

Sustainability 2019, 11, 1667 2 of 15
to identify the most significant root causes of selected reasons for post project phase implementationfailure by means of Root Cause Analysis (RCA) and to propose measures and recommendations inorder to increase efficiency of post project stage execution, directly based on the results of the conductedresearch [5].
The issue of sustainability is not often solved from the point of view of project management inthe Czech Republic (see the research of IPMA Czech Republic [6]) what is a mistake. Therefore the authorswelcome that the Sustainability journal dedicated this topic to the special issue (Applications of SystemEngineering Approaches in Complex Project Management) and realizes that sustainability needs to besolved through project management.
It is very important for project teams to pay attention to the post project phases, as these,among the other things, reduce the percentage of unsuccessful projects. Researches show (see Section 2)that there is still high percentage of unsuccessful projects, including sustainability projects.
It is necessary to realize that in a concrete company, which implements projects for example,the development of its products, will be interested in the implementation of the post project analysis.Qualified company management will demand and organize post project phases.
The situation is very different for sustainability projects that are being implemented indifferent locations with different focus and especially with a great variety of project stakeholders.As a consequence, the post project analyses are not carried out, funded and required.
2. Literature Review
Post project stages constitute full project management processes. However, research ofrenowned companies (The Standish Group, EY-Ernst & Young, etc.) focused on project successshow unsatisfactory results [7]. The aggregate results of EY in project management forthe Czech Republic in 2017 present the following key conclusions. In terms of areas, the mostfrequently executed projects include IT modernization (54%), new product development or launch (32%),process restructuralization/reorganization projects (29%) and cost reduction projects (24%). In terms ofproject evaluation according to the basic factors of time and costs, 41% of the projects were completedafter the scheduled deadline and with exceeded budget, while 61% of the projects exceeded the allocatedbudget by EUR 100,000. In general the ratio of large projects has been increasing, which probably alsomeans an increased risk of failure. Nearly half of the projects valued EUR 40,000 to EUR 100,000 exceedthe budget, deadline or get cancelled. The research also states that two of the three main reasons forproject failure are insufficient company top management support and insufficient management of projectrisks. However, both factors are fully under control of the management, that is, they may be directlyinfluenced by the management. The issue of project priority definition is also evaluated negatively.There are no priorities defined for about 20% of the projects or the priority determination process isnon-transparent. Moreover, the project teams focus mostly on project phases within the project lifecycle, they pay less attention to pre-project phases and they mostly ignore the post project phases [8].Due to the lack of concrete statistical studies for sustainability projects, were used at least publishedstatistical studies for commercial projects to justify the problem. Considering that sustainability projectsare very complex and problematic, it can be assumed that the results of statistical studies will be evenworse in relation to commercial projects. Unfortunately, the research we have available does not havethe sustainability category as an explicit category. Which is the weakness of these researches. In addition,there are other characteristics that should be monitored in these researches. On the IPMA Czech Republicconferences [9] are the results of the research regularly presented and discussed. Sustainability projectswere also identified as part of these discussions.
Inspiration for the use of KM in post project phases can be also found in CMMI. The CapabilityMaturity Model Integration (CMMI) model [10] posits systematic improvement of all managementprocesses from 3rd level for project management. Explicitly so at the 5th level. Correct use of knowledgemanagement plays an important role in the improvement [11–13]. The issue of analysing the causal linkof cause—effect needs to be mastered in particular [14]. The CMMI model is very practical and easy to

Sustainability 2019, 11, 1667 3 of 15
understand. There are defined characteristics for each maturity level that the processes need to meet(for more details see [10]). A brief description of the respective process maturity levels is given below:
0. Non-existent management: Processes and their management are completely chaotic.1. Initial: Processes are executed ad hoc.2. Repeatable: There is a certain level of discipline necessary for the execution of basic
repeatable processes.3. Defined: Processes of the organization are documented.4. Managed: Processes are managed and their performance is measured using Key Performance
Indicators (KPIs).5. Optimized: Processes are constantly improved, there is a process and management
innovation cycle.
If we consider the fact that sustainable development is one of the key issues of human societypreservation on this planet, we naturally conclude these problems need to be solved systematicallyand professionally. Application of project management principles seems effective and efficient [15].In their research, Harich, Bangerter and Durlacher present the results of a seven-year-long root causeanalysis for solving extensive social system problems, such as sustainability. For this type of problem,they proposed a formal solution process and identified four main sub-problems. For each sub-problem,they identified and analysed the root causes, including proposed measures to minimize them [16].
As one reaction to the increasingly frequent problem of non-compliance with project schedules(project delays), Ansah and Sorooshian proposed the 4P concept (project, practices, participants,procurement) for identification, analysis and classification of delays in the internal environment ofthe project development process in the construction industry. They state that the application ofthe proposed 4P concept would allow identification of key reasons for delays, their risks and use forproject delay assessment and classification. They emphasize that the project delay issue is generallydiscussed separately; however, a comprehensive framework for systematic analysis of delays ofcompleted projects is rarely applied [17].
In his research, Rongfa focused on quality management in software projects. He observed thatcausal analysis plays an important role in this area. He discussed possible use of the decision treemethod for classification of causes (problems) related to software project quality. Using the Ishikawadiagram method, he designed a method for root cause classification and identification in variouscategories. Furthermore, he pointed out a new research area related to the issue of machine learningintegration in the process of software project quality management in order to increase its efficiency [18].
In their research, Usman and Rendy presented the use of RCA in solving project problemsand risks in the construction industry. They observed the application of this approach has a positiveimpact on the project planning process in the context of Critical Chain Project Management [19].
In their research, Lakshman, Kannan and Bhojraj presented the application of the RCA method inthe context of the DMAIC methodology (Define, Measure, Analyse, Improve, Control) with the aimto identify the causes of deviations between plan and reality in a spacecraft development project.Within the practical approach, they worked with three key RCA methods: “Why-Why” Technique,Cause and Effect Analysis and Pareto Analysis. These techniques were described extensively inorder to promote their application in all crucial project management areas, including post projectphases. The authors also state there is a long-term and common goal in the space industry toidentify the factors with negative effects on project progress. Current research in this field shows thattraditional methods, such as the Critical Path Method (CPM) [20]), are not sufficient for successfulproject management and attention must also be paid to utilization of knowledge management forproject improvement. Critical factors of project success are even related for example, to multi-projectenvironment, shared project resources and so forth but the sustainability projects are executed in globalmulti-project environment these days [21].

Sustainability 2019, 11, 1667 4 of 15
The area of knowledge management is usually described in terms of “generations.” First generationthought of knowledge as an object and it was focused on the use of IT/ICT (explicit knowledge).For example in the empirical research, the author Erkut focuses on the enterprise resource planning (ERP)software market. Author solved the research question of whether the emergence of the ERP marketwas a necessary, strong or weak consequence of the product innovation of Systems, Applications &Products in Data Processing (SAP). The author’s results confirmed that the emergence of the ERP softwaremarket is contingent and was not predetermined; path dependencies play a big role in the way how thismarket segment emerged [22]. Second generation was focused on the people and organisations (tacitknowledge and communities). Third generation recognised the importance of contextual contingenciesand influences in aligning knowledge management strategies with business strategies. In their research,Handzic and Durmic presented a new conceptual model that merges knowledge management with projectmanagement. The model advocates the need for convergence between knowledge management and otherdisciplines. This is the nowadays trend in knowledge management, called “new fourth generation” [23].This topic is solved by the authors Handzic and Bassi too. They presented novel theoretical approachesand clear empirical evidence of the value of integrating the two distinct fields—project managementand knowledge management. In their research they help practitioners develop more suitable knowledgemanagement solutions for successful project [24].
3. Materials and Methods
The methodology applied in research is based on the fundamental principles of scientificand research work. The selected scientific and research methods are based on a predefined research goal.Principles of system methodology combining system approach, system thinking, system disciplinesand system algorithms were applied to the solution of a scientific problem. These principles wereapplied in the context of general management theory with focus on post project phases.
The method of secondary analysis of relevant data was applied to analyse the current state ofthe solved issue. The application method was the process of retrieving and processing secondary data,where the new data and information were obtained from the original data an information. The sourcefor formulating the theoretical framework of the problem were articles published in scientific journalsand conference papers. Another important sources were experiences from the field among projectmanagers and project team members.
During the empirical part elaboration with the aim to obtain primary data, qualitative researchmethods were used in the form of semi-structured interviews. This identified 21 reasons fornon-implementation of the project phase (primary data). The empirical research respondents weremostly employees of small and medium-sized enterprises from various industrial fields operating inthe Czech Republic. The most common fields included engineering, construction, electrical engineering,power engineering, IT/ICT. At the same time, these respondents were attending courses focused onproject management. Large enterprises are usually owned by foreign parent companies that oftenorganize their own internal project management trainings and courses and therefore they usually donot send their employees to external courses. Courses focused on project planning and managementcovered knowledge defined for level D (the lowest level of certification) of IPMA competence [25–27].Training had the form of company and public courses “open” to entrepreneurs from all overthe Czech Republic. The total number of respondents was 150. 100 respondents were project teamleaders (PTL). The remaining 50 respondents held various project team member roles.
The obtained data were subjected to RCA [28] in order to identify the root causes of selectedreasons for failure to implement post project phases. The root cause analysis was performed bythe research team of Brno University of Technology consisting of experts in project management whohave been teaching project management courses in companies and are well familiar with team researchwork and the described methods. Application of RCA was the main approach for solving the definedresearch goal. It was applied in the context of system methodology principles to identify all possiblerelations, if it is possible. [29].

Sustainability 2019, 11, 1667 5 of 15
System approach to RCA represented process execution consisting of the following steps:
1) Initiation—determination of the need, purpose and scope of RCA validity.2) Establishing Facts—establishing facts concerning what, where, when and with whom happened.
Pareto Analysis was used in this stage.3) Analysis and Validation—establishing causes and ways of fact manifestation and their validation.
The Ishikawa diagram method, the “5 Whys” method and the Cause tree method was used forthe root cause analysis.
4) Presentation of results—proposal of recommended measures focused on identified root causes.
Pareto diagram is an important tool for managerial decision making. It allows to penetratethe essence of phenomena. It helps to separate the key factors of solved problem from the lesssignificant ones. It also helps to identify the main causes of the problems. Thanks graphicallypresentation is very useful tool for prioritizing of corrective measures. This diagram is named aftereconomist and sociologist Vilfredo Pareto. He described the uneven effect of distributing wealth.His conclusion was that the distribution of income and wealth is asymmetric, because only a smallgroup of people in the country controls most of the property. Based on research from differentcountries, the result is that approximately 80% of wealth is managed by about 20% of the country’spopulation. This rule was put into practice by Joseph Moses Juran, who dealt with quality management.He applied the idea to industry. He defined that about 80% of production shutdowns are causedby 20% of the machines of a particular industrial building. Has generalized this phenomenon tothe statement which is called Pareto Rule nowadays. Pareto diagrams are basically histograms thatshow the distribution of problems into several meaningful categories. These categories are usuallyranked in decreasing order of importance. It is possible to identified which of the causes are the mostrelevant in the solved problem thanks this diagram [28].
Ishikawa diagram is a technique that helps to identify, analyse and present possible causesof significant problems. This technique was invented by Kaoru Ishikawa. It presents graphicallythe relationship between events and all factors. This technique is also called Fishbone Diagram becauseit looks like it [30].
“5 Whys” Method is an iterative interrogative technique used to explore the cause-and-effectrelationships underlying a particular problem. The main aim of the technique is to determine the rootcause of a defect or problem by repeating the question “why”? Each answer forms the basis of the nextquestion. The number 5 in the name derives from an anecdotal observation on the number of iterationsneeded to resolve the problem [31].
Causes tree method is the approach which used deductive logic and intends to makethe construction of the trees and the logic easier to apply. The basic principle of the method isthat an accident results from changes or variations in the normal process. The expert must identifythe changes in the system, list the changes, organize them into the tree diagram and define theirrelationships [28].
4. Results
This section presents the results of RCA. As initiation of the analysis of causes of post project phaseimplementation failure (significant event in terms of causal analysis defined), the identified 21 reasonsfor failure of post project phase implementation were first logically classified in four generally used 4Pcategories: place, procedures, people, policies. The classification results are summarized in Table 1.The classification could be different because the 4P method does not exactly define the content ofthe categories. The decisive criterion for inclusion in the relevant category was always consideringthe nature of the individual problems of non-post project phases. The classification has provided initialpredictors of possible causes in the four defined categories.

Sustainability 2019, 11, 1667 6 of 15
Table 1. Classification of 21 reasons why companies fail to process post project phases using 4P methods(Source: processed by the authors).
Place Procedures People Policies
13. Because its needand existence are essentially
denied or ignored.(This belongs to “quality,”
not to “projects.”)
7. People don’t know how toperform it practically so they
prefer not to do it.
1. Excited by the success ofa completed project,
the workers start to feel thereis no need to analyse or
improve anything.
3. Under the load of moreand more new projects
and everyday issues, there isno time for such analysis
21. The current time isVUCA (Volatile, Uncertain,
Complex, Ambiguous).Therefore, it makes no senseto prepare for anything by
analysing the past.Everything will be different
and nothing can bepredicted and no past
experience can be used.
9. Unlike the project execution,it is often not explicitly required.
So it is not done.
2. Devastated by the projectfailure, the project participantsand all the stakeholders try to
forget the project as fastas possible
4. Since any possible “easyand possible financial savings”are made in the already tight
project budgets, the postimplementation analysis is
usually one of them so it is noteven planned.
10. The project team does notwant to point out mistakes theyhave made (why would they?)and pointing out success, on
the other hand, isconsidered boasting.
12. The analytical teams arerepeatedly comprised of
incompetent staff members, sothe results do not correspondto the expended resources or
time and the analysisis cancelled.
5. Such a thing is consideredunnecessary ponderingand an obstruction to
proper work.
11. Since the workers do itwrong, the results are not
satisfactory, so after some time,the activity is discontinued
due to “inefficiency.”
15. In the Czech Republic,many people consider
themselves to be very smartand believe they do everythingright and don’t need to learn
anything anymore.
6. There is a worry amongthe project team members that
even well-intended, (self-)critical conclusions may turn
against them (e.g., reduction ofproject remuneration).
16. There are still many peoplewho remember a document
titled “Lessons Learntfrom Critical Development...”
that did not bring success to itsauthors! (Generation-specific
and Czech-specific reason)
17. In the chaos and hurry ofeveryday work on the project,
it simply gets forgotten.
8. The analysis was done oncebut the recommendationswere put aside ad acta, sothe whole thing inevitably
seemed to have been a wasteof time and considerable
efforts and so nobody wants torisk needless work.
19. There is no projectdocumentation, sometimes there
are no project participantsanymore, so the question is
what in particular should beresponsibly analysed?
18. A lot of people often refuseto look back; they only want to
look ahead—A commonattitude of many young
people. (There is not so muchtime in their past
but a relatively long time intheir future.)
14. Most companies lacka system of company
experience accumulation, so itis not required for projects
either. (Must be required bycompany top management.)
20. A number of projectmanagement methodology
materials still do not mentionthese phases, as well
as pre-project phases and focussolely on immediate project
management, from startto completion.
Note: The 21 identified causes were serially numbered.
At the first sight, the analysis shows that the majority of causes of failure to implement postproject phases are related to the categories of procedures, people and policies. Thus the root causesmust be related to the problems of project management (procedures), human resources management(people) and company management (policies).
Due to the relatively high number of identified root causes (see Table 1), significant causes had tobe separated from the less significant ones. Pareto Analysis was used for this purpose (see Table 2) [32].

Sustainability 2019, 11, 1667 7 of 15
Table 2. The results of Pareto analysis (Source: processed by the authors).
No. Reasons Frequency RelativeFrequency
CumulativeFrequency
7 People don’t know how to perform it practically so they prefernot to do it. 146 146 10%
13 Because its need and existence are essentially denied or ignored.(This belongs to “quality,” not to “projects.”) 143 289 20%
12The analytical teams are repeatedly comprised of incompetentstaff members, so the results do not correspond to the expendedresources or time and the analysis is cancelled.
116 405 28%
8
The analysis was done once but the recommendations were putaside ad acta, so the whole thing inevitably seemed to have beena waste of time and considerable efforts and so nobody wants torisk needless work.
111 516 35%
3 Under the load of more and more new projects and everydayissues, there is no time for such an analysis. 106 622 43%
11Since the workers do it wrong, the results are not satisfactory,so after some time, the activity is discontinueddue to “inefficiency.”
104 726 50%
14Most companies lack a system of company experienceaccumulation, so it is not required for projects either. (Must berequired by company top management.)
101 827 57%
20
A number of project management methodology materials still donot mention these phases, as well as pre-project phases and focussolely on immediate project management, from startto completion.
98 925 63%
4Since any possible “easy and possible financial savings” are madein the already tight project budgets, the post implementationanalysis is usually one of them so it is not even planned.
69 994 68%
6There is a worry among the project team members that evenwell-intended, (self-) critical conclusions may turn against them(e.g., reduction of project remuneration).
57 1051 72%
5 Such a thing is considered unnecessary ponderingand obstruction to proper work. 56 1107 76%
19There is no project documentation, sometimes there are no projectparticipants anymore, so the question is what in particular shouldbe responsibly analysed.
49 1156 79%
21
The current time is VUCA (Volatile, Uncertain,Complex, Ambiguous). Therefore, it makes no sense to preparefor anything by analysing the past. Everything will be differentand nothing can be predicted and no past experience can be used.
45 1201 82%
9 Unlike the project execution, it is often not explicitly required.So it is not done! 43 1244 85%
10The project team does not want to point out mistakes they havemade (why should they?) and pointing out success, on the otherhand, is considered boasting.
41 1285 88%
18A lot of people often refuse to look back, they only want to lookahead—Common attitude of many young people. (There is not somuch time in their past but a relatively long time in their future.)
37 1322 91%
15In the Czech Republic, many people consider themselves to bevery smart and believe they do everything right and don’t need tolearn anything anymore.
36 1358 93%
1 Excited by the success of a completed project, the workers start tofeel there is no need to analyse or improve anything. 32 1390 95%
2 Devastated by the project failure, the project participants and allthe stakeholders try to forget the project as fast as possible. 28 1418 97%
16
There are still many people who remember a document titled“Lessons Learnt from Critical Development...” that did not bringsuccess to its authors! (Generation-specificand Czech-specific reason)
26 1444 99%
17 In the chaos and hurry of everyday work on the project, it simplygets forgotten. 16 1460 100%

Sustainability 2019, 11, 1667 8 of 15
Graphic depiction of the Pareto Analysis results is given in the Pareto diagram (see Figure 1).It is a combination of a bar and line graph, which includes the Lorenz curve, depicting the increase(of the cumulative value) of the individual cause share in the whole.
Sustainability 2019, 11, x FOR PEER REVIEW 8 of 16
success to its authors! (Generation-specific and Czech-specific reason)
17 In the chaos and hurry of everyday work on the project, it simply gets forgotten.
16 1460 100%
Graphic depiction of the Pareto Analysis results is given in the Pareto diagram (see Figure 1). It is a combination of a bar and line graph, which includes the Lorenz curve, depicting the increase (of the cumulative value) of the individual cause share in the whole.
Figure 1. Pareto Chart of non-implementation of post project phases (Source: processed by the authors).
With the acceptance of the Pareto principle (80/20), the analysis shows that approximately 80% of all reasons for failure to implement post project phases are the following 12 reasons: Reason No. 7, 13, 12, 8, 3, 11, 14, 20, 4, 6, 5, 19 (for verbal cause description see Table 2). Out of the total 21 reasons, the above 12 reasons constitute approximately 20% of all reasons. With regard to the frequency value obtained from the respondents in the empirical research, the first two reasons with the highest frequency value were selected for root cause identification, that is, reason No. 7 and reason No. 13 (see subchapters 4.1 and 4.2).
4.1. Root Causes Analysis – Reason No. 7 Non-Implementation of Post Project Phases
For identification of root causes of reason No. 7 “People don’t know how to perform it practically so they prefer not to do it.“ First the Ishikawa diagram technique – Ishikawa diagram was used (see Figure 2). The chart was compiled by the research team of Brno University of Technology as a result of respondents’ answers. Initially, four main causes (Methods, Knowledge, Project Team, Organization) of the post project phase and lower level causes (e.g., Bad education organization) were identified for Reason No. 7. In the Ishikava diagram the causes at each level are equally important.
Figure 1. Pareto Chart of non-implementation of post project phases (Source: processed by the authors).
With the acceptance of the Pareto principle (80/20), the analysis shows that approximately 80% ofall reasons for failure to implement post project phases are the following 12 reasons: Reason No. 7,13, 12, 8, 3, 11, 14, 20, 4, 6, 5, 19 (for verbal cause description see Table 2). Out of the total 21 reasons,the above 12 reasons constitute approximately 20% of all reasons. With regard to the frequencyvalue obtained from the respondents in the empirical research, the first two reasons with the highestfrequency value were selected for root cause identification, that is, reason No. 7 and reason No. 13(see Seticons 4.1 and 4.2).
4.1. Root Causes Analysis—Reason No. 7 Non-Implementation of Post Project Phases
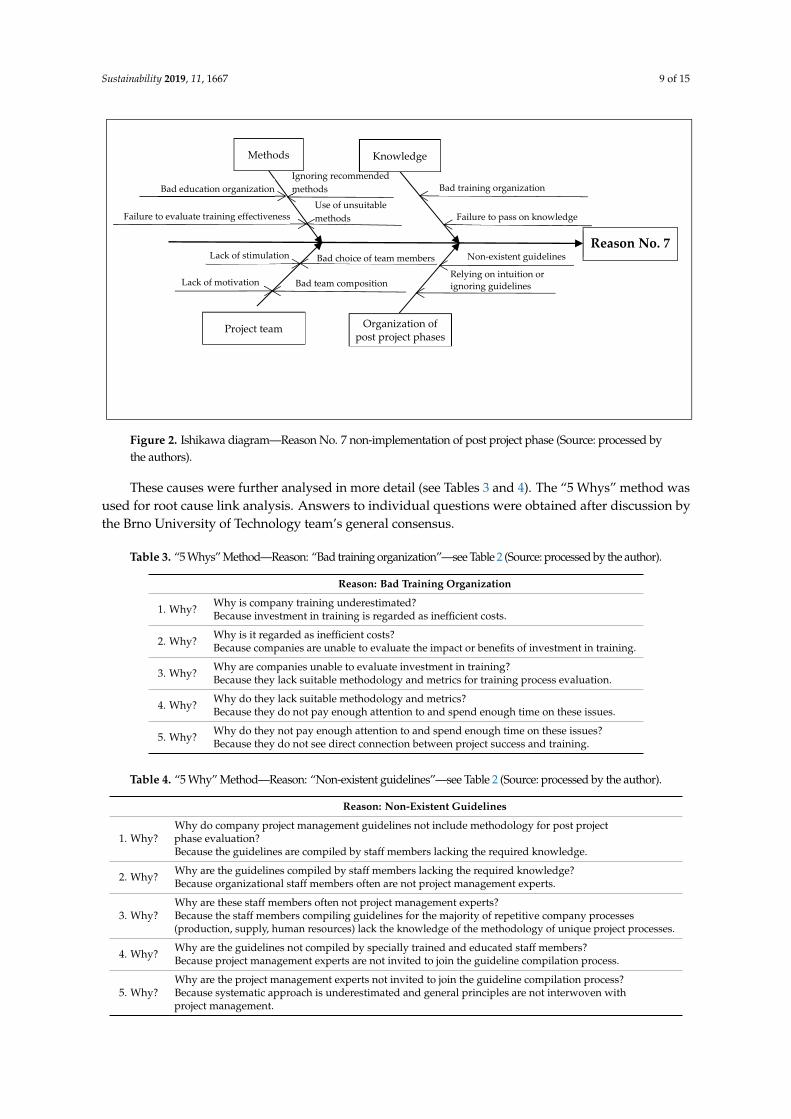
For identification of root causes of reason No. 7 “People don’t know how to perform it practicallyso they prefer not to do it.” First the Ishikawa diagram technique—Ishikawa diagram was used(see Figure 2). The chart was compiled by the research team of Brno University of Technology as a resultof respondents’ answers. Initially, four main causes (Methods, Knowledge, Project Team, Organization)of the post project phase and lower level causes (e.g., Bad education organization) were identified forReason No. 7. In the Ishikava diagram the causes at each level are equally important.
With the use of the Ishikawa diagram, a total of 15 causes (major and minor) were identifiedand graphically depicted. The Ishikawa diagram was evaluated for identification of cause priorities.The analytical team members evaluated the identified causes by the technique of pure final pointnumber allocation (total of 6 points). The results imply the most probably causes are “Bad trainingorganization” and “Non-existent guidelines.”
Sustainability 2019, 11, 1667 9 of 15Sustainability 2019, 11, x FOR PEER REVIEW 9 of 16
Figure 2. Ishikawa diagram – Reason No. 7 non-implementation of post project phase (Source: processed by the authors).
With the use of the Ishikawa diagram, a total of 15 causes (major and minor) were identified and graphically depicted. The Ishikawa diagram was evaluated for identification of cause priorities. The analytical team members evaluated the identified causes by the technique of pure final point number allocation (total of 6 points). The results imply the most probably causes are “Bad training organization” and “Non-existent guidelines.”
These causes were further analysed in more detail (see Table 3 and Table 4). The “5 Whys” method was used for root cause link analysis. Answers to individual questions were obtained after discussion by the Brno University of Technology team’s general consensus.
Table 3. “5 Whys” Method – Reason: “Bad training organization” – see Table 2 (Source: processed by the author).
Reason: Bad training organization
1. Why? Why is company training underestimated? Because investment in training is regarded as inefficient costs.
2. Why? Why is it regarded as inefficient costs? Because companies are unable to evaluate the impact or benefits of investment in training.
3. Why? Why are companies unable to evaluate investment in training? Because they lack suitable methodology and metrics for training process evaluation.
4. Why? Why do they lack suitable methodology and metrics? Because they do not pay enough attention to and spend enough time on these issues.
5. Why? Why do they not pay enough attention to and spend enough time on these issues? Because they do not see direct connection between project success and training.
Table 4. “5 Why” Method – Reason: “Non-existent guidelines” – see Table 2 (Source: processed by the author).
Reason: Non-existent guidelines
1. Why? Why do company project management guidelines not include methodology for post project phase evaluation? Because the guidelines are compiled by staff members lacking the required knowledge.
2. Why? Why are the guidelines compiled by staff members lacking the required knowledge? Because organizational staff members often are not project management experts.
3. Why? Why are these staff members often not project management experts?
Reason No. 7
Project team
Use of unsuitable methods
Ignoring recommended methods Bad training organization
Failure to pass on knowledge
Non-existent guidelines
Relying on intuition or ignoring guidelines
Bad choice of team members
Lack of motivation
Lack of stimulation
Bad education organization
Failure to evaluate training effectiveness
Organization of post project phases
Methods Knowledge
Bad team composition
Figure 2. Ishikawa diagram—Reason No. 7 non-implementation of post project phase (Source: processed bythe authors).
These causes were further analysed in more detail (see Tables 3 and 4). The “5 Whys” method wasused for root cause link analysis. Answers to individual questions were obtained after discussion bythe Brno University of Technology team’s general consensus.
Table 3. “5 Whys” Method—Reason: “Bad training organization”—see Table 2 (Source: processed by the author).
Reason: Bad Training Organization
1. Why? Why is company training underestimated?Because investment in training is regarded as inefficient costs.
2. Why? Why is it regarded as inefficient costs?Because companies are unable to evaluate the impact or benefits of investment in training.
3. Why? Why are companies unable to evaluate investment in training?Because they lack suitable methodology and metrics for training process evaluation.
4. Why? Why do they lack suitable methodology and metrics?Because they do not pay enough attention to and spend enough time on these issues.
5. Why? Why do they not pay enough attention to and spend enough time on these issues?Because they do not see direct connection between project success and training.
Table 4. “5 Why” Method—Reason: “Non-existent guidelines”—see Table 2 (Source: processed by the author).
Reason: Non-Existent Guidelines
1. Why?Why do company project management guidelines not include methodology for post projectphase evaluation?Because the guidelines are compiled by staff members lacking the required knowledge.
2. Why? Why are the guidelines compiled by staff members lacking the required knowledge?Because organizational staff members often are not project management experts.
3. Why?Why are these staff members often not project management experts?Because the staff members compiling guidelines for the majority of repetitive company processes(production, supply, human resources) lack the knowledge of the methodology of unique project processes.
4. Why? Why are the guidelines not compiled by specially trained and educated staff members?Because project management experts are not invited to join the guideline compilation process.
5. Why?Why are the project management experts not invited to join the guideline compilation process?Because systematic approach is underestimated and general principles are not interwoven withproject management.
Sustainability 2019, 11, 1667 10 of 15
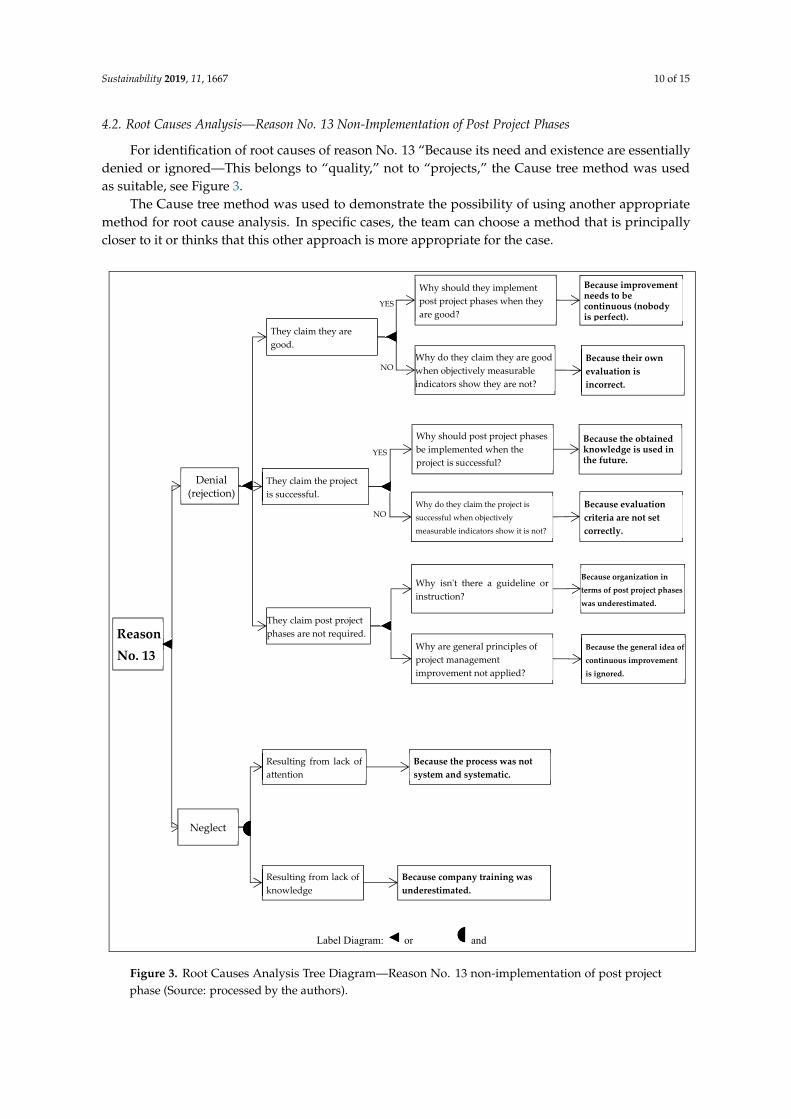
4.2. Root Causes Analysis—Reason No. 13 Non-Implementation of Post Project Phases
For identification of root causes of reason No. 13 “Because its need and existence are essentiallydenied or ignored—This belongs to “quality,” not to “projects,” the Cause tree method was usedas suitable, see Figure 3.
The Cause tree method was used to demonstrate the possibility of using another appropriatemethod for root cause analysis. In specific cases, the team can choose a method that is principallycloser to it or thinks that this other approach is more appropriate for the case.Sustainability 2019, 11, x FOR PEER REVIEW 11 of 16
Figure 3. Root Causes Analysis Tree Diagram – Reason No. 13 non-implementation of post project phase (Source: processed by the authors).
5. Discussion
It should be emphasized that the procedure and results presented in Chapter 4 (Results) are not based on “hard statistics” but rather constitute “soft processes,” which is more appropriate in this case. On the other hand, the results thus obtained can be used as general recommendations for most sustainability projects.
Table 2 and Figure 1 show the suitability and effectiveness of Pareto Analysis. It clearly shows the two reasons for failure to implement post project phases, that is, those that are most critical and should get primary attention (reason No. 7 and reason No. 13).
Figure 2, Table 3 and Table 4 show how the root causes of reason No. 7 “People don’t know how to perform it practically so they prefer not to do it“ may be gradually analysed and identified using
NO
YES
NO
YES
Reason No. 13
Denial (rejection)
They claim the project is successful.
They claim they are good.
Label Diagram: or and
Neglect
They claim post project phases are not required.
Resulting from lack of attention
Resulting from lack of knowledge
Why should they implement post project phases when they are good?
Why do they claim they are good when objectively measurable indicators show they are not?
Why should post project phases be implemented when the project is successful?
Why do they claim the project is successful when objectively measurable indicators show it is not?
Because their own evaluation is incorrect.
Because evaluation criteria are not set correctly.
Why isn't there a guideline or instruction?
Why are general principles of project management improvement not applied?
Because the process was not system and systematic.
Because company training was underestimated.
Because organization in terms of post project phases was underestimated.
Because improvement needs to be continuous (nobody is perfect).
Because the obtained knowledge is used in the future.
Because the general idea of continuous improvement is ignored.
Figure 3. Root Causes Analysis Tree Diagram—Reason No. 13 non-implementation of post projectphase (Source: processed by the authors).

Sustainability 2019, 11, 1667 11 of 15
5. Discussion
It should be emphasized that the procedure and results presented in Section 4 (Results) are notbased on “hard statistics” but rather constitute “soft processes,” which is more appropriate in thiscase. On the other hand, the results thus obtained can be used as general recommendations for mostsustainability projects.
Table 2 and Figure 1 show the suitability and effectiveness of Pareto Analysis. It clearly showsthe two reasons for failure to implement post project phases, that is, those that are most criticaland should get primary attention (reason No. 7 and reason No. 13).
Figure 2, Tables 3 and 4 show how the root causes of reason No. 7 “People don’t know how toperform it practically so they prefer not to do it“ may be gradually analysed and identified usingthe Ishikawa diagram and the “5 Whys” method. The analysis of the root causes of reason No. 7 showsthat the key cause is related mostly to knowledge and methodology, although the post project phaseimplementation methodology is described for example, in documents related to the description ofprocess improvement principles in the set of ISO 9000 international quality standards.
Even the IPMA ICB (version 4.0 from 2015) [25] and PMI PMBOK [33] documents used for projectmanagers’ knowledge certification do not explicitly require the applicants to be familiar with postproject phases and aware of post project phase techniques. This is due to the sad fact that certificateapplicants are not tested for knowledge of these processes. Yet process improvement (including projectprocesses) is required by the ISO 9001 quality standard. For this reason, the authors recommend testingof this knowledge to be included in the certification process.
Specialized project management periodicals usually emphasize the need of courses for certificationpreparation. However, they fail to emphasize the need of systematic company training of project teammembers and line managers in project management [34]. This, combined with often incorrectly set ormissing knowledge management processes, causes the direct project participants lack the necessaryknowledge concerning project management, including the knowledge related to post project phasesand recommended methods and techniques.
Figure 4 shows that the Ishikawa diagram can be drafted for a subset of measures minimizingthe cause impact on a certain reason for identified non-quality. The diagram provides an overallpresentation of the proposed recommendations that need to be applied in order to minimizethe causes of reason No. 7 for failure to implement post project phases. In the context of Figure 2,the identified causes and reasons are symmetrically paired (cause → recommendation). This will beappreciated mostly in the implementation phase and retrospect check to evaluate the effectiveness ofproposed recommendations.
In the process of searching for the root cause of reason No. 13 “Because its need and existence areessentially denied or ignored—This belongs to “quality,” not to “projects,” the Cause tree diagramwith operators AND/OR branches was used (Figure 3). In comparison to the previous case, there isa total of 8 cause.
On the basis of this research and the fact that it has been identified and analysed, the authorsrecommend the workers of project offices, respectively project managers and top managers:
1. Focus on analysis of project management training and verify the direct connection betweentraining, project success and systematic and quality training of direct project participants.
2. Focus on the quality of corporate guideline and instruction compilation process since it mayconsiderably increase project success.
3. Focus on corporate culture in order to promote the 6 reasons (see Figure 3) leading to goodunderstanding of post project phase benefits to achieve continuous company improvement.
The uniting feature of these recommendation is system approach to knowledge [35] together withthe use of current information technology [36].

Sustainability 2019, 11, 1667 12 of 15
Sustainability 2019, 11, x FOR PEER REVIEW 12 of 16
the Ishikawa diagram and the “5 Whys” method. The analysis of the root causes of reason No. 7 shows that the key cause is related mostly to knowledge and methodology, although the post project phase implementation methodology is described for example, in documents related to the description of process improvement principles in the set of ISO 9000 international quality standards.
Even the IPMA ICB (version 4.0 from 2015) [25] and PMI PMBOK [33] documents used for project managers’ knowledge certification do not explicitly require the applicants to be familiar with post project phases and aware of post project phase techniques. This is due to the sad fact that certificate applicants are not tested for knowledge of these processes. Yet process improvement (including project processes) is required by the ISO 9001 quality standard. For this reason, the authors recommend testing of this knowledge to be included in the certification process.
Specialized project management periodicals usually emphasize the need of courses for certification preparation. However, they fail to emphasize the need of systematic company training of project team members and line managers in project management [34]. This, combined with often incorrectly set or missing knowledge management processes, causes the direct project participants lack the necessary knowledge concerning project management, including the knowledge related to post project phases and recommended methods and techniques.
Figure 4 shows that the Ishikawa diagram can be drafted for a subset of measures minimizing the cause impact on a certain reason for identified non-quality. The diagram provides an overall presentation of the proposed recommendations that need to be applied in order to minimize the causes of reason No. 7 for failure to implement post project phases. In the context of Figure 2, the identified causes and reasons are symmetrically paired (cause → recommendation). This will be appreciated mostly in the implementation phase and retrospect check to evaluate the effectiveness of proposed recommendations.
Figure 4. Ishikawa diagram – Recommendations to reduce reason No. 7 non-implementation of post project phase (Source: processed by the authors).
In the process of searching for the root cause of reason No. 13 “Because its need and existence are essentially denied or ignored — This belongs to “quality,” not to “projects,” the Cause tree diagram with operators AND/OR branches was used (Figure 3). In comparison to the previous case, there is a total of 8 cause.
On the basis of this research and the fact that it has been identified and analysed, the authors recommend the workers of project offices, respectively project managers and top managers:
1. Focus on analysis of project management training and verify the direct connection between training, project success and systematic and quality training of direct project participants.
Research of suitable methods
Selection of trained methods
Reason No.
Project team
Emphasizing knowledge significance
Knowledge management organization
Guideline compilation
Guideline application
Selection of team members Team motivation
Team stimulation
Training organization
Training effectiveness evaluation
Organization of post project phases
Methods Knowledge
Team composition
Figure 4. Ishikawa diagram—Recommendations to reduce reason No. 7 non-implementation of postproject phase (Source: processed by the authors).
6. Conclusions
The concept of Knowledge Management often evokes complicated procedures bordering onArtificial Intelligence and simple yet effective methods revealing the causes of project failure areneglected (e.g., those presented and applied in this paper).
In this paper, the authors focused on searching for causes of failure to implement post projectphases. However, that is not enough. Next, it is necessary that all of companies and institutions(not only executing or participating in sustainability projects) draft proposals to eliminate or minimizethe identified negative causes.
The paper contributes to the support of system approach to project management. System approachin project proposal and execution is often neglected. The main contribution of the paper is the overviewof techniques that may be recommended for post project analysis. These techniques are demonstrated indetail on particular examples of the analysis of the most common reasons for failure to implement postproject phases. The described examples demonstrate the procedure to be followed in order to identifythe root cause of the analysed phenomenon. At the same time, the paper also describes proposalsof recommended measures that should minimize the root causes resulting in negative outcomes.The paper explicitly emphasizes and shows the connection between knowledge management and postproject phase effectiveness.
The authors are preparing research to find and present general rules and principles leadingto the elimination of the remaining established causes in order to improve post project stageimplementation and project management quality, including sustainability projects.
Improvement of sustainability projects would also be very beneficial if there was a portalcontaining the results of sustainability project analysis, used methods and recommended proceduresleading to elimination or minimization of negative causes. The authors propose next to be initiatedan international researches focused on the quality of sustainability projects both in terms of contentand project management by sustainability project stakeholders. The researches mentioned inthe Section 2 should be organized for the sustainability projects too. These researches could contributeboth to the identification of the current state and as an inspiration for improvement.
By the way, the paper primarily points out the most important causes of failure to implementpost project phases but at the same time it can serve as an example of how to analyse results obtainedfrom completed projects.

Sustainability 2019, 11, 1667 13 of 15
Apart from the recommended basic techniques and methods used in the paper (Pareto analysis,5 Whys method, Ishikawa diagram, Tree diagram) that allow effective analysis of causes of failureto implement post project phases, the authors call for company management to consider the useof sophisticated methods and instruments for knowledge management implementation in projectmanagement [37,38].
Separately listed methods are not new but original is their combination and application tothe analysis of the project phase.
In order to increase project success in the current complicated VUCA society [39] at a timereferred as “Risk Society,” it is necessary to pay extreme attention to the process of continuousand incremental improvement in particular. The system of incremental improvement may be realizedby application of knowledge management principles in project management. In practice, this requiresgood and effective progress in post project phases, mostly through analysis of the post implementationsystem and compilation of a set of proposals for better management of follow-up projects. By postimplementation analysis realized in the context of the SECI knowledge management model [40],the necessary project knowledge (tacit and explicit) for the execution of future projects may be gained.In addition the future development of project management emphasizes on project analysis [41].
Author Contributions: R.D. and B.L. designed the conceptual framework of the article and performedthe experiments (empirical research, analysis, results, discussion, recommendations).
Funding: This research received no external funding.
Acknowledgments: This paper was supported by grant FP-S-18-5524 “Information and Knowledge Managementin the age of Industry 4.0” of the Internal Grant Agency at the Brno University of Technology.
Conflicts of Interest: The authors declare no conflict of interest.
References
1. Fitzpatrick, A.G.; Apitz, S.E.; Harrison, D.; Ruffle, B.; Edwards, D.A. The Portland Harbor Superfund SiteSustainability Project: Introduction. Integr. Environ. Assess. Manag. 2018, 14, 17–21. [CrossRef] [PubMed]
2. Bedoya, C.; Dzul, L. Concrete with recycled aggregates as urban sustainability project. Rev. Ing. Constr. 2015,30, 99–108. [CrossRef]
3. Nilsson, M.; Griggs, D.; Visbeck, M. Map the interactions between Sustainable Development Goals.Nature 2016, 534, 320–322. [CrossRef] [PubMed]
4. Nilsson, M.; Chisholm, E.; Griggs, D.; Howden-Chapman, P.; McCollum, D.; Messerli, P.; Neumann, B.;Stevance, A.-S.; Visbeck, M.; Stafford-Smith, M. Mapping interactions between the sustainable developmentgoals: Lessons learned and ways forward. Sustain. Sci. 2018, 13, 1489–1503. [CrossRef] [PubMed]
5. Doskocil, R.; Lacko, B. Risk Management and Knowledge Management as Critical Success Factors ofSustainability Projects. Sustainability 2018, 10, 1438. [CrossRef]
6. 2015_projektové rízení v CR—výsledky. Available online: https://www.ipma.cz/media/1282/2015_projektové-rí-v-cr-vysledky.pdf (accessed on 15 March 2019).
7. Standish Group Chaos Report—Q&A with Jennifer Lynch. Available online: https://www.infoq.com/articles/standish-chaos-2015 (accessed on 8 November 2018).
8. EY Výsledky 10. rocníku EY pruzkumu. Available online: https://www.ey.com/Publication/vwLUAssets/Projektov%C3%A9_%C5%99%C3%ADzen%C3%AD_2018/$FILE/EY%20Pr%C5%AFzkum%20projektov%C3%A9ho%20%C5%99%C3%ADzen%C3%AD%20v%20%C4%8CR%202017_v%C3%BDsledky%2010.%20ro%C4%8Dn%C3%ADku.pdf (accessed on 15 March 2019).
9. PM_konference. Available online: https://www.pmkonference.cz/2018/ (accessed on 15 March 2019).10. CMMI Institute Standard CMMI® Appraisal Method for Process Improvement (SCAMPI) Version 1.3b.
Available online: https://cmmiinstitute.com/resources/standard-cmmi-appraisal-method-process-improvement-scampi-version-13b-method-definition (accessed on 22 November 2018).
11. Shongwe, M.M. Knowledge Management in Small Software Organisations: A South African Perspective.In Proceedings of the 16th European Conference on Knowledge Management (ECKM 2015); Massaro, M., Garlatti, A.,Eds.; Acad Conferences Ltd.: Nr Reading, UK, 2015; pp. 702–708. ISBN 978-1-910810-47-7.

Sustainability 2019, 11, 1667 14 of 15
12. Kim, S.K.; Mont, J. Agile Project Management for Root Cause Analysis Projects. In Design for Harmonies, Vol 5:Design for X, Design to X.; Lindemann, U., Venkataraman, S., Kim, Y.S., Lee, S.W., McAloone, T., Wartzak, S.,Eds.; Design Soc: Glasgow, Scotland, 2013; ISBN 978-1-904670-48-3.
13. Barber, K.D.; Munive-Hernandez, J.E.; Keane, J.P. Process-based knowledge management system forcontinuous improvement. Int. J. Qual. Reliab. Manag. 2006, 23, 8. Available online: https://www.emeraldinsight.com/doi/full/10.1108/02656710610688185 (accessed on 22 November 2018). [CrossRef]
14. Suppes, P. A Probabilistic Theory of Causality; North-Holland Pub. Co.: Amsterdam, The Netherland, 1970.15. Turner, J.R. The management of the project-based organization: A personal reflection. Int. J. Proj. Manag.
2018, 36, 231–240. [CrossRef]16. Harich, J.; Bangerter, P.; Durlacher, S. Solving the Sustainability Problem with Root Cause Analysis. In Proceedings
of the Ecosystem Services Partnership Conference, Portland, OR, USA, 31 July–4 August 2012; p. 25.17. Ansah, R.H.; Sorooshian, S. 4P delays in project management. Eng. Constr. Archit. Manag. 2018, 25, 62–76.
[CrossRef]18. Rongfa, T. Defect Classification Method for Software Management Quality Control Based on Decision Tree
Learning. In Advanced Technology in Teaching—Proceedings of the 2009 3rd International Conference on Teachingand Computational Science (wtcs 2009), Vol 1: Intelligent Ubiquitious Computing and Education; Wu, Y.W., Ed.;Springer: Berlin, Germany, 2012; Volume 116, pp. 721–728. ISBN 978-3-642-11275-1.
19. Usman, I.; Rendy, O. Toward Lean Construction through Critical Chain Project Management and RootCause Analysis in a Construction Project. In Proceedings of the 2017 International Conference on OrganizationalInnovation (icoi 2017); Shieh, C., Tichy, T., Dass, B.K., Auliandri, A., Eds.; Atlantis Press: Paris, France, 2017;Volume 131, pp. 153–158. ISBN 978-94-6252-359-3.
20. Ku, H. Teaching of Critical Path Networks Using Software Packages. In Rough Sets and Knowledge Technology,Proceedings; Wen, P., Li, Y., Polkowski, L., Yao, Y., Tsumoto, S., Wang, G., Eds.; Springer: Berlin, Germany,2009; Volume 5589, pp. 435–440. ISBN 978-3-642-02961-5.
21. Lakshman, D.; Kannan, M.V.; Bhojraj, H. Application of Root Analysis Techniques in Spacecraft ProjectManagement. J. Spacecr. Technol. 2010, 20, 1–12.
22. Erkut, B. The Emergence of the ERP Software Market between Product Innovation and Market Shaping.J. Open Innov. Technol. Mark. Complex. 2018, 4, 23. [CrossRef]
23. Handzic, M.; Durmic, N. Merging Knowledge Management with Project Management. In Proceedings ofthe 15th European Conference on Knowledge Management (ECKM 2014), Vols 1–3; Vivas, C., Sequeira, P., Eds.;Acad Conferences Ltd.: Nr Reading, UK, 2014; pp. 402–409. ISBN 978-1-910309-35-3.
24. Handzic, M.; Bassi, A. (Eds.) Knowledge and Project Management: A Shared Approach to Improve Performance;Knowledge Management and Organizational Learning; Springer International Publishing: Berlin, Germany,2017; ISBN 978-3-319-51066-8.
25. IPMA IPMA_ICB_4_0. Available online: http://products.ipma.world/wp-content/uploads/2016/03/IPMA_ICB_4_0_WEB.pdf (accessed on 22 November 2018).
26. Vukomanovic, M.; Young, M.; Huynink, S. IPMA ICB 4.0-A global standard for project, programmeand portfolio management competences. Int. J. Proj. Manag. 2016, 34, 1703–1705. [CrossRef]
27. Bartoska, J.; Flegl, M.; Jarkovska, M. IPMA Standard Competences Structure in Project Management Teaching;Kvasnicka, R., Ed.; Czech University Life Sciences Prague: Prague, The Czech Republic, 2012; Volume 6,ISBN 978-80-213-2289-9.
28. Andersen, B.; Fagerhaug, T. Root Cause Analysis: Simplified Tools and Techniques, 2nd ed.; ASQ Quality Press:Mexico City, Mexico, 2006; ISBN-13: 978-8174890221.
29. Janicek, P. Systems Conception of Problem-Solving. In Engineering Mechanics 2017; Institute ofThermomechanics, Academy of Sciences of the Czech Republic: Prague, The Czech Republic, 2017; Volume 8,pp. 402–405. ISBN 978-80-214-5497-2.
30. Ishikawa, K. Guide to Quality Control; Asian Productivity Organization: Tokyo, Japan, 1991.31. BS EN 62740:2015, BSI Standards Publication Root Cause Analysis. Available online: https://kupdf.net/
download/bs-en-62740-2015-root-cause-analysis_5af603b3e2b6f559078da777_pdf (accessed on 12 October 2018).32. Karuppusami, G.; Gandhinathan, R. Pareto analysis of critical success factors of total quality management:
A literature review and analysis. TQM Mag. 2006, 18, 372–385. [CrossRef]33. PMBOK Guide—Sixth Edition. Available online: https://www.pmi.org/pmbok-guide-standards/
foundational/pmbok/sixth-edition (accessed on 15 March 2018).

Sustainability 2019, 11, 1667 15 of 15
34. Anbari, F.T. A systems approach to project evaluation. Proj. Manag. J. 1985, 16, 21–26.35. Dömeová, L.; Houška, M.; Houšková Beranová, M. Systems Approach to Knowledge Modelling; Graphical Studio
Olga Cermáková: Hradec Králové, The Czech Republic, 2008; ISBN 978-80-86703-30-5.36. Grundspenkis, J. Agent based approach for organization and personal knowledge modelling: Knowledge
management perspective. J. Intell. Manuf. 2007, 18, 451–457. [CrossRef]37. Šubrt, T.; Zuzák, R.; Houška, M.; Brožová, H.; Houšková Beranová, M.; Havlícek, J.; Urbancová, H.; Domeová, L.;
Vostrovský, V.; Klimešová, D.; et al. Mastering Knowledge; Alfa Publishin: Praha, The Czech Republic, 2010;ISBN 978-80-87197-37-0.
38. Almeida, M.V.; Soares, A.L. Knowledge sharing in project-based organizations: Overcoming the informationallimbo. INTJ. Inf. Manag. 2014, 34, 770–779. [CrossRef]
39. Fassinger, R.E.; Shullman, S.L.; Buki, L.P. Future Shock: Counseling Psychology in a VUCA World. Couns. Psychol.2017, 45, 1048–1058. [CrossRef]
40. Nonaka, I. A Dynamic Theory of Organizational Knowledge Creation. Organ Sci. 1994, 5, 14–37. [CrossRef]41. Máchal, P.; Hvizdová, E.; Ondruchová, M. New Perspectives in Project Management; Mendel University in
Brno: Brno, The Czech Republic, 2018; ISBN 978-80-7509-540-4.
© 2019 by the authors. Licensee MDPI, Basel, Switzerland. This article is an open accessarticle distributed under the terms and conditions of the Creative Commons Attribution(CC BY) license (http://creativecommons.org/licenses/by/4.0/).
Copyright © 2022 FDOKUMEN