Explanations for withdrawn behaviour at school
24
How do young children explain their withdrawn behaviour? Katie Rix, University of Greenwich Supervisors: Pam Maras and Claire P. Monks CogDev Conference 2013
Transcript of Explanations for withdrawn behaviour at school

How do young children explain their withdrawn behaviour?
Katie Rix, University of Greenwich
Supervisors: Pam Maras and Claire P. Monks
CogDev Conference 2013

Presentation outline
1. Theoretical background
2. Methods
3. Coding
4. Findings
5. Summary
6. Next steps

Passive withdrawn Active withdrawn
1. Withdrawn behaviour
“Infrequent interaction with others.” (Ladd, 1990)

1. Effects / correlates of withdrawn behaviour
• Victimisation • Lower ratings of peer acceptance • Lower social competence • Peer rejection • Loneliness • Depression • Poorer language skills • Less speech • Lower academic performance • Less positive friendships (E.g. Rubin et al, 2009)

1. Effects / correlates of withdrawn behaviour
• Greater acceptance from peers
• Leadership qualities
(Chen, Rubin & Li, 1995)
• Different types of withdrawn behaviour
• Gender
(Nelson, Rubin & Fox, 2005)

2. Methods
Summer term reception class
(age 4/5)
Autumn term Year 1 children
(age 5/6)
Summer term Year 1 children
(age 5/6)
Summer term Year 1 class
(age 5/6)
Autumn term Year 2 children
(age 6/7)
Summer term Year 2 children
(age 6/7)
N = 285

2. Methods
• Videos with gender neutral stick people displaying each behaviour
• Children asked:
– What is the person doing?
– Can you think of anyone in their class who does this at school (lots/sometimes)?
– Do you ever do this at school (lots/sometimes/never?)
– WHY?

Passive withdrawn
Video

Active withdrawn
Video

• Widen and Russell (2011) – cause and consequence with characters’ emotions
• Leeds Attributional Coding System (LACS - Stratton et al, 1988)
• Swords, Hennessy and Heary (2011) - family/parental causes, peer causes and school causes
3. Coding system

Proportions calculated based on the number of explanations provided by each child
Cause or consequence Perceived agent Perceived target
“I stay on my own because nobody ever plays with me.”(1) 100% cause; 100% other child/ren as agent; 100% self as target
“I am feeling tired.” and “They will be nasty to me if I join in.”(2) 50% cause and 50% consequential; 50% self as agent and 50% other
child/ren as agent; 50% self as target

4. Findings
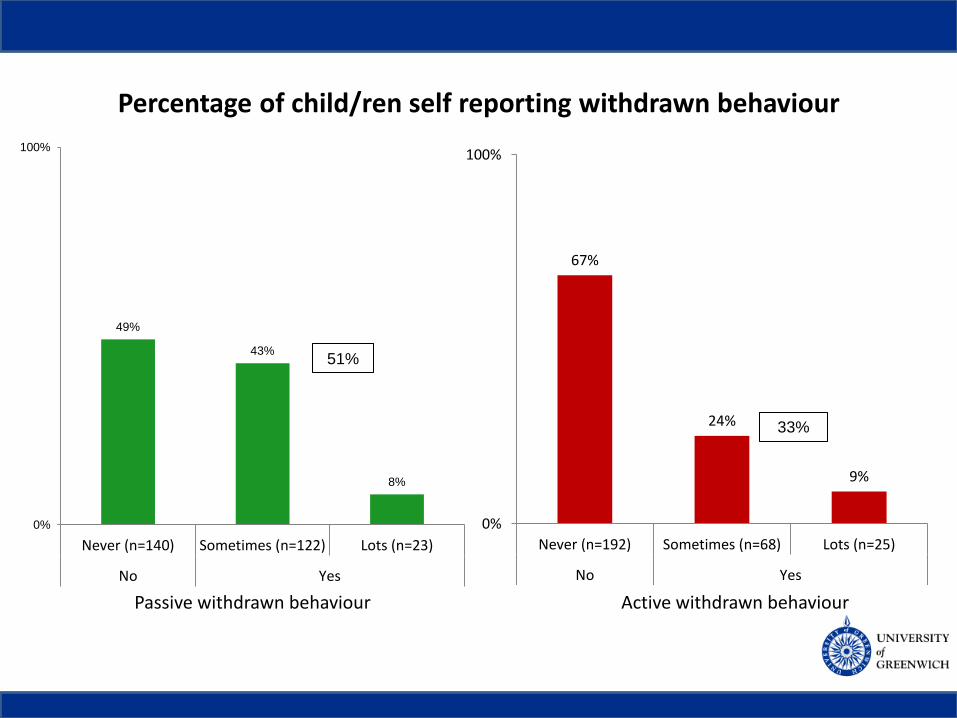
Passive withdrawn behaviour Active withdrawn behaviour
33%
Percentage of child/ren self reporting withdrawn behaviour
51%
67%
24%
9%
0%
100%
Never (n=192) Sometimes (n=68) Lots (n=25)
No Yes
49%
43%
8%
0%
100%
Never (n=140) Sometimes (n=122) Lots (n=23)
No Yes

Mean proportion of all withdrawn children’s causal and consequential explanations
88%
19%
0%
100%
Cause Consequence
Passive withdrawn behaviour**
Mea
n p
rop
oti
on
of
child
ren
's e
xpla
nat
ion
s
71%
37%
0%
100%
Cause Consequence
Active withdrawn behaviour**
Mea
n p
rop
oti
on
of
child
ren
's e
xpla
nat
ion
s
Cause and consequence

Mean proportion of withdrawn children’s causal and consequential explanations for children who said they behave in BOTH passive and active withdrawn ways
86%
70%
0%
100%
Passive withdrawnbehaviour
Active withdrawnbehaviour
Causal explanations**
Mea
n p
rop
oti
on
of
child
ren
's e
xpla
nat
ion
s
17%
35%
0%
100%
Passive withdrawnbehaviour
Active withdrawnbehaviour
Consequential explanations**
Mea
n p
rop
oti
on
of
child
ren
's e
xpla
nat
ion
s
Cause and consequence

Perceived Agents Mean proportion of all withdrawn children’s perceived agents
44%
65%
10% 7%
0%
100%
Self(a*, d**, e**)
Otherchild/ren
(a*, b**, c**)
General(b**, d**)
Adult(c**, e**)
Mea
n p
rop
ort
ion
of
exp
lan
atio
ns
57%
47%
9% 10%
0%
100%
Self(a**, b**)
Otherchild/ren(c**, d**)
General(a**, c**)
Adult(b**, d**)
Mea
n p
rop
ort
ion
of
exp
lan
atio
ns
Passive withdrawn behaviour Active withdrawn behaviour

Perceived Agents Mean proportion of withdrawn children’s perceived agents for children who said
they behave in BOTH passive and active withdrawn ways
44%
61%
0%
100%
Passive withdrawn(a*)
Active withdrawn(a*)
Self
Mea
n p
rop
ort
ion
of
exp
lan
atio
ns
72%
45%
0%
100%
Passive withdrawn(a)
Active withdrawn(a)
Other child/ren
Mea
n p
rop
ort
ion
of
exp
lan
atio
ns

TARGETS
Perceived Targets Mean proportion of all withdrawn children’s perceived targets
60%
14%
7% 7%
0%
100%
Self(a**, b**, c**)
Other child/ren(a**, d**, e**)
Adult(b**, d**)
General(c**, e**)
Mea
n p
rop
ort
ion
of
exp
lan
atio
ns
56%
11% 7% 7%
0%
100%
Self(a**, b**, c**)
Otherchild/ren
(a**, d*, e*)
General(b**, d*)
Adult(c**, e*)
Mea
n p
rop
ort
ion
of
exp
lan
atio
ns

Some things to note…
• These patterns are different to when children explain why they do not show withdrawn behaviour
• These patterns are different to children’s explanations of prosocial behaviour

Exploring recurring themes
• Rejection / acceptance • Personal choice • Play • Social dis/approval • Friendship • Nastiness • Space • Seeing/ noticing • Others not approaching • Recognition of others • Tired / worn out / unwell • Emotions • Politeness / rudeness • No cost to self • Personality / attributions
• Busy / not busy • Boredom • Possessiveness • Self benefit • Reciprocity / retaliation • Punishment • Instruction / request • School / class rules • Morals • Loneliness • Risk to self • Responsibility • Situation specific • Other

Percentage of children with recurring themes in their explanations for withdrawn behaviour (>10%)
% of all passive withdrawn children
Rejection / acceptance 27%
Personal choice 23%
Play 14%
Social dis/approval 13%
Friendship 12%
% of all active withdrawn children
Personal choice 42%
Game / activity specific 16%
Social dis/approval 14%
Tired / worn out / unwell 12%
Nastiness 11%
Play 11%

5. Summary • Causal explanations are more common than consequential
– Consequential explanations are more common for active than passive withdrawn behaviour
• Children perceive themselves and other children as more responsible for their withdrawn behaviour than adults or general reasons – Children perceive other child/ren as more responsible for their passive
withdrawn behaviour than active – Children see themselves as more responsible for active withdrawn
behaviour than passive
• Children’s explanations consider themselves as affected by the behaviour more than other child/ren, adults or general targets
• There are common themes in responses – Rejection / acceptance and personal choice were the most common
themes in explanations of passively withdrawn behaviour – Personal choice was the most common theme in explanations of
actively withdrawn behaviour

6. Next steps • Age and gender comparisons
• Analysis of phase 2 and phase 3
• Longitudinal analysis
• Comparison with other behaviour categories
• Comparison by discrepancy of report