Complexity Results and Approximation Strategies for MAP Explanations

ENHANCING LEARNING FROM DIFFERENT
VISUALIZATIONS BY SELF-EXPLANATION PROMPTS*
LIJIA LIN
East China Normal University
ROBERT K. ATKINSON
Arizona State University
ABSTRACT
The purpose of the two experiments was to investigate the potential effects
of different types of visualizations and self-explanation prompts on learning
human cardiovascular system in a multimedia environment. In Experiments
1 and 2, 70 and 44 college students were randomly assigned to one of the four
conditions in a 2 × 2 factorial design with visualization type (animated vs.
static) and prompting self-explanations (prompts vs. none) as the between-
subjects factors. The results of Experiment 1 revealed a positive effect
of prompts on learning outcomes. Experiment 2, in which the no-prompts
conditions were re-designed, partially replicated the results of Experiment 1.
In addition, it revealed a significant interaction between the two factors
on learning time, learning outcomes, and goal-driven self-explanations. The
results of both experiments suggest that instructional designers should pay
attention to learners’ cognitive aspects, and utilize the combination of ani-
mated visualizations and self-explanation prompts when designing multi-
media environments.
*This research was partially supported by “Chen Guang” Project (Grant 12CG27),
by Shanghai Municipal Education Commission, Shanghai Education Development Foundation,
and by Shanghai Pujiang Program (Grant 13PJC031).
83
� 2013, Baywood Publishing Co., Inc.
doi: http://dx.doi.org/10.2190/EC.49.1.d
http://baywood.com
J. EDUCATIONAL COMPUTING RESEARCH, Vol. 49(1) 83-110, 2013

INTRODUCTION
For the past several decades, researchers have conducted a number of studies
on learning with different types of visualizations, but the results are still mixed
and inconclusive. Some studies reported that animations are superior to static
visualizations (e.g., Arguel & Jamet, 2009; Lin & Atkinson, 2011; Rieber,
1990), whereas some other studies revealed that animated and static visuals are
equivalent in terms of promoting learning (e.g., Kim, Yoon, Whang, Tversky, &
Morrison, 2007; Mayer, Deleeuw, & Ayres, 2007). Kozma (1994) pointed out
that exposing learners to media did not automatically lead to their deep compre-
hension and learning. Thus, in order to foster learning and cognition in multi-
media environments, researchers should consider incorporating some cognitive
strategies to facilitate mental model construction (Berthold & Renkl, 2009;
Roy & Chi, 2005). The reported two experiments investigated the effectiveness
of animated/static visualizations in a multimedia environment, in which self-
explanation prompts, a domain-general cognitive strategy, were provided as an
instructional aid to support the learning of the human cardiovascular system.
Learning from Different Visualizations
An animation is a series of visual representations that display changes over
time. It is assumed that animations are effective to enhance learning. Early
research provided some evidence to support the claim. For instance, Rieber (1990)
found that the participants who were provided with animated graphics describ-
ing Newton’s law of motion performed better on posttest. The superiority of
animated visualizations over static graphics was also reported in several other
early studies addressing learning in various domains, such as biology (Large,
Beheshti, Breuleux, & Renaud, 1996), math (Thompson & Riding, 1990), and
engineering (Park & Gittleman, 1992). Tversky, Morrison, and Betrancourt
(2002) reviewed these early studies and concluded that these results are not very
convincing due to the lack of information equivalence in the static and animated
visualizations.
Later empirical studies revealed diverse and inconclusive results—some
studies showed the superiority of animations (e.g., Arguel & Jamet, 2009;
Ayres, Marcus, Chan, & Qian, 2009; Catrambone & Seay, 2002; Lai, 2000;
Lin & Atkinson, 2011; Michas & Berry, 2000; Wong, Marcus, Ayers, Smith,
Cooper, Paas, et al., 2009; Yang, Andre, & Greenbowe, 2003). For instance,
Wong et al. (2009) found in three experiments that the participants who studied
animations were more successful to complete paper-folding tasks than their
counterparts who studied static graphics. Lin and Atkinson (2011) found that
animations were more effective to enhance learning rock cycle concepts than
static graphics. However, in other studies the static and animated visualiza-
tions were found to be equivalent in terms of learning (Boucheix & Schneider,
2009; Kim et al., 2007; Mayer et al., 2007; Münzer, Seufert, & Brünken, 2009).
84 / LIN AND ATKINSON

For instance, Boucheix and Schneider (2009) investigated the effect of an
animation, an integrated static visual with five frames presented together, five
integrated static visuals presented successively, and a single static visual on
students’ understanding of a mechanical system. They found that the specifically
designed static condition (i.e., an integrated static visual with five frames pre-
sented together) and the animation condition enhanced better comprehension
of the system than the single static condition. In addition to those studies that
reported the equivalence between animated and static visuals, Mayer, Hegarty,
Mayer, and Campbell (2005) even revealed that static illustrations plus printed
texts were more effective than animations to promote the understanding of how the
lightning is formed, how a toilet tank works, how ocean waves work, and how a
braking system works. Based on the mixed results, researchers and instructional
designers should not hold the assumption that animations are always effective.
According to these divergent results, we can draw three competing hypoth-
eses—animated hypothesis, static hypothesis and equivalence hypothesis. We
elaborated the three hypotheses from the cognitive load perspective (Paas, Renkl,
& Sweller, 2003; Schnotz & Kurschner, 2007; Sweller, van Merriënboer, &
Paas, 1998). Three subcomponents underlie the cognitive load—intrinsic cogni-
tive load, extraneous cognitive load, and germane cognitive load. Intrinsic load is
determined by the inherent nature of the learning materials or tasks; extraneous
load is the mental effort that is caused by inappropriate instructional design and
is irrelevant to learning; whereas germane load is the mental effort that is used
to construct mental models. From the perspective of the animated hypothesis,
animations are more effective to enhance learning than static graphics. Unlike
viewing static graphics, learners do not need to exert cognitive effort to mentally
animate what is presented when viewing animations (Hegarty, 1992). As a
result, animations reduce the intrinsic load, and provide learners with more
cognitive resources that can be allocated to deep learning (i.e., animations may
foster germane load). On the other hand, the static hypothesis states that static
visualizations have more potential than the animated visualizations to enhance
learning. When key frames of static visualizations, which represent the important
stages of a process, are presented, extraneous information (i.e., extraneous load)
is reduced (Mayer et al., 2005). In addition, learners make inferences about the
change between frames of static visualizations. The mental effort induced by
these inferences may contribute to active learning, and germane load may be
fostered. From the perspective of the equivalence hypothesis, different types of
visualizations may merely be a format of instruction and a surface feature, no
matter whether they are animated or static (Berthold & Renkl, 2009). As a
result, similar to other surface features (such as shape and color), the type of
visualizations rarely contributes to learners’ mental model construction. There-
fore, the animated and the static visualizations are equivalent in terms of influ-
encing learning and cognitive load. These three hypotheses reflect the current
ambiguity in research related to learning from visualizations. It is of note that past
ENHANCING LEARNING FROM DIFFERENT VISUALIZATIONS / 85

research investigating the animated-static comparison rarely introduced any cog-
nitive strategies. However, some cognitive strategies serving as instructional
aids may be needed to support learning with visualizations (Mayer et al., 2005;
Renkl & Atkinson, 2002).
Supporting Learning by Prompting
Self-Explanations
Hegarty (2004) pointed out that researchers should look into the specific
conditions in which animations are effective on learning. In the two reported
experiments, the three competing hypotheses—the animated hypothesis, the
static hypothesis, and the equivalence hypothesis—were tested in a specific
multimedia environment, in which self-explanation prompts were provided.
Self-explanation is a domain general activity that engages learners in active
knowledge construction. Self-explanation prompts are questions that elicit
learners to explain to themselves about what they have learned. A number of
studies, conducted in computer-based environments, provided empirical evidence
of the effectiveness of self-explanation prompts (e.g., Aleven & Koedinger,
2002; Atkinson, Renkl, & Merrill, 2003; Berthold, Eysink, & Renkl, 2009;
Berthold & Renkl, 2009; Mayer, Dow, & Mayer, 2003). For instance, Mayer
and colleagues (2003) presented prompting questions to learners before they
viewed animations about how an electric motor works. They found learners
who experienced this type of instructional support outperformed those who were
not presented with prompting questions. According to these previous studies,
self-explanation elicited by prompts has a great potential to promote deep and
active learning in multimedia environments (Roy & Chi, 2005). From the
cognitive load perspective, prompting learners to self-explain engages learners
in cognitive processes to construct mental models, which is an approach to
foster germane cognitive load.
However, learners may experience cognitive overload due to considerable
mental effort imposed by self-explanation. Particularly, this overload may be
heightened in the multimedia environments that multiple formats of graphics
along with spoken or on-screen texts are presented. As a result, learning may
not be enhanced and may be even prevented because learners’ limited cognitive
capacity was exceeded. A couple of studies also revealed the non-significant
effect of self-explanation prompts (Gerjets, Scheiter, & Catrambone, 2006;
Große & Renkl, 2007). In Gerjets, Scheiter, and Catrambone’s study (2006),
participants learned different formats of worked examples with either self-
explanation prompts or textual instructional explanations. The researchers did
not find the superiority of prompting self-explanation. They even found that the
prompting condition deteriorated learning when optimally designed examples
were provided to learners. Consequently, it is necessary to further investigate
the prompting self-explanation effect, especially in specific conditions.
86 / LIN AND ATKINSON

According to Tversky et al. (2002), the content and structure of the animations
should be accurately comprehended in order to make animations effective. Renkl
and Atkinson (2002) also pointed out that the combination of visualizations and
self-explanation prompts in a multimedia environment has a great potential to
enhance learning, as learners may be able to study visualized concepts and be
prompted to self-explain to engage in active learning to bridge the gap between
the internal and external representations. No past research has directly com-
pared the effect of animated and static visualizations in the context of providing
self-explanation prompts. The only related empirical study was conducted by
Hegarty, Kriz, and Cate (2003). They compared static graphics and animations,
which showed how a mechanical system works. Prediction questions were used
in their study to induce learners’ prior knowledge. They found that animated and
static visuals were comparable in terms of learning, but asking learners to predict
improved their understanding. However, it is still unknown whether providing
self-explanation prompts has a positive effect on learning human cardiovascular
system (different from learning a mechanical system) when either static or ani-
mated visuals are presented. Therefore, we conducted the current study to investi-
gate the prompting self-explanation effect in a multimedia environment, in which
learners studied either animated or static graphics to gain knowledge about the
human cardiovascular system.
EXPERIMENT 1
Overview
We conducted Experiment 1 with the purpose of uncovering whether self-
explanation prompts promoted learning in a multimedia environment, in which
either animated or static visualizations were presented to facilitate the learning
of the human cardiovascular system. Therefore, different types of visualizations
and self-explanation prompts—an instructional aid to visualizations—were com-
bined to enhance learning, and specific conditions for effective animations were
investigated.
Specifically, Experiment 1 addressed four research questions:
(a) Which hypothesis, the animated hypothesis, the static hypothesis, or the
equivalence hypothesis, should be supported?
(b) Is prompting self-explanation an effective technique to promote learning
in a multimedia environment?
(c) Does the effect of prompting self-explanation differ between different
types of visualizations (the interaction effect)?
(d) Do different types of visualizations and prompting self-explanation have
any impacts on the quality and quantity of self-explanations?
ENHANCING LEARNING FROM DIFFERENT VISUALIZATIONS / 87

Two independent variables were manipulated in Experiment 1; for example,
the type of visualizations (animated or static) and the self-explanation prompts
(with or without). The experiment incorporated learning outcomes and cog-
nitive load as dependent variables. Learning time and self-explanation time were
included as en-route variables. In addition, learners’ written self-explanations
were collected.
Method
Participants and Design
A total of 70 participants (42 females) from a large southwestern university
in the United States participated in Experiment 1. They were students recruited
from a computer literacy course—a subject pool in the Teachers College. They
were all over 18 years old, and their average age was 22.87 with a standard
deviation (SD) of 11.50. They participated in the experiment to earn course credits.
Experiment 1 used a pretest-posttest, 2 (animated vs. static visualizations) ×
2 (self-explanation prompts vs. none) between-subjects design, in which the
participants were randomly assigned to one of the four experimental conditions:
(a) animated/prompts; (b) animated/no-prompts; (c) static/prompts; or (d) static/
no-prompts.
Measures and Instruments
A pretest, including 20 multiple choice questions, was administered to measure
participants’ prior knowledge about the human heart. All questions in the pretest
were scored 0 points for incorrect answer or 1 point for correct answer by the
computer program automatically. Therefore, a maximum total of 20 points could
be achieved in the pretest. A 20-item posttest was used to measure participants’
comprehension of the content after instruction. They had the same format and
followed the same scoring procedure as the pretest but were different from
the pretest. The correlation between the pretest and posttest was .56 (p = .003).
The Cronbach’s alpha was .86 for the pretest and .80 for the posttest. A sample
pretest question is “What is a difference between your heart muscle and the
muscles in your legs and arms?” And a sample posttest question is “Why does
diffusion occur into the blood in the lungs?”
Five subjective questions (i.e., task demands, effort, navigational demands,
perceived success, and stress; see Table 1) were used to measure learners’
perceived cognitive load. They were adapted from the NASA-TLX (Hart
& Staveland, 1988), and were described in prior studies (Gerjets, Scheiter,
& Catrambone, 2004, 2006; Scheiter, Gerjets, & Catrambone, 2006). Each of
the questions was rated on an 8-point Likert scale. For the first question, “1”
represented easy in the rating scale and “8” as demanding; for the second question,
“1” represented not hard at all and “8” as very hard; for the third question, “1”
88 / LIN AND ATKINSON

represented low effort and “8” as high effort; for the fourth question, “1” repre-
sented not successful at all and “8” as very successful; for the fifth question,
“1” represented not stressful at all and “8” as very stressful.
Computer-Based Multimedia Environment
The learning environment was created by Microsoft Visual Basic Express 2008,
and was embedded with two dimensional graphics created by Adobe Flash 8. The
computer-based lesson was designed to teach participants knowledge about the
human cardiovascular system, a material that has been used by a number of studies
addressing multimedia learning related issues (e.g., de Koning et al., 2010a,
2010b; Dunsworth & Atkinson, 2007). Specifically, the lesson covered the fol-
lowing five topics in a sequence: the structure and function of the heart, the
structure and function of the blood, the structure and function of the blood vessels,
the circulatory pathway of blood vessels, and the material exchange in the human
body. In all of the four experimental conditions, instruction was delivered via
24 segmented visualizations (either animated or static) accompanied by a female
voice narrating the content. These visualizations did not include labels. Partici-
pants had the control to go back to the previous screen or go to the next screen,
as well as the control of playback of visualizations and audios (see Figure 1). The
ENHANCING LEARNING FROM DIFFERENT VISUALIZATIONS / 89
Table 1. Cognitive Load Measurement
Item Measure
1.
2.
3.
4.
5.
How much mental and physical activity was
required to accomplish the learning task, e.g.,
thinking, deciding, calculating, remembering,
looking, searching, etc.?
How hard did you have to work in your attempt
to understand the contents of the learning
environment?
How much effort did you have to invest to
navigate the learning environment?
How successful did you feel in understanding
the contents?
How insecure, discouraged, irritated, stress,
and annoyed did you feel during the learning
task?
Task demands
Effort
Navigational demands
Perceived success
Stress

visuals presented to the participants differed between conditions. In the two
animated conditions, participants viewed 24 segments of animations about the
human cardiovascular system. The duration of each segmented animation was
around one minute, if a learner did not interact with it to replay or stop. In the two
static conditions, they viewed 24 segments of static graphics, which were key
frames taken from the corresponding animations in the animated conditions. To
keep the information delivered in the four conditions as equivalent as possible,
the narrations accompanying each of the 24 static graphics were exactly the
same as those accompanied the 24 segments of animations.
In the two prompting conditions, five open-ended questions were presented
at the end of each topic to prompt participants to self-explain what they learned.
These five questions were content specific, addressing five topics of human
heart (“Could you explain how the heart works?”; “Could you explain the
function of blood in your own words?”; “Could you explain how the blood vessels
work?”; “Could you explain pulmonary circulation and systemic circulation in
your own words?”; and “Could you explain the process of material exchange
in your own words?”). When one prompting question was presented, a textbox
appeared at the right side of the question for participants to type their self-
explanations (see Figure 2). In order to make the no-prompting conditions and the
prompting conditions as equivalent as possible, a textbox was provided to the par-
ticipants in the two no-prompting conditions for them to take notes (see Figure 3)
90 / LIN AND ATKINSON
Figure 1. A sample segment of static visualization.

ENHANCING LEARNING FROM DIFFERENT VISUALIZATIONS / 91
Figure 3. A sample screen of the no-prompts condition
in Experiment 1.
Figure 2. A sample screen of the self-explanation
prompts condition.

so that the factor of typing was controlled across the four experimental con-
ditions (Berthold et al., 2009; Berthold & Renkl, 2009). The computer program
did not impose any time constraints on learners. However, learning time and self-
explanation time were recorded by the computer program for each participant.
Coding Scheme of Self-Explanations
The participants’ written self-explanations were coded according to a scheme
developed by de Koning et al. (2010a, 2010b). Two raters independently coded
half of the participants’ written self-explanations. The inter-rater reliability was
.90. Therefore, one rater coded the remaining written self-explanations.
Paraphrase—Statements were coded as such if the participants were merely
describing what they had learned in their own words without adding new
explanatory information. For example, a statement “The heart consists of four
chambers. There are two upper chambers and two lower chambers” would fall
into this category.
Goal-driven explanations—A statement was coded as such if the partici-
pants were inferring a goal or function to a certain action or structure of the
human cardiovascular system. For example, a statement “Material exchange is
able to occur in capillaries because they are semi-permeable which means that
small molecules are able to pass through” would be coded as a goal-driven
self-explanation.
Elaborative explanations—A statement was coded as such if the participants’
inferred information was in an elaborative manner. For example, “Valves are like
gates that open and close” would be considered an elaborative explanation.
Incorrect self-explanations—A statement would be coded as such if the par-
ticipants made an incorrect explanation. For example, “The heart is broken into
four chambers; each chamber has a ventricle and an atrium that pump blood to
the body . . .” would be considered an incorrect self-explanation.
Procedure
Experiment 1 was conducted in a laboratory setting. At the beginning of the
experiment, each participant signed on a consent form and was seated at an
individual cubicle, facing a computer, and was briefed by the researcher about
the procedure of the experiment. However, participants were unaware of the
different conditions or the research questions included in the experiment. Then,
they started the pretest on the computer with no time limit. After the completion
of the pretest, each participant was provided with a randomly assigned experi-
ment ID number to start the computer-based lesson. The intention of using
the experiment ID number was to preserve the anonymity of each participant.
Once the participants completed the lesson, they responded to the cognitive load
92 / LIN AND ATKINSON

questionnaire followed by the posttest. Neither activity had a time limit. Upon
completion of the questionnaire and the posttest, the participants were thanked.
It took approximately 40 minutes to complete the entire study.
Results
Raw learning outcome scores were transformed to percentage correct scores.
Family-wise type I error rate was set at .05 level. Cohen’s f was used as an
effect size index. Accordingly, .10, .25, and .40 are considered as the f values
for small, medium, and large effect sizes (Cohen, 1988).
Learning Time and Self-Explanation Time
A two-way analysis of variance (ANOVA) was conducted to evaluate the
effects of different types of visualizations (animated vs. static) and prompting
(prompts vs. no prompts) on learning time. The visualization type main effect
was not significant, F(1, 66) < 1.00, MSE = 9.37, p = .82, f = .03. The prompting
main effect was marginally significant with a medium effect, F(1, 66) = 3.56,
p = .06, f = .23, indicating that learners who were prompted (Mean = 11.25 min,
SD = .52 min) spent longer time than their peers who were not prompted (Mean =
9.87 min, SD = .52 min). There was no significant interaction, F(1, 66) < 1.00,
p = .52, f = .08.
A two-way ANOVA was also conducted to evaluate the effects of different
types of visualizations (animated vs. static) and prompting (prompts vs. no
prompts) on the time learners spent on typing written self-explanations. The
main effect of visualization type was non-significant, F(1, 66) < 1.00, MSE =
13.54, p = .58, f = .07, whereas the main effect of prompting was significant,
F(1, 66) = 81.90, p < .001, f = 1.11 (large effect). Participants who were prompted
(Mean = 8.43 min, SD = .62 min) spent significantly longer time typing their
self-explanations than their peers who were not prompted (Mean = .46 min,
SD = .62 min). There was no significant interaction between the visualization
type and prompting, F(1, 66) < 1.00, p = .55, f = .08. Means and SDs are presented
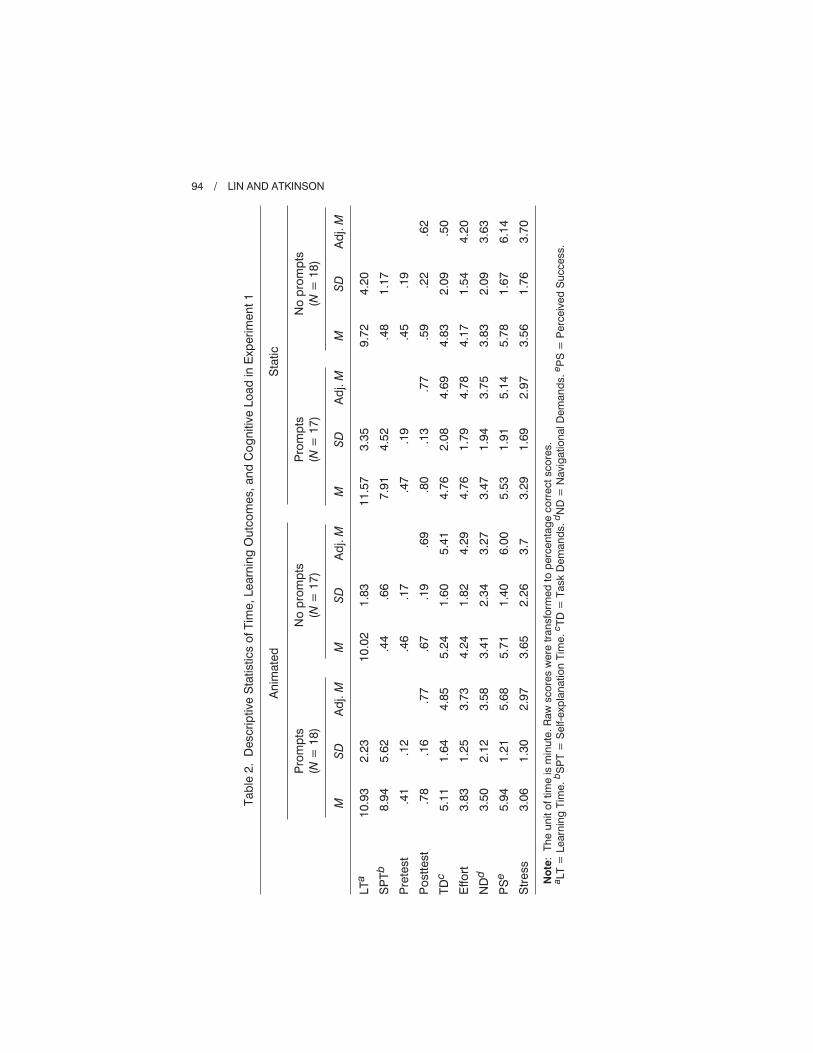
in Table 2.
Learning Outcomes
A one-way ANOVA was conducted to evaluate whether participants’ prior
knowledge substantially differed. The results showed that there was no sig-
nificant difference among the participants in the four experimental conditions,
F < 1.00, p > .73.
A two-way analysis of covariance (ANCOVA) was conducted to evaluate
the effects of different types of visualizations (animated vs. static) and prompting
(prompts vs. no prompts) on the posttest percentage correct scores. Both learning
time and the pretest percentage correct scores were used as covariates. The
ENHANCING LEARNING FROM DIFFERENT VISUALIZATIONS / 93
Tab
le2
.D
escri
ptive
Sta
tistics
ofT
ime,Learn
ing
Ou
tco
mes,an
dC
og
nitiv
eLo
ad
inE
xp
eri
men
t1
An
imate
dS
tatic
Pro
mp
ts
(N=
18
)
No
pro
mp
ts
(N=
17
)
Pro
mp
ts
(N=
17
)
No
pro
mp
ts
(N=
18
)
MS
DA
dj.
MM
SD
Ad
j.M
MS
DA
dj.
MM
SD
Ad
j.M
LT
a
SP
Tb
Pre
test
Po
stt
est
TD
c
Effo
rt
ND
d
PS
e
Str
ess
10
.93
8.9
4
.41
.78
5.1
1
3.8
3
3.5
0
5.9
4
3.0
6
2.2
3
5.6
2
.12
.16
1.6
4
1.2
5
2.1
2
1.2
1
1.3
0
.77
4.8
5
3.7
3
3.5
8
5.6
8
2.9
7
10
.02
.44
.46
.67
5.2
4
4.2
4
3.4
1
5.7
1
3.6
5
1.8
3
.66
.17
.19
1.6
0
1.8
2
2.3
4
1.4
0
2.2
6
.69
5.4
1
4.2
9
3.2
7
6.0
0
3.7
11
.57
7.9
1
.47
.80
4.7
6
4.7
6
3.4
7
5.5
3
3.2
9
3.3
5
4.5
2
.19
.13
2.0
8
1.7
9
1.9
4
1.9
1
1.6
9
.77
4.6
9
4.7
8
3.7
5
5.1
4
2.9
7
9.7
2
.48
.45
.59
4.8
3
4.1
7
3.8
3
5.7
8
3.5
6
4.2
0
1.1
7
.19
.22
2.0
9
1.5
4
2.0
9
1.6
7
1.7
6
.62
.50
4.2
0
3.6
3
6.1
4
3.7
0
No
te:
Th
eu
nit
oftim
eis
min
ute
.R
aw
sco
res
were
tran
sfo
rmed
top
erc
en
tag
eco
rrect
sco
res.
aLT
=Learn
ing
Tim
e.
bS
PT
=S
elf-e
xp
lan
atio
nT
ime.
cT
D=
Task
Dem
an
ds.
dN
D=
Navig
atio
nalD
em
an
ds.
eP
S=
Perc
eiv
ed
Su
ccess.
94 / LIN AND ATKINSON

correlation between these two covariates was small in size and non-significant
(r = –.07, p = .56). The homogeneity-of-slope assumption was not violated:
prompting-by-learning-time interaction, F(1, 63) = 2.01, MSE = .03, p = .16,
f = .18; all other covariate-by-independent-variable interactions were also non-
significant, all Fs < 1.00 and all ps > .51. The results of ANCOVA showed
that the visualization type main effect was not significant, F(1, 64) < 1.00, p = .36,
f = .11, which supported the equivalence hypothesis. On the other hand, learners
who were prompted to self-explain (adjusted Mean = .77, standard error = .03)
performed significantly better on the posttest than their peers who were not
prompted (adjusted Mean = .65, standard error = .03) after controlling for
learning time and the pretest percentage correct scores, F(1, 64) = 5.17, p = .03.
This indicates that self-explanation prompts had a positive effect on learn-
ing outcomes. The size of the effect (f = .28) was medium-to-large. There
was no significant interaction between the visualization type and prompting,
F(1, 64) < 1.00, p = .36, f = .11. Means (adjusted and unadjusted) and SDs
are presented in Table 2.
Cognitive Load
A two-way multivariate analysis of covariance (MANCOVA) was con-
ducted to assess the effects of visualization type (animated vs. static) and
prompting (prompts vs. no prompts) on the five cognitive load measures—
task demands, effort, navigational demands, perceived success, and stress.
Learning time and the pretest percentage correct scores were included as
covariates. No significant difference was found on the five cognitive load
measures for the visualization type main effect, Wilks’ lambda = .94,
F(5, 60) = 1.13, p = .35, f = .31, nor the prompting main effect, Wilks’ lambda =
.87, F(5, 60) = 1.68, p = .15, f = .37. Neither was there a significant interaction,
Wilks’ lambda = .94, F(5, 60) = .71, p = .62, f = .24. Means and SDs were
presented in Table 2.
Self-Explanations
Written self-explanations were elicited from 30 participants (1 in the static/
no-prompts condition, 1 in the animated/no-prompts, 14 in the animated/prompts
condition, and 14 in the static/prompts condition). Both quantity (word count)
and quality of self-explanations were examined. Means and SDs are presented
in Table 3.
A one-way ANOVA was conducted to evaluate the effect of visualization
type on the number of words produced by the participants. The results were non-
significant, F < 1.00, p > .39, indicating that the participants in the animated/
prompts condition and the static/prompts condition produced equivalent quantity
of self-explanations.
ENHANCING LEARNING FROM DIFFERENT VISUALIZATIONS / 95

Tab
le3
.D
escri
ptive
Sta
tistics
ofW
ritt
en
Self-E
xp
lan
atio
ns
inE
xp
eri
men
t1
An
imate
dS
tatic
Pro
mp
ts
(N=
14
)
No
pro
mp
ts
(N=
1)
Pro
mp
ts
(N=
14
)
No
pro
mp
ts
(N=
1)
MS
DA
dj.
MM
SD
Ad
j.M
MS
DA
dj.
MM
SD
Ad
j.M
Wo
rdC
ou
nt
Para
ph
rase
Go
alD
riven
Ela
bo
rative
Inco
rrect
22
9.2
9
11
.57
2.1
4
2.5
0
.71
11
0.1
1
4.8
2
1.9
2
1.7
9
.83
11
.02
1.9
1
2.3
3
.69
55
.00
—1
97
.64
10
.36
2.0
0
2.5
0
.64
79
.44
3.9
3
1.8
0
1.5
6
.74
10
.91
2.2
3
2.6
7
.67
75
.00
—
96 / LIN AND ATKINSON

A one-way MANCOVA was conducted to evaluate the effect of the visuali-
zation type on the four categories of self-explanations (paraphrase, goal-driven
self-explanations, elaborative self-explanations, and incorrect self-explanations),
using the number of words as covariate. The results were not significant, Wilks’
lambda = .94, F < 1.00, p > .85.
Conclusion and Discussion
The results of Experiment 1 showed that learners in the prompts conditions
spent longer time (both learning time and self-explanation time) than their peers
who were in the no-prompts conditions. We thus statistically controlled the
effects of learning time when evaluating the prompting effect on learning
outcomes. We found a positive, medium-to-large effect of prompting self-
explanations on learning in a multimedia environment that provided visuali-
zations, taking into account learners’ prior knowledge and learning time. This
positive effect is consistent with a number of previous studies, which revealed
the prompting effect in intelligent tutoring systems (Aleven & Koedinger,
2002), example-based learning environments (Atkinson et al., 2003; Berthold
& Renkl, 2009), and agent-based interactive learning environments (Mayer et al.,
2003). With regard to the three competing hypotheses (the animated hypothesis,
the static hypothesis, and the equivalence hypothesis), the results of Experiment 1
indicated that animated and static visualizations were equivalent in terms of
cognitive load, learning, and self-explanations, which supported the equiv-
alence hypothesis. Therefore, we could draw the conclusion that the visuali-
zation format, whether it is animated or static, is a surface feature in the multi-
media environment, and may have limited impact on learning and cognition.
However, when self-explanation prompts, a cognitive strategy, are used as a
supportive aid for these visualizations, efficient learning is very likely to be
fostered. One possible explanation is that prompted learners can successfully
activate their prior knowledge, integrate information from the external visuali-
zations with their existing mental models, and finally construct new coherent
mental models (Roy & Chi, 2005). As a result, prompting self-explanations
has a potential to bridge the gap between the external visualizations and internal
mental models.
However, we only collected self-explanation data from two participants in
the no-prompts conditions (one in the static/no-prompts condition and one in
the animated/no-prompts condition). Thus, we cannot rule out one possibility—
learners in the no-prompts conditions did not make use of the textbox during
learning, whereas their peers were elicited by prompts and engaged in typing
their self-explanations in the textbox. If this happened, the participants in
the prompts conditions and the no-prompts conditions were involved in
inequivalent activities. Therefore, we conducted Experiment 2 to address this
limitation.
ENHANCING LEARNING FROM DIFFERENT VISUALIZATIONS / 97

EXPERIMENT 2
Overview
In order to address the limitation in Experiment 1, we re-designed the
no-prompts conditions according to Berthold, Eysink, and Renkl (2009) and
Berthold and Renkl (2009) by adding a sentence “Please take notes in the
textbox in the right side” close to the textbox. By doing so, learners in the
no-prompts conditions may become aware of the function of the textbox and
make use of it to take notes during learning, an activity that is equivalent to
typing self-explanations in the textbox for those learners in the prompts con-
ditions. Consequently, the no-prompts conditions should be more equivalent to
the prompts conditions.
In Experiment 2, we examined the same research questions as addressed
in Experiment 1. Correspondingly, the independent variables, dependent vari-
ables, and en-route variables incorporated in Experiment 2 were identical to
those variables in Experiment 1. As in Experiment 1, written self-explanations
were also collected.
Method
Participants and Design
A total of 44 participants (25 females) from a large southwestern university in
the United States participated in the study. They were students recruited from the
same subject pool as Experiment 1 (i.e., a computer literacy course in the Teachers
College). They were all over 18 years old, and their average age was 21.59 (SD =
3.90). The participants’ age in this experiment was not significantly different from
those in Experiment 1 (p > .05). They participated in the experiment to earn course
credits, which is the same incentive provided to the participants in Experiment 1.
Experiment 2, identical to Experiment 1, used a pretest-posttest, 2 (animated
vs. static visualizations) × 2 (self-explanation prompts vs. none) between-subjects
design, in which the participants were randomly assigned in equal proportions (11
per condition) to one of the four experimental conditions: (a) animated/prompts;
(b) animated/no-prompts; (c) static/prompts; and (d) static/no-prompts.
Measures and Instruments
The measures and instruments used in Experiment 2 were identical to those
used in Experiment 1.
Computer-Based Multimedia Environment
The multimedia environment in Experiment 2 was almost identical to the one
used in Experiment 1 with one exception—in the no-prompts conditions, one
98 / LIN AND ATKINSON

sentence “Please take notes in the textbox in the right side” was added close to the
textbox (see Figure 4).
Coding Scheme of Self-Explanations
The coding scheme of participants’ written self-explanations was identical
to the one used in Experiment 1. Two raters independently coded half of the
participants’ written self-explanations. The inter-rater reliability was .95. There-
fore, one rater coded the remaining written self-explanations.
Procedure
Experiment 2 followed the same procedure as Experiment 1.
Results
Raw learning outcome scores were transformed to percentage correct scores.
Family-wise type I error rate was set at .05 level. Cohen’s f or Cohen’s d was
used as an effect size index.
Learning Time and Self-Explanation Time
A two-way ANOVA was conducted to evaluate the effects of different types
of visualizations (animated vs. static) and prompting (prompts vs. no prompts) on
ENHANCING LEARNING FROM DIFFERENT VISUALIZATIONS / 99
Figure 4. A sample screen of the re-designed no-prompts
condition in Experiment 2.

learning time. The visualization type main effect was not significant, F(1, 40) =
3.63, MSE = 5.87, p = .06, f = .30 (medium effect). The prompting main effect was
significant with a medium-to-large effect, F(1, 40) = 5.81, p = .02, f = .38,
indicating that learners who were prompted (Mean = 12.00 min, SD = 2.79 min)
spent longer time than their peers who were not prompted (Mean = 10.24 min,
SD = 2.43 min). The interaction between the visualization type and prompting
was also significant, F(1, 40) = 5.39, p = .03, f = .37 (medium-to-large effect). In
order to clarify the significant interaction, simple main effect analyses were
conducted. To control for the type I error, the Bonferroni procedure was used,
and the alpha level for each comparison was set at .013 (.05/4). The results showed
that participants in the animated/prompts condition (Mean = 13.54 min, SD = 2.89
min) spent significantly longer time learning the material than their peers who
were in: (a) the animated/no-prompts condition (Mean = 10.08 min, SD = 1.43
min), p = .002, Cohen’s d = 1.52; and (b) the static/prompts condition (Mean =
10.45 min, SD = 1.68 min), p = .005, Cohen’s d = 1.31. The results of the
remaining simple main effect analyses were not significant, ps > .72.
A two-way ANOVA was also conducted to evaluate the effects of visualization
type (animated vs. static) and prompting (prompts vs. no prompts) on the time
learners spent on typing written self-explanations. The prompting main effect
was significant, F(1, 40) = 14.34, MSE = 14.57, p = .001, f = .60 (large effect),
indicating that participants who were prompted (Mean = 8.71 min, SD = 3.81 min)
spent longer time than their peers who were not prompted (Mean = 4.35 min,
SD = 3.71 min). The main effect of visualization type and the interaction were
non-significant, both Fs < 1.00, both ps > .38.
Means and SDs were presented in Table 4.
Learning Outcomes
A one-way ANOVA was conducted to evaluate whether participants’ prior
knowledge significantly differed. The results showed that there was no sig-
nificant difference among the participants in the four experimental conditions,
F < 1.00, p > .74.
A two-way ANCOVA was conducted to evaluate the effects of visualization
type (animated vs. static) and prompting (prompts vs. no prompts) on the posttest
percentage scores. Both learning time and the pretest percentage scores were
used as covariates to control for the potential effects of learning time and prior
knowledge. The correlation between these two covariates was small in size and
non-significant (r = –.11, p = .47). The homogeneity-of-slope assumption was not
violated, all Fs < 1.00 and all ps > .83. The results of ANCOVA showed that the
visualization type main effect was not significant, F < 1.00, MSE = 5.52, p = .94.
However, the prompting main effect was significant, F(1, 38) = 12.21, p = .001,
f = .57 (large effect). In addition, there was a significant interaction between the
visualization type and prompting, F(1, 38) = 9.43, p = .004, f = .50 (large effect).
100 / LIN AND ATKINSON

Tab
le4
.D
escri
ptive
Sta
tistics
ofT
ime,Learn
ing
Ou
tco
mes,an
dC
og
nitiv
eLo
ad
inE
xp
eri
men
t2
An
imate
dS
tatic
Pro
mp
ts
(N=
11
)
No
pro
mp
ts
(N=
11
)
Pro
mp
ts
(N=
11
)
No
pro
mp
ts
(N=
11
)
MS
DA
dj.
MM
SD
Ad
j.M
MS
DA
dj.
MM
SD
Ad
j.M
LT
a
SP
Tb
Pre
test
Po
stt
est
TD
c
Effo
rt
ND
d
PS
e
Str
ess
13
.54
9.1
7
.46
.85
4.4
5
4.8
2
2.9
1
5.7
3
2.9
1
2.8
9
4.8
7
.15
.12
1.4
4
1.5
4
1.7
0
1.6
8
2.0
2
.83
4.0
9
4.7
4
2.8
4
5.5
1
2.8
1
10
.08
3.8
1
.41
.55
4.8
2
4.6
4
3.5
5
6.2
7
3.3
6
1.4
4
2.5
3
.26
.20
2.3
2
1.9
6
2.2
1
2.1
2
2.4
6
.58
5.0
1
4.5
8
3.4
6
6.5
9
3.2
8
10
.45
8.2
4
.43
.73
5.5
5
4.5
5
4.0
0
5.1
8
4.0
9
1.6
8
2.5
0
.14
.18
2.1
2
2.1
6
2.6
1
1.7
8
2.5
1
.76
5.4
4
4.4
6
3.8
9
5.2
5
3.9
7
10
.39
4.8
8
.50
.69
4.4
5
4.6
4
4.8
2
5.8
2
2.9
1
3.2
0
4.6
8
.20
.19
2.2
1
1.9
6
2.5
6
1.2
5
1.1
4
.69
4.7
3
4.8
6
4.4
5
5.6
5
3.2
1
No
te:
Th
eu
nit
oftim
eis
min
ute
.R
aw
sco
res
were
tran
sfo
rmed
top
erc
en
tag
eco
rrect
sco
res.
aLT
=Learn
ing
Tim
e.
bS
PT
=S
elf-e
xp
lan
atio
nT
ime.
cT
D=
Task
Dem
an
ds.
dN
D=
Navig
atio
nalD
em
an
ds.
eP
S=
Perc
eiv
ed
Su
ccess.
ENHANCING LEARNING FROM DIFFERENT VISUALIZATIONS / 101

To clarify the significant interaction, simple main effect analyses were
conducted, controlling for the pretest percentage scores and learning time. To
control for the type I error, the Bonferroni procedure was used, and the alpha
level for each comparison was set at .013 (.05/4). The results showed that, taking
into account the pretest percentage scores and learning time, the animated/prompts
condition (adjusted Mean = .83, standard error = .04) had significantly higher
posttest scores than the animated/no-prompts condition (adjusted Mean = .58,
standard error = .04), p < .001, Cohen’s d = .93. The remaining comparisons were
not significant, all ps > .10.
Means (adjusted and unadjusted) and SDs were presented in Table 4.
Cognitive Load
A two-way MANCOVA was conducted to assess the effects of visualization
type (animated vs. static) and prompting (prompts vs. no prompts) on the five
cognitive load measures—task demands, effort, navigational demands, perceived
success, and stress. Learning time and the pretest percentage scores were included
as covariates. No significant difference was found on the five cognitive load
measures for the visualization type main effect, Wilks’ lambda = .80, F(5, 34) =
1.71, p = .16, f = .50, the prompting main effect, Wilks’ lambda = .91, F(5, 34) =
.67, p = .65, f = .31, or the interaction, Wilks’ lambda = .78, F(5, 34) = 1.90,
p = .12, f = .53.
Self-Explanations
Written self-explanations were elicited from 42 participants (11 in the static/
no-prompts condition, 10 in the animated/no-prompts, 10 in the animated/prompts
condition, and 11 in the static/prompts condition). Both quantity and quality of
self-explanations were examined.
A two-way ANOVA was conducted to evaluate the effect of visualization
type and prompting on the number of words produced by the participants. The
results showed that the prompting main effect was significant, F(1, 38) = 6.62,
MSE = 8295.53, p = .01, f = .42 (large effect), indicating that the participants
who were prompted (Mean = 177.52, SD = 99.35) produced significantly more
words than their peers who were not prompted (Mean = 103.52, SD = 81.87).
Neither the visualization type main effect nor the interaction was significant; for
the visualization type main effect, F < 1.00, p > .46, for the interaction, F(1, 38) =
1.40, p = .24, f = .19.
A two-way MANCOVA was conducted to evaluate the effects of visualization
type and prompting on the four categories of self-explanations (paraphrase,
goal-driven self-explanations, elaborative self-explanations, and incorrect self-
explanations), using the number of words as covariate. The results showed that
neither the visualization type main effect nor the prompting main effect was
significant: for the visualization type main effect, Wilks’ lambda = .92, F < 1.00,
102 / LIN AND ATKINSON

p > .50; for the prompting main effect, Wilks’ lambda = .94, F < 1.00, p > .68.
The interaction was significant, Wilks’ lambda = .66, F(4, 34) = 4.35, p = .006,
f = .71. Four separate ANCOVAs were conducted as follow-up tests, using the
number of words as covariate. The results showed that there was a significant
interaction between the visualization type and prompting on the goal-driven
self-explanations, F(1, 37) = 16.26, MSE = 101.72, p < .001, f = .66 (large effect).
Simple main effect analyses were conducted to clarify the significant inter-
action. To control for the type I error, the Bonferroni procedure was used,
and the alpha level for each comparison was set at .013 (.05/4). The results
showed that learners in the animated/prompts condition (adjusted Mean = 7.92,
standard error = .79) produced more goal-driven self-explanations than those in
the animated/ no-prompts condition (adjusted Mean = 4.40, standard error = .80),
p = .004, Cohen’s d = 1.15. But this prompting effect disappeared when learners
were presented with static visualizations, p > .12. On the other hand, learners in
the animated/prompts condition produced more goal-driven self-explanations
than those in the static/prompts condition (adjusted Mean = 3.49, standard error =
.80), p < .001, Cohen’s d = .63. But this positive animation effect disappeared
when no prompts were presented, p > .10. The results of other follow-up
ANCOVAs were non-significant, all ps > .10. Means and SDs were presented
in Table 5.
CONCLUSION
In Experiment 2, we re-designed the no prompts conditions in the hope of
ruling out the possibility that the positive prompting self-explanation effect
revealed in Experiment 1 may be due to the inequivalence between the prompts
conditions and the no-prompts conditions. The results of Experiment 2 partially
replicated the self-explanation effect found in Experiment 1: (a) learners in the
prompts conditions spent more time in learning and self-explaining than their
peers in the no-prompts conditions; (b) after controlling for the effects of learning
time and prior knowledge, prompting self-explanations fostered learning out-
comes compared to no prompts; and (c) with regard to the three hypotheses related
to learning from different visualizations, the results of Experiment 2 supported
the equivalence hypothesis (i.e., the animated and statics visualizations were
equivalent in terms of learning outcomes and cognitive load). These results found
in Experiment 2 thus provided evidence to support the validity of the findings
revealed in Experiment 1.
In addition, Experiment 2 revealed some interesting findings that Experiment 1
didn’t. With respect to self-explanations, the results of Experiment 2 showed
that learners who were prompted produced more words for self-explanations,
resulting in spending longer time typing their self-explanations. Experiment 2
also showed a large interaction effect between the different types of visualizations
and self-explanation prompts on the goal-driven self-explanations, a category that
ENHANCING LEARNING FROM DIFFERENT VISUALIZATIONS / 103

Tab
le5
.D
escri
ptive
Sta
tistics
ofW
ritt
en
Self-E
xp
lan
atio
ns
inE
xp
eri
men
t2
An
imate
dS
tatic
Pro
mp
ts
(N=
10
)
No
pro
mp
ts
(N=
10
)
Pro
mp
ts
(N=
11
)
No
pro
mp
ts
(N=
11
)
MS
DA
dj.
MM
SD
Ad
j.M
MS
DA
dj.
MM
SD
Ad
j.M
Wo
rdC
ou
nt
Para
ph
rase
Go
alD
riven
Ela
bo
rative
Inco
rrect
14
9.1
4.0
0
8.2
0
7.3
0
.30
10
6.8
8
2.6
2
5.3
1
4.7
6
.67
3.8
1
7.9
2
7.0
3
.30
11
0.0
0
2.7
0
3.4
0
4.5
0
.20
74
.78
2.2
1
2.5
5
3.5
3
.42
3.3
8
4.4
0
5.4
5
.21
20
3.3
6
5.5
5
5.5
5
7.2
7
.18
88
.97
2.6
2
2.6
6
2.2
8
.39
4.1
6
3.4
9
5.3
2
.17
97
.64
2.3
6
4.9
1
5.0
0
.18
91
.07
1.8
6
4.3
2
3.7
4
.40
3.3
1
6.3
1
6.3
3
.19
104 / LIN AND ATKINSON

represents a good quality of self-explanations (Roy & Chi, 2005). Specifically,
learners who were prompted when studying animations produced a better quality
of self-explanations (more goal-driven self-explanations) and had better learning
outcomes than their peers. But this effect was conditional upon the combination
of animated visuals and prompts. These results provided empirical evidence that
the positive effect of the surface feature—animated visualizations—is contingent
upon deep cognitive processes induced by self-explanation prompts in learning
the human cardiovascular system. Self-explanation prompts may be the con-
tributing factor that bridges the gap and enhances the coherence between the
external animations and internal mental models. In sum, these additional findings
revealed from Experiment 2 implicate the specific conditions when visualiza-
tions and self-explanation prompts optimize learning and cognition, which goes
beyond Renkl and Atkinson’s recommendation to use visualizations to foster
self-explanations (2002).
GENERAL DISCUSSION
From the cognitive load perspective, we formulated three competing hypoth-
eses with regard to the relative effectiveness of animations over static visuali-
zations: (a) animated visualizations can free up more cognitive resources for
other information processing than static visualizations (the animated hypothesis);
(b) static visualizations can reduce extraneous information by their key frames
and enhance germane processing by virtue of making inferences (the static
hypothesis); and (c) animated and static visualizations are equivalent in terms
of impacting learning and cognitive load, as they are surface features that
rarely contribute to the mental model construction. The results and conclusions
in the current literature tend to be mixed, which calls for more investiga-
tions, especially of those specific conditions where the content and structure
of animations are aligned to learners’ internal representations (Tversky et al.,
2002). Therefore, we conducted two experiments to investigate which of these
three competing hypotheses was supported in a multimedia environment, in
which self-explanation prompts were manipulated to be either present or absent
in the learning environment.
Which hypothesis, the animated hypothesis, the static hypothesis, or the equiv-
alence hypothesis, should be supported? The major results of the two experi-
ments supported the equivalence hypothesis. Based on these results, we could
conclude that in the specific context—learning human cardiovascular system,
animated visualizations and static visualizations are equivalent with regard to
learning, cognitive load, and self-explanations. A number of previous studies
also revealed similar findings (Boucheix & Schneider, 2009; Kim et al., 2007;
Mayer et al., 2007; Münzer et al., 2009). However, we should interpret these
results that supported the equivalence hypothesis with caution, as we also found
interaction effects in Experiment 2. Furthermore, considering a number of studies
ENHANCING LEARNING FROM DIFFERENT VISUALIZATIONS / 105

have investigated the animated-static comparison, it may be more meaningful
to discuss the effectiveness of animated and static visualizations in a specific
condition (Hegarty, 2004), such as providing self-explanation prompts, which
we will discuss below.
Is prompting self-explanation an effective technique to promote learning in a
multimedia environment? In Experiment 1 and 2, we found that self-explanation
prompts promoted learning outcomes in the multimedia environment. These
results are consistent with a number of previous studies (e.g., Aleven &
Koedinger, 2002; Atkinson et al., 2003; Berthold et al., 2009; Berthold & Renkl,
2009; Mayer et al., 2003). One limitation of Experiment 1 is that we cannot
rule out the possibility that learners in the no-prompts conditions did not make
use of the textbox provided. As a result, we re-designed the no-prompts condi-
tions in Experiment 2, and we did find the effect of self-explanation prompts on
learning compared to no prompts, which replicated the results in Experiment 1.
Therefore, our research provides more empirical evidence to the literature that
prompting self-explanation is a domain-general activity that promotes learning in
a wide range of different domains (e.g., probability theory, Atkinson et al., 2003;
Berthold et al., 2009; geometry, Aleven & Koedinger, 2002; mechanical systems,
Mayer et al., 2003; and human cardiovascular system for this study) and in diverse
learning environments (e.g., example-based learning environments, intelligent
tutoring systems, and multimedia environments).
Does the effect of prompting self-explanation differ in different types of visual-
izations (the interaction effect)? In addition to the main effect of prompting
self-explanations, in Experiment 2 we found large interaction effects between
the visualization type (animated vs. static visualizations) and prompting self-
explanations on learning outcomes, learning time, and the goal-driven self-
explanations. Specifically, the animated/prompts condition was significantly
better than other conditions. One possible explanation for the effectiveness of
animations is that self-explanations prompts supported learning with animations
by inducing cognitive processes, in which learners successfully build connec-
tions between the external animated visualizations and internal mental models to
construct new mental models. This is one of the conditions that Tversky et al.
(2002) describes as the conditions for the successful use of animations. And we
provided empirical evidence to support this claim. However, we did not find this
result in Experiment 1. And learners’ self-explanation times in Experiment 1
were, on average, shorter than the self-explanation times in Experiment 2. It
may be due to individual differences in self-explaining (Roy & Chi, 2005).
“High self-explainers” may be more skilled and put more time than “low self-
explainers” to generate self-explanations (Chi, de Leeuw, Chiu, & LaVancher,
1994), which the results related to self-explanations reflected. Therefore, we
may consider providing self-explanation trainings to all participants in future
research to reduce or eliminate the differences of self-explanation skills among
106 / LIN AND ATKINSON

individuals. We also provide another possible explanation from the motivation
perspective. Although participants’ extrinsic motivation may be the same due to
the same incentive provided in the two experiments, their levels of intrinsic
motivation (cf. Ryan, 1982) may be different. This, in turn, results in different
levels of engagement in cognitive process, such as self-explanations (Moreno &
Mayer, 2007). However, as we did not measure participants’ intrinsic motivation,
it is unknown whether it plays a role in explaining the observed difference. Future
studies should address this limitation by including motivation related measures. In
sum, the educational implication is that self-explanation prompts are a potential
instructional aid that the instructional designers could consider incorporating in
the learning environments. The combination of self-explanation prompts and
instructional animations may be one of the conditions that optimize the
effectiveness of animations.
Do different types of visualizations and prompting self-explanation have
any impacts on the quality and quantity of self-explanations? We found in
Experiment 2 but not in Experiment 1 that prompts significantly impacted the
quality (goal-driven self-explanations) and the quantity (the total number of
words) of self-explanations when animated visualizations were presented for
instruction. These results implicate that it is not a specific type of technology-
based visual displays but the combination of visualizations and cognitive
strategies (such as prompting self-explanations) that facilitates learners’
process of constructing mental models from external information. How-
ever, it is unclear why prompts only significantly elicited goal-driven self-
explanations, instead of all categories of self-explanations. Also, as mentioned
in the above paragraph, there may be some individual differences in terms of
self-explanation skills which the current study did not control. These are the
limitations that the two experiments cannot address. In addition to providing
self-explanation trainings, researchers could consider utilizing eye tracking
techniques to reveal the “online” cognitive processes in the future (Mayer,
2010). It is of note in Experiment 2 that the pattern of the significant interaction
on the goal-driven self-explanations is consistent with the interaction pattern of
the learning outcomes. This may indicate that self-explanation activity engages
learners in the mental model construction, which leads to the improved learning
(Roy & Chi, 2005).
The recommendations from the two experiments for instructional designers,
developers, and educational professionals are that different visual displays may
have equivalent impact on learning, but cognitive strategies play an important
role in learning and instruction. Although technologies advance in a surprising
speed, instructional designers should pay attention to learners’ cognitive aspects,
and utilize the combination of technology-based visualizations and cognitive
strategies (such as self-explanations prompts) in the design and development of
the learning environments.
ENHANCING LEARNING FROM DIFFERENT VISUALIZATIONS / 107
REFERENCES
Aleven, V. A., & Koedinger, K. R. (2002). An effective metacognitive strategy: Learning
by doing and explaining with a computer-based cognitive tutor. Cognitive Science, 26,
147-179.
Arguel, A., & Jamet, E. (2009). Using video and static pictures to improve learning of
procedural contents. Computers in Human Behavior, 25(2), 354-359.
Atkinson, R. K., Renkl, A., & Merrill, M. M. (2003). Transitioning from studying examples
to solving problems: Effects of self-explanation prompts and fading worked-out steps.
Journal of Educational Psychology, 95(4), 774-783.
Ayres, P., Marcus, N., Chan, C., & Qian, N. (2009). Learning hand manipulative
tasks: When instructional animations are superior to equivalent static representations.
Computers in Human Behavior, 25(2), 348-353.
Berthold, K., Eysink, T., & Renkl, A. (2009). Assisting self-explanation prompts are more
effective than open prompts when learning with multiple representations. Instructional
Science, 37(4), 345-363.
Berthold, K., & Renkl, A. (2009). Instructional aids to support a conceptual understanding
of multiple representations. Journal of Educational Psychology, 101(1), 70-87.
Boucheix, J., & Schneider, E. (2009). Static and animated presentations in learning
dynamic mechanical systems. Learning and Instruction, 19(2), 112-127.
Catrambone, R., & Seay, A. F. (2002). Using animation to help students learn computer
algorithms. Human Factors, 44(3), 495-511.
Chi, M. T. H., de Leeuw, N., Chiu, M., & LaVancher, C. (1994). Eliciting self-explanations
improves understanding. Cognitive Science, 18(3), 439-477.
Cohen, J. (1988). Statistical power analysis for the behavioral sciences (2nd ed.). Hillsdale,
NJ: Lawrence Erlbaum Associates.
de Koning, B. B., Tabbers, H. K., Rikers, R. M. J. P., & Paas, F. (2010a). Improved
effectiveness of cueing by self-explanations when learning from a complex animation.
Applied Cognitive Psychology, 25, 183-194.
de Koning, B. B., Tabbers, H. K., Rikers, R. M. J. P., & Paas, F. (2010b). Learning
by generating vs. receiving instructional explanations: Two approaches to enhance
attention cueing in animations. Computers & Education, 55(2), 681-691.
Dunsworth, Q., & Atkinson, R. K. (2007). Fostering multimedia learning of science:
Exploring the role of an animated agent’s image. Computers & Education, 49(3),
677-690.
Gerjets, P., Scheiter, K., & Catrambone, R. (2004). Designing instructional examples to
reduce intrinsic cognitive load: Molar versus modular presentation of solution pro-
cedures. Instructional Science, 32(1-2), 33-58.
Gerjets, P., Scheiter, K., & Catrambone, R. (2006). Can learning from molar and modular
worked examples be enhanced by providing instructional explanations and prompting
self-explanations? Learning and Instruction, 16(2), 104-121.
Große, C. S., & Renkl, A. (2007). Finding and fixing errors in worked examples: Can
this foster learning outcomes? Learning and Instruction, 17(6), 612-634.
Hart, S. G., & Staveland, L. E. (1988). Development of NASA-TLX (task load
index): Results of experimental and theoretical research. In P. A. Hancock &
N. Meshkati (Eds.), Human mental workload (pp. 139-183). Amsterdam, Holland:
North-Holland.
108 / LIN AND ATKINSON

Hegarty, M. (1992). Mental animation: Inferring motion from static displays of mechanical
systems. Journal of Experimental Psychology: Learning, Memory, and Cognition,
18(5), 1084-1102.
Hegarty, M. (2004). Dynamic visualizations and learning: Getting to the difficult questions.
Learning and Instruction, 14(3), 343-351.
Hegarty, M., Kriz, S., & Cate, C. (2003). The roles of mental animations and external
animations in understanding mechanical systems. Cognition and Instruction, 21(4),
325-360.
Kim, S., Yoon, M., Whang, S. M., Tversky, B., & Morrison, J. B. (2007). The effect of
animation on comprehension and interest. Journal of Computer Assisted Learning,
23(3), 260-270.
Kozma, R. B. (1994). Will media influence learning? Reframing the debate. Educational
Technology Research and Development, 42, 7-19.
Lai, S. (2000). Increasing associative learning of abstract concepts through audiovisual
redundancy. Journal of Educational Computing Research, 23(3), 275-289.
Large, A., Beheshti, J., Breuleux, A., & Renaud, A. (1996). Effect of animation in
enhancing descriptive and procedural texts in a multimedia learning environment.
Journal of the American Society for Information Science, 47(6), 437-448.
Lin, L., & Atkinson, R. K. (2011). Using animations and visual cueing to support learning
of scientific concepts and processes. Computers & Education, 56(3), 650-658.
Mayer, R. E. (2010). Unique contributions of eye-tracking research to the study of
leaning with graphics. Learning and Instruction, 20, 167-171.
Mayer, R. E., Deleeuw, K. E., & Ayres, P. (2007). Creating retroactive and pro-
active interference in multimedia learning. Applied Cognitive Psychology. 21(6),
795-809.
Mayer, R. E., Dow, G. T., & Mayer, S. (2003). Multimedia learning in an interactive
self-explaining environment: What works in the design of agent-based microworlds?
Journal of Educational Psychology, 95(4), 806-812.
Mayer, R. E., Hegarty, M., Mayer, S., & Campbell, J. (2005). When static media promote
active learning: Annotated illustrations versus narrated animations in multimedia
instruction. Journal of Experimental Psychology: Applied, 11(4), 256-265.
Michas, I. C., & Berry, D. C. (2000). Learning a procedural task: Effectiveness of
multimedia presentations. Applied Cognitive Psychology, 14(6), 555-575.
Moreno, R., & Mayer, R. E. (2007). Interactive multimodal learning environments.
Educational Psychology Review, 19, 309-326.
Münzer, S., Seufert, T., & Brünken, R. (2009). Learning from multimedia presentations:
Facilitation function of animations and spatial abilities. Learning and Individual
Differences, 19(4), 481-485.
Paas, F., Renkl, A., & Sweller, J. (2003). Cognitive load theory and instructional design:
Recent developments. Educational Psychologist, 38(1), 1-4.
Park, O. C., & Gittelman, S. S. (1992). Selective use of animation and feedback in
computer-based instruction. Educational Technology, Research, and Development,
40, 27-38.
Renkl, A., & Atkinson, R. K. (2002). Learning from examples: Fostering self-explanations
in computer-based learning environments. Interactive Learning Environments, 10,
105-119.
ENHANCING LEARNING FROM DIFFERENT VISUALIZATIONS / 109

Rieber, L. P. (1990). Using computer animated graphics with science instruction with
children. Journal of Educational Psychology, 82(1), 135-140.
Roy, M., & Chi, M. T. H. (2005). The self-explanation principle in multimedia learning.
R. E. Mayer (Ed.) (pp. 271-286). New York, NY: Cambridge University Press.
Ryan, R. M. (1982). Control and information in the intrapersonal sphere: An extension
of cognitive evaluation theory. Journal of Personality and Social Psychology, 43,
450-461.
Scheiter, K., Gerjets, P., & Catrambone, R. (2006). Making the abstract concrete: Visual-
izing mathematical solution procedures. Computers in Human Behavior, 22(1), 9-25.
Schnotz, W., & Kurschner, C. (2007). A reconsideration of cognitive load theory. Edu-
cational Psychology Review, 19(4), 469-508.
Sweller, J., van Merrienboer, J. J. G., & Paas, F. (1998). Cognitive architecture and
instructional design. Educational Psychology Review, 10(3), 251-296.
Thompson, S. V., & Riding, R. J. (1990). The effect of animated diagrams on the
understanding of a mathematical demonstration in 11- to 14-year-old pupils. British
Journal of Educational Psychology, 60, 93-98.
Tversky, B., Morrison, J. B., & Betrancourt, M. (2002). Animation: Can it facilitate?
International Journal of Human-Computer Studies, 57(4), 247-262.
Wong, A., Marcus, N., Ayres, P., Smith, L., Cooper, G. A., Paas, F., et al. (2009).
Instructional animations can be superior to statics when learning human motor skills.
Computers in Human Behavior, 25(2), 339-347.
Yang, E., Andre, T., & Greenbowe, T. J. (2003). Spatial ability and the impact of
visualization/animation on learning electrochemistry. International Journal of Science
Education, 25(3), 329.
Direct reprint requests to:
Dr. Lijia Lin
School of Psychology and Cognitive Science
East China Normal University
Shanghai, 200062, China
e-mail: [email protected]
110 / LIN AND ATKINSON
Copyright © 2022 FDOKUMEN