Recognizing Contribution in Wikis: Authorship Categories, Algorithms, and Visualizations
14
Recognizing Contributions in Wikis: Authorship Categories, Algorithms, and Visualizations Ofer Arazy Department of Accounting and Management Information Systems (AMIS) School of Business, University of Alberta, Edmonton, AB T6G 2E8 Canada. E-mail: [email protected] Eleni Stroulia Computing Science Department, University of Alberta, Edmonton, AB T6G 2E8 Canada. E-mail: {stroulia}@ualberta.ca Stan Ruecker Humanities Computing Program, Department of English and Film Studies and Office of Interdisciplinary Studies, University of Alberta, Edmonton, AB T6G 2E5 Canada. E-mail: [email protected] Cristina Arias Humanities Computing Program, Office of Interdisciplinary Studies, University of Alberta, Edmonton, AB T6G 2E5 Canada. E-mail: [email protected] Carlos Fiorentino Department of Art and Design, University of Alberta, Edmonton, AB T6G 2C9 Canada. E-mail: carlos.fi[email protected] Veselin Ganev and TimothyYau Computing Science Department, University of Alberta, Edmonton, AB T6G 2E8 Canada. E-mail: {vganev, thyau}@ualberta Wikis are designed to support collaborative editing, with- out focusing on individual contribution, such that it is not straightforward to determine who contributed to a spe- cific page. However, as wikis are increasingly adopted in settings such as business, government, and education, where editors are largely driven by career goals, there is a perceived need to modify wikis so that each editor’s contributions are clearly presented. In this paper we intro- duce an approach for assessing the contributions of wiki editors along several authorship categories, as well as a variety of information glyphs for visualizing this informa- tion. We report on three types of analysis: (a) assess- ing the accuracy of the algorithms, (b) estimating the understandability of the visualizations, and (c) exploring wiki editors’ perceptions regarding the extent to which such an approach is likely to change their behavior. Our findings demonstrate that our proposed automated techniques can estimate fairly accurately the quantity Received December 10, 2009; revised January 25, 2010; accepted January 25, 2010 © 2010 ASIS&T • Published online 5 March 2010 in Wiley InterScience (www.interscience.wiley.com). DOI: 10.1002/asi.21326 of editors’ contributions across various authorship cat- egories, and that the visualizations we introduced can clearly convey this information to users. Moreover, our user study suggests that such tools are likely to change wiki editors’ behavior. We discuss both the potential ben- efits and risks associated with solutions for estimating and visualizing wiki contributions. Introduction Wiki, derived from the Hawaiian word for fast, is a Web-based collaborative authoring application (Leuf & Cunningham, 2001; Wagner, 2004). In some ways, wikis are similar to discussion forums and blogs; both technologies enable communities to share information on the Web. At the same time, there is a distinct difference between these tech- nologies. In forums and blogs, users post distinct entries that are appended sequentially, according to their timestamp, to a single page. As a result, each individual post is directly asso- ciated with its contributor. In wikis, on the other hand, users can edit any part of the content of a wiki page; as a result, at any point in time the most recent page version reflects the cumulative contributions of all users that have edited the page JOURNAL OF THE AMERICAN SOCIETY FOR INFORMATION SCIENCE AND TECHNOLOGY, 61(6):1166–1179, 2010
-
Upload
independent -
Category
Documents
-
view
0 -
download
0
Transcript of Recognizing Contribution in Wikis: Authorship Categories, Algorithms, and Visualizations

Recognizing Contributions in Wikis: AuthorshipCategories, Algorithms, and Visualizations
Ofer ArazyDepartment of Accounting and Management Information Systems (AMIS) School of Business,University of Alberta, Edmonton, AB T6G 2E8 Canada. E-mail: [email protected]
Eleni StrouliaComputing Science Department, University of Alberta, Edmonton, AB T6G 2E8 Canada.E-mail: {stroulia}@ualberta.ca
Stan RueckerHumanities Computing Program, Department of English and Film Studies and Office of InterdisciplinaryStudies, University of Alberta, Edmonton, AB T6G 2E5 Canada. E-mail: [email protected]
Cristina AriasHumanities Computing Program, Office of Interdisciplinary Studies, University of Alberta, Edmonton,AB T6G 2E5 Canada. E-mail: [email protected]
Carlos FiorentinoDepartment of Art and Design, University of Alberta, Edmonton, AB T6G 2C9 Canada.E-mail: [email protected]
Veselin Ganev and Timothy YauComputing Science Department, University of Alberta, Edmonton, AB T6G 2E8 Canada.E-mail: {vganev, thyau}@ualberta
Wikis are designed to support collaborative editing, with-out focusing on individual contribution, such that it is notstraightforward to determine who contributed to a spe-cific page. However, as wikis are increasingly adopted insettings such as business, government, and education,where editors are largely driven by career goals, thereis a perceived need to modify wikis so that each editor’scontributions are clearly presented. In this paper we intro-duce an approach for assessing the contributions of wikieditors along several authorship categories, as well as avariety of information glyphs for visualizing this informa-tion. We report on three types of analysis: (a) assess-ing the accuracy of the algorithms, (b) estimating theunderstandability of the visualizations, and (c) exploringwiki editors’ perceptions regarding the extent to whichsuch an approach is likely to change their behavior.Our findings demonstrate that our proposed automatedtechniques can estimate fairly accurately the quantity
Received December 10, 2009; revised January 25, 2010; accepted January25, 2010
© 2010 ASIS&T • Published online 5 March 2010 in Wiley InterScience(www.interscience.wiley.com). DOI: 10.1002/asi.21326
of editors’ contributions across various authorship cat-egories, and that the visualizations we introduced canclearly convey this information to users. Moreover, ouruser study suggests that such tools are likely to changewiki editors’ behavior. We discuss both the potential ben-efits and risks associated with solutions for estimatingand visualizing wiki contributions.
Introduction
Wiki, derived from the Hawaiian word for fast, is aWeb-based collaborative authoring application (Leuf &Cunningham, 2001; Wagner, 2004). In some ways, wikis aresimilar to discussion forums and blogs; both technologiesenable communities to share information on the Web. At thesame time, there is a distinct difference between these tech-nologies. In forums and blogs, users post distinct entries thatare appended sequentially, according to their timestamp, to asingle page. As a result, each individual post is directly asso-ciated with its contributor. In wikis, on the other hand, userscan edit any part of the content of a wiki page; as a result,at any point in time the most recent page version reflects thecumulative contributions of all users that have edited the page
JOURNAL OF THE AMERICAN SOCIETY FOR INFORMATION SCIENCE AND TECHNOLOGY, 61(6):1166–1179, 2010

until then, without maintaining explicit references betweencontent parts and editors’ contributions on the article page(although such information could be derived from the log ofwiki activity—the “History” tab).
Wikis have already had a profound impact on the Internetat large, fundamentally changing the ways communities ofpractice collaborate online, with Wikipedia being the mostprominent example (Nov, 2007; Fallis, 2008; Lim, 2009).In addition, recent evidence suggests that wikis are quicklypenetrating corporate settings (Majchrzak, Wagner, & Yates,2006; Patterson, Gellatly, Arazy, & Jang, 2007; Arazy,Gellatly, Jang, & Patterson, 2009), government (Wagner,2006), and education (Kane & Fichman, 2009). While wikiswere designed for the kinds of openness and democracy thatare typical of Internet culture (Stvilia, Twidale, Smith, &Gasser, 2008), some of wikis’ design features may not besuitable for organizational work processes. In this paper wefocus our attention on a specific design feature: authorshipnot being foregrounded. Wikis were originally designed tohide the association between a wiki page and the editors whohave produced it (Arazy & Stroulia, 2009). Two advantagesare associated with this design, and explain why it is appro-priate for Internet wikis. First, the lack of explicit authorshipannotations around wiki pages eliminates the social biasesassociated with group deliberation, thus contributing to thediversity of opinions and to the collective intelligence ofthe group (Sunstein, 2006). Second, by not emphasizingauthorship, editors are directed toward group goals, ratherthan individual benefits. Notwithstanding these advantages,this design is less suitable when users are motivated primarilyby self-promotion and career-advancement and when trace-ability and provenance are of key importance. Thus, the mainlimitation of not highlighting authorship in organizationalwork processes is that it hampers accountability and reducesthe motivations of wiki users to contribute content. For exam-ple, there is evidence suggesting that users will contributemore when they know that their contribution is visible and isvalued (Rashid et al., 2006).
While in some settings it would be sufficient to calculateand present editors’ overall contribution, we believe that inmany cases it would be important to distinguish between thetypes of contributions editors make. There are various waysin which editors can make contributions to a wiki page, e.g.,one editor may add new content, another editor may reorga-nize the text, and a third may remove redundant text to makethe page flow better. We believe that a method for estimatingeditors’ contributions should capture these various author-ship categories. Building on earlier works (Pfeil, Zaphiris, &Ang, 2008; Ehmann, Large, & Beheshti, et al., 2008), wepropose the following primary categories of wiki authorshiptasks: (a) adding content, (b) enabling navigation within thepage, (c) deleting content, (d) linking to other pages, and(e) proofreading.
Our study had two objectives. The first was to design andvalidate a set of algorithms for capturing wiki editors’ contri-butions across the various authorship categories mentionedabove, as well as an overall contribution score. It should be
stressed that our focus is on the quantity of an editor’s contri-butions; issues related to estimation of contributions’ qualityare beyond the scope of our study and are discussed at theconclusion of this paper. The second objective was to exploreseveral visualization techniques for presenting informationregarding editors’ contributions on the wiki page and to testthe understandability of these visualizations, as well as theextent to which they are likely to impact wiki users’ partici-pation. We expect that if an estimate of editor contributionswas presented on the wiki, wiki users would be encouragedto participate in the collaborative authoring process. Sincethe extent to which such an attribution tool impacts users’motivations and participation depends on the setting wherethe wiki is deployed, our user study focuses on two alter-native wiki usage contexts. The first is a classroom setting,where students work together toward a group project. Thesecond setting is a collaborative research environment. Weexpect that the impacts—both positive and negative—of anattribution tool on users’ motivations for participation wouldbe stronger in the classroom setting, where users see a poten-tial impact on their evaluation (i.e., they suspect that thecontribution score would affect, either directly or indirectly,their grade).
The remainder of the paper is organized as follows. Nextwe review related research; we proceed to describe our meth-ods for estimating editors’ contribution and for visualizingthis information; the section that follows reports the resultsof the evaluation of the algorithms and visualizations; we thendiscuss the results, and conclude with our reflection on thefindings, discussion of this study’s limitations, and an outlineof our plans for future work.
Related Work
Several recent studies have discussed wiki authorshiptasks and proposed extensions to wikis that would automati-cally calculate users’ contributions and associate a wiki pagewith its contributing editors. In the following sections wereview related works on wiki authorship tasks, algorithmsfor calculating editors’ contributions, and visualizations ofcontribution data.
Wiki Authorship Tasks
Users can make various contributions to a wiki: add newcontent, remove redundant text, restructure existing content,etc. There seems to be little theoretical guidance that wouldhelp in categorizing these various wiki editing types. Whileextant theory on professional editorial work describes edit-ing strategies used by experienced editors (Bisaillon, 2007),the context of professional editorial work, where the roles ofauthor and editor are well defined and quite distinct, is sub-stantially different from wiki collaborative authoring, wherea document is coauthored by its editors. Thus, existing theo-retical frameworks of professional editing cannot be directlyapplied to the context of wiki authoring.
Recent studies, however, have worked in a more emer-gent manner to classify the wiki editorial tasks. Pfeil et al.
JOURNAL OF THE AMERICAN SOCIETY FOR INFORMATION SCIENCE AND TECHNOLOGY—June 2010 1167DOI: 10.1002/asi

(2008) employed a grounded theory approach to elicit a cat-egorization of Wikipedia contribution types, which was lateradopted by Ehmann et al. (2008). Their framework includesthe following categories: add link, add information, for-mat, spelling, style/typography, clarify information, fix link,vandalism, delete information, reversion, grammar, mark-uplanguage, and delete link. While this detailed categorizationis useful for understanding wiki work processes, it was notintended to guide the design of automatic attribution algo-rithms. For example, it would be difficult to automaticallydetermine that a specific contribution entails “clarify infor-mation.” Tools that wish to distinguish between various typesof wiki contributions are likely to require a higher-level cat-egorization. However, to the best of our knowledge, priorworks on wiki attribution have not addressed this issue.
Estimating Users’ Relative Contributions
Previous works on author contribution have proposedsome preliminary methods that are based on metrics that aredirectly calculated by most wiki platforms: the total text cre-ated and the total number of edits performed. Hess, Kerr, andRickards (2006) propose a utility that calculates the extentof a user’s revision by comparing the current version to theprevious one, such that the overall contribution of a user isbased on the sum of all their revisions. They propose thatuser statistics be used to influence participants’ behavior andto trigger automatic actions (e.g., send alerts to administra-tors). Sabel (2007) uses a similar approach and presents a toolfor calculating the differences between wiki page versions.He proposes that the difference be used as a “rating” of theauthor’s contribution, which then feeds into a reputation sys-tem, and this reputation could then serve as an estimate oftheir overall contribution to the wiki. Korfiatis, Poulos, andBokos (2006) estimate a user’s authority in the wiki based onsocial network analysis, creating a graph of authors, and cal-culating the centrality of each author node. They proposethat authors’ centrality could serve as a proxy for authors’reputation and could be used to help identify experts in anorganization. Ding, Danis, Erickson, and Kellogg (2007) useda simple count of the edits made to wiki pages. Hoisl, Aigner,and Miksch (2007) implemented an add-on that measuresthe relative contribution of authors and displays these userstatistics. They calculate the importance of each wiki ver-sion (based on various metrics), and estimate the impact ofa user’s revision by comparing the importance of the currentversion to the importance of the previous one. The impact ofan individual author is calculated by summing up the impactfor each revision made by that author. Adler, de Alfaro, Pye,and Raman (2008) propose the “total edit longevity” metricthat is based on how long an author’s contributed text remainson the wiki before it is changed by others. They argue thatthe longevity metric is resistant to manipulations and demon-strate that the metric performs better than simple counts oftotal edits or words contributed.
These recent works provide some interesting solutionsto the problem of wiki attribution. However, they suffer
from several limitations. First, social network approaches(Korfiatis et al., 2006) are good at estimating the distribu-tion of one’s efforts across wiki pages, but do not providean estimation of the extent of contributions to a specific wikipage. Second, some of the proposed algorithms can easily bemanipulated by users seeking to boost their contribution scoreartificially. For example, by performing a long series of sin-gle character changes, someone could “game” the algorithmsusing a simple count of page edits (Ding et al., 2007). Third,most existing methods (Adler et al., 2008, is the exception)do not take into account the duration that author’s contribu-tions remained on the wiki page (Hess et al., 2006; Sabel,2007). For example, if an author adds content that is deletedimmediately, they still receive the same credit as if the con-tribution stayed on the wiki for months. Assuming that morerelevant contributions are likely to persist (Anthony, Smith, &Williamson, 2009), algorithms should consider the durationa contribution stays on the wiki page. Fourth, it is not clearwhat the appropriate unit of analysis is for estimating theextent of one’s contribution. Many of the algorithms esti-mate a contribution based on the number of words (Hesset al., 2006; Sabel, 2007) or simply count the number of con-tributions (Ding et al., 2007). These metrics, we believe, maynot necessarily distinguish between meaningful and trivialcontributions, since their unit of analysis is not a semantic ele-ment. Lastly, existing approaches do not make the distinctionbetween various types of contributions.
Visualizing Users’ Relative Contributions
Considerable research has been conducted on visualizingthe collaborative wiki process. Viegas, Wattenberg, and Dave(2004) introduced history flow diagrams that provide a visualoverview of editing history, clearly showing patterns of editssuch as the tendency for wiki authors to add or delete materialrather than reorganizing it, as well as revealing episodes ofphenomena such as “edit wars.” Ekstrand and Riedl (2009)extended this work and developed a tree-like graphical repre-sentation of the relationships among a wiki page’s revisions.This visualization is useful for making salient some of thekey properties of article history, especially during times ofhigh conflict. Holloway, Bozicevic, and Börner (2007) devel-oped visualizations that present the topical organization ofWikipedia. Ding et al. (2007) created a wiki visualizationthey call the Cherry Tree, which shows an author’s contribu-tion based on a simple count of edits; it also emphasizes thecorporate directory structure. In a similar context of collab-orative open source software development, Cheng and Kerr(2009) have been adapting bloom diagrams for the purposeof providing statistics on contributors’ activity history andfor visualizing these metrics and have applied this techniqueto two open source projects: Sourceforge.net and IIOSB (theIBM Internal Open Source Bazaar).
In summary, work remains to be done on visualizationsthat are intended to encourage collaborative authorship (asopposed to studying the history of authorship after the fact).One effort in this direction is WikiDashboard (Suh, Chi,
1168 JOURNAL OF THE AMERICAN SOCIETY FOR INFORMATION SCIENCE AND TECHNOLOGY—June 2010DOI: 10.1002/asi

TABLE 1. Summary of proposed algorithms.
Authorshipcategory Unit of analysis Key principle Algorithms’ variations
Add Sentence Editors’ own’ sentences they have created. a. Cumulative sentence additionsb. Sentence additions that persist on the most recent version.c. Sentence additions weighted by the time they persisted.
Improve Hyperlink Internal hyperlinks are added to make navigation a. Cumulative internal link additions.navigation within the page easier. b. Internal link additions that persist on the most recent version.
Delete Sentence Removal of irrelevant content is an important a. Total number of sentences deleted.contribution. b. Number of revisions where editor deleted content.
Proofread Word Editors make small proofreading corrections at a. Cumulative number of proofreading changesthe word level. b. Proofreading changes that persist on the most recent version.
Link Hyperlink Hyperlinks to other wiki pages link to relevant a. Cumulative external link additions.content. b. External link additions that persist on the most recent version
Kittur, & Pendleton, 2008), a project by Palo Alto ResearchCenter (PARC) that provides tools for supporting collabora-tive wiki work. WikiDashboard is an add-on to Wikipedia,which visualizes editors’ activity patterns over time andis intended to increase transparency and accountability ofWikipedia’s collaborative authoring. Although its impact onusers has not been studied to date, preliminary evidence sug-gests that readers find it an effective tool. WikiDashboarduses a simple metric for estimating editors’ contributions—number of edits—and does not distinguish between differentauthorship categories.
Our Proposed Approach for Calculating WikiEditors’ Contributions
In this study we set out to address the limitations dis-cussed above. We build on our preliminary work (Arazy &Stroulia, 2009) and propose a set of algorithms for calculatingeditors’ contributions. Our proposed approach acknowledgesthat wiki editors can make contributions in various waysand that a method for estimating users’ contributions shouldcapture these various authorship categories. We build on ear-lier work on the categorization of wiki contribution types(Pfeil et al., 2008; Ehmann et al., 2008), and propose a simplercategorization that should lend itself to automatic estimationof authors’relative contribution. Our proposed categorizationincludes the following contribution types:
1. Add: adding complete new sections or changing existinginformation;
2. Improve Navigation: helping users read the page by chang-ing the structure and producing anchors (i.e., internallinks);
3. Delete: deleting content;4. Proofread: making minor corrections and refinements to
text and hyperlinks;5. Link: connecting to other Web pages (either in the same
wiki application) or outside.
We take this framework as our starting point and introducea set of algorithms that are intended to capture these variousauthorship categories, one algorithm per category.
The unit of analysis for each algorithm depends of the cor-responding authorship category: algorithms that correspondto categories of content changes (i.e., “Add” and “Delete”)employ the sentence as the fundamental unit of analysis; the“Proofreading” algorithm is based on word-level changes,and the algorithms to analyze connections to other content(and correspond to the “Improve Navigation” and “Link”categories) use the hyperlink as the basic analysis unit.
Although estimating the quality of contributions is verydifficult and is beyond the scope of this study, we do consideran indirect way of estimating contributions’ relevancy. Cal-culating editors’ relative contributions to a wiki page couldbe based on their cumulative work over the page’s history,or alternatively on the portions of their work that remain onthe most current version of the page. The latter approachassumes that as wiki pages evolve, low-quality content isremoved and high-quality content persists. In this study weexplore both approaches. We apply these two approaches tothe algorithms designed for each of the authorship categories,with the exception of the “Delete” category (for which thenotion of “content that persists” is irrelevant). (Please seeTable 1 for a summary of the proposed algorithms’ key fea-tures.) In the following sections we present our method anddescribe an empirical study that evaluated the extent to whichthe algorithms indeed capture the authorship categories theyintend to.
Description of the Proposed Algorithms for each of theAuthorship Categories
“Add” category. Our method for capturing the contribu-tions of newly added content adopts a sentence as the naturalconceptual unit, and employs user’s sentence ownership as ametric for new content contributions. Focusing on the addi-tion of “complete sentences” as opposed to characters ismotivated by both our intent to focus on more conceptuallymeaningful edits and also to discourage the manipulation ofthe metric by users who want to artificially inflate their con-tribution score. We view a series of edits made by the sameauthor as one continuous editing effort and we define a wikipage “release” as the last of these sequential revisions. Our
JOURNAL OF THE AMERICAN SOCIETY FOR INFORMATION SCIENCE AND TECHNOLOGY—June 2010 1169DOI: 10.1002/asi

algorithm calculates the sentence ownership of wiki pageauthors for each release. The algorithm cleans the data anddetermines sentence boundaries using the UIUC CognitiveComputation Group sentence-segmentation tool.1 Once sen-tence boundaries have been established for both the currentand previous release, the algorithm identifies which of thesentences of the earlier release have remained essentiallythe same in the new release, building on the Munkres (1957)method to minimize the total distance between the pairedsentences. If a sentence in the current release does not havea match in the earlier release, it is considered a newly addedsentence with the author of the current release as the sentenceowner. If, conversely, a matching sentence is found in the pre-vious release, we distinguish between a minor change2 anda major change.3 For minor changes, if after the changes theoriginal owner is still responsible for creating more than 50%of the words in the sentence, then they still retain ownership ofthat sentence. On the other hand, if after the changes the orig-inal owner is now responsible for creating less than 50% ofthe words in the new sentence, the original owner loses own-ership and the sentence becomes public. For major changes,the contributor responsible for these changes becomes thenew owner of the sentence.
The Munkres algorithm was designed to address the so-called “assignment problem,” namely, to identify an assign-ment of n jobs to n workers, such that the overall time tocompletion is minimized. It takes as input an n × n matrixC, where the value of C(i, j) corresponds to the time it willtake for the worker i to complete the job j. Let us considerthe problem in terms of a bipartite graph G = (S, T; E) with nworker vertices (S) and n job vertices (T ), where each edge (E)has a nonnegative cost c(i, j). We are trying to find a perfectmatching, i.e., assign each of the vertices in s ∈ S to a distinctvertex in t ∈ T, with minimum overall cost, �c(s, t). A func-tion y:(S ∪ T) → Q is called a potential if y(i) + y(j) ≤ c(i,j),for each i ∈ S, j ∈ T. The value of potential y is �υ∈(S∪T)y(υ).It can be seen that the cost of each perfect matching is at leastthe value of each potential. The Munkres algorithm finds aperfect matching and a potential with equal cost/value, whichproves the optimality of both. In fact, it finds a perfect match-ing of tight edges: an edge ij is called tight for a potential yif y(i) + y(j) = c(i, j). In our case, the lists of sentences inthe earlier and subsequent releases correspond to the jobsand the workers. Since the number of sentences in the tworeleases may not be equal, we use an extension to the originalMunkres algorithm for rectangular matrices.
In order to study the effect of longevity, we calculatethe amount of newly added content using three alternativeapproaches. First, we calculate the cumulative additions of aneditor over all revisions. Second, we consider only the con-tent that remained on the most recent page revision, assuming
1UIUC CCG: http://l2r.cs.uiuc.edu/≈cogcomp/atool.php?tkey=SS2We consider a “minor change” if more than Y% of the words of Scurrent
can also be found in Sprevious; in this experiment we set Y to equal 50%.3We consider a “major change” if less than Y% of the words of Scurrent
can also be found in Sprevious; in this experiment we set Y to equal 50%.
that high-quality content persists. The main limitation of thislatter approach is that it fails to recognize contributions thatpersisted on the wiki for a long time if they were later over-written. Thus, if a user provided the skeleton for an entirepage, and over the course of collaboration their initial textwas refined and enhanced, this instrumental user may notreceive credit for their work. The third alternative is a com-promise of the previous two approaches and borrows from theideas of Adler et al. (2008): it considers all additions madeby an author and the longevity of these contributions, suchthat a user’s score is based on the number of revisions thattheir sentences persisted on the wiki page (one credit for eachsentence persisting on each “release”).
“Improve Navigation” category. One way to improve thelogical flow is by organizing the structure of the page. How-ever, such changes are very difficult to recognize automati-cally, and previous works do not provide any guidance (i.e.,they focus only on newly added content). Adding anchors(i.e., internal hyperlinks) is another method for improvingthe flow and enabling easier navigation within a page, whichis much easier to estimate. Thus, our method for estimat-ing contributions that are intended to improve the logicalflow of the wiki page uses as a proxy the number of inter-nal hyperlinks introduced by the editor, under the assumptionthat these links establish an organization structure over thecontent of an individual page as well as the entire wiki con-tent. Our unit of analysis here is the internal hyperlink, andin order to investigate the effect of longevity we providedtwo alternative algorithms: one based on the total number ofinternal links added and the other based on only the links thatremain in the most recent wiki page version.
“Proofread” category. In order to capture contributions ofproofreading, we counted the number of word-level changes(i.e., the unit of analysis is a word). As previously, we investi-gated the effect of longevity and looked at both the cumulativechanges as well as the changes that persisted on the mostcurrent page version.
“Delete” category. We employed two alternative methodsfor estimating the scale of contributions through text deletion.First, using the notion of sentence as a unit of meaning, wecalculated the number of sentences deleted by the user over allrevisions. Second, we counted the number of revisions wherethe user deleted content, independent of the scope of deletion.For this category, the notion of longevity is irrelevant.
“Link” category. In order to capture contributions of addinglinks to other Web pages, we counted the number of externalhyperlinks introduced by a user (i.e., the unit of analysis is theexternal link). As earlier, we studied the effect of longevityby comparing two alternative algorithms: one based on thetotal number of external links added and the other based ononly the links that remain in the most recent page version.
The set of algorithms described above were implementedon Annoki (Espiritu, Stroulia, & Tirapat, 2006), our own
1170 JOURNAL OF THE AMERICAN SOCIETY FOR INFORMATION SCIENCE AND TECHNOLOGY—June 2010DOI: 10.1002/asi
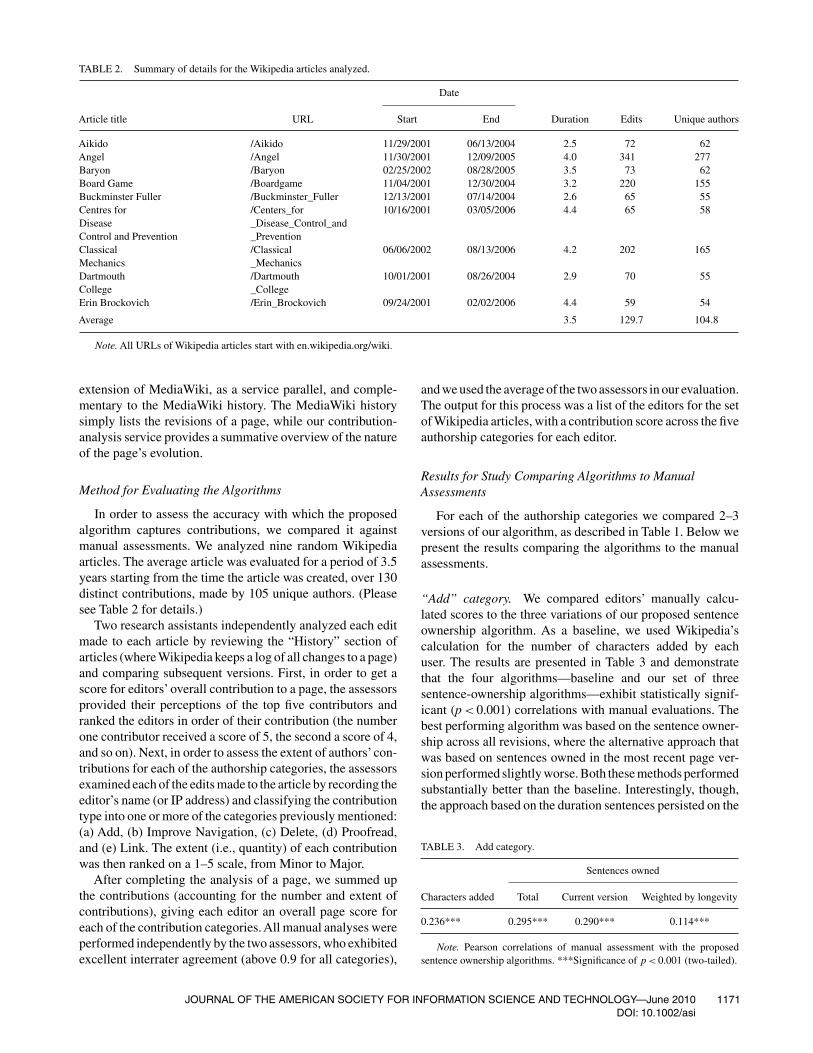
TABLE 2. Summary of details for the Wikipedia articles analyzed.
Date
Article title URL Start End Duration Edits Unique authors
Aikido /Aikido 11/29/2001 06/13/2004 2.5 72 62Angel /Angel 11/30/2001 12/09/2005 4.0 341 277Baryon /Baryon 02/25/2002 08/28/2005 3.5 73 62Board Game /Boardgame 11/04/2001 12/30/2004 3.2 220 155Buckminster Fuller /Buckminster_Fuller 12/13/2001 07/14/2004 2.6 65 55Centres for /Centers_for 10/16/2001 03/05/2006 4.4 65 58Disease _Disease_Control_andControl and Prevention _PreventionClassical /Classical 06/06/2002 08/13/2006 4.2 202 165Mechanics _MechanicsDartmouth /Dartmouth 10/01/2001 08/26/2004 2.9 70 55College _CollegeErin Brockovich /Erin_Brockovich 09/24/2001 02/02/2006 4.4 59 54
Average 3.5 129.7 104.8
Note. All URLs of Wikipedia articles start with en.wikipedia.org/wiki.
extension of MediaWiki, as a service parallel, and comple-mentary to the MediaWiki history. The MediaWiki historysimply lists the revisions of a page, while our contribution-analysis service provides a summative overview of the natureof the page’s evolution.
Method for Evaluating the Algorithms
In order to assess the accuracy with which the proposedalgorithm captures contributions, we compared it againstmanual assessments. We analyzed nine random Wikipediaarticles. The average article was evaluated for a period of 3.5years starting from the time the article was created, over 130distinct contributions, made by 105 unique authors. (Pleasesee Table 2 for details.)
Two research assistants independently analyzed each editmade to each article by reviewing the “History” section ofarticles (where Wikipedia keeps a log of all changes to a page)and comparing subsequent versions. First, in order to get ascore for editors’ overall contribution to a page, the assessorsprovided their perceptions of the top five contributors andranked the editors in order of their contribution (the numberone contributor received a score of 5, the second a score of 4,and so on). Next, in order to assess the extent of authors’con-tributions for each of the authorship categories, the assessorsexamined each of the edits made to the article by recording theeditor’s name (or IP address) and classifying the contributiontype into one or more of the categories previously mentioned:(a) Add, (b) Improve Navigation, (c) Delete, (d) Proofread,and (e) Link. The extent (i.e., quantity) of each contributionwas then ranked on a 1–5 scale, from Minor to Major.
After completing the analysis of a page, we summed upthe contributions (accounting for the number and extent ofcontributions), giving each editor an overall page score foreach of the contribution categories. All manual analyses wereperformed independently by the two assessors, who exhibitedexcellent interrater agreement (above 0.9 for all categories),
and we used the average of the two assessors in our evaluation.The output for this process was a list of the editors for the setof Wikipedia articles, with a contribution score across the fiveauthorship categories for each editor.
Results for Study Comparing Algorithms to ManualAssessments
For each of the authorship categories we compared 2–3versions of our algorithm, as described in Table 1. Below wepresent the results comparing the algorithms to the manualassessments.
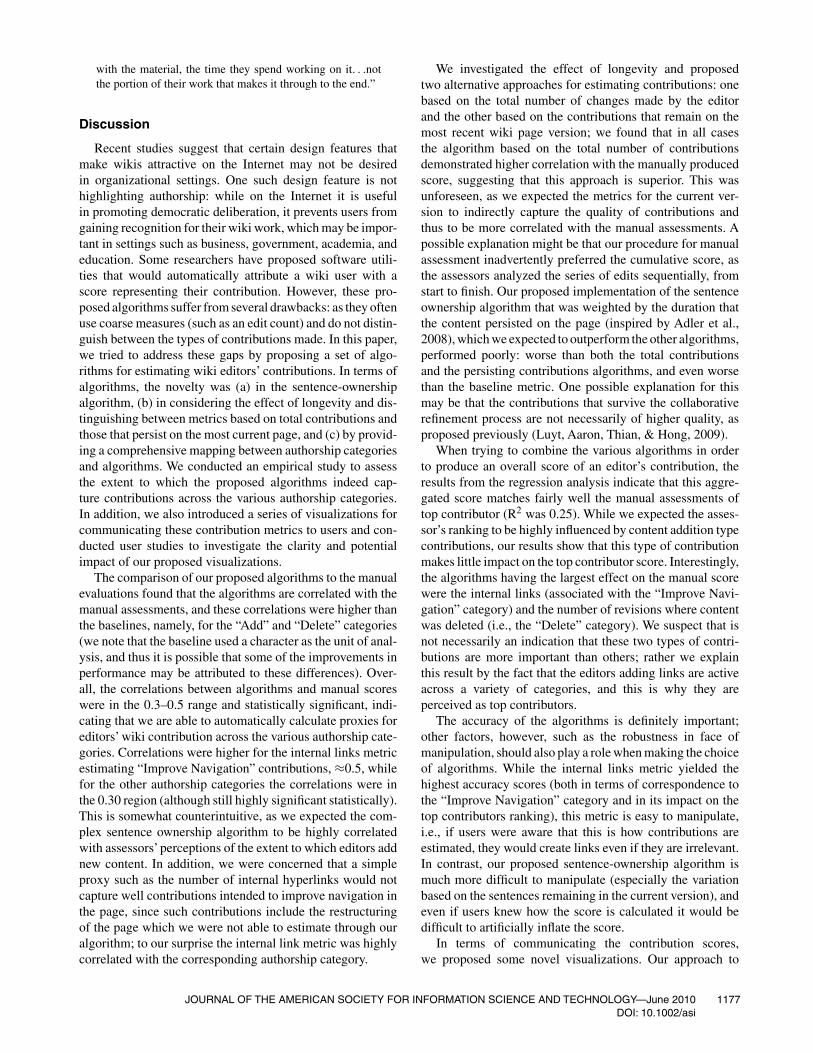
“Add” category. We compared editors’ manually calcu-lated scores to the three variations of our proposed sentenceownership algorithm. As a baseline, we used Wikipedia’scalculation for the number of characters added by eachuser. The results are presented in Table 3 and demonstratethat the four algorithms—baseline and our set of threesentence-ownership algorithms—exhibit statistically signif-icant (p < 0.001) correlations with manual evaluations. Thebest performing algorithm was based on the sentence owner-ship across all revisions, where the alternative approach thatwas based on sentences owned in the most recent page ver-sion performed slightly worse. Both these methods performedsubstantially better than the baseline. Interestingly, though,the approach based on the duration sentences persisted on the
TABLE 3. Add category.
Sentences owned
Characters added Total Current version Weighted by longevity
0.236*** 0.295*** 0.290*** 0.114***
Note. Pearson correlations of manual assessment with the proposedsentence ownership algorithms. ***Significance of p < 0.001 (two-tailed).
JOURNAL OF THE AMERICAN SOCIETY FOR INFORMATION SCIENCE AND TECHNOLOGY—June 2010 1171DOI: 10.1002/asi

TABLE 4. Delete category.
Characters added Sentences deleted Revisions with deleted content
0.197*** 0.157*** 0.274***
Note. Pearson correlations of manual assessment with the proposedsentence ownership algorithms. ***Significance of p < 0.001 (two-tailed).
page performed much lower than the other algorithms (andworse than the baseline).
“Improve Navigation” category. When comparing the man-ual evaluations to our proposed internal hyperlink metric wefound that the correlation between the manually producedvalue and our algorithms’ output was rather high: the corre-lation for the metric calculating the total number of internallinks was 0.566 (p < 0.001), while the correlation for the met-ric based on the links remaining on the current page versionwas 0.426 (p < 0.001).
“Proofread” category. When comparing the manual evalu-ations of proofreading changes to the output of our proposedalgorithms we found that the correlation between the man-ually produced value and the metrics calculating the totalnumber of word-level changes was 0.313 (p < 0.001), whilethe correlation for algorithm based on the changes thatpersisted on the current page version was 0.266 (p < 0.001).
“Delete” category. We compared editors’ manual scoreto the two variations of our proposed “delete” algorithm:(a) based on the total number of deleted sentences and (b)based on the number of revisions where the editor deletedcontent. As a baseline, we used Wikipedia’s calculation forthe number of characters deleted by each user. The resultsare presented in Table 4 and demonstrate that the threealgorithms—baseline and our two deletion algorithms—exhibit statistically significant (p < 0.001) correlations withmanual evaluations. The best-performing algorithm wasbased on the number of revisions where content was deleted(substantially better than the baseline), while the worst per-formance was for the algorithm based on the number ofsentences deleted (substantially worse than the baseline).
“Link” category. When comparing the manual evaluationsof connections made to external Web pages to our proposedalgorithms, we found that the correlation between the man-ually produced value and the metric for the total number ofadded links was 0.391 (p < 0.001), while the correlation forthe metric based on the links remaining on the current pageversion was 0.338 (p < 0.001).
In addition to the per-category analysis, we also wantedto test whether our proposed set of algorithms is able toproduce an aggregated score of an editor’s overall contri-bution to a page. To analyze the optimal combination weperformed a regression analysis using the manually identi-fied “top contributor” score and the results are presented inTable 5. The total variance explained for the outcome variable
TABLE 5. Results for regression of the set of algorithms on the manually-produced ‘top contributor’ score.
SignificanceAlgorithm Category β t-value (p<)
(Constant) — 1.029 0.304Sentence ownershipa Add 0.055 1.696 0.090Internal hyperlinksa Improve 0.366 9.285 0.000
NavigationWord-levela Proofread −0.044 −1.364 0.173Deletionsb Delete 0.187 5.538 0.000External hyperlinksa Link 0.037 1.091 0.276
Note. aAlgorithms’ total scores; bScores based in number of revisions.
(i.e., adjusted R2) was 0.252. If we used the number of editsmade by a user as a baseline metric of overall contribution, itwould produce an adjusted R2 of 0.230, below the score pro-duced by our combination. The metrics with largest impactwere internal hyperlinks (β = 0.37; p < 0.001) and revisionswith deletions (β = 0.19; p < 0.001). A regression analysiswith only these two variables produced an adjusted R2 of0.249. This result is surprising, as we anticipated the met-ric for newly added content (i.e., sentence ownership) to bethe most salient, and did not expect the deletion of con-tent to substantially influence assessors’ perceptions of topcontributors.
Visualizing the Contribution Scoresof Wiki Editors
Our proposed visualization utilizes the information calcu-lated by the various algorithms described above. We assumedthat we would be able to synthesize from these various algo-rithms a user’s score for each of the authorship categories(this is validated in our first study). The visualization alsoassumes that an overall user score could be calculated byaggregating the contributions across the various categories.
The Proposed Visualization Approach
In a preliminary work (Ruecker et al., 2008), we intro-duced two glyphs that in various ways represented the relativecontributions of authors across the different authorship cat-egories. These glyphs are intended to reside on a wiki page,so that editors’ contributions to that page are always visible.Here we extended this approach and introduced two addi-tional glyphs. We were interested in finding out more abouthow people perceived these four glyphs, if there were a com-bination of glyphs that serve users best, or if there were onethat was clearly superior.
The situated visibility of an editor’s relative contributionto the wiki is an innovation that contradicts the principle ofunattributed wiki work; we contend that in certain situations,such as the classroom or research settings, this modification ispotentially beneficial in increasing motivation to contribute.Figure 1 shows the summary form of the glyph, which wenicknamed “sunword.” It provides the names of wiki editors
1172 JOURNAL OF THE AMERICAN SOCIETY FOR INFORMATION SCIENCE AND TECHNOLOGY—June 2010DOI: 10.1002/asi

FIG. 1. The sunword glyph provides an aggregate score for all contributors (center) and individual scores indicated both by font size and a number besideeach name.
around a central aggregate score for all contributors; the fontsize of the names corresponds to their relative scores, whichare also included as a numerical value.
The detailed form of the glyph (Figure 2) allows the userto see the components of the score that is summarized insunword. The detailed glyph combines pie-shaped sectionsfor each editor that show the relative contribution across eachof the five authorship categories, indicated by five concentriccircles that make up the wedge. When the name of a specificeditor is selected (“wikidiver” in the figure), the details forthat editor are highlighted.
Our third glyph (Figure 3) was an attempt to provide theuser with a sense of editors’ contribution not only to the cur-rent wiki page but also to the larger wiki site (assuming thesite consists of many pages). Using two overlapping circles,one for the current page and one for the total wiki application,we display the same editor in both contexts. We display aneditor’s contribution score, as well as a percentage of all edi-tors’ contributions. The continuity of the contribution acrossthe two different contexts is provided by using both a bandof color and the numeric scores set in the same relative posi-tion on both circles. The two circles are also redundantlylabeled, which helps make their relationship clear at firstglance, although logically they can only occur in one order(except in the boundary condition where the current page isthe only page in the whole wiki application).
Based on the results of a user study (the results arepresented in the following sections), we implemented adetailed version of the information glyph (Figure 4) withinMediaWiki. This new glyph provides information similarto what we showed in Figure 2, except all authors are dif-ferentiated with color. The glyph is also more interactive,allowing the user to turn the section labels off and on,although with the labels off the glyph responds to rollover byswelling the appropriate section of the rings and temporarilydisplaying the label.
In principle, the glyphs can take as an input the metrics cal-culated by any algorithm. In our implementation—for eachauthorship category—the glyphs take the calculations of thebest-performing algorithm. For example, for the “Add” cate-gory the visualizations use cumulative additions (rather thanthe longevity variation). These glyphs were implemented onour MediaWiki extension—Annoki—on the History tab.
The Method for Evaluating Our Visualization
In order to evaluate the clarity of our proposed visual-ization we set out to address two primary sets of researchquestions. First, to what extent can users understand the infor-mation visualized in the glyphs? Are there specific variationsof the visualizations that users can more easily understand?What level of detail do users require? Second, how wouldvisualizations of the attribution metrics impact users’ atti-tudes toward contributing to the wiki? What is the expectedimpact of the visualization on users’wiki behavior? Are theredifferences between the various glyphs?
We were interested in examining the possible effects ofour information glyphs in two different settings and seeingif there were any differences between the settings. The firstsetting consisted of students who had been asked to contributeto a wiki as part of their course work. These people wouldbe explicitly evaluated on their contribution through a gradefor the assignment, and would also be subject to peer pressurethrough their participation in a group project. The secondtype of wiki editors consisted of collaborative researcherswho were using a wiki as part of their research activity. Inthis case, there would be no explicit evaluation; instead, thepresumed motivation would be to act appropriately withinthe context of the dynamics of the research group.
We therefore conducted a user study involving semistruc-tured interviews with ten participants: five students and fiveresearchers. Each of the participants was shown the full set
JOURNAL OF THE AMERICAN SOCIETY FOR INFORMATION SCIENCE AND TECHNOLOGY—June 2010 1173DOI: 10.1002/asi

FIG. 2. The detailed glyph provides of the selected editor’s score for eachof the authorship categories. In the version above, only the selected author“wikidiver” is shown, while in the below gray portions also contain detailsabout the other authors.
FIG. 3. The overlapping doughnuts in our third glyph are an attempt toshow a person’s contribution not only to the current page (on the right), butalso to the larger wiki application (Wikipedia, in this specific visualization).
FIG. 4. Our detailed prototype, installed within MediaWiki, provides col-ors for every author, a switch for labels, and an interactive mode where thesegments respond to rollover by swelling and displaying their details.
of information glyphs, embedded separately on wiki pagesto provide a context that would be similar to how they mayappear in use, although for the purposes of our study the pageswere printed. Participants were allowed to examine all thepages at once, in order to get a perspective that would allowcomparative comments, but the interviewer drew attention toone at a time while asking the questions.
Each participant was provided with one of two scenarios,depending on their previous experience as students workingon a collaborative writing assignment or researchers using awiki.
Scenario 1: Classroom. “As part of your assignments in yourundergrad course _______ (a real course they’ve taken) youare asked to work collaboratively with your classmates in awiki project. The project consisted in writing an article ofquality about ________ (specific interest of the participant).”
Scenario 2: Research team. “As a member of a collabora-tive research team, you have been asked to contribute to thewiki project. As a researcher, you won’t be graded, but youhope that your work on the project will eventually lead toconference presentations and publication in peer-reviewedjournals.”
The interview questions fell into two categories. The firstset dealt primarily with issues of comprehension and expla-nation: what were the participants seeing in the differentkinds of visualizations, and how did they interpret what theysaw? Participants were asked to: (a) try to explain the datadisplayed, (b) describe the strengths of each visualization,(c) explain how they would identify specific data they areinterested in (e.g., their contributions), and (d) try to rec-ognize the relative contribution of each editor. In order to
1174 JOURNAL OF THE AMERICAN SOCIETY FOR INFORMATION SCIENCE AND TECHNOLOGY—June 2010DOI: 10.1002/asi

assess the expected impact of visualizing contribution data,we performed a second component of the user study, usingthe same subject pool described above. In this case, our ques-tions focused on the possible effects such visualizations mighthave on the motivation of students in a class or researcherson a collaborative team to contribute to a wiki. Participantswere asked to: (a) describe how they would feel if a graphicshowing contributions were to be implemented as an add-onin a wiki technology, (b) discuss how having a visualizationtool inserted in a wiki would change their wiki participation,and (c) describe what their strategy for becoming the top-ranked editor would be. We kept an audio recording of thesessions and also took notes of the answers, then carried out aqualitative analysis that consisted of extracting the statementsabout each glyph that related to our questions. Since our par-ticipant pool was small, we did not concern ourselves withfrequency of statements, but instead considered as potentiallyinformative each individual utterance by each participant.
Results on the Understandability of the Visualizations
Our first research question for the information glyphsdealt with how well our participants were able to interpretwhat they were seeing: “to what extent can users understandthe information visualized in the glyphs?” Our user stud-ies indicate that by and large our glyphs were understoodby the users. Perhaps not too surprisingly, from the perspec-tive of the two different settings (classroom and collaborativeresearch), there were no differences in their ability to under-stand the visualizations. We therefore merged the two sets ofcomments in the following results.
Responses to the summary glyph (Figure 1) included var-ious indications that our participants found it to be easy tounderstand that they were seeing a visualization of relativecontribution, e.g.:
“. . .the names are clear as to who’s contributing the most.”“you can see exactly at a glance the amount of contributions.”
In addition, some participants noted the comparativeaspect of the visualization, i.e., including all editors in a singlevisualization provided a context for understanding the contri-butions of a specific editor. In fact, the intention of the glyphis to provide scores for only the top 25 editors, but there wasno way for participants to recognize that there was a limit.Some example statements include:
“. . .it just doesn’t isolate you as a user. . .is more specific,more easy to locate in context. It helps me understanding thewhole spectrum of users.”“[I see]. . .the relative rank of everyone and the total numberof contributions.”
There was, however, some confusion about the precisemeaning of the numbers, e.g.:
“And this little number on top. . . at first sight I don’tknow what it is, and. . .because it doesn’t correspond to the
percentage I think. . .yeah because Alex has three percent ofcontributions and four something. . .and wikidiver has 11, itdoesn’t make sense that this percentages are relative to thesenumbers, I don’t know what it is.”
The detailed glyph (Figure 2) showed two states, one withonly the details about a particular wiki contributor and theother with details about all contributors with one highlighted.Responses suggested that participants readily identified thebreakdown into more details.
“. . .it’s nice to have it broken down like that.”“Provides a really good breakdown of the type of contribu-tions made.”
As with the summary glyph, participants also readily iden-tified that information was being shown of a comparativenature.
“. . .it shows not only one user but also different users. So. . .itpresents more data and that you can compare different user’scontributions. . . .”“. . .it’s great because you can see your relative percentage. . ..”
However, as with the summary glyph, guesses about theactual nature of the details were not correct.
“And hmm, I don’t really understand like what the numbers‘2’and ‘11%’mean. Like. . . 11% of what? I don’t know whatthat is, and ‘2’ I don’t know what that is either. . ..”
The third glyph (Figure 3) showed contributions by a sin-gle author for the current wiki page against a total contributionto the entire project wiki. Many of the participants were ableto correctly describe in general terms what they were seeing.
“. . .it does only the other ones don’t do, which is comparesto all of the wiki pages.”“. . .your involvement in the whole wiki. . ..”
However, here too some confusion was expressed, e.g.:
“I don’t know why they are superimposed, I don’t know ifthat’s supposed to have a meaning or something.”
Results on the Expected Impact of the Visualizations
Our second research question related to the potentialimpact of the information glyphs: “How would visualiza-tions of the attribution metrics impact users’ attitudes towardcontributing to the wiki? What is the expected impact of thevisualization on users’ wiki behavior?” Overall, the visual-izations contribute to a sense of competitiveness, to whichsome subjects responded positively, while others did not thinkthis is appropriate in the wiki context. While some partici-pants recognized that the glyphs were not necessarily addinga radical new kind of information:
“you know, you can always tell in a group, it’s not like youdon’t know! so. . .this just makes it easier to track I think.”
JOURNAL OF THE AMERICAN SOCIETY FOR INFORMATION SCIENCE AND TECHNOLOGY—June 2010 1175DOI: 10.1002/asi

Many others recognized the potentially competitive natureof this aspect of the visualizations, as the first two visu-alizations (“sunword” and detailed) contained informationthat could be used for ranking oneself against others.The responses to this competitive pressure differed acrosssettings.
Classroom setting. For the students, the visual presence of ascore attached to the information glyphs seemed to resonatewith a number of existing concerns about being under thecompetitive microscope, while others responded by indicat-ing that they felt competition can be motivating, and thoughtthat they would take into consideration what the other mem-bers of their group thought about their contributions. Severalof the student participants mentioned that if their peers hadaccess to the information in the visualization, they would tryto work harder on the quality of their edits.
“I think when people can see themselves stacked up againstother people then they’re going to try harder right away.”
“As far as how it would improve the information they wereinputting, I think it makes a little bit of competition and it’salways good, just to see who is doing more effort, just to tryto add a little bit more. And I think it creates a sense of pridein your work, just to see how much effort you put into it andhow much it matters in the end.”
Others, however, expressed reservations about the poten-tial effects of the visualization on the quality of the resultingwiki content, and some felt that if an explicit connection weremade between a wiki author’s ranking and grade, the resultscould be negative:
“. . .try not to abuse the system just to get on top, people maytry just to put more data just to get more ranking.”
“. . .I also think that it would become an endless competi-tion. Um. . .because, people are going to assume that you aregraded on what part or size of the chart you have, and like wehad happen before, everyone wanted to edit the last minute.”
“Students would try and undermine each other just to get thelargest piece of the pie. I would! If my mark was on the lineand I had 11% [emphasis] I’d like do as much as I could toget 50% of the pie or bigger than anybody else, ’cause weare on a curve right?”
On the other hand, one of the researcher participants sug-gested that the glyph could be used by students, not in acompetitive mode, but instead as a means of ensuring that allgroup members contributed equally.
“I think. . .that. . .If I was in a class and I was working withfellow students on a project I think it would act as an equal-izer, it’d make sure that the work that I’m doing is consistentwith the work that other folks are doing in a class, and Iwould hope that it would act as an equalizer for everyoneelse as well. Umm. . .particularly if you use it as a set upas an expectation that everyone would be in a certain rangeof contributions it would be a useful tool to make sure thateveryone is contributing to the group project.”
A very interesting comment was sent by email by oneof the student participants after the interview. This studentsaw the contradiction between a collaborative assignment anda competitive ranking of individuals.
“I think that the entire concept of wikis revolves around col-laboration and the concept behind the assignments we’regiven is competition. Collaboration and competition don’treally mix well together and I think it’s ultimately flawed ifthe two are trying to be used together in an assignment.”
For the detailed glyph (Figure 2), one of the student par-ticipants mentioned the possibility of using the informationabout the other editors as the basis for assigning roles for thenext group assignment:
“I think it’s nice to have access to the percent of other peopleas well. . .just to see, you know, if you wanted to do it againwith a different article, maybe somebody is really good atproofreading and you can just say. . .‘Why don’t you just doall the proofreading edits?’ and then kind of assign thingsand make things a little more easy.”
In a similar vein, another participant commented on thepossible use of the detailed glyph as a management tool.
“I think it would actually be a little bit better just as a bitof a. . .more information on how things are going and wherepeople strengths are, in terms of their edits. So we can say‘hey, we are doing a good job!’ or maybe if we had a fullbunch of links, ‘you guys are putting links everywhere butwe don’t have any additional content.’ It could be used asa directional thing. . .it’s like a. . .to give you a snapshot ofwhere you are. . ..”
Research Setting. Some participants recognized that a lit-tle bit of competition can be a positive factor even in acollaborative setting:
“I think that it [Glyph 2] would motivate the person to con-tribute more because you are not the only one that is goingto be seeing it; there’s other people that are going to be see-ing it. It is kind of an ego booster in a way too, and youknow ok. . .other people know when I’m contributing to thearticle.”
However, other wiki users working in research settingsexpressed some anxieties about the presence of a score andhow it might give a false impression about the collaboration.Specifically, when introduced to the two variations for calcu-lating contribution—based on the total contributions or basedon the contributions that remained on the current version, oneof the participants responded:
“I think the aggregated score [based on what contentremained on the page], um it could be a bit misleadingby. . .the problem I would have with having this score at all isthat it may not tell the entire truth as to the quality of contri-butions that someone’s made. So I think the aggregated score[total score] would be perhaps a more honest reflection of thework someone’s put into it, I think is the time they’ve spent
1176 JOURNAL OF THE AMERICAN SOCIETY FOR INFORMATION SCIENCE AND TECHNOLOGY—June 2010DOI: 10.1002/asi
with the material, the time they spend working on it. . .notthe portion of their work that makes it through to the end.”
Discussion
Recent studies suggest that certain design features thatmake wikis attractive on the Internet may not be desiredin organizational settings. One such design feature is nothighlighting authorship: while on the Internet it is usefulin promoting democratic deliberation, it prevents users fromgaining recognition for their wiki work, which may be impor-tant in settings such as business, government, academia, andeducation. Some researchers have proposed software utili-ties that would automatically attribute a wiki user with ascore representing their contribution. However, these pro-posed algorithms suffer from several drawbacks: as they oftenuse coarse measures (such as an edit count) and do not distin-guish between the types of contributions made. In this paper,we tried to address these gaps by proposing a set of algo-rithms for estimating wiki editors’ contributions. In terms ofalgorithms, the novelty was (a) in the sentence-ownershipalgorithm, (b) in considering the effect of longevity and dis-tinguishing between metrics based on total contributions andthose that persist on the most current page, and (c) by provid-ing a comprehensive mapping between authorship categoriesand algorithms. We conducted an empirical study to assessthe extent to which the proposed algorithms indeed cap-ture contributions across the various authorship categories.In addition, we also introduced a series of visualizations forcommunicating these contribution metrics to users and con-ducted user studies to investigate the clarity and potentialimpact of our proposed visualizations.
The comparison of our proposed algorithms to the manualevaluations found that the algorithms are correlated with themanual assessments, and these correlations were higher thanthe baselines, namely, for the “Add” and “Delete” categories(we note that the baseline used a character as the unit of anal-ysis, and thus it is possible that some of the improvements inperformance may be attributed to these differences). Over-all, the correlations between algorithms and manual scoreswere in the 0.3–0.5 range and statistically significant, indi-cating that we are able to automatically calculate proxies foreditors’ wiki contribution across the various authorship cate-gories. Correlations were higher for the internal links metricestimating “Improve Navigation” contributions, ≈0.5, whilefor the other authorship categories the correlations were inthe 0.30 region (although still highly significant statistically).This is somewhat counterintuitive, as we expected the com-plex sentence ownership algorithm to be highly correlatedwith assessors’ perceptions of the extent to which editors addnew content. In addition, we were concerned that a simpleproxy such as the number of internal hyperlinks would notcapture well contributions intended to improve navigation inthe page, since such contributions include the restructuringof the page which we were not able to estimate through ouralgorithm; to our surprise the internal link metric was highlycorrelated with the corresponding authorship category.
We investigated the effect of longevity and proposedtwo alternative approaches for estimating contributions: onebased on the total number of changes made by the editorand the other based on the contributions that remain on themost recent wiki page version; we found that in all casesthe algorithm based on the total number of contributionsdemonstrated higher correlation with the manually producedscore, suggesting that this approach is superior. This wasunforeseen, as we expected the metrics for the current ver-sion to indirectly capture the quality of contributions andthus to be more correlated with the manual assessments. Apossible explanation might be that our procedure for manualassessment inadvertently preferred the cumulative score, asthe assessors analyzed the series of edits sequentially, fromstart to finish. Our proposed implementation of the sentenceownership algorithm that was weighted by the duration thatthe content persisted on the page (inspired by Adler et al.,2008), which we expected to outperform the other algorithms,performed poorly: worse than both the total contributionsand the persisting contributions algorithms, and even worsethan the baseline metric. One possible explanation for thismay be that the contributions that survive the collaborativerefinement process are not necessarily of higher quality, asproposed previously (Luyt, Aaron, Thian, & Hong, 2009).
When trying to combine the various algorithms in orderto produce an overall score of an editor’s contribution, theresults from the regression analysis indicate that this aggre-gated score matches fairly well the manual assessments oftop contributor (R2 was 0.25). While we expected the asses-sor’s ranking to be highly influenced by content addition typecontributions, our results show that this type of contributionmakes little impact on the top contributor score. Interestingly,the algorithms having the largest effect on the manual scorewere the internal links (associated with the “Improve Navi-gation” category) and the number of revisions where contentwas deleted (i.e., the “Delete” category). We suspect that isnot necessarily an indication that these two types of contri-butions are more important than others; rather we explainthis result by the fact that the editors adding links are activeacross a variety of categories, and this is why they areperceived as top contributors.
The accuracy of the algorithms is definitely important;other factors, however, such as the robustness in face ofmanipulation, should also play a role when making the choiceof algorithms. While the internal links metric yielded thehighest accuracy scores (both in terms of correspondence tothe “Improve Navigation” category and in its impact on thetop contributors ranking), this metric is easy to manipulate,i.e., if users were aware that this is how contributions areestimated, they would create links even if they are irrelevant.In contrast, our proposed sentence-ownership algorithm ismuch more difficult to manipulate (especially the variationbased on the sentences remaining in the current version), andeven if users knew how the score is calculated it would bedifficult to artificially inflate the score.
In terms of communicating the contribution scores,we proposed some novel visualizations. Our approach to
JOURNAL OF THE AMERICAN SOCIETY FOR INFORMATION SCIENCE AND TECHNOLOGY—June 2010 1177DOI: 10.1002/asi

visualization is similar in spirit to WikiDashboard, yet thereare some important differences. First, WikiDashboard isinterested in exposing collaboration patterns over time, whileour interest is in editors’ cumulative contributions. Second,we recognize the various types of contributions and visualizeeditors’ contributions across these various authorship cate-gories. Third, WikiDashboard uses a simple metric that couldbe easily manipulated for estimating contributions, while wedeveloped more complex algorithms (i.e., sentence owner-ship). Finally, our graphical representation is quite differentfrom WikiDashboard and we use color, shape, and font size tocommunicate our more complex data. Our user studies indi-cate that by and large our glyphs were understood by the usersand we did not notice any real differences between the class-room and collaborative research settings. It seems that a goodapproach would be to provide access to both a summary ver-sion (where an overall contribution score is presented) and amore-detailed version of the information glyphs (where con-tributions per authorship category are presented). However,some of the details were not entirely understood by someusers; this is not an entirely negative finding, in that it sug-gests that it would not be immediately obvious how someonecould “game” the algorithm to get a better score.
We expected the visualization of contribution scores toimpact the motivations for participation, and our findingssupport this conjecture. Results for the user study suggestthat adding the visual representation of relative contribu-tion would in a sense “up the ante” for both students in aclassroom setting and researchers on collaborative projects.Some of our participants felt that the affordance for increasedsurveillance from others in the group, combined with theirown enhanced knowledge of relative contribution, would bebeneficial, while others expressed some anxieties about thepossible consequences, either in concerns about the mean-ing of the relative contribution score and how those mightbe subject to misinterpretation, or in questioning at a morefundamental level the value of an attempt to combine col-laboration and competition. Interestingly, some participantsalso saw potential for uses of the detailed information glyphthat we had not foreseen, such as in subsequently assign-ing tasks based on previous high scores for one kind ofediting activity versus another, or in managing the cur-rent wiki task by monitoring where a lot of activity wastaking place while another activity was being neglected.The findings for the collaborative research settings werealso two-sided: some researchers felt that a visualization ofcontributions could motivate group members to increase boththe quantity and quality of their participation, while othersexpressed concerns about the ability of an automatic toolto accurately capture peoples’ contribution toward the groupeffort.
Conclusion
Wiki is a promising technology that has the potential totransform knowledge management by eliminating the bot-tlenecks associated with traditional knowledge acquisition
(Wagner, 2004, 2006). However, for such a decentralizedcollaborative technology to succeed in settings where usersare largely driven by career goals, e.g., corporate, govern-ment, research, or education settings, incentives for usercontribution are required. The application of such incentivesdemands that we are able to estimate user’s relative con-tribution toward the group effort. Recently, several studieshave begun exploring ways to automatically estimate contri-butions and visualize them. Our work extends these previousstudies by: (a) acknowledging that wiki work includes vari-ous authorship categories and proposing a set of algorithmsintended to capture contributions across all these categories,(b) developing some novel algorithms for estimating contri-butions, namely, the sentence-ownership set of algorithms,(c) proposing some novel visualizations of wiki editors’ con-tributions, and (d) empirically testing both the algorithms andthe visualizations. The scope of this paper is very broad; itincludes: a discussion of wiki authorship categories, devel-opment of algorithms and visualizations, and the empiricalevaluation of both. We acknowledge that in deciding toinclude this breadth in a single paper we might to some extenthave sacrificed depth.
In the future we plan to extend this study in various ways.First, we intend to refine the algorithms to better capturecontributions along various authorship categories. The corre-lations we obtained (in the 0.3–0.5 range) leave much roomfor improvement. Some specific directions include modifi-cations to the longevity sentence-ownership algorithms andthe development of a new algorithm to estimate structuralchanges (considered a part of the “Improve Navigation”) cat-egory. Second, future research should generalize our results toother settings. In this study we evaluated the algorithms on asmall set of Wikipedia pages. Although we cannot identifya clear reason why the performance of the algorithms wouldbe restricted to the specific pages we analyzed, it is still nec-essary to repeat the evaluation on a larger set of Wikipediapages and on wikis specifically used in other contexts, e.g.,corporate, government, research, or education. Third, thevisualizations could be improved, based on insights from ouruser study. Lastly, our findings illustrate both potential risksand benefits that are associated with tools for estimating andvisualizing wiki contributions. Such tools should be imple-mented in real-life settings, so their actual impact could beinvestigated.
An important aspect that was not addressed in this studyis the quality of editors’ contributions. We concentrated ourefforts on estimating the quantity of contributions, and onlyindirectly touched on the issue of quality (through the notionof longevity). Contribution quality is an important aspect ofonline collaborations, yet it is very difficult to capture. Recentyears have seen the development of various tools for estimat-ing the quality of the group output (e.g., Wikipedia developeda rating system for articles), the quality of one’s contributions(e.g., a rating system, such as the one used in the technologynews forum Slashdot.org), and the reputation (or authority)of contributors (e.g., using a reputation system, such as theone used in eBay). These approaches represent promising
1178 JOURNAL OF THE AMERICAN SOCIETY FOR INFORMATION SCIENCE AND TECHNOLOGY—June 2010DOI: 10.1002/asi
possibilities for addressing the notion of content qualityin wikis.
In conclusion, we believe that the gap between the affor-dances of wiki technology (that was originally designedfor peer-based governance) and traditional top-down cor-porate governance presents an opportunity for extendingwiki technology. In this study we focused on one partic-ular enhancement—highlighting editors’ contributions—butother wiki extensions are possible. For example, wikis mightbe extended to include peer-based quality assurance tools,such as rating mechanisms. We hope that the current studywill encourage further research into this promising area.
Acknowledgments
We thank Priyanka Pareek for her work on this project.This research was funded in part by the Natural Sciencesand Engineering Research Council of Canada (NSERC) andby the Canadian Social Sciences and Humanities ResearchCouncil (SSHRC).
References
Adler, T.B., de Alfaro, L., Pye, I., & Raman, V. (2008, September). Mea-suring author contributions to the Wikipedia. Paper presented at the 2008International Symposium on Wikis and Open Collaboration (WikiSym’08), Porto, Portugal.
Anthony, D., Smith, S.W., & Williamson, T. (2009). Reputation and reli-ability: The case of the online encyclopedia Wikipedia. Rationality andSociety, 21(3), 283–306.
Arazy, O., Gellatly, I., Jang, S., & Patterson, R. (2009). Wiki deployment incorporate settings. IEEE Technology and Society, 28(2), 57–64.
Arazy, O., & Stroulia, E. (2009).A utility for estimating the relative contribu-tions of wiki authors. In Proceedings of the Third International Conferenceon Weblogs and Social Media (ICWSM’09) (pp. 171–174). Menlo Park,CA: AAAI.
Bisaillon, J. (2007). Professional editing strategies used by six editors.Written Communication, 24(4), 295–322.
Cheng, L., & Kerr, B. (2009). A Collaborative User Experi-ence Project, IBM Watson Research Center, Retrieved February20, 2010, from http://domino.watson.ibm.com/cambridge/research.nsf/242252765710c19485256979004d289c/864fa36402234708852570f90079a47a?OpenDocument
Ding, X., Danis, C., Erickson, T., & Kellogg, W. (2007). Visualizing anenterprise wiki. In Proceedings of the 2007 Conference on Human Fac-tors in Computing Systems (CHI ’07) (pp. 2189–2194). New York:ACM Press.
Ehmann, K., Large, A., & Beheshti, J. (2008). Collaboration in context:Comparing article evolution among subject disciplines in Wikipedia. FirstMonday, 13(10), 6.
Ekstrand, M., & Riedl, J. (2009). Rv you’re dumb: Identifying discardedwork in Wiki article history. In Proceedings of the 2009 InternationalSymposium on Wikis and Open Collaboration (article 4). New York:ACM Press.
Espiritu, C., Stroulia, E., & Tirapat, T. (2006). The ViskiMap Toolkit:Extending Mediawiki with Topic Maps. In Y. Manolopoulos, J. Filipe,P. Constantopoulos, J. Cordeiro, (Eds.), Proceedings of the Eighth Inter-national Conference on Enterprise Information Systems: Databases andInformation Systems Integration (ICEIS 2006) (pp. 420–438). Berlin,Germany: Springer.
Fallis, D. (2008). Towards an epistemology of Wikipedia. Journal ofthe American Society for Information Science & Technology, 59(10),1662–1674.
Hess, M., Kerr, B., & Rickards, L. (2006). Wiki user statistics for regulatingbehaviour, working paper. Retrieved February 25, 2010, from http://icd.si.umich.edu/684/files/684%20wikistat%20paper%202.pdf
Hoisl, B., Aigner, W., & Miksch, S. (2006). Social rewarding in wikisystems—motivating the community. Lecture Notes in Computer Science,4564, 362–371.
Holloway, T., Bozicevic, M., & Börner, K. (2007).Analyzing and visualizingthe semantic coverage of Wikipedia and its authors. Complexity, 12(3),30–40.
Kane, G., & Fichman, R.G. (2009). The shoemaker’s children: Using wikisto improve IS research, teaching, and publication. MIS Quarterly, 33(1),1–22.
Korfiatis, N., Poulos, M., & Bokos, G. (2006). Evaluating authorita-tive sources in collaborative editing environments. Online InformationReview, 30(3), 252–262.
Leuf, B., & Cunningham, W. (2001). The Wiki way: Quick collaboration onthe Web. New York: Addison-Wesley.
Lim, S. (2009). How and why do college students use Wikipedia. Journalof the American Society for Information Science & Technology, 60(11),2189–2202.
Luyt, B., Aaron, T., Thian, L.H., & Hong, C. (2008). Improving Wikipedia’saccuracy: Is edit age a solution? Journal of the American Society forInformation Science & Technology, 59(2), 318–330.
Majchrzak,A., Wagner, C., &Yates, D. (2006). Corporate wiki users: Resultsof a survey. In Proceedings of the International Symposium on Wikis(pp. 99–104). New York: ACM Press.
Munkres, J. (1957). Algorithms for the assignment and transportation prob-lems. Journal of the Society for Industrial and Applied Mathematics(SIAM), 5, pp. 32–38.
Nov, O. (2007). What motivates Wikipedians. Communications of the ACM,50(11): 60–64.
Patterson, R., Gellatly, I., Arazy, O., & Jang, S. (2007, December). Theeffects of wikis characteristics on performance quality. Paper presentedat the 17th Workshop on Information Technologies and Systems (WITS’07), Montreal, Canada.
Pfeil, U., Zaphiris, P., &Ang, C. (2008). Cultural differences in collaborativeauthoring of Wikipedia. Journal of Computer-Mediated Communication,12(1), 88–113.
Rashid, A., Ling, K., Tassone, R., Resnick, P., Kraut, R., & Riedl, J. (2006).Motivating participation by displaying the value of contribution. In Pro-ceedings of the Conference on Human Factors in Computing Systems(pp. 955–958). New York: ACM Press.
Ruecker, S., Fiorentino, C., Arias, C., Bouchard, M., Ganev, V., Arazy, O., &Stroulia, E. (2008, November). Visualizing relative wiki contributions.Paper presented at the Third Annual Chicago Colloquium on DigitalHumanities and Computer Science (DHCS 2008), Chicago, IL.
Sabel, M. (2007). Structuring wiki revision history (pp. 125–130). Proceed-ings of the 2007 International Symposium on Wikis. Montreal: ACM.
Stvilia, B., Twidale, M., Smith, L., & Gasser, L. (2008). Information qual-ity work organization in Wikipedia. Journal of the American Society forInformation Science & Technology, 59(6), 983–1001.
Suh, B., Chi, E., Kittur, A., & Pendleton, B. (2008). Lifting the veil:Improving accountability and social transparency in Wikipedia with Wiki-dashboard. In Proceedings of the 26th Annual Special Interest Groupon Computer-Human Interaction, Conference on Human Factors inComputing Systems (SIGCHI) (pp. 1037–1040). New York: ACM Press.
Sunstein, C. (2006). Infotopia. Oxford, UK: Oxford University Press.Viegas, F., Wattenberg, M., & Dave, K. (2004). Studying cooperation and
conflict between authors with history flow visualizations. In Proceedingsof the 2004 Conference on Human Factors in Computing Systems (CHI2004) (pp. 575–582). New York: ACM Press.
Wagner, C. (2004). Wiki: A technology for conversational knowledge man-agement and group collaboration. Communication of the Association forInformation Systems, 13, 265–289.
Wagner, C. (2006). Breaking the knowledge acquisition bottleneck throughconversational knowledge management. Information Resource Manage-ment Journal, 19(1), 70–83.
JOURNAL OF THE AMERICAN SOCIETY FOR INFORMATION SCIENCE AND TECHNOLOGY—June 2010 1179DOI: 10.1002/asi