Classifier Labels as Language Grounding for Explanations
13
Classifier Labels as Language Grounding for Explanations Paper id: 22 xxx Abstract Advances in state-of-the-art techniques including convolutional neural networks (CNNs) have led to improved perception in autonomous robots. However, these new techniques make the robot’s decision-making process obscure even for the experts. Our goal is to automatically generate natural language explanations for robot’s state and decision-making algorithms in order to help people understand how they made their decisions. Generating natural language explanations is particularly challenging for perception and other high- dimension classification tasks because 1) we lack a mapping from features to language and 2) there are a large number of features which could be explained. We present a novel approach to generating explanations that first find important features that most affect the classification output and then utilize a secondary detector to label (i.e., generate natural language groundings) only those features. We demonstrate our explanation algorithm’s ability to explain our service robot’s building floor identification classifier. Contents 1 Introduction 1 2 Related Work 2 3 Explanation Problem and Approach 3 4 Algorithm Demonstration 7 4.1 Building-Floor Dataset ..................................... 7 4.2 Network Architecture ..................................... 7 4.3 Demonstration Setup ...................................... 8 4.4 Robot Explanation Demonstration .............................. 10 5 Practical Implementation Results and Discussion 10 6 Conclusion 11 1 Introduction Service robots can autonomously generate and execute plans to perform tasks for humans while appropriately handling the uncertainty of their surroundings. In order to achieve these state- of-the-art results, many service robots have adopted deep learning techniques, especially for perception using Convolutional Neural Networks (CNNs). While these algorithms help robots achieve better performance in real-world settings, they are challenging to understand by non- experts. Because non-experts in the environment may need information about the robot’s perception, state prediction, planning, and execution, our goal is to generate explanations of the robot’s algorithm’s decision. Prior work in explaining robot behavior have focused on either explaining a policy (e.g., Hayes and Shah [2017]) or narrating a particular sequence of execution (e.g.,
-
Upload
khangminh22 -
Category
Documents
-
view
2 -
download
0
Transcript of Classifier Labels as Language Grounding for Explanations
Classifier Labels as Language Grounding for Explanations
Paper id: 22
xxx
Abstract
Advances in state-of-the-art techniques including convolutional neural networks (CNNs)have led to improved perception in autonomous robots. However, these new techniquesmake the robot’s decision-making process obscure even for the experts. Our goal is toautomatically generate natural language explanations for robot’s state and decision-makingalgorithms in order to help people understand how they made their decisions. Generatingnatural language explanations is particularly challenging for perception and other high-dimension classification tasks because 1) we lack a mapping from features to language and2) there are a large number of features which could be explained. We present a novelapproach to generating explanations that first find important features that most affect theclassification output and then utilize a secondary detector to label (i.e., generate naturallanguage groundings) only those features. We demonstrate our explanation algorithm’sability to explain our service robot’s building floor identification classifier.
Contents
1 Introduction 1
2 Related Work 2
3 Explanation Problem and Approach 3
4 Algorithm Demonstration 74.1 Building-Floor Dataset . . . . . . . . . . . . . . . . . . . . . . . . . . . . . . . . . . . . . 74.2 Network Architecture . . . . . . . . . . . . . . . . . . . . . . . . . . . . . . . . . . . . . 74.3 Demonstration Setup . . . . . . . . . . . . . . . . . . . . . . . . . . . . . . . . . . . . . . 84.4 Robot Explanation Demonstration . . . . . . . . . . . . . . . . . . . . . . . . . . . . . . 10
5 Practical Implementation Results and Discussion 10
6 Conclusion 11
1 Introduction
Service robots can autonomously generate and execute plans to perform tasks for humans whileappropriately handling the uncertainty of their surroundings. In order to achieve these state-of-the-art results, many service robots have adopted deep learning techniques, especially forperception using Convolutional Neural Networks (CNNs). While these algorithms help robotsachieve better performance in real-world settings, they are challenging to understand by non-experts.
Because non-experts in the environment may need information about the robot’s perception,state prediction, planning, and execution, our goal is to generate explanations of the robot’salgorithm’s decision. Prior work in explaining robot behavior have focused on either explaininga policy (e.g., Hayes and Shah [2017]) or narrating a particular sequence of execution (e.g.,
Classifier Labels as Language Grounding for Explanations Paper id: 22
Rosenthal et al.). While these explanations can potentially help people understand a robot’sactions, they do not help a person determine how the robot determined its current state beforeperforming that action (e.g., using a classifier). One popular approach to generating model-agnostic explanations for a classifier is learning an interpretable model based on the predictionsof the original model Ribeiro et al. [2016]. This technique has been very successful but it maystill be hard for non-experts to understand the new local classifier. Other approaches explainperception classifiers visually (e.g., Selvaraju et al. [2016]). While a visual representation can beuseful, there are times when a robot cannot display an image. Additionally, a visual techniqueis challenging to extend beyond visual domain.
In this work, we focus on automatically generating natural language explanations that sum-marize the meaning of the robot’s feature space (e.g., labeling the pixels that a CNN uses toclassify the robot’s location). While natural language can be more understandable for a person,it is also challenging to generate because there often is not a grounding that easily translates aclassifier’s features to language and it is unclear which features should be explained. Hendrickset al. [2016] uses a pre-defined natural language description of the classes to train a network toproduce explanations for classification of different species of birds. However, this process is notpractical when there are no descriptions for the classes or when there may be many classes toexplain.
Our goal is to create natural language explanations without hand-labeling features. Wepresent a three-part algorithm for explaining a CNN classification that reduces the number offeatures to explain and does not require a predefined mapping from features to natural language.In the first step, our algorithm makes use of deep visualization techniques to find importantpixels in the image. Then, the algorithm makes use of a secondary pre-trained off-the-shelfclassifier to label only the important regions of the image. The labels serve as our naturallanguage descriptions of the important features. Finally, the algorithm uses templates to stitchtogether the labels and their locations within the image for a final explanation.
We demonstrate our explanation algorithm on our robot’s floor identification CNN classifier.After our robot captures an image in our building and classifies the floor it is on, it then usesour algorithm to identify important features in the image that help it determine its floor andproduces a natural language explanation. We conclude with practical implementation resultsthat would allow our algorithm to be applied to other vision-based domains as well as non-visualdomains where important features can be labeled.
2 Related Work
Finding the important features or performing feature reduction Boger and Guterman [1997];Blum and Langley [1997] in the context of machine learning is a well-researched area. But thework does not focus on generating an explanation or making those features interpretable.
A popular approach to generating model-agnostic explanations for a classifier is learning aninterpretable model based on the predictions of the original model Ribeiro et al. [2016]; Baehrenset al. [2010]; Sanchez et al. [2015]. In Ribeiro et al. the authors explain the classification ofany model by learning a separate sparse linear model that locally approximates the originalmodel to explain its decisions. While these models are successful for some domains such as textclassification where the explanations are already language-based, it is unclear how to explainthese local classifiers to non-experts.
Image-specific visualization techniques seek to find what features CNNs have learned to lookfor in each image Zeiler and Fergus [2014]; Selvaraju et al. [2016]; Zhang et al. [2016]; K. et al.[2014]; Zintgraf et al. [2016]. Essentially, they serve as functions that find important regions in
2
Classifier Labels as Language Grounding for Explanations Paper id: 22
an image that most affect the classification and display a heat map representing the relativeimportance of each pixel over the original image. A variety of different methods have beenproposed for determining which features are important, leading to different explanations of theclassification predictions of CNNs. Zeiler and Fergus uses an occluding patch to systematicallyocclude parts of the input image, and use the classifier’s confidence on these images to generatea heat map. The idea behind the approach is if a key feature in an image gets occluded, thenthe classifier’s confidence will fall upon the occlusion. Gradient visualization technique K. etal. [2014], uses gradients of the classifier’s score with respect to the pixels in the input imageas the heat map. The intuition is that the probability scores are more sensitive to the changein values of the important features than others.
While these visual explanations of image classification have been successful, several chal-lenges prevent these techniques from being applied to other domains. First, there are timeswhen either it is not feasible to display a heat map on a robot for an explanation or when a heatmap cannot explain the classification. Second, there are many other types of algorithms fornon-visual features including neural networks that could also be explained by finding importantfeatures. However, the visual heat map does not apply to those algorithms. In this work, wefocus on producing natural language explanations of high-dimension data including images.
Hendricks et al. focuses on generating textual explanations for fine-grained classificationof 200 bird species using deep network from their images. The algorithm explains ResNet Heet al. features extracted from the entire image, and are conditioned both on the image andthe class predictions. The explanation generation algorithm is trained on manually-generatedbird descriptions. While such an approach might be possible for cases where the vocabulary forexplanations are easy to manually define or pre-existing in some other form, it is very tediousto generate natural language for new domains.
Explanations of robot states and actions have similar challenges in mapping features or statesto natural language. For explaining robot actions, Hayes and Shah aims to synthesize policydescriptions and respond to queries about why robots do or do not perform particular actions inparticular states. They learn a simplified domain model of the environment from demonstrationsthen use statistics of the planner over the data to create a behavioral model. However, theirnatural language explanations require manually defined predicates and corresponding language.Rosenthal et al. creates narrations of robot paths and also requires predefined dictionariesmapping states to language. In this work, we utilize existing off-the-shelf classifiers to labelimportant features with natural language, eliminating the need for manual labeling.
3 Explanation Problem and Approach
In this work, we assume that a pre-trained classifier C and an observation (e.g., an image) I withpossibly many features are given. Our goal is to provide a good natural language explanationof how C classified I as a given class y ∈ Y . This problem is challenging for two reasons.First, unlike a visual explanation that can produce a heat map overall features, linguisticallyexplaining each of many features is infeasible. Thus, we must determine what are the mostimportant features to explain. The other challenge is that there may not be a mapping fromthose important features to natural language to use in our explanation. In order to overcomethis challenge, we make use of off-the-shelf pre-trained classifiers that can label parts of thefeature space. In the case of image-based explanations, we use a multi-object classifier thatlabels objects within images. We next describe each step in our explanation algorithm:
1. Identify important features for the classification
3
Classifier Labels as Language Grounding for Explanations Paper id: 22
(a) (b) (c)
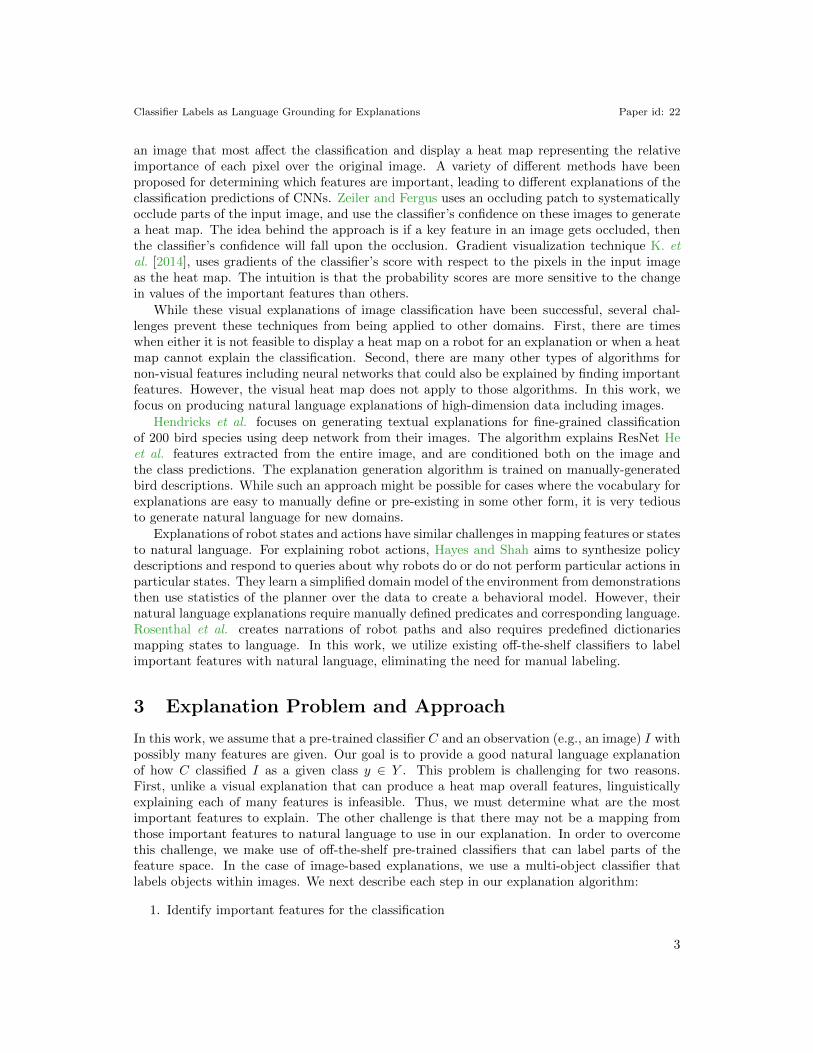
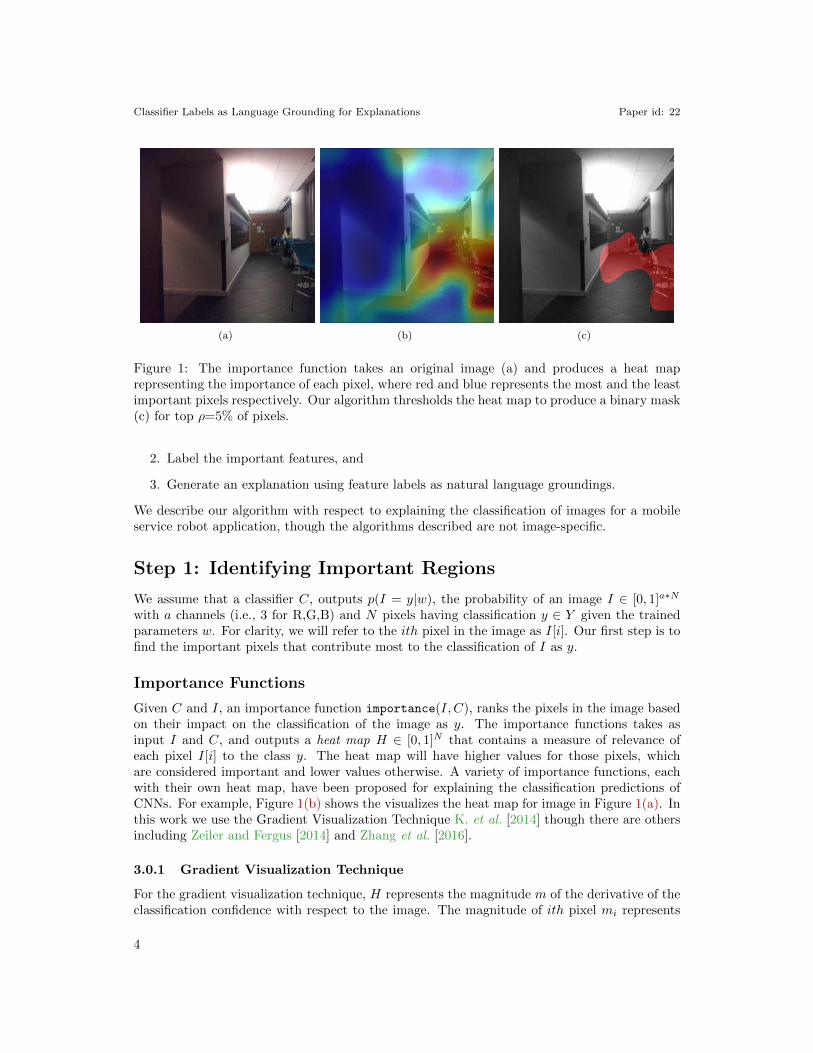
Figure 1: The importance function takes an original image (a) and produces a heat maprepresenting the importance of each pixel, where red and blue represents the most and the leastimportant pixels respectively. Our algorithm thresholds the heat map to produce a binary mask(c) for top ρ=5% of pixels.
2. Label the important features, and
3. Generate an explanation using feature labels as natural language groundings.
We describe our algorithm with respect to explaining the classification of images for a mobileservice robot application, though the algorithms described are not image-specific.
Step 1: Identifying Important Regions
We assume that a classifier C, outputs p(I = y|w), the probability of an image I ∈ [0, 1]a∗N
with a channels (i.e., 3 for R,G,B) and N pixels having classification y ∈ Y given the trainedparameters w. For clarity, we will refer to the ith pixel in the image as I[i]. Our first step is tofind the important pixels that contribute most to the classification of I as y.
Importance Functions
Given C and I, an importance function importance(I, C), ranks the pixels in the image basedon their impact on the classification of the image as y. The importance functions takes asinput I and C, and outputs a heat map H ∈ [0, 1]N that contains a measure of relevance ofeach pixel I[i] to the class y. The heat map will have higher values for those pixels, whichare considered important and lower values otherwise. A variety of importance functions, eachwith their own heat map, have been proposed for explaining the classification predictions ofCNNs. For example, Figure 1(b) shows the visualizes the heat map for image in Figure 1(a). Inthis work we use the Gradient Visualization Technique K. et al. [2014] though there are othersincluding Zeiler and Fergus [2014] and Zhang et al. [2016].
3.0.1 Gradient Visualization Technique
For the gradient visualization technique, H represents the magnitude m of the derivative of theclassification confidence with respect to the image. The magnitude of ith pixel mi represents
4

Classifier Labels as Language Grounding for Explanations Paper id: 22
Figure 2: Example for generating EM . Our algorithm takes an original image (a) and createsa binary mask of the important features (b). It also uses a secondary classifier to label regionsof the image (c) and discretizes the image into 9 grid cells (d) to use in the explanation.
the sensitivity of the network’s prediction to the change in that pixel’s value and is equal tothe derivative of the classification probability p(I = y|w) with respect to I[i]. We expect theclassifier accuracy to be more sensitive to the change in values of the important features thanothers. Note that since the gradients are pixel-wise importance values for the image, the heatmap is generally of high entropy and thus lacks continuous important image regions.
Importance Mask
While the heat map is useful for visualization, we propose the use of a binary mask– forexample the red mask in Figure 1(c) – to signify whether a feature (pixel) is included in theimportant region or not. To find the important pixel features from from a heat map, manydifferent segmentation techniques have been proposed – region-based Chen and Chen [2009],threshold-based Karthikeyan et al. [2012] or model-based Lehmann [2011]. Although model-based segmentation tends to perform better, for simplicity, we use a simple threshold-basedsegmentation to find the important regions in this work. A binary mask M ∈ {0, 1}N is createdsuch that each pixel i takes value:
M [i] =
{1 if important
0 otherwise.
We find the important features for the classification by segmenting the heat map using thresh-olding to compute a binary importance mask M . We generate the mask by segmenting top ρ%of the pixels from H. For example, Figure 1(c) is the importance mask obtained by thresholdingthe heat map shown in Figure 1(b) with ρ = 50% of pixels.
Step 2: Labeling Important Regions using a SecondaryClassifier
Using the mask M of important features in I (e.g., Figures 1(a) and 1(c) and also Figures 2(a)and (b)), our algorithm then generates natural language groundings for the important regionsin the image masked by M , by using a secondary classifier. In our application, we use animage-based multi-object detector, but any secondary classifier over features in I would work.
5

Classifier Labels as Language Grounding for Explanations Paper id: 22
Extracting Explainable Features of an Image
The detector identifies a set of objects as potential explainable features E {o0, ...ol} in theimage and their corresponding bounding boxes {(xa0, xb0, ya0, yb0), ... (xal, xbl, yal, ybl)} asshown in Figure 2(c). The bounding boxes represent the features that pertain to the object.To generate explainable features for the important regions in the image EM , we remove objectsin E with less than a threshold ratio t, of their bounding box overlapping with the importancemask M . We also filter unrelated features in E by removing tuples containing objects present ina rejection corpus R. The filtering is done to remove erroneous detections from the multi-objectdetector. The rejection corpus is constructed using object names that would not be found inthe robot’s environment.
To summarize, our algorithm automatically generates a list of explainable features EM fora particular image I and importance mask M by applying filters:
Eb = {ei |sum(M [xai : xbi, yai : ybi])
(xai − xbi) ∗ (yai − ybi)> t, ∀ei ∈ E}
EM = Eb \ {ei | oi ∈ R, ∀ei ∈ E}
where M[x1:x2, y1:y2] is a submatrix of M with (y2-y1) rows and (x2-x1) columns, it containingelements from M in x1 to x2 columns and y1 to y2 rows.
To simplify references to the explainable features (i.e., in our case references are locationsin the image), we discretize the image into g grid cells (e.g., Figure 2d with 9 cells), and usethe grid index gId of the detected object’s center as a proxy to their location in the imagerather than the xy location. The discretization can be utilized to non-vision data as well. Forexample, rather than using full timestamps in temporal data, it is possible to discretize eventsby morning, afternoon, evening, and night. In the end, our explainable features are labeledobjects that appear in the most important regions and their relative location within an image.
Extracting Explainable Attributes of a Class
Though we have a list of many explainable features for an image, we would like to identifythe explainable features that occur commonly in the class and that could be described as anattribute of the class rather than anomalous objects. Given a training set of images prior toproviding any explanations, our algorithm computes the explainable features as above for eachtraining image and then computes the union (probabilistic combination can also be used) ofEM s as the explainable attributes for class y ∈ Y as Ey.
Note that we use a small training set of 5 so the union is still a small number of explainableclass attributes. Other methods such as the intersection or a threshold may be used to reducethe size of the class attributes if it is large. We assume that the classifier, importance function,and multi-object detector are good enough to produce unique explainable features for each class,i.e., all the classes are distinguishable using only their explainable feature Ey. Ey representsthe dictionary of attributes defining the class.
Step 3: Generating Explanations
Finally, our algorithm computes the intersection EM,y of features in EM (representing theimportant regions of the image) and Ey (representing the attributes of class y) to find theexplainable features that the two have in common. There may be features in the image that arenot attributes of the class or vice versa that should not be explained. For example, if a plant
6

Classifier Labels as Language Grounding for Explanations Paper id: 22
is detected in a hallway but that plant is not commonly found there, it should not be reportedas a reason that the image was classified as the hallway.
We use language grounding and template-based natural language generation to convertEM,y to natural language explanations. To ground the grid locations, we related grid locationto a corresponding spatial location. For example, gId=(0,2) is ‘top right’ and gId=(1,1) is‘center.’ For grounding explainable features, the multi-object detector’s object labels are aproxy for naming the objects in the image. We combine all the natural language groundingsfrom EM,y with a simple natural language template to create an explanation. Our algorithmdemonstration section includes the template used in our work.
Rather than explaining all pixels or specific pixels, the algorithm focuses on importantpixels and finds natural labels for those pixels using a secondary classifier. It also focuses onexplaining the important attributes of the class rather than all objects that could be labeledin the important regions. This explanation is a summary of the objects or explainable featuresthat are representative of the class.
4 Algorithm Demonstration
When a robot navigates across many floors of a building or multiple buildings, one majorchallenge that it has is localizing itself to determine which floor it is currently on. We collecteda Building-Floor dataset and trained a CNN scene recognition classifier for determining whichfloor our robot is on. We then tested our algorithm’s ability to explain why it classified ourrobot’s images as particular floors of the building. We used an off-the-shelf multi-object detectorto label explainable features like chairs, plants, and tables in our hallways that distinguish onefloor from another. Our results show that the robot’s explanations are accurate yet concisegiven the number of features in the images.
4.1 Building-Floor Dataset
We collected a Building-Floor dataset in one of our buildings. Each image contains the scenejust outside the elevator from six different floors of the building, ref Figure 3. The goal ofthe classifier C, trained on this dataset is to find which floor the image is taken from. Sincethe robot cannot change floors other than by taking the elevator, the elevators are the onlylocations where we need to classify the robot’s location.
For each of the floors in the building, five images were taken at a particular location thatour robot stops at after exiting the elevator. To simplify the analysis, all the images were takenat the same time of the day, and the effects of people moving around in the building are notconsidered. The training data consists of three images, and the remaining two images formthe verification dataset. As the scene does not change a lot in theory, one image is enough tobe able to train and obtain good performance. In practice, this is not true so we use threeimages to avoid overfitting and capture some variation in the scene. Testing data collectedseparately consists of five images from each of the floor taken at similar daytime and settingsas the training dataset. The newly collected testing dataset was obtained while our robot wasperforming multi-floor navigation tasks.
4.2 Network Architecture
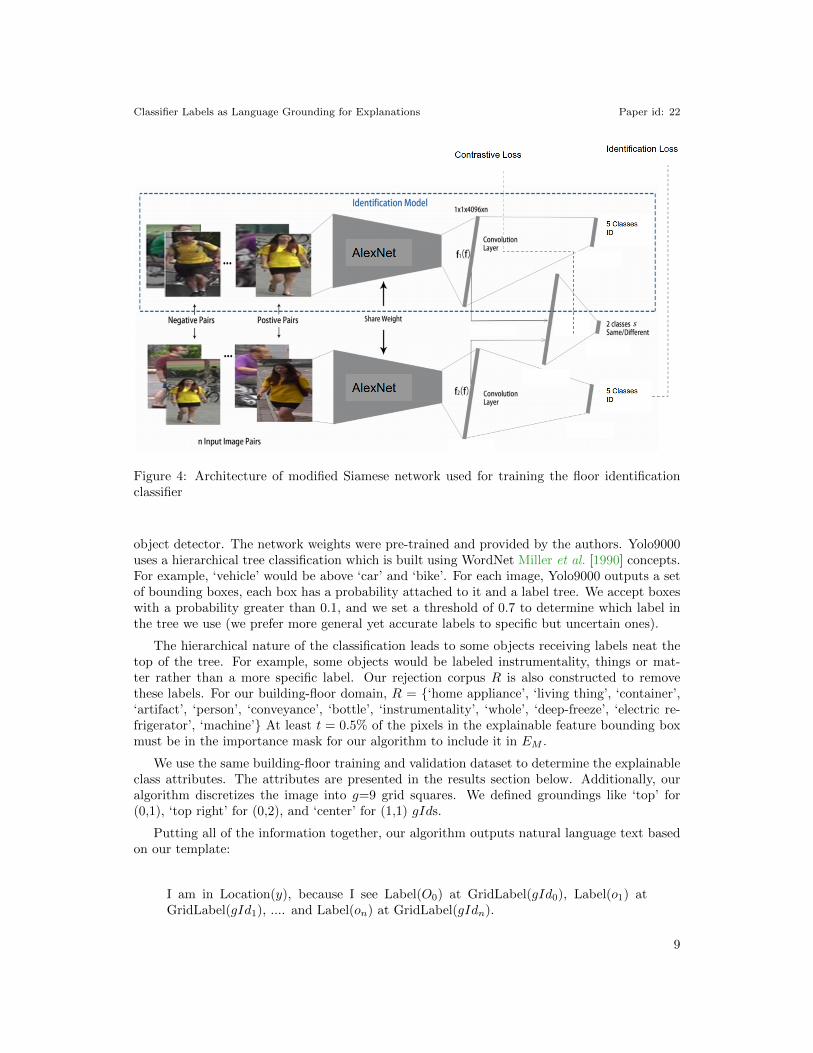
The deep learning network for our floor identification classifier C, consists of nine layers followingAlexNet Krizhevsky et al. [2012] in a modified Siamese architecture as proposed in Sun et al.;
7

Classifier Labels as Language Grounding for Explanations Paper id: 22
Figure 3: Sample of images from the Floor detection dataset. Each image belongs to a differentfloor.
Zheng et al., which combined the identification– Softmax, and the verification loss– Contrastive,for better performance, refer Figure 4. The approach we have taken to classify each of thefloors using a DNN based network is currently a popular method and can be easily scaled toaccommodate more classes. Our main reason for combining identification and verification losswith a pre-trained network is to reduce overfitting which could happen when the complexityof network is higher than the data. During training, the first seven layers of our network wereinitialized from Places205-AlexNet which was trained in the Places205-Standard dataset andprovided by the authors Zhou et al. [2014]. The remaining two layers were trained from scratch.During training, the contrastive loss was utilized in the eighth layer which is a dense layer of1000 units, while the softmax loss was employed in the ninth layer.
The classifier C can classify all the images in the testing dataset correctly. We believethe high performance of our network is because the training and testing images were taken insimilar setting and that the inter-class variation is quite high in the dataset. Another importantreason for the good performance of our floor identification module is the use of the Siamesearchitecture during training. Siamese architecture by its nature increases the network’s abilityto maximizes inter-class variability while minimizing intra-class variability.
4.3 Demonstration Setup
We implemented our explanation generation algorithm to describe the deep learning floor clas-sifier. Given an image that was classified, the algorithm first finds the important regions of theimage. Because the heat map generated from the gradient visualization technique is generallyof high entropy and lacks continuous important image regions, we dilated the heat map twicewith a 3x3 kernel. Dilating smoothens the heat map and improves the continuity of importantregions. The algorithm then generates the importance mask M , by segmenting top ρ=50%pixels from the dilated heat map.
In our demonstration, our algorithm used Yolo9000 Redmon and Farhadi [2016] as the multi-
8
Classifier Labels as Language Grounding for Explanations Paper id: 22
Figure 4: Architecture of modified Siamese network used for training the floor identificationclassifier
object detector. The network weights were pre-trained and provided by the authors. Yolo9000uses a hierarchical tree classification which is built using WordNet Miller et al. [1990] concepts.For example, ‘vehicle’ would be above ‘car’ and ‘bike’. For each image, Yolo9000 outputs a setof bounding boxes, each box has a probability attached to it and a label tree. We accept boxeswith a probability greater than 0.1, and we set a threshold of 0.7 to determine which label inthe tree we use (we prefer more general yet accurate labels to specific but uncertain ones).
The hierarchical nature of the classification leads to some objects receiving labels neat thetop of the tree. For example, some objects would be labeled instrumentality, things or mat-ter rather than a more specific label. Our rejection corpus R is also constructed to removethese labels. For our building-floor domain, R = {‘home appliance’, ‘living thing’, ‘container’,‘artifact’, ‘person’, ‘conveyance’, ‘bottle’, ‘instrumentality’, ‘whole’, ‘deep-freeze’, ‘electric re-frigerator’, ‘machine’} At least t = 0.5% of the pixels in the explainable feature bounding boxmust be in the importance mask for our algorithm to include it in EM .
We use the same building-floor training and validation dataset to determine the explainableclass attributes. The attributes are presented in the results section below. Additionally, ouralgorithm discretizes the image into g=9 grid squares. We defined groundings like ‘top’ for(0,1), ‘top right’ for (0,2), and ‘center’ for (1,1) gIds.
Putting all of the information together, our algorithm outputs natural language text basedon our template:
I am in Location(y), because I see Label(O0) at GridLabel(gId0), Label(o1) atGridLabel(gId1), .... and Label(on) at GridLabel(gIdn).
9

Classifier Labels as Language Grounding for Explanations Paper id: 22
Image Explanation algorithm output
Classification: Floor 3
EM,3: [‘(0,1), pot’, ‘(1,1), chair’, ‘(2,1), furnishing’, ‘(2,1), chair’]
Class Attributes: [‘(0,1), pot’, ‘(1,1), pot’, ‘(1,1), chair’,
‘(2,1), person’, ‘(2,1), furnishing’, ‘(2,1), chair’]
Explanation: I am in floor 3, because I see pot at left top, chairat
center, furnishing at right center and chair at right center.
Classification: Floor 5
EM,5: [‘(2,1), chair’, ‘(2,1), furnishing’, ‘(2,2), chair’]
Class Attributes: [‘(1,1), chair’, ‘(1,1), furnishing’, ‘(1,1), table’,
‘(1,2), chair’, ‘(2,1), chair’, ‘(2,2), furnishing’, ‘(2,1), furnishing’,
‘(2,2), chair’]
Explanation: I am in floor 5, because I see chair at right center,
chair at right center and furnishing at right bottom.
Classification: Floor 6
EM,6: [‘(2,1), pot’, ‘(2,1), sofa’]
Class Attributes: [‘(1,1), person’, ‘(2,1), furnishing’, ‘(2,1), chair’,
‘(2,1), pot’, ‘(2,1), sofa’]
Explanation: I am in floor 6, because I see pot at right center and
sofa at right center.
Table 1: Explanations for three floors of our building.
4.4 Robot Explanation Demonstration
We tested our algorithm’s ability to explain each floor of our building. The intermediate andfinal outputs are provided for three example floors in Table 1. For the first image representingFloor 3, the multi-object detector finds six explainable features that have more than t = 0.5 oftheir area included in the importance mask – EM = [‘(0,1), pot’, ‘(1,1), pot’, ‘(1,1), chair’, ‘(2,1),person’, ‘(2,1), furnishing’, ‘(2,1), chair’]. However, when compared to the class attributes, onlyfour of the features are included in EM,3 as shown in Table 1. The natural language explanationfor the Floor 3 image is: ‘I am in floor 3, because I see pot at left top, chair at center, furnishingat right center and chair at right center.’
5 Practical Implementation Results and Discussion
In implementing the explanation algorithm, we observed several practical requirements andmade several design decisions that affect applicability to new domains.
First, it is important to choose a secondary classifier that can actually label the features inthe domain and ideally produce unique attributes per class. Two of our floors (2 and 7) have
10

Classifier Labels as Language Grounding for Explanations Paper id: 22
very few features in our training images. In fact, the classifier was unable to find any featuresin any training images for Floor 2. Since no other class attribute set was empty, the lack ofexplainable features was considered unique to that class. In our testing, Yolo9000 could notdetect any objects for two images from ‘Floor 7’ either, since the image contained nothing otherthan a brown wall (sometimes there was a plant in view). The inability to distinguish Floors 2and 7 on those images were the only two errors in our classifier. Training Yolo9000 to detectwalls in general (it labeled walls as ‘electric refrigerator’ in some images as shown in Figure 2c)and specifically the difference between brown and white walls would have improved this result.However, overall the algorithm was very robust to our classifier and threshold choices.
Next, we made a decision to include only the explainable features in the image that alsooccurred within the class attributes. While taking an intersection to generate EM,c provides agood explanation in our domain, we also considered other ways of determining which featuresto include. In one alternative, we included all objects from EM . As a result for Floor 3, thealgorithm explains seven features [‘(0,1), pot’, ‘(1,1), pot’, ‘(1,1), chair’, ‘(1,2), seat’, ‘(2,1),person’, ‘(2,1), furnishing’, ‘(2,1), chair’] rather than four. In practice, we found that removingfeatures that were not important for the class (e.g., seat) reduced some of the confusion aboutwhether the feature was important for the image or for the classification. Another alternativewas to use the explainable features that represented the difference between EM,c and Ec′ ∀c′ ∈C &c′ 6= c. This algorithm explains three features [‘(0,1), pot’, ‘(1,1), pot’, ‘(2,1), person’]which uniquely differentiate it from all other classes. In practice, this selection algorithm oftenproduced too few and/or empty feature lists because all the classes contain a similar set ofobjects but in different positions. Choosing to explain EM,c was a good balance betweenincluding enough features to be useful yet limiting the features that were not important in theclassifier.
Finally, our implementation built on top of the extensive prior work in finding importantregions of images. To extend this work to classifiers operating on non-image data, we suggestusing other existing importance functions such as PCA or a modified version of the deep vi-sualization technique. We used an image-based multi-object detector, but any classifier oversubsets of features would be applicable. Even the discretization of our image for an explanationcan be adapted to non-vision data. For example, rather than using full timestamps in temporaldata, it is possible to discretize events by morning, afternoon, evening, and night.
6 Conclusion
We contribute an algorithm for automatically generating an explanation for classifiers usingnatural language. In order to avoid explaining all features, our algorithm first finds the impor-tant regions of the image. Then, using a secondary pre-trained classifier, it finds the explainablefeatures that makeup only the important regions of the image and uses the labels as the naturallanguage description. By relying on a separate multi-object detector, our algorithm can labeland explain the images without manual labelings. The algorithm then determines which of theimage’s features are common to the class and generates an explanation of only those features.We demonstrate our algorithm on a real CNN classifier used on our robot and discuss practicalimplementation details that affect its applicability to new domains.
11

Classifier Labels as Language Grounding for Explanations Paper id: 22
References
David Baehrens, Timon Schroeter, Stefan Harmeling, Motoaki Kawanabe, Katja Hansen, andKlaus-Robert MAzller. How to explain individual classification decisions. Journal of MachineLearning Research, 11(Jun):1803–1831, 2010.
Avrim L Blum and Pat Langley. Selection of relevant features and examples in machine learning.Artificial intelligence, 97(1):245–271, 1997.
Zvi Boger and Hugo Guterman. Knowledge extraction from artificial neural network models.In Systems, Man, and Cybernetics, 1997. Computational Cybernetics and Simulation., 1997IEEE International Conference on, volume 4, pages 3030–3035. IEEE, 1997.
Yuan Been Chen and Oscal TC Chen. Image segmentation method using thresholds automati-cally determined from picture contents. EURASIP Journal on Image and Video Processing,2009(1):140492, 2009.
Bradley Hayes and Julie A Shah. Improving robot controller transparency through autonomouspolicy explanation. In Proceedings of the 2017 ACM/IEEE International Conference onHuman-Robot Interaction, pages 303–312. ACM, 2017.
Kaiming He, Xiangyu Zhang, Shaoqing Ren, and Jian Sun. Deep residual learning for imagerecognition. In Proceedings of the IEEE conference on computer vision and pattern recogni-tion, pages 770–778, 2016.
Lisa Anne Hendricks, Zeynep Akata, Marcus Rohrbach, Jeff Donahue, Bernt Schiele, and TrevorDarrell. Generating visual explanations. In European Conference on Computer Vision, pages3–19. Springer, 2016.
Simonyan K., Vedaldi A., and Zisserman A. Deep inside convolutional networks: Visualisingimage classification models and saliency maps. In ICLR Workshop, 2014.
B Karthikeyan, V Vaithiyanathan, B Venkatraman, and M Menaka. Analysis of image segmen-tation for radiographic images. Indian Journal of Science and Technology, 5(11):3660–3664,2012.
A. Krizhevsky, I. Sutskever, and G. Hinton. Imagenet classification with deep convolutionalneural networks. In Advances in neural information processing systems, pages 1097–1105,2012.
Frederic Lehmann. Turbo segmentation of textured images. IEEE transactions on patternanalysis and machine intelligence, 33(1):16–29, 2011.
George A Miller, Richard Beckwith, Christiane Fellbaum, Derek Gross, and Katherine J Miller.Introduction to wordnet: An on-line lexical database. International journal of lexicography,3(4):235–244, 1990.
Joseph Redmon and Ali Farhadi. Yolo9000: Better, faster, stronger. 2016.
Marco Tulio Ribeiro, Sameer Singh, and Carlos Guestrin. Why should i trust you?: Explainingthe predictions of any classifier. In Proceedings of the 22nd ACM SIGKDD InternationalConference on Knowledge Discovery and Data Mining, pages 1135–1144. ACM, 2016.
12
Classifier Labels as Language Grounding for Explanations Paper id: 22
Stephanie Rosenthal, Sai P Selvaraj, and Manuela M Veloso. Verbalization: Narration ofautonomous robot experience.
Ivan Sanchez, Tim Rocktaschel, Sebastian Riedel, and Sameer Singh. Towards extractingfaithful and descriptive representations of latent variable models. AAAI Spring Syposiumon Knowledge Representation and Reasoning (KRR): Integrating Symbolic and Neural Ap-proaches, 2015.
R. Selvaraju, Das A., R. Vedantam, M. Cogswell, D. Parikh, and D. Batra. Grad-cam: Whydid you say that? visual explanations from deep networks via gradient-based localization.CoRR, abs/1610.02391, 2016.
Y. Sun, Y. Chen, X. Wang, and X. Tang. Deep learning face representation by jointidentification-verification. In Advances in neural information processing systems, pages 1988–1996, 2014.
M. Zeiler and R. Fergus. Visualizing and understanding convolutional networks. In Europeanconference on computer vision, pages 818–833. Springer, 2014.
J. Zhang, Z. Lin, J. Brandt, X. Shen, and S. Sclaroff. Top-down neural attention by excitationbackprop. In European Conference on Computer Vision, pages 543–559. Springer, 2016.
Z. Zheng, L. Zheng, and Y. Yang. A discriminatively learned CNN embedding for personre-identification. CoRR, abs/1611.05666, 2016.
B. Zhou, A. Lapedriza, J. Xiao, A. Torralba, and A. Oliva. Learning deep features for scenerecognition using places database. In Advances in neural information processing systems,pages 487–495, 2014.
L. Zintgraf, T. Cohen, and M. Welling. A new method to visualize deep neural networks. CoRR,abs/1603.02518, 2016.
13