Sixth Graders’ Co-construction of Explanations of a Disturbance in an Ecosystem: Exploring...
39
This article was downloaded by: [University of Cyprus] On: 23 March 2015, At: 08:12 Publisher: Routledge Informa Ltd Registered in England and Wales Registered Number: 1072954 Registered office: Mortimer House, 37-41 Mortimer Street, London W1T 3JH, UK International Journal of Science Education Publication details, including instructions for authors and subscription information: http://www.tandfonline.com/loi/tsed20 Sixth Graders’ Co-construction of Explanations of a Disturbance in an Ecosystem: Exploring relationships between grouping, reflective scaffolding, and evidence-based explanations Eleni A. Kyza a , Costas P. Constantinou b & George Spanoudis c a Department of Communication and Internet Studies , Cyprus University of Technology , Limassol, Cyprus b Learning in Science Group, Department of Educational Sciences , University of Cyprus , Nicosia, Cyprus c Department of Psychology , University of Cyprus , Nicosia, Cyprus Published online: 04 May 2011. To cite this article: Eleni A. Kyza , Costas P. Constantinou & George Spanoudis (2011) Sixth Graders’ Co-construction of Explanations of a Disturbance in an Ecosystem: Exploring relationships between grouping, reflective scaffolding, and evidence-based explanations, International Journal of Science Education, 33:18, 2489-2525, DOI: 10.1080/09500693.2010.550951 To link to this article: http://dx.doi.org/10.1080/09500693.2010.550951 PLEASE SCROLL DOWN FOR ARTICLE Taylor & Francis makes every effort to ensure the accuracy of all the information (the “Content”) contained in the publications on our platform. However, Taylor & Francis, our agents, and our licensors make no representations or warranties whatsoever as to the accuracy, completeness, or suitability for any purpose of the Content. Any opinions and views expressed in this publication are the opinions and views of the authors, and are not the views of or endorsed by Taylor & Francis. The accuracy of the Content should not be relied upon and should be independently verified with primary sources of information. Taylor and Francis shall not be liable for any losses, actions, claims, proceedings, demands, costs, expenses, damages, and other liabilities whatsoever
Transcript of Sixth Graders’ Co-construction of Explanations of a Disturbance in an Ecosystem: Exploring...

This article was downloaded by: [University of Cyprus]On: 23 March 2015, At: 08:12Publisher: RoutledgeInforma Ltd Registered in England and Wales Registered Number: 1072954 Registeredoffice: Mortimer House, 37-41 Mortimer Street, London W1T 3JH, UK
International Journal of ScienceEducationPublication details, including instructions for authors andsubscription information:http://www.tandfonline.com/loi/tsed20
Sixth Graders’ Co-construction ofExplanations of a Disturbance in anEcosystem: Exploring relationshipsbetween grouping, reflectivescaffolding, and evidence-basedexplanationsEleni A. Kyza a , Costas P. Constantinou b & George Spanoudis ca Department of Communication and Internet Studies , CyprusUniversity of Technology , Limassol, Cyprusb Learning in Science Group, Department of EducationalSciences , University of Cyprus , Nicosia, Cyprusc Department of Psychology , University of Cyprus , Nicosia,CyprusPublished online: 04 May 2011.
To cite this article: Eleni A. Kyza , Costas P. Constantinou & George Spanoudis (2011) SixthGraders’ Co-construction of Explanations of a Disturbance in an Ecosystem: Exploring relationshipsbetween grouping, reflective scaffolding, and evidence-based explanations, International Journalof Science Education, 33:18, 2489-2525, DOI: 10.1080/09500693.2010.550951
To link to this article: http://dx.doi.org/10.1080/09500693.2010.550951
PLEASE SCROLL DOWN FOR ARTICLE
Taylor & Francis makes every effort to ensure the accuracy of all the information (the“Content”) contained in the publications on our platform. However, Taylor & Francis,our agents, and our licensors make no representations or warranties whatsoever as tothe accuracy, completeness, or suitability for any purpose of the Content. Any opinionsand views expressed in this publication are the opinions and views of the authors,and are not the views of or endorsed by Taylor & Francis. The accuracy of the Contentshould not be relied upon and should be independently verified with primary sourcesof information. Taylor and Francis shall not be liable for any losses, actions, claims,proceedings, demands, costs, expenses, damages, and other liabilities whatsoever

or howsoever caused arising directly or indirectly in connection with, in relation to orarising out of the use of the Content.
This article may be used for research, teaching, and private study purposes. Anysubstantial or systematic reproduction, redistribution, reselling, loan, sub-licensing,systematic supply, or distribution in any form to anyone is expressly forbidden. Terms &Conditions of access and use can be found at http://www.tandfonline.com/page/terms-and-conditions
Dow
nloa
ded
by [
Uni
vers
ity o
f C
ypru
s] a
t 08:
12 2
3 M
arch
201
5

ISSN 0950-0693 (print)/ISSN 1464-5289 (online)/11/182489–37© 2011 Taylor & Francis
RESEARCH REPORT
Sixth Graders’ Co-construction of Explanations of a Disturbance in an Ecosystem: Exploring relationships between grouping, reflective scaffolding, and evidence-based explanations
Eleni A. Kyzaa*, Costas P. Constantinoub and George SpanoudiscaDepartment of Communication and Internet Studies, Cyprus University of Technology, Limassol, Cyprus; bLearning in Science Group, Department of Educational Sciences, University of Cyprus, Nicosia, Cyprus; cDepartment of Psychology, University of Cyprus, Nicosia, CyprusTaylor and FrancisTSED_A_550951.sgm10.1080/09500693.2010.550951International Journal of Science Education0950-0693 (print)/1464-5289 (online)Original Article2011Taylor & [email protected]
We report on a study investigating the relationship between cognitive ability grouping, reflectiveinquiry scaffolding, and students’ collaborative explanations of an ecosystem disturbance whichtook place when a number of flamingo birds died in a salt lake because of nearby intensive humanactivities. Twenty-six pairs of students from two intact sixth-grade classes participated in the study.All students investigated scientific data relating to the ecosystem problem using a web-basedlearning environment. One class was provided with web-based reflective inquiry scaffolding(WorkSpace), while the other class used PowerPoint. The main data analyzed for this studyconsisted of each pair’s written explanation and task-related artifacts. Findings show that the web-based reflective scaffolding supported students in providing valid evidence in support of theirexplanations. The analyses of the students’ collaborative explanations showed no statisticallysignificant differences that could be attributed to prior achievement between students in theWorkSpace condition, while differences were found between the different cognitive ability pairs inthe PowerPoint class. These findings suggest that the WorkSpace scaffolding may have providedmore influential support to lower cognitive ability pairs in creating evidence-based explanations.
*Corresponding author. Department of Communication and Internet Studies, Cyprus Universityof Technology, P.O. Box 50329, Limassol 3603, Cyprus. Email: [email protected]
International Journal of Science Education
Vol. 33, No. 18, December 2011, pp. 2489–2525
http://dx.doi.org/10.1080/09500693.2010.550951
Dow
nloa
ded
by [
Uni
vers
ity o
f C
ypru
s] a
t 08:
12 2
3 M
arch
201
5

Keywords: Explanations; Evidence-based reasoning; Inquiry-based learning; Reflective inquiry scaffolding
Introduction
Explanation-building is at the heart of making sense of the natural, technological,and social world (de Vries, Lund, & Baker, 2002; Salmon, 1989; Sandoval & Reiser,2004). In our work, we view explanation-driven inquiry as the means to learn, do,and teach science, a view which is supported by extensive literature in scienceteaching and learning (Anderson, 2002; Chinn & Malhotra, 2002; Donovan &Bransford, 2005; NRC, 1996; White & Frederiksen, 1998). The design of learningenvironments that nurture the practice of explaining can be very powerful: children’sengagement in the process of creating explanations is an epistemic activity that canfoster students’ knowledge acquisition and help refine existing knowledge structures(de Vries et al., 2002; Sandoval & Reiser, 2004).
In this paper, we examine the relationship between cognitive ability grouping,reflective scaffolding, and the quality of students’ collaborative causal explanationsof a complex ecological problem. The term ‘general cognitive ability’ refers tostudents’ capacity to grasp and learn concepts, understand the relationships ofconcepts, and solve problems. This study was part of a broader research project thataims to investigate software-based scaffolding as a means to support middle schoolstudents’ inquiry learning. The study seeks to contribute to current understanding ofthe complex interplay between software scaffolds and students’ collaborative inquirylearning in science, by investigating whether the scaffolding provided by inquiry-support systems had a differentiated effect in supporting students of varyingcognitive abilities to engage in extended inquiry projects. To our knowledge, thequestion of whether software-based inquiry scaffolding has differentiated effects onstudents’ collaborative explanation construction according to their cognitive abilityhas not received much attention in the literature.
The paper begins with an overview of students’ difficulties with evidence-basedexplanations in inquiry-based science learning and a discussion of scaffolding to helpstudents overcome such difficulties. We then present the methodology of a studydesigned to examine the relationship between grouping and reflective scaffolding.We conclude with a presentation of the results of this study and a discussion of theimplications for scaffolding different cognitive ability students’ explanation-building.
Students’ Difficulties with Scientific Reasoning and Creating Evidence-Based Explanations
Learners encounter considerable challenges in approaching inquiry-based science asa knowledge-building process and in developing the disciplinary skills required toreason scientifically (Krajcik, Blumenfeld, Marx, Bass, & Fredricks, 1998; Kuhn,Amsel, & O’Loughlin, 1988; Quintana et al., 2004; Reiser, 2004). Inquiry is an ill-structured quest for evidence-based knowledge that differentiates substantially
E. A. Kyza et al.2490
Dow
nloa
ded
by [
Uni
vers
ity o
f C
ypru
s] a
t 08:
12 2
3 M
arch
201
5

according to the phenomena being examined. For these reasons, researchers haveargued about the need to be guided in developing into a self-regulated inquirer (Rogoff,2008). In addition to the challenges in grasping the fundamental concepts of hownatural systems function, middle school students are often reported to encounter diffi-culties when asked to corroborate their explanations of physical and biologicalphenomena (Brewer, Chinn, & Samarapungavan, 2000; Kuhnet al., 1988; Sandoval,2003; Zimmerman, 2005; Zuzovsky & Tamir, 1999). It is extremely important toaddress students’ challenges, as it has been shown that formulating explanations canimprove one’s understanding (Chi, Leeuw, Chiu, & LaVancher, 1994); furthermore,it has been suggested that articulating explanations, verbally or in writing, is a char-acteristic of higher-achieving students (Chi, Bassok, Lewis, Reimann, & Glaser, 1989).
One commonly reported theme is students’ difficulties with explanation-building.Explanation can be seen as the ultimate goal of scientific inquiry (Salmon, 1989)and, as an extension, a primary goal in learning science. Middle school students areable to provide explanations of how the world around them works but may not citeevidence in support of their explanations (Glassner, Weinstock, & Neuman, 2005;Kuhn et al., 1988; Wu & Hsieh, 2006), even in cases when their explanations arewarranted by the data they have examined (Sandoval, 2003). When students do citeevidence, there may be problems relating to the quality of that evidence (McNeill &Krajcik, 2007; Sandoval & Millwood, 2005). Another area of difficulty is consider-ing alternative explanations of the data (Kyza, 2009; Mynatt, Doherty, & Tweney,1977). In previous research with seventh-grade students, we provided evidence indi-cating that students’ challenges in discussing alternative explanations of their datawere related to their epistemologies of what constitutes a good scientific explanationand argued that students can be guided in understanding the role of addressingalternative explanations (Kyza, 2009).
Reflective Inquiry: An essential process in explanation-building
From the discussion thus far, it appears that students need support in understandingwhat counts as evidence, determining the quality and appropriateness of evidence,and creating persuasive arguments within the domain-specific explanatory frameworkthey are investigating (Sadler, 2004). Some of the challenges students encounterbecome more apparent when they are engaged in inquiry-based learning, are asked towork collaboratively to solve data-rich problems, and construct evidence-based expla-nations. Reiser (2004) summarized students’ challenges as relating to the cognitivecomplexity and unfamiliar social interaction and discourse patterns, with non-reflective work being one of the crucial cognitive challenges. Specifically, Reiser arguedthat ‘for learning through investigation to succeed, students must not only constructsolutions to the particular scenario but must connect the explanations or argumentsthey construct to more general disciplinary frameworks’ (2004, p. 278). To be success-ful, learners should approach inquiry reflectively, engaging with each cognitive taskmindfully. Adopting a reflective stance to complex inquiry situations is prerequisiteto deep understanding (Dewey, 1910) but, at the same time, is not an endeavor that
Scaffolding Explanations 2491
Dow
nloa
ded
by [
Uni
vers
ity o
f C
ypru
s] a
t 08:
12 2
3 M
arch
201
5

students engage with spontaneously in school science (Loh, 2003). Following Loh(2003) we define reflective inquiry as the process during which students temporarilyhalt their investigation to monitor and evaluate the process and product of inquiry inorder to help themselves coordinate present action and to plan next steps. Our positionis not that engaging in inquiry alone is sufficient to help students overcome knowninquiry challenges, but that students need to develop a reflective approach to learning,one that involves systematic examination of inquiry activities (e.g., formulatinghypotheses, interpreting and evaluating data, etc.) as they relate to each other andengages students in planning, monitoring, and evaluating their ongoing investigation.
Scaffolding Students’ Explanation-building
An important question of interest for the design of inquiry-oriented learningenvironments is whether one could scaffold students in overcoming some of the reflec-tive inquiry challenges they encounter when asked to provide evidence-based expla-nations for complex problems and the extent to which support for reflective inquirycan have an impact on this effort. ‘Reflective inquiry scaffolding’ refers to those struc-tures that can support the coupling of students’ inquiry activities and reflection duringstudents’ explanation-building process. The term ‘scaffolding’ is used to describe situ-ations when a more knowledgeable person helps the learner progress within their zoneof proximal development, reaching the point where assistance is no longer requiredto perform the initial task. Scaffolding can take place in real-time or through pre-planned activities that seek to promote emergent autonomy. We adopt an interpreta-tion in which scaffolding can be seen as a system of interacting agents (Tabak, 2004),which can be human (e.g., teacher, peers) or software-based (e.g., pre-designedprompts, cross-reference anchors, compound activity strategies, etc.).
Software-based prompting can be used as a means to help students engage withevidence-based explanation-building (Davis, 2003). Engaging students in collabora-tive processes is another pedagogical strategy for creating opportunities for thearticulation of explanations and the coordination of inquiry work and explanation-building (Scardamalia & Bereiter, 1994), as having students collaborate affords theexternalization of ideas and the joint creation of understanding between themembers of a group.
Learning technologies have the potential to support students’ deep understandingof scientific concepts (Krajcik, 2003). Scaffolded software tools can support learnersin overcoming significant obstacles which arise when trying to make sense ofcomplex data; such obstacles are often related to conceptual, epistemic, andmetacognitive difficulties. We next provide selective examples to illustrate currentunderstanding of how software scaffolding can support explanation-building.
Researchers (Sandoval, 2003; Sandoval & Reiser, 2004) have argued that softwaretools can serve as epistemic tools to develop students’ epistemologies of science.According to Sandoval (2003), there is currently little emphasis on supportingstudents’ understanding of the nature of science as they engage in inquiry-basedlearning; Sandoval suggests that epistemic tools structured around the task of
E. A. Kyza et al.2492
Dow
nloa
ded
by [
Uni
vers
ity o
f C
ypru
s] a
t 08:
12 2
3 M
arch
201
5

constructing causal explanations can contribute to developing students’ epistemolo-gies by providing the disciplinary and epistemic frameworks to situate inquiry andcreate artifacts that support public discussions of complex constructs. Explanation-Constructor is an example of an inquiry-support tool, which provides conceptual andepistemological guidance for engaging in deep science learning (Sandoval, 1998) andwhich has been shown to support the development of students’ domain-specificexplanations (Sandoval, 2003). A main feature of the ExplanationConstructor soft-ware is the presence of explanation guides, which represent a theoretical framing ofthe topic under investigation. Another important aspect is the provision of represen-tational features, such as links, to enable the visual connection of data to arguments.These features are used to support students’ disciplinary discussions of their data andto make important components of scientific explanations explicit to students.
Scaffolds have also been employed to help students regulate the inquiry process(de Jong, 2006), as processes such as planning, monitoring, and evaluating develop-ing explanations have also been proven to be a challenge when dealing with data-richinquiry investigations. Symphony (Quintana, Eng, Carra, Wu, & Soloway, 1999) isa tool that supports students in planning and monitoring their work, by providingrepresentations that conceptually scaffold students and guide them in connectingtheir inquiry steps.
The ‘Web-Based Inquiry Science Environments’ (WISE) online platform (Linn,Clark, & Slotta, 2003) adopts an inquiry map and prompts, which offer detailed,step-by-step guidance to focus student work with online sources. Generic promptsasking students to reflect and monitor their ongoing understanding, embedded inWISE have been shown to improve student learning. The Progress Portfolio tool(Loh et al., 2001) enables teachers to design explanation template pages, facilitatesstudents’ linking of data as evidence, and uses prompts and articulation boxes toencourage reflection. Both the Progress Portfolio and WISE include scaffolds thatfacilitate students’ organization, articulation, and reflection of data.
Our brief review of types of software tools that have been shown to supportstudents’ explanation-building suggests that learning technologies can play a signifi-cant role in structuring students’ explanation-building and providing the supportneeded to overcome known inquiry challenges. In the next section, we provide anoverview of the contribution of collaborative learning and, within this section,discuss another function of software tools: that of supporting collaborative learning.
Collaborative Learning
Many researchers have argued that, under certain conditions, collaborationimproves learning more than individualized learning situations (Bowers, Pharmer, &Salas, 2000; Johnson & Johnson, 1989; Johnson, Johnson, & Stanne, 2000; Slavin,1990). Furthermore, there is a strong argument in favor of reforming instruction, sothat it has the potential to make learning in classrooms more authentic and motiva-tional (NRC, 1996). For example, Blumenfeld et al. (1991) argued that studentsshould be able to participate in learning environments that reflect the complexity of
Scaffolding Explanations 2493
Dow
nloa
ded
by [
Uni
vers
ity o
f C
ypru
s] a
t 08:
12 2
3 M
arch
201
5

the world around them, ones that have the capacity to motivate them and engagethem in higher-order thinking and ones that are predominantly social.
Dillenbourg, Baker, Blaye, and O’Malley (1996) categorized research on indepen-dent variables influencing collaborative learning as belonging to the following broadcategories: group composition, features of the task, context of collaboration, and thecommunication medium. However, Dillenbourg et al. (1996) also claimed that it isalmost impossible to investigate the topic of supporting collaboration in a controlledmanner, since these variables interact with each other and argued that researchshould, instead, focus on the process of collaboration as an entity rather on theconstituent parts. In the work reported in this manuscript we adopt mainly Dillen-bourg’s approach, by focusing on the collaborative outcomes of low-achievingstudents’ collaborative learning process. Since academic achievement grouping is akey variable in our study, in this section we discuss existing literature on the effect oftwo main variables on collaboration: group composition and computer tools as themediating artifacts.
Collaboration and Group Composition
While acknowledging the potential benefits of collaboration, several researchers haveindicated that merely having students work together will not automatically lead toincreased cognitive gains (O’Donnell, 2006). Due to the inherently social nature ofthese interactions, it would be difficult to isolate all the relationships between allvariables that may play a role in deciding the effectiveness of a group effort; however,factors such as individual characteristics, group composition, and the nature of thetask have been identified as important (Bowers et al., 2000). Several studies haveexamined whether the composition of a group influences the outcome of the collab-oration, focusing mostly on cognitive gains. The size of a group has been shown tohave an effect on achievement, with dyads and small groups mostly preferred duringcollaborative learning. For instance, dyads are preferred to avoid social loafing andpromote individual and collective accountability, while small groups are preferredfor the potential to create productive, cognitive conflict. Group size has been investi-gated mostly in non problem-based learning contexts (Fuchs et al., 2000), thusmaking it problematic to draw conclusions when referring to reformed-based learn-ing environments. While Fuchs et al. (2000) reported controversial results from thefew studies which carefully manipulated group size, their study findings withcomplex tasks in mathematics indicated that low-achieving students benefited fromworking in dyads with a high-achieving student. However, students’ interactionswere still judged of low quality. Kutnick and Thomas (1990) compared dyads’ andindividual middle school students’ understanding of scientific concepts while alsomanipulating the achievement level of each dyad member. Their findings indicatethat dyads showed learning gains, as measured by a pre- and post-test, while thescores of students working alone decreased. In a follow-up study, using differentsubjects, Kutnick and Thomas (1990) manipulated the composition of dyads, basedon achievement levels, and presented findings showing that students’ achievement
E. A. Kyza et al.2494
Dow
nloa
ded
by [
Uni
vers
ity o
f C
ypru
s] a
t 08:
12 2
3 M
arch
201
5

increased regardless of whether they were placed in homogenous or heterogeneouspairs. However, Kutnick and Thomas (1990) warn that cognitive gains are contin-gent on task-structuring and the meaningfulness of the task.
Studies have provided evidence that middle-achieving students benefit fromworking in homogenous groups, while low-achieving students benefit from partici-pating in heterogeneous groups, while there is no clear conclusion as to what bene-fits high-achieving students most (Webb, 1982). Bowers et al. (2000) performed ameta-analysis of 13 studies, asking whether group homogeneity resulted to greaterperformance; homogeneity was determined by examining gender, ability level, andpersonality. This meta-analysis indicated no statistically significant results related towhether the group was heterogeneous or homogeneous; no significant results werefound regarding the impact of any of the three attributes on task performance. Theauthors concluded that attending to these attributes alone will not improve perfor-mance. While some researchers have argued for same-gender groups, based on theargument that different collaboration styles exist between females and males, othersconcluded that research on the role of gender in collaborative-learning has beeninconclusive (Harskamp, Ding, & Suhre, 2008; O’Donnell, 2006).
Such conclusions lead us to examine the nature of the interactions, as a decisivefactor in determining a group’s individual and collective learning gains. Other studiesalso support the claim that the nature of the interaction between the members of thegroup may, in fact, play a more central role than group heterogeneity. For instance,Cheng, Lam, and Chan (2008) studied 367 groups of secondary school students,collaborating on a project and found that heterogeneity (groups consisting of high-and low-achieving students), gender, and group size were not important factors instudents’ learning efficacy, which was decided based on the quality of the intra-groupinteractions. Aspects such as the quality of interactions and the structure of the inter-action appear to impact the collaborative process. Giving and receiving explanationshave been shown to improve learning (Chi et al., 1994). One of the reasons for thepositive effect of collaboration is the possibility for extended cognitive elaboration andargumentation: working in groups supports giving and receiving explanations, whichin turn has been linked to gains in achievement tests (Webb, 1982).
In Saleh, Lazonder, and de Jong’s (2007) study, fourth graders in the experimen-tal condition had continuous access to index cards, containing guidelines aboutdesired collaborative behavior; the researchers found that structuring the collabora-tion activity and motivating students by using group rewards increased the partici-pating fourth-grade students’ academic achievement and the collaborative cognitiveelaboration activity. Average-ability students appeared to have benefited the mostwhile, despite the increase in performance, low-ability students’ verbal interactionswere still deemed of low quality. Saleh et al.’s results underline the need for scaffold-ing different-ability students using a variety of instructional strategies. According toBaker and Lund (1997), computer tools can be designed so that they can provideflexible structuring to collaborative learning, so that certain collaborative interactionpatterns can be supported. The area of computer-supported collaborative learning,which is central to the present study, is discussed next.
Scaffolding Explanations 2495
Dow
nloa
ded
by [
Uni
vers
ity o
f C
ypru
s] a
t 08:
12 2
3 M
arch
201
5

Computer-supported Collaborative Learning
It is widely accepted that computer-based tools can mediate human behavior to theextent that they can influence human reasoning processes; several researchers havealso argued in favor of technology’s role in the form of indispensable tools, augment-ing what can normally be done with human cognition alone (Hutchins, 1995;Salomon, Perkins, & Globerson, 1991). The potential of software tools and softwarescaffolding to support interaction and collaboration around problem-solving has alsobeen extensively discussed (Barron, 2000; Clark, Weinberger, Jucks, Spitulnik, &Wallace, 2003; Kreijns, Kirschner, & Jochems, 2003; Manlove, Lazonder, & deJong, 2006; Soller, Martinez, Jermann, & Muehlenbrock, 2005; Stahl, Koschmann,& Suthers, 2006).
Computer-supported collaborative learning is not, however, automaticallyoccurring whenever a tool is introduced (Dillenbourg, 2002; Kreijns et al., 2003).Two main functions of technology in supporting collaborative learning have beenidentified in the literature as necessary for affording productive collaboration: struc-turing and regulating collaboration (Dillenbourg, 2002). Jermann, Soller, andLesgold (2004) presented a classification of technological tools which are specificallydesigned to support the structuring and regulation of collaboration. Specifically,they identified the following categories of tools: graphical argumentation tools,structured dialog interfaces, mirroring tools, metacognitive tools, computer-basedcoaches and facilitators, and knowledge-building tools.
When a good match between learning goals, the affordances of technology, andinstructional support is achieved, computer-supported collaboration can contributeto higher-order cognitive activities, such as argumentation, explanation, criticalthinking, and inquiry of complex problems (Järvelä, Häkkinen, Arvaja, & Leinonen,2004; Linn, 2003). Collaborating with peers also raises additional challenges such asbuilding common ground and coordination. Scaffolded software tools, such asBelvedere (Suthers & Jones, 1997; Suthers & Weiner, 1995), Explanation Construc-tor (Sandoval, 2003), WISE (Linn et al., 2003), Symphony (Quintana et al., 1999),and Progress Portfolio (Loh et al., 2001) are just a few examples of tools which weredesigned specifically to provide technological support for collaborative explanation-building. For instance, Belvedere (Suthers & Jones, 1997; Suthers & Weiner, 1995)is a tool developed to support the collaborative externalization of developingrelationships between hypotheses and data. According to Suthers (2001), represen-tational guidance tools allow the public construction of knowledge, guided by theexisting representational features which can facilitate or constrain understanding.Suthers (2001) hypothesized that when these representations are used for deepunderstanding they become the basis for coordinating collaborative work. In a studyexamining the relationship between representational guidance and ninth-gradestudents’ inquiry skills, Toth, Suthers, and Lesgold (2002) found that thecombination of representational guidance, provided by the Belvedere evidencemapping tools, and explicit reflection structures resulted to significantly betterevidence-based reasoning than the non-scaffolded condition.
E. A. Kyza et al.2496
Dow
nloa
ded
by [
Uni
vers
ity o
f C
ypru
s] a
t 08:
12 2
3 M
arch
201
5

Study Goals
It has been argued that, beyond the analysis of individual cognitive activity, we needalso to analyze the process and products at the level of the collaborating group (Stahlet al., 2006). Hence, this study takes the pair as the unit of analysis. In a qualitativestudy of three pairs of seventh-grade students of high, middle, and low academicachievement, it was found that even though the scaffolding created more opportuni-ties for pairs of students to discuss their interpretations of the data, the quality oftheir conversations appeared to be related to their characterized academic achieve-ment (Kyza, 2004). For example, it was observed that the lower-achievementstudents’ explanations were less extensive and more superficial as compared to thoseof the higher-achievement students. Reports in the literature also indicate thatlower-achieving students need more support than higher-achieving students in orderto successfully engage in the same tasks (B. J. Zimmerman, 2002; C. Zimmerman,2000), even though it has been argued that both high- and low-achieving pairs needto be scaffolded in order to engage in higher-order thinking (Cohen, 1994).
In the work presented in this paper, we investigated whether the provision ofcomputer-based scaffolding could support low-achieving pairs in creating evidence-based explanations. The current study was guided by the following main researchquestions: (1) What was the nature of students’ collaborative explanations of a complexinquiry problem? Specifically, to what extent did the pairs create valid and evidence-based explanations? To what extent did they attend to and provide evidence arguingagainst alternative accounts of their data? (2) Furthermore, what was the relationshipbetween the pairs’ cognitive ability, reflective scaffolding, and the pairs’ explanations?
Methodology
To examine the research questions, we followed student pairs of different academicachievement as they solved a local ecological problem. We begin this section bydescribing the study participants and the enactment context. We then present theextended inquiry problem which students were asked to solve collaboratively, thescaffolding that was designed to support them in their investigations, and we providedetails about the data collection, coding, and analysis process.
Participants
Fifty-three students from two intact sixth-grade classes (n = 26; n = 27) of a subur-ban public school in Cyprus participated in this study. Both classes used the inquiryenvironment of the STOCHASMOS web-based platform (Kyza & Constantinou,2007), which is described in the next sections, to access multi-modal inquiry data.To study the effects of two different types of scaffolding on students’ inquiry, eachclass was assigned to one of two learning situations: the students in one of the classesused the STOCHASMOS inquiry environment and Microsoft PowerPoint (PPT),while the students in the other class used the STOCHASMOS inquiry environment
Scaffolding Explanations 2497
Dow
nloa
ded
by [
Uni
vers
ity o
f C
ypru
s] a
t 08:
12 2
3 M
arch
201
5

and the scaffolded web-based WorkSpace of STOCHASMOS (WorkSpace) to orga-nize their inquiry data and create their written explanations. Both classes weretaught by the same science teacher, who had sixteen years of teaching experienceand a master’s degree in science education. It was the first time the teacher wasteaching an extended software-based inquiry investigation.
Instruction was designed to be comparable across classes. This was achieved byfrequent meetings with the teacher, before and after each class session, to minimizedivergences in approach. To assess the similarity of instruction in the two classes, wecompared the number and duration of sessions for each class, the tasks studentsworked on during each session, and the whole-class teacher interventions. As indi-cated by the videotapes and researcher field notes, the teacher kept the instruction assimilar as possible in terms of duration, emphases, and opportunities for feedback inboth classes. The students had not participated in any other extended inquiry-basedscience projects during the school year and had not been taught any other ecosystemtopics up to that time in the year. Based on their teachers’ reports and the nationalcurriculum framework, it was assumed that all students were briefly taught aboutfood chains back in third grade.
The Inquiry Environment
Students in both classes worked with the Flamingo inquiry investigation, which washosted on STOCHASMOS, a web-based platform for inquiry teaching and learning.The students had access to complex data relating to an authentic environmentalscience problem about the sudden death of a large number of flamingo birds atLarnaca Salt Lake (Hadjichristoforou, 2004). To successfully solve the problem andpresent a persuasive explanation, students were expected to create and communicatea causal explanation detailing how the changing relationships between the abioticand biotic factors in the salt lake ecosystem resulted in the death of the flamingos.The successful solution of the problem required the understanding that the heavyrainfall in 2003 increased the water level more than any other year in the last fewdecades, and this led to a decrease in the lake’s salinity. The fluctuations of salinityregulate the birth and hatching of Artemia Salina, a shrimp on which the flamingofeed. Artemia Salina gives birth to cysts, which will hatch only above a certain salin-ity level. This chain of events led to a reduction in food levels for the flamingos,while at the same time the increased rainfall made the nearby rifle shooting rangearea accessible to the birds which wandered there looking for food. In order forstudents to further understand why the flamingos died of lead poisoning, theyneeded to examine the interdependencies within the ecosystem as well as under-stand the birds’ filter feeding behavior and the impact that external factors had on it.
The Enactment Context
Prior to the Flamingo investigation, the two classes completed a different, three-dayinvestigation hosted on STOCHASMOS to get acquainted with the inquiry
E. A. Kyza et al.2498
Dow
nloa
ded
by [
Uni
vers
ity o
f C
ypru
s] a
t 08:
12 2
3 M
arch
201
5
environment section of the platform. They then engaged with the Flamingo investi-gation, which took place during six weekly 80-minute sessions. Students in bothclasses were asked by the teacher to record their hypotheses, gather data in supportof their ideas, and write a final report addressed to the Fisheries Department explain-ing why the flamingo died. The students worked in pairs1 with the goal of synthesiz-ing and presenting a persuasive explanation. The teacher defined a persuasiveexplanation as one that included a claim, the reasoning behind the claim, and wassubstantiated by data selected from the investigation environment and analyzed. Toincrease explanatory power, the explanation ought to refute alternative explanations,by explaining the reasoning behind the refutation, and providing, wherever possible,evidence supporting this refutation. Such a framework, that includes explicit refer-ences to the components of an explanation, explains the reasoning behind refutingalternative explanations and provides evidence for it, has been discussed in the liter-ature as having the potential to foster the development of scientific reasoning skills(McNeill, Lizotte, Krajcik, & Marx, 2006; Sadler, 2004).
Software Tools used in Each of the Learning Situations
Students in both classes used the STOCHASMOS web-based inquiry environ-ment (Kyza & Constantinou, 2007) to access inquiry data and background infor-mation about the Flamingo investigation. The students in one of the sixth-gradeclasses used the STOCHASMOS inquiry environment and the STOCHASMOSWorkSpace to organize their data and document their explanation, whereas thestudents in the other class used the STOCHASMOS inquiry environment andMicrosoft PowerPoint. STOCHASMOS is a scaffolded software platform whichbuilds upon prior design and research efforts, such as enabling students to easilyquery databases (Tabak, Sandoval, Reiser, & Steinmuller, 2000), providing disci-plinary and epistemic scaffolds (Sandoval & Reiser, 2004), providing tools fororganizing data and articulating thoughts (Loh et al., 1997; Sandoval & Reiser,2004), and facilitating the design of web-based scaffolded inquiry environments(Linn, Davis, & Bell, 2004). The design of STOCHASMOS reflects a combina-tion of features seeking to scaffold collaborative sense-making, process management,and articulation and reflection (Quintana et al., 2004) to support students’ inquiryprocess and explanation-building.
The STOCHASMOS platform was purposefully built to facilitate students’ reflec-tive inquiry and support the researchers’ examination of students’ inquiry practices.As such, one of the main components of STOCHASMOS, the reflective Work-Space, can be de-activated selectively, so that one can create research designs inwhich the use of the tool can be investigated with or without certain components.Following this logic, one of the classes in this study was provided access to theSTOCHASMOS inquiry environment only, whereas the other class was providedaccess to the STOCHASMOS inquiry environment and the STOCHASMOSreflective inquiry WorkSpace. We next provide more details about the commonali-ties and differences between the tools used in each of the classes.
Scaffolding Explanations 2499
Dow
nloa
ded
by [
Uni
vers
ity o
f C
ypru
s] a
t 08:
12 2
3 M
arch
201
5

STOCHASMOS Components Common to both Classes: Inquiry environment
The inquiry environment was one of the core STOCHASMOS components whichwas made available to both classes. Students used the web-based inquiry environ-ment to access multimodal data about the Flamingo investigation. The scaffoldingtools available in the STOCHASMOS inquiry environment are described in Table 1.
To facilitate process management and focus the learners’ attention on the sense-making and synthesis part of their investigation, we implemented a strategydescribed by Quintana et al. (2004) as providing tools to ‘automatically handle non-salient routine tasks.’ According to this strategy, certain micro-tasks such asgraphing data in the process of solving a more complex problem, may distract somenovice learners and increase their cognitive load. Providing tools to automaticallycreate graphs can focus the learners’ cognitive resources on the conceptual issues ofwhich graphs to generate and how to interpret them (Reiser et al., 2001). Followingthese guidelines, we designed a graph generation tool embedded within the inquiryenvironment, to support students’ conceptual engagement with the data. The intentbehind the software-based scaffolding was to support students in engaging inscientific inquiry largely independently and to minimize the need to continually referto the teacher for tasks they could accomplish on their own.
This type of scaffolding was complemented by other teacher and task-relatedscaffolding, as different types of mechanisms need to co-exist and work in synergy,in order to successfully support learning in complex, classroom-based learningsituations (Tabak, 2004). For instance, to facilitate students’ investigation processes,
Table 1. STOCHASMOS inquiry environment tools
Feature Function
Tabbed interface The designer of the learning environment presents the data through a tabbed interface. Tabs segment the information into meaningful chunks. Data are presented in text, images, video, or sound formats. Within each tab data can be arranged separate pages, which are shown as a list menu within each page. Within each page the designer can embed a graph generation tool, which is used to access a database of relevant information. The first tab is titled ‘My Role,’ and includes the driving question of the problem the students are asked to solve.
Glossary This tool is used to allow students to gain easy access to customized definitions of difficult terminology. Words that have a glossary entry are shown in green color and are underlined. Upon mouseover, a pop-up window opens and displays the definition of the word. The glossary is customizable for each learning environment.
Graph tool The Graph tool enables students to run comparisons of numeric data, based on variables which are pre-defined by the designer. It can display data as bar or line charts.
Hints Hints can provide more help or explanation regarding the work that students are expected to do. They are customizable at the designer’s level and are unique for each learning environment.
E. A. Kyza et al.2500
Dow
nloa
ded
by [
Uni
vers
ity o
f C
ypru
s] a
t 08:
12 2
3 M
arch
201
5

the teacher asked all students in both classes to begin their work by writing downthree hypotheses and then select one of them as a starting point. Such teacher-controlled scaffolds were discussed with the teacher ahead of class, in the course ofpreparatory meetings, and were implemented with all participating students.
The STOCHASMOS Reflective WorkSpace Environment
STOCHASMOS includes a separate component, the reflective WorkSpace, wherestudents can document and organize data from the STOCHASMOS inquiry envi-ronment and provide written articulations of their explanations. The WorkSpace canbe activated or de-activated by the designer of the learning environment. For thisstudy, the WorkSpace area was de-activated for the students in the PowerPointclass. The WorkSpace provided students with scaffolding to help them organize theirinquiry-related data and articulate their thinking. Figure 1 illustrates the scaffoldswhich are available in the STOCHASMOS reflective WorkSpace, while Table 2explains their function.Figure 1. The explanation building scaffolding in the STOCHASMOS WorkSpaceAs students work with the investigation in the STOCHASMOS inquiry environ-ment, they can select data to support their hypotheses by using the data cameracapture tool. The system, then, automatically stores images of these data in theWorkSpace area from where students can retrieve, organize, and interpret them. Inthis study, we used three template pages to guide their inquiry learning: the hypoth-esis template page, the data page template, and the explanation template page. Thehypothesis template page was intended to support students in articulating multiplehypotheses about the data. The data page template was designed to groundstudents’ articulations in the data, by providing space for organizing the captureddata, and articulation spaces where students can record their interpretations of the
Figure 1. The explanation building scaffolding in the STOCHASMOS WorkSpace
Scaffolding Explanations 2501
Dow
nloa
ded
by [
Uni
vers
ity o
f C
ypru
s] a
t 08:
12 2
3 M
arch
201
5

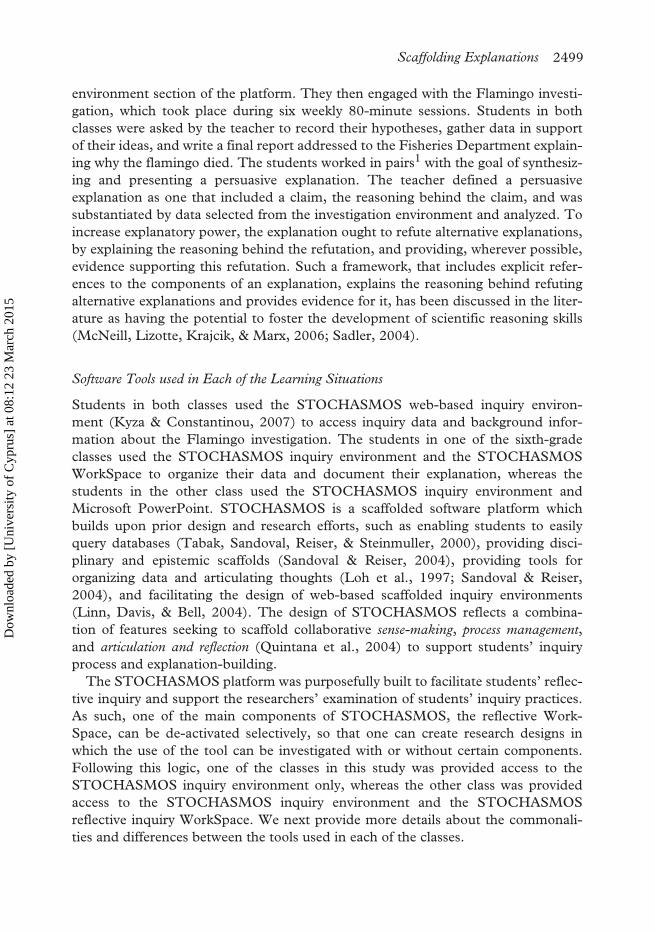
data, thus serving to keep the presentation and interpretation of the data distinct.Finally, the explanation page template (Figure 2) was intended to serve as a synthe-sis space, where the groups could provide an explanation narrative, and linkevidence, already organized in data pages, to support their explanations.Figure 2. The explanation template page of the STOCHASMOS reflective WorkSpace
PowerPoint
The students in the second class used the STOCHASMOS inquiry environment toaccess inquiry data and PowerPoint to help them document their explanation.PowerPoint was selected because it was a tool students often used and because weneeded a recording medium to document students’ explanations so that they couldbe compared to the WorkSpace class. Students were not provided with writtenprompts but were asked by the teacher to use PowerPoint to record hypotheses,organize data from the inquiry environment, and write an evidence-based explana-tion. Figure 3 shows a student-produced PowerPoint slide to indicate how one pair
Table 2. STOCHASMOS reflective WorkSpace scaffolding
WorkSpace feature Function
Data Camera Capture Tool
This tool is present in the inquiry and the WorkSpace environments. Clicking on it, while in the inquiry environment, allows students to specify and capture an area on their screen, which includes data to support their arguments. After selecting the ‘capture image’ button on the Data Camera Capture Tool, the image of the data is automatically stored and can be retrieved from the Image Browser section in the reflective WorkSpace.
Image Browser The Image Browser tool facilitates access to captured data which are represented as thumbnails. Students can browse all the data they have captured and can drag and drop selected data into data boxes, which reside in pages created from templates.
Annotation and Organization Tools
A suite of tools is available to allow students to annotate their data and articulations, stored in pages created from templates. The following annotation and organization tools were available in the current version of the Reflective WorkSpace: Insert Text Box, Insert Image Box, Insert Arrows, Insert Data link Box, and Delete.
Templates Students use templates, accessible from the Reflective WorkSpace, to create their own pages. Templates are pre-designed and are unique to each learning environment. Once the students select a template, they name it according to its role (e.g. environment). Once created, the page then appears in the WorkSpace. Templates can include Articulation spaces, Data organization spaces, and Data Link Boxes.
Articulation Boxes Students use Articulation Boxes to record written interpretations and explanations of the data.
Data Boxes Students use Data Boxes to drag and drop data as evidence from the Image Browser tool.
Data Link box This tool is used to link to other WorkSpace pages which students created. Linking to other pages facilitates evidence-based explanations.
E. A. Kyza et al.2502
Dow
nloa
ded
by [
Uni
vers
ity o
f C
ypru
s] a
t 08:
12 2
3 M
arch
201
5

of students structured their work with PowerPoint; this example is typical of otherpairs’ work as well.Figure 3. An example of a pair’s explanation in PowerPoint (translated from Greek)In summary, the students in the two learning contexts (WorkSpace and Power-Point class) employed different tools to record an evidence-based explanation, asrequested by the teacher. Only the WorkSpace class had access to templates whichincluded static prompts guiding students to interpret and document their ideas. Allother STOCHASMOS inquiry environment scaffolding tools were accessible toboth classes. The template pages and the prompts they included, in effect, providedone of the two classes with a sequence of activities that guided the explanation-building process. This sequence was not available to the other class. Instead, thisclass was given specifications from the onset of the unit, which required that theirexplanations should include hypotheses, data, and the reasoning that connects thedata to the hypotheses.
Data Collection, Coding, and Analysis
We collected a variety of qualitative and quantitative data for each class, includingpre- and post-test responses, data from students’ explanation-building process,researchers’ field notes, and each of the 26 pairs’ work on the computer.
Figure 2. The explanation template page of the STOCHASMOS reflective WorkSpace
Scaffolding Explanations 2503
Dow
nloa
ded
by [
Uni
vers
ity o
f C
ypru
s] a
t 08:
12 2
3 M
arch
201
5

In order to assess the participants’ cognitive ability, we administered two ad-hocmeasures: the Raven’s Standard Progressive Matrices (RSPM), as a general measureof non-verbal intelligence, and a test that measured the students’ understanding ofecosystems (SUE). RSPM is a paper-and-pencil, multiple-choice, and culture-fairtest, widely used as a measure of general learning capacity. RSPM consisted of 60progressive difficulty items and is thought to assess abstract reasoning ability (Raven,Raven, & Court, 1998). Webb and Treagust (2006) have presented an extensivereview arguing in favor of the use of the Raven’s test to assess ‘educative ability orfluid intelligence’ (Webb & Treagust, 2006) in several contexts.
Each student also took an individual pre-test and post-test on SUE, askingstudents to construct a concept map, representing their ecosystem understandingprior to and after the enactment. It has been widely argued in the literature thatconcept maps can provide a graphical representation of people’s knowledge on agiven subject (Cañas et al., 2003; Yin, Vanides, Ruiz-Primo, Ayala, & Shavelson,2005). For the SUE task, students were presented with an example concept mapfrom an unrelated content which dealt with animals on a farm and were asked to usea list of concepts and verbs (or add their own) to create a concept map describingthe salt lake ecosystem. This list included concepts and verbs relevant to the ecosys-tem as well as non-relevant items. This method can be seen as an open-ended taskand has been described as an accurate approach to identifying students’ mentalrepresentations (Ruiz-Primo, Schultz, Li, & Shavelson, 2001). Students’ conceptualunderstanding was scored using an expert criterion map as a reference, representing
Figure 3. An example of a pair’s explanation in PowerPoint (translated from Greek)
E. A. Kyza et al.2504
Dow
nloa
ded
by [
Uni
vers
ity o
f C
ypru
s] a
t 08:
12 2
3 M
arch
201
5

important relationships between biotic and abiotic factors in the ecosystem(Figure 4). Using a scoring system reported in the literature (Yin et al., 2005) foreach student map, we counted the number of appropriate concepts and the numberof appropriate relationships between concepts. Inter-rater reliability was conductedby the first author and a graduate research assistant using 30% of the tests. Reliabil-ity was estimated at 88%, with all disagreements resolved after discussion betweenthe two coders. Following this, the first author coded the remaining tests.Figure 4. The expert criterion map about the flamingo death problem at the Larnaca salt lakeBecause we had two conditions (WorkSpace class, PowerPoint class), we testedfor the initial equivalency of the classes. A two-step cluster analysis was performed toidentify natural groupings of children’s cognitive ability by using RSPM and SUE asgrouping variables. RSPM and SUE were converted into z-scores to avoid unequalweighting of the variables due to their differing scales. The two-step cluster analysisis an exploratory statistical technique which, based on a number of grouping vari-ables, can automatically select the number of clusters so that examinees within agroup are similar. The analysis showed that the participants could be grouped in twoclusters, one of low-learning capacity (M = 1.43) and one of high-learning capacity(M = 4.33). Students in the high-learning capacity cluster had higher scores on boththe RSPM and SUE variables. The first cluster consisted of 29 students (55%), andthe second cluster consisted of 24 students (45%). Each class was comprised of bothclusters. A chi-square test indicated that the students in the two classes wereequivalent with respect to their learning capacity [χ2 (1) = .46, p > .05]. Two t-testanalyses with RSPM and SUE as dependent variables and class as independent
Figure 4. The expert criterion map about the flamingo death problem at the Larnaca salt lake
Scaffolding Explanations 2505
Dow
nloa
ded
by [
Uni
vers
ity o
f C
ypru
s] a
t 08:
12 2
3 M
arch
201
5

variable also demonstrated the equivalency of the classes [t(51) = −.58, p > .05, andt(51) = −.14, p > .05, respectively].
Since we wanted to examine how the learning capacity may have interacted withthe reflective scaffolding condition, the participants in each class were grouped inpairs of three cognitive ability categories, using the results of the cluster analysis:high–high (HH), high–low (HL), and low–low (LL). In grouping the students wealso consulted with their teachers to form groups who had the potential of collabo-rating well. There is ample empirical evidence for a strong association betweencognitive ability, as it is measured through standardized intelligence tests, and scho-lastic performance (Deary, Strand, Smith, & Fernandes, 2007; Jensen, 1998; Rohde& Thompson, 2007). Measures of general cognitive ability are frequently utilized inthe psychological literature as means of measuring school learning capacity. More-over, having in mind that scholastic performance reflects scholastic aptitude, one canexpect the existence of a relationship between scholastic aptitude and individualdifferences in scholastic learning capacity and understanding. Thus, the method-ological manipulation of students with different cognitive ability may allow a deeperunderstanding of the interaction between educational and psychological prerequi-sites of explanation-building. Table 3 shows the number of pairs in each cognitiveability category and scaffolding condition. A Kruskal–Wallis test indicated that thethree groups performed significantly different on RSPM and SUE [χ2 (2) = 45.1,p < .05 and χ2 (2) = 6.22, p < .05], respectively.
The relationships represented in the expert criterion map were also used to decidethe correctness of the mechanism-based rationale put forth in each pair’s explana-tion and the quality of the students’ explanations. Each pair’s final explanation,taken from the PowerPoint files and from the STOCHASMOS WorkSpace, wascoded using a modified version of Toulmin’s (1958) argumentation model. Theexplanation coding scheme is shown in the Appendix. Each explanation was codedfor the main explanation provided about why the flamingo died and for the students’refuted rival explanations. The main explanation was coded for (1) the existence of aclaim (Levels 0–2), (2) the mechanism-based rationale explaining the claim (Levels0–5), and (3) evidence in support of the claim (Levels 0–4). Similarly, each of therefuted rival explanations was coded for (1) the inclusion of refuted claims (Levels0–1), (2) the existence of a rationale as to why the claims were refuted (Levels 0–3),
Table 3. Pairs in each cognitive ability category and scaffolding condition
Number of pairs in each reflective scaffolding condition Mean ranks
Cognitive-ability grouping PowerPoint WorkSpace RSPM SUE
High–High (HH, High) 4 5 44.08 32.97High–Low (HL, Mixed) 5 5 25.88 27.22Low–Low (LL, Low) 4 3 8.0 19.53Total 13 13
E. A. Kyza et al.2506
Dow
nloa
ded
by [
Uni
vers
ity o
f C
ypru
s] a
t 08:
12 2
3 M
arch
201
5

and (3) the citation of evidence to support the refutation of the rival explanations(Levels 0–4).
The reasoning levels in the coding scheme represent a progression in students’understanding of the content. The level attributed to each explanation was used toobtain an explanation score. Scores for each explanation component were added toobtain a total explanation score for each pair. The maximum possible total score foran explanation was 19 points: 11 points for the main explanation score and 8 pointsfor the refuted rival explanations score. All 26 explanations were coded by a gradu-ate research associate. Inter-rater reliability was obtained with the help of a biologyteacher who scored 15% of the total number of explanations. The inter-rateragreement was 79%, and the disagreements were discussed and resolved betweenthe coders. The remaining explanations were coded by the graduate researcher onthe basis of the discussions with the biology teacher.
Results
This study was designed to examine the role of reflective scaffolding in supportingstudents of different cognitive ability grouping in constructing explanations during aninquiry-based investigation. Two questions were asked: (1) What was the nature ofstudents’ collaborative explanations? (2) What was the relationship between the pairs’cognitive ability grouping, reflective scaffolding, and the collaborative final explana-tions? The findings’ section is organized around these questions, after a brief discussionon the effectiveness of the intervention based on the results of the pre- and post-tests.
All pairs, in both classes, constructed explanations describing the reasons theflamingo died. To assess students’ learning gains, and examine the effectiveness ofthe intervention, we compared their pre- and post-tests using the Wilcoxonsigned-rank test. The analysis indicated a statistically significant difference forboth the WorkSpace class, z(26) = −3.60, p < .01 and for the PowerPoint class,z(25) = −2.39, p = .012. These results validate the pedagogical intervention, asone that can support meaningful learning about ecosystems.
The Nature of Students’ Collaborative Explanations
To answer the main research questions, we focused on the analysis of the pairs’collaborative final explanations, as documented in their written artifacts in theSTOCHASMOS WorkSpace and in PowerPoint. All pairs in the WorkSpace classand the pairs in the PowerPoint class provided claims and explained the reasoningbehind their claims. Examining the component of the explanations by using a Mann–Whitney U test, we found differences between the two conditions only on the refutedexplanations students provided [U(13,13) = 39.5, p = .02]. Table 4 presents thedescriptive statistics for the groups’ explanations in the PPT and WorkSpace classes.
As Table 4 shows, the mean total explanation score for the WorkSpace pairs washigher (M = 11.2) than the PowerPoint pairs (M = 8.23). The analysis of the data inTable 4 using the Mann–Whitney U test showed that the mean score for the
Scaffolding Explanations 2507
Dow
nloa
ded
by [
Uni
vers
ity o
f C
ypru
s] a
t 08:
12 2
3 M
arch
201
5

WorkSpace condition was marginally higher than that of the PowerPoint condition[U(13,13) = 48, p = .06]. In the following sections, we present findings on thesimilarities and differences observed across conditions and between cognitive abilitygrouping.
Students’ Use of Evidence in Support of the Main Explanation Claim and Reasoning
One of the main reported inquiry challenges relates to the construction of evidence-based explanations and communicating the evidence on which conclusions arebased. We examined the evidentiary basis of students’ explanations using theexplanation coding scheme (shown in the Appendix). Eleven of the 13 pairs in theWorkSpace class (85%) and 9 of the 13 pairs in the PowerPoint class (69%)provided evidence in support of their claims. This evidence was scored in the rangeof Levels 0–4 (L1 = evidence cited, but all evidence was inappropriate, L2 = someevidence provided, but not sufficient; some of it is contradictory and/or false, L3 =all evidence appropriate but not sufficient, L4 = complete evidence basis provided).None of the pairs in either class received a full evidence score, as no explanationincluded baseline comparisons of ecosystem measurements from years prior to theone of the death of the flamingos.
The evidence provided by 8 of the 13 pairs in the WorkSpace class and 5 of the 13pairs in the PowerPoint class was characterized as appropriate, with no contradictoryor irrelevant information included, thus being labeled Level 3. Table 5 shows thescoring of the evidence provided by the pairs in each class.
As indicated in Table 5, the majority of the WorkSpace pairs (62%) providedevidence scored as belonging to Level 3, indicating an adequate evidence basis tosupport a causal claim, without any inappropriate, contradictory, or irrelevantevidence included. The respective percentage for the PowerPoint class was 38%.This suggests a difference between the two scaffolding conditions. When examiningthe same results according to the pairs’ learning-capacity grouping, we found thatnone of the four homogenous low-cognitive ability pairs in the PowerPoint classprovided evidence, whereas only one of the three homogenous low-cognitive abilitypairs in the WorkSpace class did not provide evidence in support of their claim. Atthe same time, the observation that no pair attained a Level 4 evidence basis suggeststhat all students had difficulties with baseline comparisons.
Table 4. Descriptive statistics for the PPT and WorkSpace classes
Type of scaffolding
Number of groups Explanation component
Mean score
Standard deviation Minimum Maximum
WorkSpace 13 Total explanation 11.2 3.8 6 1613 Main explanation 6.6 1.9 3 913 Refuted rival explanations 4.6 2.2 0 7
PPT 13 Total explanation 8.2 4.2 4 1613 Main explanation 5.5 2.2 2 913 Refuted rival explanations 2.7 2.6 0 7
E. A. Kyza et al.2508
Dow
nloa
ded
by [
Uni
vers
ity o
f C
ypru
s] a
t 08:
12 2
3 M
arch
201
5

Students’ Attention to Refuted Explanations of the Data
In another study, we provided evidence that seventh-grade student pairs, regard-less of academic ability level, may not, on their own, consider alternative explana-tions of their data as important to thoroughly research or communicate (Kyza,2009). In this work, Kyza argued that students’ epistemologies guided theirinquiry processes and shaped their written explanations. Throughout the Flamingoinvestigation, the teacher emphasized that students’ explanations ought to bepersuasive and that each pair should provide evidence for both their main claimand explanations they had rejected on the basis of evidence. The STOCHASMOSWorkSpace explanation template included explicit structures as reminders toconsider alternative explanations they had refuted and the evidence to supporttheir refutations. Hence, in our analysis of the data we focused also on students’refuted explanations, and how the scaffolding provided may have supported thestudents’ written explanations.
Our analyses indicated that 21 of the 26 pairs from both classes provided claimsthey believed were plausible but not correct as rival explanations. The examinationof the rival explanation claims listed indicated that 92% of the WorkSpace pairs (n =12 of 13) listed explanations they had refuted, in contrast to 69% of the PowerPointpairs (n = 9 of 13). One mixed-cognitive ability pair in each class did not list anyrefuted explanations. In the PowerPoint class, there was also one high- and threelow-cognitive ability pairs who did not list alternative explanations.
There were differences between the classes in the number of pairs providingreasoning and citing evidence in support of the refuted explanations of the data.Forty-six percent of the PowerPoint pairs stated their reasoning for refutingalternative explanations of their data and cited evidence in support of listed refutedalternative explanations. On the other hand, the percentage of pairs in the Work-Space class providing reasoning for refuting alternative explanations was much
Table 5. Levels of evidence present in the students’ main explanations
WorkSpace(n = 13 pairs)
PowerPoint(n = 13 pairs)
Level of evidence Number of pairs % Number of pairs %
L4 0 0 0 0L3 8 62 5 38L2 2 15 1 8L1 1 8 2 15L0 2 15 5 38
L4: All evidence is sufficient and appropriate.L3: No contradictory or irrelevant evidence cited. However, the evidence is not sufficient.L2: Some evidence provided, but not sufficient. Some of it is contradictory and/or false.L1: Evidence is provided, but all evidence is inappropriate.L0: No evidence provided.
Scaffolding Explanations 2509
Dow
nloa
ded
by [
Uni
vers
ity o
f C
ypru
s] a
t 08:
12 2
3 M
arch
201
5

higher (92%,12 of the 13 pairs), with 77% of these pairs (n = 10 of the 13 pairs) alsoproviding evidence to support their rejection of the refuted explanations.
Communicating and attempting to discount alternative explanations of the dataare cognitive behaviors that shape students’ practical epistemologies of scientificexplanations (Sandoval, 2005) and which one would like to encourage with middleschool students. Even though many students in our study were able to list alternativeexplanations of their data and provide evidence in support of their ideas, an exami-nation of the quality of their evidence suggests that the students could still improvein this respect. Specifically, none of the pairs attained Level 4 for evidence, whereasonly 7 of the 26 pairs reached Level 3, the level at which all evidence cited isappropriate and at which no contradictory or irrelevant data are cited as evidence.Table 6 shows the results for each class.
The findings presented so far suggest some subtle differences between the twoscaffolding contexts. Next in the paper, we present the results for the secondresearch question, which investigated the relationship between grouping, scaffoldingcontext, and students’ collaborative explanations.
Relationship between Grouping, Scaffolding, and Explanations
To examine the effects of the reflective scaffolding and cognitive ability grouping onthe pairs’ written explanations, we used non-parametric statistical tests due to thesmall sample size. The hypothesis tested, using the Kruskal–Wallis test, was thatreflective scaffolding equally supports all grouping situations (high-, low-, andmixed-cognitive ability) to construct explanations of the ecosystem disturbance. Theanalysis showed that there was no difference between the pairs in the three groupingsituations in the WorkSpace reflective scaffolding class for the total explanationscore, χ2(2) = 2.38, p > .05, the main explanation, χ2(2) = 4.12, p > .05, and for the
Table 6. Scoring of the evidence component of the students’ refuted explanations
STOCHASMOS inquiry environment + WorkSpace
(n = 13 pairs)
STOCHASMOS inquiry environment + PowerPoint
(n = 13 pairs)
Level of evidence Number of pairs Percentage Number of pairs %
L4 0 0 0 0L3 4 31 3 23L2 3 23 1 8L1 3 23 3 23L0 3 23 6 46
L4: All evidence is sufficient and appropriate.L3: No contradictory or irrelevant evidence cited. However, the evidence is not sufficient.L2: Some evidence provided, but not sufficient. Some of it is contradictory and/or false.L1: Evidence is provided, but all evidence is inappropriate.L0: No evidence provided.
E. A. Kyza et al.2510
Dow
nloa
ded
by [
Uni
vers
ity o
f C
ypru
s] a
t 08:
12 2
3 M
arch
201
5

refuted rival explanations, χ2(2) = 2.50, p > .05. The same test with the PowerPointclass data indicated a significant difference between the pairs in each grouping situa-tion (high-, low-, and mixed-ability groups) for the measure of the total explanationscore, χ2(2) = 6.109, p < .05, and the main explanation score, χ2(2) = 8.390, p < .05.There was no difference between the pairs for the refuted rival explanations, χ2(2)= 2.279, p > .05. Subsequently, a series of Mann–Whitney U tests were carried outto provide post-hoc comparisons of the mean ranks. These tests showed that therewas a significant difference for the main explanation of the flamingo death problembetween the pairs in the homogenous high-grouping and homogenous low-groupingclass (U = .00, p < .05), between the pairs in the mixed- and low-cognitive abilitygrouping conditions (U = 1.0, p < .05), but not between the high- and the mixed-cognitive ability pairs (U = 4.0, p > .05). These findings indicate that the high- andmixed-cognitive ability pairs outperformed the low-cognitive ability ones, but thatthere were no significant difference between the high- and the mixed-cognitive abilitypairs. Our analysis shows also that initial cognitive ability, as indicated by the resultsof the RSPM and the conceptual understanding test (SUE), were not an importantfactor in differentiating between pairs of students in the WorkSpace class, whereas itwas an important factor in differentiating between pairs in the PowerPoint class.
Discussion
This study set out to examine the relationship between reflective scaffolding,cognitive ability grouping, and the quality of students’ collaborative explanations ofa complex, ecosystem problem. Students in two sixth-grade classes worked inhomogenous pairs of high-, low-, and mixed-cognitive ability grouping, with eachintact class assigned to one scaffolding context (WorkSpace, PowerPoint). One ofthe main issues emerging from the analysis of the data was the presence of significantdifferences between the different groupings in the PowerPoint context and the corre-sponding absence of such a difference in the WorkSpace context. Based on theseresults, it seems that the reflective scaffolding offered through the WorkSpace envi-ronment might have more positively contributed to the lower-cognitive ability pairs’explanation-building process. We discuss the main results of this study next.
The Relationship between Reflective Scaffolding and Evidence-Based Explanations
When examining the pairs’ explanations, we noticed differences between the twoscaffolding contexts. These differences were obvious especially when examiningwhether students included data in support of their claims; on these occasions, itappears that there was a difference in favor of the WorkSpace groups, who moreoften cited evidence to support their ideas and provided better-quality evidence.These findings indicate that the reflective inquiry scaffolding supported students incommunicating the data on which they based their decisions. The findings alsosuggest that designing larger scaffolding structures (e.g., templates) to make therequirement of providing evidence explicit to students and giving them the tools to
Scaffolding Explanations 2511
Dow
nloa
ded
by [
Uni
vers
ity o
f C
ypru
s] a
t 08:
12 2
3 M
arch
201
5

facilitate the linking of evidence can help address problems with communicatingevidence reported in other studies (Bell & Linn, 2000; Sandoval, 2003). Further-more, beyond the learning benefits that such actions bear for the students, theexplicit communication of evidence can support teachers in more validly assessingstudent understanding and can help create a common ground of communicationbetween the teacher and the students. The latter is crucial, especially in the contextof software-based scaffolding that cannot be dynamically adapted to the individuallearning needs, as is often the case with much educational software.
At the same time, the analysis of the data highlighted an important challenge ourstudents faced: that of providing sufficient evidence. Such findings suggest thatfuture scaffolding efforts should focus on helping students move beyond identifyingdata as evidence and focus their reflective conversations on whether the evidencethey have is adequate in supporting their claims. The latter has implications regard-ing the support provided for engaging students in reflective discourse about the data.Several studies, as well as our own experiences, have suggested that students havedifficulties in evaluating the quality of the available evidence (McNeill & Krajcik,2007; Sandoval & Millwood, 2005).
Comparing Student Grouping and Evidence-Based Explanations within Scaffolding Conditions
The statistical analysis of students’ collaborative explanations in each scaffoldingcontext indicated that there were significant differences between the student pairs inthe PowerPoint context, but not within the student pairs in the WorkSpace context.Specifically, in the PowerPoint context, there were differences between the mainexplanation score of the high-cognitive ability and mixed-cognitive ability pairs andthe explanation scores of the low-cognitive ability pairs, but there were no statisti-cally significant results between the explanation scores of the high-cognitive abilityand mixed-cognitive ability pairs. In contrast, we found no statistically significantdifferences between the pairs in the WorkSpace class. These findings suggest thatthe pairs’ explanations were related to their learning capacity in the case of thePowerPoint class, but that the pairs’ learning capacity did not influence the qualityof their explanations in the WorkSpace class. The findings also suggest that thescaffolding provided, being one of the main differences between the two learningcontexts, might have supported the lower-cognitive ability pairs in performing at asimilar level as higher-cognitive ability pairs.
In considering the above conclusion, it is important to reflect on possible scaffold-ing mechanisms that might have helped the students. In both scaffolding contexts,we attempted to change students’ tasks by explicitly integrating reflective inquiryscaffolding to support students’ explanation-building, as an integral part of students’inquiry activity, either in the WorkSpace or in PowerPoint. Furthermore, weprovided more explicit structures and prompts in the WorkSpace to supportstudents in articulating ideas, reflecting on data gathered and linking data asevidence. The analysis of the data showed that students easily adopted both task
E. A. Kyza et al.2512
Dow
nloa
ded
by [
Uni
vers
ity o
f C
ypru
s] a
t 08:
12 2
3 M
arch
201
5

structures and engaged with identifying and documenting data in either environ-ment. What might be the reason for the differences between the two scaffoldingcontexts? One possible explanation is that the WorkSpace structures withinSTOCHASMOS, such as the availability of prompts and the explicit task structureto identify, document, and explain data as evidence may have made the explanatoryframework explicit to students. One of the main structures of the WorkSpace envi-ronment is prompting, for which there are several discussions in the literatureregarding its effect in promoting understanding (Chi et al., 1994; Davis, 2003;Duschl, Schweingruber, & Shouse, 2007). We argue that this scaffolding would behard to replicate in PowerPoint, whose affordances allow for a different task andorganizational structure, all meant to allow the user to sequentially organize andpresent information. In the same way, we believe that a powerful motivator was thecoupling of the prompts with the presence of the data to be interpreted. The currentstudy provides evidence regarding the hypothesis that the extent to which softwarestructures can scaffold learning may depend also on students’ cognitive ability.
The findings are in line with research arguing that reflective inquiry scaffolding mightbe more useful to students of lower academic ability, even though it appears that itcan also support higher-cognitive ability students (Zimmerman, 1986). It is knownthat low-achievers benefit by providing and receiving explanations in heterogeneousgrouping situations (Swing & Peterson, 1982), while the quality of low-achievingstudents’ interactions – and thus of learning – may be lower in homogeneous groupingsituations. Most of the literature findings on supporting low-achieving students’understanding of higher-order problems point to the need to provide scaffolding byhigher-achieving peers or the teacher (Cohen, 1994). However, Zohar and Dori (2003)argued that it is not uncommon for teachers to underestimate lower-learning capacitystudents and provide low-level support in their interactions with them.
The findings of this study provide evidence for software-based means of support-ing students’ explanation-building, supporting a hypothesis that the reflectiveinquiry scaffolding used in this study assisted lower-cognitive ability students intaking primary responsibility for making sense of ill-structured inquiry investigationdata. In this respect, software-based scaffolding that can support low-achievingstudents’ collaborative engagement with higher-order reasoning tasks can be seen asa significant partner in supporting higher-order thinking alongside the supportoffered by the teacher, peers, and other external factors.
When interpreting the results of any study, one needs also to have in mind the study’slimitations. One of the limitations of the present work is the small sample size, sinceonly 13 pairs were available to study in each classroom. Even though such issues arecommon when researching naturalistic situations, such as the real world of classrooms,collecting comparable data from more classrooms would strengthen the results of thestudy. Furthermore, discourse analyses of students’ videotaped conversations andinteractions can contribute to a better understanding of the role of software scaffoldingin students’ inquiry. Such examination can provide more detail in understanding howparticular features of the software may have contributed to students’ explanation-building and may highlight how such tools mediate student activity in context.
Scaffolding Explanations 2513
Dow
nloa
ded
by [
Uni
vers
ity o
f C
ypru
s] a
t 08:
12 2
3 M
arch
201
5

Conclusions and Implications
This study examined the relationships between students’ cognitive ability groupingand reflective scaffolding in supporting the collaborative explanation-building ofsixth-grade students, from two intact classes, working collaboratively to solve acomplex ecological problem. Both classes used the STOCHASMOS inquiry envi-ronment to access rich inquiry data: the student pairs in one class used theSTOCHASMOS WorkSpace to organize, interpret, and reflect on their data,whereas the students in the other class used PowerPoint, which they freely structuredto help them construct evidence-based explanations. To help us examine the role ofreflective scaffolding, we compared the quality of students’ explanations in eachclass. Findings indicate that the pairs in the WorkSpace class cited evidence to agreater extent and that the WorkSpace scaffolding supported students in addressingalternative explanations of their data, linking their reasoning for refuting these expla-nations to data they had examined. Findings show also that especially the students inthe lower-cognitive ability grouping in the WorkSpace benefited from receiving thescaffolding. Such findings indicate that middle school students can develop evidence-based reasoning with appropriate scaffolding and that all students can start appreci-ating and participate in the epistemic game of constructing scientific explanations(Collins & Ferguson, 1993). The findings indicate also that it is possible throughinstructional design to provide differentiated scaffolding that supports the engage-ment, reflective participation, and active inquiry of all students in complex, scientifictasks. The results of this study can inform practice, design, and research, as they indi-cate opportunities for scaffolding students’ participation in inquiry learning andcontribute to our understanding of the ways in which scaffolding can be effective.
Acknowledgments
The authors would like to thank Georgia Michael for her support during the imple-mentation of the STOCHASMOS project. We also thank Maria Loi, AndreaniBaytelman, Rodothea Hadjilouca, and Myroula Hadjichristoforou for their contri-bution to the study. This work was funded by the Cyprus Research PromotionFoundation (STOCHASMOS, KINHT/0504/03), and a European CommissionFP6 Marie Curie International Re-integration Grant (Reflective Inquiry, 017515).Opinions, findings, and conclusions are those of the authors and do not necessarilyreflect the views of the funding agencies. For more information about theSTOCHASMOS project, please visit http://www.stochasmos.org and http://www.coreflect.org.
Note
1. All students worked in pairs, with one exception in which students worked in a triad, due tothe total number of students in the class. For brevity, we will use the word ‘pairs’ for allstudent groups.
E. A. Kyza et al.2514
Dow
nloa
ded
by [
Uni
vers
ity o
f C
ypru
s] a
t 08:
12 2
3 M
arch
201
5

References
Anderson, R. D. (2002). Reforming science teaching: What research says about inquiry. Journal ofScience Teacher Education, 13(1), 1–12.
Baker, M., & Lund, K. (1997). Promoting reflective interactions in a computer-supported collabo-rative learning environment. Journal of Computer Assisted Learning, 13, 175–193.
Barron, B. (2000). Problem solving in video-based microworlds: Collaborative and individualoutcomes of high achieving sixth grade students. Journal of Educational Psychology, 92,391–398.
Bell, P., & Linn, M. C. (2000). Scientific arguments as learning artifacts: Designing for learningfrom the web with KIE. International Journal of Science Education, 22(8), 797–817.
Blumenfeld, P., Soloway, E., Marx, R. W., Krajcik, J. S., Guzdial, M., & Palincsar, A. (1991).Motivating project-based learning: Sustaining the doing, supporting the learning. EducationalPsychologist, 26, 369–398.
Bowers, C. A., Pharmer, J. A., & Salas, E. (2000). When member homogeneity is needed inwork teams: A meta-analysis. Small Group Research, 31(3), 305–327. doi:10.1177/104649640003100303
Brewer, W. F., Chinn, C. A., & Samarapungavan, A. (2000). Explanation in scientists and chil-dren. In F. C. Keil & R. A. Wilson (Eds.), Explanation and cognition (pp. 279–298).Cambridge, MA: MIT Press.
Cañas, A. J., Coffey, J. W., Carnot, M. J., Feltovich, P., Hoffman, R. R., & Feltovich, J. (2003). Asummary of literature pertaining to the use of concept mapping techniques and technologies foreducation and performance support (Report to The Chief of Naval Education and Training).Pensacola, FL: The Institute for Human and Machine Cognition.
Cheng, R. W.-y., Lam, S. F., & Chan, J. C. Y. (2008). When high achievers and low achieverswork in the same group: The roles of group heterogeneity and processes in project-basedlearning. British Journal of Educational Psychology, 78, 205–221.
Chi, M. T. H., Bassok, M., Lewis, M. W., Reimann, P., & Glaser, R. (1989). Self-explanations:How students study and use examples in learning to solve problems. Cognitive Science, 13,145–182.
Chi, M. T. H., Leeuw, N. d., Chiu, M.-H., & LaVancher, C. (1994). Eliciting self explanationsimproves understanding. Cognitive Science, 18(3), 439–477.
Chinn, C. A., & Malhotra, B. A. (2002). Epistemologically authentic inquiry in schools: A theoret-ical framework for evaluating inquiry tasks. Science Education, 86, 175–218.
Clark, D. J., Weinberger, A., Jucks, R., Spitulnik, M., & Wallace, R. (2003). Designing effectivescience inquiry in text-based computer-supported collaborative learning environments.International Journal of Educational Policy, Research, and Practice, 4(1), 55–82.
Cohen, E. G. (1994). Restructuring the classroom: Conditions for productive small groups.Review of Educational Research, 64(1), 1–35.
Collins, A., & Ferguson, W. (1993). Epistemic forms and epistemic games: Structures andStrategies to guide inquiry. Educational Psychologist, 28(1), 25–42.
Davis, E. A. (2003). Prompting middle school science students for productive reflection: Genericand directed prompts. Journal of the Learning Sciences, 12(1), 91–142.
Deary, I. J., Strand, S., Smith, P., & Fernandes, C. (2007). Intelligence and educational achieve-ment. Intelligence, 35, 13–21.
de Jong, T. (2006). Scaffolds for computer simulation based scientific discovery learning. In J.Elen & R. E. Clark (Eds.), Dealing with complexity in learning environments (pp. 107–128).London: Elsevier.
de Vries, E., Lund, K., & Baker, M. (2002). Computer-mediated epistemic dialogue: Explanationand argumentation as vehicles for understanding scientific notions. Journal of the LearningSciences, 11(1), 63–103.
Dewey, J. (1910). How we think. New York: Heath.
Scaffolding Explanations 2515
Dow
nloa
ded
by [
Uni
vers
ity o
f C
ypru
s] a
t 08:
12 2
3 M
arch
201
5

Dillenbourg, P. (2002). Over-scripting CSCL: The risks of blending collaborative learning withinstructional design. In P. A. Kirschner (Ed.), Three worlds of CSCL: Can we support CSCL?(pp. 61–91). Heerlen: Open University of the Netherlands.
Dillenbourg, P., Baker, M., Blaye, A., & O’Malley, C. (1996). The evolution of research oncollaborative learning. In E. Spada & P. Reiman (Eds.), Learning in humans and machine:Towards an interdisciplinary learning science (pp. 189–211). Oxford: Elsevier.
Donovan, M. S., & Bransford, J. D. (Eds.). (2005). How students learn: Science in the classroom.Washington, DC: National Academies Press.
Duschl, R. A., Schweingruber, H. A., & Shouse, A. W. (Eds.). (2007). Taking science to school:Learning and teaching science in grades K-8. Washington, DC: National Academies Press.
Fuchs, L. S., Fuchs, D., Kazdan, S., Karns, K., Calhoon, M. B., & Hamlett, C. L. (2000). Effectsof workgroup structure and size on student productivity during collaborative work on complextasks. The Elementary School Journal, 100(3), 183–212.
Glassner, A., Weinstock, M., & Neuman, Y. (2005). Pupils’ evaluation and generation ofevidence and explanation in argumentation. British Journal of Educational Psychology, 75,105–118.
Hadjichristoforou, M. (2004). Lead shot at Larnaca salt lake – assessment and restoration activities.Nicosia, Cyprus: Department of Fisheries and Marine Research.
Harskamp, E., Ding, N., & Suhre, C. (2008). Group composition and its effect on female andmale problem-solving in science education. Educational Research, 50(4), 307–318.
Hutchins, E. (1995). Cognition in the wild. Cambridge, MA: MIT Press.Jensen, A. R. (1998). The g factor: The science of mental ability. Westport, CT: Praeger.Jermann, P., Soller, A., & Lesgold, A. (2004). Computer software support for CSCL. In J. W.
Strijbos, P. A. Kirschner, & R. L. Martens (Eds.), What we know about CSCL (pp. 141–166).New York: Kluwer Academic.
Johnson, D. W., & Johnson, R. T. (1989). Cooperation and competition: Theory and research. Edina,MN: Interaction Book.
Johnson, D. W., Johnson, R. T., & Stanne, M. B. (2000). Cooperative learning methods: A meta-analysis. Retrieved December 10, 2009, from http://www.tablelearning.com/uploads/File/EXHIBIT-B.pdf
Järvelä, S., Häkkinen, P., Arvaja, M., & Leinonen, P. (2004). Instructional support in CSCL. InJ. W. Strijbos, P. A. Kirschner, & R. L. Martens (Eds.), What we know about CSCL(pp. 115–139). New York: Kluwer Academic.
Krajcik, J. (2003). The value and challenges of using learning technologies to support students inlearning science. Research in Science education, 32, 411–414.
Krajcik, J., Blumenfeld, P., Marx, R., Bass, K. M., & Fredricks, J. (1998). Inquiry in project-basedscience classrooms: Initial attempts by middle school students. Journal of the Learning Sciences,7(3–4), 313–350.
Kreijns, K., Kirschner, P. A., & Jochems, W. (2003). Identifying the pitfalls for social interactionin computer-supported collaborative learning environments. A review of the research.Computers in Human Behavior, 19(3), 335–353.
Kuhn, D., Amsel, E., & O’Loughlin, M. (1988). The development of scientific thinking skills. SanDiego, CA: Academic Press.
Kutnick, P., & Thomas, M. (1990). Dyadic Pairings for the enhancement of cognitive develop-ment in the school curriculum: Some preliminary results on science tasks. British EducationalResearch Journal, 16(4), 399–406.
Kyza, E. A. (2004). Understanding reflection-in-action: An investigation into middle-school students’reflective inquiry practices in science and the role that software scaffolding can play. (ProQuestDigital Dissertations, AAT 3156603). Evanston, IL: Northwestern University.
Kyza, E. A. (2009). Middle-school students’ reasoning about alternative hypotheses in a scaf-folded, software-based inquiry investigation. Cognition and Instruction, 27(4), 277–311.
E. A. Kyza et al.2516
Dow
nloa
ded
by [
Uni
vers
ity o
f C
ypru
s] a
t 08:
12 2
3 M
arch
201
5

Kyza, E. A., & Constantinou, C. P. (2007). STOCHASMOS: A web-based platform for reflective,inquiry-based teaching and learning [Computer software]. Cyprus: Learning in ScienceGroup. Available from http://www.stochasmos.org/
Linn, M. C. (2003). Technology and science education: Starting points, research programs, andtrends. International Journal of Science Education, 25(6), 727–758.
Linn, M. C., Clark, D., & Slotta, J. D. (2003). WISE design for knowledge integration. ScienceEducation, 87(4), 517–538.
Linn, M. C., Davis, E. A., & Bell, P. (Eds.). (2004). Internet environments for science education.Mahwah, NJ: Lawrence Erlbaum.
Loh, B. (2003). Using articulation and inscription as catalysts for reflection: design principles for reflectiveinquiry (PhD dissertation, Northwestern University, Evanston, IL).
Loh, B., Radinsky, J., Reiser, B. J., Gomez, L., Edelson, D. C., & Russell, E. (1997). Theprogress portfolio: Promoting reflective inquiry in complex investigation environments. InR. Hall, N. Miyake, & N. Enyedy (Eds.), Proceedings of CSCL ’97: Computer support forcollaborative learning, Toronto, Canada, December 10–14 (pp. 169–178). Toronto.
Loh, B., Reiser, B. J., Radinsky, J., Edelson, D. C., Gomez, L. M., & Marshall, S. (2001). Devel-oping reflective inquiry practices: A case study of software, the teacher, and students. In S. K.Crowley, C. Schunn & T. Okada (Eds.), Designing for science: Implications from everyday,classroom, and professional settings (pp. 279–323). Mahwah, NJ: Lawrence Erlbaum.
Manlove, S., Lazonder, A. W., & de Jong, T. (2006). Regulative support for collaborativescientific inquiry learning. Journal of Computer Assisted Learning, 22, 87–98.
McNeill, K. L., & Krajcik, J. (2007). Middle school students’ use of appropriate and inappropriateevidence in writing scientific explanations. In M. Lovett & P. Shah (Eds.), Thinking with data:The proceedings of the 33rd Carnegie Symposium on Cognition. Mahwah, NJ: Lawrence Erlbaum.
McNeill, K. L., Lizotte, D. J., Krajcik, J., & Marx, R. W. (2006). Supporting students’ construc-tion of scientific explanations by fading scaffolds in instructional materials. Journal of theLearning Sciences, 15(2), 153–191.
Mynatt, C. R., Doherty, M. E., & Tweney, R. D. (1977). Confirmation bias in a simulatedresearch environment: an experimental study of scientific inference. In P. N. Johnson-Laird &P. C. Wason (Eds.), Thinking: Readings in cognitive science (pp. 315–325). Cambridge:Cambridge University Press.
NRC (National Research Council). (1996). National science education standards. Washington, DC:National Academy Press.
O’Donnell, A. M. (2006). The role of peers and group learning. In P. Alexander & P. Winne (Eds.),Handbook of educational psychology (2nd ed., pp. 781–802). Mahwah, NJ: Lawrence Erlbaum.
Quintana, C., Eng, J., Carra, A., Wu, H., & Soloway, E. (1999). Symphony: A case study in extendinglearner-centered design through process-space analysis. Proceedings of CHI 99 Conference onHuman Factors in Computing Systems (pp. 473–480). Reading, MA: Addison-Wesley.
Quintana, C., Reiser, B. J., Davis, E. A., Krajcik, J., Fretz, E., Duncan, R. G., … Soloway, E.(2004). A scaffolding design framework for software to support science inquiry. Journal of theLearning Sciences, 13(3), 337–386.
Raven, J., Raven, J. C., & Court, J. H. (1998). Manual for Raven’s progressive matrices andvocabulary scales. San Antonio, TX: Harcourt Assessment.
Reiser, B. J. (2004). Scaffolding complex learning: the mechanisms of structuring and problema-tizing student work. Journal of the Learning Sciences, 13(3), 273–304.
Reiser, B. J., Tabak, I., Sandoval, W. A., Smith, B. K., Steinmuller, F., & Leone, A. J. (2001).BGuILE: Strategic and conceptual scaffolds for scientific inquiry in biology classrooms. In S.M. C. D. Klahr (Ed.), Cognition and instruction: Twenty-five years of progress (pp. 263–305).Mahwah, NJ: Lawrence Erlbaum.
Rogoff, B. (2008). Observing sociocultural activity on three planes: Participatory appropriation,guided participation, and apprenticeship. In K. Hall, P. Murphy, & J. Soler (Eds.), Pedagogyand practice: Culture and identities (pp. 58–74). Los Angeles, CA: Sage.
Scaffolding Explanations 2517
Dow
nloa
ded
by [
Uni
vers
ity o
f C
ypru
s] a
t 08:
12 2
3 M
arch
201
5

Rohde, T. E., & Thompson, L. A. (2007). Predicting academic achievement with cognitive ability.Intelligence, 35, 83–92.
Ruiz-Primo, M. A., Schultz, S. E., Li, M., & Shavelson, R. J. (2001). Comparison of the reliabilityand validity of scores from two concept-mapping techniques. Journal of Research in ScienceTeaching, 38(2), 260–278.
Sadler, T. D. (2004). Informal reasoning regarding socioscientific issues: A critical review ofresearch. Journal of Research in Science Teaching, 41(5), 513–536.
Saleh, M., Lazonder, A. W., & Jong, T. de. (2007). Structuring collaboration in mixed-abilitygroups to promote verbal interaction, learning, and motivation of average-ability students.Contemporary Educational Psychology, 32(3), 314–331.
Salmon, W. C. (1989). Four decades of scientific explanations. Minneapolis, MN: University ofMinnesota Press.
Salomon, G., Perkins, D. N., & Globerson, T. (1991). Partners in cognition: Extending humanintelligence with intelligent technologies. Educational Researcher, 20(3), 2–9.
Sandoval, W. A. (1998). ExplanationConstructor [Computer software]. Evanston, IL: NorthwesternUniversity.
Sandoval, W. A. (2003). Conceptual and epistemic aspects of students’ scientific explanations.Journal of the Learning Sciences, 12(1), 5–51.
Sandoval, W. A. (2005). Understanding students’ practical epistemologies and their influence onlearning through inquiry. Science Education, 89(4), 634–656.
Sandoval, W. A., & Millwood, K. A. (2005). The quality of students’ use of evidence in writtenscientific explanations. Cognition and Instruction, 23(1), 23–55.
Sandoval, W. A., & Reiser, B. J. (2004). Explanation-driven inquiry: Integrating conceptual andepistemic scaffolds for scientific inquiry. Science Education, 88, 345–372.
Scardamalia, M., & Bereiter, C. (1994). Computer support for knowledge-building communities.Journal of the Learning Sciences, 3, 265–283.
Slavin, R. (1990). Cooperative learning: Theory, research and practice. Englewood Cliffs, NJ:Prentice Hall.
Soller, A., Martinez, A., Jermann, P., & Muehlenbrock, M. (2005). From mirroring to guiding: Areview of state of the art technology for supporting collaborative learning. International Journalof Artificial Intelligence in Education, 15, 261–290.
Stahl, G., Koschmann, T., & Suthers, D. D. (2006). Computer-Supported collaborative learning:An historical perspective. In R. K. Sawyer (Ed.), The Cambridge Handbook of the LearningSciences (pp. 409–425). Cambridge: Cambridge University Press.
Suthers, D. D. (2001). Towards a systematic study of representational guidance for collaborativelearning discourse. Journal of Universal Computer Science, 7(3), 254–277.
Suthers, D. D., & Jones, D. (1997). An architecture for intelligent collaborative educational systems.Paper presented at the AI-Ed 97, the 8th World Conference on Artificial Intelligence inEducation, Kobe, Japan.
Suthers, D. D., & Weiner, A. (1995). Groupware for developing critical discussion skills.Paper presented at the CSCL ’95 Computer Supported Cooperative Learning, Bloomington,IN.
Swing, S., & Peterson, P. (1982). The relationship of student ability and small-group interactionto student achievement. American Educational Research Journal, 19, 259–274.
Tabak, I. (2004). Synergy: A complement to emerging patterns of distributed scaffolding. Journalof the Learning Sciences, 13(3), 305–355.
Tabak, I., Sandoval, W. A., Reiser, B. J., & Steinmuller, F. (2000). The Galapagos Finches. In J. J.V. Vaughan (Ed.), Bioquest Library Volume VI. San Diego, CA: Academic Press.
Toth, E. E., Suthers, D. D., & Lesgold, A. M. (2002). ‘Mapping to Know’: The effects of repre-sentational guidance and reflective assessment on scientific inquiry. Science Education, 86(2),264–286.
Toulmin, S. E. (1958). The uses of argument. Cambridge: Cambridge University Press.
E. A. Kyza et al.2518
Dow
nloa
ded
by [
Uni
vers
ity o
f C
ypru
s] a
t 08:
12 2
3 M
arch
201
5

Webb, N. M. (1982). Peer interaction and learning in cooperative small groups. Journal ofEducational Psychology, 74(5), 642–655.
Webb, P., & Treagust, D. F. (2006). Using exploratory talk to enhance problem-solving andreasoning skills in grade-7 science classrooms. Research in science education, 36, 381–401.
White, B., & Frederiksen, J. (1998). Inquiry, modeling and metacognition: Making science acces-sible to all students. Cognition and Instruction, 16(1), 13–117.
Wu, H. K., & Hsieh, C. E. (2006). Developing sixth graders’ inquiry skills to construct explana-tions in inquiry-based learning environments. International Journal of Science Education,28(11), 1289–1313.
Yin, Y., Vanides, J., Ruiz-Primo, M. A., Ayala, C. C., & Shavelson, R. J. (2005). Comparison oftwo concept-mapping techniques: Implications for scoring, interpretation, and use. Journal ofResearch in Science Teaching, 42(2), 166–184.
Zimmerman, B. J. (1986). Becoming a self-regulated learner: which are the key subprocesses?Contemporary Educational Psychology, 11, 307–313.
Zimmerman, B. J. (2002). Becoming a self-regulated learner: An overview. Theory into Practice,41(2), 64–70.
Zimmerman, C. (2000). The development of scientific reasoning skills. Developmental Review, 20,99–149.
Zimmerman, C. (2005). The development of scientific reasoning skills: What psychologistscontribute to an understanding of elementary science learning (Final draft of a report to theNational Research Council Committee on Science Learning Kindergarten through EighthGrade). Washington, DC: National Research Council. Available at http://www7.nationalacad-emies.org/bose/Corinne_Zimmerman_Final_Paper.pdf
Zohar, A., & Dori, Y. J. (2003). Higher order thinking skills and low-achieving students: Are theymutually exclusive? Journal of the Learning Sciences, 12(2), 145–181.
Zuzovsky, R., & Tamir, P. (1999). Growth patterns in students’ ability to supply scientificexplanations: findings from the Third International Mathematics and Science Study in Israel.International Journal of Science Education, 21(10), 1101–1121.
Appendix. Prompting Provided for the WorkSpace and the PowerPoint Class
Prompting which was Similar in both Conditions (Provided by the Teacher)
(1) Create an evidence-based explanation.(2) Write down three hypotheses about what might have led to the death of the
flamingos.(3) Collect evidence from the inquiry environment to investigate your hypotheses.(4) Write an explanation indicating what may have caused the flamingo death and
which hypotheses you refuted.
STOCHASMOS WorkSpace Prompts
Students in the STOCHASMOS WorkSpace condition had three template pagesavailable to them (hypothesis page, data page, and explanation page). Screenshots ofeach of the template pages are provided in the next pages. Students could create anunlimited number of each of the template pages, which they could use to organizeand articulate their explanations. There was no limitation set in terms of how manypages they could create.
Scaffolding Explanations 2519
Dow
nloa
ded
by [
Uni
vers
ity o
f C
ypru
s] a
t 08:
12 2
3 M
arch
201
5

Appendix Figure 1. Hypothesis page template promptsAppendix Figure 2. Data page template promptsAppendix Figure 3. Explanation page template prompts
Figure A1. Hypothesis page template prompts
E. A. Kyza et al.2520
Dow
nloa
ded
by [
Uni
vers
ity o
f C
ypru
s] a
t 08:
12 2
3 M
arch
201
5

Figure A2. Data page template prompts
Scaffolding Explanations 2521
Dow
nloa
ded
by [
Uni
vers
ity o
f C
ypru
s] a
t 08:
12 2
3 M
arch
201
5
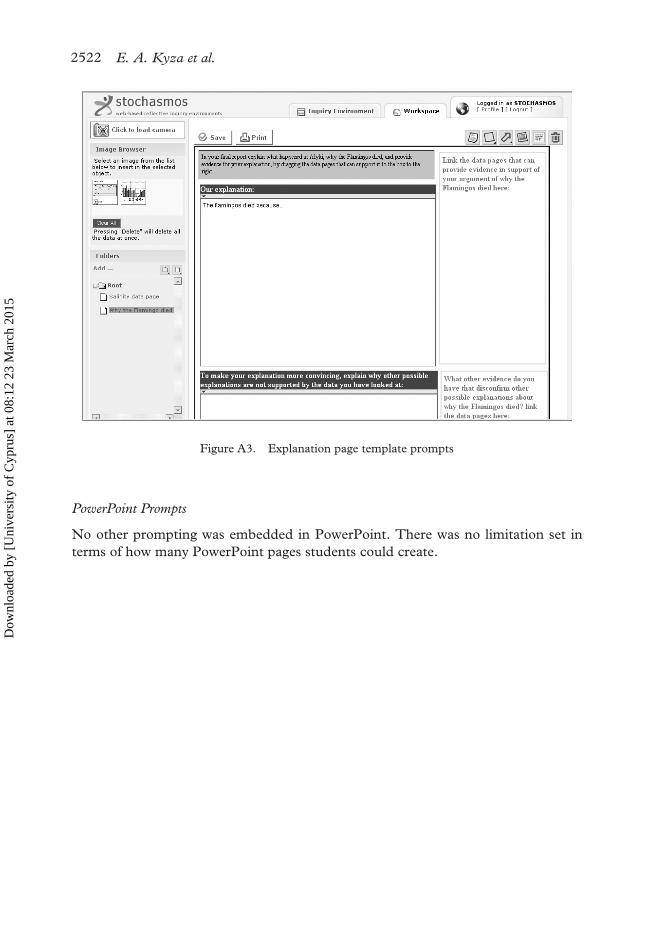
PowerPoint Prompts
No other prompting was embedded in PowerPoint. There was no limitation set interms of how many PowerPoint pages students could create.
Figure A3. Explanation page template prompts
E. A. Kyza et al.2522
Dow
nloa
ded
by [
Uni
vers
ity o
f C
ypru
s] a
t 08:
12 2
3 M
arch
201
5

Tab
le A
1.T
he fl
amin
go e
xpla
nati
on c
odin
g sc
hem
e
Lev
el
01
23
45
Mai
n ex
plan
atio
nC
laim
The
gro
up a
s no
t pr
ovid
ed a
ny
clai
m a
nsw
erin
g th
e pr
oble
m t
hey
wer
e as
ked
to
solv
e.
The
gro
up h
as n
o on
e de
fini
te c
laim
an
d m
ay, f
or
exam
ple,
pre
sent
tw
o cl
aim
s.
The
gro
up h
as
prov
ided
a c
laim
st
atin
g an
ans
wer
to
the
pro
blem
th
ey w
ere
aske
d to
so
lve.
Rea
soni
ngT
he g
roup
has
no
t pr
ovid
ed a
m
echa
nist
ic
acco
unt
of t
he
clai
m t
hey
have
pr
ovid
ed o
r pr
ovid
es a
re
ason
ing
that
is
not
rela
ted
to t
he
clai
m p
ut f
orth
.
The
gro
up h
as
atte
mpt
ed t
o pr
ovid
e re
ason
ing,
bu
t the
sta
tem
ent(
s)
prov
ided
are
mer
ely
obse
rvat
iona
l and
de
scri
bing
fac
ts.
Stu
dent
s m
ay
prov
ide
obse
rvat
ions
or
des
crip
tion
s th
at
do n
ot p
rovi
de a
ca
usal
eco
syst
em
mec
hani
sm o
f ho
w
the
flam
ingo
s di
ed.
Stu
dent
s pr
esen
t a
caus
al m
echa
nism
th
at o
nly
refe
rs t
o th
e ex
ogen
ic o
r en
doge
nic
envi
ronm
enta
l fa
ctor
s th
at
infl
uenc
ed t
he s
alt
lake
eco
syst
em
and
may
hav
e ca
used
som
e fl
amin
gos
to d
ie.
Stu
dent
s pr
ovid
e an
ec
osys
tem
-rel
ated
m
echa
nism
for
how
the
fl
amin
gos
died
, in
whi
ch t
hey
expl
icit
ly m
enti
on
rela
tion
ship
s be
twee
n ex
ogen
ic e
nvir
onm
enta
l and
en
doge
nic
biol
ogic
al f
acto
rs
of t
he e
cosy
stem
as
they
are
re
late
d to
the
fla
min
gos.
H
owev
er, t
he m
echa
nism
is
not
adeq
uate
ly e
xpla
ined
: for
in
stan
ce, t
wo
fact
ors
(bio
tic
or a
biot
ic, e
.g. f
lam
ingo
and
ra
infa
ll) m
ay b
e lin
ked,
but
in
term
edia
te li
nks
may
be
igno
red
or n
ot a
dequ
atel
y ex
plai
ned
(rai
nfal
l, w
ater
he
ight
, bri
ne s
hrim
p, a
nd
flam
ingo
). S
ome
fals
e re
ason
ing
may
als
o ex
ist.
Stu
dent
s pr
ovid
ed a
n ec
osys
tem
-bas
ed
mec
hani
sm, w
here
th
ey d
escr
ibe
the
key
idea
s of
how
the
in
terd
epen
denc
e of
bi
otic
and
abi
otic
fa
ctor
s le
d to
the
de
ath
of s
ome
of t
he
flam
ingo
s. T
he
reas
onin
g ca
nnot
be
give
n fu
ll m
arks
be
caus
e it
may
lack
im
port
ant
com
pari
sons
suc
h as
re
fere
nce
to b
asel
ine
data
fro
m p
revi
ous
and
futu
re y
ears
.
Ful
l mar
ks—
sam
e as
nu
mbe
r 4,
bu
t ex
plan
atio
n re
fers
to
base
line
data
as
wel
l.
Scaffolding Explanations 2523
Dow
nloa
ded
by [
Uni
vers
ity o
f C
ypru
s] a
t 08:
12 2
3 M
arch
201
5

Tab
le A
1.(C
ontin
ued)
Lev
el
01
23
45
Mai
n ex
plan
atio
n
Evi
denc
e ci
ted
(exp
licit
ly
linki
ng t
he
clai
m a
bout
th
e de
ath
of
the
flam
ingo
s w
ith
inve
stig
atio
n da
ta)
The
gro
up h
as
not
prov
ided
any
ev
iden
ce t
o su
ppor
t th
eir
clai
m a
s to
why
th
e fl
amin
gos
die
or m
ay c
ite
as
evid
ence
ba
ckgr
ound
dat
a.
The
gro
up h
as p
rovi
ded
evid
ence
exp
licit
ly
supp
orti
ng t
heir
cla
im,
but a
ll ev
iden
ce li
nked
is
not
appr
opri
ate.
The
gro
up p
rovi
ded
som
e ev
iden
ce, b
ut s
ome
of t
he e
vide
nce
is
cont
radi
ctor
y or
/and
fa
lse.
The
evi
denc
e pr
ovid
ed is
not
suf
fici
ent
to s
uppo
rt t
he c
laim
.
The
gro
up h
as p
rovi
ded
evid
ence
in s
uppo
rt o
f th
eir
clai
m. T
here
is n
o co
ntra
dict
ory
or
irre
leva
nt e
vide
nce
cite
d,
and
the
evid
ence
is a
ll ap
prop
riat
e. T
he g
roup
ha
s lin
ked
thei
r cl
aim
and
th
e ev
iden
ce c
ited
. H
owev
er, t
he e
vide
nce
is
not
suff
icie
nt t
o su
ppor
t th
e cl
aim
sta
ted.
The
gro
up h
as
prov
ided
evi
denc
e in
sup
port
of t
heir
cl
aim
. All
evid
ence
pro
vide
d is
suf
fici
ent
and
appr
opri
ate.
The
gr
oup
has
linke
d th
e ev
iden
ce c
ited
an
d th
eir
clai
m
stat
ed.
Riv
al
expl
anat
ions
Lis
ted
othe
r ex
plan
atio
ns
they
ref
uted
The
gro
up h
as
not
liste
d an
y ri
val e
xpla
nati
ons
they
hav
e re
fute
d.
The
gro
up h
as li
sted
one
or
mor
e ri
val
expl
anat
ions
the
y ha
ve
atte
mpt
ed t
o re
fute
.P
rovi
ded
a re
ason
ing
for
reje
ctin
g ri
val
expl
anat
ions
The
gro
up h
as
not
prov
ided
any
re
ason
s fo
r re
futi
ng t
he r
ival
ex
plan
atio
ns t
hey
liste
d.
The
gro
up h
as e
xpla
ined
th
eir
reas
onin
g as
to w
hy
they
ref
uted
som
e or
all
of th
e ri
val e
xpla
nati
ons.
H
owev
er, t
he r
atio
nale
pr
ovid
ed in
eac
h ca
se is
ir
rele
vant
or
insu
ffici
ently
el
abor
ated
for
all
the
refu
ted
clai
ms.
The
gro
up h
as p
rovi
ded
a ra
tion
ale
as to
why
at l
east
so
me
of t
he r
ival
ex
plan
atio
ns li
sted
wer
e re
fute
d. H
owev
er, t
he
rati
onal
e be
hind
reje
ctin
g so
me
of t
he e
xpla
nati
ons
may
be
mis
sing
or
not
desc
ribe
d ad
equa
tely
.
The
gro
up h
as p
rovi
ded
a va
lid r
atio
nale
for
all
the
riva
l exp
lana
tion
s th
ey
have
ref
uted
.
E. A. Kyza et al.2524
Dow
nloa
ded
by [
Uni
vers
ity o
f C
ypru
s] a
t 08:
12 2
3 M
arch
201
5

Tab
le A
1.(C
ontin
ued)
Lev
el
01
23
45
Mai
n ex
plan
atio
n
Cit
ed
evid
ence
in
supp
ort
of
the
refu
tati
on o
f th
e ri
val
expl
anat
ions
The
gro
up
prov
ided
no
evid
ence
to
supp
ort
thei
r re
futa
tion
of
riva
l ex
plan
atio
ns.
The
gro
up h
as
prov
ided
evi
denc
e to
sup
port
the
re
ason
the
y re
fute
d a
riva
l exp
lana
tion
, bu
t al
l evi
denc
e lin
ked
is n
ot
appr
opri
ate.
The
gro
up p
rovi
ded
evid
ence
for
som
e or
al
l of
the
alte
rnat
ive
expl
anat
ions
they
hav
e re
fute
d. O
ne o
r m
ore
of t
he f
ollo
win
g m
ay
hold
true
: som
e of
this
ev
iden
ce m
ay n
ot b
e re
leva
nt, a
ppro
pria
te,
or s
uffi
cien
t, b
ased
on
the
info
rmat
ion
that
w
as a
vaila
ble.
The
ev
iden
ce m
ay n
ot b
e cl
earl
y co
nnec
ted
to
part
icul
ar c
ount
er-
clai
ms.
The
gro
up h
as p
rovi
ded
rele
vant
evi
denc
e in
su
ppor
t of
the
ir r
efut
ed
expl
anat
ions
. The
re is
no
cont
radi
ctor
y or
irre
leva
nt
evid
ence
cit
ed, a
nd t
he
evid
ence
is a
ll ap
prop
riat
e.
The
gro
up h
as e
xpla
ined
th
e co
nnec
tion
bet
wee
n th
e al
tern
ativ
e ex
plan
atio
ns
and
the
evid
ence
cit
ed.
How
ever
, the
evi
denc
e m
ay
not
be s
uffi
cien
t or
wel
l ju
stif
ied
to s
uppo
rt t
he
clai
m o
r cl
aim
s st
ated
.
The
gro
up h
as
prov
ided
evi
denc
e in
su
ppor
t of
the
ir
refu
tati
on o
f al
tern
ativ
e ex
plan
atio
ns. A
ll ev
iden
ce p
rovi
ded
is
suff
icie
nt a
nd
appr
opri
ate.
The
gr
oup
has
expl
aine
d th
e co
nnec
tion
be
twee
n th
e ev
iden
ce
cite
d an
d th
e re
fute
d cl
aim
.
Scaffolding Explanations 2525
Dow
nloa
ded
by [
Uni
vers
ity o
f C
ypru
s] a
t 08:
12 2
3 M
arch
201
5