Adaptive Real-time Anomaly Detection for Safeguarding ...
167
Linköping Studies in Science and Technology Thesis No. 1231 Adaptive Real-time Anomaly Detection for Safeguarding Critical Networks by Kalle Burbeck Submitted to Linköping Institute of Technology at Linköping University in partial fulfilment of the requirements for the degree of Licentiate of Engineering Department of Computer and Information Science Linköpings universitet SE-581 83 Linköping, Sweden Linköping 2006
-
Upload
khangminh22 -
Category
Documents
-
view
3 -
download
0
Transcript of Adaptive Real-time Anomaly Detection for Safeguarding ...

Linköping Studies in Science and Technology
Thesis No. 1231
Adaptive Real-time Anomaly Detection for Safeguarding Critical Networks
by
Kalle Burbeck
Submitted to Linköping Institute of Technology at Linköping University in partial fulfilment of the requirements for the degree of Licentiate of Engineering
Department of Computer and Information Science Linköpings universitet
SE-581 83 Linköping, Sweden
Linköping 2006


Department of Computer and Information Science Linköpings universitet
SE-581 83 Linköping, Sweden
Adaptive Real-time Anomaly Detection for Safeguarding Critical Networks
by
Kalle Burbeck
February 2006 ISBN 91-85497-23-1
Linköping Studies in Science and Technology Thesis No. 1231 ISSN 0280-7971
LiU-Tek-Lic-2006:12
ABSTRACT
Critical networks require defence in depth incorporating many different security technologies including intrusion detection. One important intrusion detection approach is called anomaly detection where normal (good) behaviour of users of the protected system is modelled, often using machine learning or data mining techniques. During detection new data is matched against the normality model, and deviations are marked as anomalies. Since no knowledge of attacks is needed to train the normality model, anomaly detection may detect previously unknown attacks. In this thesis we present ADWICE (Anomaly Detection With fast Incremental Clustering) and evaluate it in IP networks. ADWICE has the following properties: (i) Adaptation - Rather than making use of extensive periodic retraining sessions on stored off-line data to handle changes, ADWICE is fully incremental making very flexible on-line training of the model possible without destroying what is already learnt. When subsets of the model are not useful anymore, those clusters can be forgotten. (ii) Performance - ADWICE is linear in the number of input data thereby heavily reducing training time compared to alternative clustering algorithms. Training time as well as detection time is further reduced by the use of an integrated search-index. (iii) Scalability - Rather than keeping all data in memory, only compact cluster summaries are used. The linear time complexity also improves scalability of training. We have implemented ADWICE and integrated the algorithm in a software agent. The agent is a part of the Safeguard agent architecture, developed to perform network monitoring, intrusion detection and correlation as well as recovery. We have also applied ADWICE to publicly available network data to compare our approach to related works with similar approaches. The evaluation resulted in a high detection rate at reasonable false positives rate.
This work has been supported by the European project Safeguard IST-2001-32685 and CENIIT (Center for Industrial Information Technology) at Linköping University.


Acknowledgement
First of all I would like to thank Simin Nadjm-Tehrani, my advisor. Without yourguidance and support, this work would not have been possible. I am also gratefulfor all the fun we have had together during the Safeguard project. Too bad I didnot take a picture when we exited the subway in Barcelona. Or when the stormforced us to sleep on the floor at a London airport and we experienced an overloadof a critical communication infrastructure first hand when everybody tried to callhome.
Thanks to all colleges at RTSLAB for discussions and support. Keep thefika going or I will be forced to haunt you with my home made cakes. Specialthanks go to Anne Moe, for your support with administrative problems, travels andorganisation of events. Thanks also to Lillemor Wallgren, Britt-Inger Karlssonand Inger Norén for administrative help. Thanks to TUS for help with technicalissues.
This work was financially supported by the European project SafeguardIST-2001-32685 and CENIIT (Center for Industrial Information Technology) atLinköping University. Taking part in a large international project has sometimesbeen frustrating but most often instructive, challenging and fun. I am glad that Igot the opportunity to take part in Safeguard.
I would like to thank Tomas Lingvall, Thomas Dagonnier, Mikael Semlingand Stefan Burschka and their colleagues at Swisscom for fruitful discussions andtheir many hours of work with the test network. Thanks also to Tomas for helpwith the Preprocessor and data generation.
The Safeguard agent architecture has been developed with the input from allthe research nodes of the project, the cooperation of whom is gratefully acknowl-edged. Special thanks to David Gamez and John Bigham from Queen Mary, Uni-versity of London and Oleg Morajko at AIA in Spain. Thanks to Wes Carter, ourproject coordinator.
Thanks to Daniel Garpe and Robert Jonasson for your work with the agentplatform evaluation. Thanks to Tobias Chyssler for your work with alert correla-tion engines. Also thanks to Tobias and Daniel for your help with implementingthe correlation agent and for your company and many discussions during thosehectic months of implementation phase in the project. Thanks to Sara GarciaAndrés for your first implementation of the simulation for our initial work on sur-vivability modelling. I would like to thank Henrik Larsson and Karin Ring forreading my thesis with fresh eyes.
Doing PhD-studies while being a father of two wonderful small girls is notalways easy. You have to learn to work very focused to get the maximum out of

those hours in your office, so that you also have time to spend with your familyat home. I would like to thank my dear wife and very best friend Malin for allher help and support. Not the least for those weeks when conferences and projectmeetings have taken me far away from home. I love you with all of my heart.
Thanks to Alva and Linnea for being such clever, cute and funny girls. Evenwhen life sometimes is harsh, you often manage to make me smile. Thanks to myparents and Malin’s for your help with the girls and your support. Thanks also toour cuddly black cats Mashlul and Korlash, for lying and purring in my lap whileI was writing those last hard chapters in the thesis.
In context of my family I also would like to give special thanks to my advisorfor her support not only with my licentiate studies, but also for supporting me inmy private situation. Thanks for helping me being home those months with mygirls in the middle of my studies.
In the end I would like to thank all my friends and my family for my years offun in Linköping. I will always remember those years as a very good time of mylife. I dedicate this work to you all.
Kalle Burbeck

CONTENTS ix
Contents
1 Introduction 11.1 Motivation . . . . . . . . . . . . . . . . . . . . . . . . . . . . . . 11.2 Research challenges . . . . . . . . . . . . . . . . . . . . . . . . . 31.3 Contribution . . . . . . . . . . . . . . . . . . . . . . . . . . . . . 51.4 List of publications . . . . . . . . . . . . . . . . . . . . . . . . . 61.5 Thesis outline . . . . . . . . . . . . . . . . . . . . . . . . . . . . 7
2 Background 92.1 Dependability and computer security . . . . . . . . . . . . . . . . 9
2.1.1 Attack types . . . . . . . . . . . . . . . . . . . . . . . . 112.2 Intrusion detection . . . . . . . . . . . . . . . . . . . . . . . . . 12
2.2.1 Components . . . . . . . . . . . . . . . . . . . . . . . . 122.2.2 Taxonomy . . . . . . . . . . . . . . . . . . . . . . . . . 142.2.3 Evaluation metrics . . . . . . . . . . . . . . . . . . . . . 18
2.3 Software agents . . . . . . . . . . . . . . . . . . . . . . . . . . . 212.3.1 Agent platforms . . . . . . . . . . . . . . . . . . . . . . 22
2.4 Data mining and machine learning . . . . . . . . . . . . . . . . . 232.4.1 Classification . . . . . . . . . . . . . . . . . . . . . . . . 242.4.2 Clustering . . . . . . . . . . . . . . . . . . . . . . . . . . 25
3 The Safeguard context 313.1 Critical infrastructures . . . . . . . . . . . . . . . . . . . . . . . 31
3.1.1 Telecommunications vulnerabilities . . . . . . . . . . . . 333.1.2 Electricity vulnerabilities . . . . . . . . . . . . . . . . . . 33
3.2 Safeguard solutions . . . . . . . . . . . . . . . . . . . . . . . . . 343.2.1 Agents for increased dependability . . . . . . . . . . . . . 353.2.2 The Safeguard agent platform . . . . . . . . . . . . . . . 363.2.3 The Safeguard agent architecture . . . . . . . . . . . . . . 39

x CONTENTS
3.3 The Safeguard agents . . . . . . . . . . . . . . . . . . . . . . . . 423.3.1 Wrapper agent . . . . . . . . . . . . . . . . . . . . . . . 423.3.2 Hybrid detector agent . . . . . . . . . . . . . . . . . . . . 433.3.3 Topology agent . . . . . . . . . . . . . . . . . . . . . . . 443.3.4 Correlation agent . . . . . . . . . . . . . . . . . . . . . . 443.3.5 Human-machine interface agent . . . . . . . . . . . . . . 493.3.6 Action agent . . . . . . . . . . . . . . . . . . . . . . . . 523.3.7 Actuator agent . . . . . . . . . . . . . . . . . . . . . . . 533.3.8 Negotiation agent . . . . . . . . . . . . . . . . . . . . . . 53
3.4 Safeguard test beds . . . . . . . . . . . . . . . . . . . . . . . . . 54
4 ADWICE 574.1 Basic concepts . . . . . . . . . . . . . . . . . . . . . . . . . . . 574.2 Training . . . . . . . . . . . . . . . . . . . . . . . . . . . . . . . 58
4.2.1 Using the original BIRCH index . . . . . . . . . . . . . . 604.3 Detection . . . . . . . . . . . . . . . . . . . . . . . . . . . . . . 614.4 Evaluation . . . . . . . . . . . . . . . . . . . . . . . . . . . . . . 61
4.4.1 Determining parameters . . . . . . . . . . . . . . . . . . 634.4.2 Detection rate versus false positives rate . . . . . . . . . . 664.4.3 Attack class results . . . . . . . . . . . . . . . . . . . . . 674.4.4 Aggregation for decreasing alert rate . . . . . . . . . . . . 684.4.5 Safeguard scenarios . . . . . . . . . . . . . . . . . . . . 70
5 ADWICE with grid index 735.1 Problems of the original BIRCH index . . . . . . . . . . . . . . . 73
5.1.1 Influence of index errors . . . . . . . . . . . . . . . . . . 735.2 The grid-index . . . . . . . . . . . . . . . . . . . . . . . . . . . 775.3 Adaptation of the normality model . . . . . . . . . . . . . . . . . 82
5.3.1 Incremental training . . . . . . . . . . . . . . . . . . . . 825.3.2 Forgetting . . . . . . . . . . . . . . . . . . . . . . . . . . 82
5.4 Evaluation . . . . . . . . . . . . . . . . . . . . . . . . . . . . . . 845.4.1 Detection rate versus false positives rate . . . . . . . . . . 845.4.2 Incremental training . . . . . . . . . . . . . . . . . . . . 845.4.3 Forgetting . . . . . . . . . . . . . . . . . . . . . . . . . . 86
6 Clustering hybrid detection agent 876.1 Design . . . . . . . . . . . . . . . . . . . . . . . . . . . . . . . . 88
6.1.1 Preprocessor . . . . . . . . . . . . . . . . . . . . . . . . 896.1.2 DataSource . . . . . . . . . . . . . . . . . . . . . . . . . 92

CONTENTS xi
6.1.3 DataBuffer . . . . . . . . . . . . . . . . . . . . . . . . . 936.1.4 Transformer . . . . . . . . . . . . . . . . . . . . . . . . . 936.1.5 AnomalyDetector . . . . . . . . . . . . . . . . . . . . . . 946.1.6 SignatureDetector . . . . . . . . . . . . . . . . . . . . . 956.1.7 Module . . . . . . . . . . . . . . . . . . . . . . . . . . . 96
6.2 Life cycle . . . . . . . . . . . . . . . . . . . . . . . . . . . . . . 966.2.1 Startup process . . . . . . . . . . . . . . . . . . . . . . . 976.2.2 The main loop . . . . . . . . . . . . . . . . . . . . . . . 976.2.3 Shut down process . . . . . . . . . . . . . . . . . . . . . 98
6.3 Performance and scalability . . . . . . . . . . . . . . . . . . . . . 99
7 Related work 1017.1 Agents for intrusion detection . . . . . . . . . . . . . . . . . . . 1017.2 Learning-based anomaly detection . . . . . . . . . . . . . . . . . 107
7.2.1 Clustering-based anomaly detection . . . . . . . . . . . . 1087.2.2 Other selected techniques . . . . . . . . . . . . . . . . . 1147.2.3 Discussion of key properties . . . . . . . . . . . . . . . . 122
8 Conclusions and future work 1298.1 Future work . . . . . . . . . . . . . . . . . . . . . . . . . . . . . 1318.2 Final words . . . . . . . . . . . . . . . . . . . . . . . . . . . . . 133

xii CONTENTS

LIST OF FIGURES xiii
List of Figures
1.1 Number of hosts on the Internet advertised in domain name servers 2
2.1 Basic intrusion detection concepts . . . . . . . . . . . . . . . . . 132.2 Terminology of IDMEF . . . . . . . . . . . . . . . . . . . . . . . 132.3 Intrusion detection taxonomy . . . . . . . . . . . . . . . . . . . . 152.4 Categorisation of unknown events . . . . . . . . . . . . . . . . . 162.5 Misuse detection versus anomaly detection . . . . . . . . . . . . 172.6 Evaluation metrics . . . . . . . . . . . . . . . . . . . . . . . . . 192.7 ROC-curve example . . . . . . . . . . . . . . . . . . . . . . . . . 212.8 Reference architecture of a FIPA agent platform . . . . . . . . . . 232.9 Clustering . . . . . . . . . . . . . . . . . . . . . . . . . . . . . . 252.10 Pure anomaly detection using clustering . . . . . . . . . . . . . . 272.11 Unsupervised anomaly detection using clustering . . . . . . . . . 282.12 Classification based detection using clustering . . . . . . . . . . . 29
3.1 Electricity cyber infrastructure . . . . . . . . . . . . . . . . . . . 343.2 Safeguard agent platform architecture . . . . . . . . . . . . . . . 383.3 Performance of Safeguard agent platform . . . . . . . . . . . . . 393.4 Scalability of Safeguard agent platform . . . . . . . . . . . . . . 403.5 Conceptual view of Safeguard . . . . . . . . . . . . . . . . . . . 403.6 The Safeguard agent architecture . . . . . . . . . . . . . . . . . . 413.7 Functional overview of wrappers and related agents . . . . . . . . 433.8 Functional overview of correlation agents . . . . . . . . . . . . . 453.9 Design of TACA (Topology Alert Correlation Agent) . . . . . . . 473.10 Timeslot based alert correlation . . . . . . . . . . . . . . . . . . . 483.11 Principle of global monitoring . . . . . . . . . . . . . . . . . . . 493.12 Network overview as presented by the HMI agent. . . . . . . . . . 503.13 Network health monitoring of the HMI agent . . . . . . . . . . . 51

xiv LIST OF FIGURES
3.14 The Safeguard telecom test network . . . . . . . . . . . . . . . . 55
4.1 Models with different M of the same data . . . . . . . . . . . . . 644.2 Example of index error . . . . . . . . . . . . . . . . . . . . . . . 654.3 Detection rate versus false positives . . . . . . . . . . . . . . . . 674.4 The accuracy for attack classes and the normal class . . . . . . . . 684.5 Aggregated alerts for different time windows . . . . . . . . . . . 694.6 Distributed malicious scripts cause alerts . . . . . . . . . . . . . . 71
5.1 Influence of index errors for detection rate 80% . . . . . . . . . . 755.2 Influence of index errors for detection rate 90% . . . . . . . . . . 765.3 Alternative grid schemes . . . . . . . . . . . . . . . . . . . . . . 785.4 Basic notions of the grid . . . . . . . . . . . . . . . . . . . . . . 795.5 Performance of primitive index operations . . . . . . . . . . . . . 795.6 Detection rate versus false positives using ADWICE-grid . . . . . 845.7 Adapting using incremental training . . . . . . . . . . . . . . . . 855.8 Adapting using forgetting . . . . . . . . . . . . . . . . . . . . . . 86
6.1 Data flow of CHDA . . . . . . . . . . . . . . . . . . . . . . . . . 886.2 CHDA design . . . . . . . . . . . . . . . . . . . . . . . . . . . . 896.3 CHDA Preprocessor . . . . . . . . . . . . . . . . . . . . . . . . 916.4 Remote data sources . . . . . . . . . . . . . . . . . . . . . . . . 92
7.1 eBayes TCP model . . . . . . . . . . . . . . . . . . . . . . . . . 1157.2 CDIS antibody life cycle . . . . . . . . . . . . . . . . . . . . . . 118

LIST OF TABLES xv
List of Tables
5.1 Consequences of index errors for anomaly detection . . . . . . . . 74
7.1 Data sources . . . . . . . . . . . . . . . . . . . . . . . . . . . . . 1227.2 Detection methods . . . . . . . . . . . . . . . . . . . . . . . . . 1237.3 Training data . . . . . . . . . . . . . . . . . . . . . . . . . . . . 1237.4 Performance evaluations . . . . . . . . . . . . . . . . . . . . . . 1247.5 Usage frequency . . . . . . . . . . . . . . . . . . . . . . . . . . 1257.6 Use of real world data . . . . . . . . . . . . . . . . . . . . . . . . 127

xvi LIST OF TABLES

INTRODUCTION 1
Chapter 1
Introduction
The number of computers on the Internet is steadily increasing. According to theInternet Systems Consortium Inc. (ISC) the number of advertised hosts on theInternet were approaching 320 000 000 in January 2005 [63]. Figure 1.1 showsthe general trend from 1998 to 2005.
The introduction of technologies such as 3G and pervasive computing makeeven mobile phones and other devices connected to the net. Most organisationsand companies depend heavily on the use of networking for their internal organi-zational processes as well as for providing their services. Important examples aregovernments, banks and E-commerce businesses. Some service sectors, not tra-ditionally dependent on Internet are also foreseen to become more dependent oncommunication networks due to technology development. Examples are powernetworks, health systems and disaster relief management. Of course this impliesthat ordinary users are also increasingly dependent on Internet services. One studyshows that the number of Americans using some form of on-line banking systemhas grown from 14 millions March 2000 to 53 millions as of September 2004 (44percent of all U.S Internet users) [65].
1.1 Motivation
As the number of users and services on the Internet grows, the motivation formisuse grows accordingly. Unfortunately the effort required for compromising acomputer system is decreasing by the use of automated attack tools. A commonset of events following the detection of a vulnerability is as follows.
• A vulnerability is detected.

2 1.1. MOTIVATION
0
50
100
150
200
250
300
350
1998 1999 2000 2001 2002 2003 2004 2005
Year
Nu
mb
er o
f h
ost
s (m
illi
on
s)
Figure 1.1: Number of hosts on the Internet advertised in domain name servers
• A malicious (or just curious) person/organisation obtains information onthe vulnerability
• An attack tool is developed (requiring a considerable amount of technicalinsight)
• The attack tool is released and used by many (requiring little actual knowl-edge)
• The software vendor obtains information on the vulnerability
• A patch for the software is developed by the software vendor
• The patch is released and applied to a subset of systems removing the vul-nerability from those systems.
The order of these events is very significant. The listed order is the mostunfortunate since the attack tool is released before the patch is applied to end usersystems resulting in a potentially very large number of compromised systems.Unfortunately the time from public discovery of a new vulnerability to the releaseof an attack tool is decreasing and is currently in the order of days. This means thatthe time window for developing and applying patches is becoming very short. Oneexample is the Zotob-A worm [47] and its variants. On Tuesday 9th August 2005Microsoft released a patch and less than three days [39] later exploit code waspublicly available on the Internet. In four days (Saturday 13th) worms exploitingthe vulnerability were spreading.

INTRODUCTION 3
Rapid patching is important [76] but not sufficient. For a production systemcontinuous patching may not be viable due to system complexity and diversityas well as compatibility requirements. For important systems, defence in depthis needed incorporating many different security technologies [112]. This may in-clude firewalls at network boundaries and on individual hosts, removal of unusedsoftware and services, virus scanners and so on. To further harden the defence,intrusion detection systems may be applied.
Intrusion detection systems look for traces of computer misuse by examiningdata sources such as program or user behaviour, network traffic or logs. Whentraces of misuse are detected, alerts are produced and manual or automatic re-sponse may be initiated. Specific attacks may not be visible in every type of datasource and diverse approaches may provide complementing information. It there-fore makes sense to use multiple intrusion detection sensors either in isolation orpreferably also combining their output by correlating the alerts.
The main detection scheme of most commercial intrusion detection systems iscalled misuse detection, where known bad behaviours (attacks) are encoded intosignatures. Misuse detection is only able to detect attacks that are well known andfor which signatures have been written.
An alternative approach is anomaly detection where good (normal) behaviourof users or the protected system is modelled, often using machine learning or datamining techniques. During detection new data is matched against the normalitymodel, and deviations are marked as anomalies. Since no knowledge of attacksis needed to train the normality model, anomaly detection may detect previouslyunknown attacks. If an attack tool is published before a patch is applied and beforeattack signatures are developed or installed, the anomaly detection system may bethe only remaining defence. Some attack types, including a subset of denial ofservice and scanning attacks, alter the statistical distribution of system data whenpresent. This implies that anomaly detection may be a general and perhaps themost viable approach to detect such attacks.
1.2 Research challenges
A fundamental problem of intrusion detection research is the limited availabilityof appropriate data to be used for evaluation. Producing intrusion detection datais a labour intensive and complex task involving generation of normal systemdata as well as attacks, and labelling the data to make evaluation possible. If areal network is used, the problem of producing good normal data is reduced, butthen the data may be too sensitive to be released to other researchers publicly.
4 1.2. RESEARCH CHALLENGES
Learning-based methods require data not only for testing and comparison but alsofor training, resulting in even higher data requirements. The data used for trainingneeds to be representative for the network to which the learning-based methodwill be applied, possibly requiring generation of new data for each deployment.
Classification-based methods [40, 83] require training data that contains nor-mal data as well as good representatives of those attacks that should be detected,to be able to separate attacks from normality. Producing a good coverage of thevery large attack space (including unknown attacks) is not practical for any net-work. Also the data needs to be labelled and attacks to be marked. One advantageof clustering-based methods [57,84,90,101] is that they require no labelled train-ing data set containing attacks, significantly reducing the data requirement. Thereexist at least two approaches.
When doing unsupervised anomaly detection [57, 90, 101] a model based onclusters of data is trained using unlabelled data, normal as well as attacks. Ifthe underlying assumption holds (i.e. attacks are sparse in data) attacks may bedetected based on cluster sizes, where small clusters correspond to attack data.Unsupervised anomaly detection is a very attractive idea, but unfortunately theexperiences so far indicate that acceptable accuracy is very hard to obtain. Also,the assumption of unsupervised anomaly detection is not always fulfilled makingthe approach unsuitable for attacks such as denial of service (DoS) and scanning.
In the second approach, which we simply denote (pure) anomaly detection inthis thesis, training data is assumed to consist only of normal data. Munson andWimer [84] used a cluster-based model (Watcher) to protect a real web server,proving anomaly detection based on clustering to be useful in real life. The anom-aly detection algorithm presented here uses pure anomaly detection to reduce thetraining data requirement of classification-based methods and to avoid the attackvolume assumption of unsupervised anomaly detection. By including only normaldata in the detection model the low accuracy of unsupervised anomaly detectioncan be significantly improved.
In a real live network with connection to the Internet, data can never be as-sumed to be free of attacks. Pure anomaly detection also works when some attacksare included in the training data, but those attacks will be considered normal dur-ing detection and therefore not detected. To increase detection coverage, attacksshould be removed from the training data to as large an extent as possible, witha trade-off between coverage and data cleaning effort. Attack data can be filteredaway from training data using updated misuse detectors, or multiple anomaly de-tection models may be combined by voting to reduce costly human effort.
An intrusion detection system in a real-time environment needs to be fast

INTRODUCTION 5
enough to cope with the information flow, to have explicit limits on resource us-age, and adapt to changes in the protected network in real-time. Many proposedclustering techniques require quadratic time for training [69], making real-timeadaptation of a cluster-based model hard. They may also not be scalable, requir-ing all training data to be kept in main memory during training, limiting the sizeof the trained model. We argue that it is important to consider scalability andperformance in parallel to detection quality when evaluating algorithms for intru-sion detection. Most work on applications of data mining to intrusion detectionconsiders those issues to a very limited degree or not at all.
One fundamental problem of anomaly detection in general is the false posi-tives rate. In most realistic settings normality is hard to capture and even worse,is changing over time. This implies that in addition to facilitate modelling thenormality of a very complex system, an anomaly detection scheme needs to adaptover time.
1.3 Contribution
Many different anomaly detection schemes have been evaluated by other authors,but not all aspects of anomaly detection is getting the attention it deserves. Twosuch aspects are adaptability and performance. The primary contribution of thisthesis is the design and implementation of the ADWICE (Anomaly DetectionWith fast Incremental Clustering) algorithm with the following properties:
• Adaptation - Rather than making use of extensive periodical retraining ses-sions on stored off-line data to handle changes, ADWICE is fully incre-mental making very flexible on-line training of the model possible withoutdestroying what is already learnt. When subsets of the model are not usefulanymore, those clusters can be forgotten.
• Performance - ADWICE is linear in the number of input data thereby heav-ily reducing training time compared to alternative clustering algorithms.Training time as well as detection time is further reduced by the use of anintegrated search-index.
• Scalability - Rather than keeping all data in memory, only compact clustersummaries are used. The linear time complexity also improves scalabilityof training.
When performing anomaly detection and improving performance by using asearch-index, detection accuracy can be influenced by the index. In this thesis we

6 1.4. LIST OF PUBLICATIONS
discuss how, and to what extent, index errors influence anomaly detection results.The application of ADWICE anomaly detection has been demonstrated in a
test network setup at a telecom company (Swisscom), and its performance foundto be satisfactory in the tested scenarios.
1.4 List of publications
The work that has resulted in this thesis has been presented in the following pub-lications:
• K. Burbeck and S. Nadjm-Tehrani, ADWICE: Anomaly Detection withReal-time Incremental Clustering, in Proceedings of 7th InternationalConference in Information Security and Cryptology (ICISC 2004), LectureNotes in Computer Science, Volume 3506, pages 407–424. Springer, 2004.
• K. Burbeck and S. Nadjm-Tehrani, Adaptive Real-Time Anomaly De-tection with Improved Index and Ability to Forget, in Proceedings ofthe 25th IEEE International Conference on Distributed Computing Sys-tems Workshops, Workshop on Security in Distributed Computing Systems,pages 195–202. IEEE Computer Society, 2005.
• K. Burbeck, D. Garpe, and S. Nadjm-Tehrani, Scale-up and PerformanceStudies of Three Agent Platforms, in Proceedings of International Perfor-mance, Communication and Computing Conference, Middleware Perfor-mance workshop, pages 857–863. IEEE Computer Society, 2004.
• T. Chyssler, S. Nadjm-Tehrani, S. Burschka, and K. Burbeck, Alarm Re-duction and Correlation in Defence of IP Networks, in Proceedings ofthe 13th International Workshops on Enabling Technologies: Infrastruc-tures for Collaborative Enterprises (WETICE 2004), pages 229–234. IEEEComputer Society, 2004.
• D. Gamez, S. Nadjm-Tehrani, J. Bigham, C. Balducelli, T. Chyssler, andK. Burbeck, Safeguarding critical infrastructures, chapter 18 in the bookDependable Computing Systems: Paradigms, Performance Issues and Ap-plications edited by H. B. Diab and A. Y. Zomaya. John Wiley & Sons,2005.
The following paper was peripheral to the work in the thesis, written in col-laboration with a masters project.
INTRODUCTION 7
• K. Burbeck, S. G. Andres, S. Nadjm-Tehrani, M. Semling, and T. Dagonnier,Time as a Metric for Defence in Survivable Networks, in Proceedings ofthe Work in Progress session of 24th IEEE Real-Time Systems Symposium(RTSS 2003), 2003.
1.5 Thesis outline
The thesis is divided into 8 chapters, as follows:
• Chapter 2 presents basic terminology. It introduces many concepts relatedto intrusion detection, such as components of intrusion detection systems,different types of detection schemes and metrics used for evaluation. Thechapter also introduces the notion of software agent and a number of basicdata mining concepts.
• Chapter 3 presents the context in which ADWICE was developed. TheSafeguard project as well as the Safeguard agent architecture is introduced.A short overview of different types of Safeguard agents is given. The Safe-guard agent platform is presented and communication performance is com-pared with other platforms.
• Chapter 4 presents the first implementation of ADWICE using the originalsearch index. Training and detection are described and evaluated.
• Chapter 5 presents ADWICE augmented with the grid index. The workingsof the new index are described and evaluated. The notion of forgetting isintroduced and adaptation of the ADWICE model described and evaluated.
• Chapter 6 presents the implementation of ADWICE as part of a Safeguardagent. The requirements and design of the agent are described together withpractical problems, such as remote data access.
• Chapter 7 presents related published work. Alternative approaches to anom-aly detection and are summarised and compared to ADWICE. In addition,a number of agent systems are discussed in the context of the Safeguardarchitecture.
• Chapter 8 concludes the thesis and indicates possible future directions ofcontinued research.

8 1.5. THESIS OUTLINE

BACKGROUND 9
Chapter 2
Background
In this chapter we explain the basic notions related to the work in this thesis. Sec-tions familiar to the reader may be skimmed. Note however, that other authorsmay provide slightly different definitions due to the lack of consensus in securityand intrusion detection terminology. In most cases this will not prevent under-standing of the rest of this work.
2.1 Dependability and computer security
Since we use computer based systems in our every day life and for many criticalapplications, it is important that we can trust those systems to carry out theirservices in a dependable way. No complex system is perfect and we can notcompletely control the environment of a system. In other words, there will beinternal faults (e.g. bugs) and external faults (e.g. attacks, accidents). Faults maylead to an error, a situation where the system state is no longer correct. Errors maycause failures. A failure is the event that occurs when the delivered service of asystem, deviates from the correct service. Since we want the system to performsatisfactorily even in presence of faults there is a need for methods that toleratefaults or detect and recover from faults before they cause failures.
Dependability is “the ability (of a system) to deliver service that can be jus-tifiably trusted” [8]. An alternative definition provided by Avizienis et al. [8] is“the ability of a system to avoid service failures that are more frequent or severethan is acceptable”. Dependability is an integrated concept that encompasses thefollowing attributes [8]:
• Availability - readiness for correct service.

10 2.1. DEPENDABILITY AND COMPUTER SECURITY
• Reliability - continuity of correct service.
• Safety - absence of catastrophic consequences on the users and the environ-ment.
• Integrity - absence of improper system alternations.
• Confidentiality1 - absence of unauthorised disclosure of information.
• Maintainability - ability to undergo modifications and repairs.
Survivability is a concept very close to dependability and will be used inter-changeably in this work. Ellison et al defines survivability as “the capability of asystem to fulfil its mission in a timely manner, in presence of attacks, failures andaccidents´´. [41] An alternative definition of survivability by Shirey [103] is “theability of a system to remain in operation or existence despite adverse conditions,including both natural occurrences, accidental actions and attacks on the system”.
Computer security is often considered the composite of the attributes confi-dentiality, availability and integrity (CIA) [53]. There are also a number of usefulsecondary criteria related to security [8]:
• Accountability - availability and integrity of the identity of the person whoperformed an operation.
• Authenticity - integrity of a message content and origin, and possibly someother information such as the time of emission.
• nonrepudiability - availability and integrity of the identity of the sender ofa message or of the receiver.
When a user accesses a computer system, personal and sensitive informationmay be logged which raises privacy issues. This is true for intrusion detectionsystems [77] in particular, where data collection is necessary to detect intrusions.Below we define the important notion of privacy.
• Privacy - confidentiality of personal information.
A security policy is a set of rules and practices that specify or regulate how asystem or organization provides security services to protect sensitive and critical
1In the context of dependability, confidentiality has not received as much attention as otherattributes [8].

BACKGROUND 11
system resources [103]. An attack is an attempt to violate the security policy ofa system. Depending on the location where the attack is initiated it is denotedexternal or internal. Bace [11] defines an intrusion to be “intentional violationof the security policy of a system”. This implies that the notion of attack, butnot intrusion, encompass failed as well as successful attempts. However, in thearea of intrusion detection the notions of attack and intrusion are sometimes usedinterchangeably [12]. In this thesis we will use the term attack, and explicitly stateif the attack was successful or not if relevant.
2.1.1 Attack types
There are various types of attacks, and many taxonomies [109] of attacks havebeen proposed. We adopt the classification used by the DARPA/Lincoln Labsevaluation [75]. This classification does not cover all possible attack types but isenough for our purposes.
• Scanning attacks are commonly performed by human attackers or maliciouscode such as worms to gain information of network topology, what trafficfirewalls will let through, open ports on individual hosts and software typesand versions. A scanning attack is often the first step to gain enough infor-mation to continue the real attack.
• System penetration attacks involves obtaining unauthorised access to a sys-tem or network and possibly use this access to break the system (attackagainst availability), obtain secret information (attack against confidential-ity) or altering sensitive data (attack against integrity). Some common sys-tem penetration attacks are:
– Remote to Local (R2L) when the attacker obtains unauthorised localuser access remotely on the network.
– User to root (U2R) that involves a normal user obtaining unauthorisedroot access. For external attackers, gaining normal user access (e.g.R2L attack) is often a first step towards root access.
• Denial of Service (DoS) is when the attacker attacks the availability of asystem, either by exploiting flaws to make software crash, or by floodingthe target system with enough traffic so that normal service is no longerpossible. When multiple hosts, possibly tens of thousands, are involved ina DoS attack, it is called Distributed Denial of Service (DDoS). DoS and
12 2.2. INTRUSION DETECTION
certainly DDoS may be very hard to defend against, unless countered closeto the source (e.g. by the Internet Service Provider).
2.2 Intrusion detection
Amoroso [1] defines intrusion detection as “the process of identifying and re-sponding to malicious activity targeted at computing and networking resources”.
The use of the word process emphasises the involvement of technology, peo-ple and tools and the complex interaction between those entities. Identificationmay be done before, during or after the malicious activity proceeds. Responsemay be initiated by tools, people, or both. If the malicious activity is detectedon an early stage, the activity may be prevented and the consequences avoided.If the activity is detected after it has completed, at least the amount of damagemay be estimated and the need for future preventive actions analysed. Includingcomputing and networking resources in the definition restricts the discussion toprotection of such systems, even though the general principles may also apply inother settings, e.g. physical protection.
Note that failure potential is very high in the case of system security. A systemmay be very reliable and have a very small risk of failing due to non-maliciousfaults. However, when malicious intent is present, the attacker will make sure thatthe very rare failure condition is established [1].
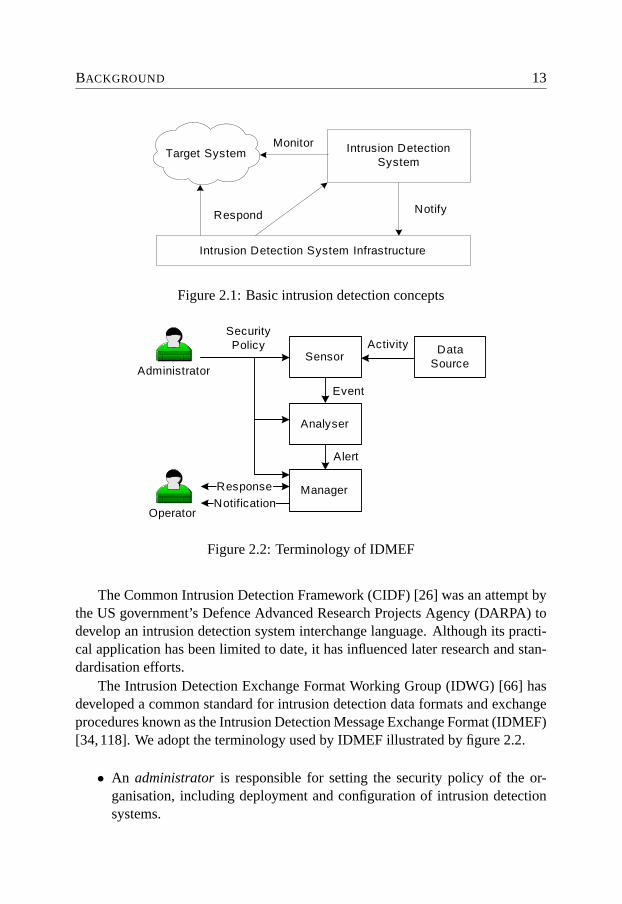
A very simple illustration [1] of the intrusion detection concept is presented infigure 2.1. The attacker aims at breaking the security of a target system which ismonitored by an intrusion detection system. When the intrusion detection systemdetects malicious activity the intrusion detection infrastructure is notified. Theinfrastructure may include additional software systems that collect, store, share,and use intrusion-related system information. Most often it also includes peopleand organisations. The infrastructure may then choose to respond to the intrusion.Response is a very complicated process, that needs to take into consideration alarge number of technical and non-technical issues [1].
2.2.1 Components
Different types of intrusion detection systems have different strengths and weak-nesses. It may therefore be useful to deploy multiple detection systems, to in-crease protection of the target system. Furthermore, intrusions often involve mul-tiple organisations, people and systems increasing the need for a common infor-mation format for intrusion detection [118].
BACKGROUND 13
Target System Intrusion Detection System
Monitor
Intrusion Detection System Infrastructure
Respond Notify
Figure 2.1: Basic intrusion detection concepts
Data Source
Sensor
Analyser
Manager
Administrator
Operator
Response
Notification
SecurityPolicy Activity
Event
Alert
Figure 2.2: Terminology of IDMEF
The Common Intrusion Detection Framework (CIDF) [26] was an attempt bythe US government’s Defence Advanced Research Projects Agency (DARPA) todevelop an intrusion detection system interchange language. Although its practi-cal application has been limited to date, it has influenced later research and stan-dardisation efforts.
The Intrusion Detection Exchange Format Working Group (IDWG) [66] hasdeveloped a common standard for intrusion detection data formats and exchangeprocedures known as the Intrusion Detection Message Exchange Format (IDMEF)[34, 118]. We adopt the terminology used by IDMEF illustrated by figure 2.2.
• An administrator is responsible for setting the security policy of the or-ganisation, including deployment and configuration of intrusion detectionsystems.

14 2.2. INTRUSION DETECTION
• A data source is an access point in the target system where data is collected.
• A sensor collects data from data sources, detects events and forwards thoseto an analyser.
• An analyser processes the events and possibly produces alerts according tothe security policy. The alerts may be formatted according to the IDMEFformat.
• A manager handles the various components of the intrusion detection sys-tem. This may include configuration, data consolidation and notificationsof the operator when certain alerts have occurred.
• An operator is the primary user of the manager and responsible for initiat-ing responses to notifications and alerts.
Notice that in many implementations a sensor and analyser may be part of thesame component. Furthermore, often there will be multiple sensors and analyserspossibly accessing different data sources.
2.2.2 Taxonomy
Unfortunately there is still no consensus on the terminology when it comes toclassification of various types of intrusion detection systems. Debar et al. [36]have however provided one of the most cited intrusion detection taxonomies upto date. We here adopt the revised version [35] [37] with some further exten-sions. The added notion of modelling method is inspired by the use of the notionsself-learning and programmed in the taxonomy by Axelsson [10]. The order ofcategories has been updated according to Arvidson and Carlbark [5]. Figure 2.3presents the resulting taxonomy. In the following sections we explain the taxon-omy.
Audit Source Location
An intrusion detection system may collect data from many different audit sources.Often raw data is processed and specific features extracted, suitable for furtheranalysis. The kinds of attacks that may be detected depend on the data source aswell as the selection of features. Many audit sources contain significant quantitiesof noise. Sometimes audit sources are used because they are already present in thetarget system, rather than because they are very suitable for intrusion detection.

BACKGROUND 15
IntrusionDetectionSystem
Audit source location
Detection method
Behaviour on detection
Usage frequency
Detection paradigm
Modeling method
Network-based
Host-based
Application -based
Alerts -based
Knowledge -based
Behaviour -based
Passive detection
Active detection
Periodic analysis
Continuous monitoring
State-based
Transition -based
Programming -based
Learning -based
Figure 2.3: Intrusion detection taxonomy

16 2.2. INTRUSION DETECTION
ModelUnknown events
Attack event
Normal event
Figure 2.4: Categorisation of unknown events
Most computers are connected to local networks and/or the Internet and manyapplications are communication intensive. Whenever the attacker does not havephysical access to the target system, she will need to access the system remotelyusing the network. This implies that attacks may be detected by analysing networktraffic, denoted network-based intrusion detection. Raw network traffic (packets)may be captured by listening passively on all network traffic using a network cardconfigured into promiscuous mode.
Modern operating systems offer different capabilities to collect logs of systemand resource usage that may be analysed by a host-based intrusion detection sys-tem. Host-based data sources are the only way of gathering information of useractivity on individual machines. A common source of host-based information isC2 security audits in UNIX corresponding to detailed information on the systemcalls of user processes.
An alternative to host-based detection is application-based intrusion detec-tion. Application logs may provide more accurate and relevant information thanlow-level operating system data.
When intrusion detection systems are applied on a larger scale with manydeployed systems, the resulting alerts may in turn be processed by alert-basedintrusion detection systems. By correlating alerts relating to the same event de-tection accuracy can be improved by the combined information from multipledetectors. Furthermore, the total number of alerts that needs to be analysed maybe decreased if alerts relating to the same event are grouped together.
Detection method
To successfully detect attacks, the intrusion detection system needs to be able todifferentiate attacks from normal data using an internal model of attacks and/ornormal data. Figure 2.4 illustrates how a model categorises unknown events intoattacks or normal data. Naturally the model may be more or less specific, pos-sibly being able to categorise subtypes of attacks and normal data, e.g. correctlyseparating a Blaster worm attack from a port scan.
BACKGROUND 17
Model
Model
Legend:
Normality
Attacks
Misuse detection
Anomaly detection
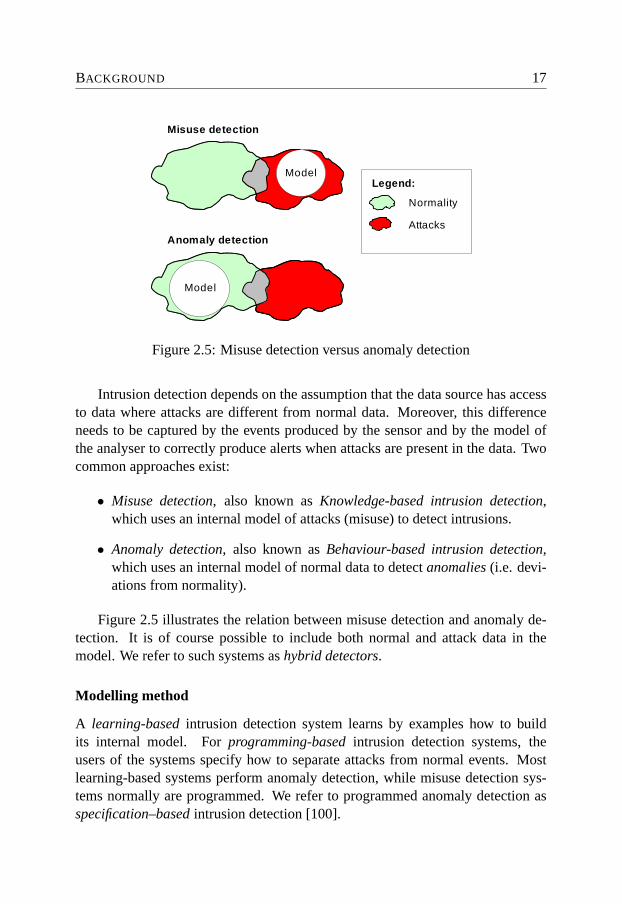
Figure 2.5: Misuse detection versus anomaly detection
Intrusion detection depends on the assumption that the data source has accessto data where attacks are different from normal data. Moreover, this differenceneeds to be captured by the events produced by the sensor and by the model ofthe analyser to correctly produce alerts when attacks are present in the data. Twocommon approaches exist:
• Misuse detection, also known as Knowledge-based intrusion detection,which uses an internal model of attacks (misuse) to detect intrusions.
• Anomaly detection, also known as Behaviour-based intrusion detection,which uses an internal model of normal data to detect anomalies (i.e. devi-ations from normality).
Figure 2.5 illustrates the relation between misuse detection and anomaly de-tection. It is of course possible to include both normal and attack data in themodel. We refer to such systems as hybrid detectors.
Modelling method
A learning-based intrusion detection system learns by examples how to buildits internal model. For programming-based intrusion detection systems, theusers of the systems specify how to separate attacks from normal events. Mostlearning-based systems perform anomaly detection, while misuse detection sys-tems normally are programmed. We refer to programmed anomaly detection asspecification–based intrusion detection [100].
18 2.2. INTRUSION DETECTION
Behaviour on detection
Passive intrusion detection generates alerts but does not actively apply counter-measures to thwart an attack upon detection. Active intrusion detection systemson the other hand are able to initiate countermeasures. Countermeasures mayinclude cutting network connections that carry attacks, blocking traffic or recon-figuring equipment and software such as firewalls or routers. Active intrusiondetection requires good detection accuracy, or else false alerts could cause thecountermeasures to decrease the availability of the system.
Usage frequency
Intrusion detection may perform analysis periodically or continuously. Intru-sion detection systems performing continuous monitoring acquire information ofevents immediately after they occur and process those events in real-time. We willrefer to such analysis as real-time intrusion detection. Periodic analysis impliesan additional time delay until the attack is detected but requires fewer resourcessuch as processing power.
Detection paradigm
State-based systems detect intrusions by analysing system states. Examples ofthis could be a file integrity checker (e.g. Tripwire [64]) using checksums to con-firm that no files have been changed and that files therefore are in their normalstate. An alternative approach is to detect transitions from a normal state to a fail-ure state, for example detecting the actual attack by using signatures (e.g. Snort2).
2.2.3 Evaluation metrics
Intrusion detection systems are often evaluated on data containing attacks as wellas normal traffic. The data may be simulated or collected from real networks.
A number of commonly used metrics exist, and are described below.
• A true positive (TP) is a real attack correctly categorised as an attack by theintrusion detection system.
• A false positive (FP) is a false alert, meaning that the intrusion detectionsystem erroneously raised an alert for normal data.
2Snort is an open source network intrusion prevention system, capable of performing real-timetraffic analysis and packet logging on IP networks. [105]

BACKGROUND 19
ActualIntrusions
DetectedIntrusions
FPFN
TN
TP
Figure 2.6: Evaluation metrics
• A true negative (TN) is normal data that correctly does not generate an alertfrom the intrusion detection system.
• A false negative (FN) is a missed attack, meaning that the attack was erro-neously categorised as normal by the intrusion detection system.
Figure 2.6 shows the relation between true and false positives, and true andfalse negatives.
Relative metrics are often more useful for comparison and a number of derivedmetrics are therefore normally used for evaluation:
• Detection rate (DR) is the fraction of all attacks that are actually detected.
Detection rate =TP
TP + FN(2.1)
• False positives rate (FPR) is the fraction of all normal data that produces(false) alerts.
False positive rate =FP
FP + TN(2.2)
• Overall accuracy is the fraction of all data that is correctly categorised.
Overall accuracy =TP + TN
TP + FN + FP + TN(2.3)
Often a combination of detection rate and false positives rate is presentedwhen evaluating an intrusion detection system. Accuracy or Detection rate in

20 2.2. INTRUSION DETECTION
isolation would be a useless metric. The straightforward method for producing100 % detection rate would be to generate one alert for every encountered data.The intrusion detection system then detects all attacks, but of course the real at-tacks would be hidden in a huge number of false alerts.
Real computer or network data from normal usage is expected to contain onlya small fraction of attack data. This means that a low false positive rate is criti-cal. Assume that an intrusion detection system located inside a firewall processes1 000 000 network packets each day and only 10 of those data are real attacks.Further assume that the false positive rate of the intrusion detection system is 1 %and the detection rate 90 %. During one day 10 009 alerts would be produced,10 000 false positive and 9 true positive. It would take a significant amount ofmanual effort to find those 9 true alerts. This illustrates the difficulty of intrusiondetection [9].
There is a well known trade-off between false positives rate and detection rate.Increasing the detection rate usually means also increasing the false positives rate.Flexible intrusion detection systems provide the opportunity for the user to adaptthis trade-off (e.g. using a threshold) to obtain higher detection rate or lower falsepositives rate (not both) depending on the present need. Producing a diagramwith detection rate on the Y-axis and false positives rate on the X-axis, knownas a ROC-curve, is an illustrative way of presenting this trade-off. Figure 2.7presents an example ROC curve. The form of the curve is typical for intrusiondetection systems, where increasing false positives rates give diminishing returnsin increasing detection rates.
When performing intrusion detection, not only accuracy is important, but alsotime. Detection latency measures the time from the attack to detection. For somedetection schemes there may be a trade-off between detection latency and detec-tion accuracy. Detection of a port scan may aggregate network packets over aspecific time window. If this time window is large, this may increase detection la-tency. If the time window is small, stealthy (slow) port scans may not be detectedbecause very little anomalous traffic is visible inside the time-window.
For use in practice, storing and processing efficiency is important. Memoryusage measures how much memory the intrusion detection system requires for aspecific model size. Throughput measures the amount of data analysed each timeunit. To be effective for real-time detection, the trough-put needs to be higher thanthe input data-rate.
A sometimes neglected but important part of evaluation is usability. Variousaspects of usability are ease of training and adaptability of learning-based systems,ease of deployment, configuration, and tuning as well as user support such as good

BACKGROUND 21
00,10,20,30,40,50,60,70,80,9
1
0 0,01 0,02 0,03 0,04 0,05 0,06
False positives rate
Det
ectio
n ra
te
Figure 2.7: ROC-curve example
interfaces and management tools. A low false positives rate increases the usabilityof the intrusion detection system, since less effort is required to sort through thefalse alerts.
2.3 Software agents
According to Russell and Norvig [95], an agent is “anything that can be viewedas perceiving its environment through sensors and acting upon the environmentthrough effectors”. Human agents use eyes and other organs as sensors, and hands,mouth and other body parts as effectors. Software agents exist only as encoded bitstrings inside computers. Even though they interact directly only with the digitalworld, through their hardware they may also influence the real world (e.g. robots).But what makes software agents different from other program components? Com-paring agents to objects, two important differences in general are:
• Autonomy - The object has state and so does the agent but the agent alsoincorporates the ability to initiate actions as what could be explained ashaving behaviours.
• Independence - In addition to having behaviours the agent is also commu-nicating by passing messages. When using objects the communication isaccomplished through method invocation with references. This means that
22 2.3. SOFTWARE AGENTS
the control lies with the invoker, which is totally opposite the agent casewhere control lies with the receiver. The receiving agent decides whetherto respond to a message or not.
Many computer-based systems of today are by necessity distributed. Datamay be collected in one place, analysis of the data in a second, while the operatorof the system is located at a third. For intrusion detection systems, analysingdata from multiple hosts and even multiple networks, this is certainly true. Toreduce complexity in the overall systems, traditional design principles suggestthat each component should be realised as a reasonably independent subsystemimplementing related functionality, communicating with related subsystems whennecessary. In other words, the system should possess strong cohesion and loosecoupling [19]. If subsystems are implemented as software agents, the completesystem is denoted a multi agent system [119]. The autonomy and independence ofagents map very well to the basic design principles of strong cohesion and loosecoupling.
If a computer system is built using a set of agents, it makes sense to collectcrosscutting functionality of agents into a middleware supporting the agent, ratherthan implementing this functionality as part of each agent. We call such agentmiddleware agent platforms.
2.3.1 Agent platforms
Agents need to communicate if they are to contribute to the purpose of the overallmulti-agent system. They also need some other basic services like directory ser-vices to locate other agents and life-cycle management to be able to start and stopexecution in a controlled way. Agent platforms are simply the basic middlewareused by software agents.
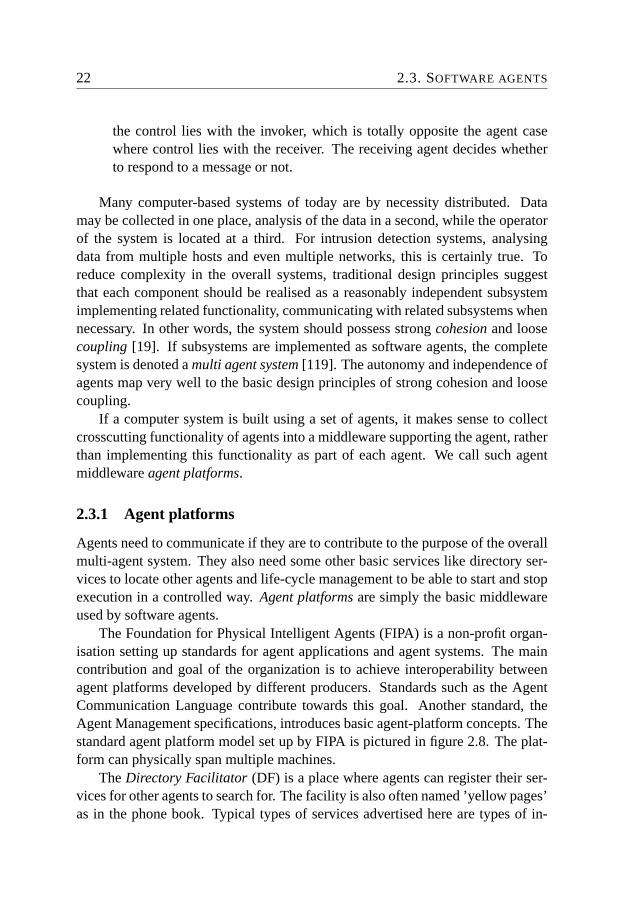
The Foundation for Physical Intelligent Agents (FIPA) is a non-profit organ-isation setting up standards for agent applications and agent systems. The maincontribution and goal of the organization is to achieve interoperability betweenagent platforms developed by different producers. Standards such as the AgentCommunication Language contribute towards this goal. Another standard, theAgent Management specifications, introduces basic agent-platform concepts. Thestandard agent platform model set up by FIPA is pictured in figure 2.8. The plat-form can physically span multiple machines.
The Directory Facilitator (DF) is a place where agents can register their ser-vices for other agents to search for. The facility is also often named ’yellow pages’as in the phone book. Typical types of services advertised here are types of in-

BACKGROUND 23
Message Transport System
Agent ManagementSystem (AMS)
DirectoryFacilitator (DF)
AgentsAgents
Figure 2.8: Reference architecture of a FIPA agent platform
teraction protocols supported and the language used for conversations as well asarbitrary user defined services. There is no restriction on the number of instanti-ated DFs on a platform.
The Agent Management System (AMS) is responsible for agent activities suchas agent creation, life cycle and deletion as well as providing and keeping uniqueagent addresses. The analogy with the phone book’s ’white pages’ comes as nosurprise. There can only be one logical AMS on an agent-platform even if itphysically spans over multiple machines. We denote the platform part with AMSthe main container.
The Message Transport System, also known as the Agent CommunicationChannel is where the control of message passing lies. The message exchangingparties could be agents living on the same platform but also on different platforms.
Many agent platform implementations are available on the Internet and it is nocoincidence that many are implemented in Java. The platform independence andeasy to use threads as well as dynamic loading of classes, make Java a suitablechoice of language for many agent applications.
2.4 Data mining and machine learning
Data mining concerns “extracting or mining knowledge from large amounts ofdata” [69]. Data mining applies many basic learning techniques from the area of“Machine learning” [82]. A large number of different data mining and machineleaning techniques have been applied to the area of intrusion detection. Herewe describe two important types of data mining approaches, classification andclustering, and how they have been used for intrusion detection.
24 2.4. DATA MINING AND MACHINE LEARNING
The data source of an intrusion detection system provides some traces of sys-tem activity (see section 2.2.1). Not all system activity is relevant for intrusiondetection and if the analyser was presented with unfiltered system activity, theintrusion detection task would be unnecessary hard. Therefore a number of mea-sures or data features needs to be selected to represent system activity such thatthose features can be used to detect attacks. This initial data filtering is part ofpre-processing in the domain of data mining. Pre-processing may in general in-clude [69]:
• Cleaning - Data cleaning is the process of filling in missing values, smooth-ing noisy data, identifying or removing outliers and resolving inconsisten-cies.
• Integration and transformation - If data come from various sources, theirformat may be inconsistent and need to be harmonised. For some classi-fication algorithms, numeric data need to be normalised, i.e. scaled to aspecific range.
• Data deduction - Huge data sets may require a long time to analyse. Byremoving irrelevant attributes, aggregation, compression or generalisationof data reduction is possible.
In this thesis, we will denote the pre-processed data feature vector. Eachdimension of the feature vector corresponds to a measure derived from systemactivity.
2.4.1 Classification
A classification algorithm is designed to learn (to approximate the behaviour of)a function which maps a feature vector into one of several classes by looking atseveral input-output examples of the function [82]. The resulting approximationof the function is denoted classifier. We call the function that is learnt, the targetfunction and the resulting range of the function the target concept. The targetfunction could in principle be specified manually for simple examples, but forlarge domains this will often be practically impossible.
There are many different approaches to classification, e.g. Artificial neuralnetworks, decision trees, genetic algorithms, Bayesian learning, case based rea-soning, fuzzy sets and so on. For description of various algorithms the reader isreferred to text books on data mining [69] and machine learning [82].
BACKGROUND 25
Data item
Cluster
Legend :
Figure 2.9: Clustering
An intrusion detection system, regardless if it is programming-based withrules or learning-based, can be considered a classifier. The classification prob-lem of intrusion detection is to decide if data is normal or are symptoms of anattack. This implies that the straightforward target function of a classifier used forintrusion detection would have attacks classes and the notion of being normal asthe target concept. The downside of this is of course that all training examplesneed to be labelled, involving a human expert.
An alternative approach is to use one attribute of the feature vector itself astarget concept. One approach that has been evaluated is to learn to discriminatebetween different applications or network services during normal usage of thecomputer system. During detection, unknown data will be presented to the clas-sifier and mapped into the target concept of valid network services. The proposedclassification will be compared to the true service visible in the data. If the pro-posed classification does not match the true service of data, this tells us that thedata is not similar to the training data of that service. If the training data corre-sponds to normal usage of the computer system this is certainly suspicious andmay possibly imply that the data is part of an attack.
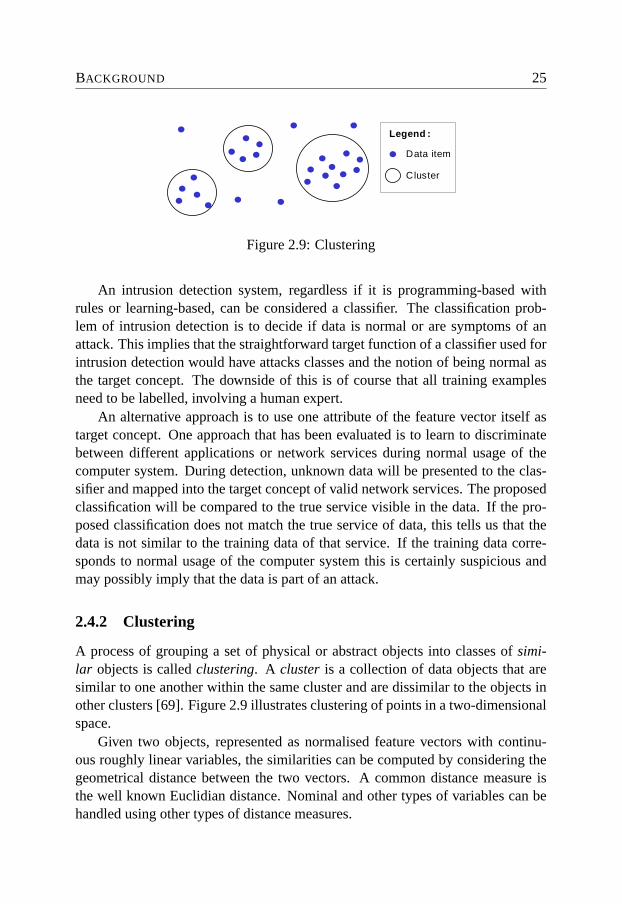
2.4.2 Clustering
A process of grouping a set of physical or abstract objects into classes of simi-lar objects is called clustering. A cluster is a collection of data objects that aresimilar to one another within the same cluster and are dissimilar to the objects inother clusters [69]. Figure 2.9 illustrates clustering of points in a two-dimensionalspace.
Given two objects, represented as normalised feature vectors with continu-ous roughly linear variables, the similarities can be computed by considering thegeometrical distance between the two vectors. A common distance measure isthe well known Euclidian distance. Nominal and other types of variables can behandled using other types of distance measures.

26 2.4. DATA MINING AND MACHINE LEARNING
In general, major clustering algorithms can be classified into the categoriesdescribed below [69].
• Partitioning methods classify data into k groups, where each group or clus-ter contains at least one object and each object belongs to exactly one clus-ter. An initial partitioning into k clusters is created, after which iterativerelocation is applied. The idea is to step by step improve the clusters bymaximizing intra–cluster similarity, while minimizing inter–cluster simi-larity.
One classical example is the K-means [69] clustering algorithms which rep-resent each cluster by its mean, or centroid. The initial partitioning is cre-ated by randomly selecting k objects to represent the cluster means. Allother objects are then assigned to the most similar cluster after which allcluster means are recomputed. This process iterates until a criterion func-tion, such as the squared error criterion, converges.
• Hierarchical methods create a hierarchical decomposition of the given dataobjects. Cure [58] and Chameleon [71] are example of hierarchical meth-ods. BIRCH [122] uses hierarchical clustering in its first phase, after whichiterative relocation is applied to clusters rather than individual objects insubsequent phases. Two hierarchical approaches exist:
– The agglomerative approach starts with each object forming a sepa-rate cluster. It successively merges similar clusters together until allclusters are merged into one at the top-most level of the hierarchy.
– The divisive approach starts with all objects in the same cluster. Ineach successive iteration, a cluster is split up into smaller clusters untilevery object is in a single cluster or until a termination criterion isfulfilled.
• The general idea of density-based methods is to grow clusters as long as thedensity, the number of objects, in the neighbourhood of the cluster exceedsome threshold. Contrast this to partitioning methods which are based ondistance measures. DBSCAN [43] is an example of a density-based clus-tering method.
• Grid-based clustering methods quantise the object space into a finite num-ber of cells that form a grid structure. Performing all clustering operationson the grid structure improves processing time. STING [116] is a typicalexample of a grid-based method.
BACKGROUND 27
Normal data
Normality cluster
Legend:
Unknown data
ab
c
Figure 2.10: Pure anomaly detection using clustering
• Model-based clustering hypothesises a model for each cluster and finds thebest fit of the data to that model. One approach is conceptual clustering,which given a set of unlabelled objects produces a classification of thoseobjects. The classifications are often represented by probabilities, one ex-ample is the COBWEB [45] method. Another approach uses neural net-works [82]. Self organizing maps (SOMs) [72] assume that there is sometopology or ordering among the input objects and the SOMs try to take onthis structure in space. SOMs have been used for intrusion detection andcan also be used to visualise high-dimensional data.
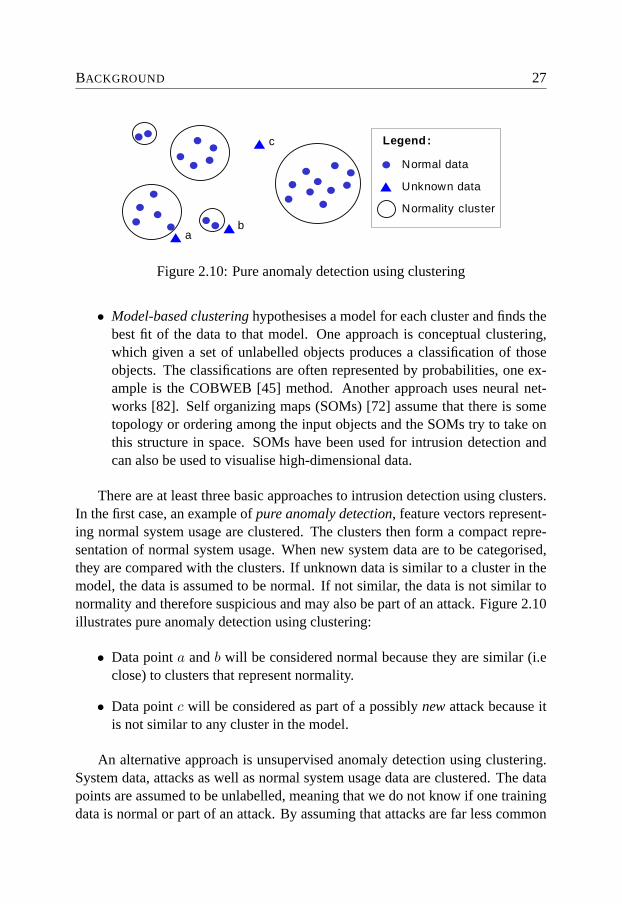
There are at least three basic approaches to intrusion detection using clusters.In the first case, an example of pure anomaly detection, feature vectors represent-ing normal system usage are clustered. The clusters then form a compact repre-sentation of normal system usage. When new system data are to be categorised,they are compared with the clusters. If unknown data is similar to a cluster in themodel, the data is assumed to be normal. If not similar, the data is not similar tonormality and therefore suspicious and may also be part of an attack. Figure 2.10illustrates pure anomaly detection using clustering:
• Data point a and b will be considered normal because they are similar (i.eclose) to clusters that represent normality.
• Data point c will be considered as part of a possibly new attack because itis not similar to any cluster in the model.
An alternative approach is unsupervised anomaly detection using clustering.System data, attacks as well as normal system usage data are clustered. The datapoints are assumed to be unlabelled, meaning that we do not know if one trainingdata is normal or part of an attack. By assuming that attacks are far less common

28 2.4. DATA MINING AND MACHINE LEARNING
ab
cNormal data
Normality cluster
Legend:
Attack data
Attack cluster
Unknown data
Figure 2.11: Unsupervised anomaly detection using clustering
than normal data, detection can be based on cluster size. Small clusters representuncommon data which are suspicious and possibly part of an attack. Figure 2.11illustrates unsupervised anomaly detection using clustering:
• Data point a will be considered normal because it is similar to a large clus-ter, which is assumed to be normal.
• Data point b will be considered as part of a possible attack because it is mostsimilar to a small cluster, assumed to be part of an attack.
• Data point c can be considered as part of a new attack because it is notsimilar to any (large) cluster.
Clustering can also be used for straightforward classification. In contrast topure anomaly detection and unsupervised anomaly detection, labelled trainingdata is then clustered. Each cluster can be given the class of the majority ofthe contained data objects for example. When unknown data are classified, theclass of the most similar cluster may be given to the unknown data. This methodis a mix of misuse and anomaly detection since both attacks and normality aremodelled. Figure 2.12 illustrates classification-based detection using clustering:
• Data point a will be considered normal because it is similar to a clusterwhere the majority of the data points are normal.
• Data point b will be considered as part of an attack because it is similar to acluster where the majority of the data points are attacks.
• Data point c can be considered as part of a new attack because it is notsimilar to any cluster.

BACKGROUND 29
ab
cNormal data
Normality cluster
Legend:
Attack data
Attack cluster
Unknown data
Figure 2.12: Classification based detection using clustering

30 2.4. DATA MINING AND MACHINE LEARNING

THE SAFEGUARD CONTEXT 31
Chapter 3
The Safeguard context
Most of the work in this thesis was done in the context of the European Safeguardproject [96]. Safeguard (2001-2004) was a European research project aiming toenhance survivability of critical infrastructures by using agent technology. Thetelecom and electricity distribution domains were used to evaluate the Safeguardconcepts.
This chapter gives a brief overview of the project and describes how the workin this thesis fits in the larger picture of Safeguard. The telecom domain will dom-inate this chapter, because ADWICE was demonstrated and successfully tested inthat domain.
3.1 Critical infrastructures
Our heavily industrialised society would not survive without a generous and re-liable supply of energy and communications. The energy and communicationsneeds are supplied by what is known as large complex critical infrastructures(LCCIs). They are large because they consist of networks interconnected at local,regional, national and global levels. They are complex because they have to pro-vide a range of services to a wide range of various costumers and there is rarelyone single supplier. They are critical because our society would collapse if any ofthose infrastructures were unavailable an extended period of time.
However critical, those infrastructures are vulnerable to failures as well as de-liberate attacks. Due to their complexity, the infrastructures depend heavily oncomputers and communications networks for monitoring, protection and manage-ment. The computer systems are in turn vulnerable.

32 3.1. CRITICAL INFRASTRUCTURES
In general, critical infrastructures can be divided into the following three lay-ers:
1. Physical layer. This is the network of pipes, lines, cables, etc. that deliversthe essential services. In the telecommunications domain the physical layerconsists of the routers, switches and copper and fibre-optic lines that carrythe telecommunications data. In the electricity domain the physical layeris the network of transmission lines, transformers, breakers and generatorsthat create and transport the electrical energy.
2. Cyber layer. This is the computers, networks and data gathering sensorsthat are used to monitor and control the physical layer. In the telecommu-nications domain, the cyber infrastructure is used to monitor and controlthe many routers and switches within the system. In the electricity domain,the cyber infrastructure gathers information about power flows and breakerstates and transmits the operators’ control signals to the breakers and trans-formers. Although the cyber layer may share communications channelswith the physical layer - in telecommunications, for example - the data thatis transmitted within the cyber layer has a very different function from thatwithin the physical layer.
3. Human operations layer. All the information gathered by the cyber layer ispassed on to the human operators, who use it to manage the physical and cy-ber layers. The organizational processes that are in place for management,security enforcement, and recovery from failures are part of this layer.
In the past it has generally been the physical and human operations layersthat have been the most vulnerable to attacks, failures and accidents. Accidentsand failures in the physical layer have always been part of the daily running ofthe network and this layer has occasionally been subject to physical attacks aswell. Within the human operations layer, operators inevitably make mistakes andthey also have the specialised tools and knowledge that are needed to carry outmalicious actions. It has also always been possible for attackers to gain physicalaccess to the control room or to manipulate operators by social engineering. Noneof these problems have gone away in recent years, but a number of factors havecontributed to a dramatic rise in the vulnerability of the cyber-layer, which hasbeen the main area of focus for the Safeguard project.

THE SAFEGUARD CONTEXT 33
3.1.1 Telecommunications vulnerabilities
In most European countries traditional circuit-switched telecommunication net-works are being replaced by packet-based IP networks. It is therefore the man-ifestation of attacks, failures and accidents in IP networks that constitutes themost significant threat to telecommunications infrastructures. In recent yearsthe dependability of IP infrastructures has decreased, due to the proliferationof worms, denial of service attacks, buffer overflow vulnerabilities and viruses.There are also the inevitable problems of hardware failures and software crashes.All of these problems are being exacerbated by the rapid deployment of hard-ware and software that have been designed primarily for other contexts (e.g. per-sonal computing) within the patchwork that constitutes modern complex systems.This spread of commercial off-the-shelf hardware and software can also lead to amonoculture within which it is easy for malicious processes to spread.
In case of failures, accidents as well as attacks, it is important that problemsare detected and resolved as soon as possible to increase service availability, andavoid further escalation of the problem. An important issue is to quickly and ac-curately identify the cause to a problem. In the context of a management networkfor telecom service providers we have identified the following needs:
• Reducing information overload on human operators (see sections 3.3.1 and3.3.4). Many existing tools produce an abundance of alerts and logs.
• Increasing coverage by providing new sources of information such as anom-aly detection with ADWICE (see chapter 4 and 5).
• Increasing information quality by reducing false positives (see section 3.3.4).
• Collating information, such as correlating alerts and combining with net-work topology information (see section 3.3.4).
• Presenting a global view of a network (see section 3.3.4).
3.1.2 Electricity vulnerabilities
The electricity cyber layer contains a number of control centres running worksta-tions, energy management software (EMS) and databases over a local area net-work. These control centres interact with the Supervisory Control And Data Ac-quisition (SCADA) system that consists of a software interface and specialisedhardware units (RTUs), which monitor sensors and interface with breakers andtransformers (see figure 3.1).

34 3.2. SAFEGUARD SOLUTIONS
Figure 3.1: Electricity cyber infrastructure
Traditionally this cyber infrastructure was protected by its relative isolationand the non standard protocols that were used to communicate over it. How-ever, with the deregulation of the electricity industry it no longer makes sense foreach company to develop its own hardware and design proprietary protocols, andcompanies are increasingly looking to commercial products to solve their commu-nication needs. A second consequence of this market orientation is the increasedinterconnectedness between the electricity management networks and other net-works, most problematically between the corporate network and the control centrenetwork. The dangers of this standardisation and interconnection became appar-ent in the recent Ohio nuclear incident [91] when the Slammer worm copied itselfacross from the corporate network into the plant network and disabled a safetymonitoring system for nearly five hours, forcing the operators to switch to an ana-logue backup. In a separate incident the propagation of Slammer blocked SCADAtraffic and impeded the ability of operators to monitor and control the electricitysystem [30].
3.2 Safeguard solutions
Within the Safeguard project we have aimed to produce a solution that can tacklesome of these challenges, using an open architecture that can be extended to cope

THE SAFEGUARD CONTEXT 35
with emerging threats. The core of this Safeguard solution is an agent system,which facilitates the distributed gathering and filtering of information from a num-ber of different sources and the execution of rapid responses to attacks, failuresand accidents.
3.2.1 Agents for increased dependability
Agents are semi-autonomous software entities that perceive their local environ-ment, process this information in some way and carry out actions. By communi-cating with one another they can develop collective solutions to problems. Agentsrun on agent middleware (see section 3.2.2) that separates their generic services(such as communication capability, service discovery, heart beat emissions) fromthe specific "business" logic used for detection, correlation or action. This para-digm offers a number of advantages over a single centralised intelligence:
• Scalability. With a centralised system, communication bottlenecks canbuild up around the central controlling node as the network increases insize. Within a decentralised system the communication overhead dependsupon the degree of coupling between the distributed components. How-ever, since this overhead is distributed over the whole of the network, evenquite tightly coupled distributed systems can generally be scaled more eas-ily. The processing of information is also distributed across many nodes inagent systems.
• Local detection and response. The remoteness of centralised intelligencesystems makes them useless in the event of a partial or complete networkfailure. On the other hand, a distributed agent system can carry out anautonomous rapid response in isolated parts of the network, which can per-form definitive repair actions or simply "buy time" before a more lastingremedy is found. This is a substantial advantage in critical infrastructures,which are generally managed using a central control room (with backupcontrol available at different locations).
• Robustness. Agent systems ideally do not have a single point of failure andcan continue to operate even if a number of them are attacked or fail. Thisis a useful feature in dependability applications, where graceful degradationrather than rapid collapse is the optimal behaviour.
• Emergent behaviour. A lot of work has been done on the way in which cer-tain forms of intelligence can emerge through large numbers of local inter-actions. A number of relatively simple agents can self-organise to perform

36 3.2. SAFEGUARD SOLUTIONS
tasks that would be very difficult to create and coordinate from a centralpoint.
• Modularisation. Whilst the object-oriented paradigm does facilitate a rea-sonable amount of modularisation, agent systems take this even furthersince each agent operates as an independent functioning system. Differentagents can be designed by different people to handle specific tasks and onlythe messages between them need to be agreed. This makes it easy to set upcommunications between agent systems made by different companies fordiverse critical infrastructures.
These advantages of agent-based systems make them a viable choice for themonitoring and protection of large critical infrastructures. However, it is the in-telligence inside the agents that enables them to identify problems and react tothem appropriately. The Safeguard approach to this will now be covered in thefollowing sections starting with a description of the Safeguard agent platform.
3.2.2 The Safeguard agent platform
As explained in section 2.3, software agents have a number of common require-ments. Some of the most important include life cycle management and communi-cation. Because this functionality is common to all agents in a multi-agent systemit can be provided by an agent platform.
Using an existing platform decreases the need of spending resources on devel-oping basic agent functionality. Therefore a large number of existing agent plat-forms were evaluated in a preliminary agent platform survey [16]. At this pointthe specific requirements of the safeguard architecture were not known, rather anumber of general requirements were used, including:
• Maturity - How mature is the platform? Is the software well used in a realworld setting?
• Activity - How active is the project? Have new versions and bug-fixes beenreleased recently?
• Security - What techniques are used to secure the agents?
• Interoperability - Can external software be integrated?
• Scalability - Can the platform manage large applications with many agents?

THE SAFEGUARD CONTEXT 37
• Footprint - Are the memory and CPU usages reasonable? Can both light-weight and heavyweight agents be implemented with the platform?
• Platform requirements - Does the platform depend on specific operatingsystems and/or hardware?
• Open source - Is the platform implemented as open source? Can the plat-form be extended by a third party?
• Documentation - Is the platform well documented?
• Support -What extent of support is available?
• Price - Is the platform free? Are there non-commercial licences?
• Availability - Can an evaluation copy easily be downloaded?
• Communication - How is agent communication implemented?
Besides some notable exceptions, many of the surveyed agent platforms weredeemed to be primarily research platforms, not mature enough to be used by theSafeguard project. Others lacked important functionality such as secure commu-nication or were too heavy-weight for the Safeguard setting. The initial surveyresulted in the selection of Jade [68] and Grasshopper 2 [55] for further evalua-tion. Due to very specific license restrictions concerning performance evaluationsof Grasshopper, this platform was excluded from further evaluation and replacedby Tryllian ADK [108].
During the initial phases of the project a number of more specific require-ments were discovered. Some wrapper agents had very high requirements on per-formance due to the high flow of network data in the telecommunication setting.This implied the need for an efficient platform implementation of agent commu-nication. Other low level agents could have limited resources in terms of memoryand processor speed. This led to the platform requirement that some low levelagents were to be implemented in C while most high level agents were to be im-plemented in Java. Java was selected due to its platform independence reducingproblems when agents are to be executed on different operating systems and hard-ware. Also it provides good support in terms of well documented libraries andalso facilitates more efficient development than alternative languages.
The specific requirements led to the decision to abandon the idea to use ex-isting agent platforms and instead implementing the Safeguard Agent Platform

38 3.2. SAFEGUARD SOLUTIONS
Message Transport System
DF Locator
AgentsAgents
Message Transport System
TCP/IP sockets
LookupServer AgentsAgentsDF
Locator
Figure 3.2: Safeguard agent platform architecture
(SAP). SAP was designed to be light-weight and also allow agents to be imple-mented in both C and Java. The platform provides the most important functional-ity needed by the agents including life cycle management, naming services, ser-vice discovery and communications. Figure 3.2 shows the architecture of SAP.
Compared to the abstract FIPA architecture presented in section 2.3.1, onedifference is the lack of an explicit agent management system in the architecture.This functionality is provided by the separate lookup-server. To obtain good per-formance plain IP/TCP sockets are used for implementing the message transportsystem. The choice of implementation is abstracted away by the platform. Eachagent finds other agents by searching for names and/or services. The local agentcontainer needs only to be configured with the location of the lookup-server tofacilitate this.
Performance evaluation
A final evaluation was performed to compare the implementation of communica-tion, support for concurrency, security and performance of SAP with Tryllian andJade. Communications performance was compared by computing round-trip time,that is, the time from Agent A sends a message to Agent B until Agent A havereceived an answer. Round-trip time was chosen as metric to keep time relative toa single agent. Figure 3.3 shows how the round-trip time increases for Tryllian,Jade and SAP when an increasing number of agent pairs are communicating lo-cated on separate hosts. The figure shows that SAP provides the best performancein this setting followed by Jade.

THE SAFEGUARD CONTEXT 39
0
50
100
150
200
250
300
350
1 2 3 4 5 6 7 8 9 10
Nr of agent pairs
Ro
un
d t
rip
tim
e (m
s)
Tryllian JADE SAP
Figure 3.3: Performance of Safeguard agent platform
Figure 3.4 shows how the round-trip time increases when a very large numberof agent pairs communicate. Also here SAP provides the best performance whileTryllian was not able to handle the large number of agents in the final experiment.
Full results from the platform evaluation can be found in the original pa-per [18] and reports [17, 51]. In general SAP provided the best performance,sometimes closely followed by Jade.
3.2.3 The Safeguard agent architecture
The safeguarding agents executing on a common agent platform are added as afourth layer interacting primarily with the cyber and organizational levels of thecritical infrastructures. Figure 3.5 shows how this is done at a conceptual level.
The Safeguard agent architecture is presented in figure 3.6. The generic rolescan be described as follows:
• Wrapper agents wrap standard devices and existing diagnosis mechanismsin the protected network, and provide their outputs after some filtering andnormalisation for use by other agents.
• Hybrid detector agents utilise domain knowledge for a given infrastructure,but combine it with behavioural detection mechanisms (e.g. anomaly de-tection with white lists) to detect known and unknown problems.

40 3.2. SAFEGUARD SOLUTIONS
0
200
400
600
800
1000
1200
1400
0 20 40 60 80 100 120
Nr of agent pairs
Ro
un
d t
rip
tim
e (m
s)
Tryllian JADE SAP
Figure 3.4: Scalability of Safeguard agent platform
Layer 1: Physical infrastructure node of LCCI
Layer 2: Control and information flow infrastructure
Layer 3: Node of human organisation (management and supervision)
Layer 4: Safeguard agents: survivability supervision
Figure 3.5: Conceptual view of Safeguard

THE SAFEGUARD CONTEXT 41
IDSWrapper
DiagnosisWrapper
Hybrid DetectorAgent
Topology Agent
HMI Agent
NegotiationAgent
ActuatorAgent
CorrelationAgent
Action Agent
Work in thisthesis
Concerned LCCI
Other LCCI:s
Figure 3.6: The Safeguard agent architecture
• Topology agents gather dynamic network topology information, e.g. hosttypes, operating system types, services provided, known vulnerabilities.
• Correlation agents identify problems that are difficult to diagnose with onesource of information in the network, by using several sources of informa-tion from wrapper, topology, or hybrid detector agents. They use the datasources to order, filter and focus on certain alerts, or predict reduced avail-ability of network critical services. One type of correlation agent performsadaptive filtering and aggregation to further reduce the alert rates.
• Action agents enable automatic and semi automatic responses when evalu-ation of a problem is finished.
• Actuator agents are wrappers for interacting with lower layer software andhardware (e.g. changing firewall rules).
• HMI (Human-Machine Interface) agents provide an appropriate interface,including overview, for one or many system operators.
• Negotiation agents communicate with agents in other LCCIs to request ser-vices and pass on information about major security alerts.

42 3.3. THE SAFEGUARD AGENTS
3.3 The Safeguard agents
In this section we give an overview of the agents in the Safeguard Architecture.Some high level agents, including the topology agent, the HMI agent and thenegotiation agents are generic and used in both the telecommunication and powerdomains. In other cases, where more specialised agent instances are needed forthe two domains, we present examples of the telecommunication instances. Thereader interested in specific agents of the power domain are referred to relatedSafeguard publications [14, 48, 97, 98].
3.3.1 Wrapper agent
A number of diagnostic tools were already available and used in both the telecomand power domains. To provide the agent system with access to those existingsystems, light weight wrapper agents were devised. Examples of wrapped systemsof telecom include:
• Snort - A well-known open source intrusion detection system
• Samhain - A file integrity checker
• Syslog - A very general logging tool in Unix.
• Firewalls
All those tools output large numbers of alerts. One important goal of the Safe-guard agent system is to identify problems by providing a diagnosis to humans andthe action agents. However, the raw output from existing tools, millions of alerts,would very quickly overload a human operator as well as higher level agents suchas the action agent. The low level agents therefore need to reduce the total numberof alerts as close as possible to the source, before forwarding the remaining alertsto higher levels. In particular there were a lot of uninteresting messages comingfrom untuned Syslog and Samhain. Practically in LCCIs, tuning requires a staticnetwork, were changes almost never happen or it requires a non-affordable ef-fort for the administration. The resulting amounts of uninteresting messages havea low severity, though through their number of occurrence, they cannot be ne-glected. Therefore static filters exclude data from Samhain and Syslog that doesnot carry any valuable information, such as messages that Samhain checks a fileor that Syslog is doing a garbage collection.
Static filters are implemented either as an ignore filter or as a delete filter. Theignore filters keep the alerts in the database to be used for forensic investigation if

THE SAFEGUARD CONTEXT 43
Single sensor correlation
SyslogSamhain
TcpDump
Multi sensor correlation
WhitelistFiltering
AnomalyDetection
ModelAdaptation
Hybrid Detector
Single sensor correlation
Snort
Static filtering
Normalisation
Correlation Agent
Wrapper
Correlation Agent
Correlation Agent
Figure 3.7: Functional overview of wrappers and related agents
needed, but they are not forwarded to high level agents. The delete filters removealerts permanently from the database. All static filters have a limited duty cycledefined by the operator and have to be reactivated afterwards.
Another severe practical problem is the disagreement in message format ofdifferent tools. Before alerts from diverse tools can be analysed by higher levelagents, their format needs to be normalised. This is another task of the wrapperagents. In the Safeguard prototype implementation a simple agent message for-mat was devised to handle the many diverse messages handled by the agents (e.g.alerts, commands, information). In a non-prototype implementation availablestandards should be used where applicable, such as IDMEF (see section 2.2.1)for intrusion detection alerts.
Figure 3.7 shows how the wrapper agents take output from existing tools,perform normalisation and static filtering and forward the remaining alerts to thecorrelation agents. In parallel the hybrid detector agent increases coverage byproviding additional types of alerts. The processing of the hybrid detection agentsand correlation agents are further described in the following sections.
3.3.2 Hybrid detector agent
The hybrid detector agent combines learning-based anomaly detection withprogramming–based detection using signatures. Signatures can be used to quickly

44 3.3. THE SAFEGUARD AGENTS
detect and categorise known problems, while the anomaly detection engine candetect new unknown attacks and problems.
In the telecom domain the data rate can be very high, compared to the electric-ity domain. This puts hard requirements in terms of performance and scalability ofthe hybrid detector agent. ADWICE, the anomaly detection scheme presented inthe next chapters of this thesis, as well as a separate instance of the hybrid detectoragent, was implemented to fulfil those needs. Due to the cluster-based engine theagent instance was named Clustering Hybrid Detection Agent (CHDA). Furtherdetails of the implementation of CHDA are provided in chapter 6.
In addition to CHDA, a number of alternative anomaly detection approacheswas evaluated by other nodes in the project in the power domain. Those includean invariant-based detection scheme [14] and a case-based reasoning [48] scheme.
3.3.3 Topology agent
The topology agent (TA) stores information about the cyber infrastructure andmakes it available for the other agents running on the system. This informationis gathered from databases and human operators and includes the hardware andsoftware components, their interconnections, importance and vulnerabilities, theservices they are running and the people responsible for them. This agent alsoprovides a measure of health for the components that it is monitoring - a computerwith a high CPU load and high temperature is rated as healthier than one that hasa low load and is cool running. The component health measures can then be usedby the correlation agent to compute network health (i.e. overall service level).
3.3.4 Correlation agent
The correlation agent ties all other agents together and has a number of complextasks to perform. To avoid scalability problems in the telecom domain hierarchiesor distribution of correlation agents can be used. In our case the first level of cor-relation agents (ARCA - Alert Reduction Correlation Agent) implements adaptivefiltering and aggregation (i.e. single sensor correlation). The higher level agent(TACA - Topology Alert Correlation Agent) correlates the filtered alerts from dif-ferent sensors as well as performs network health monitoring. Figure 3.8 showsa functional overview of the correlation agents. We now go on to explain thefunctions involved.

THE SAFEGUARD CONTEXT 45
Aggregation
TcpDump
Correlation Agent(ARCA)
Correlation Agent (TACA)
Hybrid Detector
Multi sensor correlation
Topology Agent
Network health monitoring
Snort
Correlation Agent(ARCA)
Wrapper
AggregationAdaptive Filtering
Figure 3.8: Functional overview of correlation agents
Aggregation
Repeated, identical alerts do not provide any additional information. It wouldreduce the information overload if all of these alerts were represented in only onealert including the number of its frequency. The relevant fields for aggregationhave to be defined for each source of alerts individually. For Snort the source anddestination IP, as well as the server ports and the messages are relevant. Ephemeralports1 should be ignored because they will vary between connections. For Syslog,the process identification number is unimportant but the program and the messagefield is relevant. All data is aggregated within a given time window.
Adaptive filtering
Static filtering provided by wrapper agents deals with known problems. However,since it is not possible to foresee all future misconfigurations, adaptive filteringalgorithms were implemented to suggest new filter rules to the operator. Thisis based on Naïve Bayesian (NB) learning [61]. The idea is to train a NB textclassifier to classify messages by looking at word statistics of messages. The
1Ephemeral ports are temporary ports assigned by the client’s IP stack, and are assigned from adesignated range of ports for this purpose.

46 3.3. THE SAFEGUARD AGENTS
NB-classifier has to be trained first with a subset of messages labelled as inter-esting or not. During training, a knowledge base is automatically acquired, en-abling the NB-classifier to assess whether unknown messages are interesting [22].The meaning of interesting in our approach is a message that can be useful whenanalysing it for signs of an attack. For example, a message saying "telnetd: Suc-cessful login as user root" or "File changed" is classified as interesting, but mes-sages like "Syslog-ng: 54 Objects alive. Garbage collecting while idle" or "Couldnot resolve host name" will be classified as uninteresting (the last message is anexample of a misconfiguration that should be detected and reported separated fromthe intrusion detection process).
The adaptive filters are used in the following workflow:
1. For performance reasons, the algorithm for adaptive filtering is launched ona periodic basis.
2. The algorithm suggests filter rules for top scoring events to a human expertvia HMI.
3. The reply is also used to optimise the training corpus, achieving on-lineretraining.
4. In order to avoid over learning effects, features that hardly ever occur intime are reduced in their significance and are finally forgotten.
Multi-sensor correlation
Figure 3.9 shows the high level design of TACA. Aggregated alerts from low levelcorrelation agents are first correlated with topology information. For example:Snort analyses a network packet targeting a host and finds out that it contains abuffer overflow attack taking advantage of a Windows vulnerability. When the IPof the target host is correlated with topology information of this host, the host isfound to run Unix rather than Windows. This implies that the attack failed andthe severity of the alert downgraded. The resulting alerts are stored in persistentstorage in the InAlert data base.
In the prototype implementation two types of correlation engines were used:
• A rule-based correlation engine was implemented to provide the agent withexpert knowledge.
• A learning-based correlation engine was implemented to help focus on rel-evant alerts for cases when rules do not exist.

THE SAFEGUARD CONTEXT 47
InAlert OutAlert
Alert-Topology
CorrelationCorrelationEngine 1
ConfigurationSelf
AdaptationHealth
Monitoring
CorrelationEngine N
Topology Alert Correlation Agent
HMI Agent
HM
I and
Act
ion
Age
nt
Agg
rega
ted
Ale
rts
AgentMonitoring
Met
a A
gent
A
lerts
Topo
logy
Age
nt
HMI Agent
Figure 3.9: Design of TACA (Topology Alert Correlation Agent)
The learning-based engine regards all alerts concerning one host during atime-window. In other words, the selected correlation parameters are time andIP address. Given a time window, a time slot of a three dimensional2 vector isproduced by taking the sum of severities from the three sensors. Based on theinput pattern, the correlator decides whether this is an interesting alert or not.For further processing just one single alert is generated. The idea is illustrated inFigure 3.10.
Three different engines were evaluated [22, 23] using time-slots:
1. A simple additive correlator with the parameter ’added severity threshold’
2. A neural network [104] with a variable set of neurons and hidden layers.Training is achieved by back propagation.
3. K-Nearest Neighbour [38] with K as a variable parameter.
The additive correlator simply builds a weighted sum of the number of oc-currences of the severities within a given timeslot. The sum is then compared toa threshold generating an alert if the chosen limit is exceeded. By varying thethreshold different detection rates and false positive rates can be achieved. The
2During evaluation three alert sources were used including Snort, Syslog and Samhain.

48 3.3. THE SAFEGUARD AGENTS
Buffer overflowSeverity 7
FTP-server errorSeverity 5
PingSeverity 1
Port scanSeverity 2 /etc accessed
Severity 3
Snort: 1Samhanin: 0
Syslog: 0
Snort: 9Samhanin: 3
Syslog: 5
Snort Samhain Syslog Added Values
Tim
eslo
t n
Tim
eslo
t n
-1
Figure 3.10: Timeslot based alert correlation
other two correlation algorithms were first trained on a subset of data before it isapplied to the new real time dataflow. Further details on those correlation tech-niques and their evaluation can be found in work by Chyssler et. al [22, 23].
Network health monitoring
The topology agent collects and stores a lot of information. Sometimes it is usefulfor the operator to get a more condensed view of a host or network. This is thepurpose of the network health metric. Figure 3.11 shows an example of how acondensed view of network health can be realised. The purpose of the networkis to provide a number of services. Individual hosts providing services contributeto the overall service provided by the network. Network health is a condensedmeasure on the availability of service or service level.
For individual hosts health is in this example computed out of:
• Online/Offline status. A host that is down is considered dead with healthequal to zero.
• Measures of load and memory usage. Memory consumption vary a lot dur-ing a program’s life-time and therefore such measures are computed overtime to even out the spikes during normal operation.

THE SAFEGUARD CONTEXT 49
Function F
Service Y is delivered by network
HMI
Service YTA: Port open on host BTA: Port open on host CService XTA: Port open on host A
TA: Port open on host B
Host BHost A Host C
Host A
ok Host C ok
Host B
ok Hos
t B o
k
TA: U
p/Dow
n
TA: Load
& M
emory
healt
h
TACA: Atta
ck co
nfiden
ce
TA: Up/D
own
TA: Loa
d & M
emor
y hea
lth
TACA: Atta
ck co
nfide
nce
TA: Up/D
own
TA: L
oad
& Mem
ory hea
lth
TACA: A
ttack
confi
dence
Service X is delivered by network
Figure 3.11: Principle of global monitoring
• Attack confidence. What is the probability that the host is currently com-promised or attacked?
Individual service health is computed by taking into account if their desig-nated ports are open or closed. A closed server port provides no service. Inaddition to this, the health of the hosts providing the service contributes to theoverall service health. The network health is computed as a weighted sum of allservices provided by the network. The HMI agent described in the next sectioncan then show network health as well as status for individual hosts.
3.3.5 Human-machine interface agent
The Safeguard agents’ autonomous actions are carried out under the supervisionof a human operator. In some situations the agents will need to ask human op-erators for permission to carry out actions. In other situations the agents will be
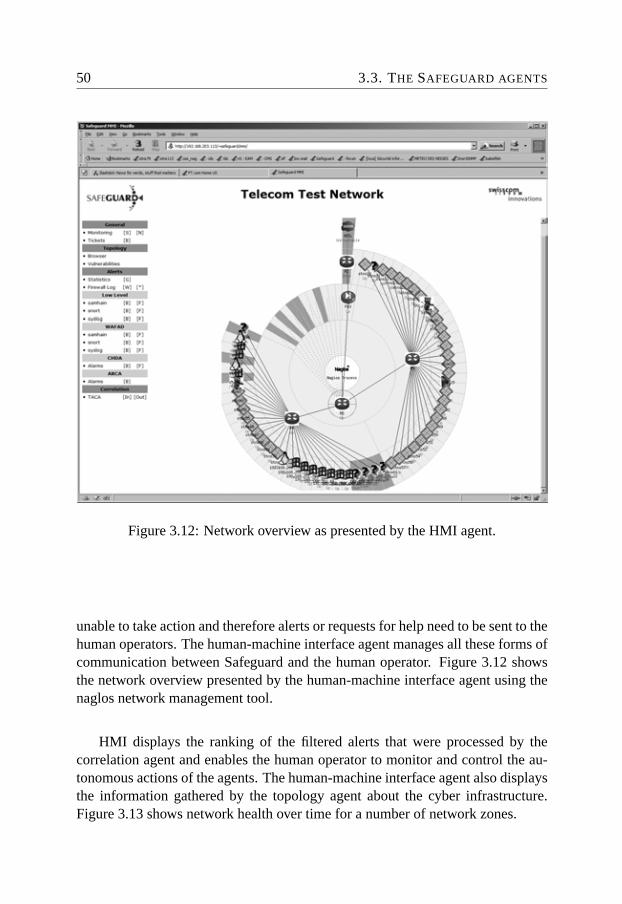
50 3.3. THE SAFEGUARD AGENTS
Figure 3.12: Network overview as presented by the HMI agent.
unable to take action and therefore alerts or requests for help need to be sent to thehuman operators. The human-machine interface agent manages all these forms ofcommunication between Safeguard and the human operator. Figure 3.12 showsthe network overview presented by the human-machine interface agent using thenaglos network management tool.
HMI displays the ranking of the filtered alerts that were processed by thecorrelation agent and enables the human operator to monitor and control the au-tonomous actions of the agents. The human-machine interface agent also displaysthe information gathered by the topology agent about the cyber infrastructure.Figure 3.13 shows network health over time for a number of network zones.

THE SAFEGUARD CONTEXT 51
Figure 3.13: Network health monitoring of the HMI agent
52 3.3. THE SAFEGUARD AGENTS
3.3.6 Action agent
The primary task of the action agent is to obtain a problem description from thecorrelation agent, and choose a suitable action that may resolve the problem. Thefirst implementation of the action agent consists of a two-dimensional action ma-trix. The action agent provides a list of capabilities in terms of possible actions.Specific known problems can then be mapped to suitable actions.
Especially in the IP domain, the actions are limited to passive defence dueto the possibility of IP spoofing. In severe cases immediate clearance of a hu-man operator is required. In general three classes of passive defence actions arepossible [97]:
1. Perimeter defence: router, firewall configuration:
• In case of configuration error:
– Correct entry.
– Find the SNMP script that is responsible.
• Decrease traffic volume (graceful degradation).
• Block or drop traffic.
• Switch off routing protocols or static routes.
• Redirect traffic.
• In case of element failure:
– Reboot.
– Switch over to backup element.
2. Internal router and switch reconfiguration:
• Decrease traffic volume.
• Block or drop traffic.
• Switch off rotten services.
• Switch off troublesome interfaces.
• Reboot element.
3. Host based countermeasures:
• Reduce process priority.
• Kill process.
THE SAFEGUARD CONTEXT 53
• Redefine priorities of users and processes.
• Disrupt inbound or outbound traffic.
• Reboot machine.
• Switch off machine.
The action agent can be configured to perform automatic actions for situationswhere the administrator decides this is viable. In other cases the action agent canpropose actions for the operator. Operators as well as agents sometimes makemistakes. An important functionality of the action agent is therefore to providethe opportunity to undo previous actions whenever possible.
3.3.7 Actuator agent
The actuators are low level agents which can be either controlled by the actionagent or the HMI when direct human control is necessary. The latter is an ultimaterequirement of operators, being in need of direct control, because the last instanceis the human if everything else fails.
Actuators were in the telecom domain prototype implemented for firewalls,routers, switches, and individual hosts. Actions included are for example:
• Host shut down and reboot.
• Various file actions including removing and changing attributes.
• Various process actions including signalling and renicing3.
• Drop, block and rate limiting of traffic.
• Adding/Removing Cron-jobs4.
3.3.8 Negotiation agent
The negotiation agent handles the interactions with other critical infrastructures.As was discussed in section 3.1, one of the emerging problems with critical in-frastructures is their increasing interdependency and the negotiation agent’s maintask is to minimise the risk of cascading failures by keeping the operators and
3Renice is a Unix utility for changing system scheduling priorities for processes.4Cron is a Unix tool that facilitates periodical running of processes (i.e. jobs).

54 3.4. SAFEGUARD TEST BEDS
agents in other critical infrastructures informed about attacks, failures and ac-cidents. The negotiation agent also exchanges information that can help in theday-to-day running of the networks.
In the event of a significant failure, the negotiation agent can also request ser-vices from other critical infrastructures of a similar or different type. For exam-ple, if a telecommunications network experiences a major failure, the negotiationagent can arrange for its calls to be switched through the most suitable alterna-tive network at an appropriate price. If the data communications in an electricitynetwork fail, more services can be requested from a telecommunications network.
3.4 Safeguard test beds
To be able to evaluate the project, two test environments were developed in paral-lel with the safeguard system. In the electricity distribution setting the evaluationwas partially based on simulation with the safeguards running on real hosts in-teracting with a simulator. For evaluation in the telecommunication setting, areal test network consisting of multiple sub networks and about 50 machines wasconstructed, mimicking a real telecommunication management network. In thistest-network real attacks and faults can be initiated.
Basically the test network consisted5 of four zones plus additional security labzones for the secure development and test of attacks:
• External zone: simulating the Internet in order to avoid contamination ofthe Internet (e.g. worms) when external attacks are to be evaluated. Theexternal zone also provides the real Internet connection when attacks aresuspended implying external partners are able to use the Safeguard test net-work for development and testing purposes. When the Internet connectionis enabled attacks may come from the Internet and data can be collectedaccording to the current security policy (e.g. router, firewall configuration).The external zone is connected to the Safeguard Demilitarised Zone (Safe-guard DMZ) by a state-full firewall, allowing only SSH (Secure Shell) pro-tocols into the Safeguard DMZ.
• Safeguard DMZ: In this zone all the following sub networks come together.All services relevant for inter to intra net connection are located here. All
5This thesis describes the test bed implementation at the end of the Safeguard project. After theproject ended, the test bed was developed further and more machines included
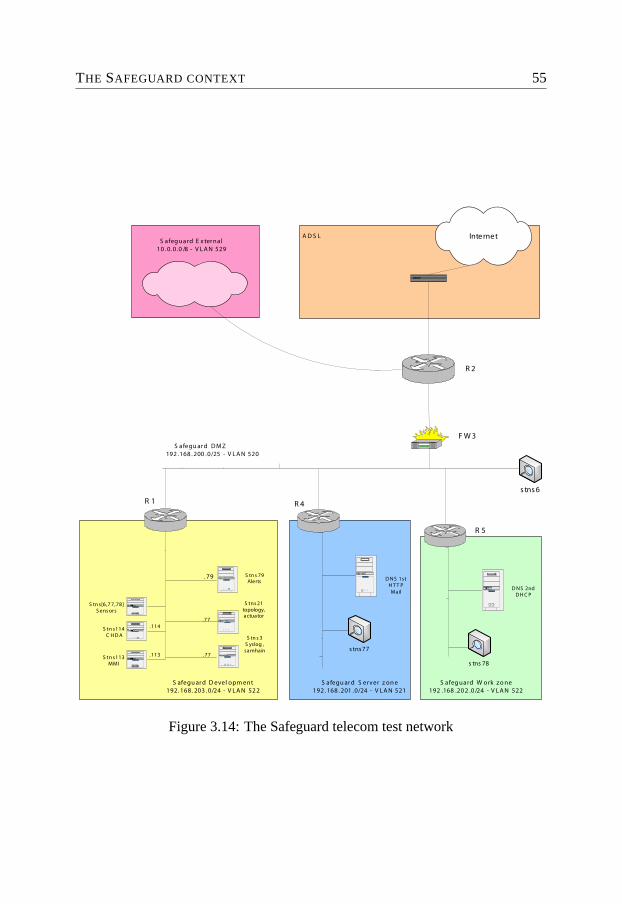
THE SAFEGUARD CONTEXT 55
S a fegu ar d S erv er z on e192 . 168 . 201 .0/24 - V L A N 521
P OW E R F AUL T DAT A AL AR M
S a fegu ar d D M Z192 .168 . 200 .0/25 - V L A N 520
D NS 1stH T T PMail
A D S LS a feg ua rd E x ter na l
10 . 0. 0 .0 /8 - V L A N 529
Internet
F W 3
R 4
S a feg ua rd W ork z o ne192 .168 .20 2 .0 /24 - V L A N 522
D NS 2ndDH C P
R 5
R 2
s tns 6
s tns77
s tns 78
S tn s 79Alerts
. 79
S afegu ar d D evel opm ent192. 168 . 203 . 0/24 - V L A N 52 2
S tn s 3S yslog ,samhain
.113
R 1
S tn s113MMI
.114S tn s114C HD A
S tn s[6,7 7,78]S ens ors
.77
S tns 21topology,actuator
.77
Figure 3.14: The Safeguard telecom test network

56 3.4. SAFEGUARD TEST BEDS
traffic coming from via the Internet is routed into the DMZ via the fire-wall to a specific jump machine. This hardened machine offers a SSH ser-vice where partners are supposed to log in. After a successful login, beingcontained in a jailed shell where only SSH to the test network is allowed,partners are able to transport data from or into the test net in a safe way.
• Work zone: A subnet where employees of a company or administrativepersonnel are working. This zone encompasses a vast variety of differenthardware (Sparc 5, 10,20; Ultra 10, PC) and computer systems, such asUnix Solaris (2.6-2.10) all patch levels, NetBSD, Windows, (2000, NT, XP)different patch levels, (VM ware).
• Server zone: In this zone servers of all kinds are located, utilizing Sparc5, 10, 20, ULTRA10 hardware) for e-mail, web, file, applications, admin-istration and control. Deployed operating systems are Solaris (2.6-2.10) allpatch levels, Linux, Windows server (VMware) and OpenBSD. This zonerepresents a realistic operating system distribution and structure for Swiss-com’s FX and Mobile administrative server environment.
• Safeguard development zone: This is a more protected sub network. Ifthe 203 router is disconnected, this zone is sealed and impenetrable. Alldata from the other zones are gathered by a hardened machine - Unix Sol9STNS3 having two separate network cards. In this zone, all network ad-ministrative related services are resident such as Emergency Jumpstart andmanagement services and the actual Safeguard agent system, being distrib-uted on eight machines. Those machines have been hardened LINUX 9.0,Solaris 2.8+ machines.
All zones are protected and monitored by Safeguard utilizing various sensorsdelivering their pre–processed data via wrappers and distributed small helper pro-grams, residing on the hosts themselves. These helper programs are running asCron–jobs or periodic or triggered demons with high priority and protection.
All zones are synchronised via the NTP protocol thus assuring that the finalcorrelation of alerts in the different IDS alert channels is timely synchronised andactions can be synchronised. If synchronization is lost in one part of the networkthe machines synchronise themselves on their next gateway, thus ensuring thatover a day’s period proper synchronization is in the seconds regime.
To describe the full evaluation of Safeguard is outside the scope of this the-sis. The interested reader is referred to the report on validation and testing ofSafeguard [98].

ADWICE 57
Chapter 4
ADWICE
The basic idea of ADWICE, is to represent normality by the compact cluster sum-maries of the BIRCH clustering algorithm [122]. As explained in the introductionwe perform pure anomaly detection, assuming the model is trained only on normaldata.
BIRCH builds a tree structure used to guide the search for similar clusterswhile clustering a set of data points. We take this idea and apply it to the cluster-based normality model. An index tree can speed up training as well as detec-tion. This chapter describes and evaluates the initial version of ADWICE using asearch-index similar to the original BIRCH clustering algorithm.
4.1 Basic concepts
The full BIRCH algorithm is presented in the original paper [122] and only theparts relevant in the context of ADWICE are summarised here. The BIRCH clus-tering algorithm requires data to be numeric. Non-numeric data is therefore as-sumed to be transformed into a numeric format by pre-processing. How this isdone will be explained in the context of evaluation later.
Given n d-dimensional data vectors vi in a cluster CFj = {vi|i = 1 . . . n}the centroid v0 and radius R(CFj) are defined as:
v0 =∑n
i=1 vi
nR (CFj) =
√∑ni=1 (vi − v0)2
n(4.1)
R is the average distance from member points in the cluster to the centroidand is a measure of the tightness of the cluster around the centroid.

58 4.2. TRAINING
A fundamental idea of BIRCH is to store only condensed information, denotedcluster feature, instead of all data points of a cluster. A cluster feature is a tripleCF = (n, S, SS) where n is the number of data points in the cluster, S is the lin-ear sum of the n data points and SS is the square sum of all data points. Given theCF for one cluster, the centroid v0 and radius R may be computed. The distancebetween a data point vi and a cluster CFj is the Euclidian distance between vi andthe centroid, denoted D(vi, CFj) while the distance between two clusters CFi
and CFj is the Euclidian distance between their centroids, denoted D(CFi, CFj).If two clusters CFi = (ni, Si, SSi) and CFj = (nj , Sj, SSj) are merged, the CFof the resulting cluster may be computed as (ni + nj , Si + Sj, SSi + SSj). Thisalso holds if one of the CFs is only one data point making incremental updates ofCFs possible.
An index tree is a tree with three parameters, leaf size (LS), threshold (T ), andmaximum number of clusters (M ). The purpose of the index tree is to guide thesearch for similar clusters in the normality model. A leaf node contains at mostLS entries, each of the form (CFi) where i ∈ {1, . . . , LS}. Each CFi of the leafnode must satisfy a threshold requirement (TR) with respect to the threshold valueT . Two different threshold requirements have been evaluated with ADWICE. Thefirst threshold requirement R(CFi) < T corresponds to a threshold requirementthat was suggested in the original paper and is therefore used as base line in thiswork (ADWICE–TRR). With this threshold requirement, a large cluster may ab-sorb a small group of data points located relatively far from the cluster centre. Thissmall group of data points may be better represented by their own cluster becausedetection is based on distances. A second threshold requirement was thereforeevaluated where D(vi, CFi) < T was used as decision criteria (vi is the new datapoint to be incorporated into the cluster). This version of the algorithm will bereferred to as ADWICE–TRD.
Each non-leaf node contains a number of entries of the form (X , childi) wherechildi is a pointer to the node’s i-th child. X provides information to guide a top-down search of the tree to find the closest cluster (i.e. centroid) given a datavector v. The following section will explain what information X that is usedfor in the first implementation of ADWICE. Chapter 5 describes an alternativeimplementation of the index-tree, with other information used to guide the search.
4.2 Training
During training the model is presented with new training data one item at a time.Given a model and a new data vector v, a top-down search of the index tree for

ADWICE 59
the closest cluster is performed. If the threshold requirement is fulfilled, the newdata point may be merged with the closest cluster, otherwise a new cluster needsto be inserted into the index tree. If the size (number of clusters) of the modelhas reached the maximum M , the threshold T is increased, the model rebuilt,and then v is inserted in the new model. When the number of clusters in themodel increases, new leaf nodes may need to be created, and the index updatedaccordingly.
Below is an algorithmic description of the training phase of ADWICE, inwhich only the main points of the algorithm are presented and some simplifi-cations made to facilitate presentation. Note that we have abstracted away the useof the search index that will be presented in more detail in the next section.
Algorithm 1 ADWICE Training1: procedure TRAIN(v, model)2: closestCF = findClosestCF(v, model)3: if thresholdRequirementOK(v,closestCF ) then4: merge(v,closestCF )5: else6: if size(model) ≥ M then7: increaseThreshold()8: model = rebuild(model)9: train(v, model)
10: else11: leaf = getLeaf(v,model)12: if spaceInLeaf(leaf ) then13: insert(newCF(v), leaf )14: else15: splitLeaf(leaf , newCF(v))16: end if17: end if18: end if19: end procedure
Rebuilding means that existing clusters are removed from the model and rein-serted. Because the threshold is increased, some of the clusters may now bemerged, thereby reducing the size below the limit M . Rebuilding the model re-quires much less effort than the initial insertion of data because the number ofclusters is significantly less than the number of data points.
If the increase of T is too small, a new rebuild of the tree may be needed

60 4.2. TRAINING
to reduce the size below M again. A heuristic described in the original BIRCHpaper [122] may be used for increasing the threshold to minimize the number ofrebuilds, but in this work we use a simple constant to increase T conservatively toavoid influencing the result by the heuristic.
If it is possible to add clusters to the model (the size is still below M ), we findthe leaf where the new cluster should be included and insert the cluster if thereis still space in the leaf. Otherwise we need to split the leaf, and insert the newcluster in the most suitable of the new leaves.
4.2.1 Using the original BIRCH index
The original BIRCH index consists of a CF tree, which is a height balanced treewith four parameters: branching factor (B), threshold (T ), maximum number ofclusters (M ), and leaf size (LS). Each non-leaf node contains at most B entriesof the form (CFi, childi), where i ∈ 1, . . . , B and childi is a pointer to the node’si-th child. Each CF at non-leaf level summarises all child CFs in the level below.
• Finding the closest cluster is done by recursively descending from the rootto the closest leaf, and in each step choosing child i such that D(v, CFi) <D(v, CFj) for every other child j.
• When inserting new data into the tree all nodes along the path to the rootneed to be updated. In absence of a split, the CFs along the path to theupdated leaf need to be recomputed to include v by incrementally updatingthe CFs. If a split occurred, we need to insert a new non-leaf entry in theparent node of the two new leafs and re-compute the CF summary for thenew leafs. If there is free space in the parent node (i.e. the number ofchildren is below B) the new non-leaf CF is inserted. Otherwise the parentis split in turn. Splitting may proceed all the way up to the root in whichcase the depth of the tree increases when a new root is inserted.
• When splitting a leaf, the two farthest CFs of the leaf are selected as seedsand all other CFj from the old leaf are distributed between the two newleafs. Each CFj is merged with the leaf with the closest seed.
The setting of the different parameters of the algorithm is further discussed inthe context of evaluation in section 4.4.1.

ADWICE 61
4.3 Detection
When a normality model has been trained, it may be used to detect anomaliesin unknown data. When a new data point v arrives detection starts with a topdown search from the root to find the closest cluster feature CFi. This searchis performed in the same way as during training. When the search is done, thedistance D(v, CFi) from the centroid of the cluster to the new data point v iscomputed. Informally, if D is small, i.e. lower than a limit, v is similar to dataincluded in the normality model and v should therefore be considered normal. IfD is large, v is an anomaly.
Let the threshold T be the limit (L) used for detection. Using two parametersE1 and E2 where E1 ≥ E2, we can compute MaxL = E1 ∗ L and MinL =E2 ∗L. Then we compute the belief that v is anomalous using the formula below:
anomaly belief =
⎧⎨⎩
0 if D ≤ MinL1 if D ≥ MaxL
D−MinLMaxL−MinL if MinL < D < MaxL
(4.2)
A belief threshold (BT) is then used to make the final decision. If we considerv anomalous we raise an alert. The belief threshold may be used by the operatorto change the sensitivity of the anomaly detection. For the rest of the thesis tosimplify the evaluation we set E1 = E2 = E so that v is anomalous if and onlyif D > MaxL = MinL. Note that clusters are spherical but the area used fordetection of multiple clusters may overlap, implying that the clusters may be usedto represent also non-spherical regions of normality.
4.4 Evaluation
Performing attacks in real networks to evaluate on-line anomaly detection is notrealistic and our work therefore shares the weaknesses of evaluation in somewhat“unrealistic” settings with other published research work in the area. Our ap-proach for dealing with this somewhat synthetic situation is as follows. We usethe KDDCUP99 data set [78, 80] to test the real-time properties of the algorithm.Having a large number of attack types and a large number of features to considercan thus work as a proof of concept for the distinguishing attributes of the algo-rithm (unknown attacks, fast on-line, incremental model building). We then goon to evaluate the algorithm in the Safeguard test network built with the aim ofemulating a realistic telecom management network (see section 3.4).

62 4.4. EVALUATION
Despite the shortcomings of the DARPA/Lincoln Labs related datasets [78]they have been used in at least twenty research papers and were unfortunatelyat the time of this work the only openly available data sets commonly used forcomparison purposes.
The original KDD training data set consists of almost five million sessionrecords, where each session record consists of 41 fields (e.g. IP flags set, service,content based features, traffic statistics) summarising a TCP session or UDP con-nection. Since ADWICE assumes all training data is normal, attack data are re-moved from the KDD training data set and only the resulting normal data (972 781records) are used for training. All 41 fields1 of the normal data are considered byADWICE to build the model.
The testing data set consists of 311 029 session records of which 60 593 arenormal and the other 250 436 records belong to 37 different attack types rangingfrom IP sweeps to buffer overflow attacks. The use of the almost one milliondata records for training and more than 300 000 data for testing in the evaluationpresented below illustrates the scalability of ADWICE. Other cluster-based workuses only small subsets of data [57].
Numeric features are normalised to the interval [0,1]. Some features of KDDdata are not numeric (e.g. service). Non-numeric features ranging over n valuesare made numeric by distributing the distinct values over the interval [0, 1]. How-ever, two distinct values of the service feature (e.g. http, ftp) for example, shouldbe considered equally close, regardless of where in the [0, 1] interval they areplaced. This intuition cannot be captured without extending the present ADWICEalgorithm. Instead the non-numeric values with n > 2 distinct values are scaledwith a weight w. In the KDD dataset nprotocol = 3, nflag = 11 and nservice = 70.If w/n >= 1 this forces the algorithm to place two sessions that differ in suchnon-numeric multi-valued attributes in different clusters. That is, assuming thethreshold condition requiring distance between two vectors to be less than 1 toinsert merge them. This should be enforced because numerical values are scaledto [0, 1]. Otherwise a large difference in numerical attributes will anyway causedata to end up in the same cluster, making the model too general. If multi-valuedattributes are equal, naturally the difference in the numerical attributes decideswhether two data items end up in the same cluster.
We illustrate the transformation of categorical values with an example, in thiscase the service attribute of the KDD data set. Let L be an arbitrary ordered list ofall nservice = 70 different values of the service attribute. Assume L[0] = http and
1The complete KDD dataset as well as documentation of all features are available for downloadfrom the UCI KDD Archive [110].

ADWICE 63
L[1] = ftp to exemplify this. We select a weight such that wservice/nservice >=1, in other words wservice >= nservice = 70. Let wservice = 70 which fulfils thiscondition. Now map the values of L into the interval [0,wservice] by for each valueL[i] computing the numeric value xi = (i/nservice) ∗ wservice = i/70 ∗ 70 = i.This imply that for every pair of value xi and xj |xi − xj | >= 1. In our examplexhttp = 0 and xftp = 1 and of course |xhttp−xftp| = |0−1| >= 1. The distancebased threshold state that D(v, CF ) < T must be fulfilled to allow a data point tobe absorbed by a cluster. We remind the reader that D is the Euclidian distance inthe current implementation and T is the threshold. Because we make sure T << 1to avoid a too general model the threshold condition will never be fulfilled whentwo service values differ, because the Euclidian distance between such vectorswill always be at least 1. In our example, assume two different vectors v andu. Assume the extreme case when all dimensions except the service dimensionare equal and v[service] = xhttp and u[service] = xftp. Then the Euclidiandistance will be D(v, u) =
√(02 + ... + (xhttp − xftp)2 + 02 + ...) = |xhttp −
xftp| = 1. This does not fulfil the threshold condition and therefore merging oftwo such vectors will be avoided. If other dimensions differ too, this will onlyincrease the Euclidian distance between the vectors.
4.4.1 Determining parameters
Of the three parameters T , B and M the threshold T is the simplest to set, as itmay be initialised to zero. The other parameters are discussed below.
The M parameter needs to be decided using experiments. Because it is onlyan upper bound of the number of clusters produced by the algorithm it is easierto set than an exact number of clusters as required by other clustering algorithms.As M limits the size of the CF-tree it is also an upper bound on the memory usageof ADWICE.
In one extreme case we could set M to the total number of training data re-sulting in one cluster for each unique training data. We would then have a modelthat marks all data that are not included into training data as attacks. Of course weneed the model to be much more general than that, or every new normal data notincluded in the training set would result in a false positive. This situation is calledover-fitting, when the model is too specific and producing very good accuracy fortraining data without being able to handle anything else. The conclusion is that ingeneral M needs to be set much lower than the number of data represented by thenormality model to avoid over-fitting.
The algorithms strive for covering all training data by the available number ofclusters, growing the clusters by increasing the threshold whenever required. If

64 4.4. EVALUATION
Normal dataNormality cluster
Legend :
Attack data
Figure 4.1: Models with different M of the same data
the clusters are too large, they will cover not only normal data, but also possiblyattack data. In the other extreme case, when M is set to one, there will be onecluster basically covering all space where there are training data. This imply thatM also needs to be set high enough to avoid too general (large) clusters. How highdepends on the distribution and number of training data although some generalguidelines could be produced given more experience with the algorithm in thecontext of real networks.
Figure 4.1 shows three different cluster models of the same data using two,four or six clusters. Representing normality by only two clusters makes the modeltoo general because also the distant attack data are covered and much of the emptyspace around the normal data. However, both four and six clusters provide goodrepresentations of the normal data. In general, the exact number of clusters is notimportant.
The above reasoning was confirmed in experiments where M was increasedfrom 2 000 to 25 000 in steps of 1 000. When setting M above 10 000 clusters theaccuracy reaches a stable level meaning that setting M at least in this range shouldbe large enough to represent the one million normal data points in the training set.In the forthcoming experiment M is therefore set to 12 000.
Naturally increasing the branching factor also increases the training and test-ing time. The extreme setting B = M would flatten out the tree completely, mak-ing the algorithm linear as opposed to logarithmic in time. Experiments wherethe branching factor was changed from 20 to 10 improved testing time by roughly16 %.
Experiments where the branching factor was increased from 2 to 2 048 insmall steps showed that not only time but also accuracy is influenced by the

ADWICE 65
c
d
1
2
Legend :
1
a b
2
c d
a
b
Data itemCluster, depth j
Cluster, depth j+1
selected path correct path
Clusters in data space Index tree
Figure 4.2: Example of index error
branching factor. More specifically, accuracy improves when the branching factorincreases. Why is this the case?
The index tree is used for searching the model. Intuitively the algorithm triesto group clusters that are close (or similar) in the same branch of the tree. Thisis true for each level of the index tree. The cluster features at higher levels areonly summaries of all clusters in the branches below. Therefore, the search maysometimes choose the wrong path and select a branch which does not contain theclosest cluster. We call this an index error. If the branching factor is very small,the number of choices increases. At the same time, the probability that two closeclusters are located in different branches at low levels in the tree increases. Thisincreases the risk of ending up in the wrong branch.
Figure 4.2 illustrate a situation where the closest cluster is not found due toan index error. To the left in the figure we see clusters in data space and to theright the corresponding index tree. Consider the clusters to be a subset of a largermodel. We now consider the new data point. To classify the data point, we searchthe model for the closest cluster. At some level j in the tree, the distance betweenthe data and the centre of clusters 1 and 2 are computed. As visible in the figurethe distance to cluster 1 is shorter than to cluster 2, and therefore the branch sum-marised by cluster 1 will be chosen when we descend the tree. Unfortunately thiswill lead the wrong part of the model and we will have an index error.
The experiments showed that the false positives rate stabilised when the branch-ing factor is increased above 16. In the forthcoming experiments the branchingfactor is therefore set to 20, a reasonable trade-off between accuracy and training

66 4.4. EVALUATION
time.A situation where the index may influence detection accuracy is not ideal.
In chapter 5 we further discuss the implications of index errors and introducean algorithm without this property, thereby improving accuracy. But before that,evaluation of the initial index is described in the following sections.
4.4.2 Detection rate versus false positives rate
Figure 4.3 shows the trade-off between detection rate and false positive rate onan ROC diagram (see section 2.2.3). To highlight the result we also compare ouralgorithm ADWICE–TRD with ADWICE–TRR which is closer to the originalBIRCH algorithm. The trade-off in this experiment is realised by changing theE-parameter from 5 (left-most part of the diagram) to 1 (right-most part of thediagram) increasing the detection space of the clusters, and therefore obtaining abetter detection rate while the false positives rate also increases.
The result confirms that ADWICE is useful for anomaly detection. With afalse positives rate of 2.8 % the detection rate is 95 % when E = 2. While notconclusive evidence, due to short-comings of KDD data, this false positives rateis comparable to alternative approaches using unsupervised anomaly detection[57, 90]. On some subsets of KDD data Portnoy et al [90] report 1–2 % falsepositives rate at 50–55 % detection rate, but other subsets produce considerablyinferior results. The significantly better detection rate of ADWICE is expecteddue to the fact that unsupervised anomaly detection is a harder problem than pureanomaly detection.
Since the KDDCUP data initially was created to compare classificationschemes, many different classification schemes have been applied to the KDD-CUP data set. Classification implies that the algorithms were trained using bothnormal and attack data contrasted to ADWICE which is only trained on the normaltraining data. The attack knowledge makes differentiating of attack and normalclasses an easier problem, and it was expected that the results [40] of the win-ning entry (C5 decision trees) should be superior to ADWICE. This was also thecase2 regarding false positives (0,54 %), however detection rate was slightly lower,91,8 %. Due to the importance of low false positives rate we indeed consider thisresult superior to that of ADWICE. We think the other advantages of ADWICE
2In the original KDDCUP performance was measured using a confusion matrix where the resultfor each class is visible. Since ADWICE does not discern different attack classes, we could notcompute our own matrix. Therefore overall false positives rates and detection rates of the classifi-cation scheme were computed out of the result for the individual classes.
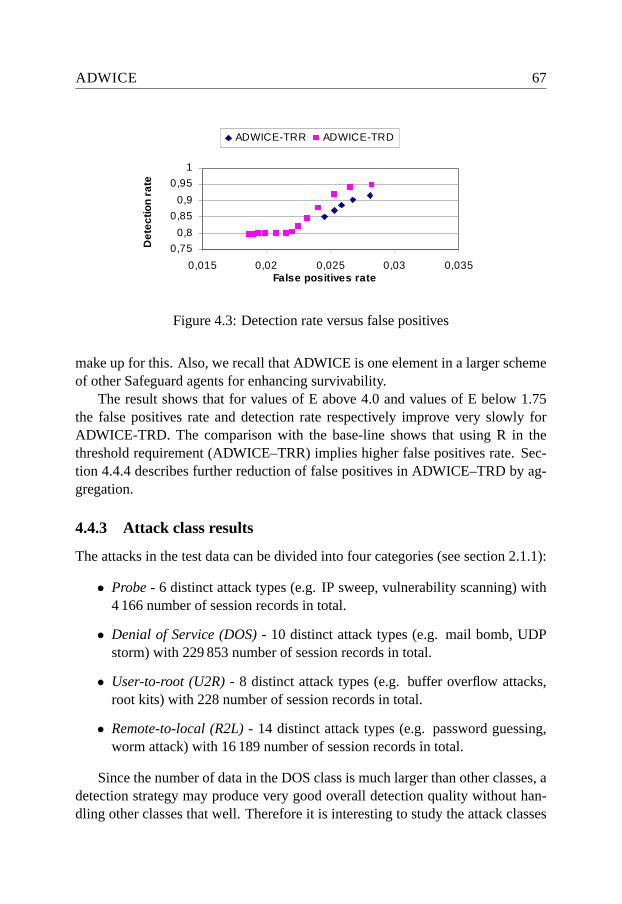
ADWICE 67
0,75
0,8
0,85
0,9
0,95
1
0,015 0,02 0,025 0,03 0,035False positives rate
Det
ectio
n ra
teADWICE-TRR ADWICE-TRD
Figure 4.3: Detection rate versus false positives
make up for this. Also, we recall that ADWICE is one element in a larger schemeof other Safeguard agents for enhancing survivability.
The result shows that for values of E above 4.0 and values of E below 1.75the false positives rate and detection rate respectively improve very slowly forADWICE-TRD. The comparison with the base-line shows that using R in thethreshold requirement (ADWICE–TRR) implies higher false positives rate. Sec-tion 4.4.4 describes further reduction of false positives in ADWICE–TRD by ag-gregation.
4.4.3 Attack class results
The attacks in the test data can be divided into four categories (see section 2.1.1):
• Probe - 6 distinct attack types (e.g. IP sweep, vulnerability scanning) with4 166 number of session records in total.
• Denial of Service (DOS) - 10 distinct attack types (e.g. mail bomb, UDPstorm) with 229 853 number of session records in total.
• User-to-root (U2R) - 8 distinct attack types (e.g. buffer overflow attacks,root kits) with 228 number of session records in total.
• Remote-to-local (R2L) - 14 distinct attack types (e.g. password guessing,worm attack) with 16 189 number of session records in total.
Since the number of data in the DOS class is much larger than other classes, adetection strategy may produce very good overall detection quality without han-dling other classes that well. Therefore it is interesting to study the attack classes

68 4.4. EVALUATION
0,97
0,99
0,99
0,92
0,31
0
0,25
0,5
0,75
1
Acc
urac
y
Normal
Probe
DOS
U2R
R2L
Figure 4.4: The accuracy for attack classes and the normal class
separately. Note that since ADWICE is an anomaly detector and has no knowl-edge of attack types, it will give the same classification for every attack type unlikea classification scheme.
Figure 4.4 shows the four attack classes Probe, DOS, U2R and R2L as well asthe normal class (leftmost column) for completeness.
The results for Probe, DOS and U2R are very good, with accuracy from 92 %(U2R) to 99 % (DOS). However, the fourth attack class R2L produces in com-parison a very bad result with an accuracy of only 31 %. It should be noted thatthe U2R and R2L classes are in general less visible in data and a lower accuracyshould therefore be expected. The best entries of the original KDD-cup com-petition had a low detection rate for U2R and R2L attacks, therefore also a lowaccuracy for those classes.
4.4.4 Aggregation for decreasing alert rate
While the 2–3 percent false positives rate produced by ADWICE may appear tobe a low false positive rate in other applications, in practice this is not acceptablefor network security as explained in section 2.2.3. Most realistic network data isnormal, and if a detection scheme with a small percent of false positives is appliedto millions of data records a day, the number of false alerts will be overwhelming.In this section we show how the total number of alerts can be further reducedthrough aggregation.
An anomaly detector often produces many similar alerts. This is true for newnormal data that is not yet part of the normality model as well as for attack types

ADWICE 69
239 204
28 95016 345 9 754 7 474 6 271 5 561
0
50000
100000
150000
200000
250000
1 10 20 40 60 80 100Size of time window
Num
ber
of a
ggre
gate
d al
arm
s
Figure 4.5: Aggregated alerts for different time windows
like DOS and network scans. Many similar alerts may be aggregated to one alert,where the number of alerts is represented by a counter. In the Safeguard agentarchitecture aggregation is one important task of the alert reduction correlationagent, see section 3.3.4. By aggregating similar alerts the information passed on tohigher-level agents or human operators becomes more compact and manageable.Here we evaluate how aggregation would affect the alert rate produced from theKDD data set.
The KDD test data does not contain any notion of time. To illustrate the effectof aggregation we make the simplifying assumption that one test data is presentedto the anomaly detector each time unit. All alerts in which service, flag and pro-tocol features are equal are aggregated during a time window of size 0 to 100. Ofcourse aggregation of a subset of features also implies information loss. However,an aggregated alert, referring to a certain service at a certain time facilitates thedecision for narrowing down to individual alerts for further details (IP-addressshould have been included if present among KDD features). The result is shownin figure 4.5.
When a new alert arrives, it is sent at once, to avoid increasing time to detec-tion. When new alerts with the same signature arrive within the same time win-dow, the first alert is updated with a counter to represent the number of aggregated

70 4.4. EVALUATION
alerts. Without aggregation ADWICE produces 239 104 alerts during the 311 029time units. Using a short time window of 10 time units, the number of aggregatedalerts becomes 28 950. Increasing the time window to 100 will reduce the originalnumber of alerts to 5 561, an impressive reduction of 97,7 %. The explanation isthat many attacks (probes, DOS) lead to a large amount of similar alerts close intime. Note that aggregation also reduces false positives, since normal sessionsbelonging to a certain subclass of normality may be very similar. While it mightseem that aggregation only makes the alerts less visible (does not remove them)it is in fact a pragmatic solution that was appreciated by our industrial partners,since it significantly reduces the time/effort at higher (human-intensive) levels ofinvestigation. The simple time slot based aggregation provides a flexible systemin which time slots can be adaptively chosen in response to different requirements.
4.4.5 Safeguard scenarios
One of the main efforts of the Safeguard project is the construction of the Safe-guard telecom management test network, presented in section 3.4, used for datageneration for off-line use as well as full-scale on-line tests with the Safeguardagent architecture. Development of the Safeguard test network and further gen-eration of intrusion detection data is ongoing work. Here we present some initialresults from tests performed over a total time period of 36 hours. The ADWICEmodel was trained using data from a period known to contain only normal data.To keep parsing and feature computation time low to facilitate real-time detection,features were only based on IP-packet headers, not on packet content (e.g. sourceand destination IP and ports, time, session length). This means of course that weat this stage can not detect events that are only visible by analysing packet content.The purpose of this instance of the hybrid detection agent is to detect anomalies,outputting alerts that can be analysed by high level agents to identify time andplace of attacks as well as failures or misconfigurations.
In Scenario 1 an attacker with physical access to the test network pluggedin a new computer at time 15:33 and uploaded new scripts. In Scenario 2 thosescripts are activated a few minutes later by the malicious user. The scripts arein this case harmless. They use HTTP on port 80 to browse Internet, but couldjust as well have been used for a distributed attack (e.g. Denial of Service) on anarbitrary port. The scripts are then active until midnight the first day, producingtraffic considered anomalous for their respective hosts. During the night they staypassive. The following morning the scripts become active and execute until thetest ends at 12:00 the second day.
Figure 4.6 illustrates the usefulness of the output of the clustering hybrid de-
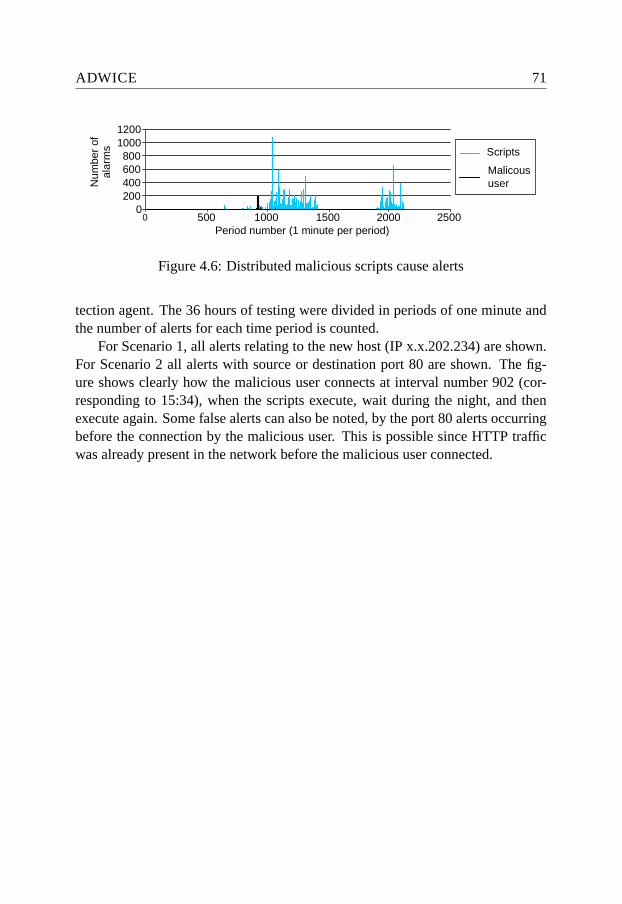
ADWICE 71
0200400600800
10001200
0 500 1000 1500 2000 2500Period number (1 minute per period)
Num
ber
of
alar
ms Scripts
Malicoususer
Figure 4.6: Distributed malicious scripts cause alerts
tection agent. The 36 hours of testing were divided in periods of one minute andthe number of alerts for each time period is counted.
For Scenario 1, all alerts relating to the new host (IP x.x.202.234) are shown.For Scenario 2 all alerts with source or destination port 80 are shown. The fig-ure shows clearly how the malicious user connects at interval number 902 (cor-responding to 15:34), when the scripts execute, wait during the night, and thenexecute again. Some false alerts can also be noted, by the port 80 alerts occurringbefore the connection by the malicious user. This is possible since HTTP trafficwas already present in the network before the malicious user connected.

72 4.4. EVALUATION

ADWICE WITH GRID INDEX 73
Chapter 5
ADWICE with grid index
This chapter describes the extended version of ADWICE, using a new grid-index.The basic algorithm is the same, as presented in the previous chapter, and ratherthen reiterating that we focus on the index itself. Adaptation of the normalitymodel using incremental training as well as forgetting is also discussed.
5.1 Problems of the original BIRCH index
The original BIRCH index is not perfect. That is, the search for the closest clustersometimes selects the wrong path, and we do not find the relevant cluster if itexists. This notion of index error is explained in the previous chapter in section4.4.1.
5.1.1 Influence of index errors
Index errors may influence the detection quality (and evaluation) of an algorithm.Table 5.1 shows how index errors influence anomaly detection results in generalwhen a testing data vector is compared to the model.
If the type of data is not included in the trained normality model an anomalydetection algorithm with index errors returns the correct result, since there is noclose cluster to find anyway. However, there are two cases where index errorsmay produce erroneous results. If the new data point is normal, and the modelincludes a close cluster, an index error results in a false positive instead of a truenegative, thereby decreasing detection quality. On the other hand, if the newdata is anomalous and such data has previously been (erroneously) included intothe model, or if the attack data is very similar to normal data, the index error

74 5.1. PROBLEMS OF THE ORIGINAL BIRCH INDEX
Data Model covers Expected Evaluation withis data evaluation index error
normal yes true negative false positivenormal no false positive false positiveattack yes false negative true positiveattack no true positive true positive
Table 5.1: Consequences of index errors for anomaly detection
may result in a true positive, improving detection quality. In other words, indexerrors make the behaviour of the detection scheme unpredictable, since qualitymay both improve and degrade. The index errors do not completely invalidateevaluation, since if training data is to a large extent normal and attacks are notnormally included in the model, the second case of error (causing improvement)is less likely. The first type of error, when the testing data is normal and the modelsubsumes this data, is most common. This reasoning seems to imply that detectionaccuracy may be improved using an index that does not cause index errors. Buthow much will the detection accuracy be influenced?
As shown in section 2.2.3 the false positives rate (FPR) is the number of falsepositives (FP ) divided by the number of normal data (FP +TN ). Detection rate(DR) is the number of detected attacks (TP ) divided by the total number of attackdata (TP + FN ).
Assume that IE is the rate of index errors and we use the index to find theclosest cluster of X data items. Then IE ∗ X data items will result in failure tofind the closest cluster.
The index errors then contribute to errors in detection result, in those caseswhere the data is included in the model. As explained previously this is the casefor true negatives, where index errors for normal data included in the model incase of index errors will result in additional false positives. In the case of falsenegatives, the index error will contribute with additional true positives.
The final detection rate and false positives rate in presence of index errors canbe computed as shown below:
DR(IE) =TP
TP + FN+
FN ∗ IE
TP + FN
= DR + (1 − TP
TP + FN) ∗ IE
= DR + (1 − DR) ∗ IE
(5.1)
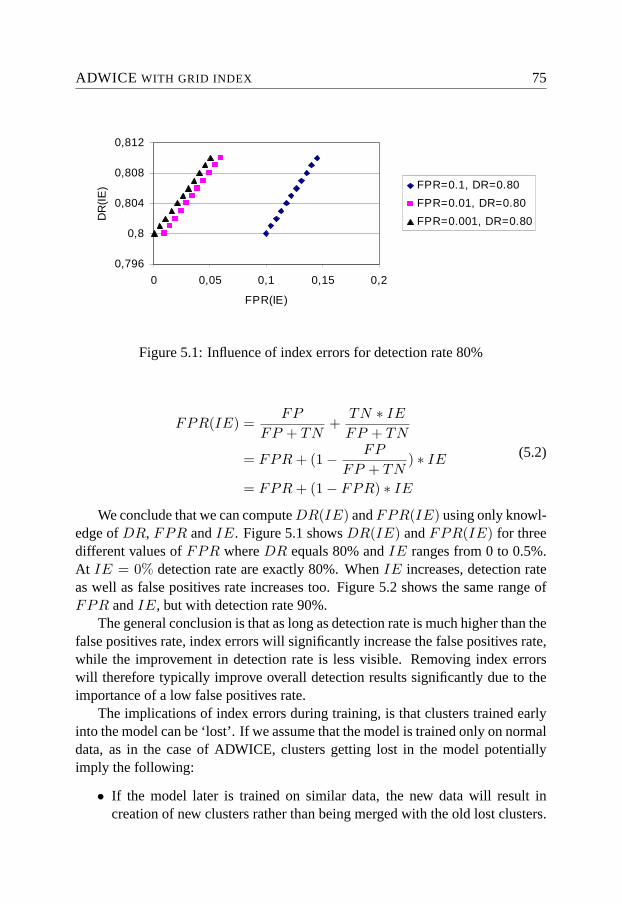
ADWICE WITH GRID INDEX 75
0,796
0,8
0,804
0,808
0,812
0 0,05 0,1 0,15 0,2
FPR(IE)
DR
(IE
) FPR=0.1, DR=0.80
FPR=0.01, DR=0.80
FPR=0.001, DR=0.80
Figure 5.1: Influence of index errors for detection rate 80%
FPR(IE) =FP
FP + TN+
TN ∗ IE
FP + TN
= FPR + (1 − FP
FP + TN) ∗ IE
= FPR + (1 − FPR) ∗ IE
(5.2)
We conclude that we can compute DR(IE) and FPR(IE) using only knowl-edge of DR, FPR and IE. Figure 5.1 shows DR(IE) and FPR(IE) for threedifferent values of FPR where DR equals 80% and IE ranges from 0 to 0.5%.At IE = 0% detection rate are exactly 80%. When IE increases, detection rateas well as false positives rate increases too. Figure 5.2 shows the same range ofFPR and IE, but with detection rate 90%.
The general conclusion is that as long as detection rate is much higher than thefalse positives rate, index errors will significantly increase the false positives rate,while the improvement in detection rate is less visible. Removing index errorswill therefore typically improve overall detection results significantly due to theimportance of a low false positives rate.
The implications of index errors during training, is that clusters trained earlyinto the model can be ‘lost’. If we assume that the model is trained only on normaldata, as in the case of ADWICE, clusters getting lost in the model potentiallyimply the following:
• If the model later is trained on similar data, the new data will result increation of new clusters rather than being merged with the old lost clusters.

76 5.1. PROBLEMS OF THE ORIGINAL BIRCH INDEX
0,896
0,9
0,904
0,908
0 0,05 0,1 0,15 0,2
FPR(IE)
DR
(IE
) FPR=0.1, DR=0.90
FPR=0.01, DR=0.90
FPR=0.001, DR=0.90
Figure 5.2: Influence of index errors for detection rate 90%
This implies that those clusters contain less data points than expected. If thelost data are not evenly distributed around the cluster, the incomplete clus-ter may have smaller area and/or possibly have the cluster centre slightlyrelocated. This means that the cluster possibly does not cover a part of themodel that should be normal, leading to additional false positives duringdetection. In principle a slightly relocated cluster could also influence de-tection accuracy by covering new normal data, not previously included inthe training data. This would actually decrease the false positives. But thiscase is less probable.
• If the model is not later trained on similar data, this will lead to additionalfalse positives if testing data contains such normal data.
The above reasoning shows that it is reasonable to expect that removing indexerrors should improve accuracy. When selecting a search index for use with amodel for anomaly detection, inexact indexes should in most cases be avoideddue to the potential increase of false positives. If inexact indexes are anywaypreferred, it is useful to evaluate how much the index influences accuracy.
The theoretical reasoning cannot easily be used to compute the index error ofa specific algorithm. A sometimes more practical solution is to remove the indextemporarily and use the model without the index and compare the accuracy withand without the index. In the case of ADWICE, changing the branching factorof the index to the maximum number of clusters would result in linear searchremoving the influence of the index. Depending on the algorithm and available

ADWICE WITH GRID INDEX 77
processing power, this may limit the size of the data set that can be used forevaluation.
5.2 The grid-index
Because index errors may potentially decrease detection accuracy, we designed analternative algorithm using a new search index, ADWICE-grid. The requirementsfor the new index are:
• There should be no index errors.
• Adaptation of the BIRCH-index should be preserved (incremental training).
• Performance should be similar to that of the BIRCH-index.
There are two possibilities for handling the adaptation requirement. The indexmay be updated together with the clusters for each change to the model or theindex may be more independent of changes to the model. Since BIRCH followsthe first principle we wanted to explore the second type of index. Minimizingthe need for continuously updating the index, may potentially further improvetraining performance. Rather than guiding the search using cluster summaries,ADWICE-grid divides space into a hierarchy of smaller regions (i.e. subspaces),called a grid.
A subspace of d-dimensional space is defined by two vectors, Max andMin for each dimension, specifying for each dimension an interval or slice. Agrid is a division of space into subspaces. In two dimensions this results in a spacedivided into rectangles. The idea of the new grid index is to use a grid-tree whereeach node specifies a subspace. The subspaces decrease in size along the pathfrom root to leaf, thereby guiding the search. Leaves contain the clusters as in thecase of the original BIRCH index.
The division into subspaces can be done using different schemes:
1. At each level in the tree all dimensions could be divided into smaller slices.The left example of figure 5.3 shows an abstract example of this for a two-dimensional space. Empty (white) subspaces do not need to be representedby leaves in the tree.
2. Alternatively only one dimension is used for slicing at each level of the tree.The right example of figure 5.3 illustrates this.

78 5.2. THE GRID-INDEX
A B C DE F
K L
O P
G H
I J
M N
A BE F
C DG H
K LO P
K L PDF
A B C DE F
K L
O P
G H
I J
M N
B
F
J
N
C
K
O
G
D
L
P
H
K L PDF
Figure 5.3: Alternative grid schemes
At each node in the tree, some computing needs to be done in order to finda path to the closest cluster. Because performance is very important in real-timeintrusion detection, we want the search to proceed as quickly as possible. Slicingusing only one dimension at each level requires less computing than the alterna-tive, and the second grid scheme was therefore selected for evaluation.
Figure 5.4 shows a 2-dimensional grid divided into subspaces together withthe corresponding grid tree using grid-scheme 2 (the tree is further explained be-low). Note that:
• Not all leaf subspaces need to be at the same level.
• Empty subspaces have no corresponding leaf.
Our intuition and experience tells us that such a grid is sparsely populated.This means that suitable programming primitives such as hash tables (rather thanvectors) should be used to avoid empty subspaces taking up space in the indextree.
Before starting with the implementation we tested the performance of theprimitive operations used in an index tree. In case of the BIRCH-index, the prim-itive operation is the distance function computing the Euclidian distance in multidimensional space. A performance evaluation shown in figure 5.5 revealed that ahash function call is 6-15 times faster than one call to the distance function de-pending on the number of dimensions (60-20). Because at each node of the CFtree of BIRCH, up to B (normally set to 10-20) branches may exist, using a hashtable could be 100 times faster when the distance function is applied multipletimes during linear search of a non-leaf node to find the correct child. This meansthat there is room for additional processing with the new index.
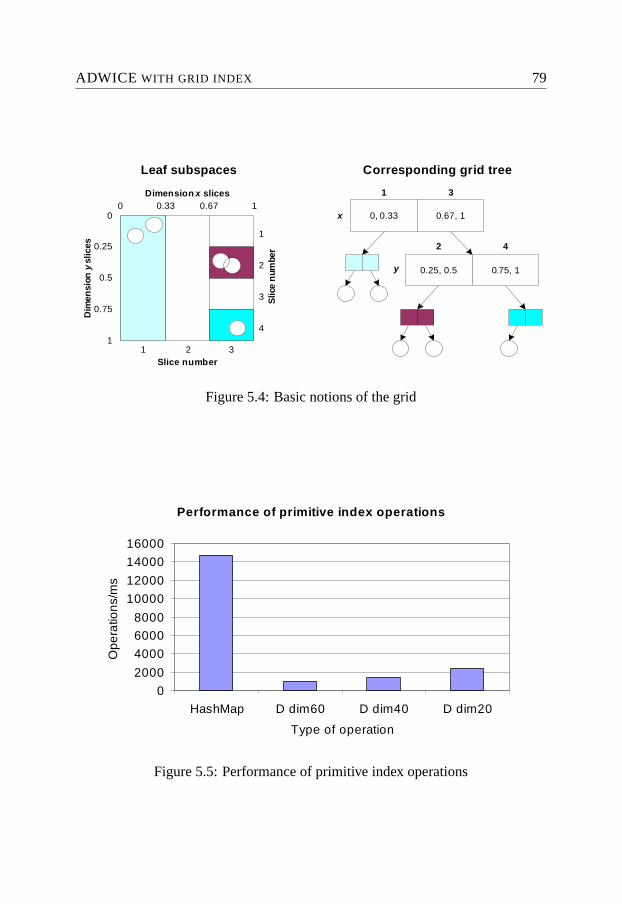
ADWICE WITH GRID INDEX 79
0.33 0.67 100
1
0.25
0.5
0.75
Dimension x slices
Dim
ensi
on y
slic
es
1
2
3
4
Slic
e n
umbe
r
2 31Slice number
0, 0.33 0.67, 1
0.25, 0.5 0.75, 1
x
y
2 4
31
Leaf subspaces Corresponding grid tree
Figure 5.4: Basic notions of the grid
Performance of primitive index operations
0
2000
4000
6000
8000
10000
12000
14000
16000
HashMap D dim60 D dim40 D dim20
Type of operation
Ope
ratio
ns/
ms
Figure 5.5: Performance of primitive index operations

80 5.2. THE GRID-INDEX
Our grid index consists of a grid-tree, which is a sparse, possibly unbalancedtree with three parameters, threshold (T ), leaf size (LS) and maximum number ofclusters (M ). Each dimension i of the d-dimensional space is assumed to have amaximum (Maxi) and a minimum (Mini). These are in practice realised duringfeature extraction for unbounded domains, and lead to the division of the cur-rent dimension i in a certain number of intervals (NumSlicesi) with a certainwidth (SliceWidthi). A slice is one such interval in some dimension. A functiongetSliceDimension(depth) is devised which maps a node depth to onedimension. Each non-leaf node of depth j contains at most NumSlicesi childrenwhere each child of a non-leaf node is an entry in a hash table. The hash table isa mapping from an interval number to a child node.
To find the closest cluster of a new data v in a node with depth j (starting withthe root), we first compute the slice dimensioni =getSliceDimension(j). In the current node we then only consider di-mension i of v. Given the value of v in dimension i (v[i]) the number of theinterval into which v fits is computed. This interval number is mapped to a childusing the hash table. In this way we find our way down to a leaf, where the datais located. In this leaf we may then do linear search among the clusters to find theclosest.
Unfortunately there is a complication that makes the index more complex.There is no guarantee that the closest cluster actually is located in the same leaf asthe data point itself. Merging of a data point with the closest cluster CFi may beperformed if D(vi, CFi) < T . This means that the closest CFi may be locatedinside any of the subspaces reachable within a distance T of the data point v.Accordingly we possibly need to search multiple paths at each node in the tree,depending on the value of T . At each non-leaf node at depth j we compute aneighbour space [v[i] − T, v[i] + T ]. T is the radius (Rns) of this space and thevector v the center. All slices that overlap the neighbour space are searched to findthe closest cluster. Because space is sparse, many slices are not occupied. Sinceonly children for occupied intervals exist as hash table entries, empty intervals donot need to be searched.
One should notice that the number of neighbour subspaces will increase ex-ponentially with the number of dimensions. In practice only a small fraction ofneighbour subspaces is populated with clusters and because multiple clusters arecontained by each leaf in the index tree, many subspaces are not represented bythe index tree. As proved by the evaluation, this makes the search feasible alsofor the case of KDD data where the number of dimensions is as high as 40. How-ever, one may construct data sets where an increasing number of neighbours will

ADWICE WITH GRID INDEX 81
cause performance of search to degrade. The full implications of this remain tobe evaluated and is left as future work.
There exist two cases when the nodes of the grid tree need to be updated:
• If no cluster is close enough to absorb the data point, v is inserted into themodel as a new cluster. If there does not exist a leaf subspace where thenew cluster fits, a new leaf is created. However, there is no need for anyadditional updates of the tree, since nodes higher up do not contain anysummery of data below.
• When the closest cluster absorbs v, its centroid is updated accordingly. Thismay cause the cluster to move in space. A cluster may potentially moveoutside its current subspace. In this case, the cluster is removed from itscurrent leaf and inserted anew in the tree from the root, since the path allthe way up to the root may have changed. If the cluster was the only one inthe original leaf, the leaf itself is removed to keep unused subspaces withoutleaf representations.
Compared to the continuously updated original BIRCH index, the need forgrid index updates are very limited, because the first case above requires onlyinsertion of one new leaf, and the second case occurs infrequently.
In case of a split of a leaf, the original leaf is transformed to a non leaf node.The new node computes its split dimension according to its depth in the tree, andthe clusters of the original leaf are inserted in the new node resulting in creationof leaves as children to the node.
The getSliceDimension(depth) should be defined manually or auto-matically according to properties of the input data to avoid a tree with a largedepth. For example, if all data have the same or almost the same value in a certaindimension, this dimension is not useful for slicing, since the depth of the tree willincrease without distributing the clusters into multiple children.
In most cases not all dimensions need to be used for slicing (thus limiting theheight of the tree), assuming that the function getSliceDimension(depth)is selected appropriately. However, if the situation arises that all dimensions havebeen used for slicing, and still the number of clusters to be inserted does notfit in one leaf due to the limited leaf size (LS), then the LS parameter for thatleaf can be increased, affecting only that leaf locally. This is the approach thatour current implementation adopts. An alternative or complementary approach tohandle this situation is to rebuild the tree using a smaller width of the intervals foreach dimension.

82 5.3. ADAPTATION OF THE NORMALITY MODEL
5.3 Adaptation of the normality model
5.3.1 Incremental training
As described earlier, agents need to adapt in order to cope with varying LCCI con-ditions including changing normality. Here we describe two scenarios in whichit is very useful to have an incremental algorithm in order to adapt to changingnormality.
In some settings, it may be useful to let the normality model relearn au-tonomously. If normality drifts slowly, an incremental clustering algorithm mayhandle this in real-time during detection by incorporating every test data classi-fied as normal with a certain confidence into the normality model. If a slowerdrift of normality is required, a random subset of encountered normal data basedon sampling could be incorporated into the normality model.
Even if autonomous relearning is not allowed in a specific network settingthere is need for model adaptation. Imagine that the ADWICE normality modelhas been trained, and is producing good results for a specific network during de-tection. At this point in time the operator recognises that normality has changedand a new class of data needs to be included as normal. Otherwise this new nor-mality class produces false positives. Due to the incremental property, the opera-tor can incorporate this new class without the need to relearn the existing workingnormality model.
In neither case there is need for retraining the complete model or to take themodel off-line. The operator or agent may even interleave incremental training ofindividual or small sets of new training data with detection. This means on-linetraining requires additional processing power, but does not require that detectionis stopped.
5.3.2 Forgetting
Incremental training of ADWICE corresponds to extending the model with addi-tional training examples as discussed above. Old clusters will obtain more datamembers and this may cause the clusters to move or grow if the threshold is in-creased and new training data is similar to existing clusters. The size of the model,corresponding to the number of clusters, will remain the same as no new clustersare created, due to the representation in form of cluster summaries.
In cases where new training data differ more significantly from the old model,new clusters will be created. If this continues over time, the threshold will beincreased until the model is too general. If M is increased when needed to avoid a

ADWICE WITH GRID INDEX 83
too general model, the model may at least in theory grow very large after extendedperiods of time which may also become a problem. Additionally, normality doesnot only change by the appearance of new types of data. Old services will stopbeing used, users may no longer have access to the system and old hosts may beremoved from the network. Such events cause normality to decrease. Some typesof data will simply not be present any more.
Should data that once where present in the system, but that is not presentanymore still be part of the normality model? In most cases no. For example,a user is getting a new working position in another company. Some time passesand then data corresponding to that user is again present in the system. This maycorrespond to the user herself misusing old credentials, or another person using aninactive account. Or maybe less probable, the user has returned to her old workingposition. If the normality model still incorporates the data corresponding to theuser, misuse of her previously inactive account will not be detected.
To adjust the model for such changes and to prevent the model to becometoo general or from growing indefinitely in case of incremental training, there isneed for a removal of subsets of the model. We use the term forgetting becausethe process resembles to the forgetting in the human brain. Unless memory isreinforced, it often fades over time until it is forgotten completely or becomesvery hard to recall. Reinforcing in the case of ADWICE, corresponds to using acertain cluster. Using in this setting correspond to one of the following events.
• During training, new training data was inserted into the cluster.
• During detection, encountered data was close enough to the cluster to beclassified as normal.
Based on the notion of cluster usage, rules can be defined when to forgetor fade out subsets of the model. In our initial implementation of forgetting eachtime a cluster is used it receives a tag with the current time. Periodically the modelwill be checked for unused clusters. If the time since last usage is longer than athreshold, the cluster will be removed from the model. Two parameters are usedin the current implementation. CheckPeriod specifies how often forgetting willtake place. RememberPeriod specifies for how long unused clusters will remainin the model. Those parameters need to be set by the operator.
In the final chapter of this thesis we will discuss alternative approaches toforgetting.

84 5.4. EVALUATION
0,75
0,8
0,85
0,9
0,95
1
0,015 0,02 0,025 0,03 0,035False positives rate
Det
ectio
n ra
teADWICE-TRR ADWICE-TRD ADWICE-Grid
Figure 5.6: Detection rate versus false positives using ADWICE-grid
5.4 Evaluation
5.4.1 Detection rate versus false positives rate
The grid index is expected to reduce the number of false positives, as implied bythe analysis in section 5.1.1. Figure 5.6 confirms this, as ADWICE-grid improvesthe false positives rate from 2,5% to 2,2% at 92% detection rate.
5.4.2 Incremental training
To evaluate the incremental training of ADWICE we treat an arbitrary abnormalclass as normal and pretend that the normality model for the KDD data should beupdated with this class. Without loss of generality we choose the IP sweep attacktype and call it ‘normal-new’; thus, considering it a new normal class detectedby the operator. The model only trained on the original normal data will detectthe normal-new class as attack, since it is not included in the model. This pro-duces ‘false positives’. The old incomplete normality model is then incrementallytrained with the normal-new training data producing a new normality model thatincorporates the normal-new class. Our evaluation showed that (without aggrega-tion) the old model produced 300 false positives, whereas the new retrained modelproduced only three.
An important point of this work is that the original model, known to trulyreflect recent normality, does not need to be retrained as soon as new cases ofnormality are encountered. We evaluate this on data generated in the Safeguardtest network. The three days of training data is used to train an initial model whichis then used for detection on the seven days of testing data. When certain types

ADWICE WITH GRID INDEX 85
Alarms for host x.x.202.183
0
2
4
6
8
10
12
0 20 40 60 80 100 120
Number of 2 hour pe riods from start of testing
Nu
mb
er o
f al
arm
s
original model
incremental 1
incremental 2
Figure 5.7: Adapting using incremental training
of traffic (new cases of normality) start producing false alerts the operator maytell ADWICE to incrementally learn the data causing those alerts to avoid similarfalse alerts in the future. Figure 5.7 shows alerts for host x.x.202.183 in threescenarios. Period number 1 starts at time 2004-03-11 00:00 (start of testing data)and each two-hour period presents the sum of alerts related to host x.x.202.183during the corresponding time interval. At 2004-03-14 12:00, corresponding toperiod number 43, the host is connected to the network.
In the first scenario, no incremental training is used, and the testing is per-formed on the original model. This corresponds to the first curve of figure 5.7.We see that when the host connects, ADWICE starts to produce alerts and thiscontinues until the testing ends at period 102.
In the second scenario the operator recognises the new class of alerts as falsepositives. She tells ADWICE to learn the data resulting in those false alerts attime 2004-03-14 17:55 (end of period 45). The second curve shows that manyof the original false alerts are no longer produced. However, at regular intervalsthere are still many alerts. Those intervals correspond to non-working hours.
In the third scenario incremental training is done in two steps. After the firstincremental training 2004-03-14 a second incremental training is initiated at 2004-03-15 07:55 (end of period 52) when the operator notices that false alerts relatedto host x.x.202.183 are still produced. Figure 5.7 shows how almost all alerts nowdisappear when the model is updated for the second time.
The need for the two-step incremental learning arouse since the model differsbetween working hours and non-working hours. The alerts the operator used forinitial incremental training were all produced during working hours (2004-03-1412:00 -2004-03-14 17:55).

86 5.4. EVALUATION
Alarms for host x.x.202.73 port 137
012345
0 20 40 60 80 100 120
Number of 2 hour periods from start of testing
Nu
mb
er o
f ala
rms
forgetting
no forgetting
Figure 5.8: Adapting using forgetting
5.4.3 Forgetting
In this section we illustrate the use of forgetting. A model is trained on tree daysof data and is then used for detection with and without forgetting on the follow-ing seven days of data. Figure 5.8 shows alerts for one instance of traffic (hostx.x.202.73, port 137) that ceases to be present in the (normal) testing data, makingthat kind of traffic anomalous. With forgetting this fact is reflected in the normal-ity model. In this experiment a CheckPeriod of 12 hours and RememberPeriod of3 days (72 hours) are used.
When traffic from host x.x.202.73 on port 137 is again visible in data (periods55-66) the traffic is detected as anomalous. Without forgetting these anomalieswould go undetected.

CLUSTERING HYBRID DETECTION AGENT 87
Chapter 6
Clustering hybrid detection agent
This chapter describes the design and implementation of the Clustering HybridDetection Agent (CHDA), an instance of the hybrid detection agent, introducedin the Safeguard architecture in section 3.2.3. The primary purpose of CHDA isto perform anomaly detection and send alerts concerning suspicious activity to acorrelation agent for aggregation and further processing.
Figure 6.1 shows an overview of the main components related to the CHDA.Tcpdump1 is sniffing the network. Tcpdump filters are applied so that Tcpdumponly outputs UDP and TCP binary data. The Tcpdump output is processed by thePreprocessor into feature vectors, where each feature vector contains basic data ona single TCP connection or UDP packet. The feature vector file is then processedby the CHDA which reports anomalies to a correlator agent.
Files are used to move data between Tcpdump, the Preprocessor and theCHDA because it is fast and simple. Also since data is stored on disk, it is easy tosave data for later and to do off-line experimenting on old data.
As long as the agent works on the level of sessions rather than individualpackets the agent needs to wait until a session is ended before doing detection.The hardest performance requirements will then be on Tcpdump itself and thePreprocessor handling Tcpdump data. If data flow increases, the time to detectionmay increase due to the processing of the Preprocessor and Tcpdump may start tolose packets. This resides outside the agent itself.
1Tcpdump is a program that prints network packets that match a boolean expression.

88 6.1. DESIGN
Clustering HDA
TCPdump
FileBinary IP -packets (TCP and UDP )
Feature vectors
Parsing, Cleaning , Feature
computation
File
Preprocessor
Network sniffingFiltering
Correlator Agent
NormalisationAnomaly Detection
Figure 6.1: Data flow of CHDA
6.1 Design
The main modules of the CHDA agent are presented here. Figure 6.2 illustratesthe main data flows between the modules. The picture shows the use of SAP(Safeguard Agent Platform) for communication, but alerts can also be written toa data base or file. In the following sections each module will be described infurther detail.
• DataSource is the interface between the agent and the output of the Pre-processor.
• DataBuffer is buffer where DataSource thread writes data. The buffer isneeded to avoid delays caused by the data source.
• Transformer is responsible for normalisation and feature selection. TheTransformer is also responsible for creating alerts.
• AnomalyDetector performs anomaly detection.
• SignatureDetector performs signature-based detection.

CLUSTERING HYBRID DETECTION AGENT 89
Clustering HDA
AnomalyDetector
Alerts to Correlator
Config
Config from Correlator
DataSource
DataBuffer
Connection records
Transformer
SignatureDetector
SAP Interface
Transformer
Logger
Figure 6.2: CHDA design
• Config handles configuration of the agent. Configuration was not im-plemented as a separate module, but rather cross-cutting the other mod-ules. The introduction of the Module interface presented in section 6.1.7improved the design.
• Logger handles logging.
6.1.1 Preprocessor
The Preprocessor is responsible for taking Tcpdump output and producing a for-mat suitable for the CHDA. In the Safeguard prototype the Preprocessor is imple-mented as a number of Perl-scripts due to Perl’s flexible text-processing features.
The output of the CHDA Preprocessor is a basic feature vector file whichcontains features computed out of a single TCP connection or one UDP packet.

90 6.1. DESIGN
A discussion with security personnel led to the selection of the following basicfeatures to be computed by the Preprocessor:
• The start-time of the connection.
• The end-time of the connection.
• The connection length in milliseconds.
• The protocol type (UDP or TCP).
• The source IP address.
• The destination address.
• The source port.
• The destination port.
• The number of bytes transferred to the destination.
• The number of bytes transferred to the source.
• A flag, indicating if the connection was ended legally using a FIN flag ornot.
All features are based on information available in the IP header. This deci-sion was made to minimize processing time, and avoid the non-trivial problem offeature computation for the non-structured information of packet content.
For certain attacks, such as denial of service and scanning attacks, it is inter-esting also to compute statistics over time, related to many different TCP connec-tions or UDP packets. Such high level features could be computed periodicallyout of the basic feature vectors. The KDD data set described in section 4.4 in-cluded a number of high level features computed over two seconds for example.To minimize the time to compute basic feature vectors, high level feature vec-tors could be processed by a separate Preprocessor as well as a separate agent.In the prototype no high-level feature vector was included. Figure 6.3 gives anoverview of the CHDA Preprocessor and the possible extension with high levelfeature computation.
To increase performance, data is to be filtered as close to the source as pos-sible. The Tcpdump filters are used to filter away duplicate traffic from differentsubnets and other data not to be included in the CHDA model.

CLUSTERING HYBRID DETECTION AGENT 91
Clustering HDA
Preprocessor
Basic Feature Vector File
Parser
TCPDump binary file
Cleaning
Basic Feature Computation
HL Feature Computation
HL Feature Vector File Clustering HDA 2
Clustering HDA 1
Future Work
Figure 6.3: CHDA Preprocessor

92 6.1. DESIGN
Host 65TcpDump
Parser
subnet
Host 77TcpDump
Parser
subnet
Host 78TcpDump
Parser
subnet
Host 114Hybrid
Detector AgentAlert Reduction
Correlation Agent
SSHSSH SSH
Figure 6.4: Remote data sources
6.1.2 DataSource
DataSource is used for retrieving data from the Preprocessor. The motivation tohave a separate Java interface is to simplify future changes to data retrieval. Theimplementation used in the Safeguard context is RemoteHostsDataSource whichuses SSH to read session files from an arbitrary number of hosts, merging sessionsbased on time stamps. Remote access is needed, since data is produced in multiplesubnets and the agent is located in the special Safeguard zone subnet. Figure 6.4illustrates remote data access.
When the agent is started, the DataSource class starts looking for one or morefeature vector files. Feature vectors represented as strings are input into the Data-Buffer.
During agent initialisation, a separate DataAquirer thread is started. Internallyit accesses a DataSource interface to acquire data, which is then put into the Data-Buffer. When there is no data available, the DataAquirer will sleep. If there is nodata available for a long time, the thread will notify the main agent thread.
The DataSource interface has only one method:
• String getData() - Returns one data item from the data source.

CLUSTERING HYBRID DETECTION AGENT 93
6.1.3 DataBuffer
The DataBuffer is a passive synchronised first in first out buffer used by theDataAquirer thread and the main thread of the agent. The interface has the fol-lowing methods:
• putData(String data) - Add one data item to the end of the buffer.
• int getNumberOfData() - Return the number of data items currentlyin the buffer.
• String[] getData() - Return and remove the first data item in thebuffer.
• String[] peekData() - Return a copy of the first data item in thebuffer.
• removeData() - Remove the first data item from the buffer.
6.1.4 Transformer
The Transformer transforms string arrays available in the DataBuffer to Instance-objects suitable for feeding the detector modules. It performs feature selection andnormalisation. What features to select as well as maximum and minimum valuesfor the features need to be supplied in the CHDA configuration file. In additionthe Transformer will construct an Alert object upon request. The Transformer isa passive entity used only by the main thread of the agent providing the followingmethods:
• Instance transform(String[] data) - Transforms one datastring into the internal representation object called Instance.
• Alert constructAlert(String[] data, int belief) -Construct an Alert object including belief, which is a measure of anomalyfor the data item. The data should be understandable by human operatorsand possible to correlate with alerts from other agents. The alert musttherefore be constructed using the original data, such as IP addresses andports, rather than the internal representation (i.e. the Instance object).
• Alert constructAlert(String[] data, ADResult r)- Constructs an alert using an ADResult object. ADResult objects isproduced by the AnomalyDetection module during detection and includes

94 6.1. DESIGN
a message for the operator as well as the anomaly belief. The message tothe operator can for example state what features contributed most when thedata was rated as anomalous.
There are multiple implementations of the interface including Transformersfor:
• The KDD data set.
• The Safeguard prototype.
• 2 dimensional numerical data for testing and illustrating clustering.
Using the CHDA agent to process other types of data (e.g. host-based datarather than network connections) is very simple. Only a corresponding implemen-tation of the Transformer is required. Of course this assumes that the alternativedata has already been pre–processed into feature vectors which may be more orless complex.
6.1.5 AnomalyDetector
This is the main module of the agent, performing anomaly detection. The moduleworks in either training or testing mode. It takes Instance-objects as input. Intraining mode it only updates the internal model without giving any output. Intesting mode it returns the anomaly belief which is a measure on how anomalousthe data is. It may also return a message for the operator further describing theanomaly. The AnomalyDetector is a passive entity used only by the main threadof the agent and provides the following methods:
• void setTrainingMode(boolean trainingMode) - Set train-ing mode on/off. This method provides the anomaly detection engine apossibility to perform processing to prepare the model to work in a newmode. For ADWICE such a mode change is transparant and requires noextra processing except for non-mandatory logging.
• boolean isTrainingMode() - Return true if training mode is set.
• void setSensitivity(double sensitivity) - Set the sensi-tivity of the model. Decreasing sensitivity will decrease false positives rateat the cost of decreasing detection rate and vice versa.
• double getSensitivity() - Return the sensitivity of the model.
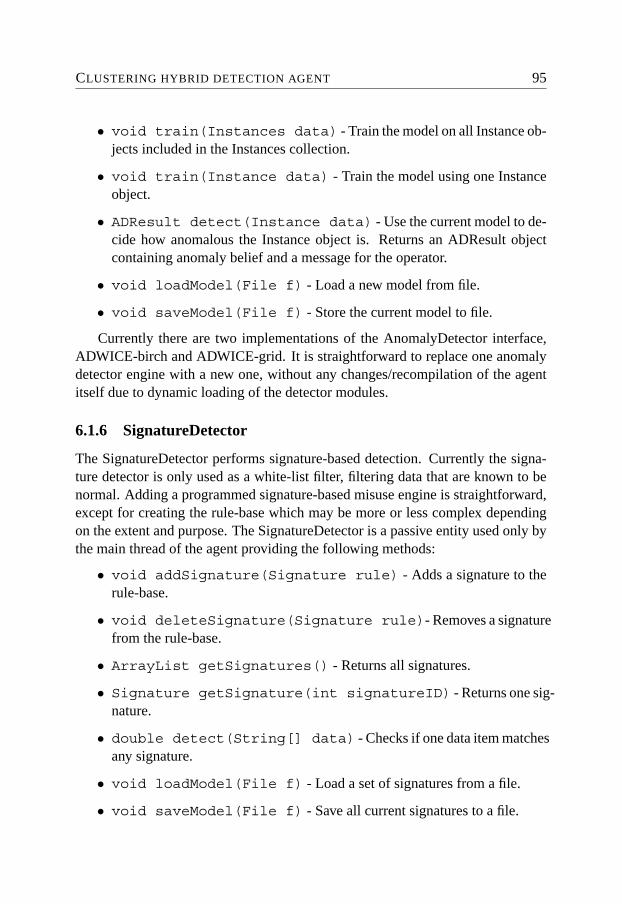
CLUSTERING HYBRID DETECTION AGENT 95
• void train(Instances data) - Train the model on all Instance ob-jects included in the Instances collection.
• void train(Instance data) - Train the model using one Instanceobject.
• ADResult detect(Instance data) - Use the current model to de-cide how anomalous the Instance object is. Returns an ADResult objectcontaining anomaly belief and a message for the operator.
• void loadModel(File f) - Load a new model from file.
• void saveModel(File f) - Store the current model to file.
Currently there are two implementations of the AnomalyDetector interface,ADWICE-birch and ADWICE-grid. It is straightforward to replace one anomalydetector engine with a new one, without any changes/recompilation of the agentitself due to dynamic loading of the detector modules.
6.1.6 SignatureDetector
The SignatureDetector performs signature-based detection. Currently the signa-ture detector is only used as a white-list filter, filtering data that are known to benormal. Adding a programmed signature-based misuse engine is straightforward,except for creating the rule-base which may be more or less complex dependingon the extent and purpose. The SignatureDetector is a passive entity used only bythe main thread of the agent providing the following methods:
• void addSignature(Signature rule) - Adds a signature to therule-base.
• void deleteSignature(Signature rule)- Removes a signaturefrom the rule-base.
• ArrayList getSignatures() - Returns all signatures.
• Signature getSignature(int signatureID) - Returns one sig-nature.
• double detect(String[] data) - Checks if one data item matchesany signature.
• void loadModel(File f) - Load a set of signatures from a file.
• void saveModel(File f) - Save all current signatures to a file.

96 6.2. LIFE CYCLE
6.1.7 Module
All modules of the CHDA agent need to be initialised, reconfigured and logged.Rather than handling each module individually, we abstract away their primaryfunctionality and consider them as generic modules whenever possible. The Mod-ule interface provides the following methods, implemented by all major modulesof the agent:
• void init(Properties props, Logger log) - Handles initial-isation of the module. The method is called by the owning object before theexecuting thread is started.
• void start() - Prepares the module for use, called by the executingthread before calling other methods of the module.
• void reconfigure(Properties props, Logger log) - Re-configures one or many properties of the module and may reset the Logger.
• void stop() - Cleans up the module and closes resources.
• void logStatistics(Logger log) - Logs current statistics of themodule to the given Logger.
• void logProgress(Logger log, long prev, long now) -Logs module progress. Called periodically.
• void collectStats(Vector statNames, Vector stats) -Returns all statistics collected by the module.
• String getName() - Returns the name of the module.
6.2 Life cycle
The CHDA is implemented in Java and should be able to run on any platform sup-porting Java 1.4. Offline testing of the agent using stored data files may thereforebe performed on any computer with as least Java version 1.4.
For online training or testing the system running the agent needs also to sup-port Tcpdump and the CHDA Preprocessor. Therefore the primary target plat-forms are Unix and Linux.
CLUSTERING HYBRID DETECTION AGENT 97
6.2.1 Startup process
The CHDA agent and related processes are executed through a start-up script:
• Initial configuration is read from a file. Some parameters are possible tochange later via messages from other agents to the running CHDA, otherswill need to be fixed during execution.
• The Preprocessor is started, reading from the latest available Tcpdump dataunless otherwise specified.
• A new Tcpdump process is started with suitable flags set sniffing data ac-cordingly.
When the agent is instantiated the following events take place:
• Initial configuration is read from file
• Modules such as DataBuffer, AnomalyDetector and DataSource are dynam-ically instantiated based on the initial configuration read from file.
• Initial detector models are loaded from files, if such model files exist.
• The DataAcquirer thread is instantiated.
It would be easy to start up multiple instances of the CHDA agent, even on thesame host, due to the agent paradigm. Different instances could process differenttypes of data, or be used to share the load executing on multiple hosts if the dataflow is too large to be handled by one agent and host.
6.2.2 The main loop
The main loop of the agent consists of:
• If there are messages waiting (e.g. reconfiguration), those are handled.
• If there are data available in the DataBuffer, detection/training (dependingon mode) is performed on one data instance.
• If there are alerts ready, those are sent to the configured receiver, normally acorrelation agent. If a receiver is not available, the alerts are stored locally.

98 6.2. LIFE CYCLE
• If forgetting is enabled, the detector modules are told using a reconfigu-ration method call, to look for unused subsets of their models and forgetthose.
• If there are no messages or data instances available, the main agent threadwill sleep for a few milliseconds.
In parallel the DataAquirer thread will try to access data from its data sourcesand store them in the DataBuffer.
The agent could have had a more parallel structure with for example a thirdthread handling communication. This was considered unnecessary since the agentonly provides two basic services, detection and reconfiguration. Reconfigurationmay not be done on the anomaly engine during detection even if using separatethreads for this. The DataSource module is executed by the separate DataAquirerthread to decouple the agent from delays related to the data source. Data will notalways arrive at a constant rate.
Note that it is possible to quickly switch to training mode while performingdetection, adapt the model by training on one or a few additionally known dataitems, and switch back to detection mode without significantly delaying detection.This is possible since the anomaly detection model using ADWICE is completelyincremental.
6.2.3 Shut down process
When the agent is shut down the following events take place:
• Ongoing work is finished with the last message or data instance currentlyprocessed.
• All remaining alerts are sent. If the receiver is not available, the alerts arestored locally.
• The DataAcquirer thread is stopped.
• All Detector models are saved.
• The main thread returns.

CLUSTERING HYBRID DETECTION AGENT 99
6.3 Performance and scalability
The theoretical training and detection time of ADWICE using the index of BIRCHis n ∗ log c where n is the number of input data and c is the number of clusters.Because c << n this time is close to linear. In practice, the overhead of dataaccess and agent processing need to be taken into account.
During our experiments we concluded that the agent was able to process 1 400to 1 900 session records per second. This was the case when data were read from asingle local file and using a model size of 12 000 clusters. During the experimentsthe agent was executing on a host with a Pentium 4 1,8 GHz processor with 512MB memory.
In the Safeguard network multiple network sniffers where used as illustratedby figure 6.4 in section 6.1.2. Because one agent needs information from multiplehosts, remote data access have to be used. If the hosts at which the sniffers exe-cuted would be overloaded, the sniffers would start dropping packets and attackscould pass by without detection. Executing the agent on its own host, avoids thedanger of having the agent sharing processing resources with a sniffer. The down-side of this setup is the additional time required to process data. When accessingmultiple files remotely encrypting traffic using SSH, the performance decreased,resulting in about 500 session records processed each second.
Considering this is a first prototype implementation and that the parallel re-mote data access of multiple files is quite intricate, the obtained performance isgood. In addition it was enough for keeping up with the data rate in the safe-guard test network, with hundreds of session records produced per second duringevaluation.
The current implementation is not optimised in any way to increase perfor-mance. Some possibilities for improving performance include:
• Reduce the amount of logging currently used for evaluation purposes.
• Redesign the agent and algorithm implementation now when the implemen-tation has stabilised somewhat.
• Keep the connection between the agent and the data source open, ratherthan setting up new SSH connections periodically.
• Split the agent into multiple instances sharing the load.
• Add more processing power and memory.

100 6.3. PERFORMANCE AND SCALABILITY
• Consider alternative methods of data access. Splitting the agent into mul-tiple instances would for example remove the need for accessing multipleremote files in parallel.
• Improve the performance of the algorithm used, for example by splittingthe model in smaller subsets, thereby reducing the time used to search themodel. We will discuss this further in the final chapter of the thesis.
The linear time for training the model and the use of compact cluster sum-maries make the algorithm very scalable. We have trained models on millions ofsessions, resulting in model sizes ranging from 5 000 to 60 000 clusters withoutscalability problems.

RELATED WORK 101
Chapter 7
Related work
This chapter discusses how Safeguard and ADWICE relate to other research in thearea of intrusion detection. We start by describing a number of interesting agentarchitectures and compare those to the Safeguard architecture in section 7.1. Insection 7.2 we change the focus to learning-based intrusion detection.
7.1 Agents for intrusion detection
This section briefly presents architectures and systems utilising agents for intru-sion detection. The benefits of using agents in this setting have been briefly pre-sented in section 3.2.1. Unlike the approaches presented below, Safeguard takesa much wider view. In addition to attacks, Safeguard aims to defend also againstfailures. Also, not only traditional communication networks are considered, butalso the power domain, aiming to apply similar techniques across the differentdomains.
AAFID
AAFID [106](Autonomous Agents For Intrusion Detection) is a distributed intru-sion detection system and architecture developed at Purdue University. AAFIDwas the first architecture to propose the use of autonomous agents for intrusiondetection. Similar to the Safeguard architecture, there is a hierarchy of entities.Filters give agents access to various data sources providing a subscription basedservice of data selection and data abstraction. Agents receive data from local fil-ters searching for intrusions and generating reports to the transceiver on the localhost. Agents may be simple and specialised or large and complex, but they do not

102 7.1. AGENTS FOR INTRUSION DETECTION
have the authority to generate alerts, that is the task of higher level entities like thetransceivers or monitors. One transceiver is executing on each host, collecting andprocessing reports from agents and redistributing them to other agents or moni-tors. Transceivers also control the local agents. Monitors are the highest-levelentities in the architecture. Unlike transceivers they can control entities executingon many different hosts. They receive information from transceivers and lowerlevel monitors and detect events that involve multiple hosts. Monitors may alsocommunicate with one or more user interfaces.
Most agent architectures today are developed in Java, but AAFID was imple-mented using the programming language Perl [89]. During the project some of thedisadvantages of Perl at that time were discovered, including big resource usage,lack of strict type checking and security problems.
Micael
Micael [33] is an intrusion detection architecture implemented using IBM Aglets[107] and Java. The architecture is developed at Universidade Federal do Rio deJaneiro in Brazil and makes use of mobility, unlike the AAFID and the Safeguardarchitecture.
The head quarter agent centralises the system’s control functions, maintainscopies of other agent’s executable code and is responsible for agent creation. Thehead quarter agent does not normally move, but may do so if the load of the localhost is very high or if the host is compromised.
Sentinels are agents that remain residents in each of the protected hosts, col-lecting information. If an arbitrary level of anomaly is detected, the agent requeststhat the head quarter creates a detachment agent that travels to the anomalous host.Depending on the type of anomaly, a specific detachment agent will be selectedto verify with greater detail the anomaly and if appropriate perform counter mea-sures.
Periodically the head quarter may create an auditor agent that will travel be-tween hosts and check the integrity of other agents in the system. The auditoragent uses precompiled internal checksum tables, and may request that missingsentinels are restarted by the head quarter.
SANTA
SANTA (Security Agents for Network Traffic Analysis) presented by Dasguptaand Brian [32] is another project using the IBM Aglets platform [107]. Santa is

RELATED WORK 103
developed by ISSRL (Intelligent Security Systems Research Laboratory) at Mem-phis University. Four types of low-level monitoring agents are presented. Theydetect deviations at packet, process, system and user level by learning a model ofnormal behaviour using neural networks. The monitor agents send their reports tothe communicator agents, a builtin agent type in the Aglets agent platform, thatwill in turn inform the decision/action agents. Each decision/action agents has afuzzy controller, representing five severity levels using five corresponding fuzzysets. The threat level reported by the monitor agents will be used to decide uponthe fuzzy membership of those sets. If the threat level are medium-high or high, akiller agent will be dispatched, killing the responsible process. If the threat levelis lower, a helper agent will provide status information to the graphical interface.The killer agent will also dispatch a helper agent to provide information about thehandled threat.
CIDS
CIDS [31, 67] (Cougaar-based Intrusion Detection System), is an agent-based in-trusion detection system also presented by ISSRL, using the Cougaar [29] agentplatform and Java. In CIDS a security node consists of four different agents. Themanager agent is responsible for giving commands and providing feedback toagents. The monitor agent detects anomalies on the packet, process, system anduser level. The anomalies are reported to a decision agent that uses three decisionengines, including one based on known attacks and one based on fuzzy inference.Each engine generates a bid with a corresponding action, and the action with thelargest bid is selected and forwarded to the action/response agent. One can con-clude that the functionality of the four monitor agents in the SANTA system hasbeen merged into one and that the combined decision/action agent has been splitinto separate agents while adding additional functionality like the three decisionengines. The action agent will build an IDMEF (see section 2.2.1) object, describ-ing the current anomaly, the probable cause and the proposed action. The IDMEFobject will then be presented to the operator through a separate user interface.
Experiments using an Nmap1 port scan and a user to root (see section 2.1.1)attack are presented, and detected utilizing the agents. Multiple security nodesmay exist in a network, each consisting of the above four agents and communi-cating through the manager agent. This level of the architecture is not evaluated.
Unlike the Safeguard architecture there is only one monitor agent responsiblefor collecting information from various data sources. Some data sources may pro-
1Nmap (Network mapper) [86] is a free open source utility for network exploration or securityauditing.

104 7.1. AGENTS FOR INTRUSION DETECTION
duce a large amount of information in a short time, especially network traffic. Inthe Safeguard implementation a separate agent is normally responsible for eachdata source. In this way data from each data source can be reduced before correla-tion between separate data sources. The Safeguard solution will reduce the risk ofinformation overload and performance problems at low levels in the architecture.
Compared to the agent hierarchies of AAFID and Safeguard, it is unclear howmultiple security nodes of CIDS should be organised when large numbers areneeded to protect many hosts in larger networks. It is also not discussed how andwhat information the manager agents should share.
PAID
Gowadia et al [54] from University of South Carolina present PAID, a probabilis-tic agent-based intrusion detection system. The idea is that agents should sharetheir knowledge. This is implemented using Bayesian Networks [61], where eachagent has three sets of variables. The input set are those variables of which otheragents have better knowledge and the local set are used only internally. Finally theoutput set are those variables of which the agent has the best knowledge, whichmay in turn be shared with other agents by exchanging messages. The Bayesiannetworks in the current implementation are built by a domain expert, and theprobabilities are assessed manually. It is assumed that the graph of agent commu-nication corresponds to a tree, implying equilibrium will be reached and globalconsistency is assured. How this tree of agents should be organised for large net-works is not specified.
PAID supports three types of agents. The system-monitoring agents performonline or offline processing of log data, communicate with the operating sys-tem and monitor system resources. Each intrusion-monitoring agent computesthe probability for one specific intrusion type. Those agents subscribe to vari-ables and/or beliefs published by system monitoring agents or other intrusion-monitoring agents. As an agent receives new information, its beliefs are updatedaccordingly. The main IDS agent is a singleton agent that supervises the workingof the entire system and provides results to the user.
The agent system is now being implemented using the JADE [68] agent plat-form and Java. The directory facilitator (see section 2.3.1) of JADE is responsiblefor maintaining information about the published variables and monitored intru-sions.
Multi-agent systems require agents to share information to reach a commongoal. In Safeguard and many other approaches, this information often consists ofhuman readable messages, like intrusion detection alerts. In the case of PAID,

RELATED WORK 105
messages are more closely related to the internal model of the agents which re-duces the need for each agent to process the message before using the information.On the other hand, this type of message representation builds on the assumptionthat all agents use the same type of model which is not the case of Safeguard andmany other agent systems with heterogeneous agents.
A denial of service resistant architecture
Mell et al [81] at NIST (National Institute of Standards and Technology) proposean agent-based intrusion detection architecture that is resistant to flooding denialof service attacks. In their model an enterprise network is built using multiple do-mains connected by the enterprise bus. Each domain consists of a number of re-gions, connected by a backbone. The backbone is assumed to consist of machinessecured from penetration including firewalls, routers, switches and hardened se-curity devices like IDSs. Critical hosts in the backbone house agents performingintrusion aggregation, analysis and control. One central idea is to limit the infor-mation the attacker may gain by attacking the individual regions. The IDS sensorslocated in the vulnerable regions are not allowed to connect directly to the agentsin critical hosts. Rather a proxy agent is used. By allowing agents to move insidea set of critical hosts, and inside a set of proxy hosts, the IDS will be a movingtarget for the attacker. Also, the critical hosts will ignore network traffic if notcoming from specific IDS sensors, limiting the information that can be gained byscanning the network. Because there is no communication directly from the vul-nerable region to the critical hosts, the attacker can not target an attack directlytowards critical hosts, and will only have knowledge of a subset of proxy hosts.
Each domain should function as a standalone IDS. Even if the enterprise bus isattacked, in many cases corresponding to the Internet, each domain will continuefunctioning and a DoS attack will be stopped at the domain fire wall. If a criticalagent is attacked even though it is not visible, backup agents should be present totake up its responsibility. Agents can also move away from an attacked host.
Safeguard handles the threat of denial of service attacks against the IDS by let-ting higher level Safeguard agents execute in a separate hardened network. Simi-lar to the work by Mell et al, it is necessary that host-based sensors reside in themore vulnerable regions to access local data. However, disabling local sensorswill only reduce the information available to higher level agents. A missing agentwill soon cause an alert to be raised, due to missing heartbeat messages in the caseof Safeguard.

106 7.1. AGENTS FOR INTRUSION DETECTION
IDA
IDA (Intrusion Detection Agent System) [6, 7] is an intrusion detection systemdeveloped at the Information-technology Promotion Agency (IPA) in Japan usingthe D’Agents platform [56]. It is a host-based IDS, primarily intended to detectintrusions that deprive root privileges in Unix.
At every protected host, sensors are monitoring system logs in search ofMarks Left by Suspected Intruder (MLSI). The MLSIs used in the presented workare root shell start-up and modification of critical files for local attacks, and start-up of shells and specific critical commands for signs of remote attacks. The sensorreports the discovered MLSIs and their types to the manager. The manager is re-sponsible for the mobile agents, analysing the gathered information and providingan interface to the operator. The manager will launch a tracing agent to the hostwhere the MLSI was found. The tracing agent will move from host to host tracingthe intrusion independently of the manager. At each host the tracer agent dis-patches an information-gathering agent that will collect further information onthe local host concerning the MLSI and returns to the manager to report.
At each host there is a message board that agents use to communicate, toavoid that multiple tracing agents follow the same track. The manager provides abulletin board, where all information gathering agents report their findings.
Of course only attacks giving rise to the presented MLSIs can be detected.On the other hand, concentrating only on those MLSIs implies that only a subsetof data needs to be processed. Safeguard, rather than concentrating on specificsubsets of attacks, filters irrelevant data as early as possible to avoid unnecessaryprocessing at higher levels.
ANT
ANT [44, 46] is an intrusion detection framework based on mobile agents mim-icking behaviours of social insects developed at Université Claude Bernard Lyon.Mobile intrusion detection agents randomly travel between hosts monitoring localmachines trying to discriminate between normal and abnormal behaviour. If ananomaly is detected, the intrusion detection agent will send an alert by buildingand spreading artificial pheromone. The pheromone consists of a number of fieldsincluding a gradient that can be used by agents to trace the source of the alert. Thepheromone field is detected by intrusion response agents. Those will climb thepheromone gradient to find the target of the attack and implement various responsebehaviours.
The alert distribution and response of ANT is very different from Safeguard

RELATED WORK 107
and most other approaches. It is important that the administrator trusts and canpredict the behaviour of protective systems in the network. This may be easierusing traditional communication means, rather than using artificial pheromone.ANT has been tested in a simulation, illustrating that agents can find the sourceof attacks using the pheromones. The emergent behaviour if applied in a realnetwork as well as a detailed comparison with traditional communication meanswould be very interesting to study.
Lightweight agents
Helmer et al [62] present an agent architecture in multiple levels developed at IowaState University. At the bottom level stationary agents are used at each data sourceto collect and clean data. At the next level, mobile agents travel between subsetsof data cleaning agents to monitor and classify ongoing activities. At the highestlevel data mining and data fusion agents are located together with databases andan interface agent.
The agent architecture is implemented using the Voyager [113] agent platformand Java. One feature of this platform is the possibility to dynamically aggregateagents. Such added functionality called facets is used to extend the behaviour ofagents dynamically providing significant flexibility.
Agents in general provide a very flexible implementation of an intrusion de-tection system. Using most agent platforms, it is easy to start, stop, upgradeand clone individual agents without shutting down the complete system. UsingJava, regardless of the choice of agent platform, it is easy today to load classesdynamically and update different aspects of agents without recompilation. Thisis actually implemented in our clustering hybrid detection agent (see chapter 6)to remove the need for recompilation when alternating between different moduleimplementations. Because the Safeguard agents do not move, the amount of codeused by the agents is less relevant than for architectures making use of mobility.
7.2 Learning-based anomaly detection
Significant effort has been devoted to learning-based anomaly detection and count-less papers have been published in this area of research. In the following sectionswe present a range of different approaches that have been proposed. Of course thislist is not complete, but it is representative and will provide some insights aboutwork done in this field. In the first section we start by describing approachesthat like ADWICE make use of clustering. In section 7.2.2 we describe other
108 7.2. LEARNING-BASED ANOMALY DETECTION
techniques for learning-based anomaly detection and finally we discuss importantproperties of those alternative techniques and compare them with ADWICE.
7.2.1 Clustering-based anomaly detection
ADWICE builds a model using clustering. In this section we present some otherapproaches using clustering-based data models, and discuss how they relate toADWICE.
Watcher
Munson and Wimer [84] have used a clustering-based pure anomaly detectiontechnique to protect a real web server executing on an instrumented Linux sys-tem. Each c-function of the Linux kernel is given an identity, and each time ac-function is called a corresponding counter is increased. Because there are 3 300instrumentation points, this results in a 3 300 dimensional vector of counters. Dur-ing a well defined time-interval, an epoch, the counters are increased, resulting ina profile vector at the end of each such time interval.
To reduce the number of dimensions, statistical filters are applied. If twodifferent c-functions are always called together, including both in the model doesnot add information. The complete number of modules is thus mapped into amuch smaller set of 100 virtual modules.
During normal execution profile vectors are collected and together form amodel of normal behaviour. Munson and Wimer noted that the vectors whenplotted together in a 100 dimensional space formed natural clusters. Each suchcluster was then represented by its centroid, a centre point and a radius, resultingin a very small model compared to the large set of original vectors.
Watcher is evaluated by protecting a real computer connected to Internet andinviting interested people to try to get root access. Execution profiles are com-pared to the model in real-time, and by including real-time responses like killingprocesses and banning IP-addresses, attacks can be stopped autonomously beforesucceeding. The experiment resulted initially in a 100 % rejection rate of portscans, buffer overflow attacks and worms.
The authors state that the threshold for rejection was set quite low. This ofcourse makes detection of attacks more probable while increasing the number offalse positives. The authors do not include evaluation of false positives in theirexperiment.
The Watcher model representation is very similar to that of ADWICE. Evenif current evaluation of ADWICE makes use of network data, the algorithm could

RELATED WORK 109
also be applied to application data similar to Watcher. Unlike Watcher that inthe presented implementation builds a static model, ADWICE provides multiplepossibilities for adaptation and a search index to increase performance.
Intrusion detection with unlabeled data
Intrusion detection in general builds on the assumption that intrusions are qualita-tively different from normal data. Portnoy et al [90] build a model of unlabelledtraining data, adding the assumption that the number of normal instances vastlyoutnumbers the number of intrusions. Building on this assumption, large clustersof data are given the classification normal, while small clusters will be consideredintrusions. Based on initial experiments, a fixed percentage N is used to decidehow many large clusters that will be labelled normal.
Portnoy et al use single linkage clustering, similar to BIRCH and ADWICE,implying one pass through training data and linear training time. Feature vectorsare normalised using mean and standard deviation. Euclidian distance is usedfor continuous values, adding a constant for each disagreeing categorical value.Unlike ADWICE a fixed cluster width is set, rather than step-wise increasing thiswidth. Adaptability is not considered, but periodical retraining on two-week basisis discussed as a possibility to keep the model updated.
The detection method is evaluated on the KDD-99 data set. Cross validationwas used, meaning the original data set was divided in multiple parts, each con-taining about 490 000 data items. Only four out of ten subsets were used, becausethose contained sufficient variations of different types of intrusion and normaldata. Training with the raw data set yielded very poor performance, because theKDD-99 data set consists to a large extent of intrusions, thereby breaking the as-sumption that normal data should be much more common. Therefore the originaldata set was filtered, resulting in data sets with only about 1 % attacks. Multi-ple tests were then performed, choosing one subset for training and another fortesting. For some subsets a 1–2 % false positives rate at a 50–55 % detectionrate were obtained, but other subsets produce considerably inferior results. Eventhough the detection rate is lower than some other approaches, one should keep inmind that this was achieved without need for complete data cleaning or labelling.One should however note the need for filtering of the KDD training data to fulfilthe assumption that normal data outnumbers attack data. Such filtering would alsoto some extent be needed if the approach is applied to real data. Flooding denialof service attacks and scanning attacks will otherwise give rise to large clustersbreaking the underlying assumption. This filtering may however be easier thanthe need for removal of possible less visible attacks required by pure anomaly

110 7.2. LEARNING-BASED ANOMALY DETECTION
detection such as ADWICE.
Y-means
Guan et al [57] use a clustering approach called Y-means to model unlabellednetwork data. Based on the population in a cluster, the cluster will be labelledas normal or abnormal. Large clusters are considered normal as in the work byPortnoy et al [90].
Y-means overcomes two shortcomings of the original K-means algorithm. K-means requires the user to choose a suitable number of clusters (K) which is criti-cal to the clustering result. In addition some of the K-clusters may be empty afterclustering. Y-means starts like K-means by assigning all instances to K clusters.If there are empty clusters, new clusters are created using data points that are veryfar from their cluster centres. When empty clusters have been eliminated, K canbe adjusted by splitting and merging clusters. If δ is the standard deviation ofdata, 99 % of the data points will statistically be inside a 2, 32δ radius of a cluster.The authors call this area the confident area of the cluster. Data points outside thisarea are deemed outliers, and the remotest outliers will be used first when creatingnew clusters by splitting. Splitting continues until no outliers exist. To avoid oversplitting, clusters with overlapping confident areas will be merged.
Y-means is like ADWICE evaluated using the KDD-99 data set. However,only a small subset consisting of 12 000 data points are used to create the model.On this small subset, the authors present a detection rate of 82,32% at 2,5% falsepositives rate. This result is, somewhat unexpectedly, significantly better than theresult by Portnoy et al [90] also performing unsupervised anomaly detection usingclustering but on other larger subsets of data.
The KDD-data consists of some types of attacks (scanning, DoS) that consistof a large number of data records, while other attacks may consist of only onepacket. This means that a small random subset may not truly be representative ofthe complete data set, making such experiments hard to compare with experimentson the complete data set or other subsets.
Similar to the work by Portnoy et al [90], Guan et al perform unsupervisedanomaly detection modelling both attacks and normal data detecting intrusionsbased on cluster sizes. ADWICE models only normal data, thereby performingpure anomaly detection. ADWICE, designed to be scalable, was able to modelall 1 000 000 normal data points without difficulty rather than only a small subset.Unlike ADWICE and the work by Portnoy et al, Y-means requires a large numberof passes through training data.

RELATED WORK 111
Clustering packet payload
The meaning of a network packet header is well known, but the payload variesa lot and consists of significantly less structured data. Many attacks are not vis-ible if considering only packet headers. This calls for general methods ignoringthe abundance of payload content types, while searching for defining differencesbetween normal and attack payload.
Many proposed detection methods, including our application of ADWICEin the Safeguard context, ignore the payload and apply learning only to header-based features or a small number of selected content-based features. Zanero andSavaresi [121] on the other hand use clustering in a first stage to group payloadinto a number of different classes represented by a single byte, thereby signifi-cantly compressing the information. In a second tier an anomaly detection algo-rithm based on self-organising maps (SOMs) [72] is applied to payload classestogether with the header features.
Experiments were performed with three different clustering algorithms forthe first stage, of which the authors consider SOM to be the most successful. Theauthors used the DARPA/Lincoln Labs 1998 data set for their proof-of-conceptevaluation, which corresponds to the data used to produce the KDD-99 data set.They used a 10 × 10 SOM, thereby organising data in 100 different clusters. Thenetwork was trained in 10 000 epochs over a representative subset of networkpackets. The authors do not state how many packets were used for training, orhow much time was needed to train the model.
2 000 packets are classified using the trained SOM. When the number of pack-ets in each class is presented for normal and Nessus2 traffic, it is clear that thedistribution of packets into classes is different. However, some Nessus packetswill be classified into the same classes as normal packets and vice versa. It isshown that normal FTP traffic is classified into a small set of 8 classes out of total100. Examples of FTP-based attacks are given, of which two were classified intoclasses not containing any FTP-traffic, and one into a class that is an uncommonFTP-class. This suggests that the compressed information can indeed providesome useful contribution to the detection of payload-based attacks.
If further evaluation of the approach proves that the results hold in general,much work on anomaly detection including ADWICE could be extended withsuch compressed payload-based features. However, unlike ADWICE, SOMs re-quires significant amounts of training, and is not as easily adapted when normalitychanges.
2Nessus [85] is a security scanner for various flavours of Unix. It performs a large number ofremote security checks, and suggests solutions for security problems.

112 7.2. LEARNING-BASED ANOMALY DETECTION
The authors claim that adding the payload-based feature to the second stageincreased detection rate by 75% at the cost of an unspecified but limited increasein false positives.
Detection of modified files
When having compromised a machine, the attacker may install a root kit to facil-itate easy access in the future. By using data bases of hashes of known normalfiles, and comparing those to hashes of potentially compromised hosts, intrusionscan be detected. However, for large networks with many different types of sys-tems and different patch levels, maintaining a complete data base of benign filesmay not be practical. Carrier and Matheny [20] propose a method to use when theoriginal hashes are unknown or hash data bases incomplete.
Hashes of a set of relevant system files are collected from all hosts in thenetwork. The vectors of hash values are then clustered. The distance betweenhosts is defined to be the number of hash values that are different. In the presentedexperiments all hosts were clustered into sets, such that the distance between allhosts in a single cluster was zero. This corresponds to all hashes being equal.
If one assumes, that only a minority of the hosts in a large network are com-promised, and many uncompromised hosts have the same patch level, suspectedhosts may be detected by examining the size of host clusters. Small clusters ofhosts are more probable to be compromised in this case.
By handling host clusters rather than individual hosts, false positives are moreeasily handled. If a cluster of hosts results in a false positive, examining onlyone of the hosts in the cluster suffices to discard this false alert. The authorstherefore also count false positives as the number of erroneously detected clusters,rather than individual hosts. Experiments using a simulated data set, show that themethod has a potential to help identify compromised hosts and reducing the workof examining suspected hosts.
Clustering normal user behaviour
Oh and Lee [87] cluster each data feature by itself, while taking user transactionsinto account when creating user profiles. A user transaction is represented by alist of occurrence frequencies of kernel signals for all the commands of a userduring a session. Similar data objects of each feature are clustered together andclusters represented by a minimum, maximum, count of the represented transac-tions, the centre and ratio together with their standard deviations. The centre iscomputed by taking the average of the data objects in each transaction, and then

RELATED WORK 113
computing the average over the number of transactions in the cluster. Similarly,the individual repetitive ratio of a transaction in a cluster is the number of dataobjects in the present cluster and transaction, divided by the complete number ofdata in the transaction. The overall ratio is the average of individual ratios over alltransactions.
The user profiles consist of internal cluster summaries as explained above, andexternal summaries representing statistics of the noise data objects not presentin clusters. During detection four different anomaly measures are computed foreach feature when comparing a new transaction with existing user profiles. Theinternal distance is the difference between the centre of a cluster and the averageof data objects in the user transactions that are in range of the cluster. The globalinternal distance is then computed by taking the average of all individual internaldistances. The other three measures are called internal ratio, external differenceand external ratio. If the anomaly measures are larger than a threshold, the usertransaction is suspicious.
Two sets of experiments are presented. In the second user logs from theDARPA/Lincoln Labs 1998 data set were used and the results compared to theclassic statistics-based NIDES intrusion detection system [2]. At about 10% falsepositives, all anomaly measures resulted in almost 100% detection rates. NIDEShad a higher false positives rate and a lower detection rate.
Unlike this work, ADWICE clusters all features together. This facilitates de-tection based on combinations of anomalous values that may go undetected if onlyconsidering features one by one. On the other hand, considering features togethermakes it more difficult to understand what features that were the primary cause tothe anomaly. ADWICE provides some help in this context, by including into thealert the individual features that contributed most to the overall anomaly level.
ADWICE in its current form does not represent outliers separately (i.e. ex-ternal summaries). Normal outliers either are present in the model as sparselypopulated clusters, or they may be removed if forgetting is applied.
Fuzzy clustering
Shah et al [102] use fuzzy clustering to detect anomalies in low level system dataincluding statistical network data, process information and global system datasuch as memory usage and CPU load. Samples are collected at a rate of once persecond. In total 189 features are collected, but using principal component analysisthe number of dimensions are reduced to 12. The resulting vectors are clusteredusing the Fuzzy mediods algorithm [73].

114 7.2. LEARNING-BASED ANOMALY DETECTION
Unlike traditional clustering approaches, including ADWICE, data may be-long to more than one fuzzy cluster. Membership is not a binary function. TheFuzzy mediods algorithm outputs n representative objects (mediods), such thatthe total fuzzy dissimilarity within each of the n clusters is minimized.
The diameter of the clusters is computed as the average pair-wise distancebetween members of the cluster, and the radius is half this distance. A thresholdbased on the radius is compared to the distance to an unknown data point to decideif the data is anomalous or not.
A model is trained on data collected in an attack-free environment, using aLinux kernel running a vulnerable Apache server [3]. A number of different at-tacks are used for testing. One of the best results was an attack that was detectedwith a 43,53 % detection rate at a 16,12 % false positives rate. The authors statethemselves that the false positives rate is high, but they assume that higher levelreasoning may mitigate that to some extent.
Unlike ADWICE, clustering of Fuzzy mediods requires multiple iterationsover data objects increasing training time and making incremental training andadaptation less viable.
Seurat
Xie et al. [120] collect system file change data from multiple hosts and use cluster-ing to detect common changes at multiple hosts at specific time intervals, possiblyindicating distributed attacks such as worms. Each host is equipped with a lightweight tool that collects a daily summary of file update attributes. The attributesinclude file name, type, device number, permissions, size, time-stamps and MD5checksum. Currently only a binary bit representing whether the file was changedor not during the present day is used.
Data vectors from the detection window are clustered and compared with clus-ters from previous t days (e.g. the comparison window). The clustering algorithmis a simple iterative algorithm normally used for K-means initialization, using noprior knowledge of the number of clusters. A cluster is called a new cluster ifit consists of multiple vectors only from the detection window. This indicatesabnormal file updates and causes generation of an alert.
7.2.2 Other selected techniques
Of course there are countless other approaches to model intrusion detection databesides clustering and below we take a broader view of learning-based intrusion
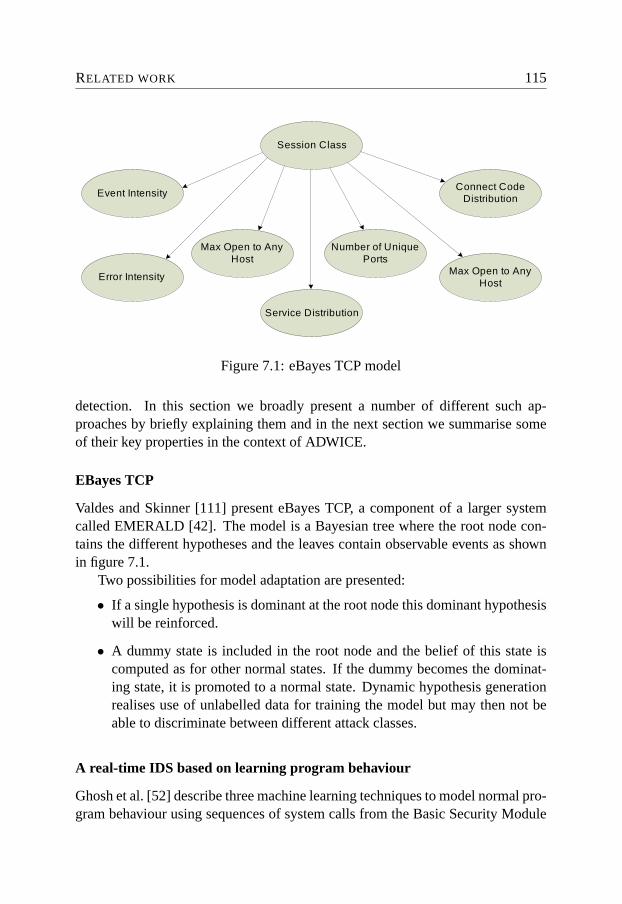
RELATED WORK 115
Max Open to Any Host
Connect Code Distribution
Session Class
Event Intensity
Error Intensity
Service Distribution
Number of Unique Ports
Max Open to Any Host
Figure 7.1: eBayes TCP model
detection. In this section we broadly present a number of different such ap-proaches by briefly explaining them and in the next section we summarise someof their key properties in the context of ADWICE.
EBayes TCP
Valdes and Skinner [111] present eBayes TCP, a component of a larger systemcalled EMERALD [42]. The model is a Bayesian tree where the root node con-tains the different hypotheses and the leaves contain observable events as shownin figure 7.1.
Two possibilities for model adaptation are presented:
• If a single hypothesis is dominant at the root node this dominant hypothesiswill be reinforced.
• A dummy state is included in the root node and the belief of this state iscomputed as for other normal states. If the dummy becomes the dominat-ing state, it is promoted to a normal state. Dynamic hypothesis generationrealises use of unlabelled data for training the model but may then not beable to discriminate between different attack classes.
A real-time IDS based on learning program behaviour
Ghosh et al. [52] describe three machine learning techniques to model normal pro-gram behaviour using sequences of system calls from the Basic Security Module

116 7.2. LEARNING-BASED ANOMALY DETECTION
(BSM) in Solaris. The presented approaches are:
• An Elman neural network is used to predict the next sequence of events atany point in time. The n:th input sequence In is presented to the networkwhich produces an output On. On is then compared to In+1 to obtain theprediction error (i.e. the anomaly measure).
• A finite automata where states correspond to n-grams in the BSM data andoutput states correspond to sets of l-grams (where l < n) that may be seenwhen the automata is in a given state. During training statistics of successorl-grams are collected through counting. During testing the deviation of thesuccessor l-grams from expected values is used for anomaly scores.
• A finite automata that represents program behaviour is automatically con-structed from normal training data. One or more n-grams are assigned toeach state. The automata predicts an n-gram N if there is a transition fromthe current state to the state corresponding to N and if the transition is la-belled with the first l events of N . If there is no matching transition labelsno prediction is made. If the matching transition leads to a state not con-taining N this is considered a prediction error (i.e. an anomaly).
Intrusion detection applied to CORBA objects
Marrakchi et al. [79] perform application level intrusion detection by modellingclient request at a CORBA [27] server. Request interceptors of the VisiBrokerORB [28] are used to collect request names and their parameter values. Eachclient connection is considered one data item, where bind/unbind between serverand client object corresponds to connect/disconnect.
The normality model is a tree structure where nodes correspond to requests,the root marks connection and leafs disconnection. Each node also contains in-formation of the parameter values. During training all client requests are assumedto be attack-free and new branches are added to the tree as new connections arepresented to the system. In a second manual phase during training a toleranceinterval is constructed for each numerical parameter value.
During detection incoming requests are matched against the model followinga path from the root to a leaf. During tree traversal the similarity between thepresent connection and the model is computed. Similarity starts at 1 and receivesa penalty at each node where parameter values do not match normality. Alertsare generated if an unexpected request is detected during tree traversal or if a leafnode is reached and the similarity is less than a threshold.

RELATED WORK 117
CDIS: Computer defence immune system
Williams et al [117] present an anomaly detection scheme based on the computerimmune system approach. The data used are 28 header attributes from individualTCP-packets, and 16 attributes from UDP and ICMP which are processed intobinary strings of 320 bits. Each non-binary attribute is represented by an intervalrather than a fixed value, thereby realising imperfect matching.
Initially the system goes through a training phase (see figure 7.2). Antibodiesare created as random binary strings and matched against a corpus of self-packetsthereby performing negative selection with removal of matching antibodies. Themodel may then optionally be tuned by affinity maturation to obtain more generalantibodies. The attribute intervals are then increased until they start matching selfafter which they are decreased again. The initial training is a very time-consumingtask performed off-line.
During detection the model of antibodies is matched against network packets.After an initial match against one antibody, an extended search for other matchingantibodies is performed. If additional matches are found on the local host oranother remote host, the antibody is said to be costimulated and only then an alertis generated to reduce false positives.
The dotted parts of figure 7.2 are not yet implemented. This includes removing(forgetting) antibodies after a certain life-span and to reinforce those antibodiesthat generate alerts to handle changing system behaviour.
Data mining methods for detection of new malicious executables
Schultz et al [99] have evaluated the application of several data mining methodsto the problem of detecting previously unknown malicious executables.
The authors compare a base-line signature-based approach against the RIP-PER algorithm [24] and two approaches based on the naive Bayes approach. TheRIPPER algorithm used character strings within the executables as features forgenerating classification rules. The Naive Bayes algorithms used character stringsas well as sequences of byte codes from the executable files. In addition to thestandard Naive Bayes the authors introduced the so-called multi-Naive Bayes,which basically splits the features in different sets and then applies the standardnaive Bayes to each set of features, and then makes a vote based on the predictionfor each set of features.

118 7.2. LEARNING-BASED ANOMALY DETECTION
Antibodies Randomly Created
Negative Selection
Affinity Maturation (optional )
Detection
Co-stimulated?
Generate Alert
Lifetime Extended
1010100011010
Not Match Self
Match Event
Yes
Lifetime Reached ?
Not Match Event
Death
No Yes
No
Initi
al T
rain
ing
Match Self
Det
ectio
n
Figure 7.2: CDIS antibody life cycle

RELATED WORK 119
Monitoring anomalous windows registry access
Apap et al [4] introduce RAD (Registry Anomaly Detection) which uses a proba-bilistic normality model to detect anomalous Windows registry access. From eachregistry access five features are extracted, namely the process name, query (set,get ...), key, response (success, not found, buffer overflow ...) and result value.Since the Windows event logger causes a major resource drain if used to log allregistry accesses, the basic audit module was implemented to create and storeregistry-based feature vectors in a data warehouse.
A set of consistency checks is applied to detect anomalies. P (X) for eachfeature and P (X|Y ) for each pair of features are computed resulting in 25 con-sistency checks for each registry access. A normality model is computed out ofthe collected normal data. For each data record, an anomaly score is computedand then compared with a user threshold to decide whether to send an alert or not.Training is performed off-line, while detection is performed real-time, keeping upwith the 50 000 records per hours produced during experiments
Detecting anomalous network traffic with self-organizing maps
Ramadas et al. [94] use self organizing maps (SOMs) [72] as normality mod-els for network data. Network packets are captured with the tcpurify program,which captures only the first 64 bytes and has the option of obfuscating the senderand receiver addresses. The tcptrace program then reports a number of periodicmessages during a TCP or UDP connection (for UDP defined using time-outs).6 features are used (and reported from tcptrace) including questions per second,average question size and idle time between questions.
A self organizing map converts non-linear statistical relationships betweendata points in high dimensional space to relations between points in two dimen-sional space. During training all neurons are presented with each training sample,and for each sample the closest neuron and its neighbours are adjusted closer tothe sample. During detection a sample is compared to all neurons and if there ismore than two units of standard deviation from the closest neuron it is consideredanomalous.
Detecting self-propagating email using anomaly detection
Gupta and Sekar [59] use a state machine and statistics to detect increasing vol-umes of email traffic. The data source is email server logs, but the current evalua-tion simulates the users.

120 7.2. LEARNING-BASED ANOMALY DETECTION
The basis is a state machine for email server operation with one send event andan arbitrary number of deliver events. Each email creates a new instance of thestate machine. Four frequency statistics are captured at the email server, rangingover all clients as well as individual clients.
Each statistic was maintained at multiple time-scales ranging from about onesecond to one hour. Rather than using averages the frequency distribution wascaptured using time windows and histograms using geometric bins (since valueranges are not known). The severity of an anomaly is defined to be the differencebetween the highest non-zero bin at detection and training.
HMM-based intrusion detection
Cho and Han [21] propose two techniques to improve HMM-based (HiddenMarkov Model [93]) detection applied to events from the basic security mod-ule in Unix. To simplify modelling, the amount of training data is reduced byconcentrating on events related to privilege flows. This includes change from userand group ID to execution ID root when setuid processes3 are used. In this wayonly about 25% of the original events are needed. Performance is improved bycombining multiple HMM-models.
The system call related information, such as file paths and system call returnvalues, is too large and varying to be directly modelled using HMMs. The manydifferent measures are reduced by applying a self-organised map so that all mea-sures are converted into one representative.
Training is performed by observing training sequences and updating the modeluntil probabilities for the normal sequences are maximised. During detection theprobability that a specific sequence is normal (generated by the HMM) is calcu-lated.
Anomalous payload-based network intrusion detection
Wang and Stolfo [115] present PAYL, a fully automatic, simple, unsupervised,and incremental anomaly detector. The data source is binary payload contentwhere the payload may optionally be truncated. The simplest approach considerspayload from individual packets but payload from complete or partial connectionsmay also be used. To obtain a good model, the complete data stream needs tobe divided into smaller subsets so that similar payloads are modelled together.
3In some applications, a user process needs extra privileges, such as permission to read thepassword file. Unix systems offer a set of system calls, called the uid-setting system calls, for aprocess to raise and drop privileges. Such a process is called a setuid process.

RELATED WORK 121
Usually the standard network services have fixed pre-assigned ports (e.g. port 80for HTTP, 21 for FTP). Each application has its own payload distribution. Thedistribution of payload also varies due to payload length where longer payloadmay indicate non-printable characters indicative of media files or executables.Also the direction of the data stream is relevant.
A sliding window of one byte is passed over the complete payload and theoccurrence for each byte is counted. For a payload the feature vector is calculatedby dividing each byte count with the total number of bytes. Each byte is treatedas a variable and its mean and standard deviation computed.
Given a training data set a model Mij is computed for each observed lengthi and port number j. Mij stores the mean byte frequency and standard deviationof each byte’s frequency. Incremental updating of the model is possible. Duringdetection the distribution of the tested payload is computed and compared withthe model.
Anomaly detection based on eigen co-occurrence matrix
Oka et al. [88] introduce a new method, Eigen Co-occurrence Matrix (ECM) thatmodels system call sequences and extracts their principal features to be used foranomaly detection. For each sample user sequence of length l a co-occurrencematrix is constructed by counting the occurrence of every event pair within a cer-tain distance. This results in an m × m matrix Mi for each sequence where mis the number of unique events. By finding the principal components the verylarge matrix can be reduced. A feature vector is obtained by projecting Mi intothe reduced co-occurrence matrix space. The feature vectors are used to constructmultiple layered networks with events as nodes and connections as edges. Un-known data are then compared to those networks.
An empirical analysis of target-resident DoS filters
Collins and Reiter [25] analyse the performance of several previously proposedtechniques for denial of service filtering.
Four different filtering techniques are evaluated. Two of the techniques makeuse of source address data, and the other two make use of coarse indications ofthe path that each packet traverses on its way to the destination node.

122 7.2. LEARNING-BASED ANOMALY DETECTION
Network-basedPacket headers 4Complete packets 1
Host-basedSystem calls 3Windows registry 1Files 1
Application-basedCORBA requests 1Email server 1
Table 7.1: Data sources
7.2.3 Discussion of key properties
This section discusses some key properties of the presented non-clustering basedtechniques and relates those to ADWICE.
Data source
If we classify the papers according to what data sources they use we get the re-sult shown in table 7.1. We can conclude that all three considered types of datasources (see section 2.2.2) are present. The most common ones are packet headersand system calls. Using packet headers rather than complete packets implies thata majority of attack classes, those visible only in payload, will not be detected. Onthe other hand, using payload may decrease performance if the payload needs tobe parsed and may aggravate the privacy problem due to user data processing. De-ciding how to use the unstructured packet content or what features to extract is notstraightforward. This may explain why more effort has been spent on processingpacket headers.
In the Safeguard setting we used only packet-based features for ADWICE tominimize processing time and avoid the feature selection problem for payloaddata. Selecting a specific number of specific features will make the detectionapproach less general. It will possibly reduce the probability that new attacks willbe detected in the case when they are not visible in the selected features. Generalapproaches to payload does not have this problem, including the work by Wangand Stolfo [115].
Detection method
In this section we summarise what subclasses of anomaly detection are presentin the surveyed work. Pure anomaly detection means that only normality is mod-elled while hybrid anomaly detection provides explicit models also of attacks.
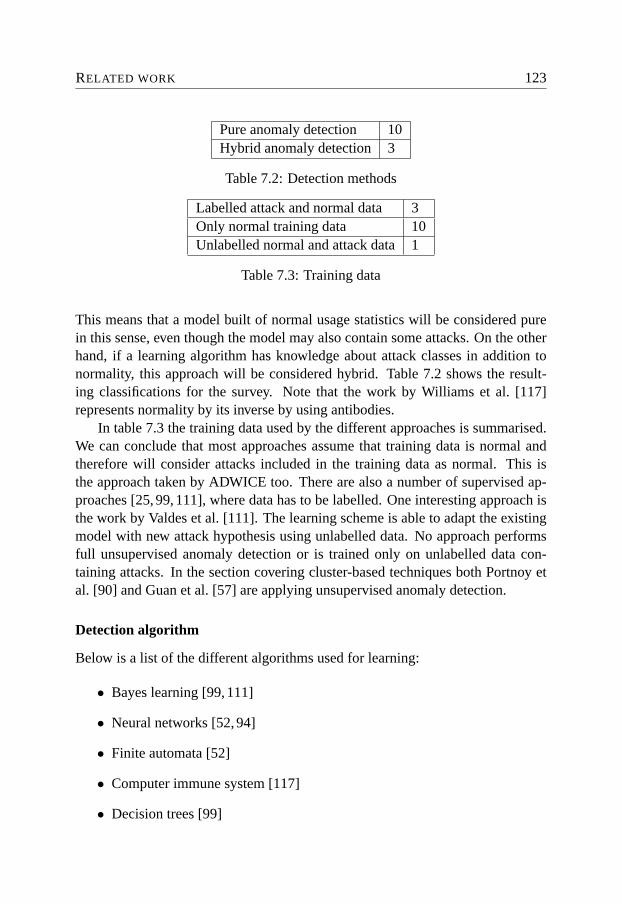
RELATED WORK 123
Pure anomaly detection 10Hybrid anomaly detection 3
Table 7.2: Detection methods
Labelled attack and normal data 3Only normal training data 10Unlabelled normal and attack data 1
Table 7.3: Training data
This means that a model built of normal usage statistics will be considered purein this sense, even though the model may also contain some attacks. On the otherhand, if a learning algorithm has knowledge about attack classes in addition tonormality, this approach will be considered hybrid. Table 7.2 shows the result-ing classifications for the survey. Note that the work by Williams et al. [117]represents normality by its inverse by using antibodies.
In table 7.3 the training data used by the different approaches is summarised.We can conclude that most approaches assume that training data is normal andtherefore will consider attacks included in the training data as normal. This isthe approach taken by ADWICE too. There are also a number of supervised ap-proaches [25, 99, 111], where data has to be labelled. One interesting approach isthe work by Valdes et al. [111]. The learning scheme is able to adapt the existingmodel with new attack hypothesis using unlabelled data. No approach performsfull unsupervised anomaly detection or is trained only on unlabelled data con-taining attacks. In the section covering cluster-based techniques both Portnoy etal. [90] and Guan et al. [57] are applying unsupervised anomaly detection.
Detection algorithm
Below is a list of the different algorithms used for learning:
• Bayes learning [99, 111]
• Neural networks [52, 94]
• Finite automata [52]
• Computer immune system [117]
• Decision trees [99]

124 7.2. LEARNING-BASED ANOMALY DETECTION
Yes (Training) Yes (Detection) NoPerformanceevaluated
3 7 4
Table 7.4: Performance evaluations
• Probabilistic model [4]
• Hidden Markov Model [21]
• Statistics [59, 115]
• Other methods [79, 88]
As we can see, many different approaches have been evaluated, and eventhough this list is representative, there are certainly other methods not includedhere. Unfortunately the motivation behind choosing a certain learning scheme isnot always presented. More explicit discussions of alternative learning schemesand why they have been considered inferior would have been helpful for direct-ing future research. Some authors do not consider the use of a specific learningscheme the primary contribution. This may to some extent explain why the spe-cific properties of the selected learning scheme are not discussed more.
When it comes to on-line detection (and adaptability) execution performanceis very important. Table 7.4 shows to what extent performance is measured. Con-sidering training time is less common than time for detection, because many ap-proaches assume off-line training and no on-line adaptation. In many cases whereperformance is considered the authors only conclude that the detection schemeis fast enough to keep up with the data processed during evaluation. Few pa-pers [88, 94, 115] present the maximum throughput of the detection scheme. Inour work with ADWICE we consider time for detection as well as training, be-cause we want to provide the possibility of on-line adaptation.
Usage frequency
To minimize time to detection, the intrusion detection system needs to be vigi-lant at all times, using continuous on-line detection. If the detector is executedonly periodically, attacks may be missed. On the other hand, periodic usage re-quires significantly less resources in terms of processing power than continuousdetection.
For real applications, what is considered normal will vary over time. Newusers and services will be added to the system and old ones stop being present in
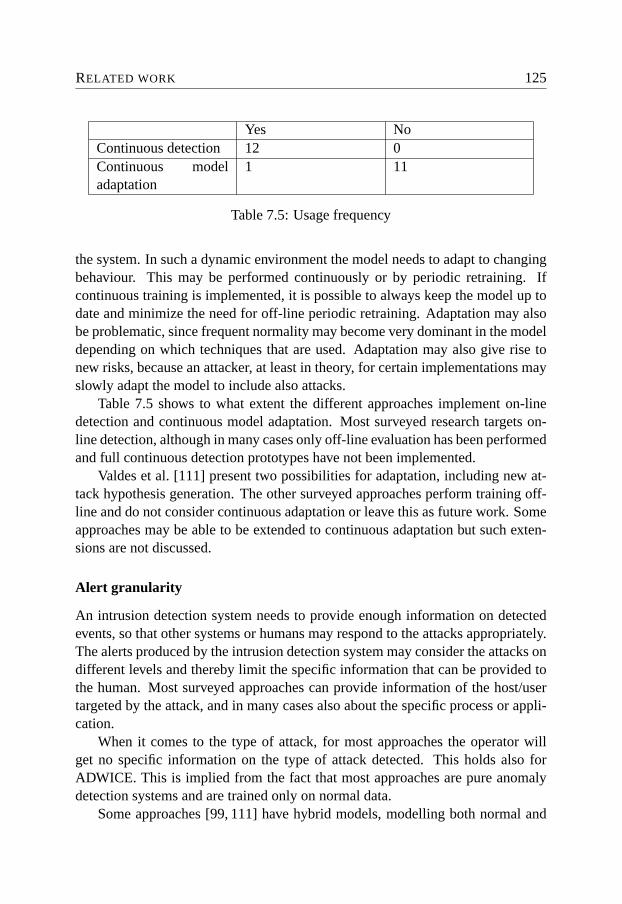
RELATED WORK 125
Yes NoContinuous detection 12 0Continuous modeladaptation
1 11
Table 7.5: Usage frequency
the system. In such a dynamic environment the model needs to adapt to changingbehaviour. This may be performed continuously or by periodic retraining. Ifcontinuous training is implemented, it is possible to always keep the model up todate and minimize the need for off-line periodic retraining. Adaptation may alsobe problematic, since frequent normality may become very dominant in the modeldepending on which techniques that are used. Adaptation may also give rise tonew risks, because an attacker, at least in theory, for certain implementations mayslowly adapt the model to include also attacks.
Table 7.5 shows to what extent the different approaches implement on-linedetection and continuous model adaptation. Most surveyed research targets on-line detection, although in many cases only off-line evaluation has been performedand full continuous detection prototypes have not been implemented.
Valdes et al. [111] present two possibilities for adaptation, including new at-tack hypothesis generation. The other surveyed approaches perform training off-line and do not consider continuous adaptation or leave this as future work. Someapproaches may be able to be extended to continuous adaptation but such exten-sions are not discussed.
Alert granularity
An intrusion detection system needs to provide enough information on detectedevents, so that other systems or humans may respond to the attacks appropriately.The alerts produced by the intrusion detection system may consider the attacks ondifferent levels and thereby limit the specific information that can be provided tothe human. Most surveyed approaches can provide information of the host/usertargeted by the attack, and in many cases also about the specific process or appli-cation.
When it comes to the type of attack, for most approaches the operator willget no specific information on the type of attack detected. This holds also forADWICE. This is implied from the fact that most approaches are pure anomalydetection systems and are trained only on normal data.
Some approaches [99, 111] have hybrid models, modelling both normal and

126 7.2. LEARNING-BASED ANOMALY DETECTION
attack data. Those may provide more specific information on known attacks at thecost of higher training data requirements or attack knowledge.
Anomaly detection is primarily used for detecting new attacks. Often misusedetection will be used in parallel providing the user with very specific informationon the attack type of known attacks.
Attack resistance
The attacker may want to cover her tracks, thereby giving the motivation for at-tacking the intrusion detection system itself or hide the attack in normal data. Ex-amples of attacks against intrusion detection system are for example evasion [92]and mimicry attacks [114]. It is important to consider how vulnerable the intru-sion detection system is to such attacks.
Very few papers consider the security or insecurity of their detection approach.Some authors claim that they will consider at least mimicry attacks in future works[4, 115].
In our work, attack resistance was mostly considered on the global level ofthe agent system. We expect that individual agents with some difficulty can bedisabled or evaded, but the complete system should still be able to detect theattack with high probability. Applying multiple detection schemes in parallel asin the case of Safeguard, makes it much harder to avoid detection than evading asingle anomaly detector.
Evaluation data
There exist a number of different approaches to intrusion detection evaluation.To avoid practical problems data may be simulated, using more or less complexmodels of users and systems. This makes evaluation of very complex systemspossible and avoids the difficulties of collecting real data. Unfortunately it is hardto prove that the simulation results are valid in a real world setting.
Collecting or generating good realistic data for intrusion detection systemevaluation is a difficult task. Ideally real normal data produced by real users in areal system should be used. Then regularities arising from use of simulated datacan be avoided. This is especially important for learning-based systems since theyotherwise may learn properties of data not present in the real world. Using realdata may however introduce other problems, e.g. related to privacy. [77]
To evaluate detection accuracy, attacks need to be included in the data. In themost realistic setting, the attacks are performed by real possibly unknown as wellas malicious adversaries. Unfortunately this implies a number of difficulties and
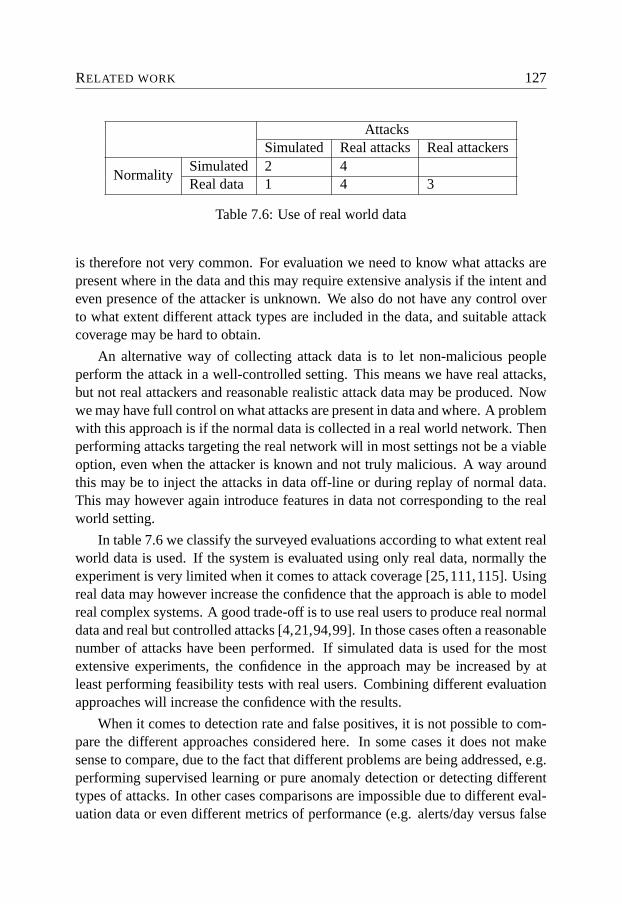
RELATED WORK 127
AttacksSimulated Real attacks Real attackers
NormalitySimulated 2 4Real data 1 4 3
Table 7.6: Use of real world data
is therefore not very common. For evaluation we need to know what attacks arepresent where in the data and this may require extensive analysis if the intent andeven presence of the attacker is unknown. We also do not have any control overto what extent different attack types are included in the data, and suitable attackcoverage may be hard to obtain.
An alternative way of collecting attack data is to let non-malicious peopleperform the attack in a well-controlled setting. This means we have real attacks,but not real attackers and reasonable realistic attack data may be produced. Nowwe may have full control on what attacks are present in data and where. A problemwith this approach is if the normal data is collected in a real world network. Thenperforming attacks targeting the real network will in most settings not be a viableoption, even when the attacker is known and not truly malicious. A way aroundthis may be to inject the attacks in data off-line or during replay of normal data.This may however again introduce features in data not corresponding to the realworld setting.
In table 7.6 we classify the surveyed evaluations according to what extent realworld data is used. If the system is evaluated using only real data, normally theexperiment is very limited when it comes to attack coverage [25,111,115]. Usingreal data may however increase the confidence that the approach is able to modelreal complex systems. A good trade-off is to use real users to produce real normaldata and real but controlled attacks [4,21,94,99]. In those cases often a reasonablenumber of attacks have been performed. If simulated data is used for the mostextensive experiments, the confidence in the approach may be increased by atleast performing feasibility tests with real users. Combining different evaluationapproaches will increase the confidence with the results.
When it comes to detection rate and false positives, it is not possible to com-pare the different approaches considered here. In some cases it does not makesense to compare, due to the fact that different problems are being addressed, e.g.performing supervised learning or pure anomaly detection or detecting differenttypes of attacks. In other cases comparisons are impossible due to different eval-uation data or even different metrics of performance (e.g. alerts/day versus false

128 7.2. LEARNING-BASED ANOMALY DETECTION
positives rate). In many cases the evaluation could be improved, although it maynot always be straightforward to do so due to the difficulty of obtaining goodevaluation data. Overall the false positives rate is still a significant problem forlearning-based approaches including ADWICE.

CONCLUSIONS AND FUTURE WORK 129
Chapter 8
Conclusions and future work
In this thesis we have described ADWICE, a pure anomaly detection scheme usingincremental clustering. The use of incremental clustering results in scalability,facilitating the use of very large training data sets and building of large normalitymodels. This was confirmed in experiments building models out of millions oftraining data resulting in normality models with tenths of thousands of clusters.
Incremental clustering provides the opportunity to adapt a cluster-based modelonline, possibly interleaving adaptation with detection. We have explained howincremental training can be used to reduce the need for complete periodical re-training of the model and illustrated how this can be used to reduce false posi-tives. In the context of adaptability we also introduce the use of forgetting for acluster-based model. This prevents the model to grow indefinitely and may in-crease detection of new anomalies that once have been considered normal.
Training time is linear due to the use of incremental clustering. The searchindex further improves performance of training as well as detection by provid-ing logarithmic search times of the model. In related work, real-time detectionand indices for fast matching against the normality model are seldom consideredtogether with the basic detection approach. We think, however, that it is impor-tant to include the index in the detection scheme from the start, since the indexmay influence not only performance, but also other properties such as adaptationand even accuracy as shown in this thesis. We explained how the initial indexcould contribute to false positives providing insights that can be useful also in thecontext of other detection schemes using indices.
A software agent was developed using ADWICE as primary detection engine.This agent was fully integrated into the prototype of the Safeguard agent architec-ture. The complete Safeguard architecture, including the agent using ADWICE,

130
was installed and used in the Safeguard test network. This illustrated the use ofADWICE in a larger context, protecting a network from attacks and failures andconfirmed that scalability and performance of the agent and ADWICE were goodenough to be useful in a realistic environment.
The DARPA/Lincoln Labs related data sets have been widely used but alsocriticised [78]. The normal traffic regularity as well as distribution of attackscompared to distribution of normality does not correspond to network data ina real network. With this in mind, our DARPA/Lincoln Labs based evaluationwith the KDD data set still shows feasibility of ADWICE given the assumptionsthat relevant features are used and that those features separate normal data fromattacks.
For full evaluation of forgetting and incremental training, data over a longerperiod needs be collected. We see the experiments used in this thesis as a proof ofconcept. It is improbable that parts of normality should be forgotten already aftera few days in a real network. Producing good public data for intrusion detectionevaluation including anomaly detection and correlation is still an important taskfor the intrusion detection community and we think collaboration on this task isvery important. Two main approaches exist:
• A test network or simulator can be used for generation of data, thereby real-ising a fully controlled environment. Generation of more extensive data setsin the Safeguard test network is ongoing work but requires more resources,primarily to generate good normal data, but also to perform attacks.
• Data can be collected from real live networks. Here, normality is no longera problem, but privacy is, and so is the issue of attack coverage. Emergingtools can be used to sanitise [15] data with some limitations. Sanitisingdata while keeping relevant properties of data so that intrusion detectionanalysis is still valid is not easy, especially for unstructured information,for example, network packet content. When it comes to attacks, they mayhave to be inserted into data offline if the real attack present in data is notenough. Performing attacks online in a real network is typically not a viableoption.
If correlation is to be evaluated, such as the correlation agents of Safeguard,data generation becomes even more complex. Many different data sources may berelevant to the detection process. Although some work has been performed in thisarea [60] further efforts are needed creating open data sets to make comparisonsbetween different approaches easier.

CONCLUSIONS AND FUTURE WORK 131
Pure anomaly detection is useful even if training data is not free from attacks.We can then detect changes in behaviour, and the old attacks already present intraining data should be handled by misuse detection systems to a large extent.What is the implication of training online on both attack and normal data? Aslong as statistics is used, attacks may be assumed to be outliers in normal dataand detected based on this assumption. In the case of ADWICE and similar ap-proaches, training online on data not assumed to be normal is probably not a goodidea. Then we may learn attacks as normality the first time they occur. By onlyadapting the model using data that is classified as normal (by ADWICE itself,another detection scheme or a human expert) this problem can be reduced.
8.1 Future work
The current implementation only handles numerical data and the mapping fromcategorical values to numerical is not a general solution. Future work includes de-velopment of a detection scheme that is more general and able to handle categori-cal data as well as numerical. Using categorical values means that representativesof data need to be stored inside a cluster, rather than just the CF used by BIRCHand currently ADWICE. To what extent this use of categorical data would influ-ence performance, memory usage, and detection quality needs to be investigated.Work by Ganti et al. [49,50] may be used as a starting point for scalable clusteringof categorical data.
We have here evaluated two kinds of threshold requirements using radius ordistance. Using distance produces better detection quality but using the radius ismore resistant to outliers of data raising the question whether a combination ofthese two could lead to the best of both worlds.
Forgetting may be used for handling outliers. Future implementations shouldstudy cluster size when deciding whether a cluster ought to be forgotten. Largeclusters, corresponding to very common normality in the past, should be very re-sistant against forgetting. Also, rather than forgetting clusters periodically, theinfluence of clusters could be reduced step by step until the point where it iscompletely forgotten. This could be realised by defining an influence radius tocomplement the normal radius of the cluster when performing detection. The in-fluence radius could be defined as a percentage of the original radius for example,where the percentage will decrease over time.
Global clustering will produce a more optimal clustering than the local incre-mental clustering used by ADWICE. One approach to get the best of both worldsmay be to use non-incremental global clustering periodically, and incremental

132 8.1. FUTURE WORK
clustering online for adaptability. This requires the global clustering algorithmto be scalable enough to handle large training data sets in the context of networkdata.
In our work service names and host addresses are included as data features.This means each host/service will be modelled by a separate set of clusters, butthat all clusters even representing separate hosts/services will be collected into oneglobal network model. This implies that the model only has global parameters,thereby removing the need to set model parameters for individual hosts/services.However, this approach results in a single large tree of clusters. An alternativeapproach would be to represent each host/service by a separate tree of clusters.The global network model would then consist of a forest of trees, rather thanone large tree. This would significantly reduce the number of clusters in eachmodel, thereby reducing the height of the tree implying improved performance.The correct tree could be found in constant time using hashing, similar to the hash-based tree used in the grid-index. Such a forest of trees could use global parametersettings to avoid the need for handling a large set of individual parameter settings.
In the Safeguard prototype only features based on packet headers were in-cluded. Many attacks require also payload-based features to be detected. Like inthe case of the KDD data set, such features can be selected by a human expertand pre-processed before feature vectors are processed by an intrusion detectionscheme. An alternative more general approach is to compute statistics based onthe binary packet content without caring about semantics of the packet data simi-lar to the work by Wang and Stolfo [115]. More work is required to analyse andcollect statistics on the usefulness of individual features for detection of specificattacks and attack types. Lundin-Barse and Jonsson [13] present a frameworkfor determining exactly which log data can reveal a specific attack. Larson etal [74] continue this work by presenting a tool that can be used to find differencesbetween normal and attack data in log files. Knowledge of such differences isrequired for selection of relevant features for intrusion detection. Knowledge ofspecific features relevant for existing attacks will not be enough for detection ofall new attacks, but could provide a starting point.
Our experience with incremental training indicates the need for new tech-niques to complement the anomaly detector. Julish [70] describes how clusteringof alerts is used to identify root causes (e.g. misconfiguration of a system resultingin false alerts). This technique could be used to suggest to the operator that largeclasses of similar alerts may possibly be false positives that should be includedinto the model by incremental training.
We have further noted that there may be a need for the operator to tell the

CONCLUSIONS AND FUTURE WORK 133
anomaly detector to learn not only the data producing the alert, but also a general-isation of data. For example, the two step incremental training during evaluationof adaptation would not have been necessary if the operator could have told thesystem to learn that the data producing alerts was normal both during workingand non-working hours. Those experiences call for intelligent tools to help theoperator using pure anomaly detection with adaptation in a real environment.
8.2 Final words
Anomaly detection in general is a difficult problem, as illustrated by the high falsealert rate produced by most presented approaches. Knowing this, is then anomalydetection something we want to include in the defence of our networks? We arguethat it is already useful but of course no silver bullet. Anomaly detection shouldbe used as a complement to other defences and for solving specific problems.
The complexity of the general problem of anomaly detection can be signifi-cantly reduced using the following principles:
• Model something simple not the complete world.
• Detect simple things not everything.
• Do not use a complex model if a simple one is enough.
In our work with ADWICE we can be accused to break all those principles.We model a complete computer network which is certainly complex. We tryto detect many types of attacks. We use a quite complex cluster-based model,rather than simple statistics like mean and standard deviation. It should comeas no surprise that like many related approaches this results in a relatively highfalse alert rate. When exploring new approaches and designing new algorithmshard problems are a welcome challenge. The easiest path is not the one mostprobable to result in new knowledge. However, when using anomaly detectionin the real world, we need to be much more pragmatic. Many commercial ap-proaches include anomaly detection to some extent today. Approaches in commer-cial tools include detection of attacks resulting in significant statistical deviations,like flooding denial service attacks and scanning attacks and modelling relativelysimple things like network protocols. This reduces the problem of false positives.Unfortunately this also implies that the goal of using anomaly detection to detectnew attacks is only partially fulfilled. The trend of using more general rule-basedapproaches, detecting attack types, rather than individual attack instances may tosome extent compensate for this.

134 8.2. FINAL WORDS
The topic of this thesis is intrusion detection. One should in this context re-member that many problems and attacks can be completely avoided or reducedusing suitable prevention techniques. Some may go further and argue that preven-tion is the only thing we need. We do not think that is the case. Prevention is ofcourse very important, but where prevention fails, we need also intrusion detec-tion. Using distributed network defence systems like Safeguard, attacks that slipthrough our other defences can be detected and with suitable response in placealso stopped.

BIBLIOGRAPHY 135
Bibliography
[1] Edward Amoroso. Intrusion Detection An introduction to Internet Surveil-lance, Correlation, Trace Back, Traps and Response. Intrusion.net Books,1999.
[2] Debra Anderson, Teresa F. Lunt, Harold Javits, Ann Tamaru, and AlfonsoValdes. Detecting unusual program behavior using the statistical compo-nents of NIDES. Technical Report SRI-CSL-95-06, SRI Internation, Com-puter Science Laboratory, May 1995.
[3] Apache, 2005. http://www.apache.org/ Acc. December 2005.
[4] Frank Apap, Andrew Honig, Shlomo Hershkop, Eleazar Eskin, and Sal-vatore J. Stolfo. Detecting malicious software by monitoring anomalouswindows registry accesses. In Recent Advances in Intrusion Detection(RAID’02), Proceedings, volume 2516 of Lecture Notes in Computer Sci-ence, pages 36–53. Springer, 2002.
[5] Martin Arvidson and Markus Carlbark. Intrusion detection systems - tech-nologies, weaknesses and trends. Master’s thesis, Linköping university,2003. LITH-ISY-EX-3390-2003.
[6] Midori Asaka, Takefumi Onabuta, Tadashi Inoue, and Shigeki Goto. Theuse of mobile agents in tracing an intruder in a local area network. In Pa-cific Rim International Conference on Artificial Intelligence (PRICAI’00),Proceedings, volume 1886 of Lecture Notes in Computer Science, pages373–382. Springer, 2000.
[7] Midori Asaka, Takefumi Onabuta, Tadashi Inoue, and Shigeki Goto. Re-mote attack detection method in ida: Mlsi-based intrusion detection us-ing discriminant analysis. In Symposium on Applications and the Internet(SAINT’02), Proceedings, pages 64–73. IEEE Computer Society, 2002.

136 BIBLIOGRAPHY
[8] Algirdas Avizienis, Jean-Claude Laprie, Brian Randell, and Carl E.Landwehr. Basic concepts and taxonomy of dependable and securecomputing. IEEE Transactions on Dependable and Secure Computing,1(1):11–33, 2004.
[9] Stefan Axelsson. The base-rate fallacy and the difficulty of intrusion detec-tion. ACM Transactions on Information and Systems Security, 3(3):186–205, 2000.
[10] Stefan Axelsson. Intrusion detection systems a survey and taxonomy. Tech-nical Report 99-15, Department of Computer Engineering, Chalmers Uni-versity of Technology, 2000.
[11] Rebecca Gurley Bace. Intrusion Detection. Macmillian Technical Publish-ing, 2000.
[12] Emelie Lundin Barse. Logging for intrusion and fraud detection. PhDthesis, Chalmers University of Technology, 2004.
[13] Emilie Lundin Barse and Erland Jonsson. Extracting attack manifestationsto determine log data requirements for intrusion detection. In 20th AnnualComputer Security Applications Conference (ACSAC 2004), Proceedings,pages 158–167. IEEE Computer Society, 2004.
[14] John Bigham, David Gamez, and Ning Lu. Safeguarding scada systemswith anomaly detection. In Mathematical Methods, Models, and Architec-tures for Computer Network Security (MMM-ACNS’03), Proceedings, vol-ume 2776 of Lecture Notes in Computer Science, pages 171–182. Springer,2003.
[15] Matt Bishop, Bhume Bhumiratana, Rick Crawford, and Karl N. Levitt.How to sanitize data. In 13th IEEE International Workshops on EnablingTechnologies, Infrastructure for Collaborative Enterprises (WETICE’04),Proceedings, pages 217–222. IEEE Computer Society, 2004.
[16] Kalle Burbeck. A preliminary agent architecture survey. Technical re-port, Real-Time Systems Laboratory, Linköping University, October 2002.http://www.ida.liu.se/∼rtslab/publications/2002/burbeck2002Agent.pdf.
[17] Kalle Burbeck. Agent platform evaluation. Technical report,Real-Time Systems Laboratory, Linköping University, April 2003.http://www.ida.liu.se/∼rtslab/publications/2003/burbeck2003Agent.pdf.

BIBLIOGRAPHY 137
[18] Kalle Burbeck, Daniel Garpe, and Simin Nadjm-Tehrani. Scale-up andperformance studies of three agent platforms. In 23rd IEEE InternationalPerformance, Computing, and Communications Conference (IPCCC’04),Proceedings, pages 857–863. IEEE, 2004.
[19] Alan Burns and Andy Wellings. Real-Time Systems and Programming Lan-guages. Addison Wesley, 2001.
[20] Brian D. Carrier and Blake Matheny. Methods for cluster-based incidentdetection. In Second IEEE International Workshop on Information Assur-ance (IWIA’04), Proceedings, pages 71–78. IEEE Computer Society, 2004.
[21] Sung-Bae Cho and Sang-Jun Han. Two sophisticated techniques to improvehmm-based intrusion detection systems. In Recent Advances in IntrusionDetection (RAID’03), Proceedings, volume 2820 of Lecture Notes in Com-puter Science, pages 207–219. Springer, 2003.
[22] Tobias Chyssler. Reducing false alarm rates in intrusion detection systems.Master’s thesis, Linköping University, 2003. LiTH-IDA-Ex-03/067-SE.
[23] Tobias Chyssler, Simin Nadjm-Tehrani, Stefan Burschka, and KalleBurbeck. Alarm reduction and correlation in defence of ip networks. In13th IEEE International Workshops on Enabling Technologies, Infrastruc-ture for Collaborative Enterprises (WETICE’04), Proceedings, pages 229–234. IEEE Computer Society, 2004.
[24] W. W. Cohen. Fast effective rule induction. In Machine Learning: the 12thInternational Conference, Proceedings. Morgan Kaufmann, 1995.
[25] Michael Collins and Michael K. Reiter. An empirical analysis of target-resident dos filters. In IEEE Symposium on Security and Privacy (S&P’04),pages 103–114. IEEE Computer Society, 2004.
[26] Common intrusion detection framework (cidf), 1999.http://www.isi.edu/gost/cidf/ Acc. March 2005.
[27] Corba, 2005. http://www.corba.org/ , Acc. December 2005.
[28] Borland Software Corporation. Visibroker, 2005.http://www.borland.com/visibroker/ Acc. March 2005.
[29] Cougaar agent architecture, 2005. http://www.cougaar.org/ , Acc. Decem-ber 2005.

138 BIBLIOGRAPHY
[30] North American Electricity Reliability Council. Sql slam-mer worm: Lessons learned for consideration by theelectricity sector slammer, June 2003. available at:http://www.esisac.com/publicdocs/SQL_Slammer_2003.pdf, Acc. August2005.
[31] D. Dasgupta, F. Gonzalez, K. Yallapu, J. Gomez, and R. Yarramsettii.Cids: An agent-based intrusion detection system. Computers & Security,24(5):387–398, 2005.
[32] Dipankar Dasgupta and Hal Brian. Mobile security agents for network traf-fic analysis. In DARPA Information Survivability Conference and Exposi-tion II (DISCEX-II), Volume 2, Proceedings, pages 332–340. IEEE Com-puter Society, 2001.
[33] Jose Duarte de Queiroz, Luiz F. Rust da Costa Carmo, and Luci Pirmez.Micael: An autonomous mobile agent system to protect new genera-tion networked applications. In Recent Advances in Intrusion Detection(RAID’99), Proceedings, 1999.
[34] Hervé Debar and David A. Curry. The intrusion detection mes-sage exchange format. Internet-Draft: work in progress, January2005. http://www.ietf.org/internet-drafts/draft-ietf-idwg-idmef-xml-14.txtAcc. March 2005.
[35] Hervé Debar, Marc Dacier, and Andreas Wespi. A revised taxonomy forintrusion detection systems. Technical Report 3176, IBM Research, 1999.
[36] Hervé Debar, Marc Dacier, and Andreas Wespi. Towards a taxonomy ofintrusion-detection systems. Computer Networks, 31(8):805–822, 1999.
[37] Hervé Debar, Marc Dacier, and Andreas Wespi. A revised taxonomy for in-trusion detection systems. Annales des Télécommunications, 55(7-8):361–378, 2000.
[38] Luc Devroye and László Györfi Gábor Lugosi. A probabilistic theory ofpattern recognition. Applications of Mathematics, 31, 1996.
[39] eeye digital security - pr20050812, 2005.http://www.eeye.com/html/company/press/PR20050812.html Acc. August2005.

BIBLIOGRAPHY 139
[40] Charles Elkan. Results of the kdd’99 classifier learning. ACM SIGKDDExplorations, 1(2):63 – 64, 2000.
[41] B. Ellison, D. A. Fisher, R. C. Linger, H. F. Lipson, T. Longstaff, and N. R.Mead. Survivable network systems: An emerging discipline. TechnicalReport CMU/SEI-97-TR-013, Carnegie Mellon University, Software Engi-neering Institute, November 1997.
[42] Emerald, 2005. http://www.sdl.sri.com/projects/emerald/ Acc. March2005.
[43] Martin Ester, Hans-Peter Kriegel, Jörg Sander, and Xiaowei Xu. A density-based algorithm for discovering clusters in large spatial databases withnoise. In 2nd International Conference on Knowledge Discovery and DataMining (KDD’96), Proceedings, pages 226–231. AAAI Press, 1996.
[44] Serge Fenet and Salima Hassas. A distributed intrusion detection and re-sponse system based on mobile autonomous agents using social insectscommunication paradigm. Electronic Notes in Theoretical Computer Sci-ence, 63, 2001.
[45] Douglas H. Fisher. Improving inference through conceptual clustering. InSixth National Conference on Artificial Intelligence, Proceedings, pages461–465. Morgan Kaufmann, 1987.
[46] Noria Foukia, Salima Hassas, Serge Fenet, and Paul Albuquerque. Com-bining immune systems and social insect metaphors: A paradigm fordistributed intrusion detection and response system. In Mobile Agentsfor Telecommunication Applications, 5th International Workshop (MATA2003), volume 2881 of Lecture Notes in Computer Science, pages 251–264. Springer, 2003.
[47] F-secure, 2005. http://www.f-secure.com/ Acc. August 2005.
[48] David Gamez, Simin Nadjm-Tehrani, John Bigham, Claudio Balducelli,Tobias Chyssler, and Kalle Burbeck. Safeguarding critical infrastructures.In Hassan B. Diab and Albert Y. Zomaya, editors, Dependable Comput-ing Systems: Paradigms, Performance Issues and Applications, chapter 18.John Wiley & Sons, 2005.
140 BIBLIOGRAPHY
[49] Venkatesh Ganti, Johannes Gehrke, and Raghu Ramakrishnan. Cactus -clustering categorical data using summaries. In Fifth ACM SIGKDD Inter-national Conference on Knowledge Discovery and Data Mining (KDD’99),Proceedings, pages 73–83. ACM, 1999.
[50] Venkatesh Ganti, Raghu Ramakrishnan, Johannes Gehrke, Allison L. Pow-ell, and James C. French. Clustering large datasets in arbitrary metricspaces. In 15th International Conference on Data Engineering, Proceed-ings, pages 502–511. IEEE Computer Society, 1999.
[51] Daniel Garpe. Comparison of three agent platforms performance, scalabil-ity and security. Master’s thesis, Linköping University, 2003. LiTH-IDA-Ex-03/070-SE.
[52] Anup K. Ghosh, Christoph Michael, and Michael Schatz. A real-time in-trusion detection system based on learning program behavior. In RecentAdvances in Intrusion Detection (RAID’00), Proceedings, volume 1907 ofLecture Notes in Computer Science, pages 93–109. Springer, 2000.
[53] Dieter Gollman. Computer security. John Wiley & Sons, 1999.
[54] Vaibhav Gowadia, Csilla Farkas, and Marco Valtorta. Paid: A probabilisticagent-based intrusion detection system. Computers & Security, 24(7):529–545, 2005.
[55] Grasshopper. http://www.grasshopper.de/index.html, Acc. August 2002.
[56] Robert S. Gray, George Cybenko, David Kotz, Ronald A. Peterson, andDaniela Rus. D’agents: Applications and performance of a mobile-agentsystem. Software - Practice and Experience, 32(6):543–573, 2002.
[57] Yu Guan, Ali A. Ghorbani, and Nabil Belacel. Y-means a clustering methodfor intrusion detection. In Canadian Conference on Electrical and Com-puter Engineering (CCECE 2003), Proceedings, volume 2, pages 1083 –1086. IEEE, 2003.
[58] Sudipto Guha, Rajeev Rastogi, and Kyuseok Shim. Cure: An efficientclustering algorithm for large databases. In ACM SIGMOD InternationalConference on Management of Data (SIGMOD 1998), Proceedings, vol-ume 27 of SIGMOD Record, pages 73–84. ACM Press, 1998.

BIBLIOGRAPHY 141
[59] Ajay Gupta and R. Sekar. An approach for detecting self-propagatingemail using anomaly detection. In Recent Advances in Intrusion Detec-tion (RAID’03), Proceedings, volume 2820 of Lecture Notes in ComputerScience, pages 55–72. Springer, 2003.
[60] J. Haines, D. Kewley Ryder, L. Tinnel, and S. Taylor. Validation of sensoralert correlators. IEEE Security and Privacy, 1(1):46–56, 2003.
[61] D. Heckerman. A tutorial on learning with bayesian networks. TechnicalReport MSR-TR-95-06, Microsoft Research, March 1996.
[62] Guy G. Helmer, Johnny S. Wong, Vasant Honavar, Les Miller, and YanxinWang. Lightweight agents for intrusion detection. Journal of Systems andSoftware, 67(2):109–122, 2003.
[63] Internet Systems Concortium Inc. Internet domain survey, 2005.http//www.isc.org/index.pl?/ops/ds/ Acc. September 2005.
[64] Tripwire Inc. Tripwire, 2005. http://www.tripwire.com/ Acc. Feb. 2005.
[65] Pew Internet and American Life. Online banking 2005 a pew internetproject data memo, 2004. http//www.pewinternet.org/ Acc. Feb. 2005.
[66] Intrusion detection exchange format working group(idwg), 2005.http://www.ietf.org/html.charters/idwg-charter.html Acc. March 2005.
[67] Issrl : Intelligent security systems research laboratory.http://issrl.cs.memphis.edu/, Acc. November 2005.
[68] Jade. http://sharon.cselt.it/projects/jade/, Acc. August 2005.
[69] JiaweiHan and Micheline Kamber. Data Mining - Concepts and Tech-niques. Morgan Kaufmann, 2001.
[70] K. Julisch. Clustering intrusion detection alarms to support root causeanalysis. ACM Transactions on Information and Systems Security,6(4):443–471, 2003.
[71] George Karypis, Eui-Hong Han, and Vipin Kumar. Chameleon: Hierar-chical clustering using dynamic modeling. IEEE Computer, 32(8):68–75,1999.
[72] Teuvo Kohonen. The self-organizing map. Neurocomputing, 21(1-3):1–6,1998.

142 BIBLIOGRAPHY
[73] R. Krishnapuram, A. Joshi, O. Nasraoui, and L. Yi. Low-complexity fuzzyrelational clustering algorithms for web mining. IEEE transactions on fuzzysystems, 9:595–607, 2001.
[74] Ulf Larson, Emilie Lundin Barse, and Erland Jonsson. Metal - a tool forextracting attack manifestations. In Detection of Intrusions and Malware,and Vulnerability Assessment (DIMVA’05), Proceedings, volume 3548 ofLecture Notes in Computer Science, pages 85–102. Springer, 2005.
[75] Richard Lippmann, Joshua W. Haines, David J. Fried, Jonathan Korba, andKumar Das. The 1999 darpa off-line intrusion detection evaluation. Com-puter Networks, 34(4):579–595, 2000.
[76] Richard Lippmann, Seth E. Webster, and Douglas Stetson. The effect ofidentifying vulnerabilities and patching software on the utility of networkintrusion detection. In Recent Advances in Intrusion Detection (RAID’02),Proceedings, volume 2516 of Lecture Notes in Computer Science, pages307–326. Springer, 2002.
[77] Emilie Lundin and Erland Jonsson. Anomaly-based intrusion detection:privacy concerns and other problems. Computer Networks, 34(4):623–640,2000.
[78] Matthew V. Mahoney and Philip K. Chan. An analysis of the 1999darpa/lincoln laboratory evaluation data for network anomaly detection.In Recent Advances in Intrusion Detection (RAID’03), Proceedings, vol-ume 2820 of Lecture Notes in Computer Science, pages 220–237. Springer,2003.
[79] Zakia Marrakchi, Ludovic Mé, Bernard Vivinis, and Benjamin Morin.Flexible intrusion detection using variable-length behavior modeling in dis-tributed environment: Application to corba objects. In Recent Advancesin Intrusion Detection (RAID’00), Proceedings, volume 1907 of LectureNotes in Computer Science, pages 130–144. Springer, 2000.
[80] John McHugh. Testing intrusion detection systems: a critique of the 1998and 1999 darpa intrusion detection system evaluations as performed by lin-coln laboratory. ACM Transactions on Information and System Security,3(4):262–294, 2000.
BIBLIOGRAPHY 143
[81] Peter Mell, Donald G. Marks, and Mark McLarnon. A denial-of-serviceresistant intrusion detection architecture. Computer Networks, 34(4):641–658, 2000.
[82] Tom M. Mitchell. Machine Learning. McGraw-Hill, 1997.
[83] Srinivas Mukkamala, Guadalupe Janoski, and Andrew Sung. Intrusion de-tection using neural networks and support vector machines. In Proceedingsof the 2002 International Joint Conference on Neural Networks (IJCNN’02), pages 1702–1707. IEEE, 2002.
[84] J.C. Munson and S. Wimer. Watcher the missing piece of the securitypuzzle. In Proceedings of the 17th Annual Computer Security ApplicationsConference (ACSAC’01), pages 230–239. IEEE Computer Society, 2001.
[85] Nessus, 2005. http://www.nessus.org/ Acc. December 2005.
[86] Nmap, 2005. http://www.insecure.org/nmap/ Acc. December 2005.
[87] Sang Hyun Oh and Won Suk Lee. An anomaly intrusion detection methodby clustering normal user behavior. Computers & Security, 22(7):596–612,2003.
[88] Mizuki Oka, Yoshihiro Oyama, Hirotake Abe, and Kazuhiko Kato. Anom-aly detection using layered networks based on eigen co-occurrence matrix.In Recent Advances in Intrusion Detection (RAID’04), Proceedings, vol-ume 3224 of Lecture Notes in Computer Science, pages 223–237. Springer,2004.
[89] The perl directory, 2005. http://www.perl.org/ , Acc. December 2005.
[90] Leonid Portnoy, Eleazar Eskin, and Salvatore Stolfo. Intrusion detectionwith unlabeled data using clustering. In ACM Workshop on Data MiningApplied to Security (DMSA-2001). ACM, 2001.
[91] K. Poulsen. Slammer worm crashed ohio nuke plant network, August 2003.SecurityFocus News: http://www.securityfocus.com/news/6767, Acc. Au-gust 2005.
[92] Thomas H. Ptacek and Timothy N. Newsham. Insertion, evasion and denialof service: Eluding network intrusion detection. Technical Report T2R-0Y6, Secure networks Inc., 1998.

144 BIBLIOGRAPHY
[93] Lawrence R. Rabiner. A tutorial on hidden markov models and selectedapplications in speech recognition. Proceedings of the IEEE, 77(2):257 –286, 1989.
[94] Manikantan Ramadas, Shawn Ostermann, and Brett C. Tjaden. Detectinganomalous network traffic with self-organizing maps. In Recent Advancesin Intrusion Detection (RAID’03), Proceedings, volume 2820 of LectureNotes in Computer Science, pages 36–54. Springer, 2003.
[95] Stuart Russell and Peter Norvig. Artificial Intelligence A Modern Ap-proach. Prentice-Hall, 1995.
[96] Safeguard. http://www.ist-safeguard.org/ Acc. May 2004.
[97] Final report on architecture. Deliverable D6, The Safeguard project, July2003.
[98] Validation, test beds and results. Deliverable D9, The Safeguard project,2004.
[99] Matthew G. Schultz, Eleazar Eskin, Erez Zadok, and Salvatore J. Stolfo.Data mining methods for detection of new malicious executables. In IEEESymposium on Security and Privacy (S&P’01), Proceedings, pages 38–49.IEEE, 2001.
[100] R. Sekar, A. Gupta, J. Frullo, T. Shanbhag, A. Tiwari, H. Yang, andS. Zhou. Specification-based anomaly detection: a new approach for de-tecting network intrusions. In 9th ACM conference on computer and com-munications security (CCS’02), Proceedings, pages 265–274. ACM Press,2002.
[101] Karlton Sequeira and Mohammed Zaki. Admit anomaly-based data miningfor intrusions. In 8th ACM SIGKDD international conference on Knowl-edge discovery and data mining, Proceedings, pages 386–395. ACM Press,2002.
[102] Hiren Shah, Jeffrey L Undercoffer, and Anupam Joshi. Fuzzy clustering forintrusion detection. In Proceedings of the 12th IEEE International Confer-ence on Fuzzy Systems (FUZZ ’03), pages 1274 – 1278. IEEE, 2003.
[103] Robert W. Shirey. Internet security glossary. RFC 2828, May 2000.http://www.ietf.org/rfc/rfc2828.txt Acc. March 2005.

BIBLIOGRAPHY 145
[104] J. Sima. Introduction to neural networks. Technical Report V-755, ICSCAS, Prague, 1998.
[105] Snort, 2005. http://www.snort.org/ Acc. September 2005.
[106] Eugene H. Spafford and Diego Zamboni. Intrusion detection using au-tonomous agents. Computer Networks, 34(4):547–570, 2000.
[107] Hideki Tai and Kazuya Kosaka. The aglets project. Communications of theACM, 42(3):100–101, 1999.
[108] Tryllian. http://www.tryllian.com, Acc. August 2005.
[109] Jeffrey Undercoffer, Anupam Joshi, and John Pinkston. Modeling com-puter attacks: An ontology for intrusion detection. In Recent Advancesin Intrusion Detection (RAID’03), Proceedings, volume 2820 of LectureNotes in Computer Science, pages 113–135. Springer, 2003.
[110] Irvine University of California. The uci kdd archive, 2003.http//kdd.ics.uci.edu Acc. February 2004.
[111] Alfonso Valdes and Keith Skinner. Adaptive, model-based monitoringfor cyber attack detection. In Recent Advances in Intrusion Detection(RAID’00), Proceedings, volume 1907 of Lecture Notes in Computer Sci-ence, pages 80–92. Springer, 2000.
[112] H. S. Venter and Jan H. P. Eloff. A taxonomy for information securitytechnologies. Computers & Security, 22(4):299–307, 2003.
[113] Voyager, 2005. http://www.recursionsw.com/mobile_agents.htm , Acc. De-cember 2005.
[114] David Wagner and Paolo Soto. Mimicry attacks on host-based intrusiondetection systems. In 9th ACM conference on Computer and communi-cations security (CCS’02), Proceedings, pages 255–264, New York, NY,USA, 2002. ACM Press.
[115] Ke Wang and Salvatore J. Stolfo. Anomalous payload-based network in-trusion detection. In Recent Advances in Intrusion Detection (RAID’04),Proceedings, volume 3224 of Lecture Notes in Computer Science, pages203–222. Springer, 2004.

146 BIBLIOGRAPHY
[116] Wei Wang, Jiong Yang, and Richard R. Muntz. Sting: A statistical informa-tion grid approach to spatial data mining. In 23rd International Conferenceon Very Large Data Bases (VLDB’97), Proceedings, pages 186–195. Mor-gan Kaufmann, 1997.
[117] Paul D. Williams, Kevin P. Anchor, John L. Bebo, Gregg H. Gunsch, andGary B. Lamont. Cdis: Towards a computer immune system for detectingnetwork intrusions. In Recent Advances in Intrusion Detection (RAID’01),Proceedings, volume 2212 of Lecture Notes in Computer Science, pages117–133. Springer, 2001.
[118] Mark Wood and Michael Erlinger. Intrusion detection message ex-change requirements. Internet-Draft: work in progress, October 2002.http://www.ietf.org/html.charters/idwg-charter.html Acc. March 2005.
[119] Michael Wooldridge. An introduction to multi agent systems. John Wiley& Sons, 2002.
[120] Yinglian Xie, Hyang-Ah Kim, David R. O’Hallaron, Michael K. Reiter,and Hui Zhang. Seurat: A pointillist approach to anomaly detection. InRecent Advances in Intrusion Detection (RAID’04), Proceedings, volume3224 of Lecture Notes in Computer Science, pages 238–257. Springer,2004.
[121] Stefano Zanero and Sergio M. Savaresi. Unsupervised learning techniquesfor an intrusion detection system. In Proceedings of the 2004 ACM Sympo-sium on Applied Computing (SAC´04), pages 412–419. ACM, 2004.
[122] Tian Zhang, Raghu Ramakrishnan, and Miron Livny. Birch an efficientdata clustering method for very large databases. In ACM SIGMOD Interna-tional Conference on Management of Data (SIGMOD 1996), Proceedings,volume 25 of SIGMOD Record, pages 103–114. ACM, 1996.

LINKÖPINGS UNIVERSITET
Rapporttyp Report category
Licentiatavhandling
Examensarbete
C-uppsats
D-uppsats
Övrig rapport
Språk Language
Svenska/Swedish
Engelska/English
Titel Adaptive Real-time Anomaly Detection for Safeguarding Critical Networks
Författare Kalle Burbeck
Sammanfattning Abstract
ISBN
ISRN
Serietitel och serienummer ISSN Title of series, numbering
Linköping Studies in Science and Technology
Thesis No. 1231
Nyckelord intrusion detection, anomaly detection, real-time, clustering, adaptation, IP networks
Datum Date
URL för elektronisk version
X
X
2006-02-28
Avdelning, institution Division, department
Institutionen för datavetenskap
Department of Computer and Information Science
Critical networks require defence in depth incorporating many different security technologies including intrusion detection. One important intrusion detection approach is called anomaly detection where normal (good) behaviour of users of the protected system is modelled, often using machine learning or data mining techniques. During detection new data is matched against the normality model, and deviations are marked as anomalies. Since no knowledge of attacks is needed to train the normality model, anomaly detection may detect previously unknown attacks. In this thesis we present ADWICE (Anomaly Detection With fast Incremental Clustering) and evaluate it in IP networks. ADWICE has the following properties: (i) Adaptation - Rather than making use of extensive periodic retraining sessions on stored off-line data to handle changes, ADWICE is fully incremental making very flexible on-line training of the model possible without destroying what is already learnt. When subsets of the model are not useful anymore, those clusters can be forgotten. (ii) Performance - ADWICE is linear in the number of input data thereby heavily reducing training time compared to alternative clustering algorithms. Training time as well as detection time is further reduced by the use of an integrated search-index. (iii) Scalability - Rather than keeping all data in memory, only compact cluster summaries are used. The linear time complexity also improves scalability of training. We have implemented ADWICE and integrated the algorithm in a software agent. The agent is a part of the Safeguard agent architecture, developed to perform network monitoring, intrusion detection and correlation as well as recovery. We have also applied ADWICE to publicly available network data to compare our approach to related works with similar approaches. The evaluation resulted in a high detection rate at reasonable false positives rate.
91-85497-23-1
0280-7971
LiU-Tek-Lic-2006:12


No 17
No 28
No 29No 48No 52No 60No 71No 72No 73No 74No 104
No 108No 111No 113No 118
No 126No 127
No 139No 140No 146No 150No 165No 166No 174No 177No 181No 184No 187No 189No 196No 197No 203No 212No 230No 237No 250No 253No 260No 283
No 298No 318
No 319
No 326No 328No 333No 335
No 348No 352
No 371No 378No 380No 381No 383No 386No 398
Department of Computer and Information ScienceLinköpings universitet
Linköping Studies in Science and TechnologyFaculty of Arts and Sciences - Licentiate Theses
Vojin Plavsic: Interleaved Processing of Non-Numerical Data Stored on a Cyclic Memory. (Available at:FOA, Box 1165, S-581 11 Linköping, Sweden. FOA Report B30062E)Arne Jönsson, Mikael Patel: An Interactive Flowcharting Technique for Communicating and Realizing Al-gorithms, 1984.Johnny Eckerland: Retargeting of an Incremental Code Generator, 1984.Henrik Nordin: On the Use of Typical Cases for Knowledge-Based Consultation and Teaching, 1985.Zebo Peng: Steps Towards the Formalization of Designing VLSI Systems, 1985.Johan Fagerström: Simulation and Evaluation of Architecture based on Asynchronous Processes, 1985.Jalal Maleki: ICONStraint, A Dependency Directed Constraint Maintenance System, 1987.Tony Larsson: On the Specification and Verification of VLSI Systems, 1986.Ola Strömfors: A Structure Editor for Documents and Programs, 1986.Christos Levcopoulos: New Results about the Approximation Behavior of the Greedy Triangulation, 1986.Shamsul I. Chowdhury: Statistical Expert Systems - a Special Application Area for Knowledge-Based Com-puter Methodology, 1987.Rober Bilos: Incremental Scanning and Token-Based Editing, 1987.Hans Block: SPORT-SORT Sorting Algorithms and Sport Tournaments, 1987.Ralph Rönnquist: Network and Lattice Based Approaches to the Representation of Knowledge, 1987.Mariam Kamkar, Nahid Shahmehri: Affect-Chaining in Program Flow Analysis Applied to Queries of Pro-grams, 1987.Dan Strömberg: Transfer and Distribution of Application Programs, 1987.Kristian Sandahl: Case Studies in Knowledge Acquisition, Migration and User Acceptance of Expert Sys-tems, 1987.Christer Bäckström: Reasoning about Interdependent Actions, 1988.Mats Wirén: On Control Strategies and Incrementality in Unification-Based Chart Parsing, 1988.Johan Hultman: A Software System for Defining and Controlling Actions in a Mechanical System, 1988.Tim Hansen: Diagnosing Faults using Knowledge about Malfunctioning Behavior, 1988.Jonas Löwgren: Supporting Design and Management of Expert System User Interfaces, 1989.Ola Petersson: On Adaptive Sorting in Sequential and Parallel Models, 1989.Yngve Larsson: Dynamic Configuration in a Distributed Environment, 1989.Peter Åberg: Design of a Multiple View Presentation and Interaction Manager, 1989.Henrik Eriksson: A Study in Domain-Oriented Tool Support for Knowledge Acquisition, 1989.Ivan Rankin: The Deep Generation of Text in Expert Critiquing Systems, 1989.Simin Nadjm-Tehrani: Contributions to the Declarative Approach to Debugging Prolog Programs, 1989.Magnus Merkel: Temporal Information in Natural Language, 1989.Ulf Nilsson: A Systematic Approach to Abstract Interpretation of Logic Programs, 1989.Staffan Bonnier: Horn Clause Logic with External Procedures: Towards a Theoretical Framework, 1989.Christer Hansson: A Prototype System for Logical Reasoning about Time and Action, 1990.Björn Fjellborg: An Approach to Extraction of Pipeline Structures for VLSI High-Level Synthesis, 1990.Patrick Doherty: A Three-Valued Approach to Non-Monotonic Reasoning, 1990.Tomas Sokolnicki: Coaching Partial Plans: An Approach to Knowledge-Based Tutoring, 1990.Lars Strömberg: Postmortem Debugging of Distributed Systems, 1990.Torbjörn Näslund: SLDFA-Resolution - Computing Answers for Negative Queries, 1990.Peter D. Holmes: Using Connectivity Graphs to Support Map-Related Reasoning, 1991.Olof Johansson: Improving Implementation of Graphical User Interfaces for Object-Oriented Knowledge-Bases, 1991.Rolf G Larsson: Aktivitetsbaserad kalkylering i ett nytt ekonomisystem, 1991.Lena Srömbäck: Studies in Extended Unification-Based Formalism for Linguistic Description: An Algo-rithm for Feature Structures with Disjunction and a Proposal for Flexible Systems, 1992.Mikael Pettersson: DML-A Language and System for the Generation of Efficient Compilers from Denota-tional Specification, 1992.Andreas Kågedal: Logic Programming with External Procedures: an Implementation, 1992.Patrick Lambrix: Aspects of Version Management of Composite Objects, 1992.Xinli Gu: Testability Analysis and Improvement in High-Level Synthesis Systems, 1992.Torbjörn Näslund: On the Role of Evaluations in Iterative Development of Managerial Support Sytems,1992.Ulf Cederling: Industrial Software Development - a Case Study, 1992.Magnus Morin: Predictable Cyclic Computations in Autonomous Systems: A Computational Model and Im-plementation, 1992.Mehran Noghabai: Evaluation of Strategic Investments in Information Technology, 1993.Mats Larsson: A Transformational Approach to Formal Digital System Design, 1993.Johan Ringström: Compiler Generation for Parallel Languages from Denotational Specifications, 1993.Michael Jansson: Propagation of Change in an Intelligent Information System, 1993.Jonni Harrius: An Architecture and a Knowledge Representation Model for Expert Critiquing Systems, 1993.Per Österling: Symbolic Modelling of the Dynamic Environments of Autonomous Agents, 1993.
Johan Boye: Dependency-based Groudness Analysis of Functional Logic Programs, 1993.
No 402No 406No 414
No 417No 436No 437No 440FHS 3/94
FHS 4/94
No 441No 446No 450No 451No 452
No 455
FHS 5/94
No 462No 463No 464No 469No 473No 475No 476No 478FHS 7/95No 482
No 488
No 489No 497No 498
No 503FHS 8/95
FHS 9/95
No 513No 517No 518No 522No 538No 545
No 546FiF-a 1/9
No 549No 550
No 557No 558No 561No 563No 567No 575No 576No 587No 589
No 591No 595No 597
Lars Degerstedt: Tabulated Resolution for Well Founded Semantics, 1993.Anna Moberg: Satellitkontor - en studie av kommunikationsmönster vid arbete på distans, 1993.Peter Carlsson: Separation av företagsledning och finansiering - fallstudier av företagsledarutköp ur ett agent-teoretiskt perspektiv, 1994.Camilla Sjöström: Revision och lagreglering - ett historiskt perspektiv, 1994.Cecilia Sjöberg: Voices in Design: Argumentation in Participatory Development, 1994.Lars Viklund: Contributions to a High-level Programming Environment for a Scientific Computing, 1994.Peter Loborg: Error Recovery Support in Manufacturing Control Systems, 1994.Owen Eriksson: Informationssystem med verksamhetskvalitet - utvärdering baserat på ett verksamhetsinrik-tat och samskapande perspektiv, 1994.Karin Pettersson: Informationssystemstrukturering, ansvarsfördelning och användarinflytande - En kompa-rativ studie med utgångspunkt i två informationssystemstrategier, 1994.Lars Poignant: Informationsteknologi och företagsetablering - Effekter på produktivitet och region, 1994.Gustav Fahl: Object Views of Relational Data in Multidatabase Systems, 1994.Henrik Nilsson: A Declarative Approach to Debugging for Lazy Functional Languages, 1994.Jonas Lind: Creditor - Firm Relations: an Interdisciplinary Analysis, 1994.Martin Sköld: Active Rules based on Object Relational Queries - Efficient Change Monitoring Techniques,1994.Pär Carlshamre: A Collaborative Approach to Usability Engineering: Technical Communicators and SystemDevelopers in Usability-Oriented Systems Development, 1994.Stefan Cronholm: Varför CASE-verktyg i systemutveckling? - En motiv- och konsekvensstudie avseende ar-betssätt och arbetsformer, 1994.Mikael Lindvall: A Study of Traceability in Object-Oriented Systems Development, 1994.Fredrik Nilsson: Strategi och ekonomisk styrning - En studie av Sandviks förvärv av Bahco Verktyg, 1994.Hans Olsén: Collage Induction: Proving Properties of Logic Programs by Program Synthesis, 1994.Lars Karlsson: Specification and Synthesis of Plans Using the Features and Fluents Framework, 1995.Ulf Söderman: On Conceptual Modelling of Mode Switching Systems, 1995.Choong-ho Yi: Reasoning about Concurrent Actions in the Trajectory Semantics, 1995.Bo Lagerström: Successiv resultatavräkning av pågående arbeten. - Fallstudier i tre byggföretag, 1995.Peter Jonsson: Complexity of State-Variable Planning under Structural Restrictions, 1995.Anders Avdic: Arbetsintegrerad systemutveckling med kalkylkprogram, 1995.Eva L Ragnemalm: Towards Student Modelling through Collaborative Dialogue with a Learning Compani-on, 1995.Eva Toller: Contributions to Parallel Multiparadigm Languages: Combining Object-Oriented and Rule-BasedProgramming, 1995.Erik Stoy: A Petri Net Based Unified Representation for Hardware/Software Co-Design, 1995.Johan Herber: Environment Support for Building Structured Mathematical Models, 1995.Stefan Svenberg: Structure-Driven Derivation of Inter-Lingual Functor-Argument Trees for Multi-LingualGeneration, 1995.Hee-Cheol Kim: Prediction and Postdiction under Uncertainty, 1995.Dan Fristedt: Metoder i användning - mot förbättring av systemutveckling genom situationell metodkunskapoch metodanalys, 1995.Malin Bergvall: Systemförvaltning i praktiken - en kvalitativ studie avseende centrala begrepp, aktiviteter ochansvarsroller, 1995.Joachim Karlsson: Towards a Strategy for Software Requirements Selection, 1995.Jakob Axelsson: Schedulability-Driven Partitioning of Heterogeneous Real-Time Systems, 1995.Göran Forslund: Toward Cooperative Advice-Giving Systems: The Expert Systems Experience, 1995.Jörgen Andersson: Bilder av småföretagares ekonomistyrning, 1995.Staffan Flodin: Efficient Management of Object-Oriented Queries with Late Binding, 1996.Vadim Engelson: An Approach to Automatic Construction of Graphical User Interfaces for Applications inScientific Computing, 1996.Magnus Werner : Multidatabase Integration using Polymorphic Queries and Views, 1996.
6 Mikael Lind: Affärsprocessinriktad förändringsanalys - utveckling och tillämpning av synsätt och metod,1996.Jonas Hallberg: High-Level Synthesis under Local Timing Constraints, 1996.Kristina Larsen: Förutsättningar och begränsningar för arbete på distans - erfarenheter från fyra svenska före-tag. 1996.Mikael Johansson: Quality Functions for Requirements Engineering Methods, 1996.Patrik Nordling: The Simulation of Rolling Bearing Dynamics on Parallel Computers, 1996.Anders Ekman: Exploration of Polygonal Environments, 1996.Niclas Andersson: Compilation of Mathematical Models to Parallel Code, 1996.Johan Jenvald: Simulation and Data Collection in Battle Training, 1996.Niclas Ohlsson: Software Quality Engineering by Early Identification of Fault-Prone Modules, 1996.Mikael Ericsson: Commenting Systems as Design Support—A Wizard-of-Oz Study, 1996.Jörgen Lindström: Chefers användning av kommunikationsteknik, 1996.Esa Falkenroth: Data Management in Control Applications - A Proposal Based on Active Database Systems,1996.Niclas Wahllöf: A Default Extension to Description Logics and its Applications, 1996.Annika Larsson: Ekonomisk Styrning och Organisatorisk Passion - ett interaktivt perspektiv, 1997.
Ling Lin: A Value-based Indexing Technique for Time Sequences, 1997.
No 598No 599No 607
No 609FiF-a 4FiF-a 6
No 615No 623No 626No 627No 629No 631No 639No 640No 643No 653FiF-a 13
No 674
No 676No 668
No 675
FiF-a 14
No 695No 700FiF-a 16
No 712
No 719No 723No 725No 730
No 731No 733No 734
FiF-a 21FiF-a 22No 737No 738FiF-a 25
No 742No 748No 751
No 752No 753No 754
No 766No 769No 775FiF-a 30No 787
No 788
No 790No 791No 800No 807
Rego Granlund: C3Fire - A Microworld Supporting Emergency Management Training, 1997.Peter Ingels: A Robust Text Processing Technique Applied to Lexical Error Recovery, 1997.Per-Arne Persson: Toward a Grounded Theory for Support of Command and Control in Military Coalitions,1997.Jonas S Karlsson: A Scalable Data Structure for a Parallel Data Server, 1997.Carita Åbom: Videomötesteknik i olika affärssituationer - möjligheter och hinder, 1997.Tommy Wedlund: Att skapa en företagsanpassad systemutvecklingsmodell - genom rekonstruktion, värde-ring och vidareutveckling i T50-bolag inom ABB, 1997.Silvia Coradeschi: A Decision-Mechanism for Reactive and Coordinated Agents, 1997.Jan Ollinen: Det flexibla kontorets utveckling på Digital - Ett stöd för multiflex? 1997.David Byers: Towards Estimating Software Testability Using Static Analysis, 1997.Fredrik Eklund: Declarative Error Diagnosis of GAPLog Programs, 1997.Gunilla Ivefors: Krigsspel coh Informationsteknik inför en oförutsägbar framtid, 1997.Jens-Olof Lindh: Analysing Traffic Safety from a Case-Based Reasoning Perspective, 1997Jukka Mäki-Turja:. Smalltalk - a suitable Real-Time Language, 1997.Juha Takkinen: CAFE: Towards a Conceptual Model for Information Management in Electronic Mail, 1997.Man Lin: Formal Analysis of Reactive Rule-based Programs, 1997.Mats Gustafsson: Bringing Role-Based Access Control to Distributed Systems, 1997.Boris Karlsson: Metodanalys för förståelse och utveckling av systemutvecklingsverksamhet. Analys och vär-dering av systemutvecklingsmodeller och dess användning, 1997.Marcus Bjäreland: Two Aspects of Automating Logics of Action and Change - Regression and Tractability,1998.Jan Håkegård: Hiera rchical Test Architecture and Board-Level Test Controller Synthesis, 1998.Per-Ove Zetterlund: Normering av svensk redovisning - En studie av tillkomsten av Redovisningsrådets re-kommendation om koncernredovisning (RR01:91), 1998.Jimmy Tjäder: Projektledaren & planen - en studie av projektledning i tre installations- och systemutveck-lingsprojekt, 1998.Ulf Melin: Informationssystem vid ökad affärs- och processorientering - egenskaper, strategier och utveck-ling, 1998.Tim Heyer: COMPASS: Introduction of Formal Methods in Code Development and Inspection, 1998.Patrik Hägglund: Programming Languages for Computer Algebra, 1998.Marie-Therese Christiansson: Inter-organistorisk verksamhetsutveckling - metoder som stöd vid utvecklingav partnerskap och informationssystem, 1998.Christina Wennestam: Information om immateriella resurser. Investeringar i forskning och utveckling samti personal inom skogsindustrin, 1998.Joakim Gustafsson: Extending Temporal Action Logic for Ramification and Concurrency, 1998.Henrik André-Jönsson: Indexing time-series data using text indexing methods, 1999.Erik Larsson: High-Level Testability Analysis and Enhancement Techniques, 1998.Carl-Johan Westin: Informationsförsörjning: en fråga om ansvar - aktiviteter och uppdrag i fem stora svens-ka organisationers operativa informationsförsörjning, 1998.Åse Jansson: Miljöhänsyn - en del i företags styrning, 1998.Thomas Padron-McCarthy: Performance-Polymorphic Declarative Queries, 1998.Anders Bäckström: Värdeskapande kreditgivning - Kreditriskhantering ur ett agentteoretiskt perspektiv,1998.Ulf Seigerroth: Integration av förändringsmetoder - en modell för välgrundad metodintegration, 1999.Fredrik Öberg: Object-Oriented Frameworks - A New Strategy for Case Tool Development, 1998.Jonas Mellin: Predictable Event Monitoring, 1998.Joakim Eriksson: Specifying and Managing Rules in an Active Real-Time Database System, 1998.Bengt E W Andersson: Samverkande informationssystem mellan aktörer i offentliga åtaganden - En teori omaktörsarenor i samverkan om utbyte av information, 1998.Pawel Pietrzak: Static Incorrectness Diagnosis of CLP (FD), 1999.Tobias Ritzau: Real-Time Reference Counting in RT-Java, 1999.Anders Ferntoft: Elektronisk affärskommunikation - kontaktkostnader och kontaktprocesser mellan kunderoch leverantörer på producentmarknader,1999.Jo Skåmedal: Arbete på distans och arbetsformens påverkan på resor och resmönster, 1999.Johan Alvehus: Mötets metaforer. En studie av berättelser om möten, 1999.Magnus Lindahl: Bankens villkor i låneavtal vid kreditgivning till högt belånade företagsförvärv: En studieur ett agentteoretiskt perspektiv, 2000.Martin V. Howard: Designing dynamic visualizations of temporal data, 1999.Jesper Andersson: Towards Reactive Software Architectures, 1999.Anders Henriksson: Unique kernel diagnosis, 1999.Pär J. Ågerfalk: Pragmatization of Information Systems - A Theoretical and Methodological Outline, 1999.Charlotte Björkegren: Learning for the next project - Bearers and barriers in knowledge transfer within anorganisation, 1999.Håkan Nilsson: Informationsteknik som drivkraft i granskningsprocessen - En studie av fyra revisionsbyråer,2000.Erik Berglund: Use-Oriented Documentation in Software Development, 1999.Klas Gäre: Verksamhetsförändringar i samband med IS-införande, 1999.Anders Subotic: Software Quality Inspection, 1999.
Svein Bergum: Managerial communication in telework, 2000.
No 809FiF-a 32
No 808No 820No 823No 832FiF-a 34
No 842No 844FiF-a 37FiF-a 40FiF-a 41No. 854No 863No 881No 882
No 890
Fif-a 47No 894No 906No 917No 916
Fif-a-49
Fif-a-51
No 919
No 915No 931
No 933
No 938No 942No 956
FiF-a 58No 964No 973No 958
Fif-a 61No 985
No 982No 989No 990
No 991No 999No 1000No 1001
No 988FiF-a 62
No 1003No 1005
No 1008No 1010No 1015No 1018No 1022
FiF-a 65
No 1024
Flavius Gruian: Energy-Aware Design of Digital Systems, 2000.Karin Hedström: Kunskapsanvändning och kunskapsutveckling hos verksamhetskonsulter - Erfarenheterfrån ett FOU-samarbete, 2000.Linda Askenäs: Affärssystemet - En studie om teknikens aktiva och passiva roll i en organisation, 2000.Jean Paul Meynard: Control of industrial robots through high-level task programming, 2000.Lars Hult: Publika Gränsytor - ett designexempel, 2000.Paul Pop: Scheduling and Communication Synthesis for Distributed Real-Time Systems, 2000.Göran Hultgren: Nätverksinriktad Förändringsanalys - perspektiv och metoder som stöd för förståelse ochutveckling av affärsrelationer och informationssystem, 2000.Magnus Kald: The role of management control systems in strategic business units, 2000.Mikael Cäker: Vad kostar kunden? Modeller för intern redovisning, 2000.Ewa Braf: Organisationers kunskapsverksamheter - en kritisk studie av ”knowledge management”, 2000.Henrik Lindberg: Webbaserade affärsprocesser - Möjligheter och begränsningar, 2000.Benneth Christiansson: Att komponentbasera informationssystem - Vad säger teori och praktik?, 2000.Ola Pettersson: Deliberation in a Mobile Robot, 2000.Dan Lawesson: Towards Behavioral Model Fault Isolation for Object Oriented Control Systems, 2000.Johan Moe: Execution Tracing of Large Distributed Systems, 2001.Yuxiao Zhao: XML-based Frameworks for Internet Commerce and an Implementation of B2Be-procurement, 2001.Annika Flycht-Eriksson: Domain Knowledge Management inInformation-providing Dialogue systems,2001.Per-Arne Segerkvist: Webbaserade imaginära organisationers samverkansformer, 2001.Stefan Svarén: Styrning av investeringar i divisionaliserade företag - Ett koncernperspektiv, 2001.Lin Han: Secure and Scalable E-Service Software Delivery, 2001.Emma Hansson: Optionsprogram för anställda - en studie av svenska börsföretag, 2001.Susanne Odar: IT som stöd för strategiska beslut, en studie av datorimplementerade modeller av verksamhetsom stöd för beslut om anskaffning av JAS 1982, 2002.Stefan Holgersson: IT-system och filtrering av verksamhetskunskap - kvalitetsproblem vid analyser och be-slutsfattande som bygger på uppgifter hämtade från polisens IT-system, 2001.Per Oscarsson:Informationssäkerhet i verksamheter - begrepp och modeller som stöd för förståelse av infor-mationssäkerhet och dess hantering, 2001.Luis Alejandro Cortes: A Petri Net Based Modeling and Verification Technique for Real-Time EmbeddedSystems, 2001.Niklas Sandell: Redovisning i skuggan av en bankkris - Värdering av fastigheter. 2001.Fredrik Elg: Ett dynamiskt perspektiv på individuella skillnader av heuristisk kompetens, intelligens, mentalamodeller, mål och konfidens i kontroll av mikrovärlden Moro, 2002.Peter Aronsson: Automatic Parallelization of Simulation Code from Equation Based Simulation Languages,2002.Bourhane Kadmiry: Fuzzy Control of Unmanned Helicopter, 2002.Patrik Haslum: Prediction as a Knowledge Representation Problem: A Case Study in Model Design, 2002.Robert Sevenius: On the instruments of governance - A law & economics study of capital instruments in li-mited liability companies, 2002.Johan Petersson: Lokala elektroniska marknadsplatser - informationssystem för platsbundna affärer, 2002.Peter Bunus: Debugging and Structural Analysis of Declarative Equation-Based Languages, 2002.Gert Jervan: High-Level Test Generation and Built-In Self-Test Techniques for Digital Systems, 2002.Fredrika Berglund: Management Control and Strategy - a Case Study of Pharmaceutical Drug Development,2002.Fredrik Karlsson: Meta-Method for Method Configuration - A Rational Unified Process Case, 2002.Sorin Manolache: Schedulability Analysis of Real-Time Systems with Stochastic Task Execution Times,2002.Diana Szentiványi: Performance and Availability Trade-offs in Fault-Tolerant Middleware, 2002.Iakov Nakhimovski: Modeling and Simulation of Contacting Flexible Bodies in Multibody Systems, 2002.Levon Saldamli: PDEModelica - Towards a High-Level Language for Modeling with Partial DifferentialEquations, 2002.Almut Herzog: Secure Execution Environment for Java Electronic Services, 2002.Jon Edvardsson: Contributions to Program- and Specification-based Test Data Generation, 2002Anders Arpteg: Adaptive Semi-structured Information Extraction, 2002.Andrzej Bednarski: A Dynamic Programming Approach to Optimal Retargetable Code Generation forIrregular Architectures, 2002.Mattias Arvola: Good to use! : Use quality of multi-user applications in the home, 2003.Lennart Ljung: Utveckling av en projektivitetsmodell - om organisationers förmåga att tillämpaprojektarbetsformen, 2003.Pernilla Qvarfordt: User experience of spoken feedback in multimodal interaction, 2003.Alexander Siemers: Visualization of Dynamic Multibody Simulation With Special Reference to Contacts,2003.Jens Gustavsson: Towards Unanticipated Runtime Software Evolution, 2003.Calin Curescu: Adaptive QoS-aware Resource Allocation for Wireless Networks, 2003.Anna Andersson: Management Information Systems in Process-oriented Healthcare Organisations, 2003.Björn Johansson: Feedforward Control in Dynamic Situations, 2003.Traian Pop: Scheduling and Optimisation of Heterogeneous Time/Event-Triggered Distributed EmbeddedSystems, 2003.Britt-Marie Johansson: Kundkommunikation på distans - en studie om kommunikationsmediets betydelse iaffärstransaktioner, 2003.
Aleksandra Tesanovic: Towards Aspectual Component-Based Real-Time System Development, 2003.
No 1034No 1033
Fif-a 69No 1049No 1052No 1054Fif-a 71No 1055No 1058FiF-a 73
No 1079No 1084
FiF-a 74No 1094No 1095No 1099No 1110No 1116
FiF-a 77
No 1126No 1127No 1132
No 1130No 1138No 1149No 1156No 1162No 1165
FiF-a 84No 1166
No 1167
No 1168FiF-a 85
No 1171FiF-a 86
No 1172No 1183No 1184
No 1185
No 1190No 1191
No 1192No 1194No 1204
No 1206No 1207No 1209
No 1225No 1228No 1229No 1231
Arja Vainio-Larsson: Designing for Use in a Future Context - Five Case Studies in Retrospect, 2003.Peter Nilsson: Svenska bankers redovisningsval vid reservering för befarade kreditförluster - En studie vidinförandet av nya redovisningsregler, 2003.Fredrik Ericsson: Information Technology for Learning and Acquiring of Work Knowledge, 2003.Marcus Comstedt: Towards Fine-Grained Binary Composition through Link Time Weaving, 2003.Åsa Hedenskog: Increasing the Automation of Radio Network Control, 2003.Claudiu Duma: Security and Efficiency Tradeoffs in Multicast Group Key Management, 2003.Emma Eliasson: Effektanalys av IT-systems handlingsutrymme, 2003.Carl Cederberg: Experiments in Indirect Fault Injection with Open Source and Industrial Software, 2003.Daniel Karlsson: Towards Formal Verification in a Component-based Reuse Methodology, 2003.Anders Hjalmarsson: Att etablera och vidmakthålla förbättringsverksamhet - behovet av koordination ochinteraktion vid förändring av systemutvecklingsverksamheter, 2004.Pontus Johansson: Design and Development of Recommender Dialogue Systems, 2004.Charlotte Stoltz: Calling for Call Centres - A Study of Call Centre Locations in a Swedish Rural Region,2004.Björn Johansson: Deciding on Using Application Service Provision in SMEs, 2004.Genevieve Gorrell: Language Modelling and Error Handling in Spoken Dialogue Systems, 2004.Ulf Johansson: Rule Extraction - the Key to Accurate and Comprehensible Data Mining Models, 2004.Sonia Sangari: Computational Models of Some Communicative Head Movements, 2004.Hans Nässla: Intra-Family Information Flow and Prospects for Communication Systems, 2004.Henrik Sällberg: On the value of customer loyalty programs - A study of point programs and switching costs,2004.Ulf Larsson: Designarbete i dialog - karaktärisering av interaktionen mellan användare och utvecklare i ensystemutvecklingsprocess, 2004.Andreas Borg: Contribution to Management and Validation of Non-Functional Requirements, 2004.Per-Ola Kristensson: Large Vocabulary Shorthand Writing on Stylus Keyboard, 2004.Pär-Anders Albinsson: Interacting with Command and Control Systems: Tools for Operators and Designers,2004.Ioan Chisalita: Safety-Oriented Communication in Mobile Networks for Vehicles, 2004.Thomas Gustafsson: Maintaining Data Consistency im Embedded Databases for Vehicular Systems, 2004.Vaida Jakoniené: A Study in Integrating Multiple Biological Data Sources, 2005.Abdil Rashid Mohamed: High-Level Techniques for Built-In Self-Test Resources Optimization, 2005.Adrian Pop: Contributions to Meta-Modeling Tools and Methods, 2005.Fidel Vascós Palacios: On the information exchange between physicians and social insurance officers in thesick leave process: an Activity Theoretical perspective, 2005.Jenny Lagsten: Verksamhetsutvecklande utvärdering i informationssystemprojekt, 2005.Emma Larsdotter Nilsson: Modeling, Simulation, and Visualization of Metabolic Pathways Using Modelica,2005.Christina Keller: Virtual Learning Environments in higher education. A study of students’ acceptance of edu-cational technology, 2005.Cécile Åberg: Integration of organizational workflows and the Semantic Web, 2005.Anders Forsman: Standardisering som grund för informationssamverkan och IT-tjänster - En fallstudiebaserad på trafikinformationstjänsten RDS-TMC, 2005.Yu-Hsing Huang: A systemic traffic accident model, 2005.Jan Olausson: Att modellera uppdrag - grunder för förståelse av processinriktade informationssystem i trans-aktionsintensiva verksamheter, 2005.Petter Ahlström: Affärsstrategier för seniorbostadsmarknaden, 2005.Mathias Cöster: Beyond IT and Productivity - How Digitization Transformed the Graphic Industry, 2005.Åsa Horzella: Beyond IT and Productivity - Effects of Digitized Information Flows in Grocery Distribution,2005.Maria Kollberg: Beyond IT and Productivity - Effects of Digitized Information Flows in the LoggingIndustry, 2005.David Dinka: Role and Identity - Experience of technology in professional settings, 2005.Andreas Hansson: Increasing the Storage Capacity of Recursive Auto-associative Memory by SegmentingData, 2005.Nicklas Bergfeldt: Towards Detached Communication for Robot Cooperation, 2005.Dennis Maciuszek: Towards Dependable Virtual Companions for Later Life, 2005.Beatrice Alenljung: Decision-making in the Requirements Engineering Process: A Human-centeredApproach, 2005Anders Larsson: System-on-Chip Test Scheduling and Test Infrastructure Design, 2005.John Wilander: Policy and Implementation Assurance for Software Security, 2005.Andreas Käll: Översättningar av en managementmodell - En studie av införandet av Balanced Scorecard i ettlandsting, 2005.He Tan: Aligning and Merging Biomedical Ontologies, 2006.Artur Wilk: Descriptive Types for XML Query Language Xcerpt, 2006.Per Olof Pettersson: Sampling-based Path Planning for an Autonomous Helicopter, 2006.Kalle Burbeck: Adaptive Real-time Anomaly Detection for Safeguarding Critical Networks, 2006.