Toward Automated Anomaly Identification in Large-Scale Systems
14
IEEE TRANSACTIONS ON PARALLEL AND DISTRIBUTED SYSTEMS 1 Toward Automated Anomaly Identification in Large-scale Systems Zhiling Lan, Member, IEEE Computer Society, Ziming Zheng, Student Member, IEEE and Yawei Li, Student Member, IEEE Abstract—When a system fails to function properly, health- related data are collected for troubleshooting. However, it is challenging to effectively identify anomalies from the voluminous amount of noisy, high-dimensional data. The traditional manual approach is time-consuming, error-prone, and even worse, not scalable. In this paper, we present an automated mechanism for node-level anomaly identification in large-scale systems. A set of techniques are presented to automatically analyze collected data: data transformation to construct a uniform data format for data analysis, feature extraction to reduce data size, and unsupervised learning to detect the nodes acting differently from others. Moreover, we compare two techniques, principal component analysis (PCA) and independent component analysis (ICA), for feature extraction. We evaluate our prototype implementation by injecting a variety of faults into a production system at NCSA. The results show that our mechanism, in particular, the one using ICA-based feature extraction, can effectively identify faulty nodes with high accuracy and low computation overhead. Index Terms—anomaly identification, large-scale systems, in- dependent component analysis, principal component analysis, outlier detection I. I NTRODUCTION A. Motivation I T has been widely accepted that failures are ongoing facts of life to be dealt with in large-scale systems. Studies have shown that in production systems, failure rates are as high as more than 1000 per year, and depending on root cause of the problem, the average failure repair time ranges from a couple of hours to nearly 100 hours [14], [27]. Every hour that a system is unavailable can cause undesirable loss of processing cycles, as well as substantial maintenance cost. When a system fails to function properly, health-related data are collected across the system for troubleshooting. Unfortu- nately, how to effectively find anomalies and their causes in the data has never been as straight forward as one would expect. Traditionally, human operators are responsible of examining the data with their experience and expertise. Such manual processing is time-consuming, error-prone, and even worse, not scalable. As the size and complexity of computer systems continue to grow, so does the need for automated anomaly identification. Zhiling Lan is with the Department of Computer Science, Illinois Institute of Technology, Chicago, IL 60616. Email: [email protected]. Ziming Zheng is with the Department of Computer Science, Illinois Institute of Technology, Chicago, IL 60616. E-mail: [email protected] Yawei Li is with Google Inc. This work was performed when the author was a student at Illinois Institute of Technology. Email: [email protected] Manuscript received August 18, 2008; revised Feb. 7, 2009; accepted March 13, 2009. To address the problem, in this paper we present an automated mechanism for node-level anomaly identification. Different from fine-grained root cause analysis that aims to identify the root causes of problems or faults, ours is a coarse- grained problem localization mechanism focusing on detecting culprit node(s) by automatically examining the health-related data collected across the system. By finding the abnormal nodes, system managers are able to know where to fix the problem and application users can take relevant actions to avoid or mitigate fault impact on their applications. Following the terminology used in the dependability literature [6], a fault — like a hardware defect or a software flaw — can cause system node to transit from a normal state to an error state, and the use of the node in the error state can lead to node failure. Hence, we seek to discover the nodes in error or failed states which are also called abnormal states in the paper; we regard these nodes as anomalies that require further investigation. B. Technical Challenges Finding anomalies is a daunting problem, especially in systems composed of vast amount of nodes. We classify the key challenges into four categories: • Data diversity. Depending on the monitoring tools used, the data collected often have different formats and seman- tics, thereby making it hard to process them in a uniform way. • Data volume. Due to the size of modern systems, data collected for analysis are characterized by their huge volume, e.g., in order of gigabytes per day [14]. Finding anomalies from such potentially overwhelming amount of data is like finding needles in a haystack. • Data dependency. Most measured data are mixtures of independent signals, and they often contain noises. A naive method that directly compares the measured data for anomalies is generally inaccurate by producing sub- stantial amount of false alarms. • Anomaly characteristics. In large-scale systems, anomaly types are many and complex. Moreover, node behavior is dynamically changing during operation as system nodes are dynamically assigned to different tasks. Thus, it is ex- tremely difficult to precisely define the normal behaviors of system nodes. C. Paper Contributions The primary contribution of this paper lies in a collection of techniques to find abnormal nodes (i.e., anomalies) via
-
Upload
independent -
Category
Documents
-
view
3 -
download
0
Transcript of Toward Automated Anomaly Identification in Large-Scale Systems
IEEE TRANSACTIONS ON PARALLEL AND DISTRIBUTED SYSTEMS 1
Toward Automated Anomaly Identification inLarge-scale Systems
Zhiling Lan, Member, IEEE Computer Society,Ziming Zheng,Student Member, IEEEandYawei Li, Student Member, IEEE
Abstract—When a system fails to function properly, health-related data are collected for troubleshooting. However, it ischallenging to effectively identify anomalies from the voluminousamount of noisy, high-dimensional data. The traditional manualapproach is time-consuming, error-prone, and even worse, notscalable. In this paper, we present an automated mechanism fornode-level anomaly identification in large-scale systems. A set oftechniques are presented to automatically analyze collected data:data transformation to construct a uniform data format for dat aanalysis, feature extraction to reduce data size, and unsupervisedlearning to detect the nodes acting differently from others.Moreover, we compare two techniques, principal componentanalysis (PCA) and independent component analysis (ICA), forfeature extraction. We evaluate our prototype implementation byinjecting a variety of faults into a production system at NCSA.The results show that our mechanism, in particular, the one usingICA-based feature extraction, can effectively identify faulty nodeswith high accuracy and low computation overhead.
Index Terms—anomaly identification, large-scale systems, in-dependent component analysis, principal component analysis,outlier detection
I. I NTRODUCTION
A. Motivation
I T has been widely accepted that failures are ongoing factsof life to be dealt with in large-scale systems. Studies have
shown that in production systems, failure rates are as high asmore than 1000 per year, and depending on root cause of theproblem, the average failure repair time ranges from a coupleof hours to nearly 100 hours [14], [27]. Every hour that asystem is unavailable can cause undesirable loss of processingcycles, as well as substantial maintenance cost.
When a system fails to function properly, health-related dataare collected across the system for troubleshooting. Unfortu-nately, how to effectively find anomalies and their causes inthedata has never been as straight forward as one would expect.Traditionally, human operators are responsible of examiningthe data with their experience and expertise. Such manualprocessing is time-consuming, error-prone, and even worse,not scalable. As the size and complexity of computer systemscontinue to grow, so does the need for automated anomalyidentification.
Zhiling Lan is with the Department of Computer Science, Illinois Instituteof Technology, Chicago, IL 60616. Email: [email protected].
Ziming Zheng is with the Department of Computer Science, Illinois Instituteof Technology, Chicago, IL 60616. E-mail: [email protected]
Yawei Li is with Google Inc. This work was performed when the authorwas a student at Illinois Institute of Technology. Email: [email protected]
Manuscript received August 18, 2008; revised Feb. 7, 2009; accepted March13, 2009.
To address the problem, in this paper we present anautomated mechanism fornode-level anomaly identification.Different from fine-grained root cause analysis that aims toidentify the root causes of problems or faults, ours is a coarse-grained problem localization mechanism focusing on detectingculprit node(s) by automatically examining the health-relateddata collected across the system. By finding the abnormalnodes, system managers are able to know where to fix theproblem and application users can take relevant actions toavoid or mitigate fault impact on their applications. Followingthe terminology used in the dependability literature [6], afault— like a hardware defect or a software flaw — can causesystem node to transit from a normal state to an error state, andthe use of the node in the error state can lead to node failure.Hence, we seek to discover the nodes in error or failed stateswhich are also calledabnormal statesin the paper; we regardthese nodes asanomaliesthat require further investigation.
B. Technical Challenges
Finding anomalies is a daunting problem, especially insystems composed of vast amount of nodes. We classify thekey challenges into four categories:
• Data diversity.Depending on the monitoring tools used,the data collected often have different formats and seman-tics, thereby making it hard to process them in a uniformway.
• Data volume.Due to the size of modern systems, datacollected for analysis are characterized by their hugevolume, e.g., in order of gigabytes per day [14]. Findinganomalies from such potentially overwhelming amountof data is like finding needles in a haystack.
• Data dependency.Most measured data are mixtures ofindependent signals, and they often contain noises. Anaive method that directly compares the measured datafor anomalies is generally inaccurate by producing sub-stantial amount of false alarms.
• Anomaly characteristics.In large-scale systems, anomalytypes are many and complex. Moreover, node behavior isdynamically changing during operation as system nodesare dynamically assigned to different tasks. Thus, it is ex-tremely difficult to precisely define the normal behaviorsof system nodes.
C. Paper Contributions
The primary contribution of this paper lies in a collectionof techniques to find abnormal nodes (i.e., anomalies) via
IEEE TRANSACTIONS ON PARALLEL AND DISTRIBUTED SYSTEMS 2
automated analysis of system data. Specifically,data transfor-mation is first employed to manage data diversity by reducingthe problem of anomaly identification with different data typesto the problem of finding outliers in a new space of a singledata type (Section III-A). Second, to address the sheer datavolume and inherent data dependency,feature extractionisintroduced to convert the multi-dimensional data into a spaceof lower dimensions for quick and better analysis (SectionIII-B). In particular, we present and compare two techniques,namely principal component analysis (PCA) and independentcomponent analysis (ICA), for feature extraction. In additionto the main objective of this paper — to design an automatedanomaly identification mechanism for large-scale systems,an-other purpose of this study is to compare PCA and ICA basedfeature extraction and further to point out their strengthsandlimitations. Lastly, unlike the traditional methods that requiresamples of both normal and abnormal data for training,outlierdetectionautomatically extracts the expected normal behaviorfrom the data and flags significant deviations from the expectedas anomalies (Section III-C). Together, these techniques forman unsupervised learning approach, which can address theunknown and dynamic characteristics of anomalies.
We evaluate our prototype system to identify system faultsthat are manually injected into a production system at theNational Center for Supercomputing Applications (NCSA).Under a variety of faults injected, the automated mechanismusing ICA-based feature extraction is capable of detectingevery anomalous node, with a false alarm rate less than8%.Our framework incurs very low runtime overhead. In ourexperiments, it takes less than0.25 seconds to identify upto 20 anomalous nodes out of256 nodes. We believe thehigh accuracy and time efficiency attribute to the novel use offeature extraction, which can significantly reduce data size by96%. Our results also suggest that the ICA-based mechanismis a promising approach to automate anomaly identification inlarge-scale systems.
While the proposed mechanism mainly targets on failurediagnosis, it can also be integrated with tools like [44], [45]to aid failure prediction by pinpointing the potential locationsof system failures.
D. Paper Outline
The rest of the paper is organized as follows. Section IIgives an overview of our methodology, followed by a detaileddescription in Section III. In Section IV, we describe ourexperiments and list experimental results. Section V discussesthe benefits and limitations of the proposed mechanism. Abrief discussion of related works is presented in Section VI.Finally, we conclude the paper in Section VII.
II. M ETHODOLOGY OVERVIEW
“Computers are incredibly fast, accurate and stupid;humans are incredibly slow, inaccurate and brilliant;together they are powerful beyond imagination.” —Albert Einstein
Drawing on the wisdom in the above quotation by AlbertEinstein, we propose an anomaly identification framework as
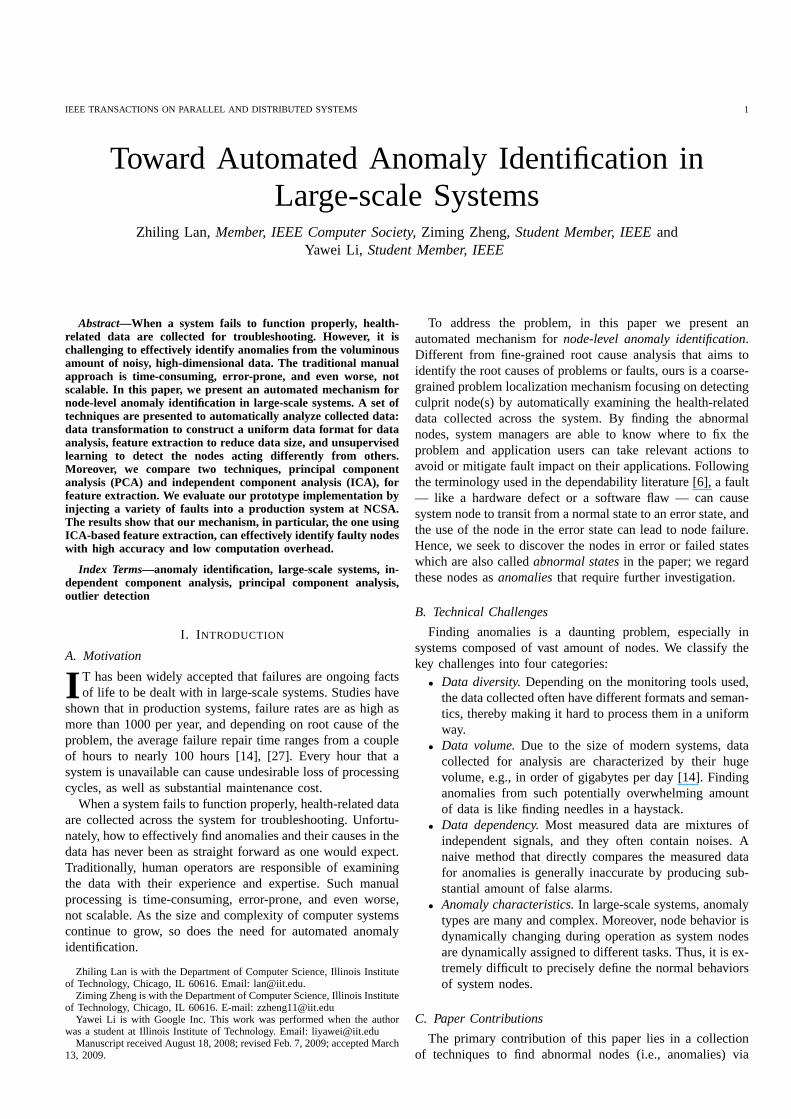
Fig. 1. Overview of anomaly identification. Node grouping is neededto dynamically divide system resources into groups, and the nodes in thesame group are expected to exhibit similar behaviors. Three group analysistechniques, namely data transformation, feature extractionand outlier detec-tion, are applied per group to find abnormal nodes (i.e., anomalies). Theseanomalies can be manually validated by system administrators.Note that theshaded boxes indicate the major contributions of this study (Section III-A -III-C).
shown in Figure 1, in which computers are utilized to processmassive quantity of data by leveraging pattern recognitiontechnologies and human can focus on final validation. Health-related data are collected across the system, and sent forautomated data analysis which includes dynamic grouping andgroup analysis. The automated mechanism can be triggeredeither periodically with a pre-defined frequency or by a systemmonitoring tool in case of unusual events. In this paper, wefocus on detecting anomalies in homogeneous collection ofnodes (also called “groups”), and heterogeneous collectionswill be addressed by grouping in the future. The resultinglist of anomalies will be sent to system administrators forfinal validation. As we will see later, by combining the fastprocessing capability of computers with human expertise, theproposed mechanism can quickly discover anomalies with avery high accuracy.
Our group analysis is based on two key observations. First,the nodes performing comparable activities generally exhibitsimilar behaviors [5], [24], [33]. Second, faults are rare events,so the majority of system nodes are functioning normally. Foreach group, three tightly-coupled techniques are applied to findthe nodes that exhibit different behaviors from the majority.
1) Data Transformation.It is responsible for collectingrelevant data across the system and assembling theminto a uniform format calledfeature matrix(generallyin high dimensionality). Here, afeature is defined asany individually measurable variable of the node beingobserved, such as CPU utilization, available memorysize, I/O, network traffic, etc.
2) Feature Extraction.A feature extraction technique, suchas principal component analysis (PCA) or independentcomponent analysis (ICA), is applied on the featurematrix to generate a matrix with much lower dimension-ality, while keeping the most relevant information in thedata. This not only accelerates data analysis by reducingdata dimensionality, but also improves data analysis byremoving inherent data dependency.
3) Outlier Detection.It determines the nodes that are “faraway” from the majority as potential anomalies. By an-
IEEE TRANSACTIONS ON PARALLEL AND DISTRIBUTED SYSTEMS 3
alyzing the low-dimensional matrix produced by featureextraction, a cell-based algorithm is used to quicklyidentify the outliers.
To truly make the above mechanism useful in practice, weintend to provide two guarantees in the design of our anomalyidentification system. First ishigh accuracy, in terms of lowfalse alarm rate and extremely low missed rate (i.e., close tozero). Second istime efficiency, meaning to quickly identifyfaulty nodes from the data collected, no matter how large is thedata. The first is essential for its acceptance by the community,while the second is needed for quick detection and timelyresponse.
III. D ESCRIPTION
In this section, we present the details of our group analysismechanism.
A. Data Transformation
The goal of this step is to gather system data for representingnode behaviors and then transform the data into a uniformformat for data analysis. A fault typically induces changesin multiple subsystems of a node, such as CPU, memory,I/O and network. For example, a memory leaking may affectthe amount of free memory and the CPU utilization rate;an operation to a malfunctioning disk may lead to huge IOtime and long CPU idle time. Hence, in order to cover abroad fault space, it is necessary to collect and store featuredata from all the subsystems per node. Furthermore, it isbeneficial to track and store the tendencies of these featuresby collecting multiple samples. Note that afeature is definedas any individually measurable variable of the node beingobserved.
Modern computer systems are deployed with various healthmonitoring tools. On the hardware side, hardware sensors arewidely deployed to monitor device attributes, such as CPUtemperature and fan speed [18], [19], [22]. On the softwareside, most operating systems provide various event logs and/orsystem calls to track memory, processes, network traffic,paging and block I/O information. In addition, a number ofthird-party software tools have been developed for systemmonitoring, such as Ganglia, Supermon, Inca, splunk, andinnumerous others [20], [39]–[41]. From the application level,there also exist tools to collect application performance datathrough source-based profiling or dynamic instrumentation[24]. The data collected by these tools can be used by ourframework.
As data collected from different tools are in arbitraryformats, data preprocessing is needed. Possible preprocessinginclude converting variable-spaced time series to constant-spaced ones, filling in missing samplings, generating real-values samples from system logs, and removing period spikesor noises [33], [35], [38].
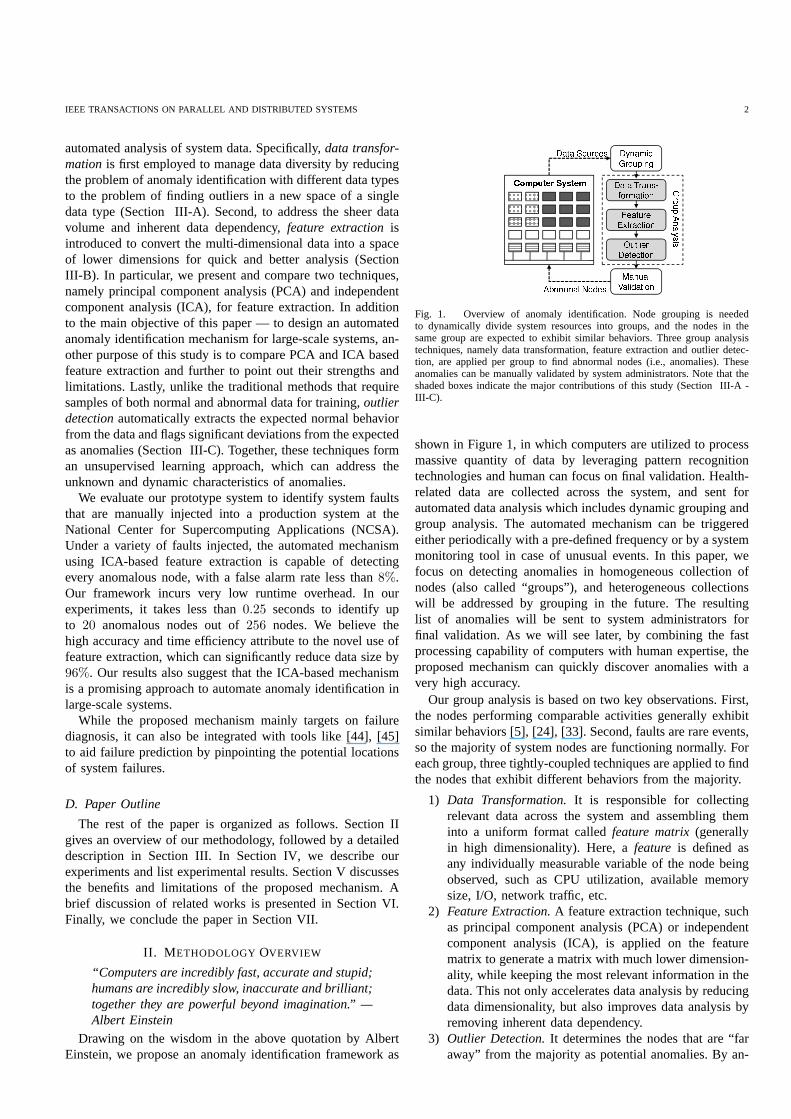
Figure 2 describes data preprocessing and transformation,whose goal is to construct feature matrix for data analysis.Let m be the number of features collected fromn nodes. Inorder to capture the tendencies of these features,k snapshotsare sampled per node. As a result, there aren matrices
Fig. 2. Data Transformation. Here,n is number of nodes,m is number offeatures, andk is number of samples per feature.F i represents the featurematrix of the ith node, andF denotes the feature matrix of the group. Itenables us to generate a uniform data type called feature matrix from diversedata sources for data analysis.
F i(i = 1, 2, · · · , n), each representing the feature matrixcollected from theith node. In each matrixF i, the elementf i
h,j denotes the value of featureh collected at thejthsnapshot, where1 ≤ j ≤ k and 1 ≤ h ≤ m. The elementsin the matrices are supposed to be preprocessed as mentionedabove.
To facilitate data analysis, we reorganize each matrixF i
into a long(m× k) column vectorf i = [f i1,1 f i
1,2 · · · fim,k]T .
We then construct a single large matrix as the feature matrixfor the group:
F = [f1, f2, · · · , fn] (1)
The transformation from a multiway matrix to a single largematrix makes it easy to diagnose anomalies across differentnodes.
B. Feature Extraction
After constructing feature matrix, a simple method is todirectly compare the data for anomalies. However, this simplecomparison can lead to high miss rate and false alarm rate,as we will see in Section IV. There are several reasons forthe ineffectiveness. First, useful information may be hiddenbetween features, and it is hard for direct comparison todiscover the hidden information. Second, some features havelarge fluctuation even when they are collected from normalnodes, while other features may be close to each other evenwhen they are collected from the nodes in different states (i.e.,normal versus abnormal states). Third, noise often exists in thedata, thereby distorting the meaning of data. Even worse, thefluctuation and noise may propagate across multiple samples,thereby impacting the accuracy of anomaly localization. Fi-nally, analyzing high dimensional matrices is time-consuming.To address these issues,feature selectionandfeature extractionare two well-known techniques.
Feature selectionis a technique to select an optimal subsetof the original features based on some criteria [16]. However,feature selection is a supervised learning, requiring a prioriknowledge of both normal and abnormal behaviors. Moreover,an optimal selection requires an exhaustive search of all thepossible subsets of features, thereby being time consuming. Ingeneral, feature selection works well with irrelevant features.As mentioned earlier, a fault typically induces changes in
IEEE TRANSACTIONS ON PARALLEL AND DISTRIBUTED SYSTEMS 4
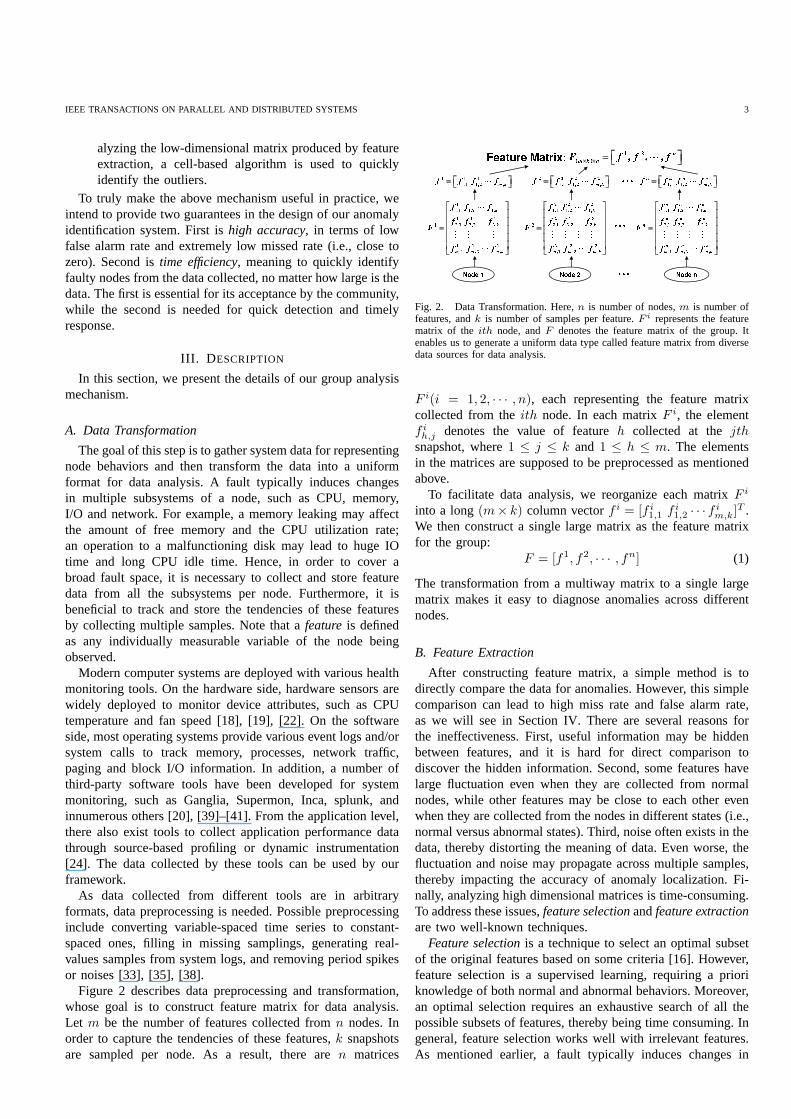
Fig. 3. Feature Extraction. Here,F is the feature matrix obtained via datatransformation (see Figure 2). Both normalization and zero mean proceduresare needed before applying PCA and ICA.
multiple subsystems and hence is reflected in multiple features.In other words, these features are not irrelevant, thereby greatlylimiting the effectiveness of feature selection.
Unlike feature selection,feature extractiontransforms theoriginal feature space into a space of fewer dimensions inwhich the information most relevant to the problem is pre-served [16]. The data presented in a low dimensional subspaceare easier to separate into different classes. Further, as we willsee in Section IV, by transforming the data into a new spacethat keeps the most relevant information, feature extraction canalso improve analysis accuracy.
In this paper, we investigate two feature extraction tech-niques: (1) Principal Component Analysis (PCA) and (2)Independent Component Analysis (ICA). Both are well-knownpattern recognition techniques. Both belong to unsupervisedlearning, meaning that we do not need to know the datalabel, e.g., whether it is normal or abnormal. Therefore theywork well for unknown anomaly patterns. Another advantageof these techniques is that in the new space, the differencebetween the classes of data is amplified, while the differencewithin the same class becomes less. This can greatly help toseparate anomalies from normal nodes. While PCA has beenexplored for problem diagnosis and application classification[25], [26], ICA has been mainly used in the field of signalprocessing or face recognition [30], [32]. As mentioned earlier,one goal of this study is to compare PCA and ICA basedanomaly identification mechanisms.
Figure 3 presents PCA and ICA based feature extractionon feature matrixF obtained from data transformation. Beforeusing PCA or ICA, anormalizationprocess is first applied onfeature matrixF . We consider that all the features are equallyimportant. Note that the collected data may have differentscales. For example, memory size is generally a large number,while CPU utilization is usually less than1.0. To transformthe data into a uniform scale, every datafij in the matrixF isfirst normalized toF ′, such that feature values are controlledin the range between0.0 and1.0. Next, it is necessary to adjustF ′ to F ′′ so that its columns havezero mean. This ensuresthat PCA and ICA dimensions capture true variance, therebyavoiding skewing results due to differences in mean [25]. Fordata matrixF ′′, each column represents a node and each rowgives the values of a particular feature.
1) PCA-based Feature Extraction:PCA is a well-knowndimensionality reduction technique [16], [25]. Basicallyitperforms linear transformation to map a given set of datapoints onto new axes (calledprincipal components). Whenworking with zero-mean data, each principal component hasthe property that it points in the direction of maximumvariance remaining in the data, given the variance already
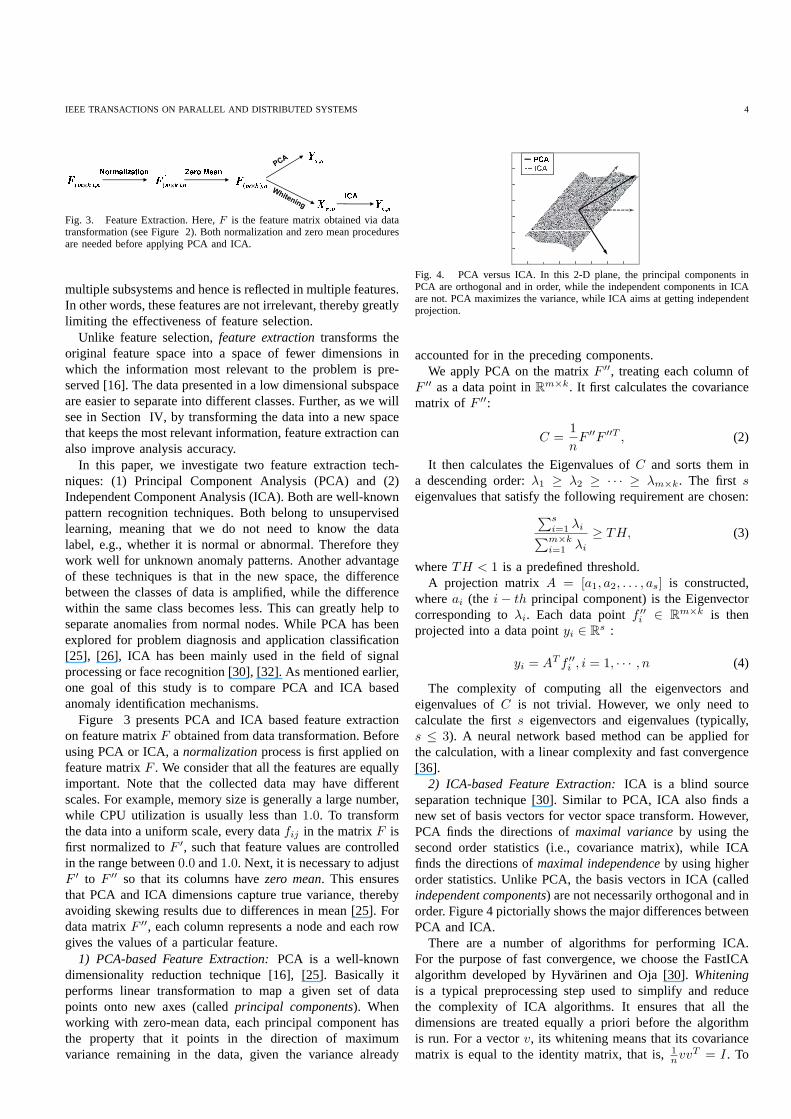
Fig. 4. PCA versus ICA. In this 2-D plane, the principal components inPCA are orthogonal and in order, while the independent components in ICAare not. PCA maximizes the variance, while ICA aims at getting independentprojection.
accounted for in the preceding components.We apply PCA on the matrixF ′′, treating each column of
F ′′ as a data point inRm×k. It first calculates the covariancematrix of F ′′:
C =1
nF ′′F ′′T , (2)
It then calculates the Eigenvalues ofC and sorts them ina descending order:λ1 ≥ λ2 ≥ · · · ≥ λm×k. The first seigenvalues that satisfy the following requirement are chosen:
∑si=1
λi∑m×k
i=1λi
≥ TH, (3)
whereTH < 1 is a predefined threshold.A projection matrix A = [a1, a2, . . . , as] is constructed,
whereai (the i − th principal component) is the Eigenvectorcorresponding toλi. Each data pointf ′′
i ∈ Rm×k is then
projected into a data pointyi ∈ Rs :
yi = AT f ′′i , i = 1, · · · , n (4)
The complexity of computing all the eigenvectors andeigenvalues ofC is not trivial. However, we only need tocalculate the firsts eigenvectors and eigenvalues (typically,s ≤ 3). A neural network based method can be applied forthe calculation, with a linear complexity and fast convergence[36].
2) ICA-based Feature Extraction:ICA is a blind sourceseparation technique [30]. Similar to PCA, ICA also finds anew set of basis vectors for vector space transform. However,PCA finds the directions ofmaximal varianceby using thesecond order statistics (i.e., covariance matrix), while ICAfinds the directions ofmaximal independenceby using higherorder statistics. Unlike PCA, the basis vectors in ICA (calledindependent components) are not necessarily orthogonal and inorder. Figure 4 pictorially shows the major differences betweenPCA and ICA.
There are a number of algorithms for performing ICA.For the purpose of fast convergence, we choose the FastICAalgorithm developed by Hyvarinen and Oja [30].Whiteningis a typical preprocessing step used to simplify and reducethe complexity of ICA algorithms. It ensures that all thedimensions are treated equally a priori before the algorithmis run. For a vectorv, its whitening means that its covariancematrix is equal to the identity matrix, that is,1nvvT = I. To
IEEE TRANSACTIONS ON PARALLEL AND DISTRIBUTED SYSTEMS 5
whiten the matrixF ′′, we first calculate its covariance matrixC (Equation (2)), and then calculate non-zero Eigenvaluesof C in a descent order:λ1 ≥ λ2 ≥ · · · ≥ λr. LetV = diag(λ1, λ2, . . . , λr) and E = [e1, e2, . . . , er], whereei is the Eigenvector corresponding toλi. The whiten data ofF ′′ is defined as:
X = V −1/2ET F ′′ (5)
whereX is a r × n matrix andr ≤ m × k.After whitening, ICA projects the data pointxi ∈ R
r intoa data pointyi ∈ R
s as below:
yi = WT xi (6)
Here, to compare ICA and PCA under identical conditions,the dimensionality ofyi is also set tos (see Equation 3). Adrawback is that this may discard some useful information.One of our future work is to exploit other techniques toestimate the dimensionality ofyi [32].
The goal is to find an optimal projection matrixW suchthatyi are maximally independent, measured by some function[30]. In general, an iterative process is employed to searchforW :
1) Choose an random initial matrixW = [w1, w2, . . . , ws],where||wi|| = 1.
2) For i=1 to sw+
i = 1
n
∑ni=1
xi(wTj xi)
3 − 3wj ,wi = w+
i /||w+
i ||.Here, the first calculation is to ensure the iterationapproaches the maximal independence, and the secondone ensures that||wi|| = 1.
3) W = W (WT W )−1/2, which is to ensure thatwi 6= wj
when i 6= j.4) If (1 − |wT
i wi|) < δ, whereδ is a small constant, thealgorithm converges; Otherwise, go to step 2.
The convergence of FastICA is good [30]. In our exper-iments, generally only a few iterations are needed, and thetotal calculation time is less than0.1 seconds.
C. Outlier Detection
The final step is to identify a subset of nodes that aresignificantly dissimilar from the majority. In the field ofdata mining, these nodes are calledoutliers. Simply put, anoutlier is a data point which is quite different from other dataaccording to some criteria [17]. In this paper, we measure thedissimilarity between two data pointsya ∈ R
s and yb ∈ Rs
by using Euclidean distance:
d(ya, yb) =
√
√
√
√
s∑
i=1
(ya,i − yb,i)2 (7)
An objecto is called aDB(p, d) outlier if at leastp fractionof the objects in the data set lies greater thand distance awayfrom o.
A straight-forward algorithm to detect aDB(p, d) outlier isto calculate the number of neighbors within the distance ofdfrom each object to determine whether it is an outlier or not.
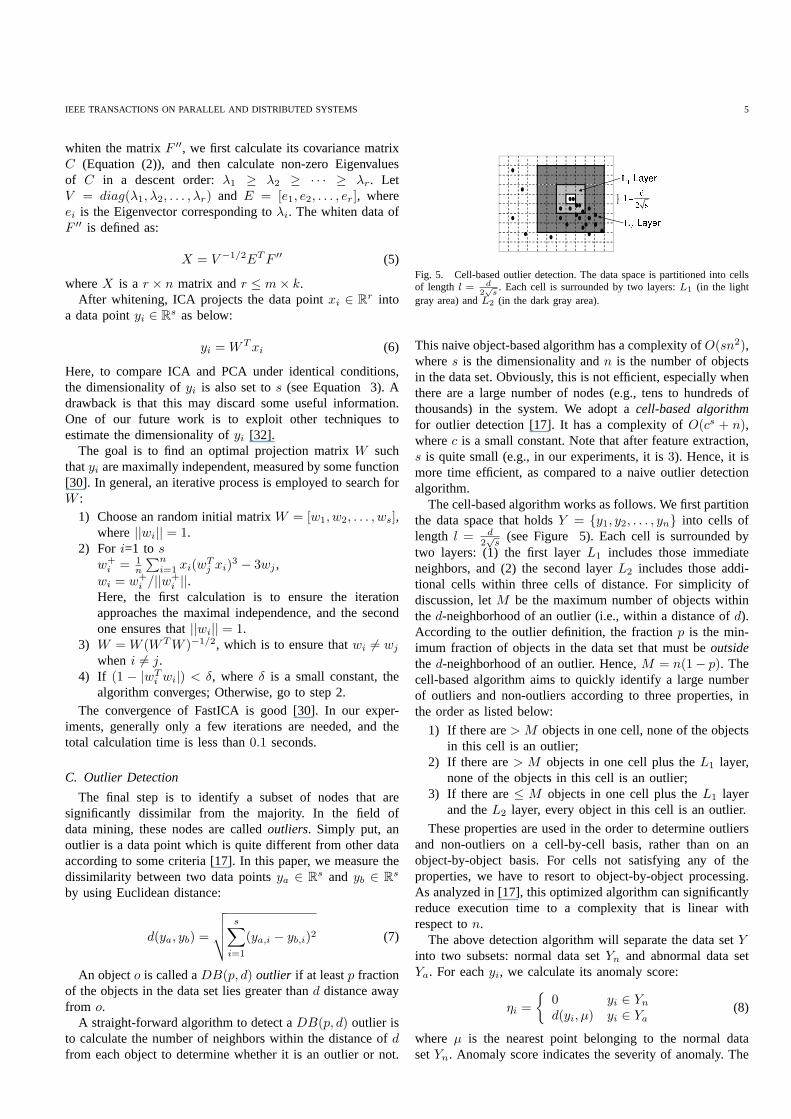
Fig. 5. Cell-based outlier detection. The data space is partitioned into cellsof length l =
d
2√
s. Each cell is surrounded by two layers:L1 (in the light
gray area) andL2 (in the dark gray area).
This naive object-based algorithm has a complexity ofO(sn2),wheres is the dimensionality andn is the number of objectsin the data set. Obviously, this is not efficient, especiallywhenthere are a large number of nodes (e.g., tens to hundreds ofthousands) in the system. We adopt acell-based algorithmfor outlier detection [17]. It has a complexity ofO(cs + n),wherec is a small constant. Note that after feature extraction,s is quite small (e.g., in our experiments, it is3). Hence, it ismore time efficient, as compared to a naive outlier detectionalgorithm.
The cell-based algorithm works as follows. We first partitionthe data space that holdsY = {y1, y2, . . . , yn} into cells oflength l = d
2√
s(see Figure 5). Each cell is surrounded by
two layers: (1) the first layerL1 includes those immediateneighbors, and (2) the second layerL2 includes those addi-tional cells within three cells of distance. For simplicityofdiscussion, letM be the maximum number of objects withinthed-neighborhood of an outlier (i.e., within a distance ofd).According to the outlier definition, the fractionp is the min-imum fraction of objects in the data set that must beoutsidethe d-neighborhood of an outlier. Hence,M = n(1− p). Thecell-based algorithm aims to quickly identify a large numberof outliers and non-outliers according to three properties, inthe order as listed below:
1) If there are> M objects in one cell, none of the objectsin this cell is an outlier;
2) If there are> M objects in one cell plus theL1 layer,none of the objects in this cell is an outlier;
3) If there are≤ M objects in one cell plus theL1 layerand theL2 layer, every object in this cell is an outlier.
These properties are used in the order to determine outliersand non-outliers on a cell-by-cell basis, rather than on anobject-by-object basis. For cells not satisfying any of theproperties, we have to resort to object-by-object processing.As analyzed in [17], this optimized algorithm can significantlyreduce execution time to a complexity that is linear withrespect ton.
The above detection algorithm will separate the data setYinto two subsets: normal data setYn and abnormal data setYa. For eachyi, we calculate its anomaly score:
ηi =
{
0 yi ∈ Yn
d(yi, µ) yi ∈ Ya(8)
where µ is the nearest point belonging to the normal datasetYn. Anomaly score indicates the severity of anomaly. The
IEEE TRANSACTIONS ON PARALLEL AND DISTRIBUTED SYSTEMS 6
abnormal subset, along with anomaly scores, will be sent tosystem administrators for final validation.
IV. EXPERIMENTS
We evaluate our prototype implementation on a productionsystem by manually injecting a variety of system faults. Whileexperimental evaluation with real faults would be better, amajor problem with this approach is that we do not often havethe luxury of allowing systems to run for many days to seetheir behavior. Further, it is not guaranteed that the system willexperience a variety of faults during the experimental time.The generally accepted solution to this problem is to injecttheeffects of faults in a system, and to observe the behavior of thesystem under the injected faults [54]. In our experiments, weare able to test the proposed anomaly identification mechanismon dozens of fault effects via fault injection.
We compare three types of identification mechanisms,namely the one using ICA-based feature extraction, the oneusing PCA-based feature extraction, and the one without usingany feature extraction. In the rest of the paper, we simply usethe termICA-based, PCA-based, andNo-Extractionto denotethese mechanisms.
A. Testbed
We use the IA64 Linux cluster calledMecuryat NCSA asour testbed, which is part of the TeraGrid infrastructure [1]. Itconsists of 887 IBM nodes: 256 nodes with dual 1.3 GHz IntelItanium 2 processors, and 631 nodes with dual 1.5 GHz IntelItanium 2 processors, all connected by Myrinet interconnectnetwork. The cluster is running SuSE Linux.
Our experiments are conducted on256 1.5 GHz nodes.A parameter sweep application is submitted on these nodes,where application processes solve dense linear equations byusing Gaussian Elimination method, thereby performing com-parable computation tasks [42].
B. Fault Injection
We randomly inject faults into the testbed by generatingfaulty threads in the background — separating from theapplication threads, and test whether different mechanisms caneffectively identify the faulty nodes. Three random factors areconsidered in our fault injection. First is to decide how manynodes to inject faults, second is to determine which nodes toinject faults, and the last is to decide the type(s) of fault(s) toinject. In our experiments, zero to twenty nodes are randomlyselected for fault injection. The inclusion of the zero cases isto test our anomaly identification mechanism under a fault-freeenvironment. Totally, five types of faults are tested:
• Memory leaking: On randomly selected nodes, besides thenormal computation threads, we introduce threads to gen-erate memory leaking on the nodes, meaning that thesethreads continue consuming memory without releasing itperiodically.
• Unterminated CPU intensive threads: On randomly se-lected nodes, the injected threads compete for the CPUresource with the normal computation threads on thenodes.
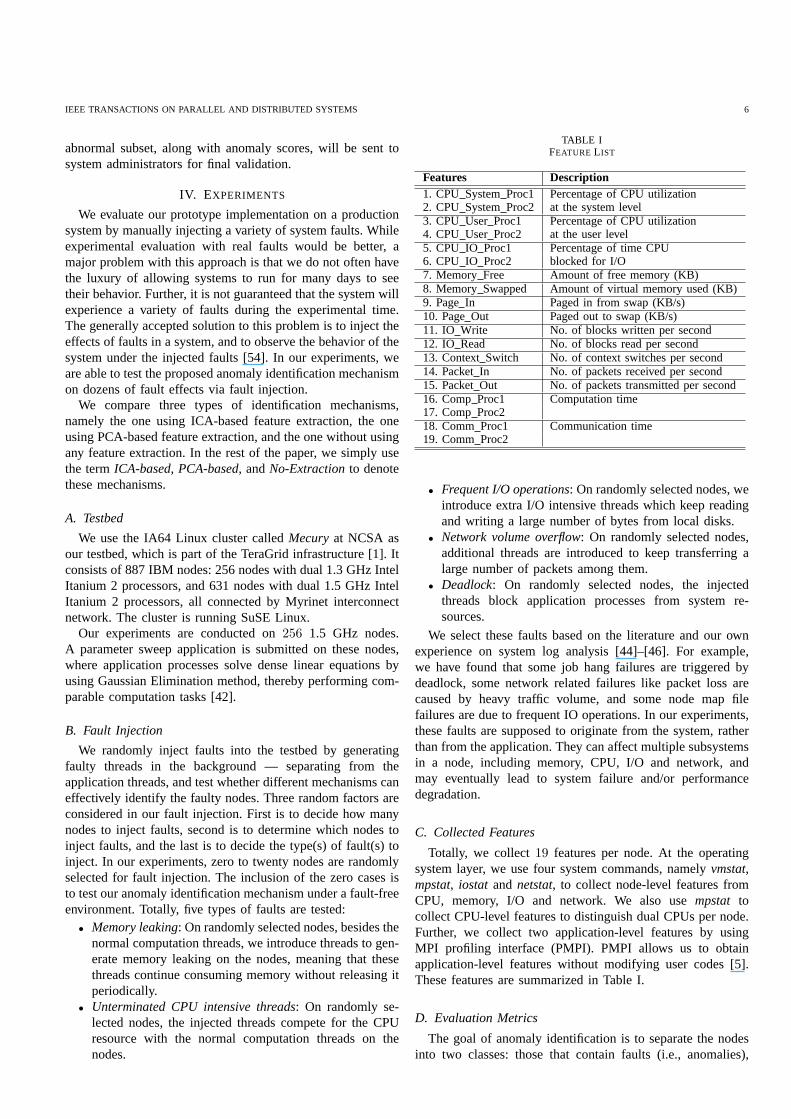
TABLE IFEATURE L IST
Features Description1. CPU SystemProc1 Percentage of CPU utilization2. CPU SystemProc2 at the system level3. CPU User Proc1 Percentage of CPU utilization4. CPU User Proc2 at the user level5. CPU IO Proc1 Percentage of time CPU6. CPU IO Proc2 blocked for I/O7. Memory Free Amount of free memory (KB)8. Memory Swapped Amount of virtual memory used (KB)9. PageIn Paged in from swap (KB/s)10. PageOut Paged out to swap (KB/s)11. IO Write No. of blocks written per second12. IO Read No. of blocks read per second13. ContextSwitch No. of context switches per second14. PacketIn No. of packets received per second15. PacketOut No. of packets transmitted per second16. CompProc1 Computation time17. CompProc218. CommProc1 Communication time19. CommProc2
• Frequent I/O operations: On randomly selected nodes, weintroduce extra I/O intensive threads which keep readingand writing a large number of bytes from local disks.
• Network volume overflow: On randomly selected nodes,additional threads are introduced to keep transferring alarge number of packets among them.
• Deadlock: On randomly selected nodes, the injectedthreads block application processes from system re-sources.
We select these faults based on the literature and our ownexperience on system log analysis [44]–[46]. For example,we have found that some job hang failures are triggered bydeadlock, some network related failures like packet loss arecaused by heavy traffic volume, and some node map filefailures are due to frequent IO operations. In our experiments,these faults are supposed to originate from the system, ratherthan from the application. They can affect multiple subsystemsin a node, including memory, CPU, I/O and network, andmay eventually lead to system failure and/or performancedegradation.
C. Collected Features
Totally, we collect19 features per node. At the operatingsystem layer, we use four system commands, namelyvmstat,mpstat, iostat and netstat, to collect node-level features fromCPU, memory, I/O and network. We also usempstat tocollect CPU-level features to distinguish dual CPUs per node.Further, we collect two application-level features by usingMPI profiling interface (PMPI). PMPI allows us to obtainapplication-level features without modifying user codes [5].These features are summarized in Table I.
D. Evaluation Metrics
The goal of anomaly identification is to separate the nodesinto two classes: those that contain faults (i.e., anomalies),
IEEE TRANSACTIONS ON PARALLEL AND DISTRIBUTED SYSTEMS 7
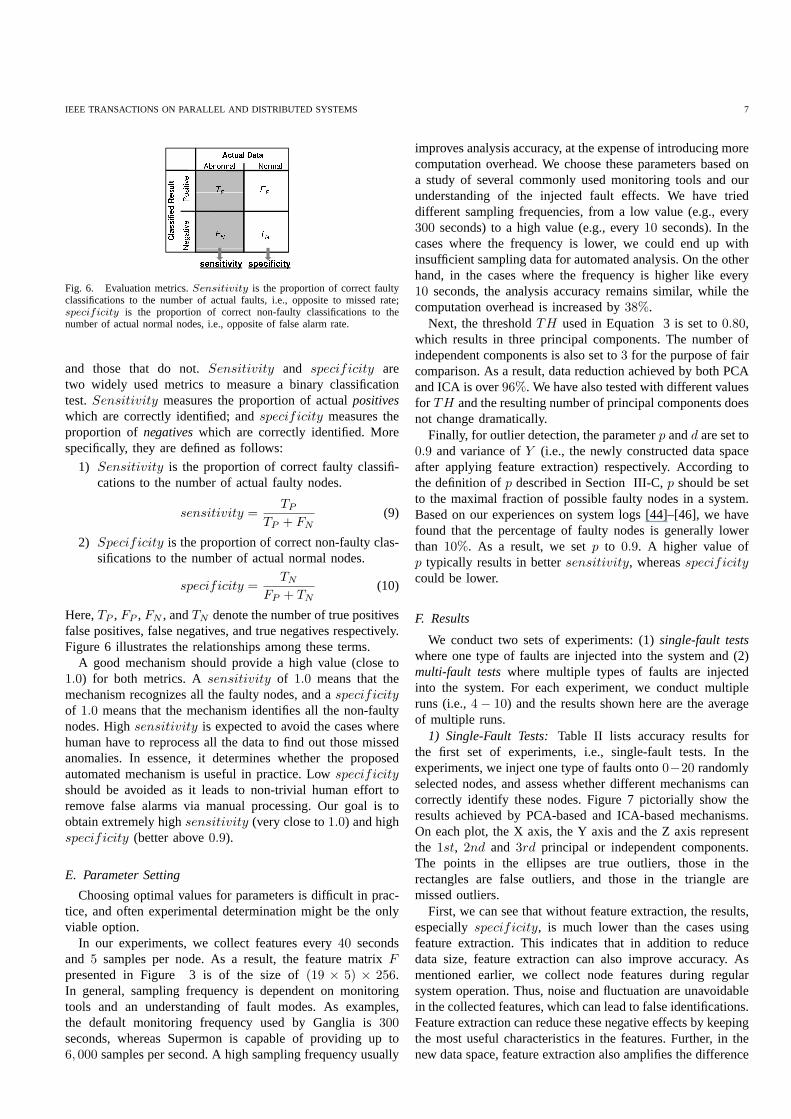
Fig. 6. Evaluation metrics.Sensitivity is the proportion of correct faultyclassifications to the number of actual faults, i.e., opposite to missed rate;specificity is the proportion of correct non-faulty classifications to thenumber of actual normal nodes, i.e., opposite of false alarm rate.
and those that do not.Sensitivity and specificity aretwo widely used metrics to measure a binary classificationtest.Sensitivity measures the proportion of actualpositiveswhich are correctly identified; andspecificity measures theproportion of negativeswhich are correctly identified. Morespecifically, they are defined as follows:
1) Sensitivity is the proportion of correct faulty classifi-cations to the number of actual faulty nodes.
sensitivity =TP
TP + FN(9)
2) Specificity is the proportion of correct non-faulty clas-sifications to the number of actual normal nodes.
specificity =TN
FP + TN(10)
Here,TP , FP , FN , andTN denote the number of true positivesfalse positives, false negatives, and true negatives respectively.Figure 6 illustrates the relationships among these terms.
A good mechanism should provide a high value (close to1.0) for both metrics. Asensitivity of 1.0 means that themechanism recognizes all the faulty nodes, and aspecificityof 1.0 means that the mechanism identifies all the non-faultynodes. Highsensitivity is expected to avoid the cases wherehuman have to reprocess all the data to find out those missedanomalies. In essence, it determines whether the proposedautomated mechanism is useful in practice. Lowspecificityshould be avoided as it leads to non-trivial human effort toremove false alarms via manual processing. Our goal is toobtain extremely highsensitivity (very close to1.0) and highspecificity (better above0.9).
E. Parameter Setting
Choosing optimal values for parameters is difficult in prac-tice, and often experimental determination might be the onlyviable option.
In our experiments, we collect features every40 secondsand 5 samples per node. As a result, the feature matrixFpresented in Figure 3 is of the size of(19 × 5) × 256.In general, sampling frequency is dependent on monitoringtools and an understanding of fault modes. As examples,the default monitoring frequency used by Ganglia is300seconds, whereas Supermon is capable of providing up to6, 000 samples per second. A high sampling frequency usually
improves analysis accuracy, at the expense of introducing morecomputation overhead. We choose these parameters based ona study of several commonly used monitoring tools and ourunderstanding of the injected fault effects. We have trieddifferent sampling frequencies, from a low value (e.g., every300 seconds) to a high value (e.g., every10 seconds). In thecases where the frequency is lower, we could end up withinsufficient sampling data for automated analysis. On the otherhand, in the cases where the frequency is higher like every10 seconds, the analysis accuracy remains similar, while thecomputation overhead is increased by38%.
Next, the thresholdTH used in Equation 3 is set to0.80,which results in three principal components. The number ofindependent components is also set to3 for the purpose of faircomparison. As a result, data reduction achieved by both PCAand ICA is over96%. We have also tested with different valuesfor TH and the resulting number of principal components doesnot change dramatically.
Finally, for outlier detection, the parameterp andd are set to0.9 and variance ofY (i.e., the newly constructed data spaceafter applying feature extraction) respectively. According tothe definition ofp described in Section III-C,p should be setto the maximal fraction of possible faulty nodes in a system.Based on our experiences on system logs [44]–[46], we havefound that the percentage of faulty nodes is generally lowerthan 10%. As a result, we setp to 0.9. A higher value ofp typically results in bettersensitivity, whereasspecificitycould be lower.
F. Results
We conduct two sets of experiments: (1)single-fault testswhere one type of faults are injected into the system and (2)multi-fault testswhere multiple types of faults are injectedinto the system. For each experiment, we conduct multipleruns (i.e.,4 − 10) and the results shown here are the averageof multiple runs.
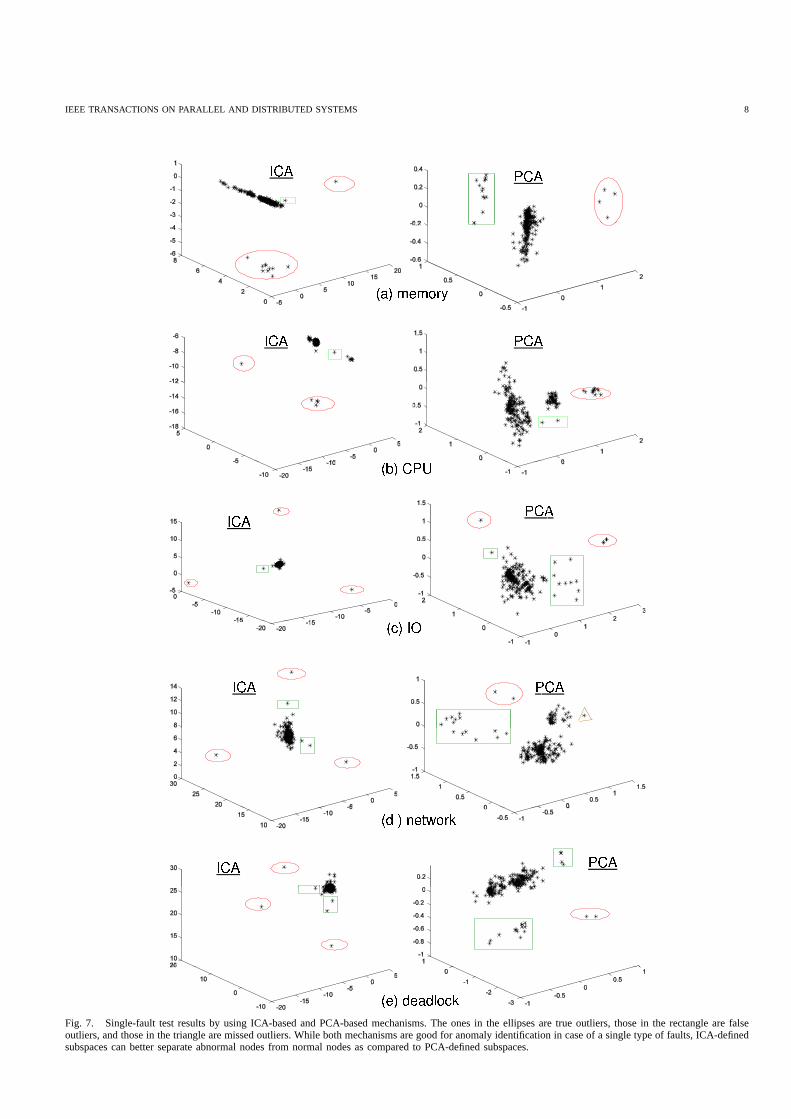
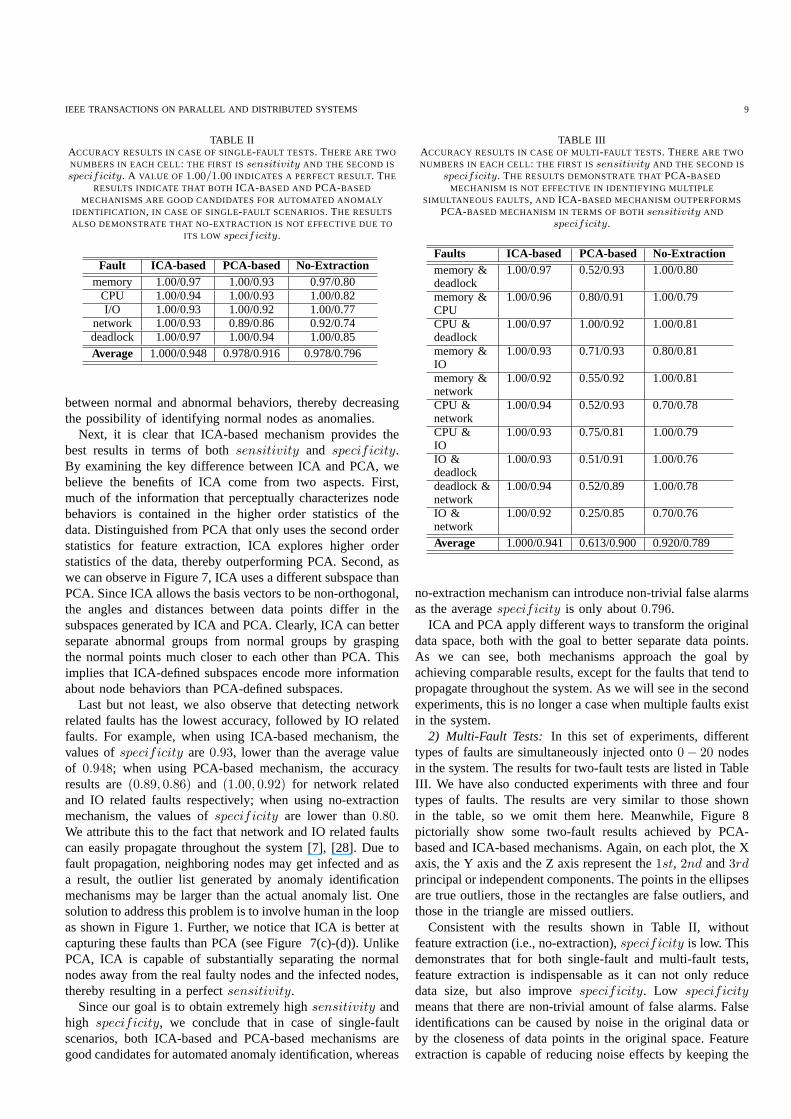
1) Single-Fault Tests:Table II lists accuracy results forthe first set of experiments, i.e., single-fault tests. In theexperiments, we inject one type of faults onto0−20 randomlyselected nodes, and assess whether different mechanisms cancorrectly identify these nodes. Figure 7 pictorially show theresults achieved by PCA-based and ICA-based mechanisms.On each plot, the X axis, the Y axis and the Z axis representthe 1st, 2nd and 3rd principal or independent components.The points in the ellipses are true outliers, those in therectangles are false outliers, and those in the triangle aremissed outliers.
First, we can see that without feature extraction, the results,especiallyspecificity, is much lower than the cases usingfeature extraction. This indicates that in addition to reducedata size, feature extraction can also improve accuracy. Asmentioned earlier, we collect node features during regularsystem operation. Thus, noise and fluctuation are unavoidablein the collected features, which can lead to false identifications.Feature extraction can reduce these negative effects by keepingthe most useful characteristics in the features. Further, in thenew data space, feature extraction also amplifies the difference
IEEE TRANSACTIONS ON PARALLEL AND DISTRIBUTED SYSTEMS 8
Fig. 7. Single-fault test results by using ICA-based and PCA-based mechanisms. The ones in the ellipses are true outliers,those in the rectangle are falseoutliers, and those in the triangle are missed outliers. Whileboth mechanisms are good for anomaly identification in case of a single type of faults, ICA-definedsubspaces can better separate abnormal nodes from normal nodes as compared to PCA-defined subspaces.
IEEE TRANSACTIONS ON PARALLEL AND DISTRIBUTED SYSTEMS 9
TABLE IIACCURACY RESULTS IN CASE OF SINGLE-FAULT TESTS. THERE ARE TWO
NUMBERS IN EACH CELL: THE FIRST ISsensitivity AND THE SECOND IS
specificity. A VALUE OF 1.00/1.00 INDICATES A PERFECT RESULT. THE
RESULTS INDICATE THAT BOTH ICA-BASED AND PCA-BASED
MECHANISMS ARE GOOD CANDIDATES FOR AUTOMATED ANOMALY
IDENTIFICATION , IN CASE OF SINGLE-FAULT SCENARIOS. THE RESULTS
ALSO DEMONSTRATE THAT NO-EXTRACTION IS NOT EFFECTIVE DUE TO
ITS LOW specificity.
Fault ICA-based PCA-based No-Extractionmemory 1.00/0.97 1.00/0.93 0.97/0.80
CPU 1.00/0.94 1.00/0.93 1.00/0.82I/O 1.00/0.93 1.00/0.92 1.00/0.77
network 1.00/0.93 0.89/0.86 0.92/0.74deadlock 1.00/0.97 1.00/0.94 1.00/0.85Average 1.000/0.948 0.978/0.916 0.978/0.796
between normal and abnormal behaviors, thereby decreasingthe possibility of identifying normal nodes as anomalies.
Next, it is clear that ICA-based mechanism provides thebest results in terms of bothsensitivity and specificity.By examining the key difference between ICA and PCA, webelieve the benefits of ICA come from two aspects. First,much of the information that perceptually characterizes nodebehaviors is contained in the higher order statistics of thedata. Distinguished from PCA that only uses the second orderstatistics for feature extraction, ICA explores higher orderstatistics of the data, thereby outperforming PCA. Second,aswe can observe in Figure 7, ICA uses a different subspace thanPCA. Since ICA allows the basis vectors to be non-orthogonal,the angles and distances between data points differ in thesubspaces generated by ICA and PCA. Clearly, ICA can betterseparate abnormal groups from normal groups by graspingthe normal points much closer to each other than PCA. Thisimplies that ICA-defined subspaces encode more informationabout node behaviors than PCA-defined subspaces.
Last but not least, we also observe that detecting networkrelated faults has the lowest accuracy, followed by IO relatedfaults. For example, when using ICA-based mechanism, thevalues ofspecificity are0.93, lower than the average valueof 0.948; when using PCA-based mechanism, the accuracyresults are(0.89, 0.86) and (1.00, 0.92) for network relatedand IO related faults respectively; when using no-extractionmechanism, the values ofspecificity are lower than0.80.We attribute this to the fact that network and IO related faultscan easily propagate throughout the system [7], [28]. Due tofault propagation, neighboring nodes may get infected and asa result, the outlier list generated by anomaly identificationmechanisms may be larger than the actual anomaly list. Onesolution to address this problem is to involve human in the loopas shown in Figure 1. Further, we notice that ICA is better atcapturing these faults than PCA (see Figure 7(c)-(d)). UnlikePCA, ICA is capable of substantially separating the normalnodes away from the real faulty nodes and the infected nodes,thereby resulting in a perfectsensitivity.
Since our goal is to obtain extremely highsensitivity andhigh specificity, we conclude that in case of single-faultscenarios, both ICA-based and PCA-based mechanisms aregood candidates for automated anomaly identification, whereas
TABLE IIIACCURACY RESULTS IN CASE OF MULTI-FAULT TESTS. THERE ARE TWO
NUMBERS IN EACH CELL: THE FIRST ISsensitivity AND THE SECOND IS
specificity. THE RESULTS DEMONSTRATE THATPCA-BASED
MECHANISM IS NOT EFFECTIVE IN IDENTIFYING MULTIPLE
SIMULTANEOUS FAULTS, AND ICA-BASED MECHANISM OUTPERFORMS
PCA-BASED MECHANISM IN TERMS OF BOTHsensitivity AND
specificity.
Faults ICA-based PCA-based No-Extractionmemory & 1.00/0.97 0.52/0.93 1.00/0.80deadlockmemory & 1.00/0.96 0.80/0.91 1.00/0.79CPUCPU & 1.00/0.97 1.00/0.92 1.00/0.81deadlockmemory & 1.00/0.93 0.71/0.93 0.80/0.81IOmemory & 1.00/0.92 0.55/0.92 1.00/0.81networkCPU & 1.00/0.94 0.52/0.93 0.70/0.78networkCPU & 1.00/0.93 0.75/0.81 1.00/0.79IOIO & 1.00/0.93 0.51/0.91 1.00/0.76deadlockdeadlock & 1.00/0.94 0.52/0.89 1.00/0.78networkIO & 1.00/0.92 0.25/0.85 0.70/0.76networkAverage 1.000/0.941 0.613/0.900 0.920/0.789
no-extraction mechanism can introduce non-trivial false alarmsas the averagespecificity is only about0.796.
ICA and PCA apply different ways to transform the originaldata space, both with the goal to better separate data points.As we can see, both mechanisms approach the goal byachieving comparable results, except for the faults that tend topropagate throughout the system. As we will see in the secondexperiments, this is no longer a case when multiple faults existin the system.
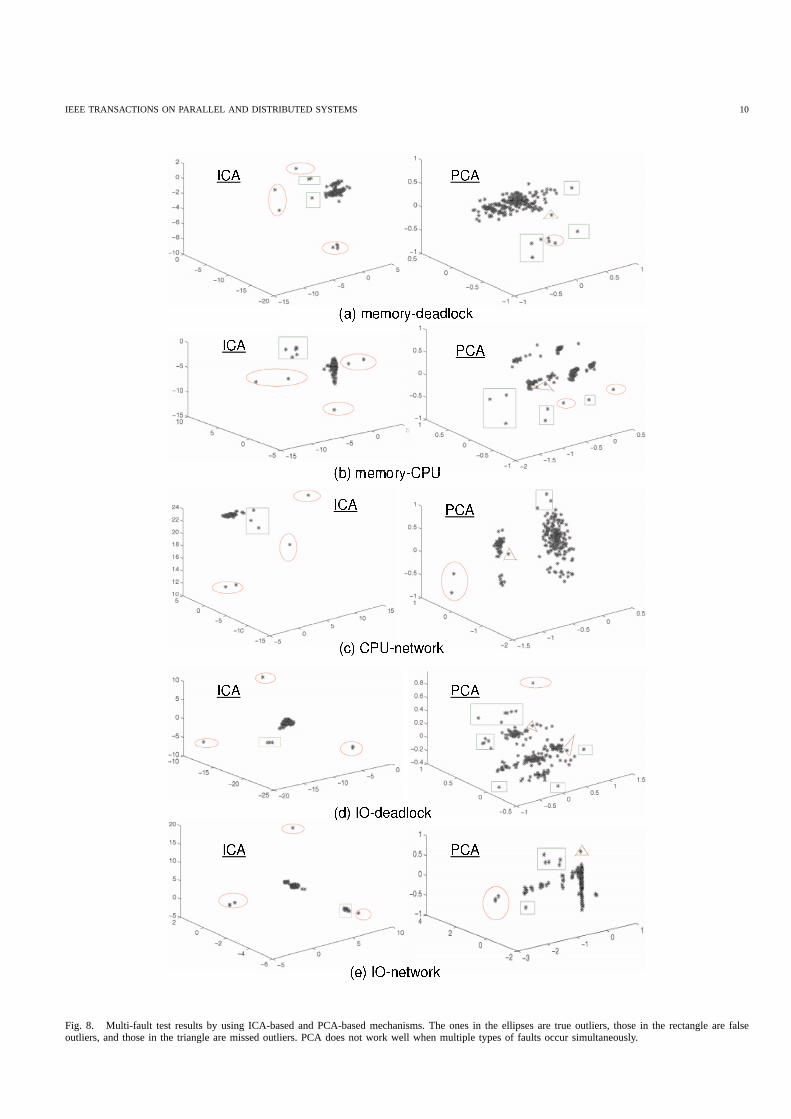
2) Multi-Fault Tests: In this set of experiments, differenttypes of faults are simultaneously injected onto0 − 20 nodesin the system. The results for two-fault tests are listed in TableIII. We have also conducted experiments with three and fourtypes of faults. The results are very similar to those shownin the table, so we omit them here. Meanwhile, Figure 8pictorially show some two-fault results achieved by PCA-based and ICA-based mechanisms. Again, on each plot, the Xaxis, the Y axis and the Z axis represent the1st, 2nd and3rdprincipal or independent components. The points in the ellipsesare true outliers, those in the rectangles are false outliers, andthose in the triangle are missed outliers.
Consistent with the results shown in Table II, withoutfeature extraction (i.e., no-extraction),specificity is low. Thisdemonstrates that for both single-fault and multi-fault tests,feature extraction is indispensable as it can not only reducedata size, but also improvespecificity. Low specificitymeans that there are non-trivial amount of false alarms. Falseidentifications can be caused by noise in the original data orby the closeness of data points in the original space. Featureextraction is capable of reducing noise effects by keeping the
IEEE TRANSACTIONS ON PARALLEL AND DISTRIBUTED SYSTEMS 10
Fig. 8. Multi-fault test results by using ICA-based and PCA-based mechanisms. The ones in the ellipses are true outliers, those in the rectangle are falseoutliers, and those in the triangle are missed outliers. PCA does not work well when multiple types of faults occur simultaneously.
IEEE TRANSACTIONS ON PARALLEL AND DISTRIBUTED SYSTEMS 11
most relevant information in the data and distinguishing groupsby amplifying the difference between normal and abnormalbehaviors.
ICA-based mechanism produces the best results by detect-ing every anomalous nodes, with the averagespecificityabove0.94. The results are also consistent with those shownin the single-fault tests. As shown in Figure 8, ICA caneffectively define a basis set of statistically independentaxes,where data points in the ICA-defined subspaces are betterseparated. The majority of data points join together as a cluster,which represent normal nodes. The points that are substantiallyaway from the major cluster are true outliers (i.e., in theellipses). On each plot, there are several data points closetothe major cluster, indicating false outliers.
A very interesting observation is that PCA does not workwell when multiple types of faults occur simultaneously.According to the table, in 6 out of 10 tests, the values ofsensitivity are lower than0.60, meaning that more than40%of anomalies are missed by using PCA. The extreme case iswhen IO related faults and network related faults co-exist inthe system, for whichsensitivity is only at 0.25. In single-fault tests, we mentioned that network related and IO relatedfaults are difficult to detect due to their easy propagationcharacteristics. PCA produces a terrible result when a mixtureof these faults occur in the system. We attribute this to thenature of PCA: PCA focuses on finding the directions ofmaximal varianceby using the second order statistic. As aresult, in case of multiple faults, PCA chooses the basis vectorsthat pertain to one “strong” fault and ignores the informationthat is relevant to other faults. Hence, PCA is not effectiveinidentifying simultaneous faults of different types.
Both single-fault and multi-fault tests have shown that ICAoutperforms PCA. The main reason is that ICA is designedto maximize independence by using higher order statisticsin the data, whereas PCA focuses on maximize variance byusing the second order statistics in the data. As a result,ICA is more robust to noise and its defined subspaces caneffectively encode more information of node behaviors thanPCA-defined subspaces. It also indicates that second-orderstatistic is not sufficient to describe the behavior of faultynodes. As a result, PCA is not effective in detecting faults thatare easily propagated throughout the system. Also, it shouldnot be adopted when there are multiple faults co-existing inthe system.
3) Computation Overhead:Both PCA-based and ICA-based mechanisms are time efficient. In our experiments, bothtake less than0.25 seconds to produce an anomaly list, whichmake them feasible for practical usage. As pointed earlierin Section III-B, this is due to the fact that we only needto calculate a few Eigenvectors and Eigenvalues by usingPCA and FastICA has a very high convergence rate (usuallyconverges in less than 40 iterations).
In summary, our experiments have shown that:• Feature extraction can substantially improvespecificity
by reducing false identifications.• Both PCA-based mechanism and ICA-based mechanism
are time efficient, e.g., taking less than0.25 seconds toprocess voluminous amount of noisy, high-dimensional
data in our experiments.• PCA-base mechanism works well for some faults; how-
ever, it is inefficient when there are multiple types offaults co-existing in the systems or faults have strongpropagation characteristics.
• ICA-based mechanism is a promising approach for au-tomated anomaly identification in large-scale systems. Itcan effectively identify a variety of faults by capturingevery fault injected (i.e.,sensitivity is always at1.0),with the false alarm rate less than8% (i.e., specificityis always above0.92). This will guarantee little amountof human effort is needed for final validation.
V. D ISCUSSIONS
This study has presented a general framework for node-level anomaly identification. In particular, it has compared twotechniques, namely PCA and ICA, for feature extraction. Ourresults have demonstrated that ICA-based mechanism alwaysoutperforms PCA-based mechanism. The limitation of PCAis derived from its assumptions. First is its assumption onthe statistical importance of mean and covariance. It onlyuses the second order statistics for the derivation of basisvectors, and the basis vectors have to be orthogonal and inorder. It does not guarantee that the directions of maximalvariance will contain good features for discrimination. Secondis due to its assumption that large variances have importantdynamics. It is only effective when the observed data has ahigh signal-to-noise ratio such that the principal componentswith larger variance correspond to interesting dynamics andlower ones correspond to noise. Our studies have shown thatfeature data collected for troubleshooting are noisy, thusPCA-based mechanism is not effective in detecting some faults.ICA overcomes these limitations by using a different way toconstruct the basis vectors.
The anomaly identification framework presented in Figure 1is general and extensible, as it works with various data sourcesas long as the data can well capture node behaviors. Asdefined in Section I, this study emphasizes the identificationof anomalies, where anomalies are the nodes in error orfailed states and they may be caused by system faults inhardware or software. In case that we are finding the nodesin error states, meaning that the nodes are not failed yet,the presented framework can be used as a failure predictionsupport. Otherwise, if the nodes are already in the failed states,then the presented framework can be considered as a failurediagnosis support.
Similar to other automatic approaches, our mechanism isalso subjected to some errors. For example, the ICA-basedapproach may result in a false alarm rate by up to8%.False alarms may be caused by background noise or faultpropagation. We believe that a promising way to address thisissue is to involve the human in data analysis, which is exactlywhat we propose in Figure 1. The anomaly list produced byour mechanism can be sent to system administrators for furtherinvestigation. Other research projects have also pointed out theimportance of keeping the human in failure analysis [48].
Our mechanism relies on the assumption that nodes in thesame group should exhibit similar behaviors. This can be
IEEE TRANSACTIONS ON PARALLEL AND DISTRIBUTED SYSTEMS 12
achieved by the use of dynamic grouping. While this studyfocuses on homogeneous collection of nodes, in order to beof system-wide use, our mechanism needs to interact withresource management and job scheduling tools to properlydivide system resources into different groups. For instance,the nodes performing comparable activities, e.g., a set ofdedicated IO nodes or a set of compute nodes allocatedto the same parameter sweep application, can be groupedtogether. Further, the nodes allocated to parallel applicationscan also be divided into different groups by examining the callstacks during process initialization stage [55]. In other words,the master nodes and worker nodes may be allocated intodifferent groups. How to effectively integrate with resourcemanagement and job scheduling tools is one of our on-goingefforts. In addition, our mechanism does not work when a faultoccurs cross the entire system. Fortunately, this kind of faultscan be easily detected via existing technologies.
Our study has some limitations that remain as our futurework. First, in our current design, the number of independentaxes in ICA is set based on a criterion used by PCA, whichmay discard some useful information in the data. This couldbe addressed by exploiting techniques like the one presentedin [32]. Second, the presented framework can be extendedby tracing the change of outliers, and this could addressthe fault propagation issue in large-scale systems. Lastly, inour experiments we have mainly collected performance datafrom the operating system for constructing feature matrix.Aninteresting direction is to investigate how to include other datasources for anomaly identification. As an example, how totransfer system events into our feature space is worthwhiletoexplore.
VI. RELATED WORK
For large-scale systems, a key challenge facing by theirsystem operators is to understand failure trends and modes.Over the past, numerous studies have been conducted ondiagnosing and/or predicting failures based on system events.Broadly speaking, we can classify existing approaches intotwo groups: model-basedand data-driven. A model-basedapproach derives a probabilistic or analytical model of thesystem. A warning is triggered when a deviation from themodel is detected [43]. Examples include an adaptive statisti-cal data fitting method called MSET presented in [47], naiveBayesian based models for disk failure prediction [23], andSemi-Markov reward models described in [49]. In large-scalesystems, errors may propagate from one component to othercomponents, thereby making it difficult to identify root causesof the problem(s). A common solution is to develop faultpropagation models (FPM), such as causality graphs or de-pendency graphs [4]. Generating dependency graphs, however,requires a priori knowledge about the system structure and thedependencies among different components, which is hard toobtain in large-scale systems. The major limitation of model-based methods is the difficulty of generating and maintainingan accurate model, especially given the unprecedented sizeand complexity of large-scale systems.
Recently, data mining and statistical learning theory (SLT)have received growing attention for failure diagnosis and
prognosis. These methods extract fault patterns from systemnormal behaviors, and detect abnormal observations basedon the learned knowledge without assuming a priori modelahead of time [37]. For example, the group at the BerkeleyRAD laboratory has applied statistical learning techniquesfor failure diagnosis in Internet services [2], [12]. The SLIC(Statistical Learning, Inference and Control) project at HP hasexplored similar techniques for automating fault managementof IT systems [50]. In [10], [13], the authors have presentedseveral methods to predict failure events in IBM clusters. In[8], [34], Liang et al. have examined several statistical basedmethods for failure prediction in IBM Blue Gene/L systems.Fu and Xu have developed a framework called hPREFECTSfor failure prediction in networked computing systems [3].In our own studies [44], [45], we have investigated meta-learning based method for improving failure prediction byadaptively combining various data mining techniques. Otherrepresentative studies include system log analysis [14], [27]and fault detection in syslogs [33].
While our approach belongs to the data-driven category (i.e.,making decisions by gathering and analyzing large amountsof data), it focuses more on building a systematic frameworkfor automated anomaly identification in large-scale systems.In addition, this study demonstrates that ICA is a promisingcandidate for anomaly identification in large-scale systems.
Most studies on failure diagnosis determine system errorsby examining historical data, which we denote as being basedon avertical view of the system. They are often characterizedby the requirement of training a classifier on samples ofboth normal and abnormal data. The fundamental problemwith this approach is that it limits us to the detection andlocalization of faults with known signatures. Distinguishedfrom this approach, our mechanism exploits ahorizontalviewof the system for anomaly identification. It does not requiretraining on good samples, thereby being capable of findinganomalies not yet seen in the data. Like the work [33], ourmechanism is also based on the observation that system nodesperforming similar activities should exhibit similar behaviors.However, unlike [33] which uses the encoding of word positionin syslogs for fault detection, our work employs featureextraction to reduce data dimensionality and outlier detectionto automatically determine the nodes that are significantlydifferent from the majority.
Our mechanism can also aid failure prediction. Unlikefailure diagnosis which focuses on detecting and localizingfailures, failure prediction emphasizes on forecasting occur-rences of system failures. Earlier studies have shown that it ispossible to predict some failures by analyzing RAS (reliability,availability, and serviceability) logs collected and archived insystems [8], [10], [44], [45]. However, due to the lack ofinformation in RAS logs, most often the prediction is on thelevel of system, meaning that we may predict when the systemwill likely experience some failure, but unable to tell where.A possible solution is to archive system performance data inaddition to RAS logs. Existing predictive methods such as[8], [10], [45] are used on the RAS events to predict whenthe underlying system will experience a critical event (e.g. ahardware or software failure), and this work can be utilized
IEEE TRANSACTIONS ON PARALLEL AND DISTRIBUTED SYSTEMS 13
to determine the potential localizations of the problem byanalyzing performance data .
Our work is inspired by the work presented in [25] whichexplores PCA to diagnose network-wide traffic anomalies.This paper is fundamentally different from [25] at three keyaspects. First, we target identifying faulty nodes in large-scalesystems such as those used for high performance computing[1]. In doing so, our feature space is quite different from theone used in [25]. Second, they apply classification techniques(i.e., a supervised learning) to identify network anomalies,while we investigate the use of an optimized outlier detectionmethod (i.e., an unsupervised learning) to find out outliers.Finally, we have demonstrated through experiments that ICAoutperforms PCA for anomaly identification in large-scalesystems.
PCA is a well-known method for feature extraction and hasbeen applied in many fields [16], such as problem diagnosis[25] and application classification [26]. However, as pointedout in our experiments, PCA has several limitations. In par-ticular, it cannot distinguish a mixture of multiple types offaults and does not work well with the faults that are easilypropagate across the system. There has been a growing waveof papers on ICA and its algorithms since the mid-1990s[31]. To date, ICA has been used for signal processing, facerecognition, industrial processing, chemical engineering, andbiomedical engineering [30], [32], [51]–[53]. To the best of ourknowledge, we are among the first to explore ICA for anomalyidentification in high performance computing systems.
There are a number of other feature extraction techniques,such as linear discriminant analysis (LDA) [16] and non-negative matrix factorization (NMF) [57]. These methodseither are based on supervised learning or have a low com-putation convergence, thereby not being examined in thiswork. Both ICA and PCA are linear extraction methods.Recently, some nonlinear methods have been proposed toaddress the issues in linear methods, like kernel methods [58]and multidimensional scaling (MDS) [56]. The investigationof these nonlinear methods remains as one of our future work.
VII. C ONCLUSION
In this paper, we have presented an automated mechanismfor anomaly identification in large-scale systems. It appliesthree inter-related techniques to dynamically get the anomalylists. Our experiments on a production system via manuallyfault injection have demonstrated that ICA-based mechanismcan provide high accuracy by effectively discovering a va-riety of faults, with perfectsensitivity and extremely highspecificity. This indicates that ICA has a great potential foranomaly identification in large-scale systems. It is one of ourgoals that this work will open up a new research directionin using ICA for anomaly detection and localization in large-scale systems.
ACKNOWLEDGMENT
This work is supported in part by US National Sci-ence Foundation grants CNS-0834514, CNS-0720549, CCF-0702737, and a TeraGrid Compute Allocation. Some prelimi-nary results of this work were presented in [29].
REFERENCES
[1] TeraGrid Website, available at http://www.teragrid.org/[2] M. Chen, E. Kiciman, E. Fratkin, A. Fox. and E. Brewer, “Pinpoint:
Problem Determination in Large, Dynamic, Internet Services,” Proc. ofDSN’02, 2002.
[3] S. Fu and C. Xu, “Exploring Event Correlation for FailurePrediction inCoalitions of Clusters,”Proc. of SC’07, 2007.
[4] M. Steinder and A. Sethi, “A Survey of Fault LocalizationTechniques inComputer Networks,”Sci. Comput. Program., vol. 53(2), 2004.
[5] V. Tabatabaee and J. Hollingsworth, “Automatic SoftwareInterferenceDetection in Parallel Applications,”Proc. of SC’07, 2007.
[6] A. Avizienis, J. Laprie, B. Randell and C. Landwehr, “Basic Conceptsand Taxonomy of Dependable and Secure Computing,”IEEE Trans. onDependable and Secure Computing, vol. 1(1), 2004.
[7] W. Kao and R. Iyer, “DEFINE: A Distributed Fault Injection andMonitoring Environment,”Proc. of IEEE Workshop on Fault-TolerantParallel and Distributed Systems, 1994.
[8] Y. Liang, Y. Zhang, A. Sivasubramaniam, M. Jette, and R. Sahoo,“BlueGene /L Failure Analysis and Models,”Proc. of DSN’06, 2006.
[9] G. Hoffmann, F. Salfner, and M. Malek, “Advanced Failure Prediction inComplex Software Systems,”Proc. of SRDS’04, 2004.
[10] R. Sahoo, A. Oliner, I. Rish, M. Gupta, J. Moreira, S. Ma,R. Vilalta,and A. Sivasubramaniam, “Critical Event Prediction for Proactive Man-agement in Large-scale Computer Clusters,”Proc. of SIGKDD’03, 2003.
[11] K. Trivedi and K. Vaidyanathan, “A Measurement-based Model forEstimation of Resource Exhaustion in Operational Software Systems,”Proc. of ISSRE’99, 1999.
[12] M. Chen, A. Zheng, J. Lloyd, M. Jordan, and E. Brewer , “FailureDiagnosis Using Decision Trees,”Proc. of ICAC’04, 2004.
[13] R. Vilalta and S. Ma, “Predicting Rare Events in TemporalDomains,”Proc. of ICDM’02, 2002.
[14] A. Oliner and J. Stearley, “What Supercomputers Say: A Study of FiveSystem Logs,”Proc. of DSN’07, 2007.
[15] J. Zhang and R. Figueiredo, “Application Classification through Mon-itoring and Learning of Resource Consumption Patterns,”Proc. ofIPDPS’06, 2006.
[16] R. Duda, P. Hart, and D. Stork.Pattern Classification (2nd Edition).Wiley-Interscience, New York, NY, 2001.
[17] E. Knorr, R. Ng, and V. Tucakov, “Distance-Based Outliers: Algorithmsand Applications,”The VLDB Journal, vol. 8(3), 2000.
[18] Hardware Monitoring by LM Sensors, available at http://www.lm-sensors.org/
[19] Intelligent Platform Management Interface, availableathttp://www.intel.com/design/servers/ipmi/
[20] Splunk Website, available at http://www.splunk.com/[21] The Computer Failure Data Repository, available at
http://institute.lanl.gov/data/lanldata.shtml[22] B. Allen, “Monitoring Hard Disk with SMART,”Linux Journal, 2004.[23] G. Hamerly and C. Elkan, “Bayesian Approaches to FailurePrediction
for Disk Drives,” Proc. of ICML’01, 2001.[24] A. Mirgorodskiy, N. Maruyama, and B. Miller, “Problem Diagnosis in
Large-Scale Computing Environments,”Proc. of SC’06, 2006.[25] A. Lakhina, M. Crovella and C. Diot, “Diagnosing Network-Wide Traffic
Anomalies,”Proc. of SIGCOMM’04, 2004.[26] J. Zhang and R. Figueiredo, “Application Classification through Mon-
itoring and Learning of Resource Consumption Patterns”,Proc. ofIPDPS’06, 2006.
[27] B. Schroeder and G. Gibson, “A Large-scale Study of Failures in HighPerformance Computing Systems,”Proc. of DSN’06, 2006.
[28] A. Girard and B. Sanso, “Multicommodity Flow Models, Failure Propa-gation, and Reliable Loss Network Design,”IEEE/ACM Transactions onNetworking, VOL. 6(1), 1998.
[29] Z. Zheng, Y. Li, and Z. Lan, “Anomaly Localization in Large-scaleClusters,”Proc. of IEEE Cluster, 2007.
[30] A. Hyvarinen and E. Oja, “Independent Component Analysis: Algo-rithms and Applications,”Neural Networks, vol. 13, Issue 4-5, 2000.
[31] C. Jutten and J. Karhunen, “The Nonlinear ICA and BSS Problems,”Proc. of the 4th Int. Symp. on Independent Component Analysis and BlindSignal Separation (ICA2003), 2003.
[32] M. Bartlett, J. Movellan and T. Sejnowski, “Face Recognition byIndependent Component Analysis,”IEEE Trans. on Neural Networks, vol.13(6), 2002.
[33] J. Stearley and A. Oliner, “Bad Words: Finding Faults inSpirit’sSyslogs,” Proc. of the Workshop on Resiliency in High PerformanceComputing, 2008.
IEEE TRANSACTIONS ON PARALLEL AND DISTRIBUTED SYSTEMS 14
[34] Y. Liang, Y. Zhang, H. Xiong and R. Shaoo, “Failure Prediction in IBMBlueGene/L Event Logs,”Proc. of ICDM’07, 2007.
[35] L. Yang, C. Liu, J. Schopf and I. Foster, “Anomaly Detection andDiagnosis in Grid Environments,”Proc. of SC’07, 2007.
[36] Y. Rao and J. Principe, “A Fast, On-Line Algorithm for PCA and ItsConvergence Characteristics,”Proc. of IEEE Signal Processing SocietyWorkshop, 2000.
[37] W. Peng, T. Li and S. Ma, “Mining Logs Files for Computing SystemManagement,”Proc. of ICAC’05,2005.
[38] S. Venkataraman, J. Caballero, D. Song, A. Blum, and J. Yates, “Black-box Anomaly Detection:Is it Utopian?”Proc. of HotNets, 2006.
[39] Ganglia Monitoring System, available at http://ganglia.sourceforge.net/[40] M. Scottile and R. Minnich, “Supermon: A High- Speed Cluster Mon-
itoring System,”Proc. of IEEE Cluster, 2002.[41] S. Smallen, C. Olschanowski, K. Ericson, P. Bechman, and J. Schopf,
“The Inca Test Harness and Reporting Framework”,Proc. of SC’04, 2004.[42] A. Grama, V. Kumar, A. Gupta, and G. Karpis,Introduction to Parallel
Computing(2nd Edition), Addison-Wesley, 2003.[43] J. Hellerstein, F. Zhang, and P. Shahabuddin, “A Statistical Approach to
Predictive Detection,”Computer Networks: The International Journal ofComputer and Telecommunications Networking, 2001.
[44] P. Gujrati, Y. Li, Z. Lan, R. Thakur, and J. White, “A Meta-LearningFailure Predictor for Blue Gene/L Systems,”Proc. of ICPP’07, 2007.
[45] J. Gu, Z. Zheng, Z. Lan, J. White, E. Hocks, and B.H. Park, “DynamicMeta-Learning for Failure Prediction in Large-Scale Systems: A CaseStudy,” Proc. of ICPP’08, 2008.
[46] B. Park, Z. Zheng, Z. Lan, and A. Geist, “Analyzing Failure Events onORNL’s Cray XT4,” Proc. of SC’08 (research poster), 2008.
[47] K. Vaidyanathan and K. Gross, “MSET Performance Optimization forDetection of Software Aging,”Proc. of ISSRE, 2003.
[48] P. Bodik, G. Friedman, L. Biewald, H. Levine, G. Candea, K. Patel,G. Tolle, J. Hui, A. Fox, M. Jordan, and D. Patterson, “CombiningVisualization and Statistical Analysis to Improve OperatorConfidenceand Efficiency for Failure Detection and Localization,”Proc. of ICAC’05,2005.
[49] S. Garg, A. Puliafito, and K. Trivedi, “Analysis of Software Rejuve-nation Using Markov Regenerative Stochastic Petri Net,”Proc. of 6thInternational Symposium on Software Reliability Engineering, 1995.
[50] I. Cohen and J. Chase, “Correlating Instrumentation Data to SystemStates: A building Block for Automated Diagnosis and Control,” Proc.of OSDI’04, 2004.
[51] P. Akhlaghi, A. Kashanipour, and K. Salahshoor, “Complex DynamicalSystem Fault Diagnosis Based on Multiple ANFIS Using IndependentComponent,”Proc. Of the 16th Mediterranean Conf. on Control andAutomation, 2008.
[52] M. Kano, S. Hasebe, and I. Hashimoto, “Evolution of Multivariate Sta-tistical Process Control: Application of Independent Component Analysisand External Analysis,”Proc. of Foundations of Computer Aided ProcessOperations, 2003.
[53] S. Makeig, A. Bell, T. Jung, and T. Sejnowski, “Independent ComponentAnalysis of Electroencephalographic Data,”Advances in Neural Informa-tion Processing Systems,vol. 8, pp. 145-151,1996.
[54] J. Barton, E. Czeck, Z. Segall, and D. Siewiorek, “FaultInjectionExperiments Using FIAT,”IEEE Trans. On Computers, vol. 39(4), 1990.
[55] N. Maruyama and S. Matsuoka, “Model-based Fault Localization inLarge-Scale Computing Systems,”Proc of IPDPS’08, 2008.
[56] A. Podgurski, D. Leon, P. Francis, W. Masri, M. Minch, J.Sun, andB. Wang, “Automated Support for Classifying Software Failure Reports,”Proc. of ICSE’03, 2003.
[57] D. Lee and S. Seung,“Learning the Parts of Objects by Non-negativeMatrix Factorization”,Nature,401, 788-791, 1999.
[58] F. Bach and M. Jordan, “Kernel Independent Component Analysis”,Journal of Machine Learning Res., vol. 3, 2002.
PLACEPHOTOHERE
Zhiling Lan received the BS degree in Mathematicsfrom Beijing Normal University, the MS degreein Applied Mathematics from Chinese Academy ofSciences, and the PhD degree in Computer Engineer-ing from Northwestern University in 2002. She iscurrently an assistant professor of computer scienceat the Illinois Institute of Technology. Her mainresearch interests include fault tolerant computing,dynamic load balancing, and performance analysisand modeling. She is a member of the IEEE Com-puter Society.
PLACEPHOTOHERE
Ziming Zheng received his BS and MS degrees inthe University Of Electronic Science & Technologyof China in 2003 and 2006. He is now a PhDcandidate of Computer Science at Illinois Instituteof Technology since 2007. His research focuses onfault tolerance in large-scale computer systems. Heis also an IEEE student member.
PLACEPHOTOHERE
Yawei Li received the BS and MS degrees in theUniversity Of Electronic Science & Technology ofChina in 1999 and 2002. He received the PhDdegree in Computer Science from Illinois Institute ofTechnology in 2009. He specializes in parallel anddistributed computing, in particular, adaptive faultmanagement and checkpointing optimization. He isnow with Google Inc. He is also an IEEE member.