Study of the Pioneer anomaly: A problem set
14
arXiv:physics/0502123v5 [physics.ed-ph] 6 Sep 2005 LA-UR-05-0745 Study of the Pioneer anomaly: A problem set Slava G. Turyshev ∗ and John D. Anderson † Jet Propulsion Laboratory, California Institute of Technology, 4800 Oak Grove Drive, Pasadena, California 91109 Michael Martin Nieto ‡ Theoretical Division, MS-B285, Los Alamos National Laboratory, University of California, Los Alamos, New Mexico 87545 Analysis of the radio-metric tracking data from the Pioneer 10 and 11 spacecraft at distances between 20 and 70 astronomical units from the Sun has consistently indicated the presence of an anomalous, small, and constant Doppler frequency drift. The drift is a blueshift, uniformly changing at the rate of (5.99 ± 0.01) × 10 −9 Hz/s. The signal also can be interpreted as a constant acceleration of each particular spacecraft of (8.74 ± 1.33) × 10 −8 cm/s 2 directed toward the Sun. This interpretation has become known as the Pioneer anomaly. We provide a problem set based on the detailed investigation of this anomaly, the nature of which remains unexplained. PACS numbers: 04.80.-y, 95.10.Eg, 95.55.Pe I. INTRODUCTION The Pioneer 10/11 missions, launched on 2 March 1972 (Pioneer 10) and 4 December 1973 (Pioneer 11), were the first to explore the outer solar system. After Jupiter and (for Pioneer 11) Saturn encounters, the two spacecraft followed escape hyperbolic orbits near the plane of the ecliptic to opposite sides of the solar system. (The hy- perbolic escape velocities are ∼12.25 km/s for Pioneer 10 and ∼11.6 km/s for Pioneer 11.) Pioneer 10 eventually became the first man-made object to leave the solar sys- tem. See Fig. 1 for a perspective of the orbits of the spacecraft and Tables I and II for more details on their missions. The orbital parameters for the crafts are given in Table III. The Pioneers were excellent craft with which to per- form precise celestial mechanics experiments due to a combination of many factors, including their attitude control (spin-stabilized, with a minimum number of at- titude correction maneuvers using thrusters), power de- sign [the Plutonium-238 powered heat-source radioiso- tope thermoelectric generators (RTGs) are on extended booms to aid the stability of the craft and also reduce the effects due to heating], and precise Doppler tracking (with the accuracy of post-fit Doppler residuals at the level of mHz). The result was the most precise naviga- tion in deep space to date. See Fig. 2 for a design drawing of the spacecraft. By 1980 Pioneer 10 had passed a distance of ∼20 as- tronomical units (AU) from the Sun and the accelera- tion contribution from solar-radiation pressure on the craft (directed away from the Sun) had decreased to < 4 × 10 −8 cm/s 2 . At that time an anomaly in the Doppler signal became evident and persisted. 1 Subse- quent analysis of the radio-metric tracking data from the Pioneer 10/11 spacecraft at distances between ∼20 and 70 AU from the Sun has consistently indicated the pres- ence of an anomalous, small, and constant Doppler fre- quency drift of ˙ ν = (5.99 ± 0.01) × 10 −9 Hz/s. The drift can be interpreted as being due to a constant accelera- tion of the spacecraft of a P = (8.74 ± 1.33) × 10 −8 cm/s 2 directed toward the Sun. 2 The nature of this anomaly remains unknown, and no satisfactory explanation of the anomalous signal has been found. This signal has become known as the Pioneer anomaly. 3 Although the most obvious explanation would be that there is a systematic origin to the effect, perhaps gen- erated by the spacecraft themselves from excessive heat or propulsion gas leaks, 4–6 none has been found. 7–9 Our inability to explain the anomalous acceleration of the Pi- oneer spacecraft has contributed to a growing discussion about its origin, especially because an independent veri- fication of the anomaly’s existence has been performed. 10 Attempts to verify the anomaly using other spacecraft have proven disappointing, 2,9,11,12 because the Voyager, Galileo, Ulysses, and Cassini spacecraft navigation data all have their own individual difficulties for use as an in- dependent test of the anomaly. In addition, many of the deep space missions that are currently being planned ei- ther will not provide the needed navigational accuracy and trajectory stability of under 10 −8 cm/s 2 (that is, recent proposals for the Pluto Express and Interstellar Probe missions), or else they will have significant on- board effects that mask the anomaly (the Jupiter Icy Moons Orbiter mission). The acceleration regime in which the anomaly was observed diminishes the value of using modern disturbance compensation systems for a test. For example, the systems that are currently be- ing developed for the LISA (Laser Interferometric Space Antenna) and LISA Pathfinder missions are designed to operate in the presence of a very low frequency accel- eration noise (at the millihertz level), while the Pioneer anomalous acceleration is a strong constant bias in the Doppler frequency data. In addition, currently available accelerometers are a few orders of magnitude less sensi- tive than is needed for a test. 11–15 Should the anomaly be a fictitious force that universally affects frequency
-
Upload
independent -
Category
Documents
-
view
0 -
download
0
Transcript of Study of the Pioneer anomaly: A problem set
arX
iv:p
hysi
cs/0
5021
23v5
[ph
ysic
s.ed
-ph]
6 S
ep 2
005
LA-UR-05-0745
Study of the Pioneer anomaly: A problem set
Slava G. Turyshev∗ and John D. Anderson†
Jet Propulsion Laboratory, California Institute of Technology,
4800 Oak Grove Drive, Pasadena, California 91109
Michael Martin Nieto‡
Theoretical Division, MS-B285, Los Alamos National Laboratory,
University of California, Los Alamos, New Mexico 87545
Analysis of the radio-metric tracking data from the Pioneer 10 and 11 spacecraft at distancesbetween 20 and 70 astronomical units from the Sun has consistently indicated the presence ofan anomalous, small, and constant Doppler frequency drift. The drift is a blueshift, uniformlychanging at the rate of (5.99 ± 0.01) × 10−9 Hz/s. The signal also can be interpreted as a constantacceleration of each particular spacecraft of (8.74 ± 1.33) × 10−8 cm/s2 directed toward the Sun.This interpretation has become known as the Pioneer anomaly. We provide a problem set based onthe detailed investigation of this anomaly, the nature of which remains unexplained.
PACS numbers: 04.80.-y, 95.10.Eg, 95.55.Pe
I. INTRODUCTION
The Pioneer 10/11 missions, launched on 2 March 1972(Pioneer 10) and 4 December 1973 (Pioneer 11), were thefirst to explore the outer solar system. After Jupiter and(for Pioneer 11) Saturn encounters, the two spacecraftfollowed escape hyperbolic orbits near the plane of theecliptic to opposite sides of the solar system. (The hy-perbolic escape velocities are ∼12.25 km/s for Pioneer 10and ∼11.6 km/s for Pioneer 11.) Pioneer 10 eventuallybecame the first man-made object to leave the solar sys-tem. See Fig. 1 for a perspective of the orbits of thespacecraft and Tables I and II for more details on theirmissions. The orbital parameters for the crafts are givenin Table III.
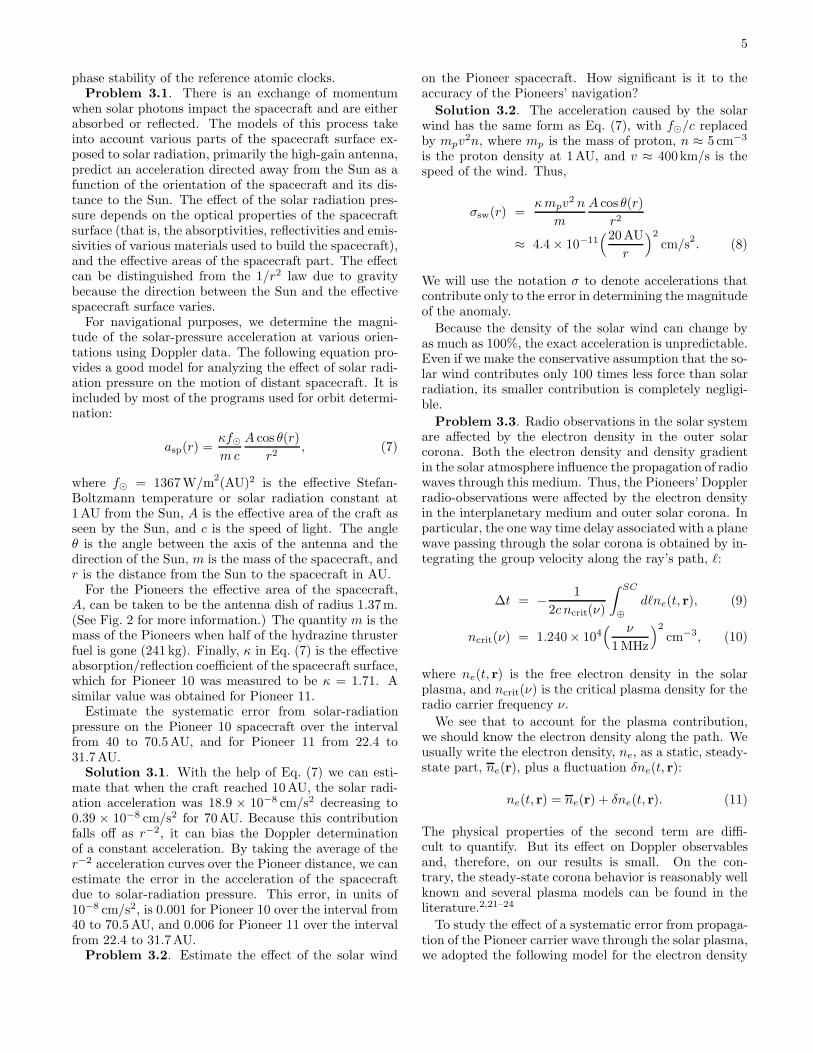
The Pioneers were excellent craft with which to per-form precise celestial mechanics experiments due to acombination of many factors, including their attitudecontrol (spin-stabilized, with a minimum number of at-titude correction maneuvers using thrusters), power de-sign [the Plutonium-238 powered heat-source radioiso-tope thermoelectric generators (RTGs) are on extendedbooms to aid the stability of the craft and also reducethe effects due to heating], and precise Doppler tracking(with the accuracy of post-fit Doppler residuals at thelevel of mHz). The result was the most precise naviga-tion in deep space to date. See Fig. 2 for a design drawingof the spacecraft.
By 1980 Pioneer 10 had passed a distance of ∼20 as-tronomical units (AU) from the Sun and the accelera-tion contribution from solar-radiation pressure on thecraft (directed away from the Sun) had decreased to< 4 × 10⁻⁸ cm/s2. At that time an anomaly in theDoppler signal became evident and persisted.1 Subse-quent analysis of the radio-metric tracking data from thePioneer 10/11 spacecraft at distances between ∼20 and70AU from the Sun has consistently indicated the pres-ence of an anomalous, small, and constant Doppler fre-
quency drift of ν = (5.99 ± 0.01) × 10−9 Hz/s. The driftcan be interpreted as being due to a constant accelera-tion of the spacecraft of aP = (8.74± 1.33)× 10−8 cm/s2
directed toward the Sun.2 The nature of this anomalyremains unknown, and no satisfactory explanation of theanomalous signal has been found. This signal has becomeknown as the Pioneer anomaly.3
Although the most obvious explanation would be thatthere is a systematic origin to the effect, perhaps gen-erated by the spacecraft themselves from excessive heator propulsion gas leaks,4–6 none has been found.7–9 Ourinability to explain the anomalous acceleration of the Pi-oneer spacecraft has contributed to a growing discussionabout its origin, especially because an independent veri-fication of the anomaly’s existence has been performed.10
Attempts to verify the anomaly using other spacecrafthave proven disappointing,2,9,11,12 because the Voyager,Galileo, Ulysses, and Cassini spacecraft navigation dataall have their own individual difficulties for use as an in-dependent test of the anomaly. In addition, many of thedeep space missions that are currently being planned ei-ther will not provide the needed navigational accuracyand trajectory stability of under 10−8 cm/s2 (that is,recent proposals for the Pluto Express and InterstellarProbe missions), or else they will have significant on-board effects that mask the anomaly (the Jupiter IcyMoons Orbiter mission). The acceleration regime inwhich the anomaly was observed diminishes the valueof using modern disturbance compensation systems fora test. For example, the systems that are currently be-ing developed for the LISA (Laser Interferometric SpaceAntenna) and LISA Pathfinder missions are designed tooperate in the presence of a very low frequency accel-eration noise (at the millihertz level), while the Pioneeranomalous acceleration is a strong constant bias in theDoppler frequency data. In addition, currently availableaccelerometers are a few orders of magnitude less sensi-tive than is needed for a test.11–15 Should the anomalybe a fictitious force that universally affects frequency
2
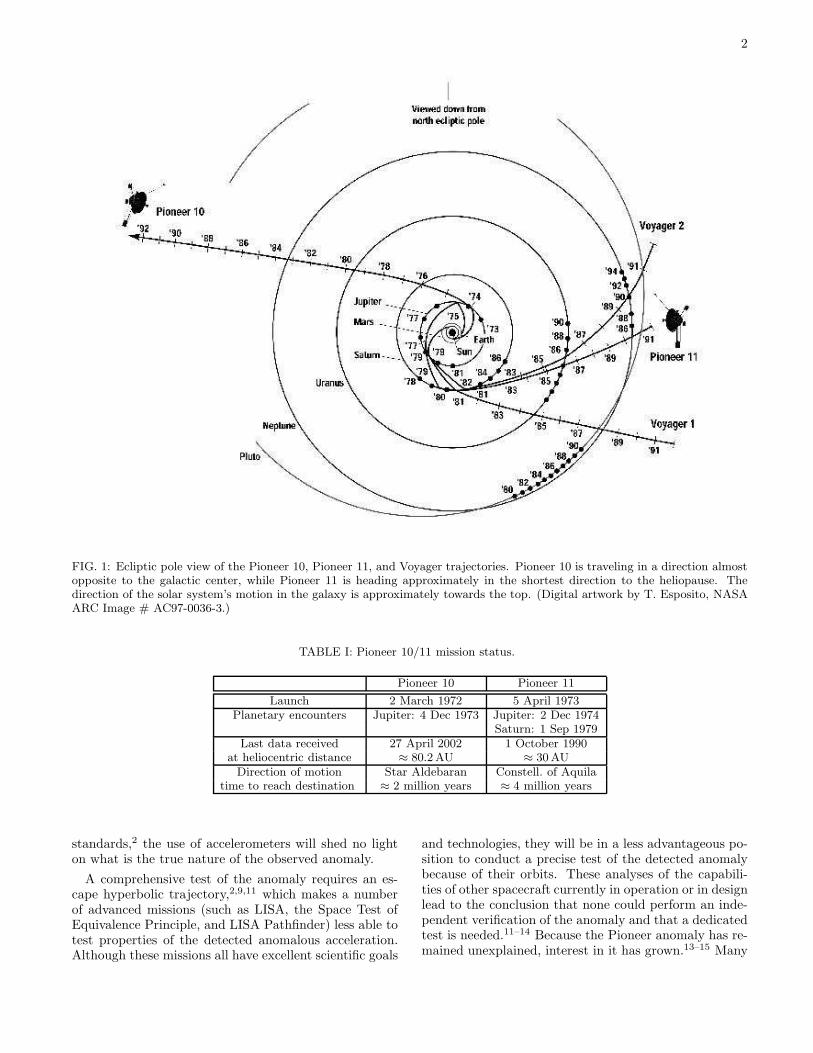
FIG. 1: Ecliptic pole view of the Pioneer 10, Pioneer 11, and Voyager trajectories. Pioneer 10 is traveling in a direction almostopposite to the galactic center, while Pioneer 11 is heading approximately in the shortest direction to the heliopause. Thedirection of the solar system’s motion in the galaxy is approximately towards the top. (Digital artwork by T. Esposito, NASAARC Image # AC97-0036-3.)
TABLE I: Pioneer 10/11 mission status.
Pioneer 10 Pioneer 11
Launch 2 March 1972 5 April 1973Planetary encounters Jupiter: 4 Dec 1973 Jupiter: 2 Dec 1974
Saturn: 1 Sep 1979Last data received 27 April 2002 1 October 1990
at heliocentric distance ≈ 80.2 AU ≈ 30 AUDirection of motion Star Aldebaran Constell. of Aquila
time to reach destination ≈ 2 million years ≈ 4 million years
standards,2 the use of accelerometers will shed no lighton what is the true nature of the observed anomaly.
A comprehensive test of the anomaly requires an es-cape hyperbolic trajectory,2,9,11 which makes a numberof advanced missions (such as LISA, the Space Test ofEquivalence Principle, and LISA Pathfinder) less able totest properties of the detected anomalous acceleration.Although these missions all have excellent scientific goals
and technologies, they will be in a less advantageous po-sition to conduct a precise test of the detected anomalybecause of their orbits. These analyses of the capabili-ties of other spacecraft currently in operation or in designlead to the conclusion that none could perform an inde-pendent verification of the anomaly and that a dedicatedtest is needed.11–14 Because the Pioneer anomaly has re-mained unexplained, interest in it has grown.13–15 Many

3
TABLE II: Position of Pioneer 10 on 1 January 2005 (datataken from the Jet Propulsion Laboratory’s Horizons system<http://ssd.jpl.nasa.gov/horizons.html>).
Distance from Sun 87.06 AUPosition (lat., long.) (3.0, 78.0)
Speed relative to the Sun 12.24 km/s
Distance from Earth 13.14 × 10⁹ kmRound-Trip Light Time ≈ 24 hr 21 min
TABLE III: Orbital parameters for Pioneers 10 and 11 atepoch 1 January 1987, 01:00:00 UTC. The semi-major axis isa, e is the eccentricity, I is the inclination, Ω is the longitude ofthe ascending node, ω is the argument of the perihelion, M0 isthe mean anomaly, f0 is the true anomaly at epoch, and r0 isthe heliocentric radius at the epoch. The direction cosines ofthe spacecraft position for the axes used are (α, β, γ). Thesedirection cosines and angles are with respect to the meanequator and equinox of J2000. The ecliptic longitude ℓ0 and
latitude b0 are also listed for an obliquity of 2326′
21.′′
4119.The numbers in parentheses denote realistic standard errorsin the last digits.
Parameter Pioneer 10 Pioneer 11a [km] −1033394633(4) −1218489295(133)
e 1.733593601(88) 2.147933251(282)
I [deg] 26.2488696(24) 9.4685573(140)
Ω [deg] −3.3757430(256) 35.5703012(799)
ω [deg] −38.1163776(231) −221.2840619(773)
M0 [deg] 259.2519477(12) 109.8717438(231)
f0 [deg] 112.1548376(3) 81.5877236(50)
r0 [km] 5985144906(22) 3350363070(598)
α 0.3252905546(4) −0.2491819783(41)
β 0.8446147582(66) −0.9625930916(22)
γ 0.4252199023(133) −0.1064090300(223)
ℓ0 [deg] 70.98784378(2) −105.06917250(31)
b0 [deg] 3.10485024(85) 16.57492890(127)
novel ideas have been proposed to explain the anomaly,such as a modification of general relativity,16–18 a changein the properties of light,19 or a drag from dark matter.20
So far, none has been able to unambiguously explain theanomaly.
The aim of the following problems is to excite and en-gage students and to show them by example how researchreally works. As a byproduct we hope to demonstratethat they can take part and understand.
In Sec. II we begin with a few calculations that aredesigned to provide intuition into the dynamics of theproblem. Then we concentrate on the error analysis thatdemonstrated the existence of the anomaly in the data.In Sec. III we will consider possible sources of errors inthe measurement of the Pioneer anomalous accelerationthat have origins external to the spacecraft. Section IVwill consider likely sources of errors that originate on-board of the spacecraft. We will discuss the anticipated
effect of computational errors in Sec. V and summarizethe various contributions in Sec. VI. In Appendix A wewill discuss the Allan deviation – a quantity useful inevaluating the stability of the reference frequency stan-dards used for spacecraft navigation.
II. EFFECT OF THE ANOMALY ON THE
PIONEERS’ TRAJECTORIES
For these problems we can use the approximation ofignoring the angular momentum in the hyperbolic orbits,and treat the velocities as radial.
Problem 2.1. Given the values of the orbital param-eters of Pioneer 10 on 1 January 2005 (distance r0 andvelocity v0) in Table II, what would be the final velocityof Pioneer 10 assuming that there is no anomaly?
Solution 2.1. The terminal escape velocity can becalculated from conservation of energy:
v∞ =√
v20 − 2GM⊙/r0 = 11.38 km/s. (1)
Problem 2.2. Assume that the anomaly continuesand is a constant. At what distance from the Sun wouldthe acceleration of the anomaly be equal to that of grav-ity?
Solution 2.2. We equate the anomalous and Newto-nian gravitational forces and find
d =√
GM⊙/aP ≈ 2, 600 AU. (2)
Problem 2.3. Assume the anomaly is due to a phys-ical force. The time interval over which the Pioneer 10data was analyzed was 11.5 years (1987 to 1998.5). Be-cause of the anomaly, what is the approximate shortfallin distance which Pioneer 10 traveled during this time?
Solution 2.3. Simple mechanics yields
∆d =1
2aP t2 ≈ 57, 500 km. (3)
Problem 2.4. If the anomaly were to continue as aconstant out to deep space and be due to a force, how farwould Pioneer 10 travel before it reaches zero velocity andstarts to fall back in to the Sun? When will the Pioneerreach zero velocity?
Solution 2.4. As seen in Problem 2.1, the gravi-tational potential energy in deep space due to the Sunis small compared to the kinetic energy of the Pioneer.Therefore, we can ignore it compared to the kinetic en-ergy needed to be turned into potential energy. (Thisapproximation slightly overestimates the time and dis-tance.) If we use the data from Table II, we can find thetime by solving
vf = 0 = v0 − aP t. (4)
The solution is t = 1.40 × 10¹³ s = 445, 000yr. The dis-tance traveled would be given by
D = r0 +v0t−1
2aP t2 ≈ 573, 300 AU = 9 light years. (5)

4
FIG. 2: Drawing of the Pioneer spacecraft.
This distance would be well on the Pioneer 10’s way toAldebaran (see Table I). Because this distance is verylarge compared to r0 = 87.06AU, this result verifiesthe validity of the approximation of ignoring the grav-itational potential energy.
Problem 2.5. What if the Pioneer anomaly is causedby heat from the RTGs? As stated, they are poweredby Plutonium 238, which has a half life of 87.74 years.(See Sec. III for more details on the RTGs.) What wouldbe the change in the final escape velocity of the Pioneersfrom this cause?
Solution 2.5. The acceleration would be decreasingexponentially due to the radioactive decay of the 238Pu.Therefore, the change in the velocity would be
∆v = aP
∫ ∞
0
dt exp[−t(ln 2)/(87.74 yr)]
= aP (87.74 yr)/ ln 2 = 3.5 m/s. (6)
III. SOURCES OF ACCELERATION NOISE
EXTERNAL TO THE CRAFT
External forces can contribute to all three vector com-ponents of spacecraft acceleration. However, for a rotat-ing spacecraft, such as the Pioneers, the forces generated
on board produce an averaged contribution only alongthe direction of the axis of rotation. The difference inthe second case is due to the fact that the two non-radialcomponents (those that are effectively perpendicular tothe spacecraft spin) are averaged out by the rotation ofthe spacecraft. Furthermore, non-radial spacecraft accel-erations are difficult to observe by the Doppler technique,which measures the velocity along the Earth-spacecraftline of sight. Although we could in principle set up com-plicated models to predict effects due to all or each of thesources of navigational error, often the uncertainty of themodels is too large to make them useful, despite the sig-nificant effort required to use them. A different approachis to accept our ignorance about these non-gravitationalaccelerations and assess to what extent they could con-tribute to spacecraft acceleration over the time scales ofall or part of the missions.
In this section we will discuss possible sources of accel-eration noise originated externally to the spacecraft thatmight significantly affect the navigation of the Pioneers10 and 11. We first consider the forces that affect thespacecraft motion, such as those due to solar-radiationpressure and solar wind pressure. We then discuss theeffects on the propagation of the radio signal that arefrom the solar corona, electromagnetic forces, and the
5
phase stability of the reference atomic clocks.Problem 3.1. There is an exchange of momentum
when solar photons impact the spacecraft and are eitherabsorbed or reflected. The models of this process takeinto account various parts of the spacecraft surface ex-posed to solar radiation, primarily the high-gain antenna,predict an acceleration directed away from the Sun as afunction of the orientation of the spacecraft and its dis-tance to the Sun. The effect of the solar radiation pres-sure depends on the optical properties of the spacecraftsurface (that is, the absorptivities, reflectivities and emis-sivities of various materials used to build the spacecraft),and the effective areas of the spacecraft part. The effectcan be distinguished from the 1/r2 law due to gravitybecause the direction between the Sun and the effectivespacecraft surface varies.
For navigational purposes, we determine the magni-tude of the solar-pressure acceleration at various orien-tations using Doppler data. The following equation pro-vides a good model for analyzing the effect of solar radi-ation pressure on the motion of distant spacecraft. It isincluded by most of the programs used for orbit determi-nation:
asp(r) =κf⊙m c
A cos θ(r)
r2, (7)
where f⊙ = 1367 W/m2(AU)2 is the effective Stefan-Boltzmann temperature or solar radiation constant at1AU from the Sun, A is the effective area of the craft asseen by the Sun, and c is the speed of light. The angleθ is the angle between the axis of the antenna and thedirection of the Sun, m is the mass of the spacecraft, andr is the distance from the Sun to the spacecraft in AU.
For the Pioneers the effective area of the spacecraft,A, can be taken to be the antenna dish of radius 1.37m.(See Fig. 2 for more information.) The quantity m is themass of the Pioneers when half of the hydrazine thrusterfuel is gone (241 kg). Finally, κ in Eq. (7) is the effectiveabsorption/reflection coefficient of the spacecraft surface,which for Pioneer 10 was measured to be κ = 1.71. Asimilar value was obtained for Pioneer 11.
Estimate the systematic error from solar-radiationpressure on the Pioneer 10 spacecraft over the intervalfrom 40 to 70.5AU, and for Pioneer 11 from 22.4 to31.7AU.
Solution 3.1. With the help of Eq. (7) we can esti-mate that when the craft reached 10AU, the solar radi-ation acceleration was 18.9 × 10⁻⁸ cm/s2 decreasing to0.39 × 10−8 cm/s2 for 70AU. Because this contributionfalls off as r−2, it can bias the Doppler determinationof a constant acceleration. By taking the average of ther−2 acceleration curves over the Pioneer distance, we canestimate the error in the acceleration of the spacecraftdue to solar-radiation pressure. This error, in units of10−8 cm/s2, is 0.001 for Pioneer 10 over the interval from40 to 70.5AU, and 0.006 for Pioneer 11 over the intervalfrom 22.4 to 31.7AU.
Problem 3.2. Estimate the effect of the solar wind
on the Pioneer spacecraft. How significant is it to theaccuracy of the Pioneers’ navigation?
Solution 3.2. The acceleration caused by the solarwind has the same form as Eq. (7), with f⊙/c replacedby mpv
2n, where mp is the mass of proton, n ≈ 5 cm−3
is the proton density at 1AU, and v ≈ 400km/s is thespeed of the wind. Thus,
σsw(r) =κ mpv
2 n
m
A cos θ(r)
r2
≈ 4.4 × 10⁻¹¹(20 AU
r
)2
cm/s2. (8)
We will use the notation σ to denote accelerations thatcontribute only to the error in determining the magnitudeof the anomaly.
Because the density of the solar wind can change byas much as 100%, the exact acceleration is unpredictable.Even if we make the conservative assumption that the so-lar wind contributes only 100 times less force than solarradiation, its smaller contribution is completely negligi-ble.
Problem 3.3. Radio observations in the solar systemare affected by the electron density in the outer solarcorona. Both the electron density and density gradientin the solar atmosphere influence the propagation of radiowaves through this medium. Thus, the Pioneers’ Dopplerradio-observations were affected by the electron densityin the interplanetary medium and outer solar corona. Inparticular, the one way time delay associated with a planewave passing through the solar corona is obtained by in-tegrating the group velocity along the ray’s path, ℓ:
∆t = − 1
2c ncrit(ν)
∫ SC
⊕
dℓne(t, r), (9)
ncrit(ν) = 1.240× 10⁴( ν
1 MHz
)2
cm−3, (10)
where ne(t, r) is the free electron density in the solarplasma, and ncrit(ν) is the critical plasma density for theradio carrier frequency ν.
We see that to account for the plasma contribution,we should know the electron density along the path. Weusually write the electron density, ne, as a static, steady-state part, ne(r), plus a fluctuation δne(t, r):
ne(t, r) = ne(r) + δne(t, r). (11)
The physical properties of the second term are diffi-cult to quantify. But its effect on Doppler observablesand, therefore, on our results is small. On the con-trary, the steady-state corona behavior is reasonably wellknown and several plasma models can be found in theliterature.2,21–24
To study the effect of a systematic error from propaga-tion of the Pioneer carrier wave through the solar plasma,we adopted the following model for the electron density
6
profile,
ne(t, r) = A(R⊙
r
)2
+
+ B(R⊙
r
)2.7
e−[ φ
φ0]2 + C
(R⊙
r
)6
, (12)
where r is the heliocentric distance to the immediate raytrajectory and φ is the helio-latitude normalized by thereference latitude of φ0 = 10. The parameters r andφ are determined from the signal propagation trajectory.The parameters A, B, C describe the solar electron den-sity. (They are commonly given in cm−3.)
Define ∆d = c∆t to be the delay of radio signals dueto the solar corona contribution and use Eqs. (9)–(12) toderive an analytical expression for this quantity.
Solution 3.3. The substitution of Eq. (12) intoEq. (9) results in the following steady-state solar coronacontribution to the earth-spacecraft range model thatwas used in the Pioneer analysis:2
∆d = −(ν0
ν
)2
η
[
A(R⊙
ρ
)
F +
+ B(R⊙
ρ
)1.7
e−[ φ
φ0]2
+ C(R⊙
ρ
)5]
. (13)
Here η = R⊙/2 ncrit(ν0) is the units conversion factorfrom cm−3 to meters, ν0 is the reference frequency (ν0 =2295MHz for Pioneer 10), ν is the actual frequency of theradio wave, and ρ is the impact parameter with respectto the Sun. The function F in Eq. (13) is a light-timecorrection factor that was obtained during integration ofEqs. (9) and (12) as:2
F = F (ρ, rT , rE) =1
π
arctan[
√
r2T − ρ2
ρ
]
+
+ arctan[
√
r2E − ρ2
ρ
]
, (14)
where rT and rE are the heliocentric radial distances tothe target spacecraft and to the Earth, respectively.
Problem 3.4. The analyses of the Pioneer anomaly2
took the values for A, B, and C obtained from the Cassinimission on its way to Saturn and used them as inputsfor orbit determination purposes: (A, B, C) η = (6.0 ×10³, 2.0 × 10⁴, 0.6 × 10⁶), all in meters.
Given Eq. (13) derived in Problem 3.3 and the valuesof the parameters A, B, and C, estimate the accelera-tion error due to the effect of the solar corona on thepropagation of radio waves between the Earth and thespacecraft.
Solution 3.4. The correction to the Doppler fre-quency shift is obtained from Eq. (13) by simple timedifferentiation. (The impact parameter depends on timeas ρ = ρ(t) and may be expressed in terms of the rela-tive velocity of the spacecraft with respect to the Earth,v ≈ 30 km/s). Use Eq. (13) for the steady-state solarcorona effect on the radio-wave propagation through the
solar plasma. The effect of the solar corona is expectedto be small on the Doppler frequency shift – our mainobservable. The time-averaged effect of the corona onthe propagation of the Pioneers’ radio-signals is found tobe small, of order
σcorona = ±0.02× 10⁻⁸ cm/s2. (15)
This small result is expected from the fact that most ofthe data used for the Pioneer analysis were taken withlarge Sun-Earth-spacecraft angles.
Problem 3.5. The possibility that the Pioneer space-craft can hold a charge and be deflected in its trajec-tory by Lorentz forces was a concern due to the largemagnetic field strengths near Jupiter and Saturn (seeFigs. 2 and 1).25 The magnetic field strength in the outersolar system is ≤ 10−5 Gauss, which is about a factorof 105 times smaller than the magnetic field strengthsmeasured by the Pioneers at their nearest approachesto Jupiter: 0.185Gauss for Pioneer 10 and 1.135Gaussfor Pioneer 11. Furthermore, data from the Pioneer 10plasma analyzer can be interpreted as placing an upperbound of 0.1µC on the positive charge during the Jupiterencounter.26
Estimate the upper limit of the contribution of the elec-tromagnetic force on the motion of the Pioneer spacecraftin the outer solar system.
Solution 3.5. We use the standard relation, F = qv×B, and find that the greatest force would be on Pioneer 11during its closest approach, < 20×10−8 cm/s2. However,once the spacecraft reached the interplanetary medium,this force decreased to
σLorentz . 2 × 10⁻¹² cm/s2, (16)
which is negligible.Problem 3.6. Long-term frequency stability tests are
conducted with the exciter/transmitter subsystems andthe Deep Space Network’s (DSN)27 radio-science open-loop subsystem. An uplink signal generated by the ex-citer is converted at the spacecraft antenna to a downlinkfrequency. The downlink signal is then passed throughthe RF-IF down-converter present at the DSN antennaand into the radio science receiver chain. This tech-nique allows the processes to be synchronized in the DSNcomplex based on the frequency standards whose Allandeviations are the order of σy ∼ 10−14–10−15 for inte-gration times in the range of 10 s to 103 s. (The Allandeviation is the variance in the relative frequency, de-fined as y = ∆ν/ν, or σy ∼ σν/ν. See the discussionin Appendix A.) For the S-band frequencies of the Pi-oneers, the corresponding variances are 1.3 × 10⁻¹² and1.0 × 10−12, respectively, for a 103 s Doppler integrationtime.
The influence of the clock stability on the detectedacceleration, aP , can be estimated from the reportedvariances for the clocks, σy. The standard single mea-surement error on acceleration is derived from the timederivative of the Doppler frequency data as (cσy)/τ ,
7
where the variance, σy, is calculated for 1000 s Dopplerintegration time and τ is the signal averaging time. Thisrelation provides a good rule of thumb when the Dopplerpower spectral density function obeys a 1/f flicker noiselaw, which is approximately the case when plasma noisedominates the overall error in the Doppler observable.
Assume a worst case scenario, where only one clock wasused for the entire 11.5 years of data. Estimate the in-fluence of that one clock on the reported accuracy of thedetected anomaly, aP . Combining σy = ∆ν/ν0, the frac-tional Doppler frequency shift for a reference frequency ofν0 ≈ 2.295GHz, with the estimate for the variance, σy =1.3×10⁻¹², yields the upper limit for the frequency uncer-tainty introduced in a single measurement by the insta-bilities in the atomic clock: σν = ν0σy = 2.98 × 10⁻³ Hzfor a 103 Doppler integration time.
Obtain an estimate for the total effect of phase and fre-quency stability of clocks to the Pioneer anomaly value.How significant is this effect?
Solution 3.6. To obtain an estimate for the totaleffect, recall that the Doppler observation technique isessentially a continuous count of the total number ofcomplete frequency cycles during the observational time.The Pioneer measurements were made with duration≈ 103 s. Therefore, within a year we could have as manyas N ≈ 3, 150 independent single measurements of theclock. The values for σy and N yield an upper limit forthe contribution of the atomic clock instability on the fre-quency drift: σclock = σν/
√N ≈ 5.3 × 10⁻⁵ Hz/yr. The
observed aP corresponds to a frequency drift of about0.2Hz/yr, which means that the error in aP is about
σfreq = 0.0003× 10⁻⁸ cm/s2, (17)
which is negligible.
IV. ON-BOARD SOURCES OF
ACCELERATION NOISE
In this section forces generated by on-board spacecraftsystems that could contribute to the constant acceler-ation, aP , are considered. The on-board mechanismsdiscussed are the radio beam reaction force, the RTGheat reflecting off the spacecraft, the differential emissiv-ity of the RTGs, the expelled Helium produced withinthe RTG, the thruster gas leakage, and the difference inexperimental results from the two spacecraft.
Problem 4.1. The Pioneers have a total nominalemitted radio power of 8 W. The power is parametrizedas
Prp =
∫ θmax
0
dθ sin θP(θ), (18)
where P(θ) is the antenna power distribution. The radi-ated power is kept constant in time, independent of thecoverage from ground stations. That is, the radio trans-mitter is always on, even when signals are not receivedby a ground station.
The recoil from this emitted radiation produces an ac-celeration bias,29 brp, on the spacecraft away from theEarth of
brp =β Prp
mc, (19)
where m is taken to be the Pioneer mass when half thefuel is gone, 241kg, and β is the fractional component ofthe radiation momentum that is in the direction oppositeto aP :
β =1
Prp
∫ θmax
0
dθ sin θ cos θP(θ). (20)
The properties of the Pioneer downlink antenna pat-terns are well known. The gain is given as (33.3±0.4)dBat zero (peak) degrees. The intensity is down by a factorof 2 (−3 dB) at 1.8. It is down a factor of 10 (−10 dB) at2.7 and down by a factor of 100 (−20dB) at 3.75. (Thefirst diffraction minimum is at a little over 4.) There-fore, the pattern is a very good conical beam.
Estimate the effect of the recoil force due to the emit-ted radio-power on the craft. What is the uncertainty inthis estimation?
Solution 4.1. Because cos 3.75 = 0.9978, we can takeβ = (0.99 ± 0.01), which yields brp = 1.10. To estimatethe uncertainty, we take the error for the nominal 8 Wpower to be given by the 0.4 dB antenna error (0.10),and obtain
arp = brp ± σrp = (1.10 ± 0.10)× 10−8 cm/s2. (21)
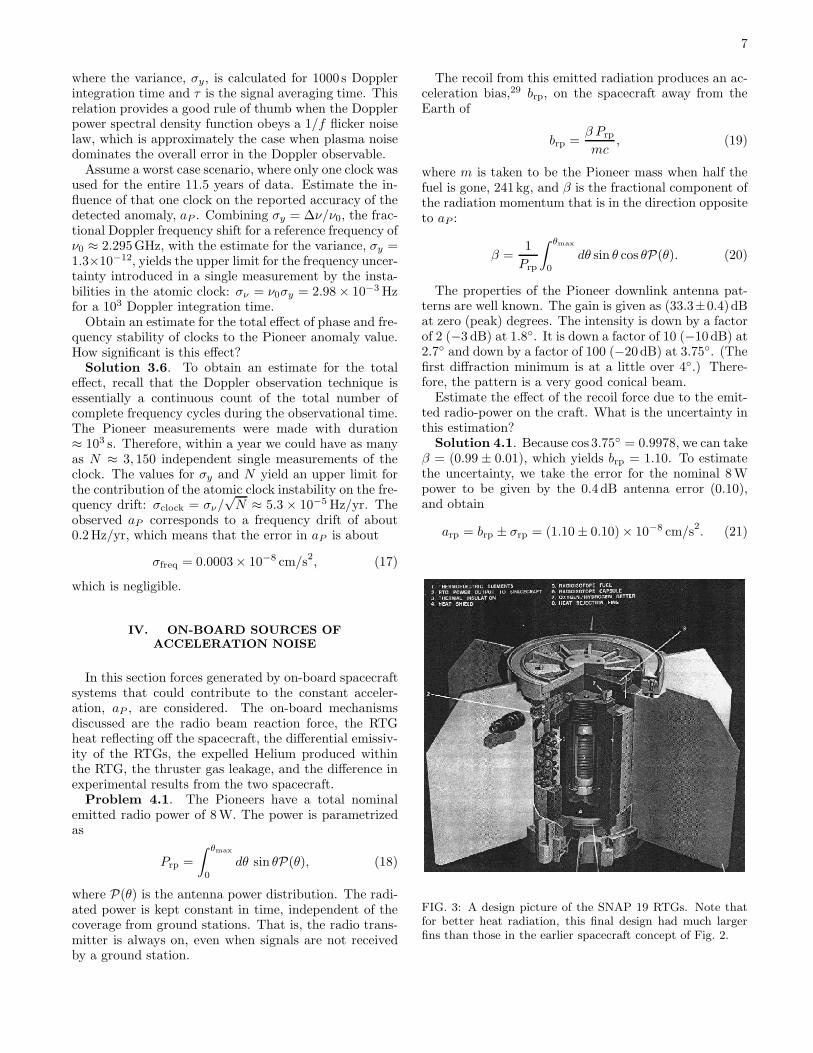
FIG. 3: A design picture of the SNAP 19 RTGs. Note thatfor better heat radiation, this final design had much largerfins than those in the earlier spacecraft concept of Fig. 2.
8
TABLE IV: Thermal system and on-board power for Pioneers 10 and 11. The core of the system is four SNAP-19 RTGs (SNAPstands for Space Nuclear Auxiliary Power). These RTGs are fueled with Plutonium 238 that undergoes nuclear α-decay via
94Pu238 → 92U234 + 2He4, with a half life of 87.74 yr. The efficiency of the relevant heat-to-electric power conversion is about
5 to 6%.
Power available:⊲ before launch electric total 165 W (by 2001 ≈ 61W)⊲ needs 100 W to power all systems (∈ 24.3 W science instruments)
Heat provided:⊲ before launch thermal fuel total 2580 W (by 2001 ≈ 2050 W)⊲ electric heaters; 12 one-W RHUs⊲ heat from the instruments (dissipation of 70 to 120 W)
Excess power/heat: if electric power was > 100 W ⇒
⊲ thermally radiated into space by a shunt-resistor radiator, or⊲ charge a battery in the equipment compartment
Thermal control: to keep temperature within (0–90) F⊲ thermo-responsive louvers: completely shut/fully open for 40F/85 F⊲ insulation: multi-layered aluminized mylar and kapton blankets
Problem 4.2. It has been argued that the anomalousacceleration is due to anisotropic heat reflection off of theback of the spacecraft high-gain antennas, the heat com-ing from the RTGs. Before launch, the four RTGs hada total thermal fuel inventory of 2580W (≈ 2050W in2001). They produced a total electrical power of 165W(≈ 61W in 2001). (In Table IV a description of the over-all power system is given.) Thus, by 2002 approximatelly2000W of RTG heat still had to be dissipated. Becauseonly ≈ 63W of directed power could have explained theanomaly, in principle, there was enough power to explainthe anomaly.
The main bodies of the RTGs are cylinders and aregrouped in two packages of two. Each package has twocylinders, end to end, extending away from the antenna.Each RTG has six fins separated by equal angles of 60
that go radially out from the cylinder. The approximatedimensions for the RTGs are: the cylinder and fin lengthsare 28.2 and 26.0 cm, the radius of the central RTG cylin-der is 8.32 cm, and the RTG fin width as measured fromthe surface of the cylinder to the outer fin tip is 17.0 cm(see Fig. 3).
The RTGs are located at the end of booms, and rotateabout the spacecraft in a plane that contains the approx-imate base of the antenna. From the closest axial centerpoint of the RTGs, the antenna is seen nearly “edge on”(the longitudinal angular width is 24.5). The total solidangle subtended is ∼ 1–2% of 4π steradians. A moredetailed calculation yields a value of 1.5%.
Estimate the contribution of the RTG heat reflectingoff the spacecraft to the Pioneer anomaly. Can you ex-plain the observed anomaly with this mechanism? Usethe spacecraft geometry and the resultant RTG radiationpattern.
Solution 4.2. There are two reasons that precludethis mechanism. One is the spacecraft geometry. Even ifwe take the higher bound of 2% of 4π steradians solid an-gle as the fraction of solid angle covered by the antenna,
the equivalent fraction of the RTG heat could provide atmost ≈ 40W. The second reason is the RTGs’ radiationpattern. Our estimate was based on the assumption thatthe RTGs are spherical black bodies, which they are not.
In fact, the fins are “edge on” to the antenna (the finspoint perpendicular to the cylinder axes). The largestopening angle of the fins is seen only by the narrow angleparts of the antenna’s outer edges. If we ignore theseedge effects, only ≈ 2.5% of the surface area of the RTGsis facing the antenna, which is a factor of 10 less thanthat obtained from integrating the directional intensity
from a hemisphere: (∫ hemi
dΩ cos θ)/(4π) = 1/4. Thus,we have only 4W of directed power.
The force from 4W of directed power suggests a sys-tematic bias of ≈ 0.55 × 10⁻⁸ cm/s2. If we add an un-certainty of the same size, we obtain a contribution fromheat reflection of
ahr = (−0.55 ± 0.55)× 10−8 cm/s2. (22)
If this mechanism were the cause, ultimately an un-ambiguous decrease in the size of aP should be observed,because the RTGs’ radioactively produced radiant heatis decreasing. As we noted, the heat produced is nowabout 80% of the original magnitude. In fact, we wouldexpect a decrease of about 0.75 × 10⁻⁸ cm/s2 in aP overthe 11.5 year Pioneer 10 data interval if this mechanismwere the origin of aP .
Problem 4.3. Another suggestion related to theRTGs is the following: During the early parts of themissions, there might have been a differential change ofthe radiant emissivity of the solar-pointing sides of theRTGs with respect to the deep-space facing sides. Notethat, especially closer in the Sun, the inner sides weresubjected to the solar wind. On the other hand, theouter sides were sweeping through the solar system dustcloud. These two processes could result in different lev-els of degradation of the optical surfaces of the RTGs. Inturn this degradation could result in asymmetric patterns

9
of heat radiation away from the RTGs in the more/aft di-rections along the spin axis. Therefore, it can be arguedthat such an anisotropy may have caused the anomaly.
The six fins of each RTG, designed to provide the bulkof the heat rejection capacity, are fabricated of mag-nesium alloy.2 The metal is coated with two to threemils of zirconia in a sodium silicate binder to providea high emissivity (≈ 0.9) and low absorptivity (≈ 0.2)(see Fig. 3).
Estimate the possible difference in the fore-and-aftemissivities of the RTGs needed to support this mech-anism. Can this mechanism explain the observedanomaly? Discuss the significance of radioactive decayfor this mechanism.
Solution 4.3. Depending on how symmetrically fore-and-aft they radiated, the relative fore-and-aft emissivityof the alloy would have had to have changed by ≈ 10% toaccount for aP . Given our knowledge of the solar windand the interplanetary dust, this amount of a radiantchange would be difficult to explain, even if it had theright sign.
To obtain a reasonable estimate of the uncertainty,consider if one side (fore or aft) of the RTGs has itsemissivity changed by only 1% with respect to the otherside. In a simple cylindrical model of the RTGs, with2000W power (only radial emission is assumed with noloss out of the sides), the ratio of the power emitted bythe two sides would be 995/1005 = 0.99, or a differen-tial emission between the half cylinders of 10W. There-fore, the fore/aft asymmetry toward the normal wouldbe 10 W × 1
π
∫ π
0dφ sin φ ≈ 6.37W.
A more sophisticated model of the fin structure startsoff from ground zero to determine if we still obtain aboutthe order of magnitude.2 Indeed we do, 6.12W, which isthe value we use in the following. (We refer the readerto Ref. 2 for this discussion, because the basic physicsalready has been discussed.)
If we take 6.12W as the uncertainty from the differ-ential emissivity of the RTGs, we obtain an accelerationuncertainty of
σde = 0.85 × 10⁻⁸ cm/s2. (23)
Note that 10 σde almost equals our final result for aP
(see Section VI). This correspondence is the origin of ourprevious statement that ≈ 10% differential emissivity (inthe correct direction) would be needed to explain aP .
Finally, consider the significance of radioactive decayfor this mechanism. The formal statistical error of thedetermination (before considering experimental system-atics) was small2 (see Sec. V). An example is a specificone-day “batch-sequential filtering”28 value for aP , av-eraged over the entire 11.5 year interval. This value wasaP = (7.77±0.16)×10−8 cm/s2, where a batch-sequentialerror tends to be large. From radioactive decay, the valueof aP should have decreased by 0.75 × 10⁻⁸ cm/s2 over11.5 years, which is five times the large batch sequentialvariance. Even more stringently, this bound is good forall radioactive heat sources. So, what if we were to argue
that emissivity changes occurring before 1987 were thecause of the Pioneer effect? There still should have beena decrease in aP with time since then, which has not beenobserved.
Problem 4.4. Another possible on-board systematicerror is from the expulsion of the He being created in theRTGs from the α-decay of 238Pu.
The Pioneer RTGs were designed so that the He pres-sure is not totally contained within the Pioneer heatsource over the life of the RTGs. Instead, the Pioneerheat source contains a pressure relief device that allowsthe generated He to vent out of the heat source andinto the thermoelectric converter. The thermoelectricconverter housing-to-power output receptacle interface issealed with a viton O-ring. The O-ring allows the heliumgas within the converter to be released by permeationinto the space environment throughout the mission lifeof the Pioneer RTGs.
The actual fuel (see Fig. 3) is formed into a stack ofdisks within a container, each disk having a height of0.212′′ and a diameter of 2.145′′. With 18 disks in eachRTG and four RTGs per mission, the total volume of fuelis about 904 cm3. The fuel is a plutonium moly cermetand the amount of 238Pu in this fuel is about 5.8 kg. Witha half life of 87.74 yr, the rate of He production (fromplutonium α-decay) is about 0.77 g/yr, assuming it allleaves the cermet and goes into the RTG chamber. Tomake this mechanism work, He leakage from the RTGsmust be preferentially directed away from the Sun witha velocity large enough to cause the acceleration.
Can this mechanism explain the Pioneer anomaly?What is the largest effect possible with this mechanism?What is the uncertainty?
Solution 4.4. The operational temperature on theRTG surface at 433K implies a helium velocity of1.22 km/s. We use this value in the rocket equation,
a(t) = −v(t)d
dt[lnM(t)]. (24)
We assume that the Pioneer mass corresponds to half ofthe fuel and that the gas is all unidirected and find amaximum bound on the possible acceleration of 1.16 ×10⁻⁸ cm/s2. Thus, we can rule out helium permeatingthrough the O-rings as the cause of aP .
If we assume a single elastic reflection, we can esti-mate the acceleration bias29 in the direction away fromthe Sun. This estimate is (3/4) sin 30 times the averageof the heat momentum component parallel to the short-est distance to the RTG fin. By using this geometric in-formation, we find the bias would be 0.31 × 10⁻⁸ cm/s2.This bias effectively increases the value of the solution foraP , which is too optimistic given all the complications ofthe real system. Therefore, we can take the systematicexpulsion to be
aHe = (0.15 ± 0.16) × 10−8 cm/s2. (25)
Problem 4.5. The effect of propulsive mass expul-sion due to gas leakage has to be assessed. Although
10
this effect is largely unpredictable, many spacecraft haveexperienced gas leaks producing accelerations on the or-der of 10−7 cm/s2. Gas leaks generally behave differentlyafter each maneuver. The leakage often decreases withtime and becomes negligible.
Gas leaks can originate from Pioneer’s propulsion sys-tem, which is used for mid-course trajectory maneu-vers, for spinning up or down the spacecraft, and fororientation of the spinning spacecraft. The Pioneersare equipped with three pairs of hydrazine thrusters,which are mounted on the circumference of the Earth-pointing high gain antenna. Each pair of thrusters formsa thruster cluster assembly with two nozzles aligned op-posite to each other. For attitude control, two pairs ofthrusters can be fired forward or aft and are used to pre-cess the spinning antenna. The other pair of thrustersis aligned parallel to the rim of the antenna with noz-zles oriented in co- and contra-rotation directions forspin/despin maneuvers.
During both observation intervals for the two Pio-neers, there were no trajectory or spin/despin maneu-vers. Thus, in this analysis we are mainly concernedwith precession (that is, orientation or attitude control)maneuvers only. Because the valve seals in the thrusterscan never be perfect, we ask if the leakages through thehydrazine thrusters could be the cause of the anomalousacceleration, aP .
Consider the possible action of gas leaks originatingfrom the spin/despin thruster cluster assembly. Eachnozzle from this pair of thrusters is subject to a certainamount of gas leakage. But only a differential leakagefrom the two nozzles would produce an observable effect,causing the spacecraft to either spin down or up.
To obtain a gas leak uncertainty (and we emphasize un-certainty rather than “error” because there is no other ev-idence), we ask, “How large a differential force is neededto cause the spin down or spin up effects that are ob-served?” The answer depends on the moment of inertiaabout the spin axis, Iz ≈ 588.3kg m2, the antenna ra-dius, R = 1.37m, and the observed spin down rates overthree time intervals. In Ref. 2 the final effect was deter-mined at the end by considering the spin-downs over thethree time periods to be manifestations of errors that areuncorrelated and are normally distributed around zeromean. For simplicity, we include here the effect of thisanalysis in terms of an overall effective spin-down rate ofθ = −0.0067 rpm/yr.
Estimate the uncertainty in the value for the Pioneeranomaly from the possibility of undetected gas leaks.
Solution 4.5. If we use the information in Problem4.5 and take the antenna radius, R, as the lever arm, wecan calculate the differential force needed to torque thespin-rate change:
Fθ =Izθ
R= 0.95 × 10⁻³ dyn. (26)
It is possible that a similar mechanism of undetectedgas leakage could be responsible for the net differential
force acting in the direction along the line of sight. Inother words, what if there were some undetected gas leak-age from the thrusters oriented along the spin axis of thespacecraft that is causing aP ? How large would this leak-age have to be? A force of
FaP= maP = 21.11 × 10⁻³ dyn (27)
(m = 241kg) would be needed to produce our final unbi-ased value of aP . Given the small amount of information,we conservatively take as our gas leak uncertainties theacceleration values that would be produced by differen-tial forces equal to
Fgl ≈ ±√
2Fθ = ±1.35 × 10⁻³ dyn. (28)
The argument for the result obtained in Eq. (28) is thatwe are accounting for the differential leakages from thetwo pairs of thrusters with their nozzles oriented alongthe line of sight direction. Equation (28) directly trans-lates into the acceleration errors introduced by the leak-age during the interval of Pioneer 10 data,
σgl = ±Fgl/m = ±0.56 × 10⁻⁸ cm/s2. (29)
At this point, we must conclude that the gas leak mech-anism for explaining the anomalous acceleration is veryunlikely, because it is difficult to understand why it wouldaffect Pioneers 10 and 11 by the same amount. We alsoexpect a gas leak would contribute to the anomalous ac-celeration, aP , as a stochastic variable obeying a Poissondistribution. Instead, analyses of different data sets in-dicate that aP behaves as a constant bias rather than asa random variable.2
Problem 4.6. There are two experimental results forthe Pioneer anomaly from the two spacecraft: 7.84 ×10⁻⁸ cm/s2 (Pioneer 10) and 8.55× 10⁻⁸ cm/s2 (Pioneer11). The first result represents the entire 11.5 year dataperiod for Pioneer 10; Pioneer 11’s result represents a3.75 year data period.
The difference between the two craft could be due todifferent gas leakage. But it also could be due to heatemitted from the RTGs. In particular, the two sets ofRTGs have had different histories and so might have dif-ferent emissivities. Pioneer 11 spent more time in theinner solar system (absorbing radiation). Pioneer 10 hasswept out more dust in deep space. Further, Pioneer 11experienced about twice as much Jupiter/Saturn radia-tion as Pioneer 10. However, if the Pioneer effect is real,and not due to an extraneous systematic like heat, thesenumbers should be approximately equal.
Estimate the value for the Pioneer anomaly based onthese two independent determinations. What is the un-certainty in this estimation?
Solution 4.6. We can calculate the time-weightedaverage of the experimental results from the two craft:[(11.5)(7.84) + (3.75)(8.55)]/(15.25) = 8.01 in units of10−8 cm/s2. This result implies a bias of b2, craft =0.17 × 10⁻⁸ cm/s2 with respect to the Pioneer 10 exper-imental result aP (exp) (see Eq. (35) below). In addition,

11
we can take this number to be a measure of the uncer-tainty from the separate spacecraft measurements, so theoverall quantitative measure is
a2, craft = b2, craft ± σ2, craft
= (0.17 ± 0.17)× 10−8 cm/s2. (30)
V. SOURCES OF COMPUTATIONAL ERRORS
Given the very large number of observations for thesame spacecraft, the error contribution from observa-tional noise is very small and not a meaningful measure ofuncertainty. It is therefore necessary to consider severalother effects in order to assign realistic errors. The firstconsideration is the statistical and numerical stability ofthe calculations. Then there is the cumulative influenceof all program modeling errors and data editing deci-sions. Besides these factors, there are errors that may beattributed to the specific hardware used to run the orbitdetermination computer codes, together with the algo-rithms and statistical methods used to obtain the solu-tion. These factors have been included in the summaryof the biases and uncertainties given in Table V. Thelargest contributor in this category, and the question wewill discuss here, is the reason for and significance of aperiodic term that appears in the data.
Problem 5.1. In addition to the constant anomalousacceleration term, an annual sinusoid has been reported.2
The peaks of the sinusoid occur when the Earth is exactlyon the opposite side of the Sun from the craft, wherethe Doppler noise is at a maximum. The amplitude ofthis oscillatory term by the end of the data interval was≈ 0.22 × 10⁻⁸ cm/s2. The integral of a sine wave in theacceleration, with angular velocity ω and amplitude a0,yields the following first-order Doppler amplitude, in thefractional frequency change accumulated over the round-trip travel time of the radio-signal:
∆ν
ν=
2a0
cω. (31)
The resulting Doppler amplitude from the sine wave withamplitude of a0 = 0.22 × 10⁻⁸ cm/s2 and annual angu-lar velocity ω = 2 × 10⁻⁷ rad/s is ∆ν/ν = 7.3 × 10⁻¹³.At the Pioneer downlink S-band carrier frequency of≈ 2.29GHz, the corresponding Doppler amplitude is0.002Hz, that is, 0.11mm/s.
A four-parameter, nonlinear, weighted, least-squaresfit to the annual sine wave was found with the amplitudevat = (0.1053 ± 0.0107)mm/s, phase = (−5.3 ± 7.2),angular velocity ωat = (0.0177 ± 0.0001) rad/day, andbias = (0.0720 ± 0.0082)mm/s. Standard data weight-ing procedures2 yield post-fit weighted rms residuals ofσT = 0.1mm/s (the Doppler error averaged over the datainterval T ).
The amplitude, vat, and angular velocity, ωat, of theannual term result in a small acceleration amplitude ofaat = vatωat = (0.215 ± 0.022)× 10−8 cm/s2. The cause
is most likely due to errors in the navigation programs’determinations of the direction of the spacecraft’s orbitalinclination to the ecliptic. Estimate the annual contribu-tion to the error budget for aP .
Solution 5.1. First observe that the standard errorsfor the radial velocity, vr, and acceleration, ar, are es-sentially what would be expected for a linear regression.The caveat is that they are scaled by the root sum ofsquares of the Doppler error and unmodeled sinusoidalerrors, rather than just the Doppler error. Furthermore,because the error is systematic, it is unrealistic to assumethat the errors for vr and ar can be reduced by a factor1/
√N , where N is the number of data points. Instead, if
we average their correlation matrix over the data interval,T , we obtain the estimated systematic error of
σ2ar
=12
T 2σ2
vr=
12
T 2(σ2
T + σ2vat
), (32)
where σT = 0.1mm/s is the Doppler error averaged overT (not the standard error of a single Doppler measure-ment), and σvat
is equal to the amplitude of the unmod-
eled annual sine wave divided by√
2. The resulting rootsum of squares error in the radial velocity determinationis about σvr
= (σ2T + σ2
vat)1/2 = 0.15mm/s for both Pio-
neer 10 and 11. Our values of aP were determined overtime intervals of longer than a year. At the same time,to detect an annual signature in the residuals, we need atleast half of the Earth’s orbit to be complete. Therefore,with T = 1/2 yr, Eq. (32) results in an acceleration errorof
σar=
0.50 mm/s
T= 0.32 × 10⁻⁸ cm/s
2. (33)
This number is assumed to be the systematic error fromthe annual term.
VI. SUMMARY OF ERRORS AND FINAL
RESULT
The tests discussed in the preceding sections haveconsidered various potential sources of systematic er-ror. The results are summarized in Table V. The onlymajor source of uncertainty not discussed here is thenon-isotropic radiative cooling of the spacecraft.2,9 Othermore minor effects are discussed in Ref. 2. Table Vsummarizes the systematic errors affecting the measuredanomalous signal, the “error budget” of the anomaly. Itis useful for evaluating the accuracy of the solution for aP
and for guiding possible future efforts with other space-craft.
Finally, there is the intractable mathematical problemof how to handle combined experimental systematic andcomputational errors. In the end it was decided to treatthem all in a least squares uncorrelated manner.2
Problem 6.1. The first column in Table V gives thebias, bP , and the second gives the uncertainty, ±σP . The

12
TABLE V: Error budget: A summary of biases and uncertainties.
Item Description of error budget constituents Bias Uncertainty10−8 cm/s2 10−8 cm/s2
1. Sources of acceleration noise external to the craft(a) Solar radiation pressure +0.03 ±0.01(b) Solar wind ± < 10−3
(c) Solar corona ±0.02(d) Electromagnetic Lorentz forces ± < 10−4
(e) Phase stability and clocks ± < 0.001
2. On-board sources of acceleration noise(a) Radio beam reaction force +1.10 ±0.10(b) RTG heat reflected off the craft −0.55 ±0.55(c) Differential emissivity of the RTGs ±0.85(d) Non-isotropic radiative cooling of the spacecraft ±0.48(e) Expelled Helium produced within the RTGs +0.15 ±0.16(f) Gas leakage ±0.56(g) Variation between spacecraft determinations +0.17 ±0.17
3. Sources of computational errors(a) Accuracy of consistency/model tests ±0.13(b) Annual term ±0.32(c) Other important effects ±0.04
Estimate of total bias/error +0.90 ±1.33
constituents of the error budget are listed in three cate-gories: systematic errors generated external to the space-craft; on-board generated systematic errors, and compu-tational errors. Our final result will be an average
aP = aP (exp) + bP ± σP , (34)
where
aP (exp) = (7.84 ± 0.01)× 10−8 cm/s2
(35)
is our formal solution for the Pioneer anomaly that wasobtained with the available data set.2
Discuss the contributions of various effects to the totalerror budget and determine the final value for the Pioneeranomaly, aP .
Solution 6.1. The least significant factors of our errorbudget are in the first group of effects, those external tothe spacecraft. From Table V we see that some are nearthe limit of contributing, and in total they are insignifi-cant.
The on-board generated systematics are the largestcontributors to the total. All the important constituentsare listed in the second group of effects in Table V.Among these effects, the radio beam reaction force pro-duces the largest bias, 1.10 × 10⁻⁸ cm/s2, and makesthe Pioneer effect larger. The largest bias/uncertaintyis from RTG heat reflecting off the spacecraft. The effectis as large as (−0.55 ± 0.55) × 10−8 cm/s2. Large un-certainties also come from differential emissivity of the
RTGs, radiative cooling, and gas leaks, ±0.85, ±0.48,and ±0.56, respectively, ×10−8 cm/s2.
The computational errors are listed in the third groupof Table V. We obtain bP ± σP = 0.90× 10⁻⁸ cm/s2 andσP = 1.33 × 10⁻⁸ cm/s2. Therefore, from Eq. (34) thefinal value for aP is
aP = (8.74 ± 1.33)× 10−8 cm/s2. (36)
The effect is clearly significant and remains to be ex-plained.
Acknowledgments
The first grateful acknowledgment must go to Cather-ine Mignard of the Observatoire de Nice. She not onlyinquired if a problem set could be written for the stu-dents at the University of Nice, she also made valuablecomments as the work progressed. We also again expressour gratitude to our many colleagues who, over the years,have either collaborated with us on this problem set orgiven of their wisdom. In this instance we specificallythank Eunice L. Lau, Philip A. Laing, Russell Anania,Michael Makoid, Jacques Colin, and Francois Tanguay.The work of SGT and JDA was carried out at the JetPropulsion Laboratory, California Institute of Technol-ogy under a contract with the National Aeronautics andSpace Administration. MMN acknowledges support bythe U.S. Department of Energy.

13
APPENDIX A: ALLAN DEVIATION
To achieve the highest accuracy, the Doppler frequencyshift of the carrier wave is referenced to ground-basedatomic frequency standards. The observable is the frac-tional frequency shift of the stable and coherent two-wayradio signal (Earth-spacecraft-Earth)
y(t) =νr(t) − νt
νt=
2
c
dL
dt, (A1)
where νr and νt are, respectively, the transmitted andreceived frequencies, t is the receiving time, and 2L isthe overall optical distance (including diffraction effects)traversed by the photon in both directions.
The received signal is compared with the expectedmeasurement noise in y, given by Eq. (A1). The qual-ity of such a measurement is characterized by its Allan
deviation, which defined as
σy(τ) =
√
1
2〈(yi+1(τ) − yi(τ))2〉, (A2)
where yi = 1τ
∫ ti+τ
tiy(t)dt. The Allan deviation is the
most widely used figure of merit for the characterizationof frequency in this context.
For advanced planetary missions such as Cassini,equipped with multi-frequency links in the X- and Ka-bands, Allan deviations reach the level of σy ≈ 10−14
for averaging times between 103 and 104 s. The Pioneerspacecraft were equipped with S-band Doppler commu-nication systems for which Allan deviations were usuallythe order ofl of 1.3× 10⁻¹² and 1.0× 10⁻¹², respectively,for 103 s Doppler integration times.
∗ Electronic address: [email protected]† Electronic address: [email protected]‡ Electronic address: [email protected] J. D. Anderson, P. A. Laing, E. L. Lau, A. S. Liu, M.
M. Nieto, and S. G. Turyshev, “Indication, from Pioneer10/11, Galileo, and Ulysses data, of an apparent anoma-lous, weak, long-range acceleration,” Phys. Rev. Lett. 81,2858–2861 (1998), gr-qc/9808081.
2 J. D. Anderson, P. A. Laing, E. L. Lau, A. S. Liu, M. M.Nieto and S. G. Turyshev, “Study of the Anomalous Accel-eration of Pioneer 10 and 11,” Phys. Rev. D 65, 082004/1–50 (2002), gr-qc/0104064.
3 To be precise, the data analyzed in Ref. 2 was taken be-tween 3 January 1987 and 22 July 1998 for Pioneer 10(when the craft was 40AU to 70.5 AU distant from theSun), and that from Pioneer 11 was obtained between 5January 1987 and 1 October 1990 (22.4 to 31.7 AU).
4 E. M. Murphy, “Prosaic explanation for the anomalousacceleration seen in distant spacecraft,” Phys. Rev. Lett.83, 1890 (1999), gr-qc/9810015.
5 J. I. Katz, “Comment on ‘Indication, from Pioneer 10/11,Galileo, and Ulysses data, of an apparent anomalous,weak, long-range acceleration’,” Phys. Rev. Lett. 83, 1892(1999), gr-qc/9809070.
6 L. K. Scheffer, “Conventional forces can explain theanomalous acceleration of Pioneer 10,” Phys. Rev. D 67,084021/1–11 (2003), gr-qc/0107092.
7 J. D. Anderson, P. A. Laing, E. L. Lau, A. S. Liu, M. M.Nieto, and S. G. Turyshev, “Anderson et al. reply,” Phys.Rev. Lett. 83, 1891 (1999), gr-qc/9906113.
8 J. D. Anderson, P. A. Laing, E. L. Lau, A. S. Liu, M. M.Nieto, and S. G. Turyshev, “Anderson et al. reply,” Phys.Rev. Lett. 83, 1893 (1999), gr-qc/9906112.
9 J. D. Anderson, E. L. Lau, S. G. Turyshev, P. A. Laing,and M. M. Nieto, “The search for a standard explanationof the Pioneer anomaly,” Mod. Phys. Lett. A 17, 875–885(2002), gr-qc/0107022.
10 C. B. Markwardt, “Independent confirmation of the Pio-neer 10 anomalous acceleration,” gr-qc/0208046.
11 M. M. Nieto and S. G. Turyshev, “Finding the origin of
the Pioneer anomaly,” Class. Quant. Grav. 21, 4005–4023(2004), gr-qc/0308017.
12 J. D. Anderson, S. G. Turyshev, and M. M. Nieto, “Amission to test the Pioneer anomaly,” Int. J. Mod. Phys.D 11, 1545–1551 (2002), gr-qc/0205059.
13 S. G. Turyshev, M. M. Nieto, and J. D. Anderson,“Lessonslearned from the Pioneers 10/11 for a mission to test thePioneer anomaly,” Adv. Space Res., Proc. 35th COSPARScientific Assembly (Paris, 2004), to be published, gr-qc/0409117.
14 M. M. Nieto, S. G. Turyshev, and J. D. Anderson, “ThePioneer anomaly: The data, its meaning, and a futuretest,” in Proceedings of the 2nd Mexican Meeting on Math-
ematical and Experimental Physics, edited by A. Macias,C. Lammerzahl, and D. Nunez (American Institute ofPhysics, NY, 2005), pp. 113-128, gr-qc/0411077.
15 S. G. Turyshev, M. M. Nieto, and J. D. Anderson, “Aroute to understanding of the Pioneer anomaly,” in Pro-
ceedings of the XXII Texas Symposium on Relativistic As-
trophysics, Stanford University, December 13–17, 2004,edited by P. Chen, E. Bloom, G. Madejski, and V. Pet-rosian. SLAC-R-752, Stanford e-Conf #C041213, paper#0310, eprint: <http://www.slac.stanford.edu/econf/
C041213/>, gr-qc/0503021.16 M.-T. Jaekel and S. Reynaud, “Gravity tests in the solar
system and the Pioneer anomaly,” Mod. Phys. Lett. A, 20,1047-1055 (2005), gr-qc/0410148.
17 R. H. Sanders, “A tensor-vector-scalar framework formodified dynamics and cosmic dark matter,” astro-ph/
0502222.18 J. W. Moffat, “Scalar-tensor-vector gravity theory,”
gr-qc/0506021.19 A. F. Ranada, “The Pioneer anomaly as acceleration of
the clocks,” Found. Phys. 34, 1955–1971 (2005), gr-qc/
0410084.20 R. Foot and R. R. Volkas, “A mirror world explanation
for the Pioneer spacecraft anomalies?,” Phys. Lett. B 517,13–17 (2001), hep-ph/0108051.
21 G. L. Tyler, J. P. Brenkle, T. A. Komarek, and A. I. Zygiel-baum, “The Viking Solar Corona experiment,” J. Geophys.
14
Res. 82, 4335–4340 (1977).22 D. O. Muhleman, P. B. Esposito, and J. D. Anderson, “The
electron density profile of the outer corona and the in-terplanetary medium from Mariner-6 and Mariner-7 time-delay measurements,” Astrophys. J. 211, 943–957 (1977).
23 D. O. Muhleman and J. D. Anderson, “Solar wind elec-tron densities from Viking dual-frequency radio measure-ments,” Astrophys. J. 247, 1093–1101 (1981).
24 S. G. Turyshev, B-G Andersson, “The 550 AU Mission:A Critical Discussion,” Mon. Not. Roy. Astron. Soc. 341,577–582 (2003), gr-qc/0205126.
25 For a discussion of spacecraft charging, see <http://
www.eas.asu.edu/~holbert/eee460/spc-chrg.html>.However, the magnetic field strength in the outer solarsystem is on the order of ≤ 10−5 Gauss.
26 G. W. Null, “Gravity field of Jupiter and its satellites fromPioneer 10 and Pioneer 11 tracking data,” Astron. J. 81,1153–1161 (1976).
27 The NASA Deep Space Network (DSN) is an internationalnetwork of antennae spread nearly equidistantly aroundthe Earth with one complex being situated in Goldstone,California, the second one near Canberra, Australia, andthe third one near Madrid, Spain.2 For more details, see<http://deepspace.jpl.nasa.gov/dsn/>.
28 To determine the state of the spacecraft at any given time,the Jet Propulsion Laboratory’s orbit determination pro-gram uses a batch-sequential filtering and smoothing algo-rithm with process noise.2 For this algorithm, any smallanomalous forces may be treated as stochastic parametersaffecting the spacecraft trajectory. As such, these parame-ters are also responsible for the stochastic noise in the ob-servational data. To better characterize these noise sources,the data interval is split into a number of constant orvariable size intervals, called “batches,” and assumptionsare made for statistical properties of these noise factors.The mean values and the second moments of the unknownparameters are estimated within the batch. In batch se-quential filtering, the reference trajectory is updated aftereach batch to reflect the best estimate of the true trajec-tory. (For more details consult Ref. 2 and also referencestherein.)
29 We use the symbol b to identify biases in the measuredvalue of the Pioneer anomaly produced by various sourcesof acceleration noise. The uncertainly in the contributionof these noise sources to the anomalous acceleration is con-ventionally denoted by σ. See an example of this usage inEq. (21).