Probability of Error Analysis for Hidden Markov Model Filtering With Random Packet Loss

McMaster, Sambasivam, and Anderson Sat, Nov 7, 2:00 - 2:25, Ballroom C
A Probability Model for Belady's Anomaly
Kirby McMaster
[email protected] CS Dept., St. Mary's College of MD
St. Mary's City, MD 20686
Samuel Sambasivam
[email protected] CS Dept., Azusa Pacific University
Azusa, CA 91702
Nicole Anderson [email protected]
CS Dept., Winona State University Winona, MN 55987
Abstract
In demand paging virtual memory systems, the page fault rate of a process varies with the
number of memory frames allocated to the process. When an increase in the number of
allocated frames leads to an increase in the number of page faults, Belady's anomaly is said to
occur. In this paper, we present a probability model for Belady’s anomaly. We describe the use
of computer simulation to estimate the parameters of the model over a design region of
process sizes and reference string lengths. We then relate our probability model to the
occurrence rate of Belady’s anomaly in the simulation results.
Keywords: Belady's anomaly, virtual memory, demand paging, page replacement, FIFO,
Random Page, probability model, simulation.
1. INTRODUCTION
In Operating Systems (OS) courses, instruc-
tors often like to assign software projects
that relate to course objectives. One topic
with special appeal to students is Belady's
anomaly. For a virtual memory system with
demand paging, the page fault rate of a
process varies with the number of memory
frames allocated to the process. When an
increase in the number of allocated frames
leads to an increase in the number of page
faults (a bump), Belady's anomaly is said to
occur (Belady, 1969).
The occurrence rate for Belady's anomaly
depends on which page replacement algo-
rithm is implemented. Examples of Belady's
anomaly for first-in-first-out (FIFO) paging
systems are presented in commonly used
Operating Systems textbooks (Silberschatz,
2008; Stuart, 2008; Deitel, 2004; etc.).
However, Belady's anomaly cannot occur
when page replacement is based on a stack
algorithm (Mattson, 1970).
In an earlier study (McMaster, Sambasivam,
and Anderson, 2009), we used computer
simulation to describe conditions that affect
how often Belady's anomaly will occur for
the FIFO and Random Page algorithms.
However, we did not explain why the
observed patterns occur.
In the previous study, for each process size
and reference string length in the design
region, we counted the total number of page
fault bumps generated by 1000 reference
Proc ISECON 2009, v26 (Washington DC): §3522 (refereed) c© 2009 EDSIG, page 1

McMaster, Sambasivam, and Anderson Sat, Nov 7, 2:00 - 2:25, Ballroom C
strings. Figure 1 summarizes the number of
anomaly bumps for the FIFO algorithm.
Figure 1. FIFO Anomaly Bumps per
1000 Reference Strings.
Anomaly bumps under FIFO appeared as
often as 869 times per 1000 reference
strings, with some strings having more than
one bump.
The FIFO anomaly data used to generate
Figure 1 is presented in tabular form as
Table A1 in the Appendix.
Figure 2 presents the anomaly bump counts
for the Random Page algorithm. Anomaly
bumps under this algorithm occurred as
often as 32152 times in 1000 reference
strings.
Figure 2. Random Page Anomaly Bumps
per 1000 Reference Strings.
The Random Page bump pattern is similar to
the FIFO results, except the bump counts
are dramatically larger. Also, the maximum
frequencies for each process size occur with
shorter reference string lengths. Some of
the reasons for these differences will be
explained later in the paper.
The Random Page anomaly data used to
generate Figure 2 is presented in tabular
form as Table A2 in the Appendix.
2. PROBABILITY MODEL
An analysis of conditions where Belady's
anomaly is likely to occur requires an
appropriate probability model. Consider the
memory regions for K frames vs. K+1
frames shown in Figure 3.
Figure 3. Memory Groups for Page
References.
At any point in time, each of the S process
pages will be in one of four disjoint groups:
Group 1: Unshared pages in K frames (A
pages). A page reference in this group will
generate a page fault for K+1 frames only.
Group 2: Unshared pages in K+1 frames
(B=A+1). A page reference here will gen-
erate a page fault for K frames only.
Group 3: Shared pages in K frames and K+1
frames (C = K-A). A page reference in this
group will generate a page fault for neither
K nor K+1 frames.
Group 4: Not in memory (D = S–A–B–C). A
page reference in Group 4 will generate
page faults for both K and K+1 frames.
0
4000
8000
12000
16000
20000
24000
28000
32000
25 50 100 200 400 800 1600 3200 6400
Reference String Length
Anomaly Bumps
S=20 S=40 S=60 S=80 S=100
0
100
200
300
400
500
600
700
800
900
25 50 100 200 400 800 1600 3200 6400
Reference String Length
Anomaly Bumps
S=20 S=40 S=60 S=80 S=100
Proc ISECON 2009, v26 (Washington DC): §3522 (refereed) c© 2009 EDSIG, page 2

McMaster, Sambasivam, and Anderson Sat, Nov 7, 2:00 - 2:25, Ballroom C
Belady's anomaly occurs when, for a given
reference string, more page references are
in Group 1 than in Group 2. This leads to
more page faults for K+1 frames than K
frames. Page references in Group 2 and
Group 4 have no effect on the difference.
For a random page reference, probabilities
can be defined for each of the four groups in
which the page might be located. Define the
random variable X with the probability
distribution as shown in Table 1. This
random variable represents the excess of
page faults for K+1 frames over K frames for
a single page reference.
Table 1. Anomaly Random Variable for
one page reference.
Group X P[X] Page Fault
1 1 A/S K+1 frames
2 -1 (A+1)/S K frames
3 0 C/S neither
4 0 D/S both
The probability of an anomaly depends on
the number of unshared pages A relative to
the process size S, and the value of A
compared to A+1. If page faults for a
reference string of length L are tracked using Y = ΣX, Belady's anomaly will occur
when there are more page faults for K+1
frames (X = 1 values) than for K frames (X
= -1 values). In this case, the random
variable Y will be positive. Thus, we are
interested in the probability P[Y > 0], given
process size S, reference string length L, and
unshared pages A in K frames.
If we assume (incorrectly) that the value of
A is constant, the expected value of Y for a
random reference string of length L is:
E(Y) = L*E(X) = L(-1/S) = -L/S
The expected value of X and Y are negative,
because page faults are less likely when
more memory frames are available. The
longer the reference string, the greater the
magnitude of the expected value of Y.
Under the same assumptions, the variance
of Y is:
Var(Y) = L*Var(X) = L[(2A+1)S – 1)]/S2
We define the standard score Z0 for Y = 0
as:
Z0 = (0 – E(Y))/SDev(Y)
= Sqrt{L/[(2A+1)S – 1]}
where SDev(Y) denotes the standard
deviation of Y. Since P[Y > 0] = P[Z > Z0],
the formula for Z0 indicates the probability
that Belady's anomaly will occur depends on
the following factors:
1. A longer reference string length L de-
creases the likelihood of an anomaly
(larger Z0).
2. A larger process size S increases the
likelihood of an anomaly (smaller Z0).
3. A greater number of unshared pages A
increases the likelihood of an anomaly
(smaller Z0).
Additional considerations that affect Belady's
anomaly include:
4. The value of A depends on S and K. The
pattern of this relationship and its effect
on Belady's anomaly are not obvious.
5. A larger S means that there are more
frame pairs K vs. K+1 in which an ano-
maly can appear. This increases the like-
lihood of an anomaly.
6. The value of A is not constant. Initially,
the value of A is 0 while the K frames and
K+1 frames are being filled. Additional
page references gradually increase the
value of A. Thus, Belady's anomaly is
unlikely for short reference strings.
7. The change in A depends on the page
replacement algorithm. With a stack algo-
rithm, the pages in K frames are a subset
of the pages in K+1 frames. In this case,
A is always 0, so Belady's anomaly never
occurs. The number of unshared pages
increases for FIFO and Random Page, but
at different rates and with different max-
imum values.
3. METHODOLOGY
Computer simulation was performed using a
program written specifically for this re-
search. We focused on four conditions that
affect the occurrence of Belady's anomaly:
1. Page replacement algorithm.
2. Process size in pages.
3. Reference string length.
4. Memory frames allocated to the process.
Proc ISECON 2009, v26 (Washington DC): §3522 (refereed) c© 2009 EDSIG, page 3
McMaster, Sambasivam, and Anderson Sat, Nov 7, 2:00 - 2:25, Ballroom C
In the simulation runs, the process size
ranged from 20 to 100 pages in increments
of 20. The length of the reference string
varied from 25 to 6400 page references,
with each value being twice the preceding
value. Two page replacement algorithms
were examined, FIFO and Random Page.
In each simulation run, one page replace-
ment algorithm, one process size, and one
reference string length were selected. Then
1000 random reference strings were gener-
ated using a uniform random number
generator. For each reference string, the
number of page faults was computed for
each memory allocation from 1 frame up to
the process size.
For each algorithm and memory frame level,
frames were "pre-filled" before any refer-
ence string page faults were counted.
Specifically, K memory frames were filled
with page numbers K (first-out) through 1
(last-in). Similarly, K+1 frames were filled
with page numbers K+1 (first-out) through 1
(last-in). These initial allocations insured
that the pages in K frames were a subset of
the pages in K+1 frames, and that the pages
were in the same order in the two queues
(with page 1 being the most recent arrival).
This initial "pre-fill" method was necessary
for FIFO comparisons, although irrelevant for
Random Page.
Our computer simulation calculated the
number of shared pages C and unshared
pages A for each pair of frame levels (K vs.
K+1) under each combination of design
conditions. It was expected that A would be
larger (and C smaller) for the Random Page
algorithm than for FIFO.
4. BELADY'S ANOMALY: FIFO
The number of unshared pages A for K
frames depends on the page replacement
algorithm, the process size S, the reference
string length L, and the allocated frames
level K. In this section, we examine the
value of A for the FIFO algorithm. It is
difficult to visualize the simultaneous effects
of three variables on A, so we initially fixed
the number of allocated frames (as a
percent of process size). This allowed us to
focus on how the number of unshared pages
depends on the process size and string
length. Later, we will explain how equili-
brium values for A relate to S and K.
Unshared Pages and Reference Strings
Figure 4 describes for FIFO how A varies as
the reference string length L increases up to
6400 for process sizes S between 20 and
100, when the number of allocated frames K
is 80% of S. We express K as a percent of S
so that the K values for different process
sizes are comparable. That is, 80%
represents K = 16 frames for 20 pages, K =
32 frames for 40 pages, etc.
Figure 4. Unshared Pages: FIFO. By
process size S and reference string
length L. Frames K = 80% of S.
Under FIFO, the initial value of A for length L
= 0 is always 0 because of how frames are
pre-filled in the simulation. Observe that for
L = 6400, the slope is approximately 0 for
each process size. As the reference string
length increases, the number of unshared
pages approaches an equilibrium value that
depends on the process size (and the
number of frames). The term "equilibrium"
value does not mean that A remains con-
stant. Probabilities are involved with each
page reference, so A will continue to vary
randomly, but around a constant average
value.
The largest value for A in Figure 4 is 8.44
unshared pages for process size S = 100.
This equilibrium value is reached when L =
6400. By comparison, the maximum value
for A when S = 20 is 1.77 unshared pages,
which is attained when L = 200. A small
0
1
2
3
4
5
6
7
8
9
0 25 50 100 200 400 800 1600 3200 6400
Reference String Length
Unshared Pages
S=100 S=80 S=60 S=40 S=20
Proc ISECON 2009, v26 (Washington DC): §3522 (refereed) c© 2009 EDSIG, page 4

McMaster, Sambasivam, and Anderson Sat, Nov 7, 2:00 - 2:25, Ballroom C
process size reaches its equilibrium value
sooner, since there are fewer initial pages to
"flush out".
In Figure 4, we presented data for K = 80%
of the process size. Different frame levels
show similar patterns, but with smaller
equilibrium A values. In the FIFO part of this
study, the largest value of A (= 8.44) occurs
when S = 100, L = 6400, and K = 80 (80%
of S).
Unshared Pages and Allocated Frames
We now examine for FIFO how the number
of unshared pages A depends on process
size S and allocated frames K (expressed as
a percent of S). To remove the effect of
reference string length, we restrict our
discussion to equilibrium values of A. Figure
5 summarizes the unshared pages A by
process size S (20 to 100) and allocated
frames K (10% to 90% of S).
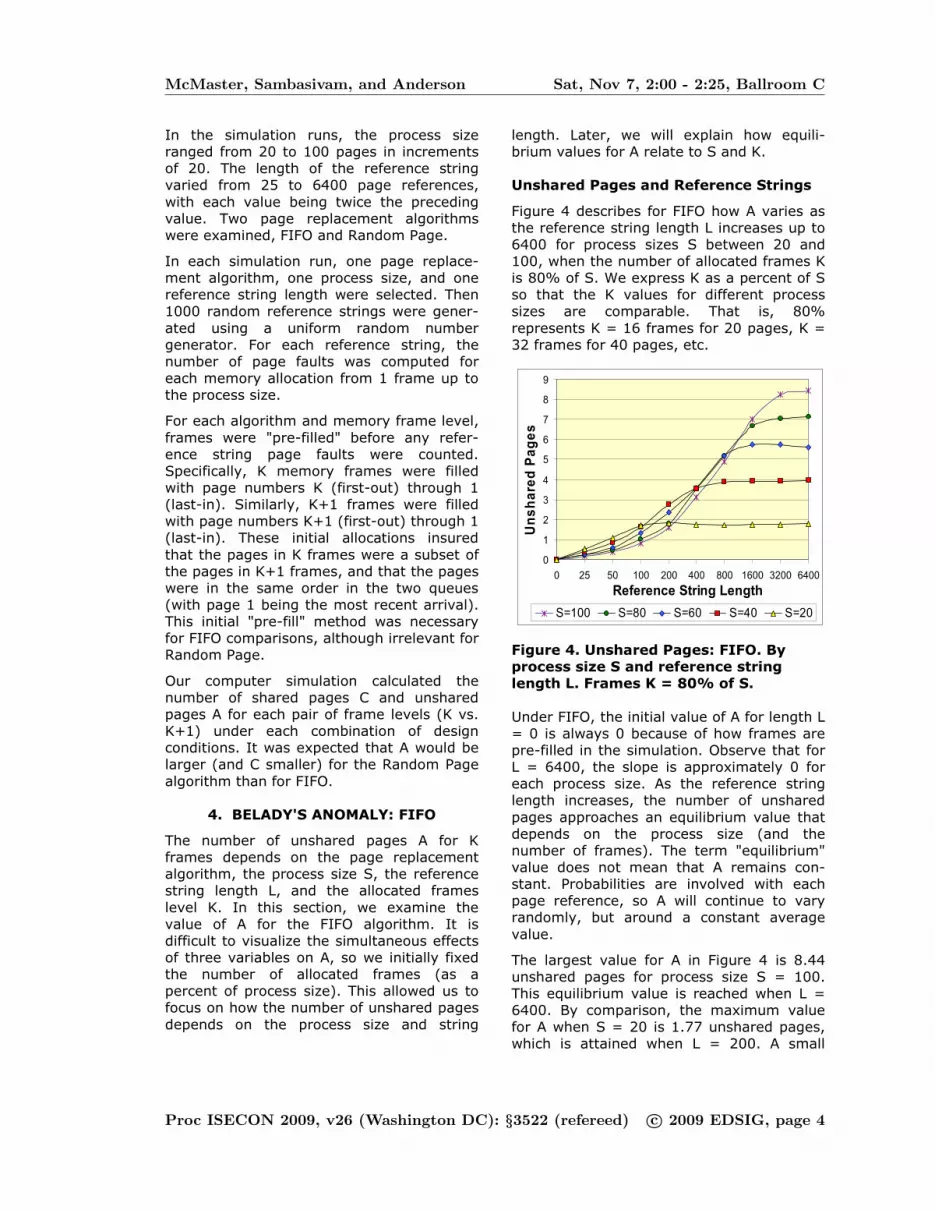
Figure 5. Unshared Pages A and Allo-
cated Frames: FIFO. By process size,
using equilibrium A values.
The FIFO pattern for equilibrium A values
has some interesting features.
1. When K is 40% or less of S, all A values
are below 1.0.
2. For a fixed process size S, as K grows
from 10% to 90%, the value of A in-
creases to a maximum and then starts to
decrease.
3. For fixed S, the maximum value of A
occurs when K is 70% (for S = 20) or
80% (for S > 20).
4. The equilibrium value of A increases as S
grows larger.
5. The largest value of A in Table 3 is 8.44
unshared pages.
Very few unshared pages occur under FIFO
when the allocated frame level is below 60%
of S. Unshared pages are most likely to
occur when S is greater than 20 and K is
between 70% and 90%.
Unshared Pages and Anomalies
Previous sections have described how the
number of unshared pages A depends on
process size S, reference string length L and
allocated frame level K. We now examine
the relationship between A and the number
of anomaly bumps.
Table 2 lists, for each process size S, the
maximum number of FIFO anomaly bumps.
These values are taken from the data
presented in Figure 1. As S becomes larger,
the maximum anomaly bump count consis-
tently increases.
Table 2 also presents, for each process size
S, the equilibrium number of unshared
pages A when the allocated frame level K is
80% of S. The 80% frame level was chosen
because this level exhibits the largest A
values for FIFO. As for anomaly bumps,
when S increases, the value of A becomes
consistently larger.
Table 2. Anomaly Summary: FIFO.
Max anomaly bumps vs. unshared
pages (frames K = 80% of S)
Process
Size S
Max
Bumps
Unshared
Pages A
A/S
(%)
20 60 1.77 8.85
40 207 3.92 9.80
60 399 5.69 9.48
80 585 7.15 8.94
100 869 8.44 8.44
However, for each process size, the maxi-
mum number of anomalies occurs before A
reaches its equilibrium value. Two competing
effects are at work here. Anomalies increase
as A becomes larger, but anomalies de-
crease when L grows longer. The highest
anomaly bump frequency involves a trade-
off of these two effects.
0
1
2
3
4
5
6
7
8
9
10% 20% 30% 40% 50% 60% 70% 80% 90%
K Frames as % of Process Size
Unshared Pages
S=100 S=80 S=60 S=40 S=20
Proc ISECON 2009, v26 (Washington DC): §3522 (refereed) c© 2009 EDSIG, page 5

McMaster, Sambasivam, and Anderson Sat, Nov 7, 2:00 - 2:25, Ballroom C
Table 2 includes the ratio of unshared pages
A to process size S, stated as a percentage.
In our probability model defined earlier, the
variance of the random variable X (and Y)
depends on A/S. For FIFO, this ratio does
not vary much over the range of process
sizes in the study. When S is 20, the ratio
A/S is slightly below 9.00%. For S values
from 40 to 100, A/S decreases gradually
from 9.80% to 8.44%.
The anomaly bump counts in Table 2 are the
sum of anomalies across all frame levels,
whereas unshared page values apply only to
the 80% frame level. We can look more
closely at the effect of frame level by
"zooming in" on the conditions that led to
the anomaly bump count of 869. In this
case, S is 100, and L is 1600. The 869
bumps occurred across many frame pairs K
and K+1, where K ranged from 1 to 99, and
each pair had its own value of A. Instead of
reporting results for all 99 frame pairs, we
focus on K values 10, 20, ... 90.
The pattern of anomaly bumps and unshared
pages for these nine frame levels is shown in
Figure 6. Figure 6 is a line graph with two
vertical axis variables, each with a separate
scale. The number of unshared pages A is on
the left scale, and the anomaly bump counts
are on the right scale.
Figure 6. Unshared Pages and
Anomalies: FIFO. Process size = 100
and reference string length = 1600.
Because of the randomness in the simula-
tion, the values in Figure 6 are "smoothed."
For each selected frame level K, we aver-
aged the three A values and the three
anomaly bump counts for K-1, K, and K+1
frames. Note the similarity of the pattern of
each vertical variable with frame count K.
For FIFO, the larger anomaly bump counts
and the larger A values fall over a fairly
narrow range of frame levels, primarily
between 70 and 90.
5. BELADY'S ANOMALY: RANDOM PAGE
In this section, we examine relationships
between unshared pages A, process size S,
reference string length L, and allocated
frames K for the Random Page algorithm. As
with FIFO, we initially fix K (as a percent of
S) and focus on how A depends on S and L.
After determining equilibrium values for A,
we observe the pattern of these maximum A
values with S and K.
Unshared Pages and Reference Strings
Figure 7 describes how A varies as the
reference string length L increases up to
6400 for process sizes S between 20 and
100, when the number of allocated frames K
is 60% of S. These results are for the
Random Page algorithm.
Figure 7. Unshared Pages: Random
Page. By process size S and reference
string length L. Frames K = 60% of S.
In this case, 60% represents K = 12 frames
for 20 pages, K = 24 frames for 40 pages,
etc. The initial value of A for length L = 0 is
0 because of how frames are pre-filled in the
simulation. As L increases beyond 100, the
number of unshared pages approaches an
0
2
4
6
8
10
12
14
16
18
0 25 50 100 200 400 800 1600 3200 6400
Reference String Length
Unshared Pages
S=100 S=80 S=60 S=40 S=200
2
4
6
8
10
10 20 30 40 50 60 70 80 90
Allocated Frames
Unshared Pages
0
10
20
30
40
Anomaly Bumps
Unshared Pages Anomalies
Proc ISECON 2009, v26 (Washington DC): §3522 (refereed) c© 2009 EDSIG, page 6

McMaster, Sambasivam, and Anderson Sat, Nov 7, 2:00 - 2:25, Ballroom C
equilibrium value that depends on the
process size. For L = 200, the slope of the
line is approximately 0 for each process size.
The largest value for A in Figure 7 is 16.51
unshared pages for a process size of S =
100. This equilibrium value is reached when
length L = 200. By comparison, the maxi-
mum value for A when S = 20 is 2.82
unshared pages, which is attained when L =
50. With the Random Page algorithm, the
initial pages are "flushed out" more rapidly
than with FIFO.
In Figure 7, we selected K = 60% of S, since
this yields the largest equilibrium values for
A. In the Random Page part of this study,
the largest value of A (= 16.51) occurs when
S = 100, L = 200, and K = 60 (60% of S).
Unshared Pages and Allocated Frames
We now consider for Random Page how the
number of unshared pages A depends on
process size S and allocated frames K
(expressed as a percent of S). Figure 8
summarizes the equilibrium values of A by
process size S (20 to 100) and allocated
frames K (10% to 90% of S).
Figure 8. Unshared Pages A and Allo-
cated Frames: Random Page. By process
size, using equilibrium A values.
The Random Page pattern for equilibrium A
values differs somewhat from FIFO.
1. The only A value less than 1.0 occurs
when S is 20 and K is 10% of S.
2. For each fixed process size S, as K grows
from 10% to 90%, the value of A in-
creases to a maximum, and then starts to
decrease.
3. For each fixed S, the maximum value of
A occurs when K is 60% of S.
4. Larger process sizes have larger equili-
brium A values.
5. The largest value of A in Figure 8 is 16.51
unshared pages.
6. Equilibrium A values for Random Page are
often twice the size of corresponding A
values for FIFO.
Relatively few unshared pages occur under
Random Page when the allocated frame level
is near 0% or is almost 100%. More un-
shared pages commonly occur when S is
greater than 20 and K is between 30% and
80%. Under Random Page, large unshared
page counts occur over a wider range of
frame levels than for FIFO.
Unshared Pages and Anomalies
We now describe the relationship between
unshared pages A and the number of
anomaly bumps for the Random Page
algorithm. Table 3 lists, for each process size
S, the maximum number of anomaly bumps.
These values are taken from the data
presented in Figure 2. As S becomes larger,
the maximum anomaly bump count grows
substantially.
Table 3. Anomaly Summary: Random
Page. Max anomaly bumps vs. un-
shared pages (frames K = 60% of S).
Process
Size S
Max
Bumps
Unshared
Pages A
A/S
(%)
20 3236 2.82 14.10
40 9547 6.23 15.58
60 16638 9.66 16.10
80 24400 13.08 16.35
100 32152 16.51 16.51
Table 3 also shows, for each process size S,
the equilibrium unshared pages A when the
allocated frame level K is 60% of S. The
60% frame level was chosen because this
level exhibits the largest A values for
Random Page. When S increases, the value
of A becomes larger, but requires slightly
longer reference strings.
For Random Page, the reference string
lengths for maximum anomaly bumps are
0
2
4
6
8
10
12
14
16
18
10% 20% 30% 40% 50% 60% 70% 80% 90%
K Frames as Percent of Process Size
Unshared Pages
S=20 S=40 S=60 S=80 S=100
Proc ISECON 2009, v26 (Washington DC): §3522 (refereed) c© 2009 EDSIG, page 7
McMaster, Sambasivam, and Anderson Sat, Nov 7, 2:00 - 2:25, Ballroom C
fairly short, and the corresponding lengths
needed for A to reach equilibrium are not
much longer. Even so, the maximum
number of anomalies occurs before A
reaches its equilibrium value. As with FIFO,
anomalies increase as A becomes larger, but
decrease when L grows longer.
Table 3 includes the ratio of unshared pages
A to process size S, stated as a percentage.
In our probability model defined earlier, the
variance of the random variable X (and Y)
depends on A/S. For Random Page, this ratio
increases gradually from 14.10% (S = 20)
to 16.51% (S = 100). The Random Page A
and A/S values are 1.5 to 2 times larger
than the FIFO values.
The anomaly bump counts in Table 3 are the
sum of anomalies across all frame levels,
whereas unshared page values apply only to
the 60% frame level. We can look more
closely at the effect of frame level by
detailing parts of the total anomaly bump
count of 32152. In this case, S is 100, and L
is 100. The 32152 bumps occurred across
most frame pairs K and K+1, where K
ranged from 1 to 99, with each pair having
its own value of A.
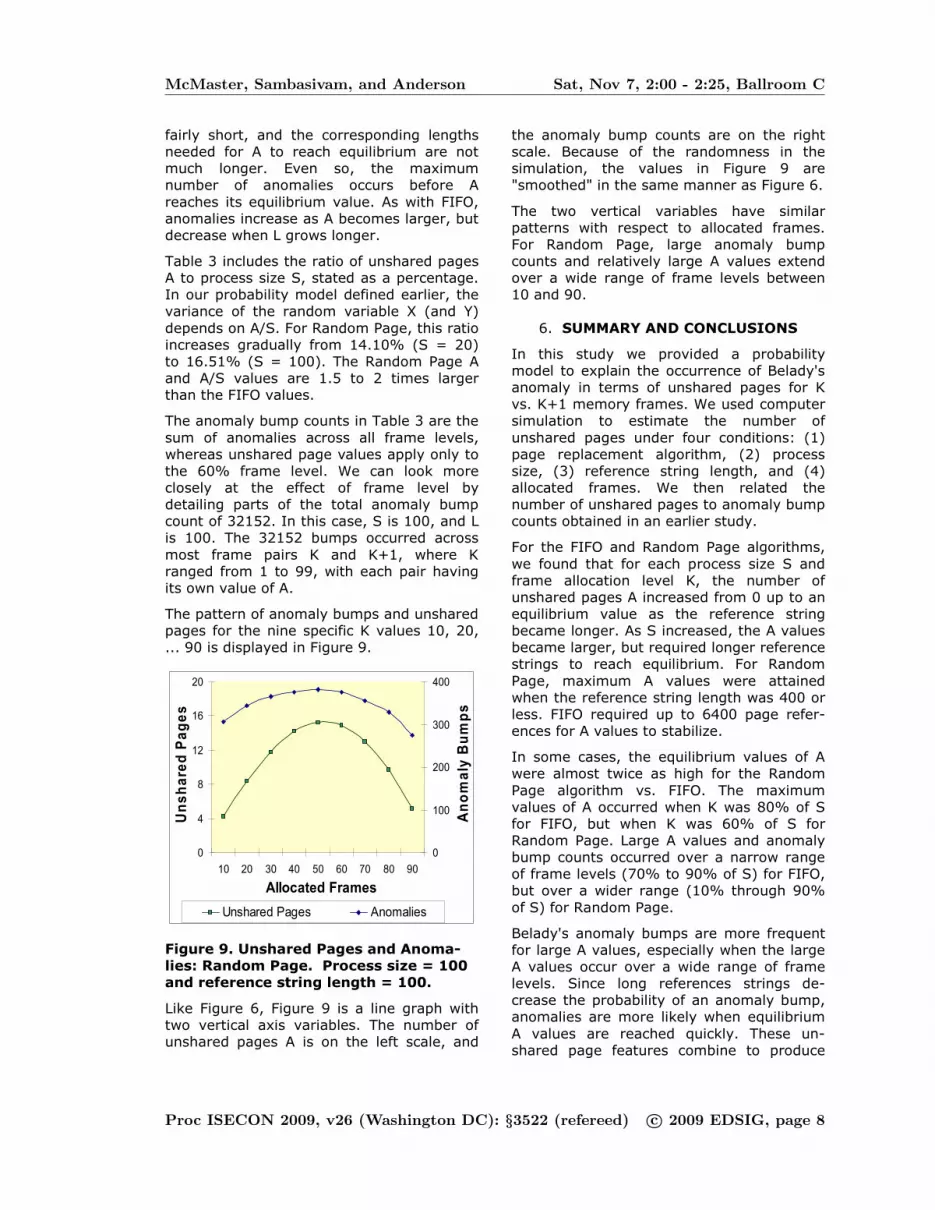
The pattern of anomaly bumps and unshared
pages for the nine specific K values 10, 20,
... 90 is displayed in Figure 9.
Figure 9. Unshared Pages and Anoma-
lies: Random Page. Process size = 100
and reference string length = 100.
Like Figure 6, Figure 9 is a line graph with
two vertical axis variables. The number of
unshared pages A is on the left scale, and
the anomaly bump counts are on the right
scale. Because of the randomness in the
simulation, the values in Figure 9 are
"smoothed" in the same manner as Figure 6.
The two vertical variables have similar
patterns with respect to allocated frames.
For Random Page, large anomaly bump
counts and relatively large A values extend
over a wide range of frame levels between
10 and 90.
6. SUMMARY AND CONCLUSIONS
In this study we provided a probability
model to explain the occurrence of Belady's
anomaly in terms of unshared pages for K
vs. K+1 memory frames. We used computer
simulation to estimate the number of
unshared pages under four conditions: (1)
page replacement algorithm, (2) process
size, (3) reference string length, and (4)
allocated frames. We then related the
number of unshared pages to anomaly bump
counts obtained in an earlier study.
For the FIFO and Random Page algorithms,
we found that for each process size S and
frame allocation level K, the number of
unshared pages A increased from 0 up to an
equilibrium value as the reference string
became longer. As S increased, the A values
became larger, but required longer reference
strings to reach equilibrium. For Random
Page, maximum A values were attained
when the reference string length was 400 or
less. FIFO required up to 6400 page refer-
ences for A values to stabilize.
In some cases, the equilibrium values of A
were almost twice as high for the Random
Page algorithm vs. FIFO. The maximum
values of A occurred when K was 80% of S
for FIFO, but when K was 60% of S for
Random Page. Large A values and anomaly
bump counts occurred over a narrow range
of frame levels (70% to 90% of S) for FIFO,
but over a wider range (10% through 90%
of S) for Random Page.
Belady's anomaly bumps are more frequent
for large A values, especially when the large
A values occur over a wide range of frame
levels. Since long references strings de-
crease the probability of an anomaly bump,
anomalies are more likely when equilibrium
A values are reached quickly. These un-
shared page features combine to produce
0
4
8
12
16
20
10 20 30 40 50 60 70 80 90
Allocated Frames
Unshared Pages
0
100
200
300
400
Anomaly Bumps
Unshared Pages Anomalies
Proc ISECON 2009, v26 (Washington DC): §3522 (refereed) c© 2009 EDSIG, page 8

McMaster, Sambasivam, and Anderson Sat, Nov 7, 2:00 - 2:25, Ballroom C
much higher Belady's anomaly occurrence
rates for Random Page than for FIFO.
Future Research
We are continuing our research on Belady's
anomaly. Alternative probability models such
as the Binomial distribution are being
considered. Statistical goodness-of-fit tests
to evaluate the suitability of the models are
being performed. The Random Page algo-
rithm justifies many of the assumptions
required by probability models and statistical
tests. This is less true for the FIFO algo-
rithm. One of our goals is to gain a better
understanding of why the FIFO algorithm
behaves in its unique ways.
7. REFERENCES
Belady, L. A. (1966). A study of replacement
algorithms for a virtual-storage comput-
er. IBM Systems Journal, Volume 5,
Number 2.
Belady, L. A., et al. (1969). An anomaly in
space-time characteristics of certain
programs running in a paging machine.
CACM, Volume 12, Number 6.
Deitel, P., & Choffnes, D. (2004). Operating
systems. Prentice Hall.
Dhamdhere, D. (2008). Operating systems.
McGraw-Hill.
Feller, W. (1968). An introduction to proba-
bility theory and its applications (3rd
ed). Wiley.
Mattson, R. L., et al. (1970). Evaluation
techniques for storage hierarchies. IBM
Systems Journal, Volume 9, Number 2.
McMaster, K., Sambasivam, S., and Ander-
son, N. (2009). How anomalous is Bela-
dy’s anomaly? Issues in Informing
Science and Information Technology,
Volume 6.
Schlesinger, R., & Garrido, J. (2007).
Principles of modern operating systems.
Jones & Bartlett.
Silberschatz, A., Galvin, P. B., & Gagne, G.
(2008). Operating system concepts (8th
ed). Wiley.
Stuart, B. (2008). Principles of operating
systems: Design and applications.
Course Technology.
Proc ISECON 2009, v26 (Washington DC): §3522 (refereed) c© 2009 EDSIG, page 9

McMaster, Sambasivam, and Anderson Sat, Nov 7, 2:00 - 2:25, Ballroom C
Appendix
Table A1: Total Anomaly Bumps – FIFO
Number of page fault bumps per 1000 reference strings.
Some reference strings exhibit more than one bump.
Maximum frequency for each process size is shown in bold.
Reference String Length
Process
Size
25
50
100
200
400
800
1600
3200
6400
20 0 14 57 60 16 3 0 0 0
40 0 8 49 166 207 144 31 2 1
60 0 3 23 147 334 399 233 59 6
80 0 0 16 112 374 585 565 232 51
100 0 0 2 80 357 693 869 533 161
Table A2: Total Anomaly Bumps – Random Page
Number of page fault bumps per 1000 reference strings.
Many reference strings exhibit multiple bumps.
Maximum frequency for each process size is shown in bold.
Reference String Length
Process
Size
25
50
100
200
400
800
1600
3200
6400
20 3236 2857 2016 1027 331 45 2 0 0
40 9184 9547 8707 7020 4856 2439 780 103 2
60 14770 16638 16391 14861 11809 8070 4268 1549 271
80 20054 23615 24400 22929 19965 15269 10213 5131 1660
100 24936 30351 32152 31229 28204 23427 17294 10416 4829
Proc ISECON 2009, v26 (Washington DC): §3522 (refereed) c© 2009 EDSIG, page 10
Copyright © 2022 FDOKUMEN