
Optimization of the manufacturing process of hollow glass
11
1 Optimization of the manufacturing process of hollow glass Zorina, Anastasiya a,b ; Aguiar, Fernando b ; Gonçalves, Clara a ; Amado, Conceição a . a Instituto Superior Técnico, Avenida Rovisco Pais, 1, 1049-001, Lisboa Portugal b Rua Vice-Almirante Azevedo Coutinho, 2700-843 Venda Nova, Lisboa, Portugal Abstract This work emerges as a response to a challenge posed by the BA glass plant - the implementation of the Best Day project in a production line. The Best Day project aims to monitor, in real time, all the process variables in a selected production line and to register all the product parameters, to characterize the Best Manufacturing Day for a study article. The Best Manufacturing Day of an article corresponds to the day when the highest production was recorded, with no critical defects and customer complaints (a posteriori registration). The aim of this project was to establish the process variables that require an increased control over the other variables, in order to obtain a more efficient production. To accomplish this objective, a statistical study was carried out in which linear correlations between the explanatory variables and the response variables of interest were established, followed by the modeling of the variables to make a statistical inference using SPSS. It was concluded that the variables related to the furnace, namely some temperatures (T1102 e T1203, near to the throat of furnace) as well as the air /gas ratio used have strong to moderate Pearson correlations with the response variables. The same is true of manufacturing variables related to the shape of gout, namely parameters that pertain to plunger. The formation of a perfect gout is the primary condition for achieving a conformal glass container. Key-words: Optimization, Best Manufacturing Day, highest production, critical defects, Pearson correlations. 1. Introduction The centenary company "Barbosa e Almeida", current BA Glass, was founded in 1912 by partners Raul da Silva Barbosa and Domingos de Almeida. It began its activity in 1930 in Campanhã. In 1971 the first machine of independent section (IS machine) was installed, that favored the productive capacity thought its automazation. The BA group has evolved as it can be seen on the next figure. Nowadays the group has 12 factories located in 7 different countries such as: Portugal, Spain, Poland, Germany, Greece, Romania and Bulgaria
-
Upload
khangminh22 -
Category
Documents
-
view
2 -
download
0
Transcript of Optimization of the manufacturing process of hollow glass

1
Optimization of the manufacturing process of hollow glass
Zorina, Anastasiyaa,b; Aguiar, Fernandob; Gonçalves, Claraa; Amado, Conceiçãoa.
a Instituto Superior Técnico, Avenida Rovisco Pais, 1, 1049-001, Lisboa Portugal
b Rua Vice-Almirante Azevedo Coutinho, 2700-843 Venda Nova, Lisboa, Portugal
Abstract
This work emerges as a response to a challenge posed by the BA glass plant - the implementation of
the Best Day project in a production line. The Best Day project aims to monitor, in real time, all the
process variables in a selected production line and to register all the product parameters, to
characterize the Best Manufacturing Day for a study article. The Best Manufacturing Day of an article
corresponds to the day when the highest production was recorded, with no critical defects and
customer complaints (a posteriori registration).
The aim of this project was to establish the process variables that require an increased control over
the other variables, in order to obtain a more efficient production. To accomplish this objective, a
statistical study was carried out in which linear correlations between the explanatory variables and
the response variables of interest were established, followed by the modeling of the variables to make
a statistical inference using SPSS.
It was concluded that the variables related to the furnace, namely some temperatures (T1102 e
T1203, near to the throat of furnace) as well as the air /gas ratio used have strong to moderate
Pearson correlations with the response variables. The same is true of manufacturing variables related
to the shape of gout, namely parameters that pertain to plunger. The formation of a perfect gout is
the primary condition for achieving a conformal glass container.
Key-words: Optimization, Best Manufacturing Day, highest production, critical defects, Pearson
correlations.
1. Introduction
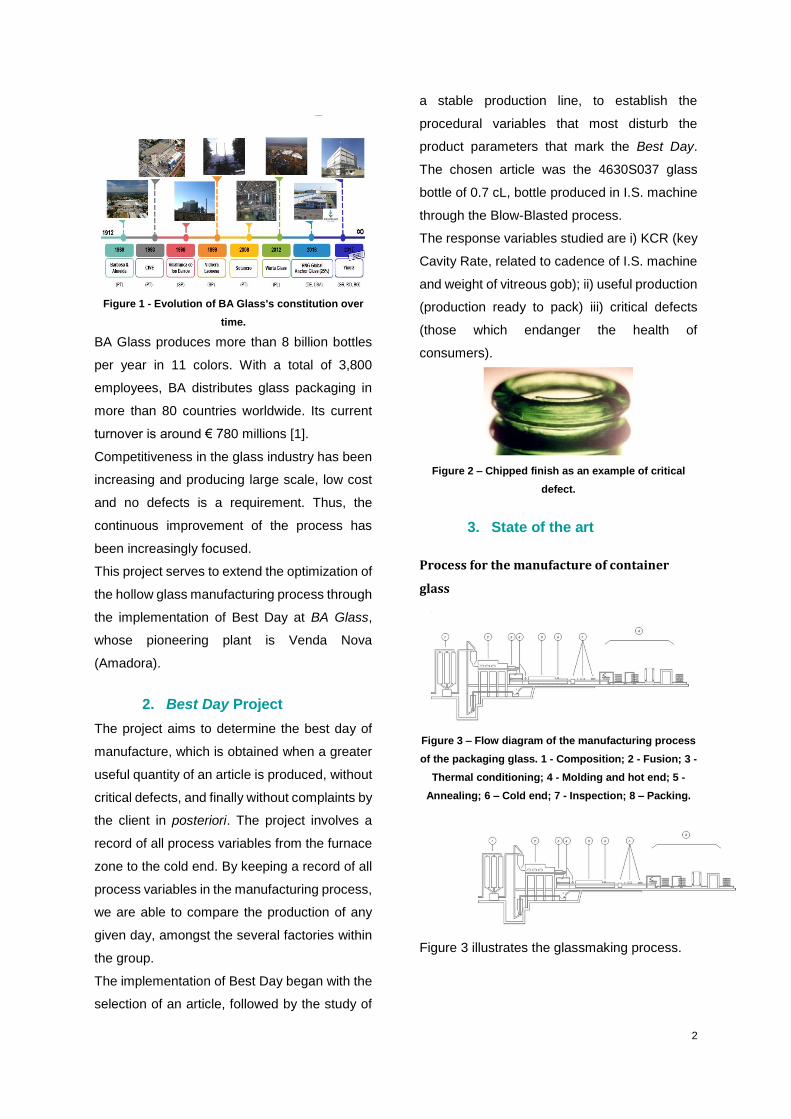
The centenary company "Barbosa e Almeida",
current BA Glass, was founded in 1912 by
partners Raul da Silva Barbosa and Domingos
de Almeida. It began its activity in 1930 in
Campanhã. In 1971 the first machine of
independent section (IS machine) was installed,
that favored the productive capacity thought its
automazation. The BA group has evolved as it
can be seen on the next figure. Nowadays the
group has 12 factories located in 7 different
countries such as: Portugal, Spain, Poland,
Germany, Greece, Romania and Bulgaria
2
Figure 1 - Evolution of BA Glass's constitution over
time.
BA Glass produces more than 8 billion bottles
per year in 11 colors. With a total of 3,800
employees, BA distributes glass packaging in
more than 80 countries worldwide. Its current
turnover is around € 780 millions [1].
Competitiveness in the glass industry has been
increasing and producing large scale, low cost
and no defects is a requirement. Thus, the
continuous improvement of the process has
been increasingly focused.
This project serves to extend the optimization of
the hollow glass manufacturing process through
the implementation of Best Day at BA Glass,
whose pioneering plant is Venda Nova
(Amadora).
2. Best Day Project
The project aims to determine the best day of
manufacture, which is obtained when a greater
useful quantity of an article is produced, without
critical defects, and finally without complaints by
the client in posteriori. The project involves a
record of all process variables from the furnace
zone to the cold end. By keeping a record of all
process variables in the manufacturing process,
we are able to compare the production of any
given day, amongst the several factories within
the group.
The implementation of Best Day began with the
selection of an article, followed by the study of
a stable production line, to establish the
procedural variables that most disturb the
product parameters that mark the Best Day.
The chosen article was the 4630S037 glass
bottle of 0.7 cL, bottle produced in I.S. machine
through the Blow-Blasted process.
The response variables studied are i) KCR (key
Cavity Rate, related to cadence of I.S. machine
and weight of vitreous gob); ii) useful production
(production ready to pack) iii) critical defects
(those which endanger the health of
consumers).
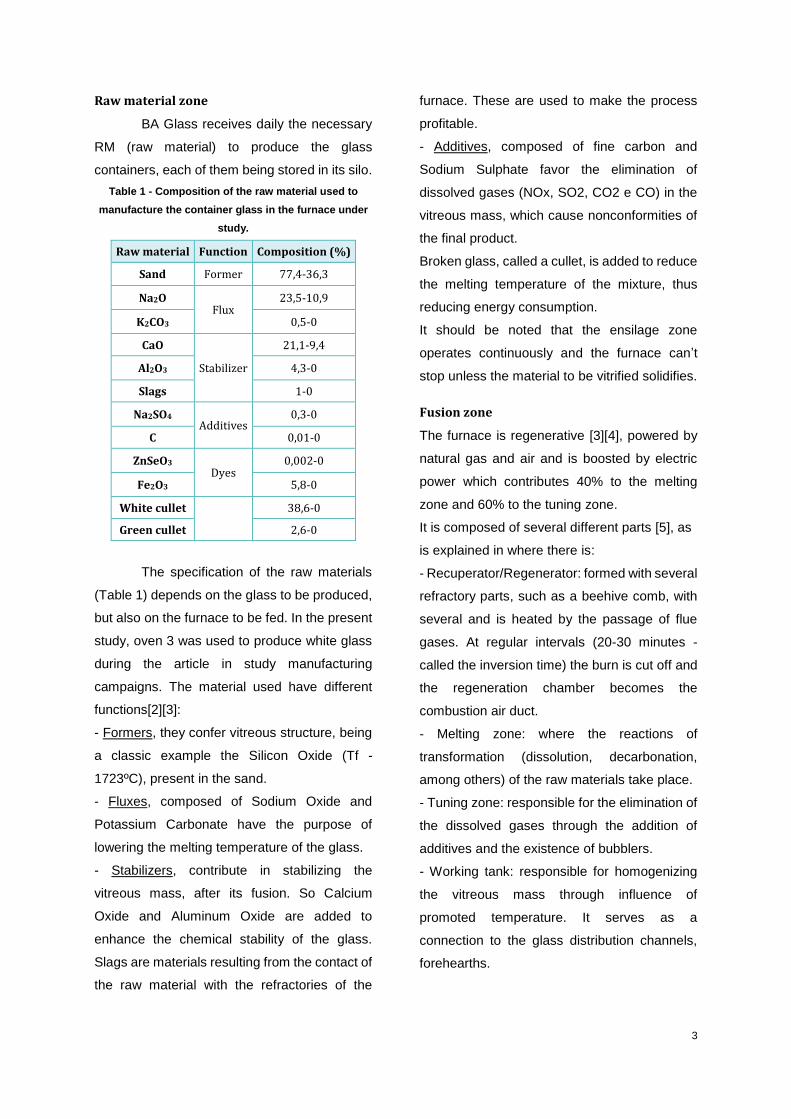
Figure 2 – Chipped finish as an example of critical
defect.
3. State of the art
Process for the manufacture of container
glass
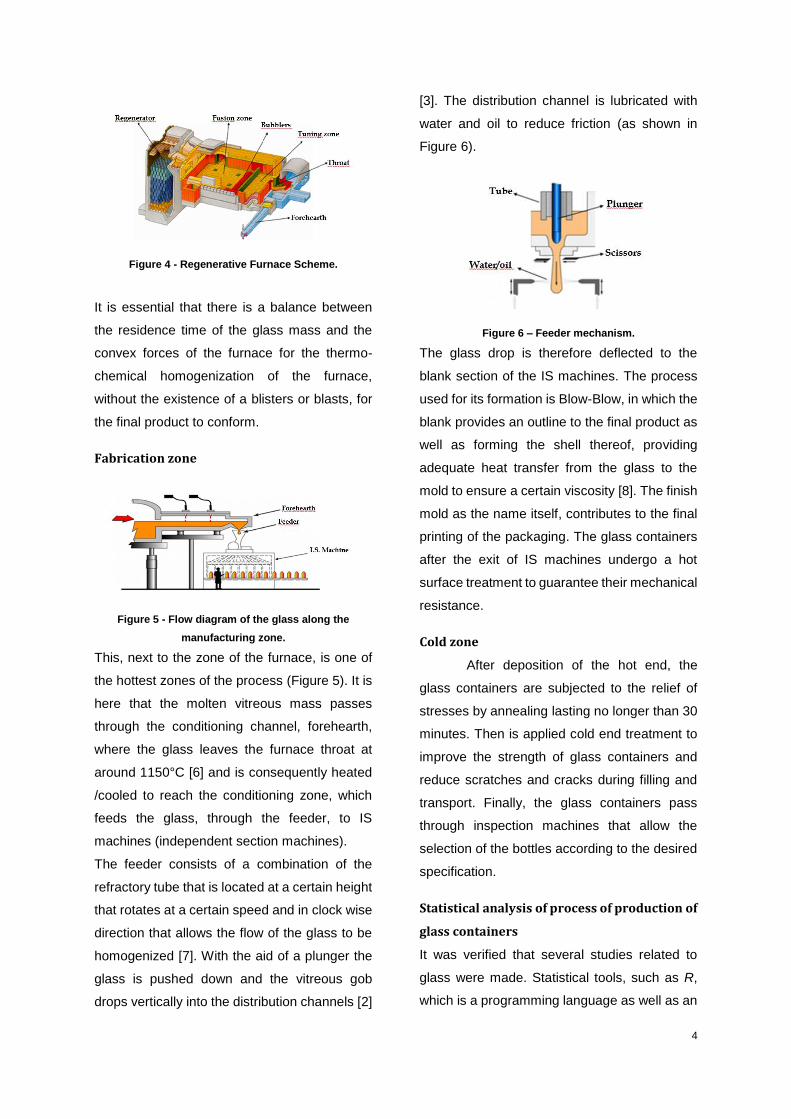
Figure 3 – Flow diagram of the manufacturing process
of the packaging glass. 1 - Composition; 2 - Fusion; 3 -
Thermal conditioning; 4 - Molding and hot end; 5 -
Annealing; 6 – Cold end; 7 - Inspection; 8 – Packing.
Figure 3 illustrates the glassmaking process.
3
Raw material zone
BA Glass receives daily the necessary
RM (raw material) to produce the glass
containers, each of them being stored in its silo.
Table 1 - Composition of the raw material used to
manufacture the container glass in the furnace under
study.
Raw material Function Composition (%)
Sand Former 77,4-36,3
Na2O Flux
23,5-10,9
K2CO3 0,5-0
CaO
Stabilizer
21,1-9,4
Al2O3 4,3-0
Slags 1-0
Na2SO4 Additives
0,3-0
C 0,01-0
ZnSeO3 Dyes
0,002-0
Fe2O3 5,8-0
White cullet
38,6-0
Green cullet 2,6-0
The specification of the raw materials
(Table 1) depends on the glass to be produced,
but also on the furnace to be fed. In the present
study, oven 3 was used to produce white glass
during the article in study manufacturing
campaigns. The material used have different
functions[2][3]:
- Formers, they confer vitreous structure, being
a classic example the Silicon Oxide (Tf -
1723ºC), present in the sand.
- Fluxes, composed of Sodium Oxide and
Potassium Carbonate have the purpose of
lowering the melting temperature of the glass.
- Stabilizers, contribute in stabilizing the
vitreous mass, after its fusion. So Calcium
Oxide and Aluminum Oxide are added to
enhance the chemical stability of the glass.
Slags are materials resulting from the contact of
the raw material with the refractories of the
furnace. These are used to make the process
profitable.
- Additives, composed of fine carbon and
Sodium Sulphate favor the elimination of
dissolved gases (NOx, SO2, CO2 e CO) in the
vitreous mass, which cause nonconformities of
the final product.
Broken glass, called a cullet, is added to reduce
the melting temperature of the mixture, thus
reducing energy consumption.
It should be noted that the ensilage zone
operates continuously and the furnace can’t
stop unless the material to be vitrified solidifies.
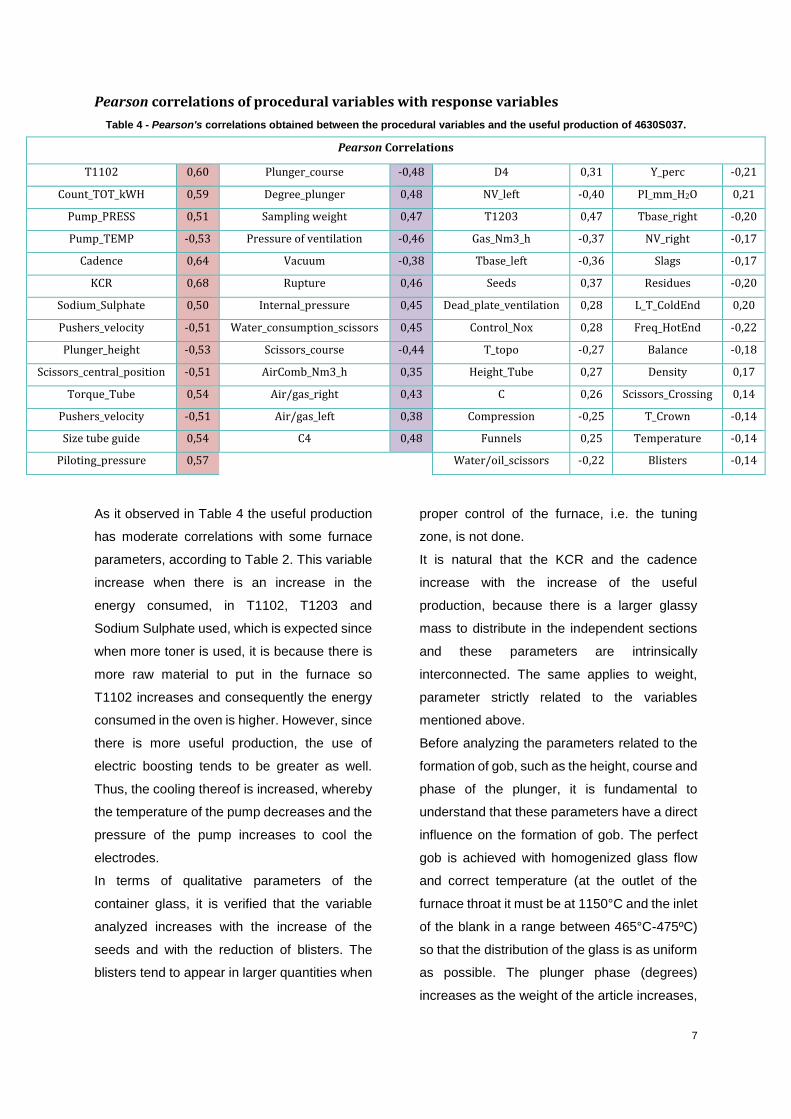
Fusion zone
The furnace is regenerative [3][4], powered by
natural gas and air and is boosted by electric
power which contributes 40% to the melting
zone and 60% to the tuning zone.
It is composed of several different parts [5], as
is explained in where there is:
- Recuperator/Regenerator: formed with several
refractory parts, such as a beehive comb, with
several and is heated by the passage of flue
gases. At regular intervals (20-30 minutes -
called the inversion time) the burn is cut off and
the regeneration chamber becomes the
combustion air duct.
- Melting zone: where the reactions of
transformation (dissolution, decarbonation,
among others) of the raw materials take place.
- Tuning zone: responsible for the elimination of
the dissolved gases through the addition of
additives and the existence of bubblers.
- Working tank: responsible for homogenizing
the vitreous mass through influence of
promoted temperature. It serves as a
connection to the glass distribution channels,
forehearths.
4
Figure 4 - Regenerative Furnace Scheme.
It is essential that there is a balance between
the residence time of the glass mass and the
convex forces of the furnace for the thermo-
chemical homogenization of the furnace,
without the existence of a blisters or blasts, for
the final product to conform.
Fabrication zone
Figure 5 - Flow diagram of the glass along the
manufacturing zone.
This, next to the zone of the furnace, is one of
the hottest zones of the process (Figure 5). It is
here that the molten vitreous mass passes
through the conditioning channel, forehearth,
where the glass leaves the furnace throat at
around 1150°C [6] and is consequently heated
/cooled to reach the conditioning zone, which
feeds the glass, through the feeder, to IS
machines (independent section machines).
The feeder consists of a combination of the
refractory tube that is located at a certain height
that rotates at a certain speed and in clock wise
direction that allows the flow of the glass to be
homogenized [7]. With the aid of a plunger the
glass is pushed down and the vitreous gob
drops vertically into the distribution channels [2]
[3]. The distribution channel is lubricated with
water and oil to reduce friction (as shown in
Figure 6).
Figure 6 – Feeder mechanism.
The glass drop is therefore deflected to the
blank section of the IS machines. The process
used for its formation is Blow-Blow, in which the
blank provides an outline to the final product as
well as forming the shell thereof, providing
adequate heat transfer from the glass to the
mold to ensure a certain viscosity [8]. The finish
mold as the name itself, contributes to the final
printing of the packaging. The glass containers
after the exit of IS machines undergo a hot
surface treatment to guarantee their mechanical
resistance.
Cold zone
After deposition of the hot end, the
glass containers are subjected to the relief of
stresses by annealing lasting no longer than 30
minutes. Then is applied cold end treatment to
improve the strength of glass containers and
reduce scratches and cracks during filling and
transport. Finally, the glass containers pass
through inspection machines that allow the
selection of the bottles according to the desired
specification.
Statistical analysis of process of production of
glass containers
It was verified that several studies related to
glass were made. Statistical tools, such as R,
which is a programming language as well as an

5
integrated development environment for
statistical and graphical calculations, like SPSS
was used in the analysis multivariate data,
aiming to classify sites from medieval glass
samples [9]. The origin of glass has been
established through Pearson correlations [10]
that provide the linear relationship between
several constituents of glass composition. The
𝑟12 (Pearson coefficient) can take values
between -1 (meaning that if one variable
decreases, the related one increases and vice-
versa) and +1 (meaning that if one variable
increases, the related one increases too),
whose interpretation of the values is explained
in Table 2.
Table 2 - Classification of the force between the
Pearson correlation values.
𝒓𝟏𝟐 Correlation strength
|0,9|- |1| Very strong
|0,9|- |0,7| Strong
|0,7|- |0,5| Moderate
|0,5|- |0,3| Weak
|0,3|- |0| Negligible
It has been pointed out that several
glass-related modeling studies have already
been carried out, within which are the projects
related to heat transfer to simulate the behavior
of the raw materials in the melting and refining
zone, based on CFD (Computational Fluid
Dynamics) [11][12]; optimizing of the reaction
zone and simplification of hydrodynamics using
CFD.
However the literature did not reveal any project
that was related to a global review of the glass
manufacturing process, from a statistical point
of view. On the other hand, no preferential
analysis was also performed on the variables
that need constant monitoring so that there is no
specific type of defects or greater quantity of
articles produced.
After establishing correlations between
procedural variables and responses, a
mathematical modeling was performed using
linear and logistic regressions in SPSS[10].
4. Results
Choice of procedural variables for input in
SPSS
The procedural variables collected were
obtained through several documents provided
by the different areas such as those of the
furnace, the manufacturing and the cold zone. It
should be noted that the fabrics of the main
glass bottle, 4630S037 of 0.7 cL, are diverse
and summarize a total of 241 days of
manufacture, starting from 22-7-2015 until 8-1-
2018. The last manufacture of this bottle, from
1-3-2018 to 15-3-2018 was used as predictive
validation of the models obtained in regression
analysis.
When the variables of the manufacturing
process were surveyed, it was found that the
registration of all the days of manufacture was
not always verified. A screening was done,
where variables were found that lack record of
observations or that are always constant, thus
not having any variability. It should be
considered that it is necessary to have between
10 and 20 observations for each analyzed
variable so that the statistical inference is
significant. Some furnace temperatures lacked
a constant register. On the other hand, the
same was observed with the gaseous emission
control variables, which are indicative of the
combustion quality in the furnace. The time of
gob drop in the distributors also lacks the record
history. The blank, final mold and counterblow
temperatures have a small number of registers
(81 observations recorded over 241 days of
manufacture analyzed) which precludes their
analysis, although it is known that they play a
key role in the distribution of the glass. In

6
addition to the recording of tool temperatures,
the glass drop conditioners are also missing,
namely their speed, length and diameter. It is
known that gob must be as short and fat as
possible, cylindrically with rounded tips, having
a relationship between its length and diameter
of 2.8. The forehearth temperatures also have
missing records, where in 241 days of
manufacture, there are only 66 observations,
again an insufficient number of observations for
analysis to be possible.
The variables are arranged in the order of the
procedural zones, in which the oven variables
are initially presented and finally the ones that
are used in the cold zone. The furnace variables
relate to the different impending temperatures,
the energy consumption and the raw materials
used. It also includes some quality variables.
Several variables related to the tool used in the
I.S. machines, which have a direct influence on
the formation of gob, are considered
Some of the variables presented here have
multicollinearity, that is, they are dependent on
each other, with a correlation force greater than
|0.8|. These cannot be embedded in the
regression models.
Table 3 - Variables included in the statistical analysis of the 4630S037 bottle of 0.7 cL
Included
T1102 SP_NN Pump_PRESS Plunger_course Balance
T1203 PV_NN Pump_TEMP Plunger_height Compression
T_Wall NV Control_NOx Degree_plunger Parison_cooling
T_Crown Inversion % Raw materail Scissors_Crossing Final_blow
T_Top Cullet_perc Sampling weight Scissors_course Piloting_pressure
T_Base Pull Density Water_consumption_scissors Internal_pressure
PI_mm_H2O Positions of boosting Seeds Water_pressure_scissors High_air_pressure
EPI_perc Pot_AB / Pot_CD Blisters Scissors_cut_time Low_air_pressure
EPI_N Pot_tot Blisters/kg Scissors_initial_position Pushers_velocity
Gas_ Nm3_h VOLTS_AB/VOLTS_CD Dom Scissors_central_position Freq_HotEnd
Gas_perc AMPS_AB/AMPS_CD Shine_perc Water/oil_scissors T_Hotte
Gast_PresBar VOLTS_TA a VOLTS_TD Purity_S_perc Machine ventilation L_T_ColdEnd
AirComb_Nm3_h Rotations_AB/Rotations_CD X_Perc Pressure of ventilation C_T_ColdEnd
AirComb_of_perc OIL_T Y_Perc Temperature R_T_ColdEnd
AirComb_Ventilador_N Count_kW_Day Height_Tube Dead_plate_ventilation ColdEnd_degree_L
Air_Gas Count_TOT_kWH Torque_Tube Vacuum ColdEnd_degree_C
Manual Reading of glass Pump_N Velocity_Tube Rupture ColdEnd_degree_R
7
Pearson correlations of procedural variables with response variables
Table 4 - Pearson's correlations obtained between the procedural variables and the useful production of 4630S037.
Pearson Correlations
T1102 0,60 Plunger_course -0,48 D4 0,31 Y_perc -0,21
Count_TOT_kWH 0,59 Degree_plunger 0,48 NV_left -0,40 PI_mm_H2O 0,21
Pump_PRESS 0,51 Sampling weight 0,47 T1203 0,47 Tbase_right -0,20
Pump_TEMP -0,53 Pressure of ventilation -0,46 Gas_Nm3_h -0,37 NV_right -0,17
Cadence 0,64 Vacuum -0,38 Tbase_left -0,36 Slags -0,17
KCR 0,68 Rupture 0,46 Seeds 0,37 Residues -0,20
Sodium_Sulphate 0,50 Internal_pressure 0,45 Dead_plate_ventilation 0,28 L_T_ColdEnd 0,20
Pushers_velocity -0,51 Water_consumption_scissors 0,45 Control_Nox 0,28 Freq_HotEnd -0,22
Plunger_height -0,53 Scissors_course -0,44 T_topo -0,27 Balance -0,18
Scissors_central_position -0,51 AirComb_Nm3_h 0,35 Height_Tube 0,27 Density 0,17
Torque_Tube 0,54 Air/gas_right 0,43 C 0,26 Scissors_Crossing 0,14
Pushers_velocity -0,51 Air/gas_left 0,38 Compression -0,25 T_Crown -0,14
Size tube guide 0,54 C4 0,48 Funnels 0,25 Temperature -0,14
Piloting_pressure 0,57 Water/oil_scissors -0,22 Blisters -0,14
As it observed in Table 4 the useful production
has moderate correlations with some furnace
parameters, according to Table 2. This variable
increase when there is an increase in the
energy consumed, in T1102, T1203 and
Sodium Sulphate used, which is expected since
when more toner is used, it is because there is
more raw material to put in the furnace so
T1102 increases and consequently the energy
consumed in the oven is higher. However, since
there is more useful production, the use of
electric boosting tends to be greater as well.
Thus, the cooling thereof is increased, whereby
the temperature of the pump decreases and the
pressure of the pump increases to cool the
electrodes.
In terms of qualitative parameters of the
container glass, it is verified that the variable
analyzed increases with the increase of the
seeds and with the reduction of blisters. The
blisters tend to appear in larger quantities when
proper control of the furnace, i.e. the tuning
zone, is not done.
It is natural that the KCR and the cadence
increase with the increase of the useful
production, because there is a larger glassy
mass to distribute in the independent sections
and these parameters are intrinsically
interconnected. The same applies to weight,
parameter strictly related to the variables
mentioned above.
Before analyzing the parameters related to the
formation of gob, such as the height, course and
phase of the plunger, it is fundamental to
understand that these parameters have a direct
influence on the formation of gob. The perfect
gob is achieved with homogenized glass flow
and correct temperature (at the outlet of the
furnace throat it must be at 1150°C and the inlet
of the blank in a range between 465°C-475ºC)
so that the distribution of the glass is as uniform
as possible. The plunger phase (degrees)
increases as the weight of the article increases,
8
as its length also increases. If the length of the
drop increases, the plunger height is
decreased, so the correlation here is negative
and correct. The stroke of the plunger
decreases with increasing pull (consequent
increase in useful production), thus there is
variation in the weight of the drop or the
cadence of the machine. It is necessary to
ensure the ratio between length and diameter of
2.8 to have the perfect gob. It should be noted
that no correlation is established between the
conditioning variables of the glass and the
subsequent temperatures in the different
sections of the glass forming machine, which
has a negative effect on the results mentioned
herein. The above parameters are critical in the
amount of glass injected, which interconnects
directly with the temperature variations in the
forehearth. It is highly recommended to the
factory register these variables every day.
Considering the variables related to the cut of
the gob, it is possible to examine that the
amount of useful production increases when
these decrease both its course and its central
position, that is, when its opening has a lower
value. This relationship is obvious given that
when there is more quantity to be produced, the
higher the speed of the machine, and therefore,
the faster the movement of the cutting of the
scissors. The water consumption in the scissors
increases, as observed by the moderate
correlation, which is predictable since with the
increase of the useful production also increases
the need of quantity of water to lubricate the
same ones. The ratio of water/oil used in the
scissors, in order to decrease the existing
friction and to correctly guide the glass gob,
decreases with increasing useful production.
This relationship is spurious because when
more glass is produced, a greater fraction of
lubricating agents is required.
The linear associations obtained in Table 5 are
similar to those of the useful production,
however there are differences in the strength of
the correlation force. The relationships
established here are still stronger, that is, the
ones that are common that were moderate
became strong and the weak ones became
moderate.
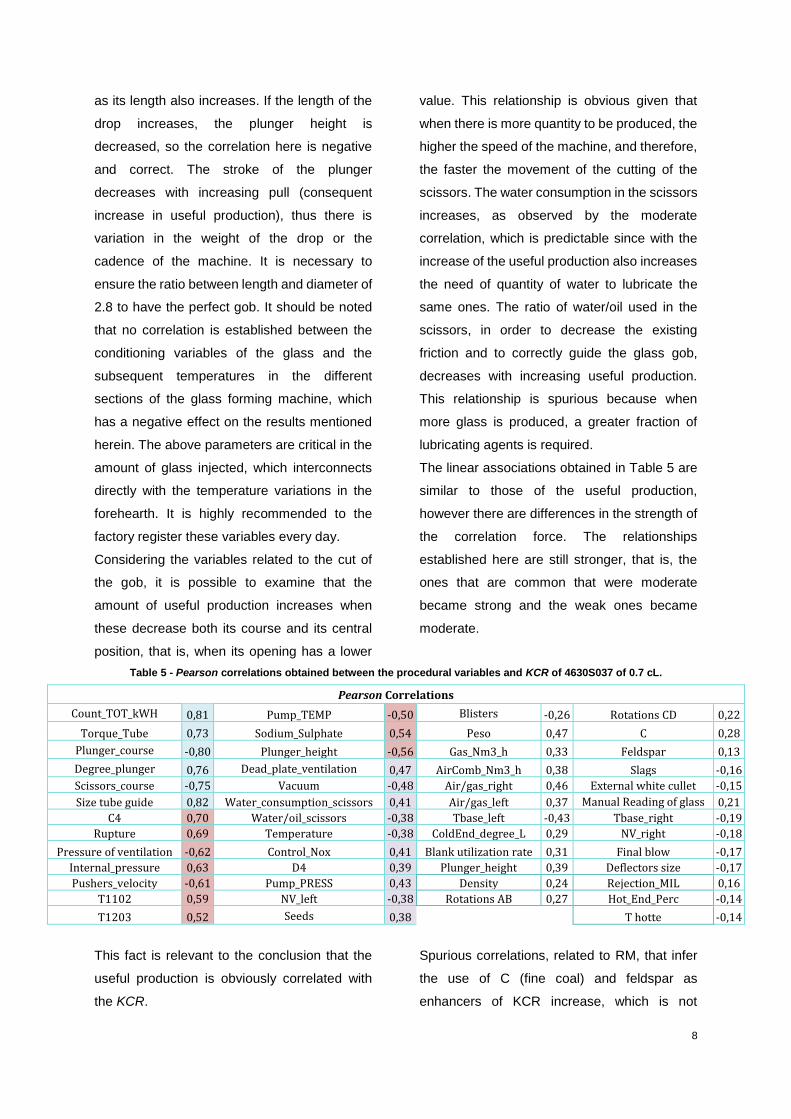
Table 5 - Pearson correlations obtained between the procedural variables and KCR of 4630S037 of 0.7 cL.
Pearson Correlations
Count_TOT_kWH 0,81 Pump_TEMP -0,50 Blisters -0,26 Rotations CD 0,22
Torque_Tube 0,73 Sodium_Sulphate 0,54 Peso 0,47 C 0,28
Plunger_course -0,80 Plunger_height -0,56 Gas_Nm3_h 0,33 Feldspar 0,13
Degree_plunger 0,76 Dead_plate_ventilation 0,47 AirComb_Nm3_h 0,38 Slags -0,16
Scissors_course -0,75 Vacuum -0,48 Air/gas_right 0,46 External white cullet -0,15
Size tube guide 0,82 Water_consumption_scissors 0,41 Air/gas_left 0,37 Manual Reading of glass 0,21
C4 0,70 Water/oil_scissors -0,38 Tbase_left -0,43 Tbase_right -0,19
Rupture 0,69 Temperature -0,38 ColdEnd_degree_L 0,29 NV_right -0,18
Pressure of ventilation -0,62 Control_Nox 0,41 Blank utilization rate 0,31 Final blow -0,17
Internal_pressure 0,63 D4 0,39 Plunger_height 0,39 Deflectors size -0,17
Pushers_velocity -0,61 Pump_PRESS 0,43 Density 0,24 Rejection_MIL 0,16
T1102 0,59 NV_left -0,38 Rotations AB 0,27 Hot_End_Perc -0,14
T1203 0,52 Seeds 0,38 T hotte -0,14
This fact is relevant to the conclusion that the
useful production is obviously correlated with
the KCR.
Spurious correlations, related to RM, that infer
the use of C (fine coal) and feldspar as
enhancers of KCR increase, which is not
9
necessarily true. The same applies to the
rejection percentages on inspection machines,
which are contradictory and therefore
negligible.
.
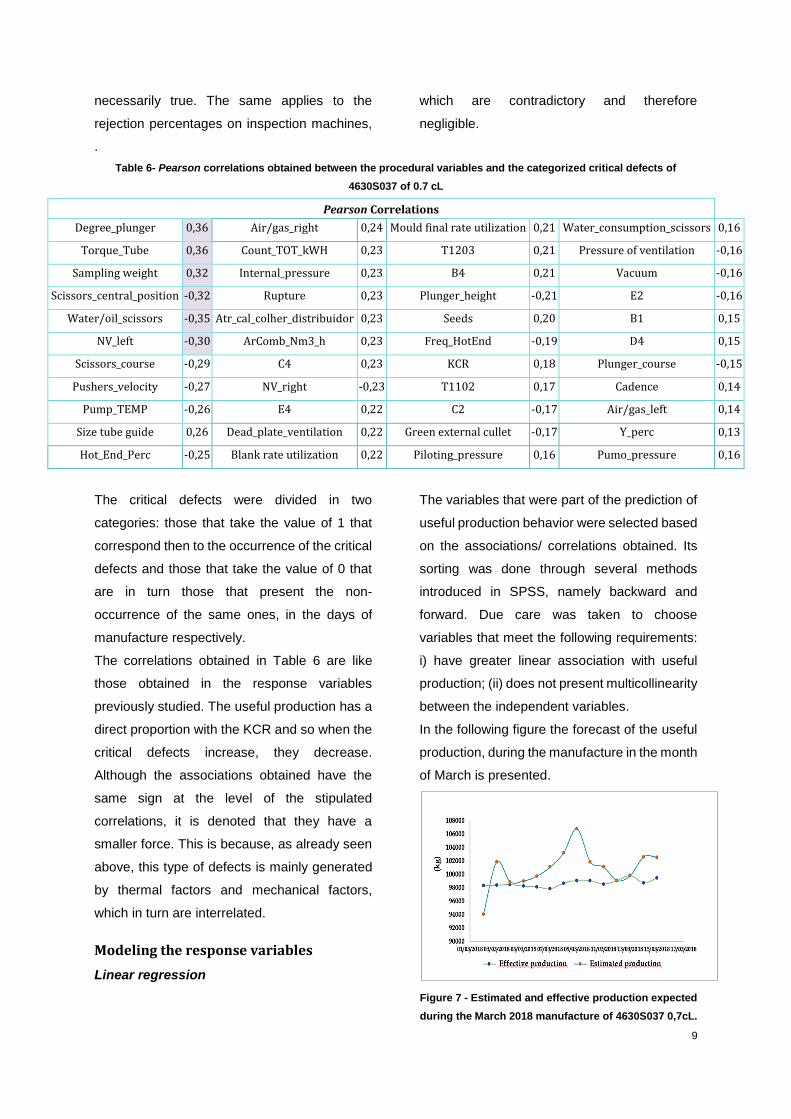
Table 6- Pearson correlations obtained between the procedural variables and the categorized critical defects of
4630S037 of 0.7 cL
Pearson Correlations
Degree_plunger 0,36 Air/gas_right 0,24 Mould final rate utilization 0,21 Water_consumption_scissors 0,16
Torque_Tube 0,36 Count_TOT_kWH 0,23 T1203 0,21 Pressure of ventilation -0,16
Sampling weight 0,32 Internal_pressure 0,23 B4 0,21 Vacuum -0,16
Scissors_central_position -0,32 Rupture 0,23 Plunger_height -0,21 E2 -0,16
Water/oil_scissors -0,35 Atr_cal_colher_distribuidor 0,23 Seeds 0,20 B1 0,15
NV_left -0,30 ArComb_Nm3_h 0,23 Freq_HotEnd -0,19 D4 0,15
Scissors_course -0,29 C4 0,23 KCR 0,18 Plunger_course -0,15
Pushers_velocity -0,27 NV_right -0,23 T1102 0,17 Cadence 0,14
Pump_TEMP -0,26 E4 0,22 C2 -0,17 Air/gas_left 0,14
Size tube guide 0,26 Dead_plate_ventilation 0,22 Green external cullet -0,17 Y_perc 0,13
Hot_End_Perc -0,25 Blank rate utilization 0,22 Piloting_pressure 0,16 Pumo_pressure 0,16
The critical defects were divided in two
categories: those that take the value of 1 that
correspond then to the occurrence of the critical
defects and those that take the value of 0 that
are in turn those that present the non-
occurrence of the same ones, in the days of
manufacture respectively.
The correlations obtained in Table 6 are like
those obtained in the response variables
previously studied. The useful production has a
direct proportion with the KCR and so when the
critical defects increase, they decrease.
Although the associations obtained have the
same sign at the level of the stipulated
correlations, it is denoted that they have a
smaller force. This is because, as already seen
above, this type of defects is mainly generated
by thermal factors and mechanical factors,
which in turn are interrelated.
Modeling the response variables
Linear regression
The variables that were part of the prediction of
useful production behavior were selected based
on the associations/ correlations obtained. Its
sorting was done through several methods
introduced in SPSS, namely backward and
forward. Due care was taken to choose
variables that meet the following requirements:
i) have greater linear association with useful
production; (ii) does not present multicollinearity
between the independent variables.
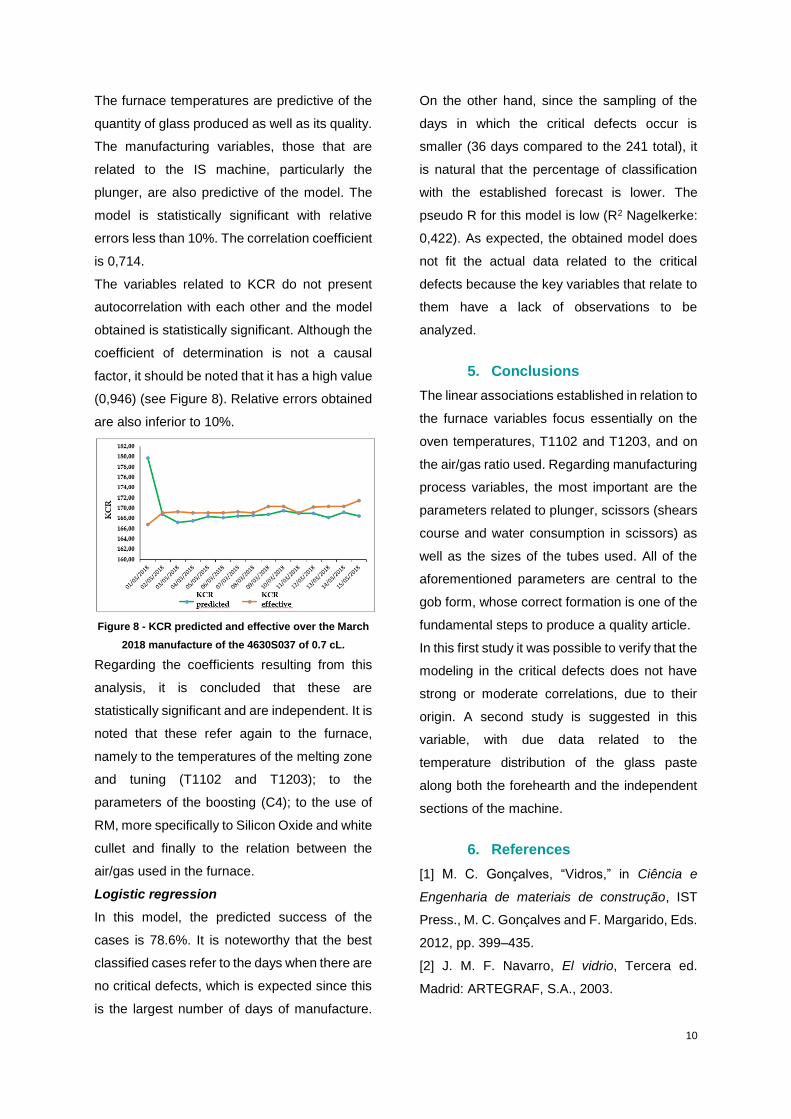
In the following figure the forecast of the useful
production, during the manufacture in the month
of March is presented.
Figure 7 - Estimated and effective production expected
during the March 2018 manufacture of 4630S037 0,7cL.
10
The furnace temperatures are predictive of the
quantity of glass produced as well as its quality.
The manufacturing variables, those that are
related to the IS machine, particularly the
plunger, are also predictive of the model. The
model is statistically significant with relative
errors less than 10%. The correlation coefficient
is 0,714.
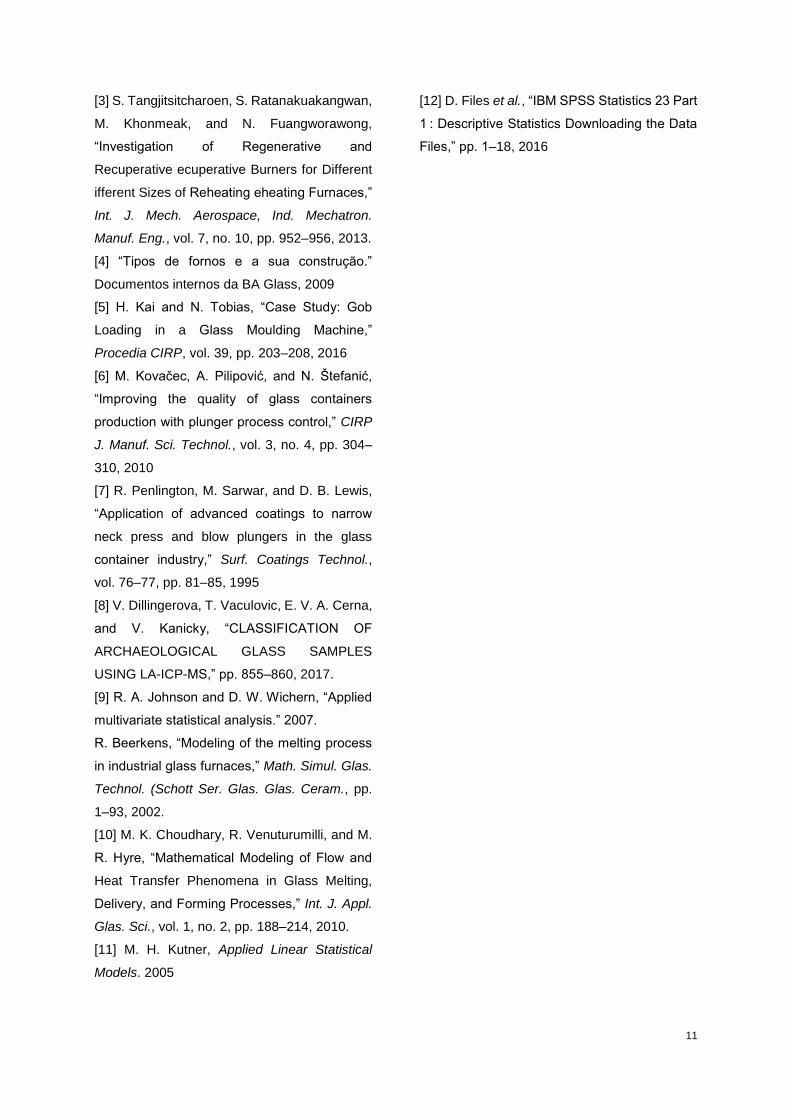
The variables related to KCR do not present
autocorrelation with each other and the model
obtained is statistically significant. Although the
coefficient of determination is not a causal
factor, it should be noted that it has a high value
(0,946) (see Figure 8). Relative errors obtained
are also inferior to 10%.
Figure 8 - KCR predicted and effective over the March
2018 manufacture of the 4630S037 of 0.7 cL.
Regarding the coefficients resulting from this
analysis, it is concluded that these are
statistically significant and are independent. It is
noted that these refer again to the furnace,
namely to the temperatures of the melting zone
and tuning (T1102 and T1203); to the
parameters of the boosting (C4); to the use of
RM, more specifically to Silicon Oxide and white
cullet and finally to the relation between the
air/gas used in the furnace.
Logistic regression
In this model, the predicted success of the
cases is 78.6%. It is noteworthy that the best
classified cases refer to the days when there are
no critical defects, which is expected since this
is the largest number of days of manufacture.
On the other hand, since the sampling of the
days in which the critical defects occur is
smaller (36 days compared to the 241 total), it
is natural that the percentage of classification
with the established forecast is lower. The
pseudo R for this model is low (R2 Nagelkerke:
0,422). As expected, the obtained model does
not fit the actual data related to the critical
defects because the key variables that relate to
them have a lack of observations to be
analyzed.
5. Conclusions
The linear associations established in relation to
the furnace variables focus essentially on the
oven temperatures, T1102 and T1203, and on
the air/gas ratio used. Regarding manufacturing
process variables, the most important are the
parameters related to plunger, scissors (shears
course and water consumption in scissors) as
well as the sizes of the tubes used. All of the
aforementioned parameters are central to the
gob form, whose correct formation is one of the
fundamental steps to produce a quality article.
In this first study it was possible to verify that the
modeling in the critical defects does not have
strong or moderate correlations, due to their
origin. A second study is suggested in this
variable, with due data related to the
temperature distribution of the glass paste
along both the forehearth and the independent
sections of the machine.
6. References
[1] M. C. Gonçalves, “Vidros,” in Ciência e
Engenharia de materiais de construção, IST
Press., M. C. Gonçalves and F. Margarido, Eds.
2012, pp. 399–435.
[2] J. M. F. Navarro, El vidrio, Tercera ed.
Madrid: ARTEGRAF, S.A., 2003.
11
[3] S. Tangjitsitcharoen, S. Ratanakuakangwan,
M. Khonmeak, and N. Fuangworawong,
“Investigation of Regenerative and
Recuperative ecuperative Burners for Different
ifferent Sizes of Reheating eheating Furnaces,”
Int. J. Mech. Aerospace, Ind. Mechatron.
Manuf. Eng., vol. 7, no. 10, pp. 952–956, 2013.
[4] “Tipos de fornos e a sua construção.”
Documentos internos da BA Glass, 2009
[5] H. Kai and N. Tobias, “Case Study: Gob
Loading in a Glass Moulding Machine,”
Procedia CIRP, vol. 39, pp. 203–208, 2016
[6] M. Kovačec, A. Pilipović, and N. Štefanić,
“Improving the quality of glass containers
production with plunger process control,” CIRP
J. Manuf. Sci. Technol., vol. 3, no. 4, pp. 304–
310, 2010
[7] R. Penlington, M. Sarwar, and D. B. Lewis,
“Application of advanced coatings to narrow
neck press and blow plungers in the glass
container industry,” Surf. Coatings Technol.,
vol. 76–77, pp. 81–85, 1995
[8] V. Dillingerova, T. Vaculovic, E. V. A. Cerna,
and V. Kanicky, “CLASSIFICATION OF
ARCHAEOLOGICAL GLASS SAMPLES
USING LA-ICP-MS,” pp. 855–860, 2017.
[9] R. A. Johnson and D. W. Wichern, “Applied
multivariate statistical analysis.” 2007.
R. Beerkens, “Modeling of the melting process
in industrial glass furnaces,” Math. Simul. Glas.
Technol. (Schott Ser. Glas. Glas. Ceram., pp.
1–93, 2002.
[10] M. K. Choudhary, R. Venuturumilli, and M.
R. Hyre, “Mathematical Modeling of Flow and
Heat Transfer Phenomena in Glass Melting,
Delivery, and Forming Processes,” Int. J. Appl.
Glas. Sci., vol. 1, no. 2, pp. 188–214, 2010.
[11] M. H. Kutner, Applied Linear Statistical
Models. 2005
[12] D. Files et al., “IBM SPSS Statistics 23 Part
1 : Descriptive Statistics Downloading the Data
Files,” pp. 1–18, 2016