Real time optimization of the sterilization process in a canning ...
7
REAL TIME OPTIMIZATION OF THE STERILIZATION PROCESS IN A CANNING INDUSTRY Carlos Vilas * (Bio)Process Engineering Group (IIM-CSIC), c/ Eduardo Cabello, 6, Vigo (Spain), [email protected] Antonio A. Alonso (Bio)Process Engineering Group (IIM-CSIC), c/ Eduardo Cabello, 6, Vigo (Spain), [email protected] Abstract Sterilization process is aimed to inactivate po- tentially harmful microorganisms. To that purpose the packaged food is subject to a time/temperature profile. In the canning industry such profiles are chosen based on the experience of the operator. In the presence of perturbations, such as steam supply problems, operators must re- act and design new profiles which, in most of the cases, are too conservative and/or may lead to the batch rejection, either because of quality or safety reasons. In order to overcome this problem, we propose in this work a model based real time optimiza- tion (RTO) strategy. The model, which describes the different relevant aspects of the plant (re- tort/can temperature, color dynamics, microor- ganism lethality, energy consumption, etc.) is used to predict the behavior of the system. Plant measurements are taken periodically and, in the event of a perturbation, an optimization proce- dure is run to compute a new time/temperature profile based on the past measurements. Keywords: Mathematical Modeling; Real Time Optimization; Sterilization of Packaged Foods; Food Safety; Food Quality. 1 INTRODUCTION The aim of the sterilization process is to inacti- vate microorganisms present in the product that might cause health problems upon consumption. Thermal sterilization of solid foodstuff consists of exposing the product to relatively high tempera- tures (around 110-130 ◦ C) during a given amount of time. Typical sterilization cycles consist of three stages: heating stage where the temperature increases from room temperature to a given set point; main- tenance stage where the set point temperature is kept during a given amount of time; and cooling stage aiming at rapidly decreasing product tem- perature so that cans can be handled and quality can be kept. Thermal sterilization process has several draw- backs: (i) it is a particularly demanding operation both in terms of energy consumption and process time; (ii) it adversely affects product quality (real or perceived) [11] since nutrients or sensory pa- rameters (color or texture for instance) are dete- riorated. In practice, industry operates using some pre- established profiles to carry out the sterilization. However, sterilization at industry levels is subject to unknown perturbations, such as deficiencies in the steam supply; scheduling problems, etc., that affect the process. Operators react to these per- turbations following some conservative recipes to ensure safety of the final product. However, this may have a large impact on the final product quality; energy consumption; or final processing time; leading, in some cases, to the rejection of the batch. Model based real time optimization RTO [4, 1] using current plant measurements allows for de- signing strategies to correct the presence of un- expected disturbances taking into account their effects on quality, process time and energy con- sumption. The aim of this work is to design a RTO strat- egy able to detect, using plant measurements, when a perturbation leads to food safety issues and, in such a case, compute a new optimal pro- file able to minimize the effects of such pertur- bation. The objective function considered com- bines energy consumption, food quality (under- stood as surface color) and process time. The rel- ative weight of these criteria can be modified by changing some parameters in the objective func- tion. Decision variables in the optimization block are heating and maintenance time as well as main- tenance temperature. The RTO profiles implemented in this work, con- sist of constant sterilization profiles due to legis- lation issues. However, larger improvement might be acquired if temperature set point is allowed to be modified during the sterilization (variable re- tort temperature, VRT) [12, 5, 6, 1]. The manuscript is structured as follows: first we Actas de las XXXIX Jornadas de Automática, Badajoz, 5-7 de Septiembre de 2018 657 https://doi.org/10.17979/spudc.9788497497565.0657
-
Upload
khangminh22 -
Category
Documents
-
view
0 -
download
0
Transcript of Real time optimization of the sterilization process in a canning ...

REAL TIME OPTIMIZATION OF THE STERILIZATIONPROCESS IN A CANNING INDUSTRY
Carlos Vilas∗
(Bio)Process Engineering Group (IIM-CSIC), c/ Eduardo Cabello, 6, Vigo (Spain), [email protected]
Antonio A. Alonso(Bio)Process Engineering Group (IIM-CSIC), c/ Eduardo Cabello, 6, Vigo (Spain), [email protected]
Abstract
Sterilization process is aimed to inactivate po-tentially harmful microorganisms. To thatpurpose the packaged food is subject to atime/temperature profile. In the canning industrysuch profiles are chosen based on the experienceof the operator. In the presence of perturbations,such as steam supply problems, operators must re-act and design new profiles which, in most of thecases, are too conservative and/or may lead to thebatch rejection, either because of quality or safetyreasons.
In order to overcome this problem, we proposein this work a model based real time optimiza-tion (RTO) strategy. The model, which describesthe different relevant aspects of the plant (re-tort/can temperature, color dynamics, microor-ganism lethality, energy consumption, etc.) isused to predict the behavior of the system. Plantmeasurements are taken periodically and, in theevent of a perturbation, an optimization proce-dure is run to compute a new time/temperatureprofile based on the past measurements.
Keywords: Mathematical Modeling; Real TimeOptimization; Sterilization of Packaged Foods;Food Safety; Food Quality.
1 INTRODUCTION
The aim of the sterilization process is to inacti-vate microorganisms present in the product thatmight cause health problems upon consumption.Thermal sterilization of solid foodstuff consists ofexposing the product to relatively high tempera-tures (around 110-130 ◦C) during a given amountof time.
Typical sterilization cycles consist of three stages:heating stage where the temperature increasesfrom room temperature to a given set point; main-tenance stage where the set point temperature iskept during a given amount of time; and coolingstage aiming at rapidly decreasing product tem-perature so that cans can be handled and qualitycan be kept.
Thermal sterilization process has several draw-backs: (i) it is a particularly demanding operationboth in terms of energy consumption and processtime; (ii) it adversely affects product quality (realor perceived) [11] since nutrients or sensory pa-rameters (color or texture for instance) are dete-riorated.
In practice, industry operates using some pre-established profiles to carry out the sterilization.However, sterilization at industry levels is subjectto unknown perturbations, such as deficiencies inthe steam supply; scheduling problems, etc., thataffect the process. Operators react to these per-turbations following some conservative recipes toensure safety of the final product. However, thismay have a large impact on the final productquality; energy consumption; or final processingtime; leading, in some cases, to the rejection ofthe batch.
Model based real time optimization RTO [4, 1]using current plant measurements allows for de-signing strategies to correct the presence of un-expected disturbances taking into account theireffects on quality, process time and energy con-sumption.
The aim of this work is to design a RTO strat-egy able to detect, using plant measurements,when a perturbation leads to food safety issuesand, in such a case, compute a new optimal pro-file able to minimize the effects of such pertur-bation. The objective function considered com-bines energy consumption, food quality (under-stood as surface color) and process time. The rel-ative weight of these criteria can be modified bychanging some parameters in the objective func-tion. Decision variables in the optimization blockare heating and maintenance time as well as main-tenance temperature.
The RTO profiles implemented in this work, con-sist of constant sterilization profiles due to legis-lation issues. However, larger improvement mightbe acquired if temperature set point is allowed tobe modified during the sterilization (variable re-tort temperature, VRT) [12, 5, 6, 1].
The manuscript is structured as follows: first we
Actas de las XXXIX Jornadas de Automática, Badajoz, 5-7 de Septiembre de 2018
657
https://doi.org/10.17979/spudc.9788497497565.0657
briefly describe the sterilization process carriedout in the considered canning plant and illustratethe problems caused by service steam issues. Thenwe develop the mathematical model describing thedynamics of the plant and we briefly state theRTO problem. Finally, we present the main re-sults of the work.
2 THE STERILIZATIONPROCESS
In the case considered in this work, superheatedwater is used to increase the temperature of thefood packaged products as shown in Figure 1.Such water is heated using a plate heat exchanger
Steam
RecycledWater
Plate heatexchanger
Cans
Hot watershowers
Sterilizer
Coldwater
Figure 1: Sterilizer unit with plate heat exchanger.
(PHE). At the beginning of the process preheatedwater (≈ 60 ◦C) is introduced into the sterilizerand recycled to the PHE. As the process evolveswater temperature in the retort increases until itreaches the operation point (typically a tempera-ture between 110 and 130 ◦C). Such temperatureis kept for a given amount of time after which thesteam valve in the PHE is closed and cold wateris introduced to cool down the cans.
At the end of the process microorganism lethalityat the coldest point must be above a given value(typically 8 min).
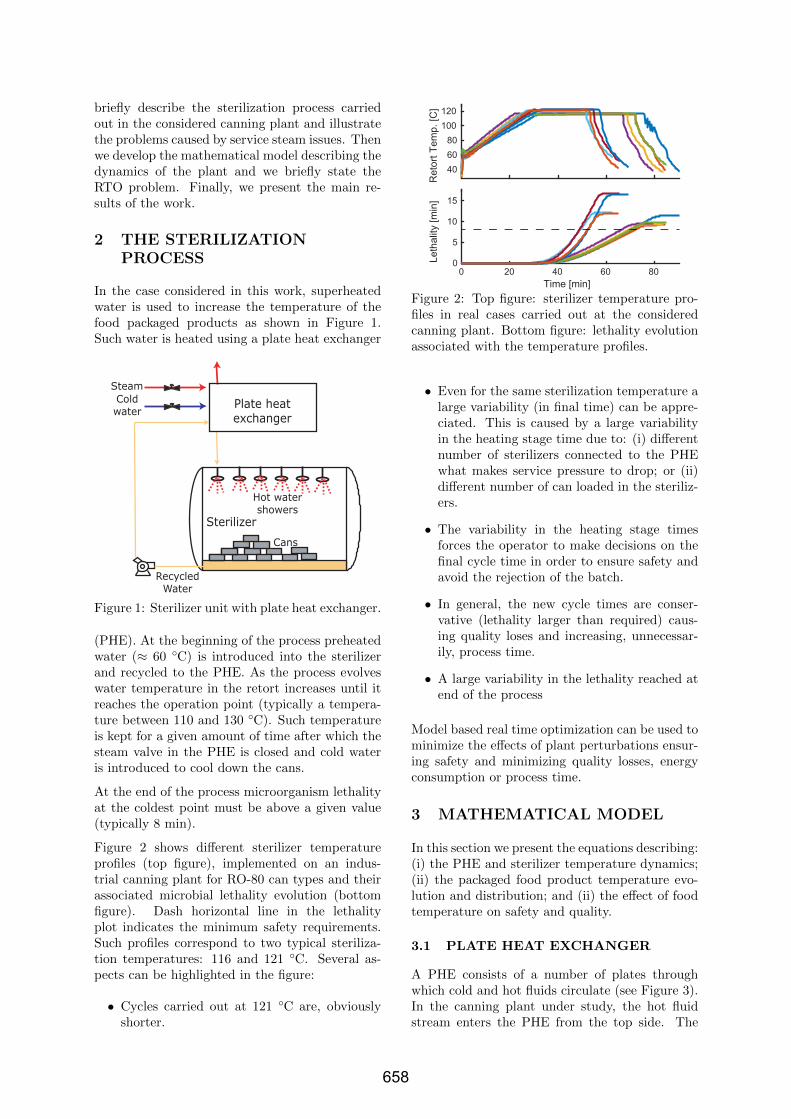
Figure 2 shows different sterilizer temperatureprofiles (top figure), implemented on an indus-trial canning plant for RO-80 can types and theirassociated microbial lethality evolution (bottomfigure). Dash horizontal line in the lethalityplot indicates the minimum safety requirements.Such profiles correspond to two typical steriliza-tion temperatures: 116 and 121 ◦C. Several as-pects can be highlighted in the figure:
• Cycles carried out at 121 ◦C are, obviouslyshorter.
406080
100120
Ret
ort T
emp.
[C]
0 20 40 60 80Time [min]
0
5
10
15
Leth
ality
[min
]
Figure 2: Top figure: sterilizer temperature pro-files in real cases carried out at the consideredcanning plant. Bottom figure: lethality evolutionassociated with the temperature profiles.
• Even for the same sterilization temperature alarge variability (in final time) can be appre-ciated. This is caused by a large variabilityin the heating stage time due to: (i) differentnumber of sterilizers connected to the PHEwhat makes service pressure to drop; or (ii)different number of can loaded in the steriliz-ers.
• The variability in the heating stage timesforces the operator to make decisions on thefinal cycle time in order to ensure safety andavoid the rejection of the batch.
• In general, the new cycle times are conser-vative (lethality larger than required) caus-ing quality loses and increasing, unnecessar-ily, process time.
• A large variability in the lethality reached atend of the process
Model based real time optimization can be used tominimize the effects of plant perturbations ensur-ing safety and minimizing quality losses, energyconsumption or process time.
3 MATHEMATICAL MODEL
In this section we present the equations describing:(i) the PHE and sterilizer temperature dynamics;(ii) the packaged food product temperature evo-lution and distribution; and (ii) the effect of foodtemperature on safety and quality.
3.1 PLATE HEAT EXCHANGER
A PHE consists of a number of plates throughwhich cold and hot fluids circulate (see Figure 3).In the canning plant under study, the hot fluidstream enters the PHE from the top side. The
658

w,1 s,1s,2s,iw,iw,N-1s,N
s,0
w,R
Figure 3: Sterilizer unit with plate heat exchanger.
system allows the entrance of hot fluid every otherplate. Once the fluid reaches the end of the PHEit returns through a pipe located at the bottomof the system. The remaining plates correspondto the cold fluid which enters through the bottomand comes out through the top. Cold and hotfluids correspond to water and saturated steam,respectively.
PHE temperature dynamics are obtained throughan energy balance in each of the plates. Someassumptions are made:
• “Cold” water inlet stream temperature is thesame for all the plates.
• Steam inlet stream temperature is the samefor all the plates.
• The plate heat exchanger is well isolated, i.e.there are no heat loses.
• No phase change in the steam or waterstreams occurs.
• Fluid flow rate in all “cold” water plates isthe same.
• Fluid flow rate in all steam plates is the same.
For the sake of clarity, only the final set of partialdifferential equations are indicated here.
Equations for the plates containing cold water areof the form
mwcp,w∂Tw,i
∂t= −vwmwcp,w
∂Tw,i
∂z+ (1)
UAp (Ts,i − 2Tw,i + Tw,i+1)
with mw, vw and Tw,i being, respectively, themass, velocity and temperature of water in eachof the plates. cp,w is the specific heat of waterwhereas U and Ap are the heat transfer coefficientand the contact area between plates. Ts,i corre-sponds with the temperature of steam in each ofthe plates, which is computed by solving the fol-lowing set of partial differential equations:
ms,1cp,s,1∂Ts,1∂t
= −vs,1ms,1cp,s,1∂Ts,1∂z
+ (2)
UA (Tw,1 − Ts,1)
ms,icp,s,i∂Ts,i∂t
= −vs,ims,icp,s,i∂Ts,i∂z
+ (3)
UA (Tw,i−1 − 2Ts,i + Tw,i)
ms,Ncp,s,N∂Ts,N∂t
= −vs,Nms,Ncp,s,N∂Ts,N∂z
+
(4)UA (Tw,N−1 − Ts,N )
where ms,i, vs,i, and cp,s,i are, respectively, themass, velocity, and specific heat of steam in each ofthe plates. In this case, model parameters as wellas fluid flow characteristic allow us to approximatethe convection term by a finite differences schemewith two terms, i.e.:
∂Ts,i∂z
=Ts,i − Ts,0
Lp;
∂Tw,i
∂z=Tw,i − Tw,R
Lp
with Lp being the plate height. Ts,0 correspondswith the steam service temperature whereas Tw,R
is the recycle water temperature which is assumedto be the same as the temperature of the water inthe sterilizer.
3.2 THE STERILIZER
3.2.1 The sterilizer unit
A simple energy balance allows us obtaining theequation describing the evolution of the sterilizerwater temperature.
mw,Rcp,wdTw,R
dt= qwcp,w (Tw,PHE − Tw,R)−
(5)Qcan −Qamb
where Tw,PHE is the water temperature at theoutput of the PHE. Qcan is the heat absorbed bythe cans, whose form will be presented in the fol-lowing section. Sterilizers heat loses are computedas:
Qamb = hcAc (Tw,R − Tamb)
where Tamb, hc and Ac are the surrounding mediatemperature, heat transfer coefficient between thesterilizer and the surrounding media and the areaof the metal cover of the retort.
In order to maintain the set point temperaturea PID controller is installed in the canning plantconsidered. Such controller regulates the sterilizertemperature by modifying the entrance of steamin the PHE. In this regard, steam valve openingis computed as:
us,k = us,k−1 +Kp (ek − ek−1) +Ki∆tek+ (6)
Kd
∆t(ek − 2ek−1 + ek−2)
where ∆t is the time between two consecutivemeasurements and ek = Tw,R(tk) − T sp
w,R, with
T spw,R being the set point temperature.
659

3.2.2 Energy consumption
In order to compute the energy consumption weassume that heat can recovered at the output ofthe hot stream in the PHE. In this regard, heatconsumption is computed as the amount of heattransmitted from the steam to the water in thePHE. Mathematically this can be expressed as:
Ec =
∫ tf
0
qwcp,w (Tw,PHE(t)− Tw,R(t)) dt (7)
3.2.3 Packaged food product
The solid product to be sterilized is packed incylindrical RO-80 containers, although the proce-dure would be the same for other type of packages.We assume that the temperature of the retort isthe same in all the can surface. Under these con-ditions symmetry properties can be used to trans-form the original 3D problem into a 2D equiva-lent one (see Figure 4). As the package product is
r
z
Figure 4: Equivalence between the 3D and 2D spa-tial domains.
mostly solid, temperature distribution obeys theso-called Fourier equation for heat conduction incylindrical coordinates, i.e.:
ρpcp,p∂Tp∂t
= κ
[∂2Tp∂z2
+1
r
∂
∂r
(r∂Tp∂r
)](8)
where r and z are the cylindrical coordinates rep-resenting radius and length respectively. Tp(r, z, t)stands for product temperature, whereas ρp, cp,pand κ corresponded to product density, specificheat and thermal conductivity, respectively. Theequation is completed with (Robin-type) bound-ary conditions of the form:
κ
(∂Tp∂z
)z=L
= ht(TR − Tp|z=L
)(9)
κ
(∂Tp∂z
)z=0
= hb(TR − Tp|z=0
)(10)
κ
(∂Tp∂r
)r=R
= hr(TR − Tp|r=R
)(11)(
∂Tp∂r
)r=0
= 0 (12)
where hx, with x = t, b, r corresponds to the con-vective heat transfer coefficient between the prod-uct (top, bottom and right) boundaries and thewater from the showers.
We assume that all can in the sterilizer absorb thesame amount of heat which is, then, computed as[15]:
Qcan = ncmccp,cdTc,n
dtwhere
Tc,n =
∫VTp(r, z, t)dV
Vwith V being the volume of the can.
3.3 SAFETY AND QUALITYINDICATORS
Lethality at the cold point F0 is considered as thesafety indicator. Time evolution of this variableis described by a Thermal Death Time (TDT) ki-netic equation of the form [3]:
dF0
dt= 10
Tc(t)−TM,refzM,ref (13)
Parameters TM,ref and zM,ref correspond toClostridium botulinum bacteria [2] since, in sporeform, it is one of the most heat resistant bacteria.
TDT kinetics has been previously used to describesurface color evolution (Cs) (quality parameter)[2]. However, some experimental work showedthat, in this case, first order kinetics are more ac-curate, i.e.:
dCs
dt= −kArry; (14)
with
kArr = kref exp
[Ea
R
(1
Ts− 1
Tref
)]where kref is a reference constant at Tref . Ea andR denote, respectively the activation energy anduniversal gas constant. Ts is the temperature atthe surface of the food product.
Unknown model parameters were estimated fol-lowing the criteria in [14].
4 STERILIZATION PROCESSREAL TIME OPTIMIZATION
The scheme for real time optimization used in thiswork is schematically presented in Figure 5. First,a given set point for sterilizer temperature andprocess time is selected. The PID controller com-putes the steam valve openings (us) to reach andmaintain such temperature. Actual plant mea-surements (sterilizer temperature, Tw,R) are fedto the model which predicts the final lethality ofthe products accordingly. If lethality fulfills safetyrequirements, the profile is kept otherwise a newoptimal profile is computed by means of an opti-mization step taking into account available plantmeasurements.
660
PID
SterilizerPHE
us
Model
Tw,Rsp
Optimization
Safe?
NoTw,Rsp
Yes
F0
F , J0Tw,Rsp
Tw,R
Figure 5: Flow chart of the RTO scheme proposed.
In practice, options for optimization are limitedby law. New profiles, as for instance those usingvariable retort temperature (VRT), must be val-idated by food control agencies before they canbe implemented. Therefore, in this work, we willfocus on constant temperature profiles.
The optimization block will search for the con-trol profile, i.e. heating time and temperature ofthe maintenance stage (th, T
spw,R), that minimizes a
given objective function (J). In this work, J com-bines three variables: energy, surface color andprocess time:
Jth,T spw,R
= w1Ec + w2(100− C(tf )) + w3tf (15)
where w1, w2 and w3 are given weights which maychange depending on the primary objective of theoperator (saving energy, final product quality orsaving process time).
The minimization of J is carried out taking intoaccount the following constraints on the modelvariables and bounds on the decision variables:
1. F0(tf ) > 8 min.
2. Model equations (1)-(14).
3. 110 ◦C ≤ T spw,R ≤ 130 ◦C.
4. 0 min ≤ th ≤ 80 min
where tf and th are, respectively, final processtime and heating stage time.
In order to find the solution of this problem, ahybrid stochastic-deterministic method based onthe scatter search approach will be employed. Inparticular, the algorithm eSS (Enhanced ScatterSearch) [7] will be used. Note that the dynamicsof the sterilizer and PHE are explicitly consideredtherefore, the resulting profiles will be, by con-struction feasible.
Other type of objective functions and constraintscould be also considered in this methodology. Inthis regard, nutrient retention at the end of the
process, personnel costs, etc. could be taken intoaccount. On the other hand, quality could be con-sidered as a constraint instead of a variable to bemaximized.
Plant model mismatch is not considered in thiswork. However, the methodology described in [10]could be applied to such purpose.
5 RESULTS AND DISCUSSION
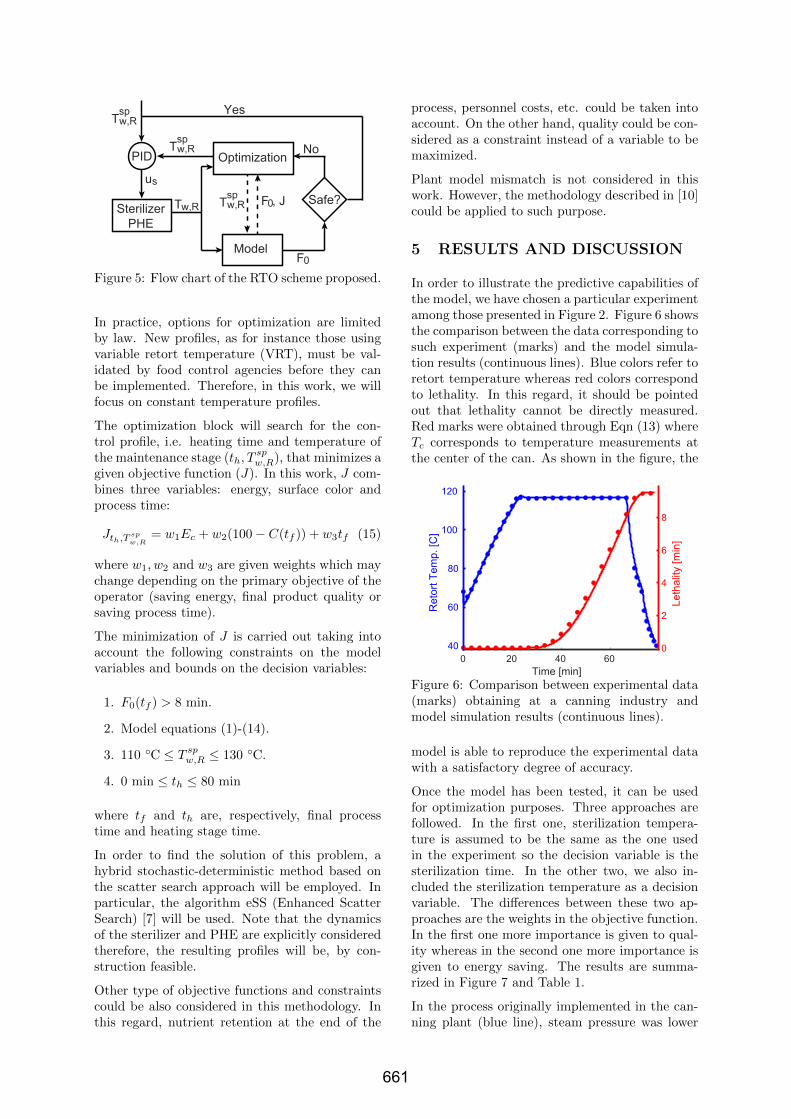
In order to illustrate the predictive capabilities ofthe model, we have chosen a particular experimentamong those presented in Figure 2. Figure 6 showsthe comparison between the data corresponding tosuch experiment (marks) and the model simula-tion results (continuous lines). Blue colors refer toretort temperature whereas red colors correspondto lethality. In this regard, it should be pointedout that lethality cannot be directly measured.Red marks were obtained through Eqn (13) whereTc corresponds to temperature measurements atthe center of the can. As shown in the figure, the
0 20 40 60Time [min]
40
60
80
100
120
Ret
ort T
emp.
[C]
0
2
4
6
8
Leth
ality
[min
]Figure 6: Comparison between experimental data(marks) obtaining at a canning industry andmodel simulation results (continuous lines).
model is able to reproduce the experimental datawith a satisfactory degree of accuracy.
Once the model has been tested, it can be usedfor optimization purposes. Three approaches arefollowed. In the first one, sterilization tempera-ture is assumed to be the same as the one usedin the experiment so the decision variable is thesterilization time. In the other two, we also in-cluded the sterilization temperature as a decisionvariable. The differences between these two ap-proaches are the weights in the objective function.In the first one more importance is given to qual-ity whereas in the second one more importance isgiven to energy saving. The results are summa-rized in Figure 7 and Table 1.
In the process originally implemented in the can-ning plant (blue line), steam pressure was lower
661

than expected causing the heating stage to belonger than predicted. In order to ensure safety,the operator decided to extend the maintenancestage with respect the original plan. The value of
40
60
80
100
120
Ret
ort T
emp.
[C]
0 20 40 60 80Time [min]
0
5
10
Leth
ality
[min
]
Exper.RTO1RTO2RTO3
Exper.RTO1RTO2RTO3
Figure 7: Comparison between a experiment car-ried out in a canning plant and three RTO pro-files. Top figure: retort temperature. Bottom fig-ure: lethality evolution. Horizontal dashed lineindicates the lethality constraint.
lethality reached at the end was 11.5 min and theduration of the cycle was 89 min. The productwas over-processed.
The RTO approach allowed detecting the steamservice problem so new profiles were computed.As shown in the Figure 7, in all RTO profiles fi-nal lethality was 8 min, i.e the value of the con-straint defined in the optimization problem. The
Table 1: Comparison between the optimizationschemes. Percentages of improvement are givenwith respect the profile originally implemented inthe canning plant. Negative values indicate worserperformance with respect such profile.
Percentage of improvementEnergy Color Time
RTO1 2.7 2.8 10.7RTO2 -5.7 8.0 30.0RTO3 1.3 5.7 21.1
first RTO profile (red line), improved the origi-nal profile in all senses. It allows reducing processtime in around 10 min saving energy and improv-ing surface color (see Table 1). The second RTOprofile (black line) is the most aggressive, main-tenance temperature was 127.6 ◦C. This profilewas, evidently, the shortest one (around 27 minshorter than the original profile). It was also ableto increase quality (color) by a 8.0 % although it isthe most energy consuming profile. Changing theweights in the objective function -Eqn. (15)- togive more importance to energy saving, resulted
into the third RTO profile (green line). This pro-file, with a maintenance temperature of 120.2 ◦C,also improves the process in all senses allowing toreduce cycle time in around 19 min.
Disturbances during the maintenance stage aremore unusual, however in such events the RTOscheme would also react and compute new profilespreventing the over-processing of the product.
Finally, as mentioned above, the RTO profiles im-plemented in this work, considered constant ster-ilization profiles. However, larger improvementmight be acquired using VRT. In such cases, theoptimal control problem can be approached byusing the control vector parametrization (CVP)method in which the solution is approximated bypiece-wise low order polynomials (see [9, 13, 8] fordetails). This allows converting the original prob-lem into a nonlinear programming problem (NLP)that may be solved using a global optimizer.
6 CONCLUSION
In this work we presented a methodology for mini-mizing the effects of unexpected disturbances dur-ing the sterilization process of a canning industry.We showed that in many cases product is over-processed as a result of conservative adjustmentsmade to counteract such disturbances and ensurefood safety.
The methodology consisted of using plant mea-surements and a mathematical model of the plantto detect when a perturbation will cause foodsafety problems. In such event, an optimizationstage is carried out (using plant measurements asan input) to recompute sterilization temperatureand time. This allowed us minimizing the effectsof the disturbance on food quality, energy con-sumption and process time.
Finally, we illustrated the benefits of such schemewith respect the classical procedure.
Acknowledgments
These results are part of the CoPro project whichhas received funding from the European Union’sHorizon 2020 research and innovation programmeunder grant agreement No 723575.
Referencias
[1] A. A. Alonso, A. Arias-Mendez, E. Balsa-Canto, M. R. Garcıa, J. I. Molina, C. Vi-las, and M. Villafın. Real time optimizationfor quality control of batch thermal steril-ization of prepackaged foods. Food Control,32(2):392–403, 2013.
662

[2] J. R. Banga, A. A. Alonso, J. Gallardo,and R. I. Perez-Martın. Kinetics of thermaldegradation of thiamine and surface colourin canned tuna. Z Lebensm Unters Forsch,197(2):127–131, 1993.
[3] A. Casp and J. Abril. Procesos de conser-vacion de alimentos. Tecnologıa de alimentos.Mundi-Prensa, 2003.
[4] M. Diehl, H. G. Bock, J. P. Schloder, R. Find-eisen, Z. Nagy, and F. Allgower. Real-timeoptimization and nonlinear model predictivecontrol of processes governed by differential-algebraic equations. Journal of Process Con-trol, 12(2):577–585, 2002.
[5] T. D. Durance. Improving canned foodquality with variable retort temperature pro-cesses. Trends in Food Science and Technol-ogy, 8(4):113–118, 1997.
[6] T. D. Durance, J. L. Dou, and J. Mazza.Selection of variable retort temperature pro-cesses for canned salmon. Journal of FoodProcess Engineering, 20(1):65–76, 1997.
[7] J. A. Egea, E. Vazquez, J. R. Banga, andR. Marti. Improved scatter search for theglobal optimization of computationally ex-pensive dynamic models. Journal of GlobalOptimization, 43(2–3):175–190, 2009.
[8] F. Fournier, M. Fikar, and M. A. Latifi. Con-trol vector parametrisation in optimal controlof a batch electrochemical reactor. Chemi-cal and Biochemical Engineering Quarterly,12(2):81–85, 1998.
[9] C. J. Goh and K. L. Teo. Control parameteri-zation: a unified approach to optimal controlproblems with general constraints. Automat-ica, 24:3–18, 1988.
[10] T. Rodrıguez-Blanco, D. Sarabia, J. L.Pitarch, and C. de Prada. Modifier adap-tation methodology based on transient andstatic measurements for rto to cope withstructural uncertainty. Computers & Chemi-cal Engineering, 106:480–500, 2017.
[11] A. A. Teixeira and G. S. Tucker. On-line re-tort control in thermal sterilization of cannedfoods. Food Control, 8:13–20, 1997.
[12] A. A. Teixeira, G. E. Zinsmeister, and J. W.Zahradnik. Computer simulation of variableretort control and container geometry as apossible means of improving thiamine reten-tion in thermally processed foods. Journal ofFood Science, 40(4):656–659, 1975.
[13] V. S. Vassiliadis, R. W. H. Sargent, andC. C. Pantelides. Soluion of a class ofmultistage dynamic optimization problems 2.problems with path constraints. Industrial &Engineering Chemistry Research, 33(9):2123–2133, 1994.
[14] C. Vilas, A. Arias-Mendez, M. R. Garcıa,A. A. Alonso, and E. Balsa-Canto. Towardspredictive food process models: A protocolfor parameter estimation. Critical Reviews inFood Science and Nutrition, 58(3):463–449,2018.
[15] C. Vilas, M. R. Garcıa, J. R. Banga, andA. A. Alonso. Desarrollo de una librerıade componentes en EcosimPro para la op-eracion de plantas de procesamiento termicode alimentos. Revista Iberoamericana de Au-tomatica e Informatica industrial, 5(1):51–65,2008.
c© 2018 by the authors.Submitted for possibleopen access publication
under the terms and conditions of the CreativeCommons Attribution CC-BY-NC 3.0 license(http://creativecommons.org/licenses/by-nc/3.0/).
663