Optimization Study - Akademia Baru
20
Journal of Advanced Research in Applied Mechanics ISSN (online): 2289-7895 | Vol. 6, No. 1. Pages 1-20, 2015 1 Penerbit Akademia Baru Performances of Automated Control System for Membrane Gas Absorption: Optimization Study A. R. Sunarti *,1,a and A. L. Ahmad 2,b 1 Faculty of Chemical and Natural Resources Engineering, Universiti Malaysia Pahang, 26300 Kuantan, Pahang, Malaysia. 2 School of Chemical Engineering, Engineering Campus, Universiti Sains Malaysia, 14300 Nibong Tebal, Seberang Perai Selatan, Pulau Pinang, Malaysia. a,* [email protected], b [email protected] Abstract – Membrane gas absorption (MGA) can overcome the major drawbacks of the processes that have been used commercially for the removal of CO2. Using produced thin film composite (TFC) membrane, performances of automated control system of MGA was optimized using central composite design (CCD) of Response Surface Methodology (RSM). ANOVA result showed that the temperature, concentration, velocity and flow rate of DEA played a significant role. The optimum DEA temperature was found at 50 o C, DEA concentration at 2M, velocity at 3770m/s and 80 ml/min of DEA flow rate with 0.90 of desirability. Copyright © 2015 Penerbit Akademia Baru - All rights reserved. Keywords: Membrane Gas Absorption, DEA, RSM 1.0 INTRODUCTION Membrane gas absorption (MGA) is a hybrid of membrane and solvent separation that seeks to exploit the advantages of both processes [1,2]. MGA involves the transfer of CO2 through a non-selective membrane before chemically absorption into a liquid absorbent. The polymeric membrane facilitates a controlled flow of gas into the solvent and provides high gas-liquid contact surface area. This physical separation of the liquid and gas flows eliminates foaming and channeling problems that can occur in classical solvent absorption processes. In MGA, polymer membrane is should from hydrophobic materials. Hydrophobic materials have little or no tendency to adsorb water and water tends to “bead” on their surfaces (i.e discrete droplets). Hydrophobic materials possess low surface tension values and lack active groups in their surface chemistry for formation of “hydrogen- bonds” with water [3]. Table 1 shows the hydrophobic materials and its surface tension. Lower the surface tension shows higher the hydrophobic character of the materials. Due to the enhanced greenhouse effect, MGA has been considered to be a promising alternative to conventional and potential large scale application technology for the recovery and removal of CO2 [4]. The various factors such as porosity, membrane dimension, liquid viscosity, chemical reaction on mass transfer in membrane [5-7] gave the impact for the MGA performance.
-
Upload
khangminh22 -
Category
Documents
-
view
7 -
download
0
Transcript of Optimization Study - Akademia Baru

Journal of Advanced Research in Applied Mechanics
ISSN (online): 2289-7895 | Vol. 6, No. 1. Pages 1-20, 2015
1
Penerbit
Akademia Baru
Performances of Automated Control System for
Membrane Gas Absorption: Optimization Study
A. R. Sunarti*,1,a and A. L. Ahmad2,b
1Faculty of Chemical and Natural Resources Engineering, Universiti Malaysia Pahang, 26300
Kuantan, Pahang, Malaysia. 2School of Chemical Engineering, Engineering Campus, Universiti Sains Malaysia, 14300
Nibong Tebal, Seberang Perai Selatan, Pulau Pinang, Malaysia. a,*[email protected], [email protected]
Abstract – Membrane gas absorption (MGA) can overcome the major drawbacks of the processes that
have been used commercially for the removal of CO2. Using produced thin film composite (TFC)
membrane, performances of automated control system of MGA was optimized using central composite
design (CCD) of Response Surface Methodology (RSM). ANOVA result showed that the temperature,
concentration, velocity and flow rate of DEA played a significant role. The optimum DEA temperature
was found at 50oC, DEA concentration at 2M, velocity at 3770m/s and 80 ml/min of DEA flow rate with
0.90 of desirability. Copyright © 2015 Penerbit Akademia Baru - All rights reserved.
Keywords: Membrane Gas Absorption, DEA, RSM
1.0 INTRODUCTION
Membrane gas absorption (MGA) is a hybrid of membrane and solvent separation that seeks
to exploit the advantages of both processes [1,2]. MGA involves the transfer of CO2 through a
non-selective membrane before chemically absorption into a liquid absorbent. The polymeric
membrane facilitates a controlled flow of gas into the solvent and provides high gas-liquid
contact surface area. This physical separation of the liquid and gas flows eliminates foaming
and channeling problems that can occur in classical solvent absorption processes.
In MGA, polymer membrane is should from hydrophobic materials. Hydrophobic materials
have little or no tendency to adsorb water and water tends to “bead” on their surfaces (i.e
discrete droplets). Hydrophobic materials possess low surface tension values and lack active
groups in their surface chemistry for formation of “hydrogen- bonds” with water [3]. Table 1
shows the hydrophobic materials and its surface tension. Lower the surface tension shows
higher the hydrophobic character of the materials.
Due to the enhanced greenhouse effect, MGA has been considered to be a promising alternative
to conventional and potential large scale application technology for the recovery and removal
of CO2 [4]. The various factors such as porosity, membrane dimension, liquid viscosity,
chemical reaction on mass transfer in membrane [5-7] gave the impact for the MGA
performance.

Journal of Advanced Research in Applied Mechanics
ISSN (online): 2289-7895 | Vol. 6, No. 1. Pages 1-20, 2015
2
Penerbit
Akademia Baru
Table 1: Hydrophobic materials level [3]
Chemical Name Surface Tension (dynes/cm)
Polytetrafluoroethylene
(Teflon*)
18
Polyvinyllidene fluoride
(PVDF)
25
Polypropylene 29
Polyethylene 31
Polystyrene 33
Amylopectin 35
Polyepichlorohydrin 35
Amylose 37
To develop a MGA system, the focus is not only on liquid absorption type but improving the
characteristic of membrane is also important. Table 2 is shown the MGA system performance
with selected several of liquid absorbents.
Table 2: MGA system performance with selected chemical as liquid absorbents.
Type of polymer
membrane
Module Liquid Absorbent Durability Reference
PP1 Hollow Fiber Aqueous NaOH and
DEA solution
poor [8]
PP1 Celgard X40-
200 and X50-
215, Hollow
Fiber
Aqueous DEA
solution
poor [9]
PP1 Hollow Fiber MEA Wetting after some
hours
[10]
PES2 coated with
PDMS3
Hollow Fiber MEA Wetting after 6
hours
[10]
PP1 coated with
PDMS3
Hollow Fiber MEA Wetting after 7
days
[10]
PTFE4 Hollow Fiber 5 M MEA More than 6600
hours
[11]
PP1 Hollow Fiber 2M DEA Over 3 months [5]
PP1= Polypropylene, PES2= Polyether Sulfone, PDMS3= polydimethylsiloxane (silicon
rubber), PTFE4= Polytetrafluoroethylene
Commercial MGA system are available on the market, however they tend to produce mass
transfer coefficients that are significantly lower than those obtained in modules that are

Journal of Advanced Research in Applied Mechanics
ISSN (online): 2289-7895 | Vol. 6, No. 1. Pages 1-20, 2015
3
Penerbit
Akademia Baru
carefully built by hand [12]. The poor performance of commercial modules had been attributed
to an uneven spacing of flat sheet membrane within the system, resulting in liquid channeling
[13]. Furthermore, the experimental analysis of commercial modules is limited because they
only have data sampling ports at the inlets and outlets. Hence, in this study, an automated
control system of MGA was designed and fabricated in-house for the purpose to enhance the
membrane performances. Performances of MGA were investigated based on selected operating
parameters. A CCD and RSM were used to identify the significant operating parameters and
developed a model to predict the response of the mass transfer rate of CO2.
2.0 METHODS/THEORY
2.1 Materials
Th in film composite (TFC) membranes were used. A 99% grade of diethanolamines (DEA)
were purchased from Merck (M) Sdn. Bhd. and were mixed with deionized water, respectively
to prepare aqueous liquid absorbents with desired concentrations (1M, 2M and 3M). The
properties of TFC membranes are listed in Table 3.
Table 3: Properties of TFC membrane
Properties
TFC membrane type PDMS based 0.1 µm PVDF membrane
Contact angle with water 130.2o
Contact angle with 1M of DEA 144.2o
Contact angle with 2M of DEA 138.1o
Contact angle with 3M of DEA 131.4o
2.2 Design of automated control system of MGA
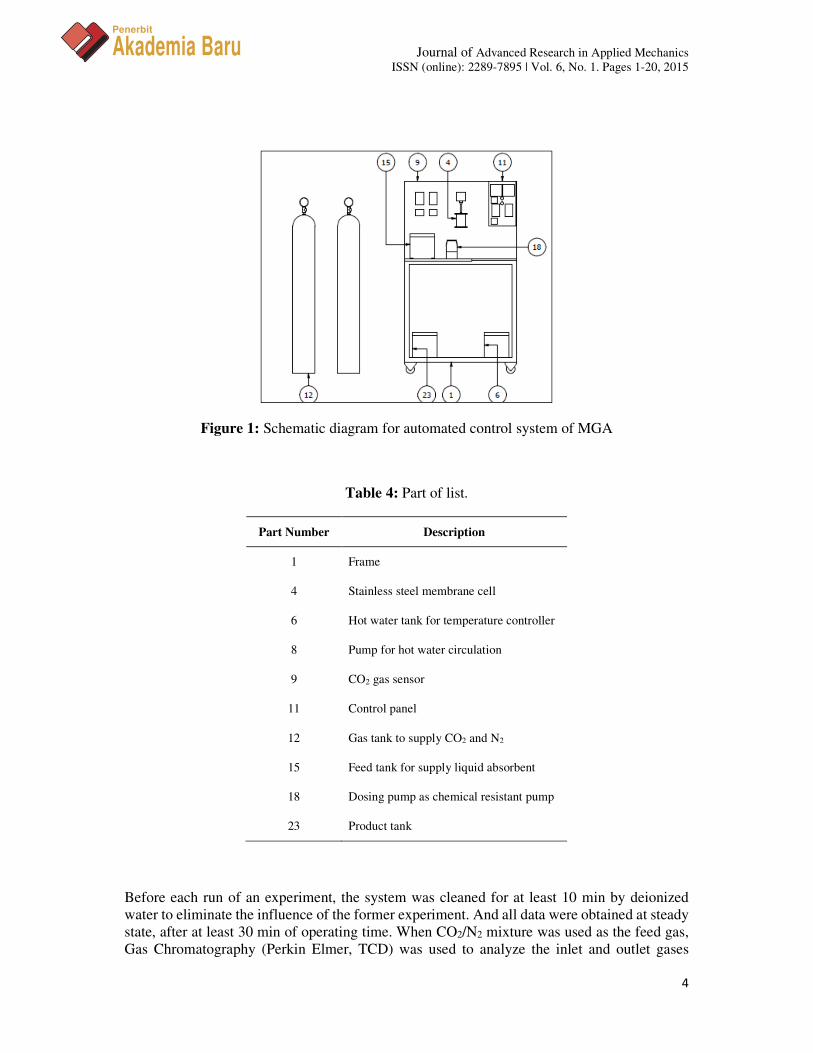
In this study, an automated control system of MGA was designed and fabricated in-house. The
schematic diagram for experimental setup is listed in Table 4 together part of shown in Figure
1.
The gas stream was passed through the upside of membrane cell and diffused through
membrane pores into the liquid absorbent. Here, supply pressure regulator was ranged 0 to 5
bars applied. Gas flow meters with digital display were applied which ranged 0 to 400 ml/min.
To detect CO2 flow, CO2 composition sensors was located before and after membrane cell for
determine the composition of CO2 which ranged 0- 20%. Two units of bourdon type pressure
gauges were attached to detect the CO2 and N2 at inlet which ranged 0 to 5 bars. 10 liters hot
water bath with centrifugal circulating pump and digital temperature controller (30-70oC) was
used to heat up the liquid absorbent. Rotameter was used to feed liquid absorbents. Three liters
stainless steel tank was provided as feed tank with liquid feed pump. Electrical control consoled
with indicator lamps, safety circuit and emergency cut out switch was allocated at control
panel.
Journal of Advanced Research in Applied Mechanics
ISSN (online): 2289-7895 | Vol. 6, No. 1. Pages 1-20, 2015
4
Penerbit
Akademia Baru
Figure 1: Schematic diagram for automated control system of MGA
Table 4: Part of list.
Part Number Description
1 Frame
4 Stainless steel membrane cell
6 Hot water tank for temperature controller
8 Pump for hot water circulation
9 CO2 gas sensor
11 Control panel
12 Gas tank to supply CO2 and N2
15 Feed tank for supply liquid absorbent
18 Dosing pump as chemical resistant pump
23 Product tank
Before each run of an experiment, the system was cleaned for at least 10 min by deionized
water to eliminate the influence of the former experiment. And all data were obtained at steady
state, after at least 30 min of operating time. When CO2/N2 mixture was used as the feed gas,
Gas Chromatography (Perkin Elmer, TCD) was used to analyze the inlet and outlet gases

Journal of Advanced Research in Applied Mechanics
ISSN (online): 2289-7895 | Vol. 6, No. 1. Pages 1-20, 2015
5
Penerbit
Akademia Baru
concentrations. The CO2 concentration of the outlet liquid was measured by a CO2 electrode
(Thermo Orion Model 95-02) to verify the mass balance via the gas analysis. The measurement
range of the electrode was 4.4–440 ppm CO2 with a reproducibility of ±2%. All the data were
collected after experiment had been operated for 10 min to ensure the system to reach the steady
state. Steady state was indicated by a constant CO2 concentration in the outlet gas stream. The
results of each run were averaged from five times of sampling.
2.3 Calculation of experimental data
For chemical absorption, the overall mass transfer coefficient was experimentally calculated
by following [14]:
, , , ,( )
( )
g i g in i g out
i
m m
V C CK
A C
−=
∆ (1)
where Vg is the volumetric flow rate of gas phase, Am is the area of the membrane and ∆Cm is
the logarithmic mean driving force based on gas phase concentration:
* *
, , , , , ,
* *
, , , , , ,
( ) ( )
ln[( ) /( )]
i g in g in i g out g out
m
i g in g in i g out g out
C C C CC
C C C C
− − −∆ =
− − (2)
where *
,g outC and *
,g inC in gas phase concentrations in equilibrium with corresponding liquid-
phase CO2 concentrations Ci,L. Due to liquid –phase CO2 concentrations at inlet of the module
equal to 0, *
,g outC is 0. *
,g inC is expressed by Henry’s law as: *
, ,/
g in i LC C m= , the value of m is
estimated by literature [15].
2.4 Experimental design
The CO2 mass transfer optimization was studied with a standard Response Surface
Methodology (RSM) using central composite design (CCD). CCD was used to examine the
relationship between one or more response variables and set of quantitative experimental
factors and finally necessary to find the factor settings that optimize the response. It was used
to fit a quadratic surface as well. This method helps to optimize the individual and interaction
effects of operating parameters of MGA system and its potential of CO2 removal on DEA as
liquid absorbent.
Table 5: Variables and levels for two-level fractional study of MGA system
Symbol Variables Range
A Liquid absorbent temperature 30 50
B Liquid absorbent concentration 1 3
C Liquid absorbents velocity 943 3770
D Gas flow rate 50 120
E Liquid absorbents flow rate 25 80
F Volumetric concentration of CO2 in
inlet
10 100

Journal of Advanced Research in Applied Mechanics
ISSN (online): 2289-7895 | Vol. 6, No. 1. Pages 1-20, 2015
6
Penerbit
Akademia Baru
Table 6: Design layout and experimental variables for CCD
Run Factor A Factor B Factor C Factor D Factor E Factor F
1 40 2 2356.5 85 52.5 100
2 30 3 943.0 120 80.0 100
3 50 1 943.0 120 25.0 10
4 40 2 2356.5 85 52.5 55
5 40 2 2356.5 120 52.5 55
6 30 2 2356.5 85 52.5 55
7 30 1 3770.0 120 80.0 100
8 30 3 943.0 120 25.0 10
9 50 2 2356.5 85 52.5 55
10 50 3 943.0 120 80.0 10
11 30 1 943.0 120 80.0 10
12 30 1 943.0 50 80.0 100
13 40 1 2356.5 85 52.5 55
14 30 3 943.0 50 80.0 10
15 50 3 3770.0 50 25.0 100
16 30 1 3770.0 120 25.0 10
17 50 1 3770.0 120 25.0 100
18 50 3 3770.0 50 80.0 10
19 40 2 2356.5 85 52.5 55
20 30 1 943.0 50 25.0 10
21 40 2 2356.5 85 52.5 10
22 50 1 3770.0 120 80.0 10
23 30 3 3770.0 50 80.0 100
24 30 3 3770.0 120 25.0 100
25 50 3 943.0 50 25.0 10
26 50 1 943.0 50 25.0 100
27 50 3 943.0 50 80.0 100
28 50 3 3770.0 120 80.0 100
29 40 3 2356.5 85 52.5 55
30 30 1 3770.0 50 80.0 10
31 40 2 2356.5 85 80.0 55
32 50 3 943.0 120 25.0 100
33 50 1 3770.0 50 25.0 10
34 50 1 943.0 120 80.0 100
35 30 1 3770.0 50 25.0 100
36 40 2 2356.5 85 25.0 55
37 30 3 3770.0 50 25.0 10
38 40 2 943.0 85 52.5 55
39 40 2 2356.5 50 52.5 55
40 30 3 3770.0 120 80.0 10
41 50 1 943.0 50 80.0 10
42 30 3 943.0 50 25.0 100
43 40 2 3770.0 85 52.5 55
44 30 1 943.0 120 25.0 100
45 50 1 3770.0 50 80.0 100
46 50 3 3770.0 120 25.0 10
In this study, a half-fraction central composite face centered design with single replicate at each
point was used to optimize the MGA system. Six variables were investigated in this study, they
are coded as; liquid absorbent temperature (30 to 50oC) (A), liquid absorbent concentration (1
to 3M) (B), liquid absorbents velocity (943 to 3770 cm/min) (C), gas flow rate (50 to 120
ml/min) (D), liquid absorbents flow rate (25 to 80 ml/min) (E), and volumetric concentration

Journal of Advanced Research in Applied Mechanics
ISSN (online): 2289-7895 | Vol. 6, No. 1. Pages 1-20, 2015
7
Penerbit
Akademia Baru
of CO2 in inlet (10 to 100%) (F). Meanwhile, CO2 mass transfer (mol/ (m2 s)) (Y) was analyzed
as response. The experimental conditions for each system studied as shown in Table 5.
The variables which are identified as important or significant are then investigated more
thoroughly in subsequent experiment. The CCD consisting of 6 center points and 14 axial
points that rendered a total of 46 run of experiment, which used to analyze the data acquired
from the experimental design, as shown in Table 6. All experiments were done in a randomized
order to minimize the effect of unexplainable variability in the observed responses due to
irrelevant factor. Design expert software version 6.0.6 [16] was used to develop the
mathematical model and evaluate the subsequent regression analyses, analyses of variance
(ANOVA) and response surfaces. Based on the optimum operating parameters calculated by
CCD, the optimum condition was repeated and validated.
3.0 RESULTS AND DISCUSSION
3.1 Response Surface Analysis for DEA as liquid absorbent
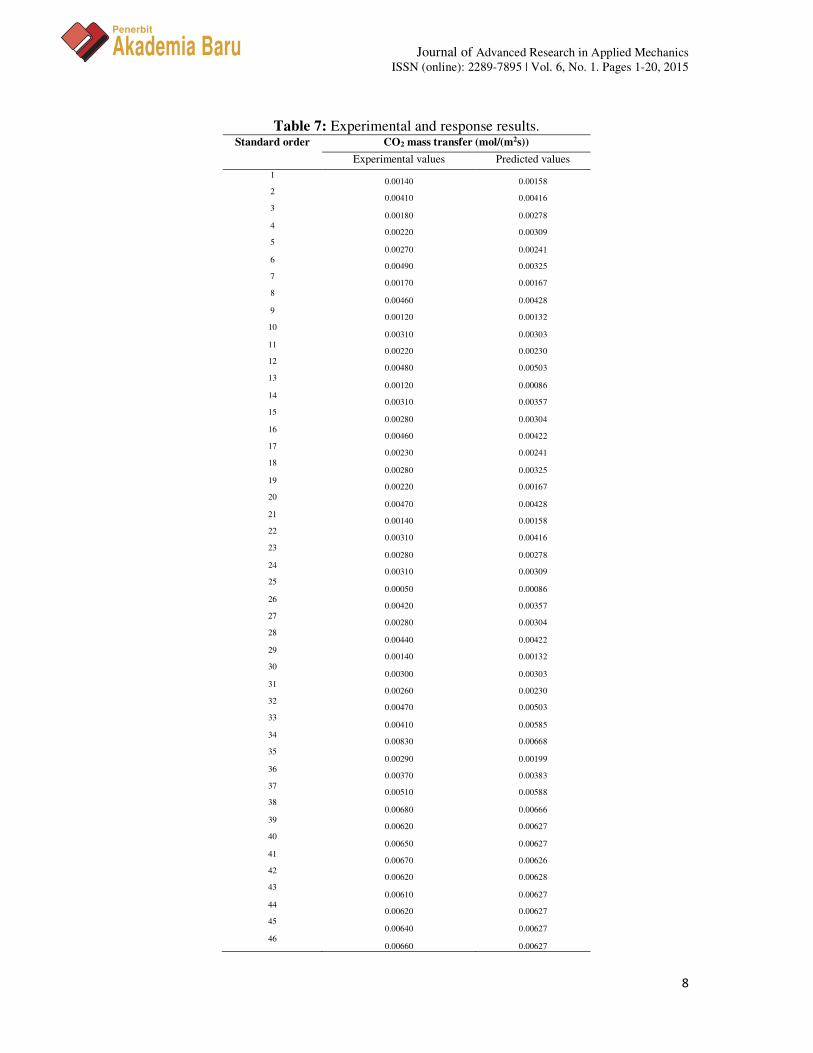
Responses for each experimental run and predicted value are as shown in Table 7. The
regression model equation generated for the CO2 mass transfer by discarding the insignificant
effects which was obtained after performing 46 experiments, are listed in Table 7. The
mathematical models were also inspected for its validity by comparing the experimental data
and the predicted data given by the models. The data can be observed also in Table 7. This data
can be observed using visual inspection by plotting the experimental data versus the predicted
data corresponding to the respective responses in the DOE software. The results demonstrated
that there are tendencies in the linear regression fit, and the model explained the experimental
range studied adequately.
The fitted regression equation showed good fit of the models and was successful in capturing
the correlation between the variables. From all these validity tests, the model was found to be
adequate for predicting the optimized CO2 mass transfer for MGA system using DEA as liquid
absorbent.
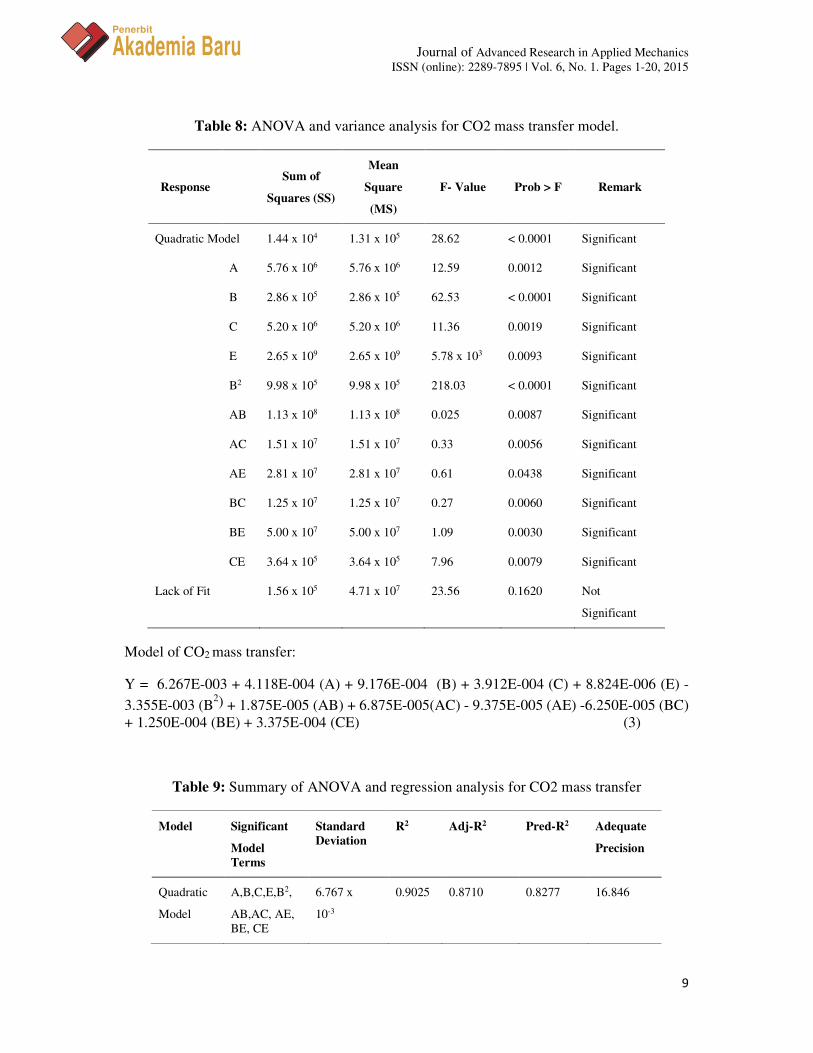
3.2 ANOVA Analysis
Apart from that, significant effects of regression model generated for the CO2 mass transfer
were tabulated in Table 8. The significant effects included the DEA temperature (A), DEA
concentration (B), DEA velocity (C), DEA flow rate (E), second-order effects of DEA
concentration (B2), as well interaction effect of (AB), (AC), (AE), (BC), (BE) and (CE). The
regression model equations were evaluated by F-test ANOVA which revealed that these
regressions model equation are statistically significant at 95% confidence level. All these
significant effects had the value of Prob > F less than 0.05. A quadratic empirical model for
CO2 mass transfer is as shown in Eqn. 3.
Journal of Advanced Research in Applied Mechanics
ISSN (online): 2289-7895 | Vol. 6, No. 1. Pages 1-20, 2015
8
Penerbit
Akademia Baru
Table 7: Experimental and response results. Standard order CO2 mass transfer (mol/(m2s))
Experimental values Predicted values
1 0.00140 0.00158
2 0.00410 0.00416
3 0.00180 0.00278
4 0.00220 0.00309
5 0.00270 0.00241
6 0.00490 0.00325
7 0.00170 0.00167
8 0.00460 0.00428
9 0.00120 0.00132
10 0.00310 0.00303
11 0.00220 0.00230
12 0.00480 0.00503
13 0.00120 0.00086
14 0.00310 0.00357
15 0.00280 0.00304
16 0.00460 0.00422
17 0.00230 0.00241
18 0.00280 0.00325
19 0.00220 0.00167
20 0.00470 0.00428
21 0.00140 0.00158
22 0.00310 0.00416
23 0.00280 0.00278
24 0.00310 0.00309
25 0.00050 0.00086
26 0.00420 0.00357
27 0.00280 0.00304
28 0.00440 0.00422
29 0.00140 0.00132
30 0.00300 0.00303
31 0.00260 0.00230
32 0.00470 0.00503
33 0.00410 0.00585
34 0.00830 0.00668
35 0.00290 0.00199
36 0.00370 0.00383
37 0.00510 0.00588
38 0.00680 0.00666
39 0.00620 0.00627
40 0.00650 0.00627
41 0.00670 0.00626
42 0.00620 0.00628
43 0.00610 0.00627
44 0.00620 0.00627
45 0.00640 0.00627
46 0.00660 0.00627
Journal of Advanced Research in Applied Mechanics
ISSN (online): 2289-7895 | Vol. 6, No. 1. Pages 1-20, 2015
9
Penerbit
Akademia Baru
Table 8: ANOVA and variance analysis for CO2 mass transfer model.
Response Sum of
Squares (SS)
Mean
Square
(MS)
F- Value Prob > F Remark
Quadratic Model 1.44 x 10⁴ 1.31 x 10⁵ 28.62 < 0.0001 Significant
A 5.76 x 10⁶ 5.76 x 10⁶ 12.59 0.0012 Significant
B 2.86 x 10⁵ 2.86 x 10⁵ 62.53 < 0.0001 Significant
C 5.20 x 10⁶ 5.20 x 10⁶ 11.36 0.0019 Significant
E 2.65 x 10⁹ 2.65 x 10⁹ 5.78 x 10³ 0.0093 Significant
B2 9.98 x 10⁵ 9.98 x 10⁵ 218.03 < 0.0001 Significant
AB 1.13 x 10⁸ 1.13 x 10⁸ 0.025 0.0087 Significant
AC 1.51 x 10⁷ 1.51 x 10⁷ 0.33 0.0056 Significant
AE 2.81 x 10⁷ 2.81 x 10⁷ 0.61 0.0438 Significant
BC 1.25 x 10⁷ 1.25 x 10⁷ 0.27 0.0060 Significant
BE 5.00 x 10⁷ 5.00 x 10⁷ 1.09 0.0030 Significant
CE 3.64 x 10⁵ 3.64 x 10⁵ 7.96 0.0079 Significant
Lack of Fit 1.56 x 10⁵ 4.71 x 10⁷ 23.56 0.1620 Not
Significant
Model of CO2 mass transfer:
Y = 6.267E-003 + 4.118E-004 (A) + 9.176E-004 (B) + 3.912E-004 (C) + 8.824E-006 (E) -
3.355E-003 (B2) + 1.875E-005 (AB) + 6.875E-005(AC) - 9.375E-005 (AE) -6.250E-005 (BC)
+ 1.250E-004 (BE) + 3.375E-004 (CE) (3)
Table 9: Summary of ANOVA and regression analysis for CO2 mass transfer
Model Significant
Model
Terms
Standard
Deviation
R2 Adj-R2 Pred-R2 Adequate
Precision
Quadratic
Model
A,B,C,E,B2,
AB,AC, AE,
BE, CE
6.767 x
10-3
0.9025 0.8710 0.8277 16.846

Journal of Advanced Research in Applied Mechanics
ISSN (online): 2289-7895 | Vol. 6, No. 1. Pages 1-20, 2015
10
Penerbit
Akademia Baru
In this study, the reggression model of CO2 mass transfer (Equation 3) provided high values of
R2 (0.9025), Adj-R2 (0.8710) and Pred- R2 (0.8277) as shown by Table 9. The high
determination coefficient of R2 indicated that the variability in the response could be explained
by the mathematical model. For the model of equation, the predicted R2 is in reasonable
agreement with the adjusted R2 because they are within 0.10 to each other.
3.3 Analysis of response surface
Impacts of DEA temperature, DEA concentration, DEA velocity and liquid absorbent flow rate
were significant as indicated by response surface plot in Figure 2 to Figure 7. The maximum
mass transfer of CO2 was attained at intermediate DEA concentration (1M to 3M) in Figure 2,
Figure 3 and Figure 4, respectively.
Figure 2: Response surface plotted on DEA concentration: DEA temperature.
Figure 3: Response surface plotted on DEA concentration: DEA velocity.
1.91E-03
3.11E-03
4.31E-03
5.51E-03
6.71E-03
Mass transfer of CO2
30
35
40
45
50
1
2
2
3
3
B: DEA concentration A: DEA temperature
1.60E-03
2.83E-03
4.05E-03
5.28E-03
6.51E-03
Mass transfer of CO2
1
2
2
3
3
94
165
235
306
377
B: DEA concentration C: DEA velocity
Journal of Advanced Research in Applied Mechanics
ISSN (online): 2289-7895 | Vol. 6, No. 1. Pages 1-20, 2015
11
Penerbit
Akademia Baru
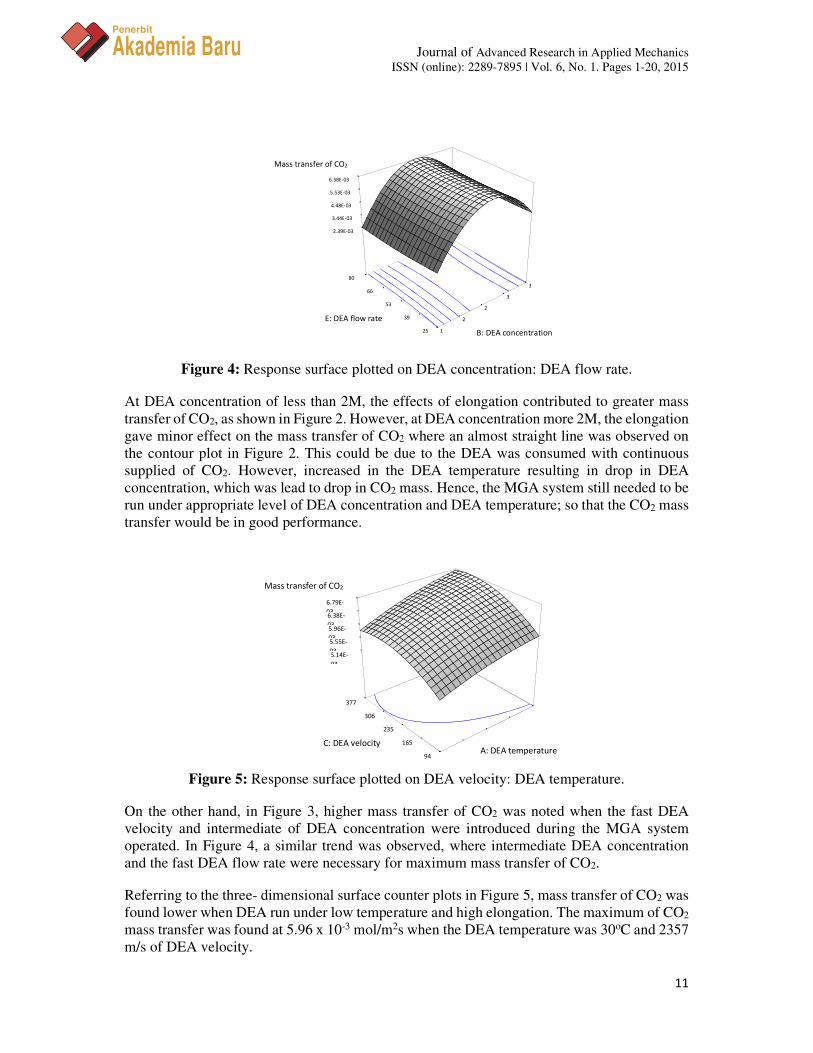
Figure 4: Response surface plotted on DEA concentration: DEA flow rate.
At DEA concentration of less than 2M, the effects of elongation contributed to greater mass
transfer of CO2, as shown in Figure 2. However, at DEA concentration more 2M, the elongation
gave minor effect on the mass transfer of CO2 where an almost straight line was observed on
the contour plot in Figure 2. This could be due to the DEA was consumed with continuous
supplied of CO2. However, increased in the DEA temperature resulting in drop in DEA
concentration, which was lead to drop in CO2 mass. Hence, the MGA system still needed to be
run under appropriate level of DEA concentration and DEA temperature; so that the CO2 mass
transfer would be in good performance.
Figure 5: Response surface plotted on DEA velocity: DEA temperature.
On the other hand, in Figure 3, higher mass transfer of CO2 was noted when the fast DEA
velocity and intermediate of DEA concentration were introduced during the MGA system
operated. In Figure 4, a similar trend was observed, where intermediate DEA concentration
and the fast DEA flow rate were necessary for maximum mass transfer of CO2.
Referring to the three- dimensional surface counter plots in Figure 5, mass transfer of CO2 was
found lower when DEA run under low temperature and high elongation. The maximum of CO2
mass transfer was found at 5.96 x 10⁻³ mol/m2s when the DEA temperature was 30oC and 2357
m/s of DEA velocity.
2.39E-03
3.44E-03
4.48E-03
5.53E-03
6.58E-03
Mass transfer of CO2
1
2
2
3
3
25
39
53
66
80
B: DEA concentration
E: DEA flow rate
5.14E-
03
5.55E-
03
5.96E-
03
6.38E-
03
6.79E-
03
Mass transfer of CO2
94
165
235
306
377
A: DEA temperature C: DEA velocity

Journal of Advanced Research in Applied Mechanics
ISSN (online): 2289-7895 | Vol. 6, No. 1. Pages 1-20, 2015
12
Penerbit
Akademia Baru
Impacts of DEA flow rate, DEA velocity and DEA temperature were shown in Figure 6 and 7.
At higher DEA flow rate, the MGA system still needed higher DEA velocity and DEA
temperature, where long elongation as can be seen in Figure 6 and 7. Hence, at 80 ml/min of
DEA flow rate and 943 m/s of DEA velocity, CO2 mass transfer was found at 4.93 x 10⁻³
mol/m2s. Meanwhile, at 80 ml/min of DEA flow rate and 30oC of DEA temperature, CO2 mass
transfer was found at 5.61 x 10⁻³ mol/m2s. Thus, it can be concluded that CO2 mass transfer
depends appropriate value of DEA temperature, velocity and flow rate.
Figure 6: Response surface plotted on DEA flow rate: DEA velocity.
Figure 7: Response surface plotted on DEA flow rate: DEA temperature.
3.4 Verification and statistical models and diagnostic statistic
RSM has the advantages of observing the interaction effects among independent parameters.
Fig. 8-13 show the binary interactions between DEA concentration and DEA temperature (Fig.
8); DEA temperature and DEA velocity (Fig. 9); DEA temperature and DEA flow rate (Fig.
10); DEA flow rate and DEA velocity (Fig. 11); DEA concentration and DEA velocity (Fig.
12) and DEA concentration and DEA flow rate (Fig. 13), respectively.
5.80E-03
6.07E-03
6.34E-03
6.60E-03
6.87E-03
Mass transfer of CO2
30
35
40
45
50
25
39
53
66
80
A: DEA temperature E: DEA flow rate
5.40E-03
5.77E-03
6.13E-03
6.50E-03
6.86E-03
Mass transfer of
943
1650
2357
3063
3770
25
39
53
66
80
C: DEA velocity E: DEA flow rate

Journal of Advanced Research in Applied Mechanics
ISSN (online): 2289-7895 | Vol. 6, No. 1. Pages 1-20, 2015
13
Penerbit
Akademia Baru
Figure 8: Interaction via DEA temperature: DEA concentration (▲for 1M, ■ for 3M and ● is
design point)
Figure 9: Interaction via DEA temperature: DEA velocity (▲for 3770 m/s, ■ for 943 m/s
and ● is design point)
As can be seen in Fig. 8 to Fig. 11, the parallel curvatures implied that there was a weak
interaction between variables. However, the non- parallel curvatures of Fig. 12 and Fig. 13
indicated that there was relatively strong interaction between variables. In this case, DEA
concentration (B), DEA velocity (C) and DEA flow rate (E). As the result of this strong
interaction, BC and BE appeared as significant terms in Eqn. 3. According the model, the
maximum operating condition of MGA system was predicted around the region of middle of
the variables.
Diagnostic plots in Figure 14 and Figure 15 were used to determine the residual analysis of
response surface design, ensuring that the statistical assumptions fit to analysis data. Figure 14
shows the normal probability of the residuals, to verify whether the standard deviations
between actual and predicted response values do follow the normal distribution [17]. The
general impression from the figure explained that underlying errors were distributed normally
as the residuals fall near to a straight line and thus there was no sever indication of non-
normality of the experimental results.
B: DEA concentration
A: DEA temperature
Ma
ss t
ran
sfe
r o
f C
O2
30 35 40 45 50
5.00E-04
2.45E-03
4.40E-03
6.35E-03
8.30E-03
C: DEA velocity
A: DEA temperature
Ma
ss t
ran
sfe
r o
f C
O2
30 35 40 45 50
5.00E-04
2.45E-03
4.40E-03
6.35E-03
8.30E-03

Journal of Advanced Research in Applied Mechanics
ISSN (online): 2289-7895 | Vol. 6, No. 1. Pages 1-20, 2015
14
Penerbit
Akademia Baru
Figure 10: Interaction via DEA temperature: DEA flow rate (▲for 80 ml/min, ■ for 25
ml/min and ● is design point)
Figure 11: Interaction via DEA velocity: DEA flow rate (▲for 80 ml/min, ■ for 25 ml/min
and ● is design point)
Figure 12: Interaction via DEA concentration: DEA flow rate (▲for 3770 m/s, ■ for 943 m/s
and ● is design point)
E: DEA flow rate
A: DEA temperature
Ma
ss t
ran
sfe
r o
f
CO
2
30 35 40 45 50
5.00E-04
2.45E-03
4.40E-03
6.35E-03
8.30E-03
E: DEA flow rate
C: DEA velocity
Ma
ss t
ran
sfe
r o
f C
O2
943 1650 2357 3063 3770
5.00E-04
2.45E-03
4.40E-03
6.35E-03
8.30E-03
C: DEA velocity
B: DEA concentration
Ma
ss t
ran
sfe
r o
f C
O2
1 2 2 3 3
5.00E-04
2.45E-03
4.40E-03
6.35E-03
8.30E-03

Journal of Advanced Research in Applied Mechanics
ISSN (online): 2289-7895 | Vol. 6, No. 1. Pages 1-20, 2015
15
Penerbit
Akademia Baru
Figure 13: Interaction via DEA concentration: DEA flow rate (▲for 80 ml/min, ■ for 25
ml/min and ● is design point)
Figure 14: Normal probability plot of residual for mass transfer of CO2
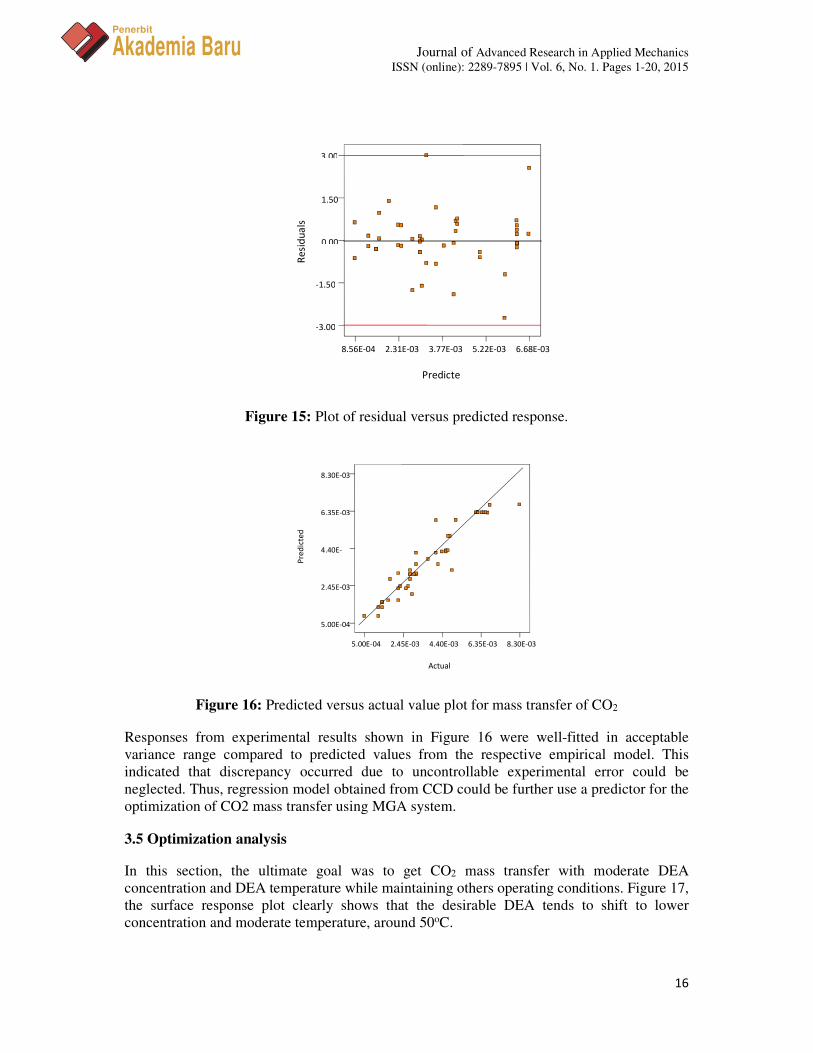
The plots of residuals versus predicted response was presented in Fig. 15. All points of
experimental runs were scattered randomly within constant range of residuals across the graph
i.e. within the horizontal lines at point ±3.0. This implied that the proposed models were
adequate and the assumption of constant variance was confirmed.
Reliability and adequacy of empirical models (Eqn. 3) were confirmed when the actual values
obtained from experimental studies were well-matched to the estimated values from regression
model (Fig. 16). Points above the diagonal line were those over-estimates and vice versa. Fig.
16 generally indicated that all experiment design points were distributed along the diagonal
line.
E: DEA flow rate
B: DEA concentration
Ma
ss t
ran
sfe
r o
f
CO
1 2 2 3 3
5.00E-04
2.45E-03
4.40E-03
6.35E-03
8.30E-03
Residuals
No
rma
l P
rob
ab
ilit
y (
%)
-2.75 -1.32 0.12 1.56 2.99
1
5 10
20 30
50
70 80
90 95
99
Journal of Advanced Research in Applied Mechanics
ISSN (online): 2289-7895 | Vol. 6, No. 1. Pages 1-20, 2015
16
Penerbit
Akademia Baru
Figure 15: Plot of residual versus predicted response.
Figure 16: Predicted versus actual value plot for mass transfer of CO2
Responses from experimental results shown in Figure 16 were well-fitted in acceptable
variance range compared to predicted values from the respective empirical model. This
indicated that discrepancy occurred due to uncontrollable experimental error could be
neglected. Thus, regression model obtained from CCD could be further use a predictor for the
optimization of CO2 mass transfer using MGA system.
3.5 Optimization analysis
In this section, the ultimate goal was to get CO2 mass transfer with moderate DEA
concentration and DEA temperature while maintaining others operating conditions. Figure 17,
the surface response plot clearly shows that the desirable DEA tends to shift to lower
concentration and moderate temperature, around 50oC.
Predicte
Re
sid
ua
ls
-3.00
-1.50
0.00
1.50
3.00
8.56E-04 2.31E-03 3.77E-03 5.22E-03 6.68E-03
Actual
Pre
dic
ted
5.00E-04
2.45E-03
4.40E-
6.35E-03
8.30E-03
5.00E-04 2.45E-03 4.40E-03 6.35E-03 8.30E-03

Journal of Advanced Research in Applied Mechanics
ISSN (online): 2289-7895 | Vol. 6, No. 1. Pages 1-20, 2015
17
Penerbit
Akademia Baru
Figure 17: Response surface plot of desirability
Table 10: Numerical optimization for central composite design
Operating
conditions
1 2 3 4 5
DEA temperature
(oC)
50 50 49 48 48
DEA
concentration (M)
2 2 2 2 2
DEA velocity
(cm/min)
3770 3770 3763 3763 3763
Gas flow rate
(ml/min)*
101 110 72 70 103
DEA flow rate
(ml/min)
80 80 79 79 78
CO2 inlet
concentration
(%v)* 33 71 15 62 94
Predicted
Responses
Mass transfer of
CO2
7.47x10⁻³ 7.47x10⁻³ 7.46x10⁻³ 7.45x10⁻³ 7.45x10⁻³
(mol/(m2s))
Desirability (Df) 0.90
(Selected)
0.90 0.89 0.89 0.88
*Has no effect on optimization results.
0.148
0.313
0.478
0.643
0.808
D
esi
rab
ilit
y
30
35
40
45
50
1
2
2
3
3
A: DEA temperature B: DEA concentration

Journal of Advanced Research in Applied Mechanics
ISSN (online): 2289-7895 | Vol. 6, No. 1. Pages 1-20, 2015
18
Penerbit
Akademia Baru
Table 11: Confirmation between optimized mass transfers of CO2 calculated from
mathematical design and experimental study
Factor A:
DEA temp.
(oC)
Factor
B:
DEA con.
(M)
Factor C:
DEA
velocity
(cm/min)
Factor D:
Gas flow
rate
(ml/min)*
Factor
E:
DEA
flow rate
(ml/min)
Factor
F:
CO2 inlet
con. (%v)*
Response:
Mass
Transfer of
CO2
(mol/(m2s))
Predicted values from central composite design:
50 2 3370 101 80 33 7.47x10⁻³
Actual value from confirmation study:
50 2 3370 101 80 33 7.97x10⁻³
Standard deviation (%): 0.04
From Table 10, it can be seen that the most desirable operating conditions were set at DEA
temperature of 50oC, DEA concentration of 2M, DEA velocity of 3770 m/s and DEA flow rate
of 80 ml/min, respectively. Meanwhile, for operating condition has no effect to the response;
gas flow rate and CO2 inlet concentration were set at 101 ml/min and 33 %v, respectively.
To validate the optimal point generated by CCD, an experimental run was conducted at
operating conditions were set as the most desirable operating conditions as shown in Table 10.
In the Table 11, the experimental value (7.97x10⁻³ mol/m2s) was found to be in good agreement
with the values predicted by CCD (7.47x10⁻³ mol/m2s). Error estimations between predicted
and actual values fell within 5%. This indicates that the process optimization in CCD is good
and reliable to achieve high CO2 mass transfer when the MGA system is operated using the
suggeted optimal operating conditions.
4.0 CONCLUSIONS
ANOVA result showed that the temperature, concentration, velocity and flow rate of DEA
played a significant role. The optimum DEA temperature was found at 50oC, DEA
concentration at 2M, velocity at 3770m/s and 80 ml/min of DEA flow rate with 0.90 of
desirability. In the study, the optimum response predicted via CCD was 7.47 x 10⁻³ mol/m2s
shown good agreement with the actual experiment value 7.97 x 10⁻³ mol/m2s with the deviation
within 5% between actual and predicted data.
REFERENCES
[1] Y. Zhang, R. Wang, Novel method for incorporating hydrophobic silica nanoparticles on
polyetherimide hollow fiber membranes for CO2 absorption in a gas–liquid membrane
contactor, Journal of Membrane Science 452 (2014) 379-389.
[2] S. Wongchitphimon, R.Wang, R. Jiraratananon, Surface modification of polyvinylidene
fluoride-co-hexafluoropropylene (PVDF–HFP) hollow fiber membrane for membrane
gas absorption, Journal of Membrane Science 381 (2011) 183-191.

Journal of Advanced Research in Applied Mechanics
ISSN (online): 2289-7895 | Vol. 6, No. 1. Pages 1-20, 2015
19
Penerbit
Akademia Baru
[3] R. Wang, Polymeric Membrane preparation and surface modification for water treatment,
the 7th International Pre Conference Workshop on Membrane Science & Technology,
Kuala Lumpur, (2009).
[4] J.L. Li, B. H. Chen, Review of CO2 absorption using chemical solvents in hollow fiber
membrane contactors, Separation and Purification Technology 41(2005) 109–122.
[5] N A.L. Ahmad, A.R. Sunarti, K.T. Lee, W.J.N. Fernando, CO2 removal using membrane
gas absorption, International Journal of Greenhouse Gas Control 4 (2010) 495-498.
[6] A. Mansourizadeh, Z. Aslmahdavi, A.F. Ismail, T. Matsuura, Blend polyvinylidene
fluoride/surface modifying macromolecule hollow fiber membrane contactors for CO2
absorption, International Journal of Greenhouse Gas Control 26 (2014) 83-92.
[7] Gh. Bakeri, A.F. Ismail, M. Rahimnejad, T. Matsuura, Porous polyethersulfone hollow
fiber membrane in gas–liquid contacting processes. Chemical Engineering Research and
Design 92 (2014) 1381-1390.
[8] H.A. Rangwala, Absorption of Carbon Dioxide into aqueous solutions using hollow fiber
membrane contactors, Journal of Membrane Science 112 (1996) 229-240.
[9] R. Wang, D.F. Li, C. Zhou, M. Liu, D.T. Liang, Impact of DEA solutions with and
without CO2 loading on porous polypropylene membranes intended for use as contactors,
Journal of Membrane Science 229 (2004) 147–157.
[10] F.O. Pedersen, H. Dannstrom, Separation of carbon dioxide from offshore gas turbine
exhaust, Energy Conversion Management 38 (1997) 81-86.
[11] N. Nishikawa, M. Ishibashi, H. Ohta,N. Akutsu, H. Matsumoto,T. Kamata, H. Kitamura,
CO2 removal by hollow-fiber gas-liquid contactor, Energy Conversion Management 36
(1995) 415–418.
[12] S.R. Wickramasinghe, M.J. Semmens, E.L. Cussler, Hollow fiber modules made with
hollow fiber fabric, Journal of Membrane Science 84 (1993) 1–14.
[13] K.L. Wang, E.L. Cussler, Baffled membrane modules made with hollow fiber fabric,
Journal of Membrane Science 85 (1993) 265–278.
[14] J.G. Lu, Y.F. Zheng, M.D. Cheng, Wetting mechanism in mass transfer process of
hydrophobic membrane gas absorption, Journal of Membrane Science 308 (2008) 180–
190.
[15] R.J. Little, G.F. Versteeg, W.P.M. van Swaaij, Kinetics of CO2 with primary and
secondary amines in aqueous solutions I. Zwitterion deprotonation kinetics for DEA and
DIPA in aqueous blends of alkanolamines, Chemical Engineering Science 47 (1992)
2027-2035.
[16] D.C. Montgomery, Design and Analysis of Experiments. John Wiley & Sons, New York
(2005).

Journal of Advanced Research in Applied Mechanics
ISSN (online): 2289-7895 | Vol. 6, No. 1. Pages 1-20, 2015
20
Penerbit
Akademia Baru
[17] K.M. Lee, D.F. Gillmore, Formulation and process modeling of biopolymer
(polyhydroxyalkanoates: PHAs) production from industrial wastes by novel crossed
experimental design, Process Biochemistry 40 (2005) 229-246.