
Akademia Baru
17
Journal of Advanced Research in Applied Sciences and Engineering Technology 10, Issue 1 (2018) 1-17 1 Journal of Advanced Research in Applied Sciences and Engineering Technology Journal homepage: www.akademiabaru.com/araset.html ISSN: 2462-1943 Optimization of Interlocking Structures Made of Flax Fibre Composites to Improve Its Energy Absorption Capability Mohamed Ibrahim J. Ibrahim 1,* , Mohd Zuhri Mohamed Yusoff 1 1 Department of Mechanical and Manufacturing Engineering, Faculty of Engineering Universiti Putra Malaysia, 43400 Serdang Selangor, Malaysia ARTICLE INFO ABSTRACT Article history: Received 1 November 2017 Received in revised form 14 December 2017 Accepted 19 December 2017 Available online 6 January 2018 This study presents an investigation about the effect of size variation on mechanical performance of square core interlocking structures, by using finite element analysis (FEA). The material used in this study is flax fibre reinforced polypropylene (PP) composite. Abaqus software was used for modelling and visualizing number of six interlocking honeycomb structures with different cell sizes and heights. In the first analysis, Abaqus/standard was performed on the perfect models by applying quasi- static loading to identify the imperfection shape and obtaining the buckling Eigen- modes for the models, then the Eigen-modes from abaqus/standard were imported to abaqus/explicit to run post-buckling analysis and simulate the overall imperfection behaviour of models. The numerical results from the finite element analysis simulation were used to plot load-displacement curve to each model. The area under the load-displacement curve represents the total absorbed energy, energy absorption per unit mass indicates the specific energy absorption, and the highest value of specific energy absorption represents the optimum size. The findings demonstrated that the square interlocking structure exhibits good energy absorption performance in some geometrical cases, and also revealed that the natural fibre composites have unique energy absorption capability under quasi-static loads. Keywords: Flax fibre materials, interlocking structure, size effect, finite element Copyright © 2018 PENERBIT AKADEMIA BARU - All rights reserved 1. Introduction The use of interlocking concept in manufacturing of honeycomb structures offers a lot of advantages to overall performance of the systems and constructions, because it’s characterized by simplicity of installation and provided great resistance to crack propagation, also, it is helpful to absorb large amount of crushing energy. Moreover, the interlocking structures having a unique ability to combine various materials within a single topologically interlocked [1]. Recently, due to contemporary environmental rules, massive researches on natural fibres composites have been performed. Natural fibres composite (NFC) are low cost materials offering a low density, extraordinary specific properties, bio-degradable characteristics and recyclability [2]. Furthermore, to improve the levels of safety and protection, researchers and engineers moved toward * Corresponding author. E-mail address: Mohamed Ibrahim J. Ibrahim ([email protected]) Penerbit Akademia Baru Open Access
-
Upload
khangminh22 -
Category
Documents
-
view
5 -
download
0
Transcript of Akademia Baru
Journal of Advanced Research in Applied Sciences and Engineering Technology 10, Issue 1 (2018) 1-17
1
Journal of Advanced Research in Applied
Sciences and Engineering Technology
Journal homepage: www.akademiabaru.com/araset.html
ISSN: 2462-1943
Optimization of Interlocking Structures Made of Flax Fibre
Composites to Improve Its Energy Absorption Capability
Mohamed Ibrahim J. Ibrahim1,∗
, Mohd Zuhri Mohamed Yusoff1
1
Department of Mechanical and Manufacturing Engineering, Faculty of Engineering Universiti Putra Malaysia, 43400 Serdang Selangor, Malaysia
ARTICLE INFO ABSTRACT
Article history:
Received 1 November 2017
Received in revised form 14 December 2017
Accepted 19 December 2017
Available online 6 January 2018
This study presents an investigation about the effect of size variation on mechanical
performance of square core interlocking structures, by using finite element analysis
(FEA). The material used in this study is flax fibre reinforced polypropylene (PP)
composite. Abaqus software was used for modelling and visualizing number of six
interlocking honeycomb structures with different cell sizes and heights. In the first
analysis, Abaqus/standard was performed on the perfect models by applying quasi-
static loading to identify the imperfection shape and obtaining the buckling Eigen-
modes for the models, then the Eigen-modes from abaqus/standard were imported
to abaqus/explicit to run post-buckling analysis and simulate the overall imperfection
behaviour of models. The numerical results from the finite element analysis
simulation were used to plot load-displacement curve to each model. The area under
the load-displacement curve represents the total absorbed energy, energy absorption
per unit mass indicates the specific energy absorption, and the highest value of
specific energy absorption represents the optimum size. The findings demonstrated
that the square interlocking structure exhibits good energy absorption performance
in some geometrical cases, and also revealed that the natural fibre composites have
unique energy absorption capability under quasi-static loads.
Keywords:
Flax fibre materials, interlocking
structure, size effect, finite element Copyright © 2018 PENERBIT AKADEMIA BARU - All rights reserved
1. Introduction
The use of interlocking concept in manufacturing of honeycomb structures offers a lot of
advantages to overall performance of the systems and constructions, because it’s characterized by
simplicity of installation and provided great resistance to crack propagation, also, it is helpful to
absorb large amount of crushing energy. Moreover, the interlocking structures having a unique
ability to combine various materials within a single topologically interlocked [1]. Recently, due to
contemporary environmental rules, massive researches on natural fibres composites have been
performed. Natural fibres composite (NFC) are low cost materials offering a low density,
extraordinary specific properties, bio-degradable characteristics and recyclability [2]. Furthermore,
to improve the levels of safety and protection, researchers and engineers moved toward
∗
Corresponding author.
E-mail address: Mohamed Ibrahim J. Ibrahim ([email protected])
Penerbit
Akademia Baru
Open
Access

Journal of Advanced Research in Applied Sciences and Engineering Technology
Volume 10, Issue 1 (2018) 1-17
2
Penerbit
Akademia Baru
developing structures that having excellent ability to absorb crushing energy, and made of eco-
friendly materials [3-4]. Hence, the interlocking structures which made of natural fibre composites
comprised between the excellent properties of materials and the high mechanical performance of
structures that make it desirable in high-tech applications [5].
The most optimized square interlocking honeycomb structure is that having the best specific
energy absorption capability and the lowest peak stress when used as a shock absorption device.
Honeycomb structure is very important for the safeguard structural design where the cell height
and cell wall thickness of the material honeycombs are used as design variables [6]. Many
researchers have revealed that the composites based on natural fibres can offer comparable
properties to those based on synthetic fibres, this is because most natural fibres need a lesser
amount of handling costs and lower energy, in addition possessing excellent environmental
standards such as being renewable, ecological and sustainable compared to glass and carbon fibres
[7]. For that reason, Mallaiah [8] studied the properties of bio-based and artificial based fibre
sandwich structures, and proved that a hybrid structure based on bamboo and glass fibres offers
higher values of core shear stress and face bending stress than those structures manufactured from
either pure glass or carbon fibres.
Pandey [9] stated that the growth rate of natural fibres in the industries, constructions, and
business market sectors has increased by13 %, for instance, the sector of automobiles industry has
focused on natural fibre composites to be used in both interior and exterior parts. This is to
minimize the gross weight of the car as well as improving the fuel efficiency and sustainability. The
utilization of natural fibre in fabricating of automotive spare parts contributes 10% weight
reduction of vehicle, and this leads to 80% energy consumption and 5% cost saving [10]. A number
of automotive industries in the world have introduced natural fibre composites into their products
[11]. Jaguar and Land Rover automobiles pioneers fabricated a car door prototype from
flax/polypropylene and stated that the bio fibre composites offer higher performance comparing
with to modern-day elements. The weight of this prototype is lighter than the corresponding steel
component by about 60% for the identical stiffness, and is almost 35% lighter than a glass filled
polypropylene issued at the equal thickness [12].
Likewise, the air craft and space technology have given great attention toward lightweight
composite structures, because these materials are characterized as offering a high strength with
light weight a long with high specific bending stiffness and strength resistance under distributed
loads [13]. Similarly, Yin [14] reported that, the currently thin-walled honeycombs have been
extensively used as energy absorption structures due to their extraordinary light weight, excellent
energy absorption capacity, and relatively low price in automotive, aerospace, military and many
other industries. Enhancing levels of safety and protection need to create an ideal energy-absorbing
structure, an ideal energy absorber structure is the capability of the structure to deform partially or
completely and absorbs as much as possible of crushing energy following compression. To
manufacture these structures there are two essential parameters should be considered, firstly, the
mechanical specification of the used material or composite, secondly, the geometrical dimensions
and shape of the structure [15]. Moreover, the previous reported studies have revealed that the
cell structure has a substantial effect on the mechanical performance of the honeycomb material.
Therefore, it is crucial to studied and compared the stress-strain characteristics and energy
absorbing capacities in large buckling for the engineering design purposes [16].
Interlocking structures are well-known for being offer a lot of characteristics to performance of
the systems, whereas, the natural fiber composites (NFCs) offer many advantages that make them
an appropriate alternative for many types of engineering materials, particularly, for those related to
energy-absorbing structures where safety and enhancing levels of protection are among the main
Journal of Advanced Research in Applied Sciences and Engineering Technology
Volume 10, Issue 1 (2018) 1-17
3
Penerbit
Akademia Baru
interests. Therefore, researchers and engineers have given much attention for interlocking
structures which are made of natural lightweight composites, in order to optimize their efficiency
and mechanical performance. Thus, to optimize the mechanical performance of interlocking
structures which made of NFCs, there is an importance to study the influence of core design (size
effecting) on the validity of structures, as a result many researchers studied this issue analytically or
experimentally to determine the optimum geometrical shape and dimensions of structure relied on
different methods. Those researches were depended on the mechanical properties (specific
strength, energy absorption, and shape) this is more active and sensitive method to identify the
optimum core design.
Dharmasena [17] mentioned that the square shape honeycombs are the best shape design core
among all other core shapes in term of strength by about 27%. Yamashita [18] performed a
numerical simulation with practical experiment on aluminum honeycomb, by applying quasi-static
compression tests toward through-thickness direction they concluded that the best strength is
achieved in case of a regular hexagon cell shape. Zuhri [19] studied the influence of design of
honeycomb core on compressive strength of natural flax fiber composites, where they carried out a
comparison between square and triangle honeycomb made of polylactide (PLA) polymers and
reinforced polypropylene (PP) it was found that the (PP) based composites are offered tensile
characteristics and energy-absorbing better than those based on (PLA) composites, furthermore, it
was observed that the energy-absorbing and compression characteristics of square honeycomb
were greater than corresponding triangular counterparts.
This study presents numerical investigation about the effect of changing the geometrical
dimensions on mechanical efficiency of square interlocking honeycomb structures made of flax
fibre reinforced polypropylene (PP). A finite element analysis was used to simulate six interlocking
honeycomb models with different dimensions and subjected to ques-static loading, and then from
plotting displacement–load curve, the specific energy absorption of each model was calculated and
compared to identify the optimum size in terms of mechanical performance. The outcomes from
this study could be used in industries that fabricate structures and spare parts that used to provide
high levels of safety and protection such as automobiles and aeronautical industries, also it could
be helpful to researchers and designers when use finite element techniques to estimate mechanical
characteristics of materials.
2. Methodology
2.1 Techniques of using ABAQUS Simulation
In order to accomplish the objective of this study both ABAQUS/ Explicit and standard software
version 6.14 are used, the analysis model consists of the following information: element geometry,
section properties, material data, loads and boundary conditions, assembling, constraints, analysis
type, and output requests. The outputs of successfully complete simulation are saved in field
output and history output. A complete ABAQUS software analysis is carried out by three
distinguished stages: pre-processing, simulation, and post-processing.
2.2 Pre-processing
Creating an ABAQUS input file is the first step, then sketching the frame of the model and
assigning the type of material, weather deformable or sold rigid, following that the structural
characteristic of the input keyed. The model is sketched graphically using ABAQUS sketcher, or it
could be imported from another 3D modelling software. In other words ABAQUS is a graphical
representation, defining the geometry, defining material properties, and generating a mesh, then
Journal of Advanced Research in Applied Sciences and Engineering Technology
Volume 10, Issue 1 (2018) 1-17
4
Penerbit
Akademia Baru
visualizing the results. A lot of assumptions and techniques should be provided to get successful
simulation and precise results.
2.3 Element Geometry
Creating the parts is the first task in modelling, in this study six models with different size
dimensions and different heights are used to modelling the actual specimens, each model plotted
individually in 2D frame work according to its dimensions, then the model is extruded to the
desired width to become solid 3D deformable element, the partition process applied to the parts in
order to control meshing and gain accurate results. Consequently, two rigid shell platens are
plotted and extruded to be located at the top and bottom of each model, with assigning a reference
point at the centre of each platen used to apply compression load and calculate results of the
models. The platen model does not deform during the test. The thickness of all models is set to
about 1.5 mm. 1st
model dimension is 20x20x20 mm, 2nd
model 20x20x40 mm, 3rd
model 30x30x20
mm, 4th
model 30x30x40 mm, 5th model 50x50x20 mm, and 6th model 50x50x40 mm.
2.4 The Units of Quantities
The ABAQUS software has not identified specific units to be used in plotting models dimension
and inputting materials properties, except for angle measures and rotation motion, therefore, the
units of quantities are specified by the user, which means that derived units of the chosen system
can be expressed in terms of the fundamental units without conversion factors, to obtain precise
results all quantities must be unified. The units which are used in this simulation are SI units.
Table 1
Units used in finite element simulation
No. Quantity Unit
1. Length Millimeter (mm)
2. Force Newton (N)
3. Mass Kilogram (kg)
4. Time Second (s)
5. Stress Pascal Pa (N/mm2)
6. Energy Millimeter Joule (mmJ)
7. Density Kilogram per Millimeter (kg/mm3)
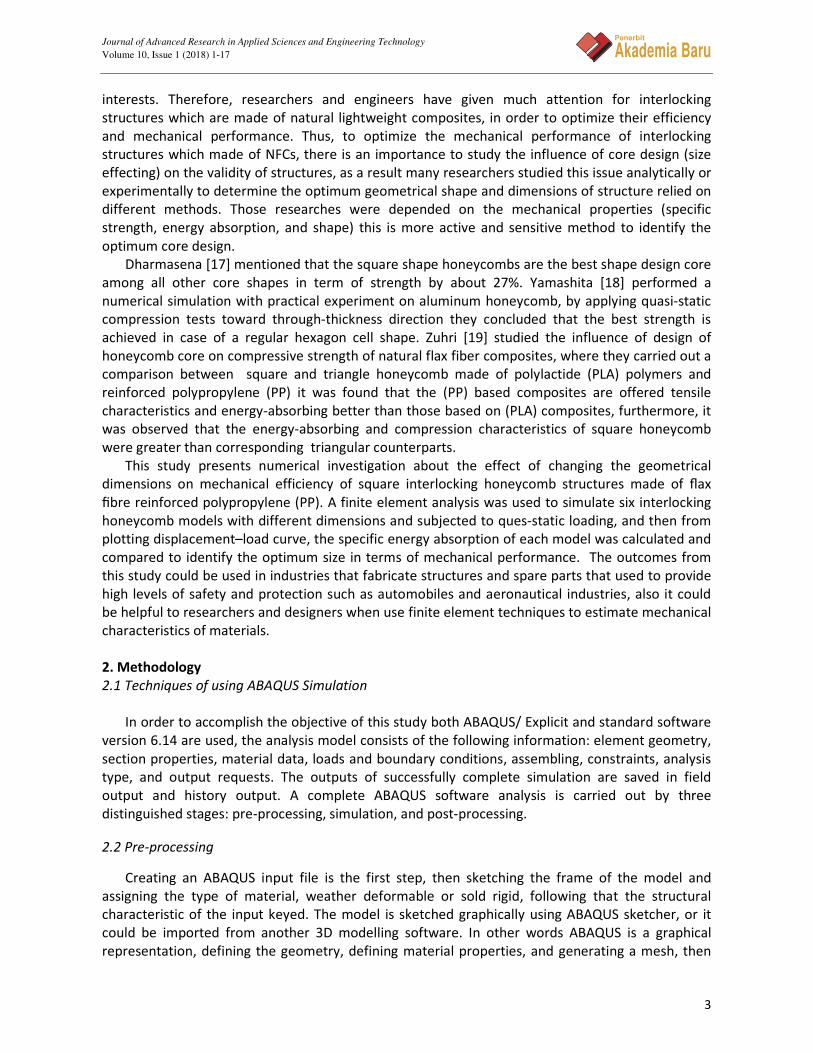
2.5 Element Type and Meshing
For the honeycomb cores the used element is 3D deformable solid homogeneous with eight-
node brick (C3D8R), the meshing control is structure hex with an 8-node linear brick and reduced
integration hourglass control, the meshing size of element should be similar along every unit cell
size [20]. The CPU time is affected by the meshing size of element; too large element size leads to a
greater value of stress, while a finer mesh size leads to much memory usage and is time consuming.
For both top and bottom platen the used element is 3D discrete rigid type S4R none deformable,
the meshing control is set to be free quad with a 4-node 3D bilinear rigid quadrilateral. Hibbitt [21]
reported that to avoid penetration between honeycomb core and platens during compressing
process, the meshing size of platens should be assigned to be larger than the core structure
meshing size.
Journal of Advanced Research in Applied Sciences and Engineering Technology
Volume 10, Issue 1 (2018) 1-17
5
Penerbit
Akademia Baru
Fig. 1. Meshing of interlocking structure and platens
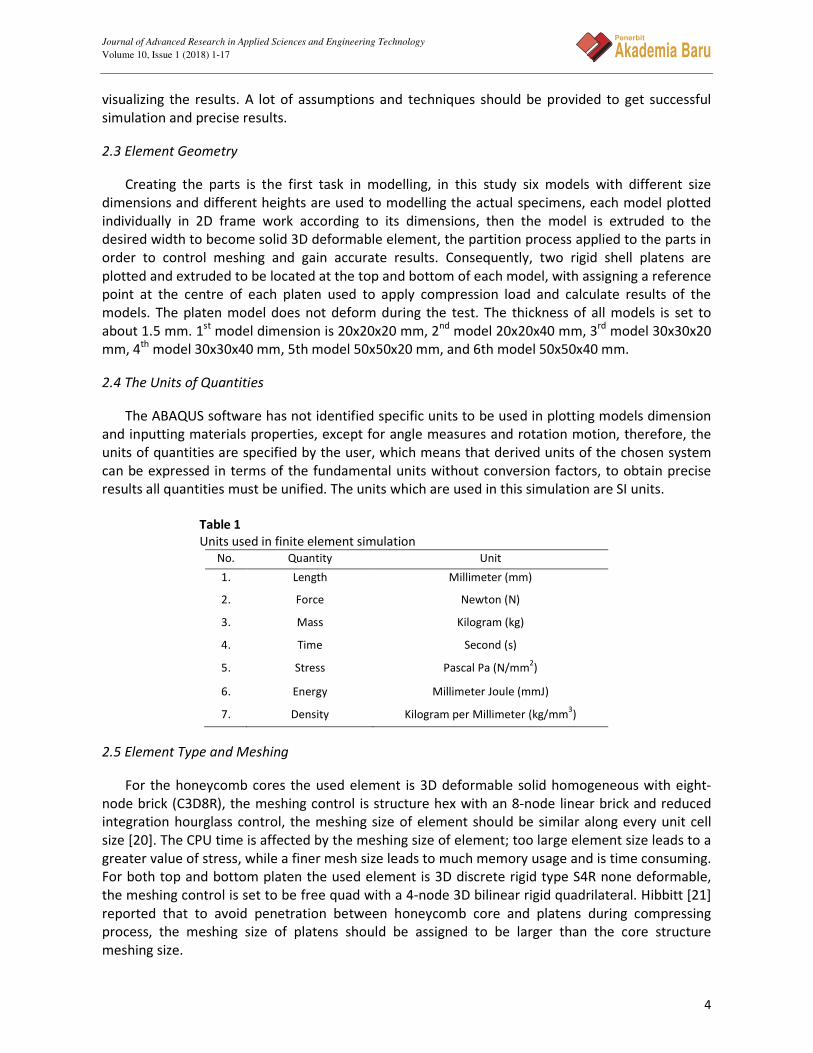
2.6 Assembling the Model and Interaction
All the parts of the honeycomb created earlier with both top and bottom platens are translated
together in assembly stage to achieve the required model shape. Figure 2 shows the assembly
process of interlocking core with top and bottom platens which are used to compress the model. To
define the surfaces contact among the model parts, a general contact generated between the
interlocking parts of model, and surface to surface contact generated between the honeycomb core
and both top and bottom platen. The contact property will be hard contact and frictionless in the
tangential direction in case of general contact, while in case of surface to surface contact the
contact property will be with penalty friction. Moreover, a tie constraint is created between platen
surface and honeycomb core surface with allowing for small sliding between surfaces. Tow
reference points are created at the centre of each platen to use in applying loads and calculating
results.
Fig. 2. The assembly of interlocking core with upper and bottom platens
Journal of Advanced Research in Applied Sciences and Engineering Technology
Volume 10, Issue 1 (2018) 1-17
6
Penerbit
Akademia Baru
2.7 Boundary Conditions and Loading
In current case, Abaqus/standard will be performed firstly to accurately simulate the
perturbation behaviour of honeycomb. The step procedure type will be linear perturbation under
buckling mode, with subspace Eigen-solver. For the boundary conditions the lower platen is fully
fixed and upper platen moves toward y-direction at constant rate to compress the honeycomb
core. Loading type is concentrated force assigned either to upper reference point or to upper
surface of top platen; this force is distributed uniformly toward y-direction. Following that the
imperfection pattern which produced of the previous abaqus/standard is imported into
Abaqus/explicit by using Input file usage: *IMPERFECTION, FILE=results_file, STEP=step.
Abaqus/explicit is applied to simulate the full imperfection of models, where the loading will
change to be dynamic explicit load, and the boundary condition remained similar to that in
abaqus/standard. The reference points at centre of platens are used to record the values of
reaction force and crushing displacement, the field output and history output files are created
either from particular point in model or from the whole model or over a part of model, those files
used to define the required output from the overall analysis such as kinetic energy, forces,
displacement, stress, strain, and soon. The numerical data obtained from abaqus simulation could
be imported to Microsoft EXCEL to perform the calculations and plotting graphs.
2.8 Simulation
In this stage ABAQUS job file is created to solve the numerical problem which defined in the
model and identified the case of analysis linear or nonlinear analysis. Complicated models could be
simulated with this software with high level of flexibility workforce; the accuracy of outcomes from
analysis is depending on many parameters such as the mesh refinement and type of element
selected along with the accuracy of mechanical properties of used material. During analysis the CPU
time, stable time, and step time are calculated along with number of increment and kinetic energy,
warning and error messages established in case if any syntax error committed. This simulation
technique may take interval from seconds to days to complete an analysis run, that is rely on the
complexity of the problem being analysed and the specifications of the computer being used.
2.9 Post-processing
In this stage the results are evaluated as soon as the simulation has been accomplished
successfully, and the necessary variables have been calculated. The evaluation is done by using the
Visualization module of ABAQUS/explicit. The Visualization module, which reads the binary output
database file, has a multi options for displaying the results, including, animations, deformed shape
plots, colour contour plots, and X–Y plots. Once the model is complete, ABAQUS/explicit can
submit, monitor, and control the products analysis jobs. The Visualization module can then be used
to interpret the results.
2.10 Material Type and Specifications
The material which used as a sample in this research is natural flax fibre reinforced by
polypropylene (PP), where the numerical analysis was carried out onto six samples having square
shape honeycomb core design, the wall thickness is constant about 1.5 mm for all samples, and
dimensions of cell size in the range between 20 mm and 50 mm, with height between 20 mm and
40 mm. Moreover, to conduct a successful study with tangible scientific values, the specifications
and mechanical properties of selected material model defined appropriately, ABAQUS technique

Journal of Advanced Research in Applied Sciences and Engineering Technology
Volume 10, Issue 1 (2018) 1-17
7
Penerbit
Akademia Baru
has capability to deal with various types of materials. In this study, a flax fibre /PP with properties:
The Young’s modulus is 3.7 GPa, the density is 800 Kg/m3, and Poisson’s ratio is 0.3, [19].
2.11 Mesh Refinement and Model Sensitivity
Abaqus software is a technique depending on meshing principle in calculating the results, the
meshing size of the model is very important factor to get the accurate results, that is why before
obtaining the final results of the finite element analysis a meshing sensitivity investigation should
be carried out to all the models, the meshing study is done by varying the approximate global size
throughout the core geometry of each module. The concept of mesh sensitivity analysis stated that
the maximum load for the model is relaying on refinement degree of the mesh and element size as
well, by other mean time-force curve is used to identify the optimum meshing size of model with
taking the CPU time in consideration [22]. Figure 3 shows the effect of changing meshing size on the
reaction force of the 20x20 mm model. This variation occurred due to change of the approximate
global size value in seed part window in Abaqus program. A gradual altering in the meshing size
control starting from the smallest meshing size value where the ABAQUS program could start
calculations, continued until the changing in meshing size values become insignificant, this step
considers as evaluating process to determine the appropriate meshing size for the models.
However, if a meshing size is refined to very small density, it will require long running CPU times,
and large amount of computer memory. The extra-large meshing refinements lead to convergence
in results [23]. The values of maximum reaction forces which results from changing meshing
refinement, with CPU time for each running test, are used to plot the graph in figure 4 which
included meshing size, maximum loads, and CPU times. The intersection point of the maximum
loads line with CPU time curve is used to determine the optimum meshing size for the models. As
shown in the figure the intersection point is approximately corresponding to meshing size 1 mm. As
a result, the meshing size 1 mm is selected to be the refinement size to all models. To determine
the appropriate duration to run a successful explicit analysis, a series of numerical runs with
different time durations are carried out, until the dynamic effect became insignificant. Via this
approach, the running time duration was assigned to 0.1 second [24].
Fig. 3. Effect of changing meshing size on the reaction force
0
20
40
60
80
100
120
140
0 0.01 0.02 0.03 0.04 0.05 0.06 0.07 0.08 0.09
Load
(k
N)
Time (s)
m0.5
m0.75
m1
m1.25
m1.5

Journal of Advanced Research in Applied Sciences and Engineering Technology
Volume 10, Issue 1 (2018) 1-17
8
Penerbit
Akademia Baru
Fig. 4. Relationship between meshing size and both max load and CPU time
2.12 Energy absorption calculation
The law of Energy conservation states that the total energy contained by a substance or a
structure cannot be destroyed or created, but it may be transferred from one form of energy to
another. Therefore, in this study a compression test is conducted to analyse the energy absorption
capability of interlocking structure, the absorbed energy by structure could be estimated from the
load-displacement curves, where integration of the area under the curve up to densification point
multiplied by average reaction force represents the capacity of absorbed-energy for the structure
[25]. Figure 5 shows the area of absorbed-energy for structure. The energy absorption ability of
material dependents on the shape and size of the specimen, as the amount of absorbed energy
increased the rate of deformation will be larger, this absorbed energy usually transformed into
plastic deformation [26].
Fig. 5. Shows the area of absorbed energy in load-displacement curve [27]
2.13 Specific Energy Absorption
The term of specific energy absorption (SEA) in unit kJ/kg is used to differentiate between
results of lightweight materials structures [28]. To achieve the optimum structure efficiency in
0
10
20
30
40
50
60
70
80
90
0
10
20
30
40
50
60
70
80
0 0.2 0.4 0.6 0.8 1 1.2 1.4 1.6
CP
U t
ime
(s)
max
imu
m load
(k
N)
meshing size (mm)

Journal of Advanced Research in Applied Sciences and Engineering Technology
Volume 10, Issue 1 (2018) 1-17
9
Penerbit
Akademia Baru
designing of energy-absorbing structures a comparison study to models in terms of specific energy
absorption should be performed [29]. Where the higher value of specific energy absorption
represents the better energy absorption capability relative to unit weight of structure [30]. The
specific energy absorption of material or structure is obtained by dividing the calculated value of
absorbed energy below load–displacement curve up to densification point by the unit mass of
material [26]. The mass of material (kg) is achieved by multiplying the density of material in the
structure volume. Li [6] reported that when designing an energy absorber structure, different
measures can be applied to evaluate the performance. These measures may be energy absorption
per unit mass or per unit volume, which are often called the specific energy absorption. Reduction
in the mass and volume are always desirable in the design of energy absorbing elements.
Therefore, the specific energy absorption is used to characterize the energy absorption of metal
honeycombs.
3. Results and Discussions
3.1 Geometry Imperfection and Buckling Mode
Due to the thin thickness of the interlocking cells, the flax/PP composite reveals buckling before
the core fully crushed. For that reason, the geometrical imperfection pattern was included into the
model to accurately predict the failure behaviour of the interlocking core structure. The geometric
imperfection pattern is defined as a linear superposition of buckling Eigen-modes achieved from a
prior eigenvalue buckling prediction performed with Abaqus/Standard [21]. The process of
calculating and identifying the full geometric imperfection behaviour of the structures in
ABAQUS/explicit simulation is achieved by adding linear buckling (perturbation) mode by using
abaqus/standard first, then the post-buckling (nonlinear buckling) is carried out [31]. In the linear
buckling process abaqus/standard will calculate eigenvalues for buckling mode of structure, and by
adding the Input file: *NODE FILE U in edit keywords file for the model, consequently, the
abaqus/explicit will import these values of Eigen-mode to the perfect geometry in order to
introduce the final imperfection shape of structure. To define the imperfection of weighted mode
shapes, specify the results job file and step number from eigenvalue buckling calculation analysis.
The importing of Eigen-mode data for identified node set is done by using the input file
*IMPERFECTION FILE=results_file, STEP=step. Figure 6 shows the initial imperfection behaviour of
the model with size of 20x20 mm, at displacement of 2 mm this imperfection is done by
Abaqus/standard simulation, by applying quasi-static load, the step manger is linear parturition
buckling mode.
Fig. 6. the initial imperfection behavior of the model with size of 20x20 mm

Journal of Advanced Research in Applied Sciences and Engineering Technology
Volume 10, Issue 1 (2018) 1-17
10
Penerbit
Akademia Baru
3.2 Core Size of 20x20 mm
The volume of this model equals to 11205 mm3, and the total mass is about 89.64x10
-4 kg.
Figure 7 shows the load-displacement curve of the model under compression load, in the linear
transition region the curve starts with a speedy increase until reach the peak load at about 1mm
displacement, then the load drops abruptly to crushing zone, where the structure is continuously
compressed until reaches the point of densification at 13.60 mm displacement. The amount of
absorbed energy by this model is calculated from displacement-force curve it found to be 0.65 kJ
and the corresponding specific energy is 72.61 kJ/kg.
Fig. 7. Load-displacement curve for core cell size 20x20 mm
3.3 Core Size of 20x40 mm
The deformation stages of this model under compression load are as following, the curve line in
the linear transition zone reached the maximum load at 1.2 mm displacement, then as the model
starts collapsing the load decreased rapidly to crushing region, where, the curve appeared a
fluctuated movement resulted of the resistance of structure to crushing, the complete collapse
occurred at 29.40 mm displacement. The volume of this model is about 22410 mm3, with mass of
179.28x10⁻⁴
kg. Figure 8 shows the deformation shape of the model at different crushing
displacements along the height of its core. The amount of absorbed energy from this model is
about 0.841 kJ, while the specific energy absorption is 46.93 kJ/kg.
3.4 Core Size of 30x20 mm
The results obtained from the preliminary analysis of core size of 30x20 mm are shown in Figure
9 the curve rose up rapidly to record maximum load equals to 112.80 kN in linear region.
Thereafter, the curve declined gradually to the crushing area with a noticeable resistance to the
applied load, the load continued compressing the structure until the fully crush occurred at
densification point which is corresponding to about 14.25 mm displacement. The volume of this
model is 16605 mm3, and its mass 132.84x10
-4 kg. The amount of absorbed energy is estimated to
be 0.79 kJ, and according to the total mass of the model the specific energy absorption is estimated
to be 59.14 kJ/kg.
0
10
20
30
40
50
60
70
80
90
0 2 4 6 8 10 12 14 16
Load
(k
N)
Displacement (mm)

Journal of Advanced Research in Applied Sciences and Engineering Technology
Volume 10, Issue 1 (2018) 1-17
11
Penerbit
Akademia Baru
Fig. 8. Load-displacement curve for core cell size 20x40 mm
Fig. 9. Load-displacement curve for core cell size 30x20 mm
3.5 Core size of 30x40 mm
The load-displacement graph in Figure 10 shows the crushing behaviour of the model size of
30x40 mm under compression load, in the linear transition zone the maximum load reached at 1.2
mm displacement, then the load decreased rapidly until reached the crushing region, where, the
curve appeared an oscillatory motion resulted of the resistance of the structure to crushing, the
fully collapse occurred at 29.71 mm displacement. The volume of this model is about 33210 mm3,
with mass of 265.68x10⁻⁴
kg. The amount of absorbed energy from this model is about 1.08 kJ,
while the specific energy absorption is 40.71 kJ/kg.
0
10
20
30
40
50
60
70
80
0 5 10 15 20 25 30 35
Load
(k
N)
Displacement (mm)
0
20
40
60
80
100
120
140
0 2 4 6 8 10 12 14 16
Load
(k
N)
Displacement (mm)

Journal of Advanced Research in Applied Sciences and Engineering Technology
Volume 10, Issue 1 (2018) 1-17
12
Penerbit
Akademia Baru
Fig. 10. Load-displacement curve for core cell size of 30x40 mm
3.6 Core size of 50x20 mm
As shown in Figure 11 the first phase of the load-displacement curve for this model starts with a
rapid increase in region of linear transition until reaches the maximum load by 172 kN. Following
that, the load decreased slightly created a sustained crushing region, where the load continued
compressing the structure until the sustained crushing completed at densification point
corresponding to about 15 mm displacement. The mass of model is 219.24x10⁻⁴
kg, and its volume
is 27405 mm3. The amount of absorbed energy according to the area under the curve is 1.29 kJ;
meanwhile, the value of specific energy absorption relative to the total mass of model is 58.66
kJ/kg.
Fig. 11. Load-displacement curve for core cell size 50x20 mm
3.7 Core size of 50x40 mm
The entire volume of this model is roughly equivalent to 54810 mm3 and its total mass about
438.48x10⁻⁴
kg. Figure 12 shows the load-displacement graph for this model, the curve starts with a
prompt increase recorded the highest reaction force at 1.4 mm displacement, then the load
0
10
20
30
40
50
60
70
80
90
100
0 5 10 15 20 25 30 35
Load
(k
N)
Displacement (mm)
0
50
100
150
200
250
0 2 4 6 8 10 12 14 16
Load (
kN
)
Displacement (mm)
Journal of Advanced Research in Applied Sciences and Engineering Technology
Volume 10, Issue 1 (2018) 1-17
13
Penerbit
Akademia Baru
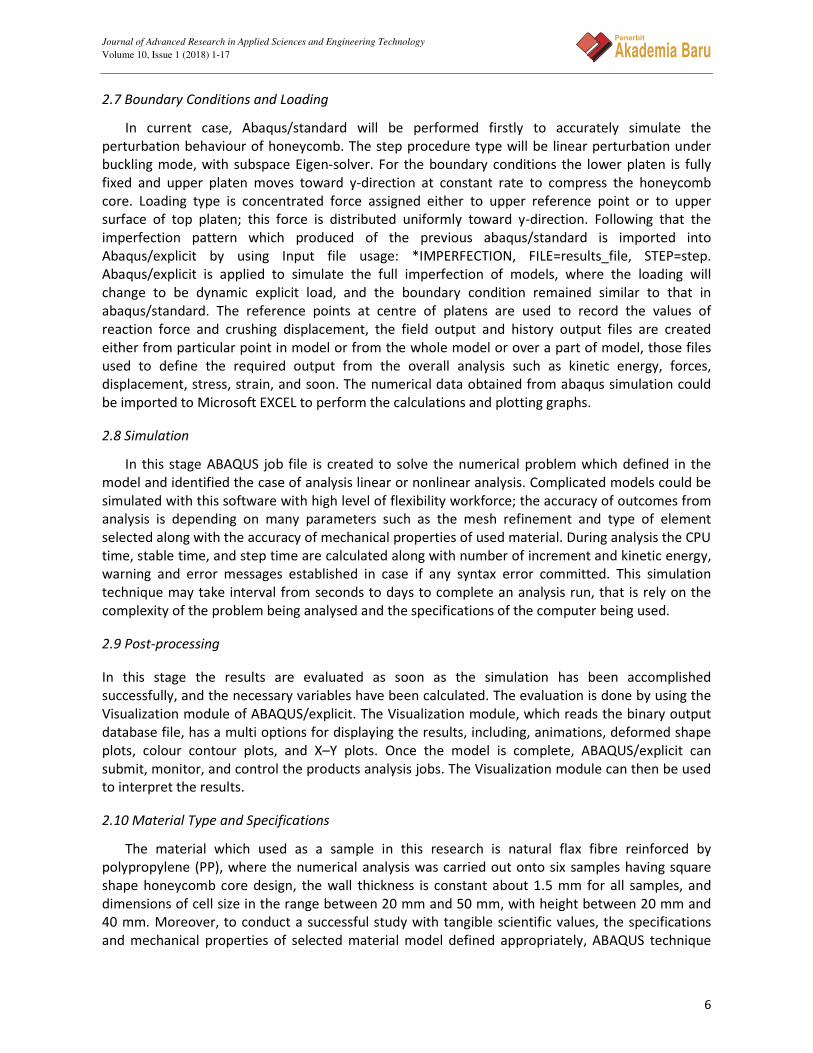
decreased steadily to stabilize temporary in crushing region where, the structure is continuously
compressed until reaches the point of densification at 31.50 mm displacement when the crushing is
completely finished. Due to it is large volume this model absorbed the highest amount of energy by
about 1.6 kJ; and the specific energy absorption is 36.54 kJ/kg.
Fig. 12. Load-displacement curve for core cell size 50x40 mm
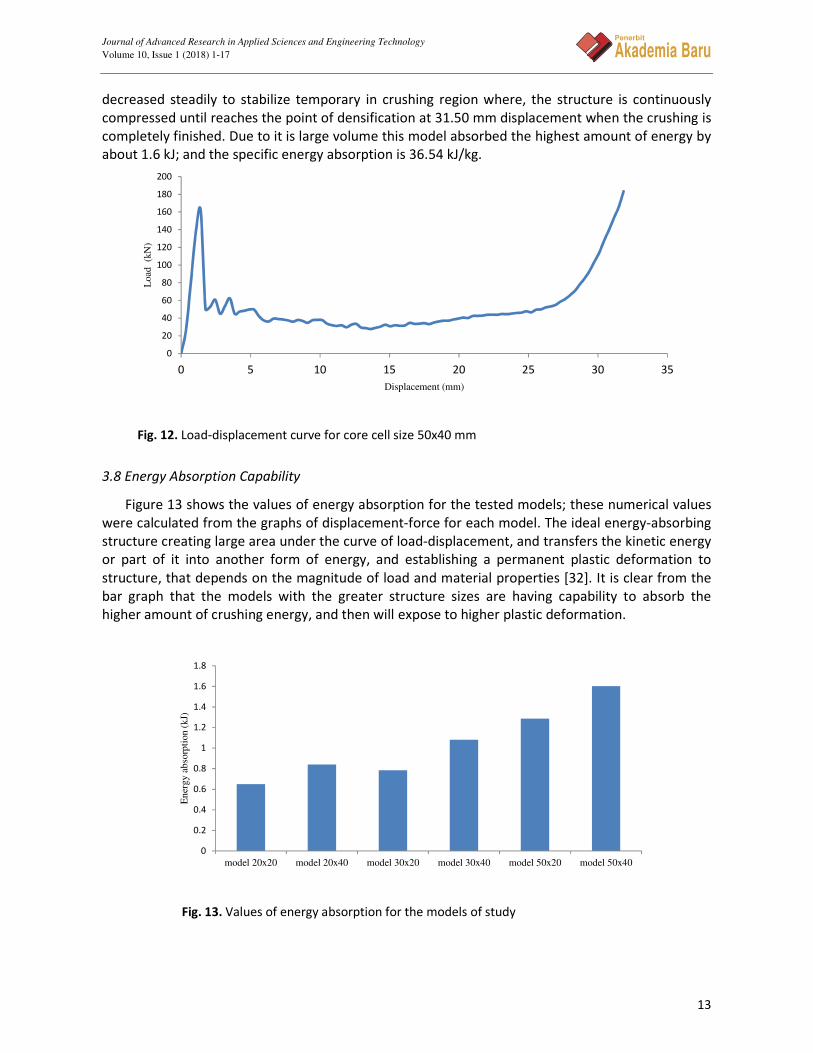
3.8 Energy Absorption Capability
Figure 13 shows the values of energy absorption for the tested models; these numerical values
were calculated from the graphs of displacement-force for each model. The ideal energy-absorbing
structure creating large area under the curve of load-displacement, and transfers the kinetic energy
or part of it into another form of energy, and establishing a permanent plastic deformation to
structure, that depends on the magnitude of load and material properties [32]. It is clear from the
bar graph that the models with the greater structure sizes are having capability to absorb the
higher amount of crushing energy, and then will expose to higher plastic deformation.
Fig. 13. Values of energy absorption for the models of study
0
20
40
60
80
100
120
140
160
180
200
0 5 10 15 20 25 30 35
Load
(k
N)
Displacement (mm)
0
0.2
0.4
0.6
0.8
1
1.2
1.4
1.6
1.8
model 20x20 model 20x40 model 30x20 model 30x40 model 50x20 model 50x40
En
ergy a
bso
rpti
on
(k
J)

Journal of Advanced Research in Applied Sciences and Engineering Technology
Volume 10, Issue 1 (2018) 1-17
14
Penerbit
Akademia Baru
3.9 Specific Energy Absorption
The mechanical performance of the thin wall and lightweight structures does not evaluate by the
amount of absorbed energy via the model according to its size. Therefore, to compare the results
among different analyses of lightweight structures the specific energy absorption (SEA) is generally
used. Where, the higher value of SEA points out to the optimum performance in absorbing energy
relative to unit mass [28]. Figure 14 demonstrates the values of specific energy for the six models,
the model with size of 20x20 mm recorded the highest magnitude of SEA by about 72.62 kJ/kg.
Meanwhile, the model size of 50x40 mm recorded the lowest value with around 36.54 kJ/kg. The
models with sizes of 30x20 mm and 50x20 mm recorded approximately close values of specific
energy absorption by 59.14 kJ/kg and, 58.66 kJ/kg respectively.
Fig. 14. Values of specific energy absorption for the models of study
Table 2
Specifications of the models of study
Model Volume (mm3) Mass (kg) EA (kJ) SEA (kJ/kg)
20x20 11205 89.64X10⁻⁴ 0.65 72.62
20x40 22410 179.28X10⁻⁴ 0.84 46.94
30x20 16605 132.84X10⁻⁴ 0.79 59.14
30x40 33210 265.68X10⁻⁴ 1.08 40.71
50x20 27405 219.24X10⁻⁴ 1.29 58.66
50x40 54810 438.48X10⁻⁴ 1.60 36.54
3.10 Comparison with Previously Published Data
3.10.1 Comparison of deformation behaviour
A previous experiment study conducted by Wu [33] concluded an identical description to this
research results about the deformation behavior of honeycomb under compression load; where, six
types of honeycomb structures were subjected to quasi-static loading. The findings revealed that,
all honeycomb specimens showed a sharp peak load at beginning of applying force, followed by an
oscillatory decreasing to crush load with a nearly constant mean value in crushing region, then the
load rose up after the full crushing occurred at onset densification point. Likewise, a lately study by
0
10
20
30
40
50
60
70
80
model 20x20 model 20x40 model 30x20 model 30x40 model 50x20 model 50x40
Sp
ecif
ic e
ner
gy a
bso
rpti
on
(k
J/k
g)

Journal of Advanced Research in Applied Sciences and Engineering Technology
Volume 10, Issue 1 (2018) 1-17
15
Penerbit
Akademia Baru
Zuhri [19] mentioned the same trends of deformation stages for square and triangular honeycombs
subjected to compression load. Furthermore, Li [6] described the three phases of deformation
when honeycomb mechanics properties are studied. The first phase is linear elastic region where
the honeycomb structures absorb energy through the elastic buckling of cell walls and the stress
inside the wall reach to the peak value during the initial compression. The second phase is the
stable plastic crushing phase; here the compressive stress is almost constant and the honeycomb
structure absorbs energy through the plastic collapse of the cell walls. The third phase is the
compaction phase described as follows. The walls of honeycomb are plastically collapsed, further
deformation compresses the core tightly and leads to a sudden increase in the load-displacement
curve. This phase represents the deformation ability of the honeycombs.
3.10.2 Comparison of SEA values
The outcomes of the current study showed that, the shorter heights of honeycomb core
structure offer better specific energy absorption than longer height structures counterpart, these
results are validated by previous study carried out by Roslan [5] when they conducted a
compression tests to square and triangular honeycomb core structures based on bamboo-epoxy
composites, to study their specific energy absorption. The findings indicated that the smaller cell
height of honeycomb is able to absorb more energy than the bigger cell height one.
4. Conclusions
The compression response of the square interlocking structures made of flax fiber reinforced
polypropylene (PP) composite has been successfully investigated using ABAQUS software. The
simulation was carried out on six models with a different cell heights and sizes and same wall
thickness. Initially, Abaqus/standard was applied to introduce the imperfection behavior of the
models then, this imperfection is imported to Abaqus/explicit to simulate the final deformation of
the models. Following this a few conclusions has been made:
• The optimum mechanical performance of lightweight interlocking structures is evaluated
according to the values of specific energy absorption. Hence the core structure with cell size
of 20x20 mm exhibited the highest value of specific energy absorption, and the lowest value
is obtained from the cell size of 50x40 mm.
• The models with shorter cell heights appeared better specific energy absorption than the
models with higher cell height counterpart. By other mean, the mechanical performance of
the interlocking structures is inversely proportional to the height of cell.
• Despite their low density and lightweight the flax/PP composites showed outstanding
mechanical performance and good energy absorption capabilities under compression loads.
References [1] Estrin, Yuri, A. V. Dyskin, and Elena Pasternak. "Topological interlocking as a material design concept." Materials
Science and Engineering: C 31, no. 6 (2011): 1189-1194.
[2] Benyahia, Azzedine, and Abdellah Merrouche. "Effect of chemical surface modifications on the properties of alfa
fiber-polyester composites." Polymer-Plastics Technology and Engineering 53, no. 4 (2014): 403-410.
[3] Ahmad, Furqan, Heung Soap Choi, and Myung Kyun Park. "A review: natural fiber composites selection in view of
mechanical, light weight, and economic properties." Macromolecular Materials and Engineering 300, no. 1
(2015): 10-24.
Journal of Advanced Research in Applied Sciences and Engineering Technology
Volume 10, Issue 1 (2018) 1-17
16
Penerbit
Akademia Baru
[4] Amina, Z., Roslina Mohammad, S. Abdul Azizc, and N. Othmand. "Workers’ Safety Awareness Level on Hand
Related Injury Accident in Metal Fabrication Industry." Journal of Advanced Research in Applied Sciences and
Engineering Technology 1: 1-12.
[5] Roslan, S. A. H., M. Z. Hassan, Z. A. Rasid, S. A. Zaki, Y. Daud, S. Aziz, S. Sarip, and Z. Ismail. "Mechanical properties
of bamboo reinforced epoxy sandwich structure composites." International Journal of Automotive and
Mechanical Engineering 12 (2015): 2882.
[6] Li, Meng, Zong-quan Deng, Hong-wei Guo, Rong-qiang Liu, and Bei-chen Ding. "Optimizing crashworthiness design
of square honeycomb structure." Journal of Central South University 21, no. 3 (2014): 912-919.
[7] Umar, A. H., E. S. Zainudin, and S. M. Sapuan. "Effect of accelerated weathering on tensile properties of kenaf
reinforced high-density polyethylene composites." Journal of Mechanical Engineering and Sciences 2 (2012): 198-
205.
[8] Mallaiah, Sripathy, Krishna Vinayak Sharma, and M. Krishna. "Development and comparative studies of bio-based
and synthetic fiber based sandwich structures." Int J Soft Compos Eng 2 (2012): 332-335.
[9] Pandey, Jitendra K., S. H. Ahn, Caroline S. Lee, Amar K. Mohanty, and Manjusri Misra. "Recent advances in the
application of natural fiber based composites." Macromolecular Materials and Engineering 295, no. 11 (2010):
975-989.
[10] Loh, X. H., M. Ahadlin M. Daud, M. Zulkefli Selamat, and UniversitiTeknikal Malaysia Melaka. "Study on Fibre
Length and Composition of Kenaf-Polypropylene (K-PP) Composite for Automobile Interior Parts." Applied
Mechanics and Materials 695 (2014): 36.
[11] Holbery, James, and Dan Houston. "Natural-fiber-reinforced polymer composites in automotive
applications." JOM Journal of the Minerals, Metals and Materials Society 58, no. 11 (2006): 80-86.
[12] WEAGER, Brendon. "High-performance biocomposites: novel aligned natural fibre reinforcements." JEC
composites 55 (2010): 31-32.
[13] Abrate, Serge. "Localized impact on sandwich structures with laminated facings." Applied Mechanics Reviews 50
(1997): 69-82.
[14] Yin, Hanfeng, Guilin Wen, Shujuan Hou, and Kai Chen. "Crushing analysis and multiobjective crashworthiness
optimization of honeycomb-filled single and bitubular polygonal tubes." Materials & Design 32, no. 8 (2011):
4449-4460.
[15] Aziz, Alia Ruzanna. "The energy-absorbing characteristics of novel tube-reinforced sandwich structures." PhD
diss., University of Liverpool, 2015.
[16] Xue, P., T. X. Yu, and X. M. Tao. "Effect of cell geometry on the energy-absorbing capacity of grid-domed textile
composites." Composites Part A: Applied Science and Manufacturing 31, no. 8 (2000): 861-868.
[17] Dharmasena, K. P., D. T. Queheillalt, H. N. G. Wadley, P. Dudt, Y. Chen, D. Knight, A. G. Evans, and V. S.
Deshpande. "Dynamic compression of metallic sandwich structures during planar impulsive loading in
water." European Journal of Mechanics-A/Solids 29, no. 1 (2010): 56-67.
[18] Yamashita, M., and M. Gotoh. "Impact behavior of honeycomb structures with various cell specifications—
numerical simulation and experiment." International Journal of Impact Engineering 32, no. 1 (2005): 618-630.
[19] Zuhri, M. Y. M., Z. W. Guan, and W. J. Cantwell. "The mechanical properties of natural fibre based honeycomb
core materials." Composites Part B: Engineering 58 (2014): 1-9.
[20] Smith, M., Z. Guan, and W. J. Cantwell. "Finite element modelling of the compressive response of lattice
structures manufactured using the selective laser melting technique." International Journal of Mechanical
Sciences 67 (2013): 28-41.
[21] Hibbitt, Karlsson and Sorensen. (2012) Abaqus/CAE User’s Manual (6.12): Dassault Systèmes Simulia Corp.,
Providence, RI, USA.
[22] Rejab, Mat, and Mohd Ruzaimi. "The mechanical properties of novel lightweight structures based on corrugated-
cores." PhD diss., University of Liverpool, 2013.
[23] Wallace, John R. "Introduction to meshing algorithms for radiosity." SIGGRAPH’92 Radiosity Course Notes (1992).
[24] Al Galib, D., and A. Limam. "Experimental and numerical investigation of static and dynamic axial crushing of
circular aluminum tubes." Thin-Walled Structures 42, no. 8 (2004): 1103-1137.
[25] Farley, Gary L. "Energy absorption of composite materials." Journal of composite Materials 17, no. 3 (1983): 267-
279.
[26] Hamada, H., and S. Ramakrishna. "Impact performance of glass cloth/epoxy composite tubes with different
surface treatment." Composite Interfaces 4, no. 1 (1996): 35-44.
[27] Li, Q. M., I. Magkiriadis, and John J. Harrigan. "Compressive strain at the onset of densification of cellular
solids." Journal of cellular plastics 42, no. 5 (2006): 371-392.
[28] Heimbs, Sebastian. "Energy absorption in aircraft structures." In International Workshop on Hydraulic Equipment
and Support Systems for Mining, Huludao, China, pp. 17-18. 2012.

Journal of Advanced Research in Applied Sciences and Engineering Technology
Volume 10, Issue 1 (2018) 1-17
17
Penerbit
Akademia Baru
[29] Thornton, P. H., J. J. Harwood, and P. Beardmore. "Fiber-reinforced plastic composites for energy absorption
purposes." Composites Science and Technology 24, no. 4 (1985): 275-298.
[30] Li, Meng, Zong-quan Deng, Hong-wei Guo, Rong-qiang Liu, and Bei-chen Ding. "Optimizing crashworthiness design
of square honeycomb structure." Journal of Central South University 21, no. 3 (2014): 912-919.
[31] Kazemahvazi, Sohrab, Daniel Tanner, and Dan Zenkert. "Corrugated all-composite sandwich structures. Part 2:
Failure mechanisms and experimental programme." Composites Science and Technology 69, no. 7 (2009): 920-
925.
[32] Alghamdi, A. A. A. "Collapsible impact energy absorbers: an overview." Thin-walled structures 39, no. 2 (2001):
189-213.
[33] Wu, Enboa, and Wu-Shung Jiang. "Axial crush of metallic honeycombs." International Journal of Impact
Engineering 19, no. 5-6 (1997): 439-456.