no. 41 December 2021 ISSN 2300-5599 - CBI Pro-Akademia
81
no. 41 December 2021 ISSN 2300-5599
-
Upload
khangminh22 -
Category
Documents
-
view
0 -
download
0
Transcript of no. 41 December 2021 ISSN 2300-5599 - CBI Pro-Akademia

no. 41
December 2021
ISSN 2300-5599

Acta Innovations quarterly no. 41 Konstantynów Łódzki, Poland, December 2021 ISSN 2300-5599 Original version: online journal Online open access: www.proakademia.eu/en/acta-innovations Articles published in this journal are peer-reviewed Publisher: Research and Innovation Centre Pro-Akademia 9/11 Innowacyjna Street 95-050 Konstantynów Łódzki Poland Editor in Chief: Rafał Marcin Łukasik, Ph.D. © Copyright by Research and Innovation Centre Pro-Akademia, Konstantynów Łódzki 2021

no. 41
December 2021

Acta Innovations 2021 no. 41 4
Contents
Sandip Kumar Mishra, Sanjeev Dahiya, Brijesh Gangil, Lalit Ranakoti, Surendra Kumar MECHANICAL PROPERTIES OF FIBRE/FILLER BASED POLYLACTIC ACID (PLA) COMPOSITES: A BRIEF REVIEW…………………………………………………………………………………………………………………………………………………………5 Francesca Frongia, Laura Arru, Maria Rita Cramarossa, Luca Forti MICROALGAE POTENTIAL IN THE CAPTURE OF CO2 EMISSION……………………………………………………………………….19 Supriya Lamba Sahdev, Gurinder Singh, Navleen Kaur FACTORS CONTRIBUTING AND PROMOTING OPEN INNOVATION IN INDIAN FEMALE-OWNED FOOD PROCESSING SMES- PRIORITIZING THROUGH THE AHP TECHNIQUE……………………………………………………………..28 Surya P Gairola, Yogesh Tyagia, Brijesh Gangilb, Kanishk Jhac PHYSIO-MECHANICAL & WEAR PERFORMANCE OF BANANA FIBER/WALNUT POWDER BASED EPOXY COMPOSITES…………………………………………………………………………………………………………………………………………….…42 Almazbek Dooranov, Akima Orozalieva, Aisulu Parmanasova, Volodymyr Katan, Yuliia Horiashchenko, Yeugene Nagornyi ESTIMATION AND STIMULATION OF EXPORT POTENTIAL OF THE INNOVATIVELY ACTIVE ENTERPRISE BASED ON ECONOMIC AND MATHEMATICAL MODELLING…………………………………………………………….………………………..56 Kamil Królak, Maria Buła BREWING ON AN INDUSTRIAL AND A CRAFT SCALE – IMPACT ON THE PHYSICOCHEMICAL PROPERTIES AND VOLATILE COMPOUNDS PROFILE OF THE PALE PILSENER-STYLE LAGER BEER ANALYZED WITH HS/GC-MS……..65 Rafał M. Łukasik THANKS TO OUTSTANDING REVIEWERS FOR ACTA INNOVATIONS IN 2021…………………………………………………...81

Acta Innovations 2021 no. 41: 5-18 5
https://doi.org/10.32933/ActaInnovations.41.1 ISSN 2300-5599 2021 RIC Pro-Akademia – CC BY
MECHANICAL PROPERTIES OF FIBRE/ FILLER BASED POLY(LACTIC ACID) (PLA) COMPOSITES : A BRIEF REVIEW
Sandip Kumar Mishra Research Scholar, School of Engineering & Technology, University of Technology
Jaipur, Rajasthan, India
Sanjeev Dahiya School of Engineering & Technology, University of Technology
Jaipur, Rajasthan, India
Brijesh Gangil Mechanical Engineering Department, SOET, HNB Garhwal University
Srinagar, Uttarakhand, India, [email protected]
https://orcid.org/0000-0002-5849-5881
Lalit Ranakoti Department of Mechanical Engineering, NIT
Uttarakhand, Srinagar, India
Nikita Agrawal Department of Pedodontics, People College of Dental Sciences,
Bhopal, MP, India
Article history: Received 25 August 2021, Received in revised form 21 September 2021, Accepted 22 September 2021, Available online 2 September 2021
Abstract Being a biodegradable polymer, poly(lactic acid) (PLA) based composites receive greater preference over non-biodegradable plastics. Poly(lactic acid) has to find its place in various applications such as polymer composites, agriculture, biomedical, etc. Polymer composites based on PLA possess comparable mechanical strength, endurance, flexibility and endures future opportunities. Several combinations of natural fibers and filler-based PLA composites have been fabricated and investigated for physical and mechanical changes. Moreover, several biopolymers and compatibilizers are added to PLA to provide rigidity. The paper presents a tabulated review of the various natural fiber/filter-based PLA composites and the preparation and outcomes. In addition, enhancement made by the reinforcement of nano filler in the PLA are also discussed in brief. The significance of PLA in the biomedical application has been discussed in brief. The paper also shed lights in the social and economic aspects of PLA. Keywords poly(lactic acid) (PLA); biodegradable composites; mechanical properties. Introduction The increase in carbon emission and the excess usage of plastic polluting the air, land, and water are the major causes for the substitution of plastic for biodegradable polymers [1–3]. In fact, biodegradable polymers have become necessary to maintain an ecological balance between the source and waste production, ensuring minimum waste accumulation in the environment [4–6]. Millions of plastic commodities are being manufactured in everyday life, and almost equal is disposed of in the environment. These plastics are reinforced with various types of fibers and fillers to improve mechanical strength [7–9]. The most typical kinds of plastics used in daily practice are polypropylene, polyethylene, polystyrene, polyvinyl chloride, and polyurethane. The polymers mentioned above take a very long time to degrade hence called plastics or non-biodegradable polymers, due to the presence of a long polymeric chain and shows detrimental effects to the fertility of soil when dumped [10]. In an intention to resolve the issue of biodegradability, various natural and synthetic biopolymers were introduced in the market. Among them, PLA, a synthetic biopolymer, was found suitable to substitute the existing polymers due to good compatibility with other biopolymers to form blends, comparable tensile and flexural strength, large deformation, and remains thermally stable at elevated temperature [11]. PLA can be easily

Acta Innovations 2021 no. 41: 5-18 6
https://doi.org/10.32933/ActaInnovations.41.1 ISSN 2300-5599 2021 RIC Pro-Akademia – CC BY
manufactured by the process of fermentation and consume less energy during processing. It is cheap and available on the market. The alarming situation of CO2 emission by the use of non-biodegradable polymers can be curbed down by using PLA. Problem of disposing plastic in the landfills and aquatic can also be controlled to some extent. Using PLA as a bio material is not only beneficial economically but also favaourable for environment and social ecosystem. Many biopolymers are used in biocomposites with projected applications in sectors like automobile, marine engineering, aerospace, electronics, and household ware [12]. In the last decade or two, poly(lactic acid) has been extensively used as a matrix material for the fabrication of bio-composites with several types of reinforcements such as fiber (natural or synthetic), fillers (bio filler or nanofiller), metallic, and ceramics [13]. The properties of PLA-based composite fabricated in the past differ in method of fabrication, weightage of reinforcement, addition of compatibilizers etc. which will be discussed in the literature section. Process of manufacturing PLA based composites Composites based on PLA are prepared by various processes depending upon the nature of reinforcement and type of composite to be prepared. For instance, if the reinforcement is filler type, then twin-screw extruder (Figure 1) and injection moulding is used [14]. Various natural fillers such as wood flour, silicates, carbonates are reinforced in this process. In the case of fiber mat, a compression moulding machine is employed. Several kinds of natural and synthetic fiber can be reinforced with PLA in compression moulding machines such as hemp, kenaf, sisal, coir, wood, carbon, etc. [15–17]. Both the processes are equipped with the provision of a heating element to melt the pallets of PLA. Usually, the temperature range of heating elements is kept between 170-185o C. Blends of PLA have been often prepared to provide rigidity in which various kinds of biopolymers are added like polyethylene glycol (PEG), poly(butylene succinate) (PBS), poly(hydroxy acid) (PHA), natural rubber (NR), polycaprolactone (PCL) and poly(hydroxy butyrate) (PHB). These blends are prepared by a melt blending process in which polymers are mixed in a beaker and stirred [18]. Thereafter, the required reinforcement is added to the blend. Injection moulding or melt screw moulding is advantageous in several ways over other manufacturing processes like compression moulding, hand lay-up, vacuum assisted resin transfer moulding etc. for example low running cost, specimen for specific dimension can be made directly by using die at the exit, complex material can be fabricated easily, variety of polymer can be easily processed due to the presence of heating element, higher rate of production, longer working life because of low applied pressure and cleanliness of fabricated material due to lower possibility of contamination.
Figure 1. Melt extruder for the fabrication of composite based on PLA [14].

Acta Innovations 2021 no. 41: 5-18 7
https://doi.org/10.32933/ActaInnovations.41.1 ISSN 2300-5599 2021 RIC Pro-Akademia – CC BY
Work done on Poly(lactic acid) based composites:
Table.1. PLA based biopolymer reinforced with natural fibre.
S. No. Material Process parameters Particulars of research
Ref.
1 PLA grafted with 3 % Maleic anhydride reinforced with 30 % and 50 % Wood flour
Twin-screw corotating extruder followed by injection moulding.
Reduced flexural modulus, storage modulus, and tensile modulus were observed whereas failure strain, coefficient of thermal expansion, and melt flow index improved. Thermal stability was enhanced while the crystallinity of PLA decreased.
[19]
2 PLA with 5 % to 20 % fleece fiber and coir fiber
Hot-press moulding at a temperature of 170o C, the pressure of 10MPa, and moulding time of 10 minutes.
An increase in tensile strength of the composite was observed with an increase in the percentage of fleece fiber but it decreases as the fleece fiber weightage increases to 20 %. Modulus of elasticity increases with an increase in the percentage of fleece fiber.
[20]
3 PHB and PLA with 30 % short and long pulp fiber.
Fibers were mixed with a blend of PHB and PLA in a torque rheometer at 190 ºC
The impact strength was enhanced by a factor of 1.3, while tensile strength was enhanced by a factor of 1.5 as compared to the virgin blend of PLA and PHB.
[21]
4 PLA with olive husk flour at 10, 20, and 30 % reinforcement
Composites were prepared with the extrusion-injection moulding method.
Young modulus increased by almost 27 % from the initial value with the addition of olive husk flour. However, the tensile strength and elongation at break were reduced owing to poor dispersion and weak interfacial bonding. Treatment of olive husk flour resulted in an enhancement in interfacial bonding and improved mechanical and thermal properties.
[22]
5 PLA and short kenaf fiber
Blend of PLA, and short kenaf fiber was prepared by melt blending in Brabender internal mixer at 60 rpm and 170o C for 10 minutes.
The addition of short kenaf fiber improved the tensile strength and tensile modulus of the composite up to 30 wt. % of the reinforcement. At 40 wt. % and 50 wt. % of kenaf fiber reinforcement, the PLA matrix unable to wet the fiber and resulted in reduced tensile strength and tensile modulus. Change in the crystallinity and porosity of PLA was also observed due to the reinforcement of short kenaf fiber
[23]
6 PLA, PBS, PCL, PBAT, NR, PCL and grass fiber
Blending of polymer was carried out in laboratory and reinforced with grass fiber via injection moulding
Blending of polymer with NR significantly improved the impact strength. Improvement in the tensile strength and tensile modulus with the incorporation of grass fiber was observed but the impact strength and elongation at break reduced.
[24]

Acta Innovations 2021 no. 41: 5-18 8
https://doi.org/10.32933/ActaInnovations.41.1 ISSN 2300-5599 2021 RIC Pro-Akademia – CC BY
7 PLA and Basalt fiber Mixture of PLA and dried basalt fiber were prepared in twin screw extruder and then passes through injection moulding for the preparation of composite samples
The mechanical properties of PLA increased linearly with the increase in the percentage of basalt fiber in composite. The highest improvement in the mechanical properties were obtained at 30 % weightage of basalt fiber.
[25]
8 PLA and continuous carbon fiber
Fused deposition modelling
The carbon fiber reinforced PLA composite yielded enhanced tensile and flexural strength.
[26]
9 PLA, chitosan and carbon fiber
Solvent blending and immersed glow moulding process
The presence of chitosan in carbon fiber PLA composite helped bridge the gap between the fiber and matrix, resulting in improved shear and bending modulus. The rate of bio degradation of the composite accelerated with the addition of chitosan.
[27]
10 PLA and bamboo fiber Composites were prepared in injection moulding machines
Bamboo fiber lowered the glass transition temperature, storage modulus and loss modulus of the PLA. Moreover, the mechanical properties of PLA significantly reduced.
[28]
11 PLA, benzoyl peroxide, banana fiber and sisal fiber
Composites were prepared by twin screw extrusion followed by injection moulding process.
Excellent improvement in the mechanical properties of PLA especially in tensile and flexural strength attributed to the treatment of fibers with benzoyl peroxide.
[29]
12 PLA, sugar beet pulp and sorbitol and glycerol as plasticizer
Composites were prepared by twin screw extrusion followed by injection moulding process.
Tensile strength reduced by 25 % with the reinforcement of 30 % of sugar beet pulp whereas the elongation at break increases. Specific mechanical energy of PLA reduced from 1400 J/gram to 1000 J/gram.
[30]
13 PLA and okra fiber Co-rotating twin screw micro extruder
The stiffness of PLA increased with the addition of okra fiber. The morphological study revealed that fiber diameter was reduced by the chemical treatment but the interlocking enhanced between the fiber and matrix.
[31]
14 PLA and chitin Melt blending was used to prepare the blend of PLA and chitin
The drop in peak degradation temperature of PLA was observed with the addition of chitin. Char formation increased as PLA became more hydrophobic leading to enhancement in tensile and flexural strength.
[32]
15 PLA, carbon fiber and SEBS-g-MA as compatibilizer
Composites samples were prepared by single screw extruder
Tensile strength, tensile modulus and flexural modulus decreased whereas flexural strength increased marginally and significant improvement was observed in the impact strength of PLA with the addition of chitin.
[33]

Acta Innovations 2021 no. 41: 5-18 9
https://doi.org/10.32933/ActaInnovations.41.1 ISSN 2300-5599 2021 RIC Pro-Akademia – CC BY
16 PLA, cassava flour, pine apple flour and ash.
Samples were prepared by injection moulding machine
Mechanical properties of PLA enhanced up to 30 % of both cassava and pine flour reinforcement but started decreasing when the reinforcement weightage increased to 40 %.
[34]
17 PLA, basalt fiber and wood flour
Co rotating twin screw extruder was used to fabricated the composite samples
SEM micro graphs confirm the homogenous mixing of reinforcements in PLA. There was no improvement observed in the mechanical properties of PLA with the incorporation of basalt fiber rather decreased with the incorporation of wood flour in PLA.
[35]
18 PLA, epoxidized natural rubber and lignocellulose fiber
Composites samples were prepared by using a vulcanized mould in press moulding
On mixing natural rubber with PLA, the elasticity improved. The glass transition temperature of PLA increased with the addition of lignocellulose fiber. It was also found that the decomposition rate of PLA accelerated due to the incorporation of silane-treated lignocellulose fiber.
[36]
19 PLA and coir fiber Samples were prepared with co-rotating twin screw extruder
At 30 % reinforcement of coir fiber the tensile strength reduced to 52.8 MPa from 57.4 and elongation of break reduced to 2 % from 3.8 %. The tensile modulus was found to be increased from 4 GPa to 4.8 GPa.
[37]
20 PLA and hemp fiber Composite samples were prepared by twin-screw extrusion and injection moulding
At 40 wt. % loading of hemp fiber in PLA, the flexural strength, flexural modulus, and impact strength were found to be maximum with an increment of 62 %, 90 %, and 68 % respectively as compared to virgin PLA.
[38]
21 PLA, 25 wt. % cotton linters and 50 wt. % Mapple fiber
Composites samples were prepared via compounding followed by injection moulding
Marginal increase in the overall density was achieved with the addition of 25 % cotton linters in the PLA. Flexural modulus of PLA was increased by 56 % and 123 % by the addition of cotton linters and Mapple fiber respectively. Significant improvement in the impact strength of PLA was also observed.
[39]
22 PLA, office waste paper and PBAT
Composites were prepared by melt blending and injection moulding
The impact strength of PLA was enhanced by 291 % at 20 wt. % of office waste paper but the flexural modulus and flexural strength decreased. PBAT addition in PLA increases the water uptake stepwise.
[40]
23 PLA, kenaf fiber and rice husk
Compounding of PLA with fibers were carried out followed by samples preparation by injection moulding
The flexural modulus of PLA increased around 32 % and 18 % with the addition of kenaf fiber and rice husk respectively. However, flexural strength and impact strength decreased.
[41]
24 PLA, bamboo fiber and silane coupling agent
Composite samples were prepared by injection moulding
Storage modulus and loss modulus of PLA decreased as the weight percentage of bamboo fiber increased in the composite.
[28]

Acta Innovations 2021 no. 41: 5-18 10
https://doi.org/10.32933/ActaInnovations.41.1 ISSN 2300-5599 2021 RIC Pro-Akademia – CC BY
25 PLA, benzylated treated rice straw and nano clay
Solvent casting method was used to prepare the composite samples
Reduction in the peak intensity of the cellulosic hydroxyl group was observed with the addition of treated tice straw due to the formation of aromatic bonds. A slight increase in the crystallinity of PLA was observed due to strong molecular interaction between fiber and PLA.
[42]
26 PLA and rice straw Alkali pulping and benzylation was performed on the rice straw followed by twin screw extruder for the composite fabrication
The addition of rice straw in PLA resulted in the lowering of glass transition temperature and melting temperature. Early degradation of the composite was confirmed by the SEM micrographs.
[43]
27 PLA and thin strip of bamboo
Strips of bamboo were bonded in PLA with the help of compression moulding machine for the fabrication of composites
Excellent enhancement in the mechanical properties of PLA was obtained due to the influence of the node. Highly stiffed composite can be fabricated via compression moulding process.
[44]
28 PLA and 10 wt. % PEG Melt blending and co rotating twin screw extruder
PEG plasticized the PLA but the mechanical properties were reduced.
[45]
29 PLA, raw fiber obtained from acid-catalysed hydrolysis and delignified fiber
Samples were prepared by co rotating twin extruder
Marginal improvement was observed in the tensile strength of PLA with the addition of raw fiber. Formation of pores and voids took place due to the addition of oat delignified fiber.
[46]
30 PLA and nanometric and micrometric cellulose filler
Solvent casting method was used for the fabrication of blend
Higher young modulus and tensile strength were obtained for nanometric filled PLA composite as compared to micrometric filled PLA composite
[47]
31 PLA, starch, cellulose fiber in powder form and carnauba wax,
Foam composite was prepared by compression moulding
The foam containing 9 % PLA showed the highest improvement in tensile strength with an increment of 31 % as compared to foam without PLA.
[48]
32 PLA with 10 % copper fibers
Compression moulding technique
Viscoelastic behaviour of PLA enhanced with the addition of copper fiber. The PLA became more thermally stable due to the reinforcement of copper fibers.
[49]
The results reported in the tabulated form (Table 1) conclude that reinforcing PLA with fiber/filler reduces the strength but enhances the modulus and stiffness. Various compatibilizers are added in the PLA to improve the mechanical interaction between fiber and PLA and enhances the melting point temperature. The addition of copolymer increases toughness and crystallinity of PLA due to formation of cross linkage. In addition, the dynamic mechanical properties such as loss modulus and storage modulus are also enhanced by the addition of copolymers. Poly(lactic acid) based nano composite Various inorganic and organic materials can be incorporated in PLA to enhance its mechanical and thermal properties. These incorporations, when performed at nanoscale then it is called nano composites.
Acta Innovations 2021 no. 41: 5-18 11
https://doi.org/10.32933/ActaInnovations.41.1 ISSN 2300-5599 2021 RIC Pro-Akademia – CC BY
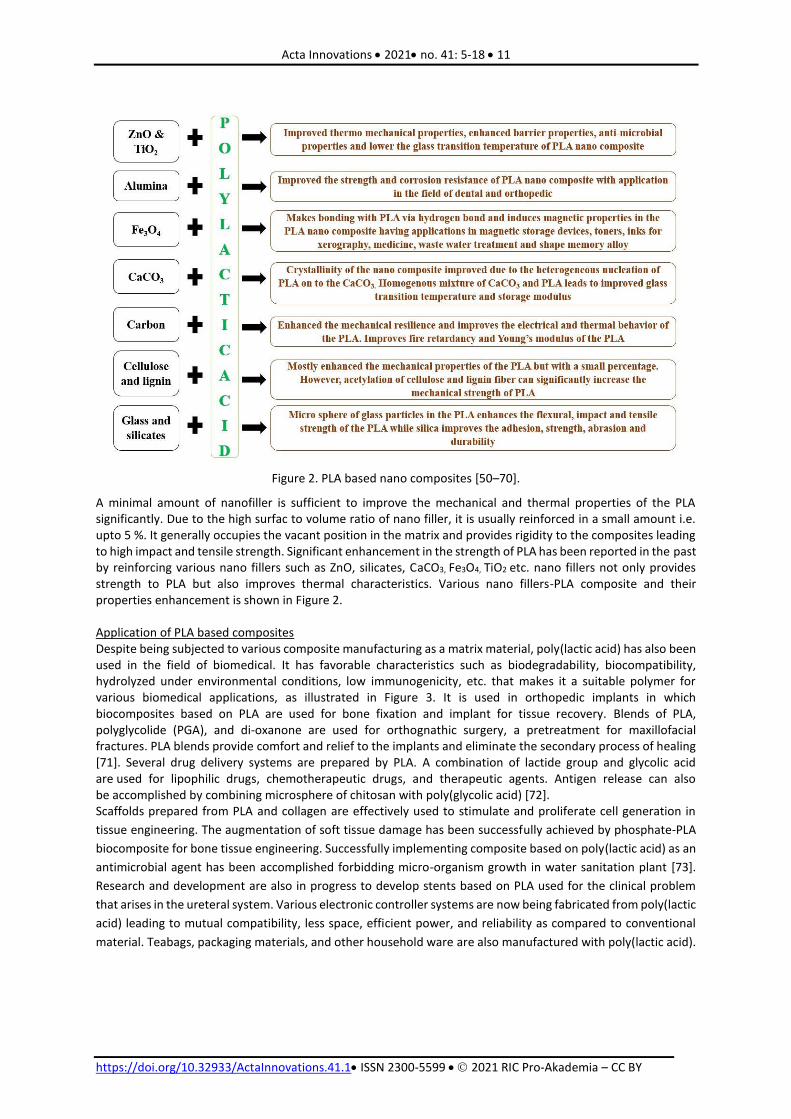
Figure 2. PLA based nano composites [50–70].
A minimal amount of nanofiller is sufficient to improve the mechanical and thermal properties of the PLA significantly. Due to the high surfac to volume ratio of nano filler, it is usually reinforced in a small amount i.e. upto 5 %. It generally occupies the vacant position in the matrix and provides rigidity to the composites leading to high impact and tensile strength. Significant enhancement in the strength of PLA has been reported in the past by reinforcing various nano fillers such as ZnO, silicates, CaCO3, Fe3O4, TiO2 etc. nano fillers not only provides strength to PLA but also improves thermal characteristics. Various nano fillers-PLA composite and their properties enhancement is shown in Figure 2. Application of PLA based composites Despite being subjected to various composite manufacturing as a matrix material, poly(lactic acid) has also been used in the field of biomedical. It has favorable characteristics such as biodegradability, biocompatibility, hydrolyzed under environmental conditions, low immunogenicity, etc. that makes it a suitable polymer for various biomedical applications, as illustrated in Figure 3. It is used in orthopedic implants in which biocomposites based on PLA are used for bone fixation and implant for tissue recovery. Blends of PLA, polyglycolide (PGA), and di-oxanone are used for orthognathic surgery, a pretreatment for maxillofacial fractures. PLA blends provide comfort and relief to the implants and eliminate the secondary process of healing [71]. Several drug delivery systems are prepared by PLA. A combination of lactide group and glycolic acid are used for lipophilic drugs, chemotherapeutic drugs, and therapeutic agents. Antigen release can also be accomplished by combining microsphere of chitosan with poly(glycolic acid) [72]. Scaffolds prepared from PLA and collagen are effectively used to stimulate and proliferate cell generation in
tissue engineering. The augmentation of soft tissue damage has been successfully achieved by phosphate-PLA
biocomposite for bone tissue engineering. Successfully implementing composite based on poly(lactic acid) as an
antimicrobial agent has been accomplished forbidding micro-organism growth in water sanitation plant [73].
Research and development are also in progress to develop stents based on PLA used for the clinical problem
that arises in the ureteral system. Various electronic controller systems are now being fabricated from poly(lactic
acid) leading to mutual compatibility, less space, efficient power, and reliability as compared to conventional
material. Teabags, packaging materials, and other household ware are also manufactured with poly(lactic acid).

Acta Innovations 2021 no. 41: 5-18 12
https://doi.org/10.32933/ActaInnovations.41.1 ISSN 2300-5599 2021 RIC Pro-Akademia – CC BY
Figure 3. Biomedical scope of poly(lactic acid) [71].
Impact Cost of production of any mateiral is the crucial parameter which decides its viability and future sustainability in the industry. Today, various companies like NatureWorks, Futerro, Corbion etc. are providing PLA at reasonable cost. The quality of PLA offer by these companies are worth buying but the original production cost is unknown to almost everyone except few producers. To assess the original production cost of the PLA a number of experiments were performed. Raw material used for the production of PLA were potato starch, wood extract, cassava extract, food waste, triticale and corn. The cost of production incurred in the analysis varied according to the method adopted. The detailed cost analysis of PLA production is explained in Table 2. The variation in the cost is the result of method used in the production, type of feed stock and other direct and indirect cost considered in the investigation therefore a comparison among the studies on the basis of production cost will not be justified. Nevertheless, various methods of producing PLA at different working conditions have evolved through research and technical advancement. By using different types feedstock and technique, we can lower down the production cost of PLA as shown in Table 2. However, the commercialization of the method will depend on the balance between its cost and environmental effect. PLA is well-known for its low CO emission and the feedstock i.e. corn, consumes CO2
during its cultivation [74]. Comparing the carbon emission of PLA production with other typical polymers, it was found that PLA has negative green house gas emission [75]. This makes the PLA acts as a green house gas sink and coupling this with latest process technology will definitely leads to the formation of green environment.

Acta Innovations 2021 no. 41: 5-18 13
https://doi.org/10.32933/ActaInnovations.41.1 ISSN 2300-5599 2021 RIC Pro-Akademia – CC BY
Table 2. Cost analysis of PLA produced by different method [76–79].
Feedstock Technique Cost incurred Remark
Potato starch
Bacterial fermentation (Green field technology)
Cost of dextrose, waste disposal cost, revenue cost, fixed cost such as electricity cost and overhead cost
$ 2.9 US production cost per kg of PLA
Sugar extract from wood
Bacterial fermentation (Brownfield technology)
Lowers the capital cost, annual operating costs, including taxes, insurance, maintenance, return on investment and other expenses
$ 2.62 US production cost per kg of PLA
Corn starch Yeast fermentation Lower the waste cost and process cost
$ 2.12 US production cost per kg of PLA
Cassava root Cargill dow process Costs of PLA production, raw material costs (cassava roots and chemicals), capital costs, labour costs, operating costs, and waste treatment costs, environmental cost and cost of CO2 emissions resulting from electricity and fuel consumption
$ 2.71 US production cost per kg of PLA
Cassava starch Cargill dow process Raw material costs (cassava starch, capital costs, labour costs, operating costs, and waste treatment costs, environmental cost and cost of CO2 emissions and waste cost (gypsum)
$ 2.82 US production cost per kg of PLA
Cereal crops (triticale)
Baseline technology Costs of raw materials (biomass and chemicals), energy and operating materials, maintenance and repair, labour, operating materials, insurance and overhead, administration, distribution and sales
$ 1.2 US production cost per kg of PLA
Corn grains Bio refinery Equipment cost, raw materials cost, energy cost, labour cost and costs of producing lactic acid from bacteria, fungi and yeast-based fermentation
$ 0.84 US production cost per kg of PLA
Figure 4. CO2 emission by various polymers [80].

Acta Innovations 2021 no. 41: 5-18 14
https://doi.org/10.32933/ActaInnovations.41.1 ISSN 2300-5599 2021 RIC Pro-Akademia – CC BY
Conclusions
The fabrication of the biocomposites in the coming future will be given preference over non-biodegradable composites due to the strict regulations as specified by the United Nation environmental program (UNEP) for the prevention of the environment from the hazardous effect of the polymer waste where poly(lactic acid) can play a crucial role. Different types of biopolymers compatible with PLA need to be exposed to expand its scope for the fabrication of sustainable material that could perform in real-time conditions. Poly(lactic acid) is readily available in pallet form and is widely used for the manufacturing of boi-composites particularly via melt extruder and injection moulding. Various favourable changes in mechanical and wear characteristics of PLA have been reported along with some future suggestions. PLA showed decreasing characteristics of tensile and flexural strength with the addition of filler which can be modified with the use of compatibilizers or mixing of suitable biopolymers. Biodegradable implants are primarily designed from PLA-based composites and are expected to be made from pure PLA in the near future also. The emerging biomedical tailorable applications will be made from the PLA and its copolymer blends such as glycolic acid, caprolactone, and polyethylene glycol. Conflict of interest There are no conflicts to declare. Acknowledgments This research has not been supported by any external funding. Reference [1] M. Shen, B. Song, G. Zeng, Y. Zhang, W. Huang, X. Wen, W. Tang, Are biodegradable plastics a promising
solution to solve the global plastic pollution?, Environ. Pollut. 263 (2020) 114469. https://doi.org/10.1016/j.envpol.2020.114469.
[2] S.P. Gairola, Y.K. Tyagi, B. Gangil, A. Sharma, Fabrication and mechanical property evaluation of non-woven banana fibre epoxy-based polymer composite, in: Mater. Today Proc., 2020: pp. 3990–3996. https://doi.org/10.1016/j.matpr.2020.10.103.
[3] L. Ranakoti, P.K. Rakesh, Physio-mechanical characterization of tasar silk waste/jute fiber hybrid composite, Compos. Commun. 22 (2020) 100526. https://doi.org/10.1016/j.coco.2020.100526.
[4] B. Yadav, A. Pandey, L.R. Kumar, R.D. Tyagi, Bioconversion of waste (water)/residues to bioplastics- A circular bioeconomy approach, Bioresour. Technol. 298 (2020) 122584. https://doi.org/10.1016/j.biortech.2019.122584.
[5] S. Rodriguez-Perez, A. Serrano, A.A. Pantión, B. Alonso-Fariñas, Challenges of scaling-up PHA production from waste streams. A review, J. Environ. Manage. 205 (2018) 215–230. https://doi.org/10.1016/j.jenvman.2017.09.083.
[6] S.K. Verma, A. Gupta, T. Singh, B. Gangil, E. Jánosi, G. Fekete, Influence of dolomite on mechanical, physical and erosive wear properties of natural-synthetic fiber reinforced epoxy composites, Mater. Res. Express. 6 (2019) 125704. https://doi.org/10.1088/2053-1591/ab5abb.
[7] R. Siakeng, M. Jawaid, H. Ariffin, S.M. Sapuan, M. Asim, N. Saba, Natural fiber reinforced polylactic acid composites: A review, Polym. Compos. 40 (2019) 446–463. https://doi.org/10.1002/pc.24747.
[8] L. Ranakoti, B. Gangil, P. Kumar Rakesh, N. Agrawal, Synthesis and Utilization of Biodegradable Polymers, in: Biobased Compos., Wiley, 2021: pp. 167–174. https://doi.org/10.1002/9781119641803.ch12.
[9] A. Basu, M. Nazarkovsky, R. Ghadi, W. Khan, A.J. Domb, Poly(lactic acid)-based nanocomposites, Polym. Adv. Technol. 28 (2017) 919–930. https://doi.org/10.1002/pat.3985.
[10] F. Saliu, S. Montano, M.G. Garavaglia, M. Lasagni, D. Seveso, P. Galli, Microplastic and charred microplastic in the Faafu Atoll, Maldives, Mar. Pollut. Bull. 136 (2018) 464–471. https://doi.org/10.1016/j.marpolbul.2018.09.023.
[11] E. Kabir, R. Kaur, J. Lee, K.H. Kim, E.E. Kwon, Prospects of biopolymer technology as an alternative option for non-degradable plastics and sustainable management of plastic wastes, J. Clean. Prod. 258 (2020) 120536. https://doi.org/10.1016/j.jclepro.2020.120536.
[12] T.G. Yashas Gowda, M.R. Sanjay, K. Subrahmanya Bhat, P. Madhu, P. Senthamaraikannan, B. Yogesha, Polymer matrix-natural fiber composites: An overview, Cogent Eng. 5 (2018) 1446667. https://doi.org/10.1080/23311916.2018.1446667.
[13] A. Ilyas Rushdana, M. Sapuan Salit, M. Lamin Sanyang, M. Ridzwan Ishak, Nanocrystalline Cellulose As Reinforcement For Polymeric Matrix Nanocomposites And Its Potential Applications: A Review, Curr.

Acta Innovations 2021 no. 41: 5-18 15
https://doi.org/10.32933/ActaInnovations.41.1 ISSN 2300-5599 2021 RIC Pro-Akademia – CC BY
Anal. Chem. 13 (2017) 203–225. https://doi.org/10.2174/1573411013666171003155624. [14] X. Cui, A. Ozaki, T.A. Asoh, H. Uyama, Cellulose modified by citric acid reinforced Poly(lactic acid) resin
as fillers, Polym. Degrad. Stab. 175 (2020) 109118. https://doi.org/10.1016/j.polymdegradstab.2020.109118.
[15] M.K. Lila, K. Shukla, U.K. Komal, I. Singh, Accelerated thermal ageing behaviour of bagasse fibers reinforced Poly (Lactic Acid) based biocomposites, Compos. Part B Eng. 156 (2019) 121–127. https://doi.org/10.1016/j.compositesb.2018.08.068.
[16] J.O. Akindoyo, M.D.H. Beg, S. Ghazali, H.P. Heim, M. Feldmann, M. Mariatti, Simultaneous impact modified and chain extended glass fiber reinforced poly(lactic acid) composites: Mechanical, thermal, crystallization, and dynamic mechanical performance, J. Appl. Polym. Sci. 138 (2021) 49752. https://doi.org/10.1002/app.49752.
[17] G. Wang, D. Zhang, B. Li, G. Wan, G. Zhao, A. Zhang, Strong and thermal-resistance glass fiber-reinforced polylactic acid (PLA) composites enabled by heat treatment, Int. J. Biol. Macromol. 129 (2019) 448–459. https://doi.org/10.1016/j.ijbiomac.2019.02.020.
[18] X. Zuo, Y. Xue, L. Wang, Y. Zhou, Y. Yin, Y.C. Chuang, C.C. Chang, R. Yin, M.H. Rafailovich, Y. Guo, Engineering Styrenic Blends with Poly(lactic acid), Macromolecules. 52 (2019) 7547–7556. https://doi.org/10.1021/acs.macromol.9b01349.
[19] S. Bhattacharjee, D.S. Bajwa, Feasibility of Reprocessing Natural Fiber Filled Poly(lactic acid) Composites: An In-Depth Investigation, Adv. Mater. Sci. Eng. 2017 (2017) 1–10. https://doi.org/10.1155/2017/1430892.
[20] L. Musyarofah, D. Puspita, E. Hidayah, Sujito, Tensile properties of coir and fleece fibers reinforced poly-lactic acid hybrid green composites, in: J. Phys. Conf. Ser., 2019: p. 012008. https://doi.org/10.1088/1742-6596/1217/1/012008.
[21] H. Ren, Y. Zhang, H. Zhai, J. Chen, Production and evaluation of biodegradable composites based on polyhydroxybutyrate and polylactic acid reinforced with short and long pulp fibers, Cellul. Chem. Technol. 49 (2015) 641–652.
[22] T. Yu, J. Ren, S. Li, H. Yuan, Y. Li, Effect of fiber surface-treatments on the properties of poly(lactic acid)/ramie composites, Compos. Part A Appl. Sci. Manuf. 41 (2010) 499–505. https://doi.org/10.1016/j.compositesa.2009.12.006.
[23] N.A. Ibrahim, W. Md Zin Wan Yunus, M. Othman, K. Abdan, K.A. Hadithon, Poly(Lactic Acid) (PLA)-reinforced kenaf bast fiber composites: The effect of triacetin, J. Reinf. Plast. Compos. 29 (2010) 1099–1111. https://doi.org/10.1177/0731684409344651.
[24] P. Juntuek, C. Ruksakulpiwat, P. Chumsamrong, Y. Ruksakulpiwat, Mechanical properties of polylactic acid and natural rubber blends using vetiver grass fiber as filler, in: Adv. Mater. Res., 2010: pp. 1167–1170. https://doi.org/10.4028/www.scientific.net/AMR.123-125.1167.
[25] T. Tábi, N.K. Kovács, J.G. Kovács, Basalt fibre reinforced poly (LACTIC ACID) based composites for engineering applications, in: 16th Eur. Conf. Compos. Mater. ECCM 2014, 2014.
[26] X. Tian, T. Liu, C. Yang, Q. Wang, D. Li, Interface and performance of 3D printed continuous carbon fiber reinforced PLA composites, Compos. Part A Appl. Sci. Manuf. 88 (2016) 198–205. https://doi.org/10.1016/j.compositesa.2016.05.032.
[27] W. Xu, The mechanical properties of Carbon fiber/Polylatide/Chitosan composites, in: 2010 4th Int. Conf. Bioinforma. Biomed. Eng. ICBBE 2010, IEEE, 2010: pp. 1–4. https://doi.org/10.1109/ICBBE.2010.5515711.
[28] X.G. Li, X. Zheng, Y.Q. Wu, DMA analysis on bamboo fiber/polylactic acid composites, in: 2010 Int. Conf. Mech. Autom. Control Eng. MACE2010, IEEE, 2010: pp. 3090–3092. https://doi.org/10.1109/MACE.2010.5535322.
[29] B. Asaithambi, G. Ganesan, S. Ananda Kumar, Bio-composites: Development and mechanical characterization of banana/sisal fibre reinforced poly lactic acid (PLA) hybrid composites, Fibers Polym. 15 (2014) 847–854. https://doi.org/10.1007/s12221-014-0847-y.
[30] V.L. Finkenstadt, C.K. Liu, P.H. Cooke, L.S. Liu, J.L. Willett, Mechanical property characterization of plasticized sugar beet pulp and poly(lactic acid) green composites using acoustic emission and confocal microscopy, J. Polym. Environ. 16 (2008) 19–26. https://doi.org/10.1007/s10924-008-0085-8.
[31] E. Fortunati, D. Puglia, M. Monti, C. Santulli, M. Maniruzzaman, M.L. Foresti, A. Vazquez, J.M. Kenny, Okra (Abelmoschus esculentus) Fibre Based PLA Composites: Mechanical Behaviour and Biodegradation, J. Polym. Environ. 21 (2013) 726–737. https://doi.org/10.1007/s10924-013-0571-5.
[32] M.M. Hassan, K. Koyama, Thermomechanical and viscoelastic properties of green composites of PLA using chitin micro-particles as fillers, J. Polym. Res. 27 (2020) 27. https://doi.org/10.1007/s10965-019-

Acta Innovations 2021 no. 41: 5-18 16
https://doi.org/10.32933/ActaInnovations.41.1 ISSN 2300-5599 2021 RIC Pro-Akademia – CC BY
1991-2. [33] C.T. Hsieh, Y.J. Pan, C.W. Lou, C.L. Huang, Z.I. Lin, J.M. Liao, J.H. Lin, Polylactic acid/carbon fiber
composites: Effects of functionalized elastomers on mechanical properties, thermal behavior, surface compatibility, and electrical characteristics, Fibers Polym. 17 (2016) 615–623. https://doi.org/10.1007/s12221-016-5922-0.
[34] K.W. Kim, B.H. Lee, H.J. Kim, K. Sriroth, J.R. Dorgan, Thermal and mechanical properties of cassava and pineapple flours-filled PLA bio-composites, in: J. Therm. Anal. Calorim., 2012: pp. 1131–1139. https://doi.org/10.1007/s10973-011-1350-y.
[35] S. Kuciel, K. Mazur, M. Hebda, The Influence of Wood and Basalt Fibres on Mechanical, Thermal and Hydrothermal Properties of PLA Composites, J. Polym. Environ. 28 (2020) 1204–1215. https://doi.org/10.1007/s10924-020-01677-z.
[36] A. Masek, K. Diakowska, M. Zaborski, Physico-mechanical and thermal properties of epoxidized natural rubber/polylactide (ENR/PLA) composites reinforced with lignocellulose, J. Therm. Anal. Calorim. 125 (2016) 1467–1476. https://doi.org/10.1007/s10973-016-5682-5.
[37] T.R. Rigolin, M.C. Takahashi, D.L. Kondo, S.H.P. Bettini, Compatibilizer Acidity in Coir-Reinforced PLA Composites: Matrix Degradation and Composite Properties, J. Polym. Environ. 27 (2019) 1096–1104. https://doi.org/10.1007/s10924-019-01411-4.
[38] Y. Song, J. Liu, S. Chen, Y. Zheng, S. Ruan, Y. Bin, Mechanical Properties of Poly (Lactic Acid)/Hemp Fiber Composites Prepared with a Novel Method, J. Polym. Environ. 21 (2013) 1117–1127. https://doi.org/10.1007/s10924-013-0569-z.
[39] C. Way, D.Y. Wu, D. Cram, K. Dean, E. Palombo, Processing Stability and Biodegradation of Polylactic Acid (PLA) Composites Reinforced with Cotton Linters or Maple Hardwood Fibres, J. Polym. Environ. 21 (2013) 54–70. https://doi.org/10.1007/s10924-012-0462-1.
[40] C. Xu, X. Zhang, X. Jin, S. Nie, R. Yang, Study on Mechanical and Thermal Properties of Poly(Lactic acid)/Poly(Butylene adipate-co-terephthalate)/Office Wastepaper Fiber Biodegradable Composites, J. Polym. Environ. 27 (2019) 1273–1284. https://doi.org/10.1007/s10924-019-01428-9.
[41] A.A. Yussuf, I. Massoumi, A. Hassan, Comparison of polylactic Acid/Kenaf and polylactic Acid/Rise husk composites: The influence of the natural fibers on the mechanical, thermal and biodegradability properties, J. Polym. Environ. 18 (2010) 422–429. https://doi.org/10.1007/s10924-010-0185-0.
[42] M. Ghorbani Chaboki, J. Mohammadi-Rovshandeh, F. Hemmati, Poly(lactic acid)/thermoplasticized rice straw biocomposites: effects of benzylated lignocellulosic filler and nanoclay, Iran. Polym. J. (English Ed. 28 (2019) 777–788. https://doi.org/10.1007/s13726-019-00743-1.
[43] A. Zandi, A. Zanganeh, F. Hemmati, J. Mohammadi-Roshandeh, Thermal and biodegradation properties of poly(lactic acid)/rice straw composites: effects of modified pulping products, Iran. Polym. J. (English Ed. 28 (2019) 403–415. https://doi.org/10.1007/s13726-019-00709-3.
[44] A.P. Morales, A. Güemes, A. Fernandez-Lopez, V.C. Valero, S. de La Rosa Llano, Bamboo-polylactic acid (PLA) composite material for structural applications, Materials (Basel). 10 (2017) 1286. https://doi.org/10.3390/ma10111286.
[45] D. Li, Y. Jiang, S. Lv, X. Liu, J. Gu, Q. Chen, Y. Zhang, Preparation of plasticized poly (lactic acid) and its influence on the properties of composite materials, PLoS One. 13 (2018) e0193520. https://doi.org/10.1371/journal.pone.0193520.
[46] M. Soleimani, L.G. Tabil, I. Oguocha, J. Fung, Interactive Influence of Biofiber Composition and Elastomer on Physico-Mechanical Properties of PLA Green Composites, J. Polym. Environ. 26 (2018) 532–542. https://doi.org/10.1007/s10924-017-0967-8.
[47] A. Grząbka-Zasadzińska, M. Odalanowska, S. Borysiak, Thermal and mechanical properties of biodegradable composites with nanometric cellulose, J. Therm. Anal. Calorim. 138 (2019) 4407–4416. https://doi.org/10.1007/s10973-019-09023-9.
[48] M.M. Hassan, M.J. Le Guen, N. Tucker, K. Parker, Thermo-mechanical, morphological and water absorption properties of thermoplastic starch/cellulose composite foams reinforced with PLA, Cellulose. 26 (2019) 4463–4478. https://doi.org/10.1007/s10570-019-02393-1.
[49] X. Zhang, L. Chen, T. Mulholland, T.A. Osswald, Characterization of mechanical properties and fracture mode of PLA and copper/PLA composite part manufactured by fused deposition modeling, SN Appl. Sci. 1 (2019) 616. https://doi.org/10.1007/s42452-019-0639-5.
[50] P.O. Bussiere, S. Therias, J.L. Gardette, M. Murariu, P. Dubois, M. Baba, Effect of ZnO nanofillers treated with triethoxy caprylylsilane on the isothermal and non-isothermal crystallization of poly(lactic acid), Phys. Chem. Chem. Phys. 14 (2012) 12301–12308. https://doi.org/10.1039/c2cp41574g.
[51] M. Murariu, A. Doumbia, L. Bonnaud, A.L. Dechief, Y. Paint, M. Ferreira, C. Campagne, E. Devaux,

Acta Innovations 2021 no. 41: 5-18 17
https://doi.org/10.32933/ActaInnovations.41.1 ISSN 2300-5599 2021 RIC Pro-Akademia – CC BY
P. Dubois, High-performance polylactide/ZnO nanocomposites designed for films and fibers with special end-use properties, Biomacromolecules. 12 (2011) 1762–1771. https://doi.org/10.1021/bm2001445.
[52] M.E. Hoque, Processing and Characterization of Cockle Shell Calcium Carbonate (CaCO3) Bioceramic for Potential Application in Bone Tissue Engineering, J. Mater. Sci. Eng. 02 (2013). https://doi.org/10.4172/2169-0022.1000132.
[53] J.Z. Liang, L. Zhou, C.Y. Tang, C.P. Tsui, Crystalline properties of poly(L-lactic acid) composites filled with nanometer calcium carbonate, Compos. Part B Eng. 45 (2013) 1646–1650. https://doi.org/10.1016/j.compositesb.2012.09.086.
[54] Y.B. Nekhamanurak, P. Patanathabutr, N. Hongsriphan, Mechanical Properties of Hydrophilicity Modified CaCO3-Poly (Lactic Acid) Nanocomposite, Int. J. Appl. Phys. Math. (2012) 98–103. https://doi.org/10.7763/ijapm.2012.v2.62.
[55] N. Shi, J. Cai, Q. Dou, Crystallization, morphology and mechanical properties of PLA/PBAT/CaCO3 composites, in: Adv. Mater. Res., 2013: pp. 768–771. https://doi.org/10.4028/www.scientific.net/AMR.602-604.768.
[56] W.M. Chiu, Y.A. Chang, H.Y. Kuo, M.H. Lin, H.C. Wen, A study of carbon nanotubes/biodegradable plastic polylactic acid composites, J. Appl. Polym. Sci. 108 (2008) 3024–3030. https://doi.org/10.1002/app.27796.
[57] K. Fukushima, M. Murariu, G. Camino, P. Dubois, Effect of expanded graphite/layered-silicate clay on thermal, mechanical and fire retardant properties of poly(lactic acid), Polym. Degrad. Stab. 95 (2010) 1063–1076. https://doi.org/10.1016/j.polymdegradstab.2010.02.029.
[58] L. Suryanegara, A.N. Nakagaito, H. Yano, The effect of crystallization of PLA on the thermal and mechanical properties of microfibrillated cellulose-reinforced PLA composites, Compos. Sci. Technol. 69 (2009) 1187–1192. https://doi.org/10.1016/j.compscitech.2009.02.022.
[59] P. Tingaut, T. Zimmermann, F. Lopez-Suevos, Synthesis and characterization of bionanocomposites with tunable properties from poly(lactic acid) and acetylated microfibrillated cellulose, Biomacromolecules. 11 (2010) 454–464. https://doi.org/10.1021/bm901186u.
[60] I. Spiridon, K. Leluk, A.M. Resmerita, R.N. Darie, Evaluation of PLA-lignin bioplastics properties before and after accelerated weathering, Compos. Part B Eng. 69 (2015) 342–349. https://doi.org/10.1016/j.compositesb.2014.10.006.
[61] B.K. Chen, C.H. Shen, A.F. Chen, Preparation of ductile PLA materials by modification with trimethyl hexamethylene diisocyanate, Polym. Bull. 69 (2012) 313–322. https://doi.org/10.1007/s00289-012-0730-1.
[62] R. Pantani, G. Gorrasi, G. Vigliotta, M. Murariu, P. Dubois, PLA-ZnO nanocomposite films: Water vapor barrier properties and specific end-use characteristics, Eur. Polym. J. 49 (2013) 3471–3482. https://doi.org/10.1016/j.eurpolymj.2013.08.005.
[63] R. Malinowski, K. Janczak, P. Rytlewski, A. Raszkowska-Kaczor, K. Moraczewski, T. Zuk, Influence of glass microspheres on selected properties of polylactide composites, Compos. Part B Eng. 76 (2015) 13–19. https://doi.org/10.1016/j.compositesb.2015.02.013.
[64] Y. Li, C. Chen, J. Li, X.S. Sun, Synthesis and characterization of bionanocomposites of poly(lactic acid) and TiO2 nanowires by in situ polymerization, Polymer (Guildf). 52 (2011) 2367–2375. https://doi.org/10.1016/j.polymer.2011.03.050.
[65] Y.B. Luo, W. Da Li, X.L. Wang, D.Y. Xu, Y.Z. Wang, Preparation and properties of nanocomposites based on poly(lactic acid) and functionalized TiO2, Acta Mater. 57 (2009) 3182–3191. https://doi.org/10.1016/j.actamat.2009.03.022.
[66] M. Vallet-Regi, S. Granado, D. Arcos, M. Gordo, M. V. Cabanas, C. V. Ragel, A.J. Salinas, A.L. Doadrio, J. San Roman, Preparation, characterization, andin vitro release of Ibuprofen from Al2O3/PLA/PMMA composites, J. Biomed. Mater. Res. 39 (1998) 423–428. https://doi.org/10.1002/(SICI)1097-4636(19980305)39:3<423::AID-JBM11>3.0.CO;2-B.
[67] M. Sajjadi, M. Nasrollahzadeh, S. Mohammad Sajadi, Green synthesis of Ag/Fe3O4 nanocomposite using Euphorbia peplus Linn leaf extract and evaluation of its catalytic activity, J. Colloid Interface Sci. 497 (2017) 1–13. https://doi.org/10.1016/j.jcis.2017.02.037.
[68] M. Shabanian, M. Khoobi, F. Hemati, H.A. Khonakdar, S. esmaeil S. Ebrahimi, U. Wagenknecht, A. Shafiee, New PLA/PEI-functionalized Fe3O4 nanocomposite: Preparation and characterization, J. Ind. Eng. Chem. 24 (2015) 211–218. https://doi.org/10.1016/j.jiec.2014.09.032.
[69] M.Y. Razzaq, M. Behl, A. Lendlein, Magnetic memory effect of nanocomposites, Adv. Funct. Mater. 22 (2012) 184–191. https://doi.org/10.1002/adfm.201101590.
[70] S. Taccola, A. Desii, V. Pensabene, T. Fujie, A. Saito, S. Takeoka, P. Dario, A. Menciassi, V. Mattoli, Free-

Acta Innovations 2021 no. 41: 5-18 18
https://doi.org/10.32933/ActaInnovations.41.1 ISSN 2300-5599 2021 RIC Pro-Akademia – CC BY
standing poly(l-lactic acid) nanofilms loaded with superparamagnetic nanoparticles, Langmuir. 27 (2011) 5589–5595. https://doi.org/10.1021/la2004134.
[71] S. Vacaras, M. Baciut, O. Lucaciu, C. Dinu, G. Baciut, L. Crisan, M. Hedesiu, B. Crisan, F. Onisor, G. Armencea, I. Mitre, I. Barbur, W. Kretschmer, S. Bran, Understanding the basis of medical use of poly-lactide-based resorbable polymers and composites–a review of the clinical and metabolic impact, Drug Metab. Rev. 51 (2019) 570–588. https://doi.org/10.1080/03602532.2019.1642911.
[72] S.M. Davachi, B. Kaffashi, Polylactic Acid in Medicine, Polym. - Plast. Technol. Eng. 54 (2015) 944–967. https://doi.org/10.1080/03602559.2014.979507.
[73] Z. Sheikh, S. Najeeb, Z. Khurshid, V. Verma, H. Rashid, M. Glogauer, Biodegradable materials for bone repair and tissue engineering applications, Materials (Basel). 8 (2015) 5744–5794. https://doi.org/10.3390/ma8095273.
[74] J.C. Bogaert, P. Coszach, Poly(lactic acids): A potential solution to plastic waste dilemma, in: Macromol. Symp., 2000: pp. 287–303. https://doi.org/10.1002/1521-3900(200003)153:1<287::AID-MASY287>3.0.CO;2-E.
[75] E.T.H. Vink, K.R. Rábago, D.A. Glassner, P.R. G ruber, Applications of life cycle assessment to NatureWorksTM polylactide (PLA) production, Polym. Degrad. Stab. 80 (2003) 403–419. https://doi.org/10.1016/S0141-3910(02)00372-5.
[76] S. Chiarakorn, C.K. Permpoonwiwat, P. Nanthachatchavankul, Financial and economic viability of bioplastic production in Thailand, 2014.
[77] Tides Center/Environmental Health Strategy Center; Maine Initiaties; Jim Lunt & Associates LLC, The Business Case for Commercial Production of Bioplastics in Maine: A preliminary report, 2010.
[78] A. Manandhar, A. Shah, Techno-economic analysis of bio-based lactic acid production utilizing corn grain as feedstock, Processes. 8 (2020) 199. https://doi.org/10.3390/pr8020199.
[79] S. Sanaei, P.R. Stuart, Systematic assessment of triticale-based biorefinery strategies: techno-economic analysis to identify investment opportunities, Biofuels, Bioprod. Biorefining. 12 (2018) S46–S59. https://doi.org/10.1002/bbb.1499.
[80] E.T.H. Vink, D.A. Glassner, J.J. Kolstad, R.J. Wooley, R.P. O’Connor, The eco-profiles for current and near-future NatureWorks® polylactide (PLA) production, Ind. Biotechnol. 3 (2007) 58–81. https://doi.org/10.1089/ind.2007.3.058.

Acta Innovations 2021 no. 41: 19-27 19
https://doi.org/10.32933/ActaInnovations.41.2 ISSN 2300-5599 2021 RIC Pro-Akademia – CC BY
MICROALGAE POTENTIAL IN THE CAPTURE OF CO2 EMISSION
Francesca Frongia Department of Life Sciences, University of Modena and Reggio Emilia,
via G. Campi 103, 41125 - Modena, Italy
https://orcid.org/0000-0002-1218-6661
Laura Arru Department of Life Sciences, University of Modena and Reggio Emilia
via G. Amendola 2, 42122 - Reggio Emilia, Italy
https://orcid.org/0000-0002-1807-1689
Maria Rita Cramarossa Department of Life Sciences, University of Modena and Reggio Emilia
via G. Campi 103, 41125 - Modena, Italy
https://orcid.org/0000-0002-6066-7355
Luca Forti* Department of Life Sciences, University of Modena and Reggio Emilia
via G. Campi 103, 41125 - Modena, Italy, [email protected]
https://orcid.org/0000-0002-5662-7756 Article history: Received 27 September 2021, Received in revised form 1 October 2021, Accepted 3 October 2021, Available online 4 October 2021 Abstract In a perspective projected to reduce the atmospheric concentration of greenhouse gases, in which carbon dioxide is the master, the use of microalgae is an effective and decisive response. The review describes the bio circularity of the process of abatement of carbon dioxide through biofixation in algal biomass, highlighting the potential of its reuse in the production of high value-added products. Keywords Microalgae; CO2 biofixation; circular bioeconomy. Introduction Greenhouse effect and decarbonisation strategies Earth's temperature is rising almost 0.15°- 0.20°C per decade since 1975, causing an increase of 1° C since 1880 [1,2]. Scientists believe that this trend cannot be explained uniquely by natural changes, but it has to consider the influence of other factors, first of all the effect of the anthropogenic emission of large quantities of greenhouse gases (GHGs). GHGs include CO2, methane, nitrous oxide, hydrofluorocarbons, chlorofluorocarbons, etc. Considering that many GHGs can remain in the atmosphere for tens or hundreds of years, creating serious consequences even in the long term, the situation is even more critical. In order to counteract this trend, and to protect the environment, many Countries pledged to enter into agreements such as the Kyoto Protocol (1979) and the Paris Climate Agreement (2015). Among the GHGs, CO2 is considered to have the greatest negative impact on global warming. The rise of atmospheric CO2 concentration has been about 2 ppm/year in the last ten years, and in 2019 was almost 40% higher (399 ppm) than that measured during the Industrial Revolution (280 ppm) [3,4]. Since CO2 is one of those gases with exceptional persistence in the atmosphere (even if also non-CO2 greenhouse gases could have a negative role as well) [5], transported by the wind and spreading all over the world, it can be responsible for global warming virtually irreversible for more than 1,000 years. Although still controversial and debated [6,7], contribution of fossil fuels-burning power plants seems to be about 40% of the total CO2 global emission [8], to which burning of fossil fuels for transport must be added [9]. In heavy industries, CO2 emissions are a by-product produced through chemical reactions that do not involve combustion, but also CO2 emissions indirectly produced by electricity generation must be taken into account [9]. Some predictive studies show how the failure to reduce the GHGs emissions will

Acta Innovations 2021 no. 41: 19-27 20
https://doi.org/10.32933/ActaInnovations.41.2 ISSN 2300-5599 2021 RIC Pro-Akademia – CC BY
affect the atmospheric temperature in coastal areas by 2°C by 2050 and by 4°C by 2100, while in inland areas the temperature will increase by 4°C by 2050 and by 7°C by 2100.
Figure 1. CO2 emissions by sector. Source: https://www.iea.org/articles/global-CO2-emissions-in-2019.
Although the combustion of fossil fuels is currently the cheapest form of energy production, it is one of the main factors contributing to CO2 emissions into the atmosphere [10]. Several studies focus on finding solutions both to reduce atmospheric CO2 pollution (by removing it from atmosphere or by reducing industrial emission) and to give alternatives to fossil fuels [10,11]. The main chemical processes to reduce CO2 presence in the atmosphere capture are absorption by amino solvents to treat industrial air flows [11,12] and adsorption of CO2 molecules to a solid phase [13]. However, both chemical processes are economically disadvantageous, due to the energy consumption for solvent regeneration in the first case, and for separation of pollutants from adsorbents in the second one [13]. Microalgae CO2 capture and utilization In recent years, the concept of circular bioeconomy has emerged, focusing on the sustainable valorisation and transformation of biomass in production chains converting agro-industrial wastes into high added value products and use of renewable resources into products with a high added value [14]. The use of versatile and environmentally friendly photosynthetic organisms such as microalgae represents a promising approach in the development of such closed loop systems [15,16]. In Nature, Microalgae play a key role in the mitigation of environmental carbon and in bioremediation thanks to their high photosynthetic efficiency -about 40% more than terrestrial plants-, and to the significant sequestration of CO2: about 1 kg of microalgae consumes 1.83 kg of CO2 and represents 40% of the global CO2 sequestration [16]. Microalgae has been studied not only to reduce CO2 from the atmosphere or from flue gas emissions [17], but also to be applied in wastewater treatments [18] to generally lower pollutants and converting them into organic biomass rich in lipids, proteins, and other high value-added compounds [19] for energetic applications (biodiesel, biogas), food (human and animal feed), pharmaceuticals and cosmetics production [20]. Optimisation of carbon fixation efficiency by microalgae should take into account many variables.
It should be considered the use of the most suitable strain in relation with the different mediums to be treated, adjusting operating conditions as physicochemical and hydrodynamic parameters [8]. Good characteristics are tolerance to high CO2 concentrations, high temperatures, and presence of toxic compounds such as NOx, SOx, hydrogen sulfide. For this reason the search for appropriate microalgae strain is one of the main concerns regarding the improvement of CO2 capture processes [21]. Several microalgae such as Chlorella spp.,

Acta Innovations 2021 no. 41: 19-27 21
https://doi.org/10.32933/ActaInnovations.41.2 ISSN 2300-5599 2021 RIC Pro-Akademia – CC BY
Scenedesmus spp., Chlorococcum spp., Nannochloropsis spp. have shown good ability to capture the CO2 present in effluents similar to those emitted by industrial activities [22–25]. The supply of nutrients plays a fundamental role in the regulation of key metabolic processes related to both CO2 fixation and biomass synthesis. Nutrients for microalgae cultivation include carbon, nitrogen, phosphorus, magnesium, sulfur and trace element [26]. When microalgae are grown in autotrophy, light is crucial for photosynthetic activity, being the energy source. The growth of microalgae and the fixation of CO2 depend on both the light-dark cycle and the intensity of the light, but this is not a universal rule. CO2 fixation by Aphanothece microscopica Nägeli and by Nannochloropsis sp. achieves approximately 100% efficiency with continuous illumination of the culture [27]. There is also evidence that shorter lighting periods lead to a reduction in biomass production and carbon dioxide fixation [27]. Another crucial parameter to enhance both CO2 capture and cell growth is temperature. The solubility of CO2
depends on temperature and is reduced at high temperatures. Besides, also the affinity of RuBisCO (the key enzyme for CO2 fixation) for CO2 decreases as the temperature increases. In any case, the effect of temperature on the reaction metabolic rate depends on the strain being considered [28]. The value for pH determines the form in which dissolved inorganic carbon (DIC) exists in water. CO2, HCO3
-, CO32-
and H2CO3, can all be found in water, but only CO2 and HCO3- can be used by microalgal cells. The acidic pH favors
the formation of H2CO3, whilst the alkaline one allows the assimilation of NO3- and HCO3
-. It is generally preferred to cultivate microalgae in alkaline conditions due to the positive effect on CO2 solubilization [29]. Microalgae cultivation systems for CO2 capture Microalgae can be produced either in open (outdoor) or closed systems (photobioreactor). Open systems for microalgae growth are the cheapest, but they are also the most prone to the effects of external factors and contamination. Closed cultivation systems, also known as photobioreactors (PBR), despite being more expensive, allow the strict control of cultivation parameters, favoring the most suitable conditions for the growth of microalgae [30]. Typical configurations for CO2 capture systems are tubular or flat PBRs. Tubular PBRs are commonly used for CO2 capture due to good scalability and low contamination risk. They are divided into horizontal and vertical tubular reactors [30]. The main advantages of horizontal PBRs are the large surface exposed to light and the relatively low CO2 losses [31]; on the other hand, an important disadvantage is the accumulation of oxygen in the culture medium, that can lead to a decrease in biomass production and CO2 uptake [29]. Vertical PBRs, on the other hand, are advantageous for their high mass transfer and good mixing, which has made them suitable systems for biomass production and CO2 sequestration; however, they have a small illumination area, which can induce a decrease in the growth rate [32]. Another configuration commonly used for CO2 capture with microalgae are flat plate PBRs. An important advantage is the short light path and high illumination area. An important drawback is the low mixing and high shear stress [32]. Effect of flue gas compounds on microalgae In order to apply the biofixation of microalgae to industrial power plants or fuel gases it is necessary to understand the influence of combustion gas compounds on microalgae (Table 1). In fact, in addition to the CO2 contained in about 10/15% in coal-fired power plants and 5/6% in natural gas-fired power plants, nitric oxide (NO) and nitrogen dioxide (NO2) are present in flue gases, as well as SOx [33]. In combustion gases the level of NOx emission varies from 90/95% of NO and 5/10% of NO2. If the NO concentration is very low, it is transformed into NO2 and absorbed as a nitrogen source. However, the increase in NO concentration may lead to a decrease in the growth rate for some microalgal species [8]. SOx are produced by burning hydrogen sulfide, sulfur, or organosulfur compounds. It is well known that the presence of SO2 strongly inhibits microalgae growth. Inhibitory effects of SO2 on microalgae growth can be attributed to increased acidity, which leads to cell death. A pH control in the growth medium would maintain algal growth unvarying in the presence of SO2 [8]. Concerning the interaction between microalgae and other compounds as unburnt hydrocarbons, O2, N2, CxHx, H2O, CO, aerosols, heavy metals, and particulate matter, they have yet to be studied in detail.

Acta Innovations 2021 no. 41: 19-27 22
https://doi.org/10.32933/ActaInnovations.41.2 ISSN 2300-5599 2021 RIC Pro-Akademia – CC BY
Table. 1. Inhibition effects of microalgae species cultivated using flue gas with SOx and NOx compounds. Source: [4].
Microalgal species
CO2% (v/v) NOx (ppm)
SOx (ppm)
Source Inhibitory effect
Cultivation system
References
Nannochloropsis limnetica
10 - 25
Real flue gas from rice husk emission
Inhibited Bubble column
[34]
3 - 11
Real flue gas from rice husk emission
Inhibited Bubble column
[34]
Chlorella sp.
8-10 38 3.8
Real flue gas from co-generator units
No inhibition
Bubble column
[35]
6-8 37 -
Real flue gas from combustion of natural gas from boiler
No inhibition
Open thin layer PBR
[36]
23 78 87
Real flue gas from coke oven of steel plant
No inhibition
Double set PBR
[37]
Chlorella sp. MTF-15 6–8
25 70-80 80-90
Real flue gas from coke oven of steel plant
Slight inhibition
Column-type glass-fabricated PBR
[22]
26 8-10 15-20
Real flue gas from coke oven of steel plant
Slight inhibition
Column-type glass-fabricated PBR
[22]
24 25-30 15-20
Real flue gas from coke oven of steel plant
Slight inhibition
Column-type glass-fabricated PBR
[22]
Scenedesmus sp. 18 150 200
Real flue gas from combustion chamber of coke oven
No inhibition
Airlift [38]
Mixed culture of Scenedesmus sp., Chlorella sp., Nitzschia sp., Chlamydomonas sp., Oocystis sp. & Protoderma sp.
7.5 77 -
Real flue gas from combustion of natural gas in manure-drying motors
No inhibition
High-rate algal pond
[39]

Acta Innovations 2021 no. 41: 19-27 23
https://doi.org/10.32933/ActaInnovations.41.2 ISSN 2300-5599 2021 RIC Pro-Akademia – CC BY
Applications of CO2 capture and utilization by microalgae To date, there are few examples of commercial applications of microalgae for the capture of CO2 in a biorefinery concept, due to the high process costs [40]. Here are some examples of successful pilot scale applications. The first company in the world to use the exhaust gases of a power plant for seaweed farming was Seambiotic, in Israel. The first company in the world to use the exhaust gases of a power plant for seaweed farming was Seambiotic, in Israel. In 2006, this company, in collaboration with a coal-burning power plant in the city of Ashkelon, developed a pilot plant with a pond area of 1000 m2, to test algae growth using CO2 from flue gases. The plant produced around 7 tons of biomass per year from flue gases containing 12% vol CO2. Subsequently, the Hearol project, by Seambiotic, Yantai Hairong Electricity Technology and Penglai Weiyuan Science & Trading Ltd was developed, with the aim of using the exhaust gases generated by the Penglai coal-fired power plant to grow microalgae on a commercial scale [21]. In Germany, RWE has started a project in which combustion gases from the Niederaussem power plant are fed into an algae plant near the plant to convert CO2 into biomass. The plant has been operational since 2008 on an area of 600 square meters and supplies about 6000 kg of algal biomass using about 12000 kg of CO2 per year [41]. At the University of Kentucky in the United States, researchers cultivated Scenedesmus acutus in an 18,000-liter pilot-scale PBR system using exhaust gas derived from Duke Energy's East Bend Power Plant, Kentucky. The exhaust gas was initially pre-treated to reduce SOx and NOx and then pumped into the culture systems. The mean growth rate recorded during the study was 32.9 g m-2 d-1 [42]. The Daqi project in China is capable of capturing 110 tons of CO2 with microalgae and producing respectively 20 tons of biodiesel and 5 tons of protein per year [21]. Eni, an Italian multinational active in fuel and natural gas sectors, started in 2019 the experimental plant for the CO2 biofixation from microalgae thanks to the aid of artificial led light. The process, through CO2 biofixation by microalgae, allow to enhance CO2 as a raw material and to transform it in high value products such as algal flour for food and nutraceutical markets or biooil, which can sequentially be used as feedstock in biorefineries. The pilot plant consisting of 4 PBRs is integrated with renewable energy sources, and has achieved daily productivity data of biomass that could lead to 1 hectare plant producing 500 tons of biomass per hectare per year, trapping about 1000 tons of CO2 [43]. Between 2011 and 2013, the Green Mission project (a collaboration between the State of Brandenburg, the European Union and Vattenfall) followed by the Green Vision project, tested an algal farm facility using the combustion gas obtained from the Senftenberg power plant (Brandenburg). The facility is one of the largest closed algal cultivation systems globally with a volume of 48000 L, with an increased biomass productivity using raw combustion gas [21]. Environmental and economic impacts aspects of CO2 capture and utilization by microalgae Microalgae are receiving increasing attention due to their potential application to the capture and use of CO2 in the renewable energy sector. The use of microalgae has several advantages over the use of other plant raw materials, including a high photosynthetic conversion, a high capacity to produce different raw materials for biofuels, a high environmental bioremediation capacity (CO2 fixation from atmosphere or from combustion gases, water purification) and the non-competitiveness for the use of land for food crops. Furthermore, net CO2 emissions are assumed to be essentially zero if the CO2 released from the biofuel from microalgae can be recycled and reused for microalgae cultivation. Consequently, these advantages and potential make microalgae suitable for solving CO2 and energy reduction problems [33]. CO2 capture through a biorefinery approach with microalgae cultivation is economically feasible, as waste from power plants or other industrial plants is reused [44] and residual microalgae biomass, rich in proteins and carbohydrates, can be used as a carbon source for the production of bioelectricity, biohydrogen and also fatty acids and other molecules, which can in turn be used to produce bioplastics [45]. A very promising algae for capturing CO2 from flue gases is chlorella. Studies have shown that Chlorella could grow in an atmosphere containing up to 40% (v / v) CO2, with a CO2 fixation rate between 0.73 and 2.22 g/L/day. [4,45]. A very important aspect concerns the fact that the NOx and SOx compounds present in the fed CO2 stream do not affect the production of Chlorella biomass. [4,46]. In fact, some studies reported how these pollutants are metabolized at the cellular level by microalgae in culture [22,47]. Some microalgal species could therefore be potentially useful for bioremediation of CO2, but also of other greenhouse gases [47].

Acta Innovations 2021 no. 41: 19-27 24
https://doi.org/10.32933/ActaInnovations.41.2 ISSN 2300-5599 2021 RIC Pro-Akademia – CC BY
Therefore, the main purpose is the conversion of CO2 into different products, thus closing the carbon cycle and contributing to the bioeconomy of the process [48]. The EU emission trading scheme (ETS) is a milestone of EU policy to tackle climate change and a key tool for cost-effectively reducing greenhouse gas emissions. It is the world's leading CO2 market and continues to be the largest. The ETS is a free trade program where, one the state has set the limit for the environmental load of carbon dioxide that can be emitted distributes to companies an amount of exchangeable certificates capable of covering the fixed quantity. Those who are unable to cover their emissions incur the payment of financial penalties. The most important parameter of all is therefore the method of assignment of certificates. In order to achieve climate neutrality in the EU by 2050, including the interim target of a net greenhouse gas emission reduction of at least 55% by 2030, the Commission proposes to review and possibly extend the scope of the EU ETS system. The main impact produced by the ETS is represented by the cost that companies will have to face to obtain the necessary permits to cover their emissions, so being the cost of innovative technologies for the reduction of CO2 emissions presumably lower than the expected cost of purchasing new certificates on the market, companies will feel encouraged to adopt new technologies. The possibility of acquiring a valid and efficient technological innovation that allows to reduce, at least in part, the polluting CO2 emissions by channelling the latter into photobioreactors to produce biomass, must make us reflect and think about a whole series of other important benefits that can be drawn from the use of this technology. Firstly, part of the cost currently incurred only for the "virtual" compensation of CO2, which continues to flow into the atmosphere, would be invested. On the other hand, the biosynthesis operated by microalgae intervenes in this process by sequestering and transforming inorganic carbon (CO2) into organic carbon and returning molecular oxygen to the environment. Impact Microalgae are capable to convert CO2 from the atmosphere and from flue gas, leading to a reduction of GHGs emissions. Thanks to this, the greenhouse effect will be reduced, and therefore also global warming, achieving a healthier environment. Worldwide emissions of CO2, about 40 Gt per year, are too high compared to about 14000 tons of microalgae biomass commercialized (about 27000 tons of CO2 biofixed). This incredibly low contribution highlights the need to boost productivity and improve existing technologies in order to generate more microalgal biomass capable of capturing more CO2 [29]. One of the most important aspects related to the capture of CO2 from microalgae is the reuse of biofixed biomass for energy production, considering the need to meet global energy demand. Moreover, CO2 biofixation using microalgae is combined with other processes like wastewater treatment: this is advantageous to offer more economical feasibility and environmentally sustainability. The transition from pilot to industrial scale is difficult to apply as microalgal cells are exposed to hostile circumstances, resulting in a reduction in CO2 biofixation and product yield. Therefore, it is necessary to integrate the use of promising algal strains, optimized process parameters, targeted cultivation systems, to ensure economic and environmental feasibility on a large scale. Conflict of interest There are no conflicts to declare. Acknowledgments This research has not been supported by any external funding. References [1] T.M.L. Wigley, P.D. Jones, P.M. Kelly, Global warming?, Nature. 291 (1981) 285.
https://doi.org/10.1038/291285a0. [2] N.J.L. Lenssen, G.A. Schmidt, J.E. Hansen, M.J. Menne, A. Persin, R. Ruedy, D. Zyss, Improvements in the
GISTEMP Uncertainty Model, J. Geophys. Res. Atmos. 124 (2019) 6307–6326. https://doi.org/10.1029/2018JD029522.
[3] M. Molazadeh, H. Ahmadzadeh, H.R. Pourianfar, S. Lyon, P.H. Rampelotto, The use of microalgae for coupling wastewater treatment with CO2 biofixation, Front. Bioeng. Biotechnol. 7 (2019). https://doi.org/10.3389/fbioe.2019.00042.
[4] W.Y. Cheah, P.L. Show, J.S. Chang, T.C. Ling, J.C. Juan, Biosequestration of atmospheric CO2 and flue gas-containing CO2 by microalgae, Bioresour. Technol. 184 (2015) 190–201.

Acta Innovations 2021 no. 41: 19-27 25
https://doi.org/10.32933/ActaInnovations.41.2 ISSN 2300-5599 2021 RIC Pro-Akademia – CC BY
https://doi.org/10.1016/j.biortech.2014.11.026. [5] S. Solomon, J.S. Daniel, T.J. Sanford, D.M. Murphy, G.K. Plattner, R. Knutti, P. Friedlingstein, Persistence
of climate changes due to a range of greenhouse gases, Proc. Natl. Acad. Sci. U. S. A. 107 (2010) 18354–18359. https://doi.org/10.1073/pnas.1006282107.
[6] J. Singh, D.W. Dhar, Overview of carbon capture technology: Microalgal biorefinery concept and state-of-the-art, Front. Mar. Sci. 6 (2019) 1–9. https://doi.org/10.3389/fmars.2019.00029.
[7] A. Boretti, Covid 19 impact on atmospheric CO2 concentration, Int. J. Glob. Warm. 21 (2020) 317–323. https://doi.org/10.1504/IJGW.2020.108686.
[8] B. Zhao, Y. Su, Process effect of microalgal-carbon dioxide fixation and biomass production: A review, Renew. Sustain. Energy Rev. 31 (2014) 121–132. https://doi.org/10.1016/j.rser.2013.11.054.
[9] Intergovernmental Panel on Climate Change, Climate Change 2014 Mitigation of Climate Change, Cambridge University Press, Cambridge, 2014. https://doi.org/10.1017/cbo9781107415416.
[10] X. Li, A. Kraslawski, Conceptual process synthesis: Past and current trends, Chem. Eng. Process. Process Intensif. 43 (2004) 583–594. https://doi.org/10.1016/j.cep.2003.05.002.
[11] K. Damen, M. Van Troost, A. Faaij, W. Turkenburg, A comparison of electricity and hydrogen production systems with CO 2 capture and storage. Part A: Review and selection of promising conversion and capture technologies, Prog. Energy Combust. Sci. 32 (2006) 215–246. https://doi.org/10.1016/j.pecs.2005.11.005.
[12] J.N. Knudsen, J.N. Jensen, P.J. Vilhelmsen, O. Biede, Experience with CO2 capture from coal flue gas in pilot-scale: Testing of different amine solvents, in: Energy Procedia, 2009: pp. 783–790. https://doi.org/10.1016/j.egypro.2009.01.104.
[13] Z. Qiao, Z. Wang, C. Zhang, S. Yuan, Y. Zhu, J. Wang, PVAm–PIP/PS composite membrane with high performance for CO2/N2 separation, AIChE J. 59 (2012) 215–228. https://doi.org/10.1002/aic.
[14] P. Stegmann, M. Londo, M. Junginger, The circular bioeconomy: Its elements and role in European bioeconomy clusters, Resour. Conserv. Recycl. X. 6 (2020) 100029. https://doi.org/10.1016/j.rcrx.2019.100029.
[15] A. Shahid, A. Zafar Khan, T. Liu, S. Malik, I. Afzal, M.A. Mehmood, Production and Processing of Algal Biomass, in: Algae Based Polym. Blends, Compos. Chem. Biotechnol. Mater. Sci., Elsevier, 2017: pp. 273–299. https://doi.org/10.1016/B978-0-12-812360-7.00007-0.
[16] C.W.W. Ng, R. Tasnim, J.L. Coo, Effects of atmospheric CO2 concentration on soil-water retention and induced suction in vegetated soil, Eng. Geol. 242 (2018) 108–120. https://doi.org/10.1016/j.enggeo.2018.06.001.
[17] M.K. Lam, K.T. Lee, Renewable and sustainable bioenergies production from palm oil mill effluent (POME): Win-win strategies toward better environmental protection, Biotechnol. Adv. 29 (2011) 124–141. https://doi.org/10.1016/j.biotechadv.2010.10.001.
[18] C. Grandclément, I. Seyssiecq, A. Piram, P. Wong-Wah-Chung, G. Vanot, N. Tiliacos, N. Roche, P. Doumenq, From the conventional biological wastewater treatment to hybrid processes, the evaluation of organic micropollutant removal: A review, Water Res. 111 (2017) 297–317. https://doi.org/10.1016/j.watres.2017.01.005.
[19] J. Masojídek, G. Torzillo, M. Koblízek, Photosynthesis in Microalgae, in: Handb. Microalgal Cult. Appl. Phycol. Biotechnol. Second Ed., John Wiley & Sons, Ltd, Oxford, UK, 2013: pp. 21–36. https://doi.org/10.1002/9781118567166.ch2.
[20] I. Afzal, A. Shahid, M. Ibrahim, T. Liu, M. Nawaz, M.A. Mehmood, Microalgae: A Promising Feedstock for Energy and High-Value Products, in: Algae Based Polym. Blends, Compos. Chem. Biotechnol. Mater. Sci., Elsevier, 2017: pp. 55–75. https://doi.org/10.1016/B978-0-12-812360-7.00003-3.
[21] A.K. Vuppaladadiyam, J.G. Yao, N. Florin, A. George, X. Wang, L. Labeeuw, Y. Jiang, R.W. Davis, A. Abbas, P. Ralph, P.S. Fennell, M. Zhao, Impact of Flue Gas Compounds on Microalgae and Mechanisms for Carbon Assimilation and Utilization, ChemSusChem. 11 (2018) 334–355. https://doi.org/10.1002/cssc.201701611.
[22] C.Y. Kao, T.Y. Chen, Y. Bin Chang, T.W. Chiu, H.Y. Lin, C. Da Chen, J.S. Chang, C.S. Lin, Utilization of carbon dioxide in industrial flue gases for the cultivation of microalga Chlorella sp., Bioresour. Technol. 166 (2014) 485–493. https://doi.org/10.1016/j.biortech.2014.05.094.
[23] P. Kandimalla, S. Desi, H. Vurimindi, Mixotrophic cultivation of microalgae using industrial flue gases for biodiesel production, Environ. Sci. Pollut. Res. 23 (2016) 9345–9354. https://doi.org/10.1007/s11356-015-5264-2.
[24] M. Ota, M. Takenaka, Y. Sato, R. Lee Smith, H. Inomata, Effects of light intensity and temperature

Acta Innovations 2021 no. 41: 19-27 26
https://doi.org/10.32933/ActaInnovations.41.2 ISSN 2300-5599 2021 RIC Pro-Akademia – CC BY
on photoautotrophic growth of a green microalga, Chlorococcum littorale, Biotechnol. Reports. 7 (2015) 24–29. https://doi.org/10.1016/j.btre.2015.05.001.
[25] L. Meier, R. Pérez, L. Azócar, M. Rivas, D. Jeison, Photosynthetic CO2 uptake by microalgae: An attractive tool for biogas upgrading, Biomass and Bioenergy. 73 (2015) 102–109. https://doi.org/10.1016/j.biombioe.2014.10.032.
[26] Y. Chisti, Biodiesel from microalgae, Biotechnol. Adv. 25 (2007) 294–306. [27] E. Jacob-Lopes, C.H.G. Scoparo, L.M.C.F. Lacerda, T.T. Franco, Effect of light cycles (night/day) on CO2
fixation and biomass production by microalgae in photobioreactors, Chem. Eng. Process. Process Intensif. 48 (2009) 306–310. https://doi.org/10.1016/j.cep.2008.04.007.
[28] A. Kumar, S. Ergas, X. Yuan, A. Sahu, Q. Zhang, J. Dewulf, F.X. Malcata, H. van Langenhove, Enhanced CO2 fixation and biofuel production via microalgae: Recent developments and future directions, Trends Biotechnol. 28 (2010) 371–380. https://doi.org/10.1016/j.tibtech.2010.04.004.
[29] M. Morales, L. Sánchez, S. Revah, The impact of environmental factors on carbon dioxide fixation by microalgae, FEMS Microbiol. Lett. 365 (2018). https://doi.org/10.1093/femsle/fnx262.
[30] H.W. Yen, I.C. Hu, C.Y. Chen, J.S. Chang, Design of Photobioreactors for Algal Cultivation, in: Biofuels from Algae, Second, Elsevier Inc., 2013: pp. 23–45. https://doi.org/10.1016/B978-0-444-59558-4.00002-4.
[31] L. Moraes, G.M. Rosa, A. Morillas España, L.O. Santos, M.G. Morais, E. Molina Grima, J.A.V. Costa, F.G. Acién Fernández, Engineering strategies for the enhancement of Nannochloropsis gaditana outdoor production: Influence of the CO2 flow rate on the culture performance in tubular photobioreactors, Process Biochem. 76 (2019) 171–177. https://doi.org/10.1016/j.procbio.2018.10.010.
[32] G. de M. Michele, K. da S. Cleber, A.H. Adriano, A.V.C. Jorge, Carbon dioxide mitigation by microalga in a vertical tubular reactor with recycling of the culture medium, African J. Microbiol. Res. 9 (2015) 1935–1940. https://doi.org/10.5897/ajmr2015.7632.
[33] W. Klinthong, Y.H. Yang, C.H. Huang, C.S. Tan, A Review: Microalgae and their applications in CO2 capture and renewable energy, Aerosol Air Qual. Res. 15 (2015) 712–742. https://doi.org/10.4209/aaqr.2014.11.0299.
[34] S.R. Ronda, C. Kethineni, L.C.P. Parupudi, V.B.S.C. Thunuguntla, S. Vemula, V.S. Settaluri, P.R. Allu, S.K. Grande, S. Sharma, C.V. Kandala, A growth inhibitory model with SOx influenced effective growth rate for estimation of algal biomass concentration under flue gas atmosphere, Bioresour. Technol. 152 (2014) 283–291. https://doi.org/10.1016/j.biortech.2013.10.091.
[35] F. Kaštánek, S. Šabata, O. Šolcová, Y. Maléterová, P. Kaštánek, I. Brányiková, K. Kuthan, V. Zachleder, In-field experimental verification of cultivation of microalgae Chlorella sp. using the flue gas from a cogeneration unit as a source of carbon dioxide, Waste Manag. Res. 28 (2010) 961–966. https://doi.org/10.1177/0734242X10375866.
[36] J. Doucha, F. Straka, K. Lívanský, Utilization of flue gas for cultivation of microalgae (Chlorella sp.) in an outdoor open thin-layer photobioreactor, J. Appl. Phycol. 17 (2005) 403–412. https://doi.org/10.1007/s10811-005-8701-7.
[37] S.Y. Chiu, C.Y. Kao, T.T. Huang, C.J. Lin, S.C. Ong, C. Da Chen, J.S. Chang, C.S. Lin, Microalgal biomass production and on-site bioremediation of carbon dioxide, nitrogen oxide and sulfur dioxide from flue gas using Chlorella sp. cultures, Bioresour. Technol. 102 (2011) 9135–9142. https://doi.org/10.1016/j.biortech.2011.06.091.
[38] F.F. Li, Z.H. Yang, R. Zeng, G. Yang, X. Chang, J.B. Yan, Y.L. Hou, Microalgae capture of CO2 from actual flue gas discharged from a combustion chamber, Ind. Eng. Chem. Res. 50 (2011) 6496–6502. https://doi.org/10.1021/ie200040q.
[39] I. de Godos, J.L. Mendoza, F.G. Acién, E. Molina, C.J. Banks, S. Heaven, F. Rogalla, Evaluation of carbon dioxide mass transfer in raceway reactors for microalgae culture using flue gases, Bioresour. Technol. 153 (2014) 307–314. https://doi.org/10.1016/j.biortech.2013.11.087.
[40] W. Zhou, J. Wang, P. Chen, C. Ji, Q. Kang, B. Lu, K. Li, J. Liu, R. Ruan, Bio-mitigation of carbon dioxide using microalgal systems: Advances and perspectives, Renew. Sustain. Energy Rev. 76 (2017) 1163–1175. https://doi.org/10.1016/j.rser.2017.03.065.
[41] M. Dębowski, M. Zieliński, J. Kazimierowicz, N. Kujawska, S. Talbierz, Microalgae cultivation technologies as an opportunity for bioenergetic system development—advantages and limitations, Sustain. 12 (2020) 1–37. https://doi.org/10.3390/su12239980.
[42] M.H. Wilson, J. Groppo, A. Placido, S. Graham, S.A. Morton, E. Santillan-Jimenez, A. Shea, M. Crocker, C. Crofcheck, R. Andrews, CO2 recycling using microalgae for the production of fuels, Appl. Petrochemical Res. 4 (2014) 41–53. https://doi.org/10.1007/s13203-014-0052-3.

Acta Innovations 2021 no. 41: 19-27 27
https://doi.org/10.32933/ActaInnovations.41.2 ISSN 2300-5599 2021 RIC Pro-Akademia – CC BY
[43] S.D. Milanese, Eni sviluppa una innovativa tecnologia per la biofissazione della CO2 con luce artificiale, (2020).
[44] L. Brennan, P. Owende, Biofuels from microalgae—a review of technologies for production, processing, and extractions of biofuels and co-products, Renew. Sustain. Energy Rev. 14 (2010) 557–577.
[45] S. Venkata Mohan, J.A. Modestra, K. Amulya, S.K. Butti, G. Velvizhi, A Circular Bioeconomy with Biobased Products from CO2 Sequestration, Trends Biotechnol. 34 (2016) 506–519. https://doi.org/10.1016/j.tibtech.2016.02.012.
[46] S.P. Singh, P. Singh, Effect of CO2 concentration on algal growth: A review, Renew. Sustain. Energy Rev. 38 (2014) 172–179. https://doi.org/10.1016/j.rser.2014.05.043.
[47] J.H. Duarte, L.S. Fanka, J.A.V. Costa, Utilization of simulated flue gas containing CO2, SO2, NO and ash for Chlorella fusca cultivation, Bioresour. Technol. 214 (2016) 159–165. https://doi.org/10.1016/j.biortech.2016.04.078.
[48] F. Bauer, Narratives of biorefinery innovation for the bioeconomy: Conflict, consensus or confusion?, Environ. Innov. Soc. Transitions. 28 (2018) 96–107. https://doi.org/10.1016/j.eist.2018.01.005.
Acta Innovations 2021 no. 41: 28-41 28
https://doi.org/10.32933/ActaInnovations.41.3 ISSN 2300-5599 2021 RIC Pro-Akademia – CC BY
FACTORS CONTRIBUTING AND PROMOTING OPEN INNOVATION IN INDIAN FEMALE-OWNED FOOD PROCESSING SMES- PRIORITIZING THROUGH THE AHP TECHNIQUE
Supriya Lamba Sahdev
Amity International Business School, Sector-125, Amity University Noida, UP, India, [email protected]
https://orcid.org/0000-0001-5141-5538
Gurinder Singh Amity International Business School, Sector-125, Amity University
Noida, UP, India, [email protected]
https://orcid.org/0000-0002-7827-1578
Navleen Kaur Amity International Business School, Sector-125, Amity University
Noida, UP, India, [email protected]
https://orcid.org/0000-0002-6814-5690 Article history: Received 29 September 2021, Received in revised form 2 October 2021, Accepted 5 October 2021, Available online 5 October 2021 Abstract The prime motivation behind this investigation is to recognize and organize the different factors connected to Open Innovation in the already up and running from last five years Indian female owned SMEs in Food Processing Industry. Fifteen Indian female owners were chosen. An AHP system was utilized to examine the weight of basic elements leading towards Open Innovation. All things considered, the respondents organized advancement technique, opportunity acknowledgment, money and inspiration as the principle criteria that leads to Open Innovation in Indian females owned SMEs in Food Processing. COVID-19, gender gap, raising inner and outer funds were likewise observed as a hindrance ladies face that usually would keep them away from innovative tasks performed for business. The result of this examination is giving policymakers in India food for thought regarding the significance of the factors connected to development of Indian female owned SMEs in Food Processing Industry and will be able to move towards sustainable development goals- Goal 9 (Industry, Innovation and Infrastructure) and Goal 5 (gender equality) which is required for the economic development of the country. This will assist them with systemizing and organizing the basic, advancement of open innovation factors in Indian female owned Food Processing SMEs, which will give a boost to the contribution of Indian females in the financial development of India, which a developing country currently. Keywords open innovation; India; SMEs; female owned Food Processing SMEs; AHP. Introduction Business has for quite some time been known as a driver of financial development. Innovation based SMEs are a pointer of a sound and developing economy [1], subsequently, such undertakings ought to be energized, bolstered, and developed to the best conceivable degree [2] especially in developing countries like India. In India, nearly 453,339 SMEs structure the centre of the India government's development methodology [1]. A study by McKinsey estimated in 2015 that promoting women’s equality in India can make the GDP boost by $0.7 trillion in 2025. Also, entrepreneurship is an underdeveloped area to work upon the economic potential of women in India, which will further help in achieving the sustainable development goals: Goal -9 (Industry, Innovation, and Infrastructure) and Goal-5 (gender equality) [3]. Indian history is a proof that India was a male's dominated zone [4]. According to Sixth Economic Census by National Sample Survey Organization (NSSO), out of 58.5 million businesses, in India 8.05 million business are owned by females. The critical development of female owned and managed SMEs in creating nations has drawn the consideration of both scholastics and the corporate segment [5]. Worldwide open foundations, national and governments, NGOs, privately owned businesses, philanthropies,

Acta Innovations 2021 no. 41: 28-41 29
https://doi.org/10.32933/ActaInnovations.41.3 ISSN 2300-5599 2021 RIC Pro-Akademia – CC BY
information foundations and business affiliations have started projects and approaches to advance and create female enterprise [1]. As per the Mastercard Index of Women Entrepreneurs (MIWE) 2018, in 2016 around 163 million women in 74 economies started new businesses in the world and approax 8 million women are running their own businesses. India is world’s second - largest producer of vegetables and fruits. Out of India’s food market, 32% accounts for processing of food and in terms of manufacturing, consumption, exporting and expected growth, which ranks 5th. In Manufacturing and Agriculture, it contributes 8.83 and 10.66% to Gross Value Added respectively. In 6 years ending 2017-18, Food Processing Sector in India grew at an AAGR of around 5.06% [6]. And contributes 13% to exports. Indian government aims to support the food processing sector by leveraging reforms like 100% FDI in marketing of food items and exemptions and support system at central and state level with a focus on infrastructure required for supply chain. As per DIPP, in India the food processing sector has received around US$ 7.54 billion worth of FDI during the period April 2000 -March 2017 [7]. The Indian Food Processing industry has been growing at an Average Annual Growth Rate of 8.41% in 2014-18. As per the data collected in Annual Survey of Industries (2016-17), food processing accounted for [8].
15.95% of total number of factories
16.78% of operational factories
employed 11.36% of workforce
14.09% of output Innovation was believed to be the domain of huge companies/ MNCs. In recent years literature has increased about innovation, SMEs, and women’s owners, which throws light on positive effect of innovation on women, and about an underrepresentation of females in the areas that are related with generating innovation. This Study throws light on the components that support and block Indian female businessowners from being increasingly adopting Open Innovation, for example, assembling, science and innovation. Limited research has been done to investigate these components in Female businessowners in Food Processing SMEs [9]. This examination looks to accomplish the following exploration goals:
a. distinguish the inhibitors and facilitators that advance Open Innovation development in Indian women owned Food Processing SMEs.
b. organizes the significance of chance acknowledgment, culture, innovation, aptitudes improvement, development system, inspiration, government approaches, fund, and factors in already up and running Indian Female owned Food Processing SMEs.
For understanding the status of open innovation Indian Food Processing SMEs owned by Females numerous factors, sub-factors were identified and then exploration was planned by forming a multi-criterion diagnosis and a levelled process (AHP) model, by utilizing subjective factors and sub-factors which are on a lateral stage converted into quantitative pointers which further help female owners in better understanding [10]. Literature review
1. Open Innovation (OI) Innovation may include growing new items, new strategies for creation, new sources of supply, the abuse/exploitation of new markets, or new approaches to compose business [11]. Open Innovation is a process of progressively arranged procedure of innovation in which organizations benefit from outer information is called 'open innovation', a worldview that expect that associations can and should consolidate inner thoughts, outer thoughts and ways to advertise, as associations hope to propel their innovations [12]. It is evident from prior research that engaging in OI helps firms to access ideas, knowledge and technologies from relevant stakeholders in their ecosystems [13]. The ability of Indian SMEs is colossal and can coordinate with its remote partners, yet it is obvious that they slack in development. Adoption of innovations in SMEs can support the Food Processing Sector of India and can make Indian SMEs comparable to already developed nations [14]. Firm size has been found to impact OI practices and outcomes [15]. Hewitt-Dundas and Roper (2018) [16] identify that levels of OI in small firms are sub-optimal due to a paucity of OI capabilities. The current literature on SME-OI is thin and fragmented [17]. Empowering female business owners in the food processing industry will expand the way of life and contributes towards the making the economy more developed [18].
2. Opportunities and challenges faced by female entrepreneurs in India As per APJ Abdul Kalam, “empowering women is important for making a country decent as this leads to better family, society and nation”. Indian women owners are important for Indian economy as they contribute 3.09 % to industrial output and give 10% jobs in various industries [19]. But in India, women owned SMEs, have lack of access to capital which is the biggest constraint for them in making their businesses run [20]. In 2014, Prime
Acta Innovations 2021 no. 41: 28-41 30
https://doi.org/10.32933/ActaInnovations.41.3 ISSN 2300-5599 2021 RIC Pro-Akademia – CC BY
Minister Modi’s Make in India was launched and focusing on MNCs and more FDI in India and missing on women’s entrepreneurial capabilities. Whereas, 8% of manufacturing is from the Indian SME sector. Women hold a fair stake (14% of registered enterprises, 9% unregistered) among SMEs. Two industries were highlighted in the Make in India campaign including the garment and food processing which are popular among women entrepreneurs. 10% share of women’s entrepreneurship is there in food processing, which is no doubt is low and the potential remains unexplored [21]. The Statewise female owned MSMEs in India (per 1000 MSMEs) - Andhra Pradesh 247, Arunachal Pradesh 276, Assam 55, Bihar 49, Chhattisgarh 84, Delhi 93, Goa 154, Gujarat 249, Haryana 101, Himachal Pradesh 129, Jammu & Kashmir 106, Jharkhand 196, Karnataka 244, Kerala 208, Madhya Pradesh 138, Maharashtra 168, Manipur 481, Meghalaya 351, Mizoram 392, Nagaland 229, Odisha 149, Punjab 153, Rajasthan 141, Sikkim 193, Tamil Nadu 260, Telangana 373, Tripura 133, Uttar Pradesh 96, Uttarakhand 50, West Bengal 327, A & N Islands 210, Chandigarh 99, Dadra & Nagar Haveli 169, Daman & Diu 202, Lakshadweep 260 and Puducherry 283 [22]. Females have been known to have unprecedented innovative abilities that empower them to prevail in various organizations [2,23]. Gupta and Agarwal (2017) [24], detailed that Indian ladies faces hindrances which includes paucity of career obligations, lack of monetary instability of ladies, risk taking capacity absenteeism, managing finance & raw material, tough competition, low degree of proficiency among ladies, getting help by banks, marketing issues, no help from family, and significant cost of production. From Indian Food Processing Industry, we have examples of successful females, owing and managing SMEs like Monica Narula-Idea Chakki Private Ltd., Lisa Suwal-Prasuma Meats & Delicatessen, Dipti Motiani- Freshtrop Fruits Ltd., Rupali Bhatnagar-Sparkling Wines, at Sula Vineyards and Anamika Singh- Anandini Himalaya Tea [7].To get a reasonable image of the difficulties faced by Indian female owned Food Processing SMEs doing Open Innovation, this investigation utilizes the accompanying classifications: culture, inspiration, strategy of open innovation, opportunity acknowledgment, finance, technology, expertise development and policies of Indian government. Culture - Societal and cultural characteristics qualities are profoundly powerful in deciding enterprising achievement as per Baum and Locke (2004) [25] and Gutcher (2013) [26] as Thornton et al. (2011) [27] saw culture as an example of reasoning, acting, and feeling; such factors are not specific to a country [28]. Distinguished social qualities and cultural qualities as key properties of culture [27]; these qualities have an immediate connect to business enterprise. Social qualities allude to the esteem framework received by individuals inside a typical social setting, which is described by basic standards, family structure and frames of mind legitimately identified with imaginative direction [29]. Creating inventive culture in SMEs prompts showcase situated, client cantered, and provider arranged items and forms that encourage elite of SMEs [30,31]. Inspiration - Lim, Wadhwa and Mitchell (2010) [31] study distinguishes top five money related and mind elements inspiring ladies to start their businesses. The difficulties are more related with business enterprise as opposed to gender [32]. The part of inspiration assumes a focal function in advancing SME innovation [33].Family and friends help are the prime factors to contribute towards inspiration [18]. This reflects Indian culture and its people and the effect of family members and relationships on the choices being made by the female owners in the Indian Food Processing SMEs. And no doubt inspiration plays a prima facie role promoting innovation in SMEs (Vijayakumar et al., 2013) [34]. Strategizing for innovating - For Indian Food Processing SMEs, innovation is a way towards development, improving and executing in a better manner [35,36]. Businesspeople must stay mindful of new market patterns and track their rivals progress to beat their partners [37]. Open innovation can be actualized by leading studies or meetings with clients, providers, workers, investigate associations and colleges to create new thoughts and open ways to new openings [38]. Also, in developing economies like India, the historical role of women in entrepreneurship and patenting endeavours, and the barriers to greater female participation in innovation in STEM (science, technology, engineering, and mathematics) fields has been focused on [39]. Acknowledging the opportunities available - It is the prime and the most significant thought or idea behind research done in entrepreneurship research and in the way forward towards the process of Innovation [40]. The opportunity available in the Indian food processing SMEs is perceived by watching closely, testing the idea or information, and abusing/converting that into something that can be commercialized from the perspective of innovation in different SMEs, even rival firms and market top performance firms [41].

Acta Innovations 2021 no. 41: 28-41 31
https://doi.org/10.32933/ActaInnovations.41.3 ISSN 2300-5599 2021 RIC Pro-Akademia – CC BY
Finance - There is a dire need to address gender discrimination in the small-business credit market will help in bridging the performance gap between male and female-owned firms in India [42]. Around 79% of women owned businesses are self - financed, as families are usually hesitant to support their daughter’s entrepreneurial ventures financially [43]. Arranging the finance required is considered to be a vital factor and no doubt is the largest obstacles faced by the Indian Food Processing for innovating.World Bank Enterprise Survey recognized the likely endogeneity of gender in credit constraints [44]. Enterprises owned by female entrepreneurs are on average 3% less likely to be credit constrained compared to their male counterparts [33]. Technology - To improve competitiveness of Indian Food Processing SMEs, government should make more efforts to encourage foreign investments and IT service providers and come up with business environment related economic policies. These efforts by government will help in making efficient ICT applications for sustainable growth of SMEs. The web is a stage for development which helps SMEs in advertising, making openings and getting to showcase patterns [37]. Cloud computing is another type of innovation which extremely engaging SMEs because of its cost adequacy, is greatest ROI and intensity in a business domain [45]. Informal communities have brought new open doors for SME administrators in both created and creating districts [5,35].
Development of Expertise - Gaining prodigy or development of expertise in skills is the prime factor that helps in promoting innovation in the Indian Food Processing SMEs which are women owned. India is enjoying a demographic dividend vis-à-vis countries with rapidly ageing population [46]. The National Skill Development Policy (2009) envisaged the creation of 530 million skilled workers by 2022. The Skill Development Policy 2012–2017 are there to develop the skills of the indigenous people of the state and offer better employment opportunities [47]. Innovative, creative, and technical skills set combination is important for individuals to utilize the ideas and go for problem solving as per Singh and De Noble (2003) [48]. The already existing literature reflects that skills like leadership and good communication also help in having best objectives to be set for the firm along with best strategies adoption and execution [49]. Minister for Food Processing Industries, Smt. Harsimrat Kaur Badal launched the PM Formalization of Micro Food Processing Enterprises (PM FME) scheme on 29th June 2020 as a part of “Atma nirbhar Bharat Abhiyan”. Union Minister said that the Scheme would generate total investment of Rs 35.000 crore and generate 9 lakh skilled and semi-skilled employment and benefit 8 lakh units through access to information, training, better exposure and formalization [50]. Government policies - Governments across the globe as well as varied developmental organizations are actively endeavour promotion of women entrepreneurs through numerous schemes, incentives and promotional measures [51]. Government of India has 27+ schemes for women operated by different departments and Ministries. Few of them are: Integrated Rural Development Programme, Khadi and village Industries Commission, Training of Rural Youth for Self-Employment, Prime Ministers Rojgar Yojana, Entrepreneurial Development Programme, Management Development programmes, Women’s Development Corporations, Marketing of Non-Farm Products of rural Women, Assistance to Rural Women in Non-Farm Development, Traded Related Entrepreneurship Assistance Development [52]. MSME Definition Further Revised to Energise MSMEs With Entire Gamut of ‘Atmanirbhar Bharat Package’on 1st June, 2020 [53].
Table 1. MSME Definition Revised in June 2020 by Government of India.
Category Old Capital [crore]
Old Turnover New Capital New Turnover
Small 5 2 10 50
Medium 10 5 50 1
3. Innovations brought by women in the SME sector Women's entrepreneurial innovativeness is majorly impacted by the type of business, its location, and size of usiness along with age and education of the female owner [51]. As per the examination performed by Global Entrepreneurship Monitor (2015) on female business owners - it was recognised that women entrepreneur’s numbers Worldwide has rose by 6% [47]. Despite the obstructions, three associations – Shri Mahila Griha Udyog

Acta Innovations 2021 no. 41: 28-41 32
https://doi.org/10.32933/ActaInnovations.41.3 ISSN 2300-5599 2021 RIC Pro-Akademia – CC BY
Lijjat Papad established in 1959, Self Employed Women's Association (SEWA) established in 1971, and Biocon40 established in 1978 - were established by ladies. In India under the existence and prevalence of gender gap, female business owners are comparatively more innovative than male partners [1]. In India, according to GEM review 2017-2018, announced that Indian Women entrepreneurs have negligible contribution in the cutting-edge segment. This might be because of following reasons, for example, a higher level of hazard and a more significant level of costs identified with mechanical development.
4. Overview of AHP
AHP is a strategy to organizing the achievement components of SMEs [54]. AHP is one of the most prevalent techniques utilized for multi-criteria decision-making. It is too flexible, handles complex issues, makes an interpretation of human pairwise decisions into analysable subjective information, and manages subjective criteria. The principle commitment of AHP is dispensing with any inclination that could be natural from esteem decisions and giving outcomes that are both predictable and powerful. This methodology has given progressively steady and reasonable information because of the interrelated correlation among factors. To choose the components that support and block Indian female businessowners from being increasingly adopting Open Innovation, this examination paper utilizes the AHP procedure. Considering the rules proposed by Saaty [10]
an AHP system was created for encouraging the examination [24]. Figure 1 shows a stream outline including different strides to lead the AHP study. This study is therefore performed to identify and prioritize in order of importance the factors and sub factors that are associated with women - owned Indian Food Processing SMEs and AHP model has been used to throw light on and for having a better understanding on open innovation in India’s context.
5. Research model and methodology
The key focus in this segment is on the calculated structure of this study. Under this study, following prime factors that contribute towards adoption of open innovation as facilitators are being investigated in the context of up and running (more than 5 years) female owned Indian Food Processing SMEs-culture, inspiration, strategizing for innovating, acknowledgement of the available opportunities, finance, technology, skills development, and government policies [47]. For this reason, a study based subjective and quantitative technique was utilized. With the help of the LinkedIn, 15 questionnaires were shared and 11 were answered completely and correctly in Delhi NCR. A questionnaire was utilised to acquire the reactions of up and running (more than 5 years) female owned Indian Food Processing SMEs on the hurdles underwent by them while performing open innovation. The questionnaire was created in English and included both open-ended questions utilizing a nine-point proportion scale (Table 3).
Table 2. Random index.
N 1
2 3 4 5 6 7 8 9 10
RI 0.00
0.00 0.58 0.90 1.12 1.24 1.32 1.41 1.45 1.48
Note: Where n is number of factors.

Acta Innovations 2021 no. 41: 28-41 33
https://doi.org/10.32933/ActaInnovations.41.3 ISSN 2300-5599 2021 RIC Pro-Akademia – CC BY
NO
YES
NO
Figure 1. Follow of the AHP method (used under the study).
Table 3. AHP preferences - One to nine scale.
Prioritizing as per their intensity of importance
Definition given Explanation made
1 Importance equally shared
Equal contribution by two criteria
3 Importance moderately shared The slightly more importance is given to one criterion in comparison to the other.
5 Importance - strong
Strong importance and favour are given to one criterion.
7 Importance - super strong
A super strong importance and favour is given to one criterion.
9 Importance - of absolute degree
Importance of highest possible degree is given to one criterion over the other available.
2,4,6,8 Values shared between criteria’s Represents adjusted or compromised values shared between the criterions or priorities mentioned in the table above.
Define Problem
Develop Hierarchical Structure of the problem
Construct pairwise comparison matrix
Synthetization
Check Consistency
All judgements are consistent
All levels are compared
Develop overall priority rankings

Acta Innovations 2021 no. 41: 28-41 34
https://doi.org/10.32933/ActaInnovations.41.3 ISSN 2300-5599 2021 RIC Pro-Akademia – CC BY
Because of COVID-19 pandemic, the questionnaire was shared with the respondents through emails and messages on LinkedIn: out of the questionnaire filled and returned, 11 were finished and returned, giving a 67% reaction rate. The definition of the AHP hierarchy system was trailed by the information gathered from women entrepreneurs in established organizations. 15 respondents for this examination was utilized [55,56]. The AHP procedure incorporates foundation of a various levelled structure, characterizing loads and amalgamation [57]. An exploration issue is placed into a various levelled structure: level 1 throws light on the goal, level 2 reflects the variables of respondent’s choice, whereas level 3 contains sub-variables of choice and level 4 contains the choices for where the choice is to be actualized. The loads are characterized by gathering information to gauge criteria and sub-criteria, and prioritization is led by appointing a number from a scale created by Saaty speaking to the significance of the criteria. In accordance with Saaty's (2012) [55] recommendations, a geometric mean methodology was favoured over a number juggling mean methodology to join the individual pairwise correlation decisions to get the agreement pairwise examination judgment networks for the whole group. These traits were placed in a grid structure with pairwise correlation with compute mean and integrating the last assessment of choices execution based on positions of criteria and sub criteria [10]. As reflected in Figure 1, the set stages in the AHP was the basis for the pairwise analysis of the said criteria. For characterizing pairwise examinations, Saaty (2012) proposed a nine-point proportion scale as appeared in Table 3.
a. consistency index (CI) was applied to calculate consistency. Saaty (1980) characterized this specific consistency (CI=λmax – n/n 1).
b. where max is the greatest Eigen estimation of the matrix of the ratios reflecting importance and n is the quantity of variables. At that point, the consistency proportion (CR) was utilized to survey if a grid was adequately reliable. This is the proportion of the CI to the random index (RI), which is the CI of a matrix of randomly created matrix (CR=CI/ RI).
c. pair wise random examinations were done to deliver average random indices for various estimated matrices. The estimations of RI are given in Table 2 [58]. As per Saaty [58], if the estimation of CR is less than or equivalent to 0.10, the inconsistency can be acceptable.
d. Saaty [59] presented a 'consistency principle' for ascertaining priority vectors. The consistency rule says that aik = aij.ajk and further for utilizing the uncommon case of the consistency matrix framed by components aik = wi/wj, where wi and wj are the components of the priority weight vector comparing to standards and j. The information gathered were cleaned to make sure there are mistakes, for example, inadequacy or wrong reactions. The questionnaire was created utilizing a nine-point proportion scale and an AHP strategy was utilized to rank the components that influence Open Innovation in Indian Female owned food processing SMEs.

Acta Innovations 2021 no. 41: 28-41 35
https://doi.org/10.32933/ActaInnovations.41.3 ISSN 2300-5599 2021 RIC Pro-Akademia – CC BY
Figure 2. Model Proposed with AHP Technique.
Results and discussion AHP analysis Criteria level analysis-In this part of the study, the AHP analysis was used to record the priorities of Indian female owned food processing SMEs. Analysis of variables/factors impacting open innovation taking place in the Indian food processing SMEs respondents are reflecting in Table 4.

Acta Innovations 2021 no. 41: 28-41 36
https://doi.org/10.32933/ActaInnovations.41.3 ISSN 2300-5599 2021 RIC Pro-Akademia – CC BY
Table 4. Factors affecting Open innovation in food processing SMEs in Delhi-NCR owned by females. (CR value = 0.1).
Criteria Established Indian Women owned Food Processing SMEs
Ranking
Societal /Culture characteristics 0.03 7
Inspiration 0.27 1
Strategizing for innovating 0.22 3
Acknowledgement of opportunities available
0.17 2
Finance required 0.11 4
Technology status 0.08 5
Development of Skill Sets 0.06 6
Supporting policies of Government 0.06 6
Figure 3. Criteria in up and running (already existing from last 5 years) Indian Food processing SMEs in Delhi-NCR.
From Figure 3, we can make out that all the respondents of the study were selected from already up and running Indian Food processing SMEs in Delhi-NCR (purposive sampling was done) considered inspiration as the criteria of their priority (at 27%), with acknowledging the available opportunity as their second and innovation strategy as their third priorities at 22% and 17%, respectively. All the criteria for promoting Open innovation in SMEs among Indian Food Processing female owned, by all 11 participants of the study from the already up and running Indian Food processing SMEs in Delhi-NCR, showed an accepted level of consistency with CR = 0.10. AHP Sub-criteria level analysis Under this study, majorly twenty-three sub-factors/criterion were fetched from the main eight factors. Afterwards the informants from the up and running female owned Indian Food Processing SMEs were asked to prioritise these factors. In Table 5, informant’s data was summarised which reflects that societal/cultural environment for innovation as their topmost priority at seventy-two % among the sub-factor criteria. Under the main factor criteria of Inspiration, members of the family were prioritized and attained eighty-eight %. From this it is evident that in the Indian setup, members of the family and the inspiration offered by them contributes majorly for female owned Indian Food Processing SMEs. Whereas under the factor criteria of Inspiration,

Acta Innovations 2021 no. 41: 28-41 37
https://doi.org/10.32933/ActaInnovations.41.3 ISSN 2300-5599 2021 RIC Pro-Akademia – CC BY
information/ knowledge/ awareness about the market trends were given most importance of sixty-four %. On the other hand, under the factor criteria of acknowledging the opportunities available, scrutinizing/ monitoring was given importance with thirty - five %. Informants from the up and running Indian Food Processing SMEs reflected resistance in doing experimentation and undergoing any risky venture keeping in mind the king of impact COVID-19 pandemic has made on their operations and preferred following the ideas implemented by their rivals from the same industry.
Table 5. Pairwise comparison of all sub-criteria in established-phase businesses.
Sub-criteria Priority vector
CR value Total priority Total sub-criteria ranking
Societal/Cultural characteristics for Innovation
0.72 0.09 2
Social 0.12 0.02 0.01 8
Societal 0.16 0.02 7
Members of family 0.88 0.00 0.11 1
Acquaintances or friends 0.12 0.02 7
Information/Knowledge/ Awareness about the market trends
0.64 0.08 3
Feedback/response from clients 0.18 0.10 0.02 7
Sharing of Ideas/Information/Knowledge 0.07 0.01 8
Keeping a track of the rivals/competitors 0.12 0.01 8
Scrutinizing/monitoring 0.35 0.04 5
Experimentation 0.34 0.06 0.04 5
Developing associations 0.31 0.04 5
Inside the SMEs 0.87 0.00 0.11 1
Outside the SMEs 0.13 0.02 7
Online portals of social media 0.60 0.07 4
Cloud based computing services 0.09 0.02 0.01 8
Usage of internet community 0.31 0.04 5
Skill set for guidance 0.64 0.08 3
Innovation and creativity 0.22 0.06 0.03 6
Crisis management (in COVID-19 Pandemic)
0.14 0.02 7
Schemes related to funds 0.63 0.08 3
Collaboration with other existing organizations
0.22 0.10 0.03 6
Venture association 0.15 0.02 7
To sum up, ranking was done of all the sub-factors criteria. Members of the family and funds available from the inside sources finance were given the top priority, which was then followed by the societal/ cultural environment for innovation, sharing of ideas/ information/ knowledge about trends of the market, skill set related to leadership and finally the online portals of social media. In this study a survey was conducted with the help of the questionnaire consisting of the above-stated factors mentioned which were used to collect data from Indian Food Processing SMEs owned by women in Delhi - NCR which prioritized the hurdles in adopting Open innovation. The informants prioritized strategizing for innovating, acknowledgement of opportunities available, funding, and inspiration as the main factors for developing criteria’s which promote Open innovation in SMEs owned by women in Delhi - NCR. Moreover, financial markets are far from perfect because of COVID-19, and there has been a lack of SME equity financing in India. Therefore, SMEs mainly find the capital they need through the savings and income of the owners themselves or their family members or networks. The findings show that

Acta Innovations 2021 no. 41: 28-41 38
https://doi.org/10.32933/ActaInnovations.41.3 ISSN 2300-5599 2021 RIC Pro-Akademia – CC BY
Indian Food Processing SMEs owned by women in Delhi- NCR focus primarily on product and organizational innovation. In India, female entrepreneurs mostly prefer banks, among all financial providers, for their financial support. There is a definite gap between the financing provided by banks and the financing acquired by women entrepreneurs. Indian female entrepreneurs mentioned firm size, high interest rates and lack of awareness of funding schemes as their main obstacles to obtaining financing.
Impact The resaerch done is highlighting the need of support required by female enterpreneurs and the small and medium enterprises in developing economies like India especially after the challenging times that SMEs have undergone because of COVID-19, whereby attention of government is required for reforming and introducing new policies that help and support SMEs to grow and contribute more towards the GDP of these emerging and developing.The result of this examination is giving policymakers in India food for thought regarding the significance of the factors connected to development of Indian female owned SMEs in Food Processing Industry and will be able to move towards sustainable development goals - Goal 9 (Industry, Innovation and Infrastructure) and Goal 5 (gender equality) which is required for the economic development of the country. Furthermore, a more precise decision - making model can be achieved using fuzzy AHP methodology or ANP, where interrelationships can be made between different levels and within the same level, and more complex relationships can be generated among the categories and sub-categories. In today’s world which is driven by technology, having a strategy to innovate is must, otherwise the business will come to an end. Thus, it is the need of the hour that Indian policymakers introduce and launch such policies that extend support/help to Indian food processing SMEs owned by females through training and skill development to make their business a success in these challenging times of COVID -19 pandemic. The proposed model can be useful in future academic studies and will solve complicated decision - making problems in the business sector and will be able to move towards sustainable development goals - Goal 9 (Industry, Innovation and Infrastructure) and Goal 5 (gender equality) especially when the Indian economy is so badly impacted by COVID-19. In practical terms, the study includes interpretations and discussions that will help policymakers and related associations formulate and develop policies to empower Indian female entrepreneurs and initiate Open innovation in their businesses in an effective manner. In the year 2019, India has gone from 81 in 2015 to 52 position according to Global Innovation Index (GII) [60]. Government has revised the definition of SMEs in year 2020 for the growth of SMEs in India. Conclusions This study examined the various factors that will promote Open innovation adoption and execution in Indian female - owned Food processing SMEs in Delhi NCR which is required for them to become economically stronger and come out of the impact of COVID-19. The AHP method of analysis was conducted with the help of the primary data collected through the survey performed based on the questionnaire shared with the 11 Indian female owners from the Indian Food processing SMEs. Prioritizing strategies for innovating, acknowledgement of opportunities available, funding, and inspiration as the main factors for developing criteria’s which promote Open innovation in SMEs owned by women in Delhi - NCR. As per the informants, strategy, and cultural aspects both impact innovation to a greater extend. It must be kept in mind by the female owners to adopt and use all these in the initial stages or years of their business. COVID-19, gender gap, raising inner and outer funds were likewise observed as a hindrance ladies face that usually would keep them away from innovative tasks performed for business. The result of this examination is giving policymakers in India food for thought regarding the significance of the factors connected to development of Indian female owned SMEs in Food Processing Industry and will be able to move towards sustainable development goals - Goal 9 (Industry, Innovation and Infrastructure) and Goal 5 (gender equality) which is required for the economic development of the country. This will assist them with systemizing and organizing the basic, advancement of open innovation factors in Indian female owned Food Processing SMEs, which will give a boost to the contribution of Indian females in the financial development of India, which a developing country currently. Conflict of interest There are no conflicts to declare. Acknowledgments This research has not been supported by any external funding.

Acta Innovations 2021 no. 41: 28-41 39
https://doi.org/10.32933/ActaInnovations.41.3 ISSN 2300-5599 2021 RIC Pro-Akademia – CC BY
References [1] N. Saraf, Global Entrepreneurship Monitor 2013 India Report, 2013. [2] I.P.W. Wijeyaratnam, T. Perera, Barriers of women entrepreneurship: SME sector in Srilanka, Sri Lankan
J. Manag. 18 (2013) 51–81. [3] McKinsey & Company, the Power of Parity : Advancing Women’s Equality in India, McKinsey Glob. Inst.
(2015) 22. http://www.mckinsey.com/insights/growth/the_power_of_parity_advancing_womens_equality_in_india.
[4] S. Agarwal, U. Lenka, An exploratory study on the development of women entrepreneurs: Indian cases, J. Res. Mark. Entrep. 18 (2016) 232–247. https://doi.org/10.1108/JRME-04-2015-0024.
[5] UNCTAD, Annual report, 2013. [6] The Union Minister for Finance & Corporate Affairs, Economic Survey 2019-20, (2020). [7] R. Hanson, Food Processing Sector, (2011) 1–24. https://doi.org/https://ficci.in/sector.asp?sectorid=15. [8] C. of I. Industry, Indian Food Processing Sector, New Delhi 12. (2019). [9] D.P. Price, M. Stoica, R.J. Boncella, The relationship between innovation, knowledge, and performance
in family and non-family firms: an analysis of SMEs, J. Innov. Entrep. 2 (2013) 14. https://doi.org/10.1186/2192-5372-2-14.
[10] T.L. Saaty, Decision making with the Analytic Hierarchy Process, Sci. Iran. 9 (2002) 215–229. https://doi.org/10.1504/ijssci.2008.017590.
[11] H. Bloch, The theory of economic development, in: Schumpeter’s Price Theory, Harvard University Press, Massachusetts, 2020: pp. 13–23. https://doi.org/10.4324/9781315724744-2.
[12] S. Mazzocchi, Open Innovation: The New Imperative For Creating and Profiting From Technology, Innovation. 6 (2004) 474–474. https://doi.org/10.5172/impp.2004.6.3.474.
[13] A. Spithoven, P. Teirlinck, D. Frantzen, Managing open innovation: Connecting the firm to external knowledge, Edward Elgar Publishing, 2012. https://doi.org/10.4337/9781781953594.
[14] S.B. Gunjati, C. V. Adake, Innovation in Indian SMEs and their current viability: A review, in: Mater. Today Proc., 2020: pp. 2325–2330. https://doi.org/10.1016/j.matpr.2020.04.604.
[15] A.J.J. Pullen, P.C. De Weerd-Nederhof, A.J. Groen, O.A.M. Fisscher, Open innovation in practice: Goal complementarity and closed NPD networks to explain differences in innovation performance for SMEs in the medical devices sector, in: J. Prod. Innov. Manag., 2012: pp. 917–934. https://doi.org/10.1111/j.1540-5885.2012.00973.x.
[16] N. Hewitt-Dundas, S. Roper, Exploring market failures in open innovation, Int. Small Bus. J. Res. Entrep. 36 (2018) 23–40. https://doi.org/10.1177/0266242617696347.
[17] S. Popa, P. Soto-Acosta, I. Martinez-Conesa, Antecedents, moderators, and outcomes of innovation climate and open innovation: An empirical study in SMEs, Technol. Forecast. Soc. Change. 118 (2017) 134–142. https://doi.org/10.1016/j.techfore.2017.02.014.
[18] K. Naser, W.R. Mohammed, R. Nuseibeh, Factors that affect women entrepreneurs: Evidence from an emerging economy, Int. J. Organ. Anal. 17 (2009) 225–247. https://doi.org/10.1108/19348830910974932.
[19] Government of India, Provisional Results of Sixth Economic Census All India Report, (2014). [20] IFC, Financial inclusion for woman-owned micro, small & medium enterprises (MSMEs) in India, Int.
Financ. Corp. (2019). https://www.ifc.org/wps/wcm/connect/ca5c0868-e89d-4b43-ace5-8a702ed29b25/Financial+Inclusion+for+Women-owned+MSMEs.July+31.pdf?MOD=AJPERES&CVID=mOK28X8.
[21] Where are the woman in Make in India’s vision?, (2014). https://www.livemint.com/Opinion/x1NJqQiCdx8bQrxE95ju6N/Where-are-the-women-in-Make-In-Indias-vision.html.
[22] https://smestreet.in/infocus/195-msmes-out-of-1000-are-led-by-women-entrepreneurs-in-india/, (2018).
[23] J.M. Fielden, Grief as a transformative experience: Weaving through different lifeworlds after a loved one has completed suicide, Int. J. Ment. Health Nurs. 12 (2003) 74–85. https://doi.org/10.1046/j.1440-0979.2003.00271.x.

Acta Innovations 2021 no. 41: 28-41 40
https://doi.org/10.32933/ActaInnovations.41.3 ISSN 2300-5599 2021 RIC Pro-Akademia – CC BY
[24] D. Maletič, F. Lasrado, M. Maletič, B. Gomišček, Analytic Hierarchy Process Application in Different Organisational Settings, in: Appl. Theory Anal. Hierarchy Process - Decis. Mak. Strateg. Decis., InTech, 2016. https://doi.org/10.5772/64511.
[25] J.R. Baum, E.A. Locke, The relationship of entrepreneurial traits, skill, and motivation to subsequent venture growth, J. Appl. Psychol. 89 (2004) 587–598. https://doi.org/10.1037/0021-9010.89.4.587.
[26] L. Gutcher, Women in UAE SMEs told to look beyond cupcakes, Natl. (2013). www.thenational.ae/business/economy/women-in-uae-smes-told-to-look-beyond-cupcakes#ixzz2wb2dg7Se.
[27] P.H. Thornton, D. Ribeiro-Soriano, D. Urbano, Socio-cultural factors and entrepreneurial activity: An overview, Int. Small Bus. J. 29 (2011) 105–118. https://doi.org/10.1177/0266242610391930.
[28] P. Arenius, A. Kovalainen, Similarities and differences across the factors associated with women’s self-employment preference in the Nordic countries, Int. Small Bus. J. 24 (2006) 31–59. https://doi.org/10.1177/0266242606059778.
[29] N. Krueger, F. Liñán, G. Nabi, Cultural values and entrepreneurship, Entrep. Reg. Dev. 25 (2013) 703–707. https://doi.org/10.1080/08985626.2013.862961.
[30] P. Rujirawanich, R. Addison, C. Smallman, The effects of cultural factors on innovation in a Thai SME, Manag. Res. Rev. 34 (2011) 1264–1279. https://doi.org/10.1108/01409171111186397.
[31] D.S.K. Lim, E.A. Morse, R.K. Mitchell, K.K. Seawright, Institutional environment and entrepreneurial cognitions: A comparative business systems perspective, Entrep. Theory Pract. 34 (2010) 491–516. https://doi.org/10.1111/j.1540-6520.2010.00384.x.
[32] H.P. Bulsara, J. Chandwani, S. Gandhi, Women Entrepreneurship and Innovations in India: An Exploratory Study, Int. J. Innov. 2 (2014). https://doi.org/10.5585/iji.v2i1.2.
[33] IFC, Strengthening access to finance for women-owned SMEs in developing countries, 2011. [34] R. Karan, S. Shokeen, Women Entrepreneurs in India - Issues and Challenges, Int. J. Econ. Manag. Stud.
4 (2017) 17–23. https://doi.org/10.14445/23939125/ijems-v4i12p103. [35] B.R. Barringer, R.D. Ireland, Entrepreneurship: Successfully Launching New Ventures, Pearson, Harlow,
2012. http://scholar.google.com/scholar?hl=en&btnG=Search&q=intitle:No+Title#0. [36] S. Bucolo, C. Wrigley, Design Led Innovation as a Means to Sustain Social Innovation Enterprises, Des.
Bus. Conf. 2011, 17-18 Novemb. 2011, IED Barcelona, Barcelona. (2011) 17–18. [37] OECD, OECD Innovation Strategy 2015 An Agenda for Policy Action, OECD Rev. Innov. Policy. (2015) 395–
423. http://www.oecd.org/mcm/documents/OECD-Innovation-Strategy-2015-CMIN2015-7.pdf%5Cnhttp://www.oecd-ilibrary.org/science-and-technology/oecd-reviews-of-innovation-policy-china-2008/framework-conditions-for-innovation_9789264039827-12-en.
[38] U. Georgy, External Knowledge Inflow by Open Innovation in Public Libraries Potential of knowledge management in public libraries — Knowledge Management, IFLA World Libr. Inf. Congr. 2012 Helsi (2012) 1–10. http://conference.ifla.org/ifla78.
[39] C. Chatterjee, S. Ramu, Gender and its rising role in modern Indian innovation and entrepreneurship, IIMB Manag. Rev. 30 (2018) 62–72. https://doi.org/10.1016/j.iimb.2017.11.006.
[40] S. Bucolo, C. Wrigley, Design led innovation to sustain social innovation enterprises, in: J. Faust (Ed.), Bus. Des. Conf. – A Discursive Summ., CreateSpace Independent Publishing Platform, United States of America, 2013.
[41] R.A. Baron, Entrepreneurship: A process perspective, Acad. Manag. Perspect. 20 (2006) 104–119. [42] K. Chaudhuri, S. Sasidharan, R.S.N. Raj, Gender, small firm ownership, and credit access: some insights
from India, Small Bus. Econ. 54 (2020) 1165–1181. https://doi.org/10.1007/s11187-018-0124-3. [43] A. Mathew, Making it in India, Financ. Dev. 56 (2019) 14–17. [44] N. Wellalage, S. Locke, Access to credit by SMEs in South Asia: do women entrepreneurs face
discrimination, Res. Int. Bus. Financ. 41 (2017) 336–346. https://doi.org/10.1016/j.ribaf.2017.04.053. [45] S. Saya, L.G. Pee, A. Kankanhalli, The impact of institutional influences on perceived technological
characteristics and real options in cloud computing adoption, in: ICIS 2010 Proc. - Thirty First Int. Conf. Inf. Syst., Missouri, USA, 2010.
[46] A.K. Das, Skills development for SMEs: Mapping of key initiatives in India, Institutions Econ. 7 (2015) 120–143. https://doi.org/10.2139/ssrn.2499207.
[47] GEM, Global Entrepreneurship Monitor (GEM) report 2017-18, 2018. [48] G. Singh, A. DeNoble, Views on Self-employment and personality- an exploratory study, J. Dev. Entrep.
8 (2003) 265–281. http://scholar.google.com/scholar?hl=en&btnG=Search&q=intitle:Views+on+Self-employment+and+personality-+an+exploratory+study#0.

Acta Innovations 2021 no. 41: 28-41 41
https://doi.org/10.32933/ActaInnovations.41.3 ISSN 2300-5599 2021 RIC Pro-Akademia – CC BY
[49] S. Choo, M. Wong, Entrepreneurial intention: Triggers and barriers to new venture creations in Singapore, Singapore Manag. Rev. 28 (2006) 47–64.
[50] PM FME Scheme to Invest of Rs 35,000 Crore and 9 Lakh Skilled Employment: Harsimrat Kaur Badal, (2020). https://smestreet.in/limelight/pm-fme-scheme-to-invest-of-rs-35000-crore-and-9-lakh-skilled-employment-harsimrat-kaur-badal/.
[51] J. Agarwal, Women entrepreneurship and innovations: evidencefFrom India, Res. J. Soc. Sci. Manag. 8 (2019) 64–68.
[52] A.K. Marg, Women entrepreneurship: Transforming from domestic household to financial independence, (2012) 1–38.
[53] MSME Definition Further Revised to Energise MSMEs With Entire Gamut of ‘Atmanirbhar Bharat Package,’ (2020). https://smestreet.in/limelight/msme-definition-further-revised-to-energise-msmes-with-entire-gamut-of-atmanirbhar-bharat-package/.
[54] A. Sevinç, Ş. Gür, T. Eren, Analysis of the difficulties of SMEs in industry 4.0 applications by analytical hierarchy process and analytical network process, Processes. 6 (2018) 264. https://doi.org/10.3390/pr6120264.
[55] L.P. Fatti, Decision making for leaders: The analytical hierarchy process for decisions in a complex world, Eur. J. Oper. Res. 42 (1989) 107–109. https://doi.org/10.1016/0377-2217(89)90066-0.
[56] P.R. Drake, D. Myung Lee, M. Hussain, The lean and agile purchasing portfolio model, Supply Chain Manag. An Int. J. 18 (2013) 3–20. https://doi.org/10.1108/13598541311293140.
[57] F. Talib, Z. Rahman, Identification and prioritization of barriers to total quality management implementation in service industry: An analytic hierarchy process approach, TQM J. 27 (2015) 591–615. https://doi.org/10.1108/TQM-11-2013-0122.
[58] I.I. Karayalcin, The analytic hierarchy process: Planning, priority setting, resource allocation, Eur. J. Oper. Res. 9 (1982) 97–98. https://doi.org/10.1016/0377-2217(82)90022-4.
[59] T.L. Saaty, How to make a decision: The analytic hierarchy process, Eur. J. Oper. Res. 48 (1990) 9–26. https://doi.org/10.1016/0377-2217(90)90057-I.
[60] Global Innovation Index Report, 2019. https://www.wipo.int/publications/en/series/index.jsp?id=129.

Acta Innovations 2021 no. 41: 42-55 42
https://doi.org/10.32933/ActaInnovations.41.4 ISSN 2300-5599 2021 RIC Pro-Akademia – CC BY
PHYSIO-MECHANICAL & WEAR PERFORMANCE OF BANANA FIBER/WALNUT POWDER BASED EPOXY COMPOSITES
Surya P Gairola*
Department of Mechanical Engineering, DIT University Dehradun Uttarakhand, India, [email protected]
https://orcid.org/0000-0001-7135-4269
Yogesh Tyagi
Department of Mechanical Engineering, DIT University Dehradun, Uttarakhand, India
https://orcid.org/0000-0001-7700-6425
Brijesh Gangil
Department of Mechanical Engineering, H.N.B.Garhwal University Srinagar- Garhwal, India
https://orcid.org/0000-0002-5849-5881
Kanishk Jha
Department of Mechanical Engineering, Lovely Professional University Punjab, India
https://orcid.org/0000-0002-1183-7987
Article history: Received 24 August 2021, Received in revised form 28 September 2021, Accepted 15 October 2021, Available online 16 October 2021 Abstract The present environmental condition indicates the immediate need for sustainable materials containing mainly natural elements for composite fabrication. Encouragement of natural fibers in composite materials can significantly reduce the greenhouse effect and the high cost of manufacturing synthetic fiber-based polymer composites. Hence, this study aimed to investigate the physio-mechanical properties of banana fiber (BF) fiber -based epoxy (EP) composites filled with walnut shell powder (WNP). Fabrication was carried out by mixing and cold pressing with fixed BF proportion and varying percentages of WNP (0%, 5%, 10%, 15 wt. %). The results obtained in the study suggest the mechanical properties of the BF/EP composite were enhanced with the addition of WNP as a filler. This is because the WNP filler occupies the spaces in the composite, which bridge the gaps between the banana fibers and the epoxy matrix; also, the inclusion of walnut powder in the BF/EP composites greatly enhanced their wear resistance. The microstructural properties of the composites were examined by scanning electron microscopy (SEM). Keywords banana fibers; epoxy composites; walnut powder; mechanical properties; wear properties. Introduction In recognition of the growing concern over carbon emission and plastic waste, natural fibers in biopolymer matrices are gaining interest in the composite domain. Naturally occurring fibers have many advantages, including easy availability, biodegradability, low cost and good strength [1]. It is reported that natural fibers with polymer composites improve the mechanical properties more than the synthetic fiber-filled polymer composite but also the sustainability issue encouraged the researchers to expand their research on the use of natural fibers like BF, in the field of composite materials [2,3]. In addition to natural fibers, natural particulate fillers are also often used as reinforcement material to provide sufficient impact strength to the matrix materials [4–6]. To take advantage of two natural fibers materials (banana and coconut), hybrid composites (two fibers) are now being manufactured on a large scale [7]. The loading percentage of various fibers in the matrix may vary and depend on the fabrication process. The increase in banana fibers (BF) up to 30 wt.% with PP (polypropylene) enhances the mechanical properties [8,9]. Significant improvements in the mechanical strength were also obtained for BF
Acta Innovations 2021 no. 41: 42-55 43
https://doi.org/10.32933/ActaInnovations.41.4 ISSN 2300-5599 2021 RIC Pro-Akademia – CC BY
and polylactic acid (PLA) composites at 40 wt.% of reinforcement [10]. Hybrid epoxy composites with jute and BF reinforcement at 50 wt.% exhibited better mechanical properties than the virgin epoxy [11]. Similar observations were reported by Venkateshwara et al. [12] in which they used 50% sisal fiber and 50% banana/epoxy composite in different percentages. The peroxide and permanganate-treated BF had higher properties than the untreated BF/EP composites [13]. The effect of variation of banana fiber length on the mechanical properties are studied and results showed that 10 mm fiber length and 15 wt.% fiber loading display the utmost magnitude of the tensile, hardness, flexural, and Impact strength [14,15]. The arrangement of the reinforcement in a plain-woven oriented hybrid composite of banana /kenaf fibers had higher strength than that of randomly twill oriented banana/Kenaf fiber [16]. Studies suggested that when only BF and EP are taken at 50/50 volume fraction, the product can sustain more load compared to other proportions. However, as we mentioned earlier, the mechanical strength of the fabricated composite depends not only on the volume fraction of fiber but also on the sample thickness and fiber weaving pattern. When BF was taken with polyester resin in different volume fractions 5%, 10%, 15%, 17.5%, and 20%, by different thicknesses of the composite (3mm and 5 mm). The results revealed that the 5 mm thickness has the optimum tensile, flexural, and impact strength value. Besides, plain woven fiber has always been stronger than randomly oriented fibers. By adding filler particles, the proportion of fiber content can be reduced, and the desired properties can be obtained. Because of this, most researchers have achieved their best results with 30wt% BF loading with epoxy composites filled with a particulate filler [17–19]. Hybrid polymer composites containing BF have also been characterized for wear performance. A jute-banana-epoxy composite, for instance, showed better wear performance than virgin epoxy [20]. Research has also been carried out on BF reinforced polyester resin for structural applications and it was found that BF with polyester resin exhibited improved strength than other natural fibers that can be employed for structural use. The BF composite properties have also been analyzed for load and length and it was shown that 30 mm fiber length gave the optimum mechanical and structural strength at 40 % BF loading. The study of the water absorption by BF composites reveals that the high-water absorption ability of BF results in lower mechanical properties [21,22]. The addition of natural fiber waste results in the enhancement of mechanical properties [23]. It is suggested that walnut shell powder (WNP), usually obtained in the form of waste materials, because of its unique physical and chemical properties has a huge potential to bring a substantial improvement to the properties of polymer composites. WNP, coconut shell, and rice husk have been added to prepare hybrid composites. The results have shown that hybridization remarkably improved the mechanical properties compared to single filler composites of one of the above three fillers [24]. In his investigation, Emel Kuram [25] used Powdered hazelnut and walnut shells as natural filler with ABS to develop hybrid polymer composites. With a single natural filler, the walnut shell flour was found to be usable for enhancing strengths (tensile, flexural and impact) and modulus. Similarly, the mechanical and tribological properties of the Walnut Shell Powder - Polypropylene natural composite have been investigated by Moustafa, N. M et.al. [26] and found out that by increasing the walnut shell powder content by 20% wt, the ultimate tensile and bending stresses are reduced by 19.5 percent, and the modulus of elasticity is reduced by 7.7%. P.Dhiman used natural jute, basalt fibre, and walnut shell to create the hybrid polymer composites. Composites with and without walnut shell filler were compared in terms of various characteristics and concluded that composites filled with walnut shell filler demonstrated better mechanical properties [27]. HDPE (High - Density Polyethylene) based composites filled with WNP and reinforced with bast fibers were investigated for their mechanical and wear properties, it was reported that the maximum strength was obtained at 40 wt. % of WNP in HDPE in the composite [28]. The effect of WNP on the physical - mechanical properties of polypropylene composites and MAPP (maleic anhydride grafted polypropylene) matrix composites have reported an increase in the mechanical properties [29]. Chemical treatment of natural fibers escalates the compatibility of fiber and matrix [13] by reducing the moisture absorption capability. The inclusion of natural filler in a conventional composite can boost the strength at a relatively low cost of composite. Alkali treated walnut shell powder is considered a helpful reinforcement material in epoxy matrix based composite by Singh, A. K. et al. [30]. He investigated that the properties of treated composites like tensile, compressive, and flexural strength increase up to 15% by weight and then start to decrease. The present work describes the physico - mechanical characterization of alkali-treated BF /WNP / EP composites. The composites were fabricated via mixing and cold pressing with varying weight percentages of WNP (0, 5, 10, and 15 wt. %), while the BF content was kept constant at 30 wt.%. The BF contents are kept constant to take advantage of the WNP filler in the composite, and the BF percentage is determined from previous literature reviews [9,19,31].

Acta Innovations 2021 no. 41: 42-55 44
https://doi.org/10.32933/ActaInnovations.41.4 ISSN 2300-5599 2021 RIC Pro-Akademia – CC BY
Methods Material: Matrix Epoxy resin of grade LY-556 (Density 1.15 - 1.20 g/cm3) with hardener HY- 951 was procured from Seema Corp., India. Hy-951 is an unfilled epoxy casting resin system hardener, having low viscosity with additional high filler possibility and can cure epoxy at room temperature. Fiber Surface Treatment The BF mats were treated to remove hydroxyl groups from the surface of the fibers with a 5 % alkali solution (NaOH) and enhance the fiber’s adhesiveness with matrix. Obviously, hydroxyl groups are very sensitive to many reagents and increase the solubility of organic compounds in water. The fibers were dipped in the NaOH solution for 8 hours and then washed thoroughly with water. After washing, the fibers were dried in sunlight for 24 hours. SEM images of the Banana Fiber (BF) samples, treated BF and WNP are shown in Figure 1 (a, b, and c), respectively.
Figure 1. (a) SEM image of the banana fibers (b) Pictorial view of the NaOH treated banana fibers (c) pictorial view of the
walnut powder.
Composite fabrication The fabrication process adopted in the present investigation is shown schematically in Figure 2. A metallic mold with a 300 x 300 x 4 mm3 cavity was prepared and the surface plates were machined to smoothen their surfaces. WNP and EP were mixed in a beaker and stirred by a mechanical stirrer for 15 minutes to homogenize the mixture. The treated, randomly oriented banana fiber mat was placed over the mylar sheet placed in the mold.
Figure 2. Fabrication process.
A mixture of EP and WNP was poured over a non-woven BF mat of thickness 2 mm. A second mylar sheet was placed to avoid sticking the composite to the molding plate. The composition was then pressed at a normal load of 147N and left to cure for 24 hours.

Acta Innovations 2021 no. 41: 42-55 45
https://doi.org/10.32933/ActaInnovations.41.4 ISSN 2300-5599 2021 RIC Pro-Akademia – CC BY
Table 1. Designation and detailed composition.
Designation
Composition (wt. %)
Epoxy resin (With Hardener)
Banana fiber Walnut powder
BW1 70 30 0
BW2 65 30 5
BW3 60 30 10
BW4 55 30 15
Here BW1, BW2, BW3, and BW4 represent the compositions of the samples of BF at 30 wt. % and four wt.% of Wall-nut powder and epoxy
Characterization of the composite Physical characterization. The expression for the theoretical density (ρth) of composite material in terms of the weight fractions of the different constituents was that described by Agarwal and Broutman [32], as shown in equation 1 where ρe ρb ρwn are the densities of EP, BF, and WNP, while W represents the weight fraction of the same. The experimental densities (ρexh) of the composite have been determined by the Archimedes principle. The void fraction content (Vc) in the composites was calculated by using equation 2.
(1)
𝜌𝑡ℎ = 1
𝑊𝑒𝜌𝑒
+𝑊𝑏𝜌𝑏
+𝑊𝑤𝑛𝜌𝑤𝑛
(2)
Vc = (𝜌th - 𝜌𝐸𝑥𝑝) × 100/ (𝜌th)
Water absorption percentage was measured by the difference of weight before and after immersion of the specimen for 10 days and then divided by the dry weight. Mechanical characterization. The test for hardness was carried out on a VICKERS Cum BRINELL (BV 50) Testing Machine supplied by Rockwell Testing Aids, New Delhi. Specimens of dog bone shape were cut from 4 mm thick molded sheets for the tests. The flexural strength was determined by a 3-point bending method according to the ASTM D-790 standard. Wear Characterization. A pin on the disc machine (DUCOM Instrument Pvt. Ltd, India) was used to determine the wear properties of the composites as per ASTM 99 [32]. The specific wear rate (SWR) was calculated relative to variations of the following factors; fiber content, sliding distance, sliding velocity, and normal load. The experiment disk was hardened, ground steel, whose hardness was 72 HRC and roughness 0.6µRa.The specific wear rate (SWR) was calculated by
(3)
SWR =𝛥𝑤
𝜌𝐷𝑓𝑛
Where SWR is the specific wear rate, 𝛥w (grams) is the total weight loss, ρ(g/cm3) is the density, D(meters) is the sliding distance and fn (Newton) is the normal load. The control factors, as stated in Table 2, were studied in four levels. The level of control and selected control factor are shown in Table 2. As per the goal of the experiment. S/N ratio was calculated from the different 16 level results. As minimum wear is required, a lower S/N as better was taken and computed by equation 4 [28].

Acta Innovations 2021 no. 41: 42-55 46
https://doi.org/10.32933/ActaInnovations.41.4 ISSN 2300-5599 2021 RIC Pro-Akademia – CC BY
(4)
𝑆/𝑁 𝑟𝑎𝑡𝑖 = −10 𝑥𝑙𝑜𝑔1
16∑ OD2
where S/N is signal to noise ratio, 16 = observation count, and OD = observed data. The calculation of the S/N ratio is given in eq. 4. In a response table, the ranks assist you rapidly understand which factors have the greatest impact. The factor with the biggest delta value is ranked first, followed by the factor with the second largest delta, and so on [33].
Table 2. Control factors and their levels, as used in the experiments.
Control factor Description Level I Level II Level III Level IV
1 WNP content (wt.%) 0 5 10 15
2 Sliding velocity (m/s) 1.5 2.5 3.5 4.5
3 Normal load (N) 15 20 25 30
4 Sliding distance (m) 800 1300 1800 2300
Results and Discussion Effect of WNP filler loading on the void fraction of the composites Table 3 shows the effect of WNP loading on the density and void fraction of the composites. The results indicated that increasing the walnut loading decreased both the theoretical and experimental density. The experimental density decreased from 0.95 kg/m3 to 0.814 kg/m3 while the theoretical density decreased from 0.902 kg/m3 to 0.742 kg/m3, which increases the void fraction based on the amplified difference in the experiment and theoretical density. The formation of void content might be due to the structure discontinuities created by increasing the filler loading. WNP has the lower density compared to epoxy resin and banana fiber and an increased percentage in the composition. The manufacturing and curing process disturbs the void fraction effectively.The void fraction has a significant impact on the mechanical properties, as shown in table 3.
Table 3. Effect of walnut shell loading on the void fraction on of the composites.
Effect of WNP filler loading on tensile strength and modulus of the composites The effect of WNP content on the tensile strength of the banana fiber reinforced epoxy composite is shown in Figure 3. The increase in the WNP addition leads to enhancement of the tensile strength as well as the modulus of the composites. The peak tensile strength is reported to be 76.7 MPa at 15 wt. % WNP loading. At 0 wt. % filler loading, the tensile strength was 65.6 MPa which increased to 69.4 MPa at 5 % filler addition. The tensile strength further increased at 10 wt. % filler loading to be 74.1 MPa. The highest tensile modulus achieved is about 3.4 GPa at 15wt% of WNP loading. At 0wt% of WNP, the tensile modulus was 2.4 GPa which increased by 16% for 5 wt.% of WNP loading to 2.9 GPa. It was further increased by 13.3% at 10 wt.% walnut loading to 3.3 GPa.
Designation Theoretical Density (ρth) kg/m3
Experimental Density (ρexp) kg/m3
Void Fraction (%)
BW1 0.950 0.902 4.8
BW2 0.899 0.849 5.5
BW3 0.854 0.801 6.2
BW4 0.814 0.742 8.8

Acta Innovations 2021 no. 41: 42-55 47
https://doi.org/10.32933/ActaInnovations.41.4 ISSN 2300-5599 2021 RIC Pro-Akademia – CC BY
Figure 3. Effect of WNP filler Loading on tensile strength and modulus of the Composites.
An effective stress transfer due to the bonding of the WNP with the EP matrix we suggest is the reason for the improvement of the tensile strength. The WNP filler occupies the spaces in the composite which bridge the gaps between the banana fibers and the epoxy matrix. Initially, WNP is bound with BF (up to 10 wt. % of WNP as per our experiment) so it is increasing the tensile strength and after that, it crosses its optimum wt. % so it will not help to increase the tensile strength [34]. This shows that, with a growing content of walnut shell particles, there was an increase in the tensile strength and tensile modulus and peak value of tensile strength and modulus for 15 percent of walnut particles. This was attributed to the increased percentage of WNP increasing the adhesion and interfacial contact, which will increase the modulus and tensile strength up to optimum wt. % of WNP, after that it will reduce the adhesion and interfacial contact. The increase in the tensile modulus (Because of the increase in adhesion and interfacial bonding) with walnut filler is another reason for the improvement in the tensile strength.
Effect of WNP filler loading on the flexural strength and flexural modulus of the composites BF reinforced composite flexural strength was observed to be 38.1 MPA and it increased with increasing WNP addition (Figure 4). At 5 wt.% of WNP loading, the flexural strength increased by 5.8 % to 40.2 MPa. The flexural strength further increased to 41.8 MPa with 10 wt.% WNP filler addition and was found to be maximum (43.2 MPa) at 15 wt. % loading, as in Figure 4. The WNP filler in the BF/EP composite imparted rigidity which enhanced the composite stiffness and resulted in improved flexural strength. It is possible that the increased flexural strength can be attributed to the addition of WN filler, which creates a more uniform mixture. A similar result was obtained by Rahman et al., and they bring that the weight percentage of fiber and filler material (both BF and any suitable natural filler material) is very important in determining the properties of composites [35]. The flexural modulus of our composites also increased with increased WNP addition. The maximum modulus was 2.5 GPa at 15 wt. % WNP loading. At 0 wt. % filler loading, the flexural modulus was 1.7 GPa which increased to 2.1 GPa at 5 % filler addition. The flexural modulus further increased at 10 wt. % filler loading, to 2.4GPa.

Acta Innovations 2021 no. 41: 42-55 48
https://doi.org/10.32933/ActaInnovations.41.4 ISSN 2300-5599 2021 RIC Pro-Akademia – CC BY
Figure 4. Effect of WNP loading on the flexural strength and modulus of the composites.
Effect of WNP filler loading on the impact energy of the composites The effect of WNP filler loading on the impact energy of the BF/EP composite is shown in Figure 5. A similar trend was observed for the impact energy as for the tensile and flexural strengths shown in Figures 3 and 4, but much larger increases. Figure 5 indicates that the WNP filler loading in the BF/EP composites greatly improved the impact energy. The maximum impact energy was observed at 15 wt. % WNP loading and the minimum at 0 wt. % WNP loading, the impact energy for wt. 15% WNP loading increased by 25% compared to 10wt% loading. TheWNP filler addition thus, improving both the stiffness and strength and thus resulted in higher load-carrying capacity. The percentage increase in impact strength was higher at lower filler loading i.e., loading from 0 to 5wt%, but it gradually decreased as the WNP filler percentage in the composite increased. This suggested that adding WNP wt. % in the BF/EP composites at higher loadings may lead either to only a small change in the impact energy but had a more significant effect than on the TS and FS.
Figure 5. Effect of WN filler Loading on the Impact energy of the Composites.

Acta Innovations 2021 no. 41: 42-55 49
https://doi.org/10.32933/ActaInnovations.41.4 ISSN 2300-5599 2021 RIC Pro-Akademia – CC BY
Effect of WNP filler loading on the hardness of the composites The effect of WNP filler loading on the hardness of the BF/EP composites in Figure 6. The hardness is defined as the resistance to indentation and as the WNP filler loading increased in the composites, the hardness of the composite slightly increased. The light dense particles of the WNP filler, which gathered at the surfaces upon cooling, made the surface hard compared to BF/EP composite. When more WNP filler was added to the composite, more filler accumulated at the surfaces causing the hardness to be slightly enhanced. The highest hardness was obtained at 15 wt. % WNP filler, 50.7 Hv, and the lowest was observed for 0 wt. % WNP filler, 42.8 Hv.
Figure 6. Effect of WNP filler loading on the hardness of the composites.
Taguchi analysis of the wear of the WNP filler loaded BF/ EP composites The Taguchi method was used for the wear test. The four composite’s specific wear rates for all 16 test runs and their corresponding S/N ratio are given in Table 4. The maximum specific wear rate was found to be a value of 9.93x10⁻⁸mm3/Nm for the BW1 composite at 3.5 m/s velocities, 30 N load, and 1800 m distance. The minimum specific wear rate was observed as 3.25x10⁻⁸mm3/Nm for 5wt. % of walnut powder (BW2) at 1.5 m/s sliding velocities, 20 N load, and 1300 m distance. Similar findings were also shown by Kumar S. et al. [36] for specific wear rates for a similar sample. Table 4 also shows that all samples S/N ratios were between 140.061 and 149.762 dB (Decibels). The database effect of the SN ratio, which is shown in Table 4 is plotted in Figure 7. In Table 6 the most critical control factor was the sliding velocity followed by the fiber content, while the normal load showed the least effect on the specific wear rate. From Response Table 5, the best composition of control parameter that would produce the minimum wear was fiber content at level – II (5wt%) and sliding velocity at the level I (1.5 m/s), normal load at level II (15N),and sliding distance at level I (1800 m). The observations also revealed that increasing the WNP content from 5 wt. % to 10 wt. % increased the S/N ratio but a WNP loading of 15 wt. % decreased the S/N ratio which indicated a high specific wear rate. Table 5 shows the composite response table for the S/N ratio. The delta value was calculated by subtracting the maximum and minimum S/N ratio values, and the control factor was ranked using the delta value. The greatest delta value indicates a stronger influence on the specific sliding wear rate. The wear rate on the sliding condition was shown to decrease with increases in WNP content up to 10% but increased after that. This could be because filler particles function as a barrier between the rotating disc and the composite material, preventing wear. It can also be seen in Figure 7 about normal load, it can be concluded that the load increasing, initially decreases the rate of wear, because of a fixed amount of banana fiber in the new sample of WNP particulates.

Acta Innovations 2021 no. 41: 42-55 50
https://doi.org/10.32933/ActaInnovations.41.4 ISSN 2300-5599 2021 RIC Pro-Akademia – CC BY
Table 4. Experimental design for the wear using L16 orthogonal array.
SL. No Sliding velocity (m/s)
Walnut content (wt.%)
Normal load (Newton)
Sliding distance (m)
Specific wear rate (mm3/Nm)
S/N ratio (db)
1 1.5 0 15 800 6.21E-08 144.138
2 1.5 5 20 1300 3.25E-08 149.762
3 1.5 10 25 1800 4.29E-08 147.351
4 1.5 15 30 2300 5.74E-08 144.822
5 2.5 0 20 1800 7.41E-08 142.604
6 2.5 5 15 2300 6.35E-08 143.945
7 2.5 10 30 800 3.44E-08 149.269
8 2.5 15 25 1300 9.31E-08 140.621
9 3.5 0 25 2300 6.11E-08 144.279
10 3.5 5 30 1800 9.93E-08 140.061
11 3.5 10 15 1300 7.51E-08 142.487
12 3.5 15 20 800 6.75E-08 143.414
13 4.5 0 30 1300 5.73E-08 144.837
14 4.5 5 25 800 4.04E-08 147.872
15 4.5 10 20 2300 3.85E-08 148.291
16 4.5 15 15 1800 7.29E-08 142.745
Actually, there were two general regions of variation of wear against sliding velocity. The first occurred in the high-velocity region and the second in the low-velocity region. In the low-velocity region, the specific rate of wear is inversely proportional to the sliding velocity but in the high-velocity region, but increases with increasing velocity for solid/solid content but decreases for solid /liquid form content [37]. From Figure 7. However, while increasing the load, normal load initially reduces the wear rate because of the availability of a fixed amount of banana fiber and WNP particulates. However, once the ideal circumstances are achieved, the wear rate increases as the load increases due to an increase in contact pressure.
Figure 7. Effect of control factors on the specific wear rate of the composites.

Acta Innovations 2021 no. 41: 42-55 51
https://doi.org/10.32933/ActaInnovations.41.4 ISSN 2300-5599 2021 RIC Pro-Akademia – CC BY
Table 5. Response Table for Signal to Noise Ratio Smaller is Better.
Control Factors (All are in S/N ratio)
Level Sliding velocity
Normal load Walnut content
Sliding distance
1 146.5 144.0 143.3 146.2
2 144.1 145.4 146.0 144.4
3 142.6 146.8 145.0 143.2
4 145.9 142.9 144.7 145.3
Delta 4.0 3.9 2.7 3.0
Rank 1 2 4 3
Analysis of variance ANOVA is a well-grounded tool for the evaluation of experimental wear tests [37]. The result of the application ANOVA for the wear performance of our WNP/BF/EP composite is shown in Table 6. The sliding velocity and fiber content were the more influencing parameters on the composite wear, where the sliding distance and normal load had a lesser effect. The P-value of the sliding velocity was 0.319 for the BF/WNP /EP composite, which indicates that there was a negative effect of sliding velocity on the specific wear rate for the f composite reinforced fiber.
Table 6. ANOVA for S/N ratio BF/WNP.
Analysis of Variance for S/N ratio Banana fiber/WNP/EP composites, using the Adj SS for the Tests
Source DF Seq SS Adj SS Adj MS F P P.C %
Sliding velocity (m/s) 3 38.941 38.941 12.980 1.81 0.319 29.86
Walnut content (wt.%) 3 35.508 35.508 11.836 1.65 0.346 27.22
Normal load (Newton) 3 14.807 14.807 4.936 0.69 0.617 11.35
Sliding distance (m) 3 19.602 19.602 6.534 0.91 0.530 15.03
Error 3 15 21.544 7.181 16.52
Total 15 130.402
DF - Degree of freedom, Seq SS - Sequential sum of squares, Adj SS - Adjacent sum of squares, Adj MS - Adjacent sum of mean squares, F – Variance, P - Test statistics, P.C- Percentage Contribution
Scanning Electron Microscopy (SEM) analysis Micrographs of Scanning electrons were taken to analyze the post sliding wear effect on the samples, as in Figure 8 (a - f). Along the plane of crack propagation, the micrograph of a fractured surface exhibits signs of fibre fracture, fibre pullout, matrix cracking, and fiber-matrix debonding, Figure 8 (a-b). The presence of more ends and alignment in the fiber generally bears the applied load and transfers it to the other end of the composite via matrix, thus improving the composite's wear properties [38]. Sliding wear causes abrasion, adhesion, and surface fatigue. Moreover, debris (Not in all) formation and flattening of surfaces may also be caused during sliding wear operation, Figure 8 (c). The sliding wear rate is more dependent on hardness than sliding velocity, normal load, sliding distance, and walnut content since higher hardness leads to a lesser wear rate. Moreover, the WNP is less dense thus it accumulated at both surfaces of the composite, which leads to more interaction of WNP with the sliding surfaces than of the BF or EP. For this reason, the WNP played an essential role in reducing the wear of the banana fiber reinforced polymer composite, as evident from Figure 8 (c and d). SEM observation also revealed that the formation of wear debris and potholes during sliding wear existed at the samples' surfaces containing WNP, at higher load and velocity. Abrasive wear accompanied with surface fatigue was also observed at the specimens surface, but abrasive wear remained more dominant, as shown in Figure. 8 (e and f). Figure 8 (d) shows higher void formation, which was at 15 wt. % WNP loading, followed by 10 wt. % WNP as in Figure 8 (e). An increase in the void fraction also affects the composite's overall properties, as shown in Figure. 8 (e, f). Moreover, WNP has a higher tenacity than BF, due to which the composite surface becomes harder with
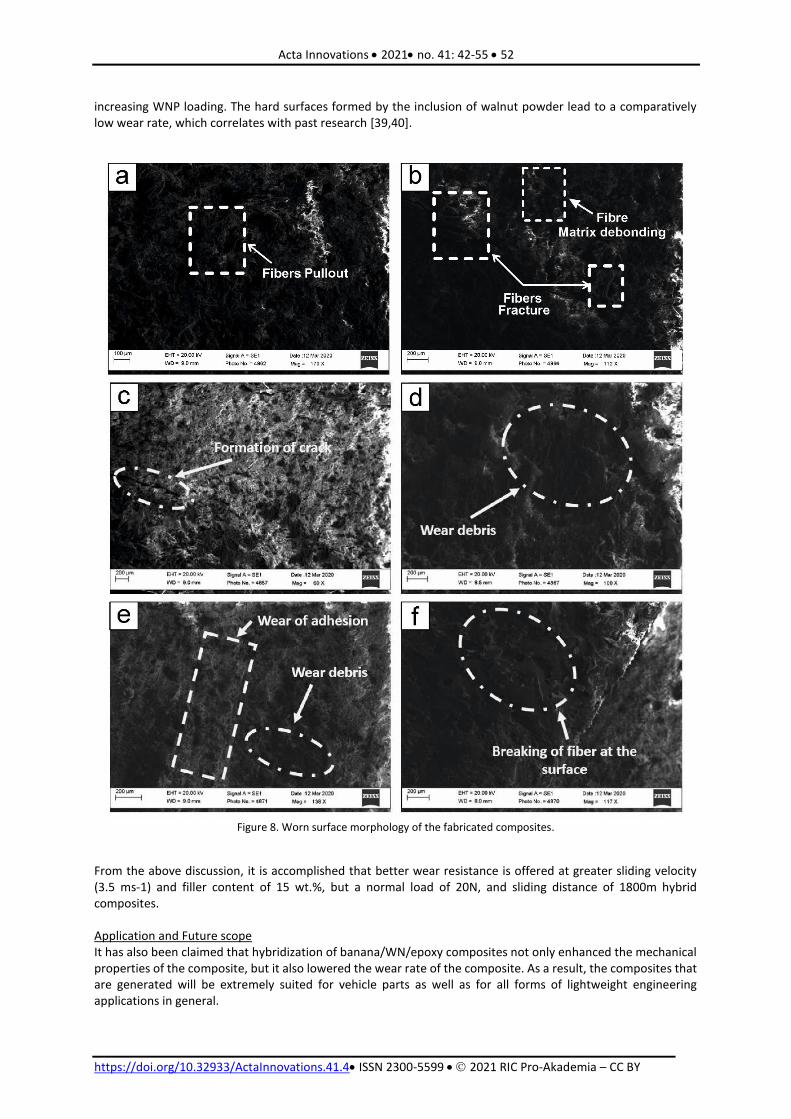
Acta Innovations 2021 no. 41: 42-55 52
https://doi.org/10.32933/ActaInnovations.41.4 ISSN 2300-5599 2021 RIC Pro-Akademia – CC BY
increasing WNP loading. The hard surfaces formed by the inclusion of walnut powder lead to a comparatively low wear rate, which correlates with past research [39,40].
Figure 8. Worn surface morphology of the fabricated composites.
From the above discussion, it is accomplished that better wear resistance is offered at greater sliding velocity (3.5 ms-1) and filler content of 15 wt.%, but a normal load of 20N, and sliding distance of 1800m hybrid composites. Application and Future scope It has also been claimed that hybridization of banana/WN/epoxy composites not only enhanced the mechanical properties of the composite, but it also lowered the wear rate of the composite. As a result, the composites that are generated will be extremely suited for vehicle parts as well as for all forms of lightweight engineering applications in general.

Acta Innovations 2021 no. 41: 42-55 53
https://doi.org/10.32933/ActaInnovations.41.4 ISSN 2300-5599 2021 RIC Pro-Akademia – CC BY
Impact The current investigation is focused on the study of physio-mechanical properties of banana fiber (BF), fiber-based epoxy (EP) composites filled with walnut shell powder (WNP). The experimental results revealed a positive result of using the selected material in the composite. The addition of walnut powder in the BF/EP composites enhances the wear resistance. The major impact of the present investigation is the environmental benefit as the sustainable materials containing mainly natural entities for composite fabrication reduces the greenhouse effect and are biodegradable. This will encourage the use of natural fibers in composite materials, bringing down the high cost of manufacturing synthetic fiber-based polymer composites. Conclusions Green composites made from non-woven banana fiber/WNP/EP composites were successfully manufactured utilizing the hand lay-up method. Analysis of green composites can lead to the following conclusion.
The inclusion of Walnut powder contents led to a decrease in density, increases in void although led to enhance tensile, hardness, impact, and flexural strength.
According to the Taguchi method's response table, the control factors that influenced wear performance were sliding velocity> fibre content > sliding distance > Normal load. The combination that provided the lowest wear rate was 5wt% walnut powder (BW2) at 1.5 m/s sliding velocities, under load of 20 N at a distance of 1300 m.
The worn surface micrographs of banana / WN / epoxy composites have shown the related wear mechanisms which were liable for the wear as experimentally found.
Conflicts of interest There are no conflicts to declare. Acknowledgments This research has not been supported by any external funding. References [1] M. Idicula, N.R. Neelakantan, Z. Oommen, K. Joseph, S. Thomas, A study of the mechanical properties
of randomly oriented short banana and sisal hybrid fiber reinforced polyester composites, J. Appl. Polym. Sci. 96 (2005) 1699–1709. https://doi.org/10.1002/app.21636.
[2] S. Raghavendra, P.B. Shetty, P.G. Mukunda, Mechanical Properties of Short Banana Fiber Reinforced Natural Rubber Composites, Int. J. Innov. Res. Sci. Eng. Technol. 2 (2013) 1652–1655.
[3] M.M. Ibrahim, A. Dufresne, W.K. El-Zawawy, F.A. Agblevor, Banana fibers and microfibrils as lignocellulosic reinforcements in polymer composites, Carbohydr. Polym. 81 (2010) 811–819. https://doi.org/10.1016/j.carbpol.2010.03.057.
[4] R. Bhoopathi, M. Ramesh, C. Deepa, Fabrication and property evaluation of banana-hemp-glass fiber reinforced composites, in: Procedia Eng., 2014: pp. 2032–2041. https://doi.org/10.1016/j.proeng.2014.12.446.
[5] K.N. Indira, P. Jyotishkumar, S. Thomas, Thermal stability and degradation of banana fibre/PF composites fabricated by RTM, Fibers Polym. 13 (2012) 1319–1325. https://doi.org/10.1007/s12221-012-1319-x.
[6] R. Kumar, G. Chandan, R. Ramamoorthi, Fabrication and testing of natural fiber hybrid composites, Int. J. Eng. Res. 5 (2016) 285–288.
[7] K. Bilba, M.A. Arsene, A. Ouensanga, Study of banana and coconut fibers. Botanical composition, thermal degradation and textural observations, Bioresour. Technol. 98 (2007) 58–68. https://doi.org/10.1016/j.biortech.2005.11.030.
[8] S. Shahinur, M. Hasan, Jute/Coir/Banana Fiber Reinforced Bio-Composites: Critical Review of Design, Fabrication, Properties and Applications, in: Encycl. Renew. Sustain. Mater., Elsevier, 2020: pp. 751–756. https://doi.org/10.1016/b978-0-12-803581-8.10987-7.
[9] S.K. Samal, S. Mohanty, S.K. Nayak, Banana/glass fiber-reinforced polypropylene hybrid composites: Fabrication and performance evaluation, Polym. - Plast. Technol. Eng. 48 (2009) 397–414. https://doi.org/10.1080/03602550902725407.
[10] Y.F. Shih, C.C. Huang, Polylactic acid (PLA)/banana fiber (BF) biodegradable green composites, J. Polym. Res. 18 (2011) 2335–2340. https://doi.org/10.1007/s10965-011-9646-y.
[11] M. Boopalan, M. Niranjanaa, M.J. Umapathy, Study on the mechanical properties and thermal properties of jute and banana fiber reinforced epoxy hybrid composites, Compos. Part B Eng. 51 (2013)

Acta Innovations 2021 no. 41: 42-55 54
https://doi.org/10.32933/ActaInnovations.41.4 ISSN 2300-5599 2021 RIC Pro-Akademia – CC BY
54–57. https://doi.org/10.1016/j.compositesb.2013.02.033. [12] N. Venkateshwaran, A. ElayaPerumal, A. Alavudeen, M. Thiruchitrambalam, Mechanical and water
absorption behaviour of banana/sisal reinforced hybrid composites, Mater. Des. 32 (2011) 4017–4021. https://doi.org/10.1016/j.matdes.2011.03.002.
[13] W. Jordan, P. Chester, Improving the Properties of Banana Fiber Reinforced Polymeric Composites by Treating the Fibers, in: Procedia Eng., 2017: pp. 283–289. https://doi.org/10.1016/j.proeng.2017.07.040.
[14] R. Karthick, K. Adithya, C. Hariharaprasath, V. Abhishek, Evaluation of mechanical behavior of banana fibre reinforced hybrid epoxy composites, in: Mater. Today Proc., 2018: pp. 12814–12820. https://doi.org/10.1016/j.matpr.2018.02.265.
[15] S.M. Sapuan, A. Leenie, M. Harimi, Y.K. Beng, Mechanical properties of woven banana fibre reinforced epoxy composites, Mater. Des. 27 (2006) 689–693. https://doi.org/10.1016/j.matdes.2004.12.016.
[16] A. Alavudeen, N. Rajini, S. Karthikeyan, M. Thiruchitrambalam, N. Venkateshwaren, Mechanical properties of banana/kenaf fiber-reinforced hybrid polyester composites: Effect of woven fabric and random orientation, Mater. Des. 66 (2015) 246–257. https://doi.org/10.1016/j.matdes.2014.10.067.
[17] M. Ramesh, T. Sri Ananda Atreya, U.S. Aswin, H. Eashwar, C. Deepa, Processing and mechanical property evaluation of banana fiber reinforced polymer composites, in: Procedia Eng., 2014: pp. 563–572. https://doi.org/10.1016/j.proeng.2014.12.284.
[18] S. Dhakal, B.S. Keerthi Gowda, An Experimental Study on Mechanical properties of Banana Polyester Composite, in: Mater. Today Proc., 2017: pp. 7592–7598. https://doi.org/10.1016/j.matpr.2017.07.092.
[19] N. Amir, K.A.Z. Abidin, F.B.M. Shiri, Effects of Fibre Configuration on Mechanical Properties of Banana Fibre/PP/MAPP Natural Fibre Reinforced Polymer Composite, in: Procedia Eng., 2017: pp. 573–580. https://doi.org/10.1016/j.proeng.2017.04.140.
[20] P. Deepak, H. Sivaraman, R. Vimal, S. Badrinarayanan, R. Vignesh Kumar, Study of Wear Properties of Jute/Banana Fibres Reinforced Molybdenum disulphide Modified Epoxy Composites, in: Mater. Today Proc., 2017: pp. 2910–2919. https://doi.org/10.1016/j.matpr.2017.02.172.
[21] P.A. Sreekumar, F. Albert, G. Unnikrishnan, K. Joseph, S. Thomas, Mechanical and water sorption studies of ecofriendly banana fiber-reinforced polyester composites fabricated by RTM, J. Appl. Polym. Sci. 109 (2008) 1547–1555. https://doi.org/10.1002/app.28155.
[22] M.Z.H. Khan, M.A.R. Sarkar, F. Ibne, A. Imam, R.O. Malinen, ISSN 2277-7156 Original Article Fiber morphology and Pulping study of Banana Pseudo-stem, Int. J. Fiber Text. Res. 3 (2013) 31–35.
[23] A.R. Dayal, A. Gaikwad, A.S. Pawar, Development of a new bio composite material by utilizing walnut shell powder, coir and jute fiber and evaluation of its mechanical properties, Int. J. Mech. Prod. Eng. Res. Dev. 8 (2018) 819–826. https://doi.org/10.24247/ijmperdapr201893.
[24] D. Chandramohan, A.J. Presin Kumar, Experimental data on the properties of natural fiber particle reinforced polymer composite material, Data Br. 13 (2017) 460–468. https://doi.org/10.1016/j.dib.2017.06.020.
[25] E. Kuram, Rheological, mechanical and morphological properties of hybrid hazelnut (Corylus avellana L.)/walnut (Juglans regia L.) shell flour-filled acrylonitrile butadiene styrene composite, J. Mater. Cycles Waste Manag. 22 (2020) 2107–2117. https://doi.org/10.1007/s10163-020-01094-3.
[26] N.M. Moustafa, K.A. Mohammed, E.S. Al-Ameen, A.A.F. Ogaili, M.N.M. Al-Sabbagh, Mechanical and tribological properties of walnut/polypropylene natural composites, J. Mech. Eng. Res. Dev. 43 (2020) 372–380.
[27] P. Dhiman, H. Sharma, Effect of walnut shell filler on mechanical properties of jute-basalt hybrid epoxy composites, in: Mater. Today Proc., 2020: pp. 4537–4541. https://doi.org/10.1016/j.matpr.2020.10.811.
[28] Q. Zhang, Y. Li, H. Cai, X. Lin, W. Yi, J. Zhang, Properties comparison of high density polyethylene composites filled with three kinds of shell fibers, Results Phys. 12 (2019) 1542–1546. https://doi.org/10.1016/j.rinp.2018.09.054.
[29] N. Ayrilmis, A. Kaymakci, F. Ozdemir, Physical, mechanical, and thermal properties of polypropylene composites filled with walnut shell flour, J. Ind. Eng. Chem. 19 (2013) 908–914. https://doi.org/10.1016/j.jiec.2012.11.006.
[30] A.K. Singh, R.P. Verma, S. Avikal, K.S. Mehra, Mechanical characterization of epoxy composite reinforced with alkali treated walnut shell powder, in: Mater. Today Proc., 2021: pp. 10642–10646. https://doi.org/10.1016/j.matpr.2021.01.383.
[31] S.P. Gairola, Y.K. Tyagi, B. Gangil, A. Sharma, Fabrication and mechanical property evaluation of non-woven banana fibre epoxy-based polymer composite, in: Mater. Today Proc., 2020: pp. 3990–3996.

Acta Innovations 2021 no. 41: 42-55 55
https://doi.org/10.32933/ActaInnovations.41.4 ISSN 2300-5599 2021 RIC Pro-Akademia – CC BY
https://doi.org/10.1016/j.matpr.2020.10.103. [32] E.Y. Robinson, ANALYSIS AND PERFORMANCE OF FIBER COMPOSITES Second Edition B.D. Agrawal and
L.J. Broutman A Wiley-Interscience Publication John Wiley and Sons, Inc., New York 449 pages, hard cover, 1990., Mater. Manuf. Process. 8 (1993) 375–379. https://doi.org/10.1080/10426919308934840.
[33] T. Singh, R. Chauhan, A. Patnaik, B. Gangil, R. Nain, A. Kumar, Parametric study and optimization of multiwalled carbon nanotube filled friction composite materials using taguchi method, Polym. Compos. 39 (2018) E1109–E1117. https://doi.org/10.1002/pc.24576.
[34] S. Kumar, B. Gangil, V.K. Patel, Physico-mechanical and tribological properties of Grewia Optiva fiber/bio-particulates hybrid polymer composites, in: AIP Conf. Proc., 2016: p. 020384. https://doi.org/10.1063/1.4946435.
[35] M. Rahman, A.A. Jasani, M.A. Ibrahim, Flexural Strength of Banana Fibre Reinforced Epoxy Composites Produced through Vacuum Infusion and Hand Lay-Up Techniques - A Comparative Study, Int. J. Eng. Mater. Manuf. 2 (2017) 31–36. https://doi.org/10.26776/ijemm.02.02.2017.02.
[36] S. Kumar, K.K.S. Mer, B. Gangil, V.K. Patel, Synergy of rice-husk filler on physico-mechanical and tribological properties of hybrid Bauhinia-vahlii/sisal fiber reinforced epoxy composites, J. Mater. Res. Technol. 8 (2019) 2070–2082. https://doi.org/10.1016/j.jmrt.2018.12.021.
[37] T. Singh, B. Gangil, B. Singh, S.K. Verma, D. Biswas, G. Fekete, Natural-synthetic fiber reinforced homogeneous and functionally graded vinylester composites: Effect of bagasse-Kevlar hybridization on wear behavior, J. Mater. Res. Technol. 8 (2019) 5961–5971. https://doi.org/10.1016/j.jmrt.2019.09.071.
[38] T. Singh, B. Gangil, A. Patnaik, D. Biswas, G. Fekete, Agriculture waste reinforced corn starch-based biocomposites: Effect of rice husk/walnut shell on physicomechanical, biodegradable and thermal properties, Mater. Res. Express. 6 (2019) 045702. https://doi.org/10.1088/2053-1591/aafe45.
[39] R. Khantwal, G. Gupta, R.S. Negi, Walnut Shell Reinforced Composite: A Review, Int. J. Sci. Eng. Res. 7 (2016) 179–189.
[40] S. Nitin, V.K. Singh, Mechanical behaviour of Walnut reinforced composite, J. Mater. Environ. Sci. 4 (2013) 233–238.

Acta Innovations 2021 no. 41: 56-64 56
https://doi.org/10.32933/ActaInnovations.41.5 ISSN 2300-5599 2021 RIC Pro-Akademia – CC BY
ESTIMATION AND STIMULATION OF EXPORT POTENTIAL OF THE INNOVATIVELY ACTIVE ENTERPRISE BASED
ON ECONOMIC AND MATHEMATICAL MODELLING
Almazbek Dooranov* Department of MBA Programs, Kyrgyz National University named after Jusup Balasagyn
Bishkek, Кyrgyzstan, [email protected]
https://orcid.org/0000-0002-2198-4956
Akima Orozalieva Department of Economics, Management and Customs Affairs, Kyrgyz State Law University (KSLA)
Bishkek, Kyrgyzstan
https://orcid.org/0000-0001-5387-5722
Aisulu Parmanasova Department of Economics, Kyrgyz National University named after Jusup Balasagyn
Bishkek, Kyrgyzstan
https://orcid.org/0000-0002-5885-0812
Volodymyr Katan Department of Economic Cybernetics, Oles Honchar Dnipro National University,
Dnipro, Ukraine
https://orcid.org/0000-0001-9167-2619
Yuliia Horiashchenko Department of Marketing, University of Customs and Finance
Dnipro, Ukraine
https://orcid.org/0000-0001-7020-1412
Yeugene Nagornyi Research Sector, Sumy State Pedagogical University named after A. S. Makarenko
Sumy, Ukraine
https://orcid.org/0000-0003-0756-8398
Article history: Received 29 October 2021, Received in revised form 14 November 2021, Accepted 15 November 2021, Available online 15 November 2021 Highlight The authors propose a new approach to stimulating the export potential of an innovatively active enterprise, based on identifying the hidden potential and expressed in the form of an economics-mathematical model. Abstract The study is devoted to the development of proposals for improving the assessment and stimulating the export potential of an innovatively active enterprise. The authors examined the essence and features of the activities of innovatively active enterprises, as well as the impact on their export activities. The conducted theoretical and methodological study allowed the authors to show their vision of the main components of the export potential of the enterprise, and also, in order to assess and analyze the export potential of an innovatively active enterprise, they proposed an economic and mathematical model, a feature of which is taking into account the hidden export potential, which has a significant economic impact. To stimulate the export potential of an innovatively active enterprise, the authors proposed a system of labour force motivation, as well as institutional instruments, which have a significant social impact. Keywords export potential; export; innovatively active enterprise; labour force; labour; mathematical modelling.
Acta Innovations 2021 no. 41: 56-64 57
https://doi.org/10.32933/ActaInnovations.41.5 ISSN 2300-5599 2021 RIC Pro-Akademia – CC BY
Introduction In the conditions of globalization, which is based, in particular, on continuous informatization and digitalization, the competition of enterprises on a national and international scale is significantly intensified, which determines the importance of providing competitive advantages for any enterprise through innovation [1]. The innovative component of the company's activities is a prerequisite for full-fledged competition in the domestic and foreign markets [2,3]. The innovative activity allows an economic entity to gain undeniable competitive advantages over other market players [4]. An enterprise typically turns to two proven activities to take a leadership position: innovation and market expansion. The synergy of these two components will allow the enterprise to successfully compete in the market, increase income, and meet the needs of the labour force. An enterprise that generates new types of products and services can quickly become a leader in its field and be able to set standards for the development of the entire industry. This will significantly strengthen the market position of the company, add to its competitive advantages. Another equally important argument in favour of implementing innovative activities for the company will be a more rational use of its resource base for the implementation of promising innovative projects and research in its field. Among other things, the implementation of innovative activities allows the company to invest in developing various priority initiatives the required amount of funds to use in the development of the most qualified specialists. These activities will achieve the best results for the company, which will ultimately affect its approaches to new developments and the ability to determine the direction of the industry's development. Methods The study is based on the relationship between theory and practice; therefore, the authors cite the main theoretical and methodological aspects of the subject of research, analyzing which the authors propose ways of improvement using economic and mathematical modelling. The methodological basis of the study is the theory of innovation activity, as well as individual elements of the concepts of development and stimulation of the export potential of the enterprise and incentives for employees. To assess and analyze the export potential of a certain business entity, an economic and mathematical model was developed that reflects the main processes of the export potential functioning and is based on two categories of the export potential of an innovatively active enterprise: actually achieved export potential and unrealized export potential (reserves). The theoretical and methodological basis Innovatively active enterprises: essence, features, resources. Despite the priority of innovation, today, the concept of an innovative-active enterprise is not clearly defined in domestic practice. The conducted analysis [5–7] indicates many criteria for classifying enterprises as innovation-active, used by both the official government bodies and the independent expert community. Innovation-active are enterprises that develop and implement new or improved products or services, technological processes or methods of producing products (providing services). The innovative activity of the enterprise includes the following types of work (Figure 1).
Figure 1. Distinctive features of innovatively active enterprises. Source: developed by the authors.
enterprise
types of activities
research and development
technology acquisition
production of products under patents and patent licenses
production and design work, purchase of software, education and training of personnel
marketing research
purchase of machinery, equipment, installations and other fixed assets related to the implementation of innovations
other types of innovative activities.
+
innovative enterprise
innovatively active enterprise
on an ongoing basis
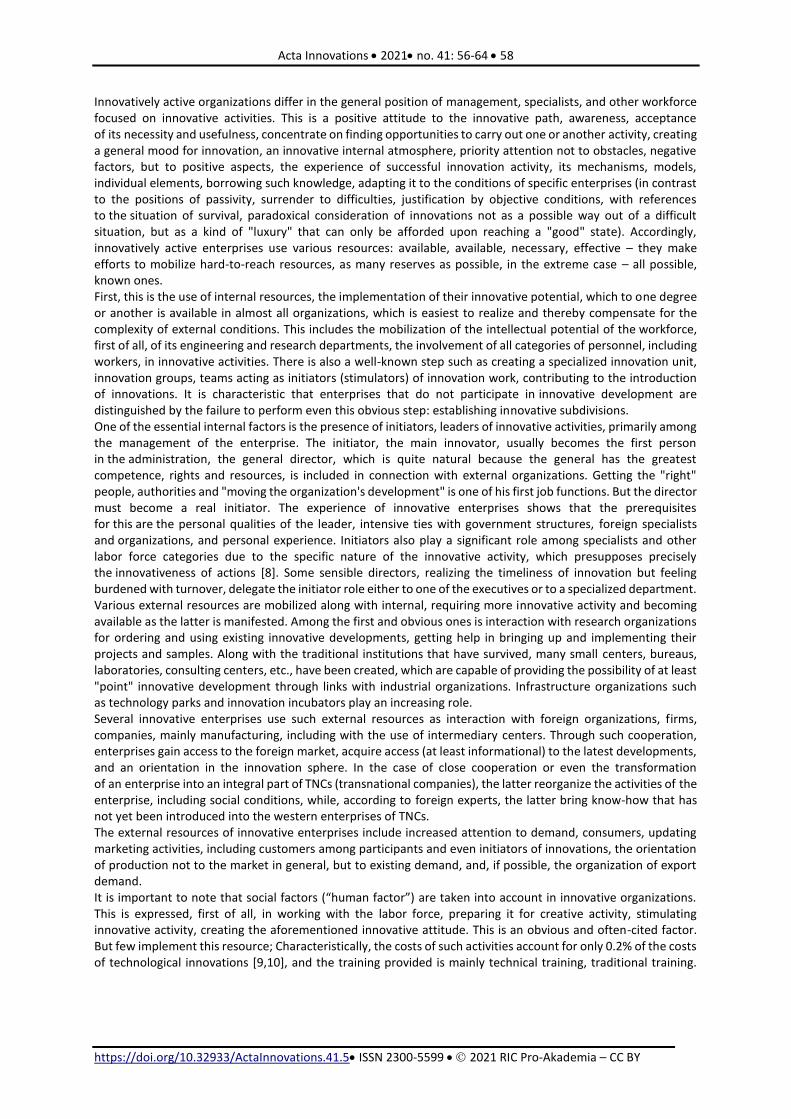
Acta Innovations 2021 no. 41: 56-64 58
https://doi.org/10.32933/ActaInnovations.41.5 ISSN 2300-5599 2021 RIC Pro-Akademia – CC BY
Innovatively active organizations differ in the general position of management, specialists, and other workforce focused on innovative activities. This is a positive attitude to the innovative path, awareness, acceptance of its necessity and usefulness, concentrate on finding opportunities to carry out one or another activity, creating a general mood for innovation, an innovative internal atmosphere, priority attention not to obstacles, negative factors, but to positive aspects, the experience of successful innovation activity, its mechanisms, models, individual elements, borrowing such knowledge, adapting it to the conditions of specific enterprises (in contrast to the positions of passivity, surrender to difficulties, justification by objective conditions, with references to the situation of survival, paradoxical consideration of innovations not as a possible way out of a difficult situation, but as a kind of "luxury" that can only be afforded upon reaching a "good" state). Accordingly, innovatively active enterprises use various resources: available, available, necessary, effective – they make efforts to mobilize hard-to-reach resources, as many reserves as possible, in the extreme case – all possible, known ones. First, this is the use of internal resources, the implementation of their innovative potential, which to one degree or another is available in almost all organizations, which is easiest to realize and thereby compensate for the complexity of external conditions. This includes the mobilization of the intellectual potential of the workforce, first of all, of its engineering and research departments, the involvement of all categories of personnel, including workers, in innovative activities. There is also a well-known step such as creating a specialized innovation unit, innovation groups, teams acting as initiators (stimulators) of innovation work, contributing to the introduction of innovations. It is characteristic that enterprises that do not participate in innovative development are distinguished by the failure to perform even this obvious step: establishing innovative subdivisions. One of the essential internal factors is the presence of initiators, leaders of innovative activities, primarily among the management of the enterprise. The initiator, the main innovator, usually becomes the first person in the administration, the general director, which is quite natural because the general has the greatest competence, rights and resources, is included in connection with external organizations. Getting the "right" people, authorities and "moving the organization's development" is one of his first job functions. But the director must become a real initiator. The experience of innovative enterprises shows that the prerequisites for this are the personal qualities of the leader, intensive ties with government structures, foreign specialists and organizations, and personal experience. Initiators also play a significant role among specialists and other labor force categories due to the specific nature of the innovative activity, which presupposes precisely the innovativeness of actions [8]. Some sensible directors, realizing the timeliness of innovation but feeling burdened with turnover, delegate the initiator role either to one of the executives or to a specialized department. Various external resources are mobilized along with internal, requiring more innovative activity and becoming available as the latter is manifested. Among the first and obvious ones is interaction with research organizations for ordering and using existing innovative developments, getting help in bringing up and implementing their projects and samples. Along with the traditional institutions that have survived, many small centers, bureaus, laboratories, consulting centers, etc., have been created, which are capable of providing the possibility of at least "point" innovative development through links with industrial organizations. Infrastructure organizations such as technology parks and innovation incubators play an increasing role. Several innovative enterprises use such external resources as interaction with foreign organizations, firms, companies, mainly manufacturing, including with the use of intermediary centers. Through such cooperation, enterprises gain access to the foreign market, acquire access (at least informational) to the latest developments, and an orientation in the innovation sphere. In the case of close cooperation or even the transformation of an enterprise into an integral part of TNCs (transnational companies), the latter reorganize the activities of the enterprise, including social conditions, while, according to foreign experts, the latter bring know-how that has not yet been introduced into the western enterprises of TNCs. The external resources of innovative enterprises include increased attention to demand, consumers, updating marketing activities, including customers among participants and even initiators of innovations, the orientation of production not to the market in general, but to existing demand, and, if possible, the organization of export demand. It is important to note that social factors (“human factor”) are taken into account in innovative organizations. This is expressed, first of all, in working with the labor force, preparing it for creative activity, stimulating innovative activity, creating the aforementioned innovative attitude. This is an obvious and often-cited factor. But few implement this resource; Characteristically, the costs of such activities account for only 0.2% of the costs of technological innovations [9,10], and the training provided is mainly technical training, traditional training.

Acta Innovations 2021 no. 41: 56-64 59
https://doi.org/10.32933/ActaInnovations.41.5 ISSN 2300-5599 2021 RIC Pro-Akademia – CC BY
Export activity of innovatively active enterprises. The problems of export activities and the elaboration of different models for the inclusion of the national economy in the world market system are sufficiently highlighted in the scientific works of foreign and domestic economists and scientists [11]. Some authors rightly argue that the export potential is an absolute value and an integrated indicator that considers the properties and characteristics of the enterprise and the market. However, if we talk about the export potential not of an enterprise but of an individual product or resource, it is necessary to make several clarifications. The economic category “export potential” appeared in the early 90s, having come, to a certain extent, to replace the category “export base of industry”, which was analyzed in the 70s and 80s XX century. When defining this category, the emphasis was shifted to the production and marketing activities of the enterprise. Subsequently, it was considered in the scientific literature as the main subject of the national economy, carrying out foreign economic activity. There are two approaches to assessing the export potential:
assessment of the export potential of the enterprise directly;
assessment of the potential of foreign trade activities of the enterprise [12]. These concepts are often identified, or the concept of "export potential" is replaced by the concept of "foreign economic potential, " covering export and import operations. At the same time, the emphasis is placed on the need for the enterprise's all-around inclusion in globalization and international economic cooperation processes. Nevertheless, when designating indicators of the potential for foreign economic activity, some indicators mainly characterize the export potential. Consequently, there is a combination of two economic categories, which, despite the relationship, require separate consideration. The structural and logical analysis made it possible to identify the reasons determining the variety of export potential definitions [12–14]. This approach made it possible to classify them into one of two groups: essential or derived. Among the vital reasons for the variety of definitions of export potential, the following can be distinguished (Table 1).
Table 1. Reasons for the variety of definitions of export potential Source: developed by the authors based on [13,14].
Causes Description
Dynamism, or constant development of the phenomenon
Economic thought evolves towards the most complete, accurate and modern reflection of the essence of export potential, during which new approaches are formed, and existing ones are developed.
Polystructurality, or the variety of the structure of the event the structure of the phenomenon
The export potential of an enterprise is an aggregate characteristic, the outcome of the influence of many factors, and it is quite logical that different researchers, depending on the goals and capabilities of their scientific research, try to determine it through the most relevant in practice, in their opinion, factors.
Polyvariety, or a variety of manifestations of the phenomenon
The export potential characterizes enterprises of various industries, regions, and countries. Accordingly, when determining the export potential of objects of various levels, attempts are made to specify the special, most influential factors for this particular object.
In the export potential of the enterprise, one can single out the key factors affecting its implementation. Import of materials and components, equipment, technologies, know-how. The share of imported components in the cost of goods of the export assortment in the industry can be up to 40% or more since domestic production is developing more slowly than foreign production. International cooperation. The level of competitiveness of domestic products does not always meet international requirements; therefore, enterprises need to cooperate and produce higher quality products or similar imported ones. Entrepreneurship in free economic zones. This type of entrepreneurship will allow an enterprise to find an optimal niche for itself, in which it will be able to constantly improve the quality of products for entering the foreign market.

Acta Innovations 2021 no. 41: 56-64 60
https://doi.org/10.32933/ActaInnovations.41.5 ISSN 2300-5599 2021 RIC Pro-Akademia – CC BY
Counterfeit. The presence of such products at the enterprise significantly reduces its competitiveness; therefore, it is necessary to prevent the appearance of counterfeit products on the market. Intercultural marketing communications are currently the most promising in terms of the formation, implementation and development of export potential [15]. To achieve a synergistic effect is necessary to combine business communications of enterprises, economic missions and international exhibitions. The management of this system, both at the macro and micro levels, aims to promote enterprises to the markets of far and near abroad to monitor the effective formation and implementation of their export potential. National government regulation. Export activity, especially for novice exporters, small and medium-sized enterprises, is a rather complex economic process, accompanied by significant risks and requiring financial costs. However, given that the stimulation of national exports is one of the promising directions that the governments of many countries adhere to, significant amounts are allocated from the state budget for these purposes: for guaranteeing and insuring export supplies and lending export-oriented industries. The formation, implementation, assessment and stimulation of the export potential of an enterprise is a complex and multifaceted phenomenon that occurs on the market within the country under the influence of many factors of the external environment and the internal state of the enterprise. Results and discussion The theoretical and methodological analysis showed that entering the foreign market requires a preliminary assessment of the export potential to determine the enterprise's potential to supply and promote competitive products to the foreign market or provide competitive services in the required quantity within a certain time frame. In the context of constantly changing market conditions, modernization of society [16], complex problems of organizations [15], quarantine restrictions, the need for additional financing of enterprises [17], expansion of foreign trade relations [18] and increased competition in international markets effective use of export potential will ensure the preparation and adoption of high-quality management decisions aimed at achieving sustainable development of the innovation-active enterprise. Based on the study, the export potential can be presented in the form of a diagram shown in Figure 2.
Figure 2. The main components of the export potential of the enterprise. Source: developed by the authors.
Thus, the main goal in assessing an enterprise's export potential should be identifying and implementing reserves for increasing the efficiency and profitability of an enterprise's export activities, increasing production of products competitive in foreign markets with minimal costs of production and financial resources. Unrealized export potential (reserves, latent potential) – assets that do not provide a specific advantage at this stage, although they can be transformed into basic funds in the future. Thus, it is necessary to work out an instrument, using economic and mathematical modelling, which makes it possible to define different indicators for assessing this potential in the conditions of the corresponding (best) system of economic activity of the innovation-active enterprise, aimed at identifying hidden reserves [19]. Given the specificity of the research subject, the integral method of calculating the export potential of an enterprise is more often used, which we improve by introducing two categories of exports and which allows us to more accurately reflect the capabilities of an innovative enterprise in the foreign market, using indicators that are weighted in a certain way among themselves. The advantage of this method is simplicity in calculations and unambiguously interpretable results:
+ =
The total potential of the enterprise
The economic potential of the enterprise
Export potential
Export potential of the
enterprise
Unrealized export potential
(reserves)
Actually achieved export potential

Acta Innovations 2021 no. 41: 56-64 61
https://doi.org/10.32933/ActaInnovations.41.5 ISSN 2300-5599 2021 RIC Pro-Akademia – CC BY
(1)
𝐾𝑝 = √𝛼 ∗ 𝑃𝑎𝑎 ∗ (1 − 𝛼) ∗ 𝑃𝑟𝑒𝑠
where 𝛼 is the coefficient of the contingency of export potential; 𝑃𝑎𝑎 is the aggregate estimate of the actually achieved export potential of the enterprise and is calculated using the formula:
(2)
𝑃𝑎𝑎 = 𝐾𝑃𝑃 ∗ 𝐾𝑃𝑅𝑂𝐹𝑎∗ 𝐾𝑇𝑀𝑠ℎ
∗ 𝐾𝑃𝑅𝑂𝐹𝑝𝑟𝑜𝑑
where 𝐾𝑃𝑃 is an indicator of the ratio of the production program to the production capacity of the enterprise;
𝐾𝑃𝑅𝑂𝐹𝑎 is an indicator of the profitability of production assets;
𝐾𝑇𝑀𝑠ℎ is the share of products in the target market;
𝐾𝑃𝑅𝑂𝐹𝑝𝑟𝑜𝑑 is an indicator of product profitability;
𝑃𝑟𝑒𝑠 - is the aggregate estimate of the unrealized export potential (reserves) of the enterprise and is calculated
using the formula:
(3)
𝑃𝑟𝑒𝑠 = 𝐾𝑅 ∗ 𝐾𝑃𝑀𝑠ℎ
∗ 𝐾𝐶𝑚∗ 𝐾𝑃𝑅𝑂𝐹𝑠𝑎𝑙
where 𝐾𝑅 is an indicator of the ratio of production and sales;
𝐾𝑃𝑀𝑠ℎ is the share of products in the potential market;
𝐾𝐶𝑚 is the share of marketing costs in the total amount of costs;
𝐾𝑃𝑅𝑂𝐹𝑠𝑎𝑙 is an indicator of the profitability of sales;
Foreign trade activity is subject to economic conditions, which is expressed in unstable oscillatory processes of the enterprise. During the upturn, the economic situation improves, the possibilities of production and sale of export products expand, which contributes to a greater manifestation of the hidden export potential of the enterprise. During the deterioration of the economic situation (recession, crisis), the export potential of the enterprise, on the contrary, decreases, but it can also be adjusted due to the intensification of production, the economic use of resources, recircular production, and the creation of the necessary basis for raising production. Choosing three stages of the market environment for the characteristics of oscillatory processes: growth, stabilization and decline, we will establish certain values of the contingency coefficient (Table 2).
Table 2. Coefficients of the conjugation of actually achieved and unrealized export potential. Source: developed by the authors.
Market conditions
Contingency coefficient
actually achieved potential
unrealized export potential
Recession 0.7 0.3
Stabilization 0.5 0.5
Rise 0.3 0.7
In sum, the coefficients of the conjugation of the achieved and unrealized export potential should be equal to one. In sum, the coefficients of the contingency of domestic and latent export potential should be one.
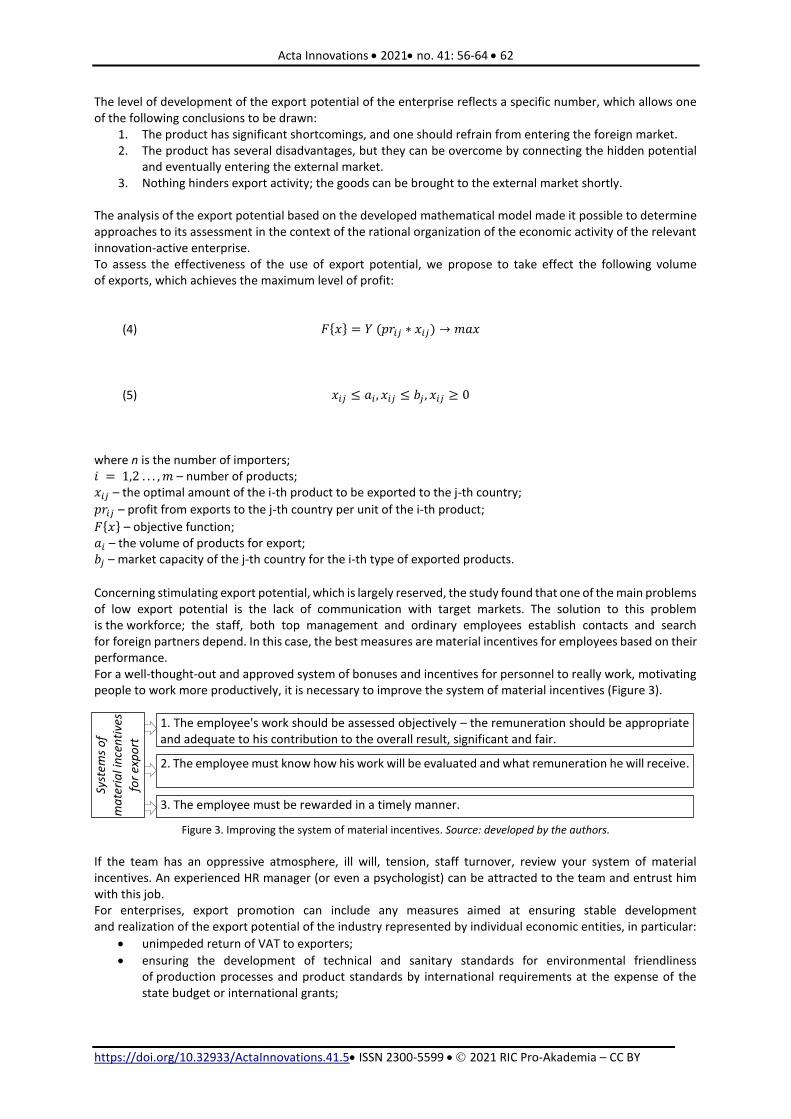
Acta Innovations 2021 no. 41: 56-64 62
https://doi.org/10.32933/ActaInnovations.41.5 ISSN 2300-5599 2021 RIC Pro-Akademia – CC BY
The level of development of the export potential of the enterprise reflects a specific number, which allows one of the following conclusions to be drawn:
1. The product has significant shortcomings, and one should refrain from entering the foreign market. 2. The product has several disadvantages, but they can be overcome by connecting the hidden potential
and eventually entering the external market. 3. Nothing hinders export activity; the goods can be brought to the external market shortly.
The analysis of the export potential based on the developed mathematical model made it possible to determine approaches to its assessment in the context of the rational organization of the economic activity of the relevant innovation-active enterprise. To assess the effectiveness of the use of export potential, we propose to take effect the following volume of exports, which achieves the maximum level of profit:
(4)
𝐹{𝑥} = 𝑌 (𝑝𝑟𝑖𝑗 ∗ 𝑥𝑖𝑗) → 𝑚𝑎𝑥
(5)
𝑥𝑖𝑗 ≤ 𝑎𝑖 , 𝑥𝑖𝑗 ≤ 𝑏𝑗 , 𝑥𝑖𝑗 ≥ 0
where n is the number of importers; 𝑖 = 1,2 . . . , 𝑚 – number of products; 𝑥𝑖𝑗 – the optimal amount of the i-th product to be exported to the j-th country;
𝑝𝑟𝑖𝑗 – profit from exports to the j-th country per unit of the i-th product;
𝐹{𝑥} – objective function; 𝑎𝑖 – the volume of products for export; 𝑏𝑗 – market capacity of the j-th country for the i-th type of exported products.
Concerning stimulating export potential, which is largely reserved, the study found that one of the main problems of low export potential is the lack of communication with target markets. The solution to this problem is the workforce; the staff, both top management and ordinary employees establish contacts and search for foreign partners depend. In this case, the best measures are material incentives for employees based on their performance. For a well-thought-out and approved system of bonuses and incentives for personnel to really work, motivating people to work more productively, it is necessary to improve the system of material incentives (Figure 3).
Figure 3. Improving the system of material incentives. Source: developed by the authors.
If the team has an oppressive atmosphere, ill will, tension, staff turnover, review your system of material incentives. An experienced HR manager (or even a psychologist) can be attracted to the team and entrust him with this job. For enterprises, export promotion can include any measures aimed at ensuring stable development and realization of the export potential of the industry represented by individual economic entities, in particular:
unimpeded return of VAT to exporters;
ensuring the development of technical and sanitary standards for environmental friendliness of production processes and product standards by international requirements at the expense of the state budget or international grants;
Syst
ems
of
ma
teri
al i
nce
nti
ves
for
exp
ort
po
ten
tia
l
1. The employee's work should be assessed objectively – the remuneration should be appropriate and adequate to his contribution to the overall result, significant and fair.
2. The employee must know how his work will be evaluated and what remuneration he will receive.
3. The employee must be rewarded in a timely manner.

Acta Innovations 2021 no. 41: 56-64 63
https://doi.org/10.32933/ActaInnovations.41.5 ISSN 2300-5599 2021 RIC Pro-Akademia – CC BY
the attraction of investments for the modernization of the technical and technological base of the industry;
full application of the quota system;
maintaining a competitive real exchange rate, which forms adequate price incentives;
creation of a mechanism for financial support for exports, first of all, lending, guaranteeing and insurance of export supplies and loans for improving the infrastructure and social base (qualified workforce), providing information and consulting services, promoting the exhibition and fair activities of national firms abroad, subsidizing research works.
All organizational and economic measures to assess and stimulate the level of efficiency of the export potential of the innovation-active enterprise should be implemented systematically. Impact The research touches upon two areas of influence: economic and social. Economic Impact: the authors propose a conceptual basis for assessing and stimulating the export potential of an enterprise, which, unlike the existing ones, is based on the identification and development of hidden export potential. An interesting contribution to the development of practical economic methods is developing an economic and mathematical model that allows one to determine various indicators for assessing the latent potential in the conditions of rational (optimal) organization of economic activity of the relevant business entity at identifying hidden reserves. Social Impact: according to the results of the study, which revealed that the low export potential of the enterprise, among other things, is influenced by the lack of connection with the target markets. To solve this problem, the authors propose material incentives for employees based on the results of their work, improving the system of material incentives for employees, which, unlike the existing ones, is based on the principles of objectivity, transparency and timeliness. Conclusions All organizational and economic measures to assess and stimulate the improvement of the efficiency of the use of export potential in the context of international integration processes should be implemented systematically, in a relationship that will change the negative trends of its development. It is important to note that there is still a lack of comprehensive research with specific recommendations on economic policy measures and methodologies for their use to qualitatively expand and intensify export activities and improve the position of national exports in the world market. That is why the expediency of further research is also caused by the problem associated with the urgent need to develop and implement a comprehensive strategy for the formation and use of the export potential of the country, which necessitates the development of theoretical and methodological foundations of active state economic policy and qualitative factors of the economic development of the country. Conflict of interest There are no conflicts to declare. Acknowledgments This research has not been supported by any external funding. References [1] L. Halkiv, O. Karyy, I. Kulyniak, S. Ohinok, Modeling and forecasting of innovative, scientific and technical
activity indicators under unstable economic situation in the country: Case of Ukraine, in: Commun. Comput. Inf. Sci., 2020: pp. 79–97. https://doi.org/10.1007/978-3-030-61656-4_5.
[2] O. Bilovodska, A. Kholostenko, Z. Mandrychenko, O. Volokitenko, Innovation management of enterprises: Legal provision and analytical tools for evaluating business strategies, J. Optim. Ind. Eng. 14 (2021) 89–96. https://doi.org/10.22094/JOIE.2020.677820.
[3] O. Garachkovska, O. Sytnyk, D. Fayvishenko, I. Taranskiy, O. Afanasieva, O. Prosianyk, Strategic management of brand positioning in the market, Adv. Sci. Technol. Eng. Syst. 6 (2020) 947–953. https://doi.org/10.25046/aj0601104.
[4] I. Vakhovych, B. Satyvaldieva, A. Dooranov, M. Slynko, O. Marchenko, I. Salivonchyk, Smart specialization of the region as a tool for modernizing innovative development, Estud. Econ. Apl. 39 (2021). https://doi.org/10.25115/eea.v39i5.4800.

Acta Innovations 2021 no. 41: 56-64 64
https://doi.org/10.32933/ActaInnovations.41.5 ISSN 2300-5599 2021 RIC Pro-Akademia – CC BY
[5] Bashynska I.O., Models of integrated marketing communications forming for innovatively active machine engineering enterprises, Econ. Ann. (2012) 52–54.
[6] R.K. Serkebayeva, A.A. Korzhengulova, Z.M. Shaukerova, B.Z. Uteyev, A.M. Ziyatdinov, Practice and assessment of financing of innovative projects in Kazakhstan, Espacios. 38 (2017) 14.
[7] L. Halkiv, O. Karyy, I. Kulyniak, S. Ohinok, Innovative, scientific and technical activities in Ukraine: Modern trends and forecasts, in: Proc. 2020 IEEE 3rd Int. Conf. Data Stream Min. Process. DSMP 2020, IEEE, 2020: pp. 321–324. https://doi.org/10.1109/DSMP47368.2020.9204148.
[8] T. Mamytbek uulu, M. Aibashev, Labor migration and development of human resources of the Kyrgyz Republic, Population (Paris). 24 (2021) 154–164. https://doi.org/10.19181/population.2021.24.2.14.
[9] O. Golichenko, S. Samovoleva, Mapping risk factors of innovation activity enterprises, Int. J. Innov. Reg. Dev. 5 (2013) 149. https://doi.org/10.1504/ijird.2013.055238.
[10] M. Kopytko, Y. Ilkiv, MECHANISM OF ENTERPRISE SECURITY ACTIVITY MANAGEMENT OF INNOVATION-ACTIVE ENTERPRISE: SUMMARY AND STRUCTURE, Soc. Leg. Stud. 8 (2020) 119–129. https://doi.org/10.32518/2617-4162-2020-2-119-129.
[11] Y. Rahimi, I. Matyshenko, R. Kapitan, Y. Pronchakov, ORGANIZATION THE INFORMATION SUPPORT OF FULL LOGISTIC SUPPLY CHAINS WITHIN THE INDUSTRY 4.0, Int. J. Qual. Res. 14 (2020) 1279–1290. https://doi.org/10.24874/IJQR14.04-19.
[12] I.A. Markina, Management of the 21St Century : Globalization Challenges, (2019) 260. https://www.pdaa.edu.ua/sites/default/files/academicdepartment/kafedra-menedzhmentu/monographpoltava2018-ilovepdf-compressed-1-260.pdf.
[13] A.I. Volkova, I.A. Karachev, Export potential growth factors for a small innovative enterprise, Financ. Theory Pract. 20 (2016) 31–38.
[14] М. Karimbergenova, А. Nurgaliyeva, G. Kerimbek, S. Bespalyy, L. Moldashbayeva, THE DEVELOPMENT OF REGIONAL EXPORT POTENTIAL, REPORTS. 3 (2019) 160–167. https://doi.org/10.32014/2019.2518-1483.87.
[15] I. Bashynska, Improving the Tariff Policy of Urban Passenger Transport Based on International Experience, TEM J. 9 (2020) 1588–1596. https://doi.org/10.18421/TEM94-34.
[16] A. Smutko, Z. Asanov, T. Ergeshova, MODERNIZATION AND KYRGYZ TRADITIONAL SOCIETY, EurasianUnionScientists. 5 (2021) 38–41. https://doi.org/10.31618/esu.2413-9335.2021.5.84.1302.
[17] O. Poberezhets, O. Kovalova, M. Iorgachova, TRANSFORMATION PROCESSES OF THE IPO MARKET: UKRAINIAN AND WORLD EXPERIENCE, Balt. J. Econ. Stud. 4 (2018) 178–183. https://doi.org/10.30525/2256-0742/2018-4-2-178-183.
[18] O. Prokopenko, Y. Kichuk, O. Ptashchеnko, I. Yurko, M. Cherkashyna, Logistics Concepts to Optimise Business Processes, Estud. Econ. Apl. 39 (2021). https://doi.org/10.25115/eea.v39i3.4712.
[19] A.I. Borodin, A.A. Tatuev, N.N. Shash, E. V. Lyapuntsova, V.V. Rokotyanskaya, Economic-mathematical model of building a company’s potential, Asian Soc. Sci. 11 (2015) 198–204. https://doi.org/10.5539/ass.v11n14p198.

Acta Innovations 2021 no. 41: 65-80 65
https://doi.org/10.32933/ActaInnovations.41.6 ISSN 2300-5599 2021 RIC Pro-Akademia – CC BY
BREWING ON AN INDUSTRIAL AND A CRAFT SCALE – IMPACT ON THE PHYSICOCHEMICAL PROPERTIES AND VOLATILE COMPOUNDS PROFILE OF THE PALE PILSENER-STYLE LAGER BEER ANALYSED WITH HS/GC-MS
Kamil Królak*
Research and Innovation Centre Pro-Akademia 9/11 Innowacyjna Str., 95-050 Konstantynow Łodzki, [email protected]
https://orcid.org/0000-0003-3295-0935
Maria Buła Research and Innovation Centre Pro-Akademia
9/11 Innowacyjna Str., 95-050 Konstantynow Łodzki, [email protected]
https://orcid.org/0000-0002-2490-0201 Article history: Received 2 September 2021, Accepted 6 September 2021, Available online 7 September 2021 Highlight Volatile compounds profile of a craft and industrial beer analysed using headspace gas chromatography-mass spectrometry method. Abstract The pale Pilsener-style lager beers produced on a massive and craft scale were taken to analyse their basic physicochemical properties (alcohol content, pH, haze, real degree of fermentation) and volatile compounds profiles. The research was carried out using a beer analyser equipment and a headspace gas chromatography-mass spectrometry method (HS/GC-MS). The findings showed that in terms of physicochemical and flavour attributes, the quality of craft beers differed to a higher degree from the standard Pilsener beer quality than in the case of industrial beers. Keywords Industrial and craft beer; pilsener; volatile compounds; off-flavours; HS/GC-MS, physicochemical properties Introduction It is believed that the process of making beer represents the world’s oldest biotechnology, which helps to account for the fact that the brewing industry is currently the most established on the alcoholic beverages market with beer being nearly the most consumed beverage in the world [1,2]. In generic terms, there are two main types of beer being produced both on an industrial and a craft (artisanal) scale, namely (1) ale – top fermenting styles of beer and (2) lager – bottom fermenting styles of beer, which refers to the type of yeast used in the fermentation process. Although the craft beer industry in Poland, as distinct from the industrial one, is primarily focused on producing ale beers rather than lagers, it is the production of the bottom fermenting style that has been found to grow faster recently (c. 3.5-fold faster than ale craft beers in 2019) [3]. Overall, there are three to five main commercial companies brewing on an industrial scale in Poland, being distinguished by the annual beer production exceeding 200 000 hL, with their combined market share reaching 98%, and these are particularly: Kompania Piwowarska, Grupa Żywiec and Carlsberg Polska [2,4]. Throughout the years, the prime objective of such large industrial breweries has been aimed at providing highly standardised product, designated „for everybody”, so that the producers can meet the demands of the average consumer and at the same time maximise their profits [5,6]. As a consequence of this policy, the pale pilsener type of lager beer due to its mild and generally not very characteristic flavours has become ubiquitous on the market and is considered now the most dominant and widely brewed single beer style all over the world [7]. Nevertheless, as the noticeable change in consumer attitudes and preferences towards beer did occur in Poland in the beginning of the second decade of the 21st century, the number of microbreweries (craft breweries, contract breweries and brew pubs), offering products with enhanced sensory characteristics or new beer styles whatsoever, have been steadily increasing ever since then (it passed from 107 to 308 in the years 2010-2015) [4,7,8]. This phenomenon associated with opposition to standardisation of beer brewing and beer consumption is called „the craft beer revolution” [5,9]. Despite the popularity of this slogan and craft breweries in themselves among beer consumers in Poland these days, it has to be pointed out that there is no official, common shared

Acta Innovations 2021 no. 41: 65-80 66
https://doi.org/10.32933/ActaInnovations.41.6 ISSN 2300-5599 2021 RIC Pro-Akademia – CC BY
and agreed definition of craft beer and craft breweries as well. It is of note, however, that there are many regional and national brewers associations all over the world, which represent independent microbreweries and simultaneously supply us with some working definitions in terms of craft brewing striving to safeguard their member’s interest [8,10]. As far as Poland is concerned, it seems reasonable to invoke PSBR (“Polskie Stowarzyszenie Browarów Rzemieślniczych”), since according to its 2019 annual report, this microbrewers association was incorporating 25 craft breweries throughout the country at the time, with their combined beer production volume making up to 50% of the total production volume of craft beer in Poland [3]. Although PSBR’s regulations as to what craft brewery is do not strictly refer to brewery’s annual production, it is declared that for all of the associated breweries it does not exceed 18 000 hL. Apart from that, according to PSBR, a craft brewery is innovative as well as economically and personally independent of another (not artisanal) brewery. Moreover, it essentially uses traditional raw materials, i.e. water, barley malt, yeast and hops and thus theoretically provides a high-quality product being sold at a relatively high price [10]. Brewing on an industrial and a craft scale Concerning the scale of production, the quality of even the same style of beer made following industrial and artisanal manufacturing methods might vary significantly, which opens up discussions which scale is favourable for providing better quality of beer [11]. In fact, one of the reasons for the change in consumer preferences for beer in favour of craft was the desire for new taste experiences provided by particular flavours, which were not being found in industrial beers [8]. On the other hand, in contrast to common belief, craft beer may turn out to be of inferior quality to industrial one due to the lack of such steps of production as pasteurisation and filtration processes as well as poor quality control in the production chain. The exclusion of microfiltration phase prior to, and heating-process after beer bottling may result in generating undesirable flavours induced by incompletely removed yeast and microbial contamination respectively [11]. Further, the ability of a small brewery to follow the quality of semi-finished product and contents of various beer compounds, and thus to maintain a steady production is limited because of small budget and resultant lack of investment in accurate analytical instruments like those based on chromatographic analysis, being vital for brewery’s development and competition [12]. For apparently this reason, the SWOT analysis made by Wojtyra and Grudzień characterises the difficulty in providing consistently high-quality of beer as one of the weaknesses of the craft beer industry in Poland [4]. It is worth mentioning on an industrial beer, however, that in order to minimise production costs it is common nowadays for macrobreweries to brew with unmalted cereals (barley, maize, wheat or rice) as partial substitution of barley malt, which is by no means irrelevant for the quality and can have potentially negative effects on beer foam or flavour, for instance [11]. In fact, it is the latter that is considered of the greatest importance with regard to the sensory profile of the beer, and consequently beer’s subsequent market performance [1,2]. Volatile compounds Beer flavour is contingent on presence and intensity of positive and negative taste and aroma characteristics, the latter being determined by many classes of volatile compounds derived from raw materials [2]. Furthermore, the ultimate volatile compounds profile of the beer is influenced by the production technologies (e.g. pasteurisation, microfiltration) and process conditions (wort aeration level, fermentation temperature, conditioning time), yeast strain (secondary metabolites), as well as storage conditions (light and oxygen contribution) and last but not least by microbial contamination [1,11–14]. Hence, In order to provide a high-quality product, it is necessary to keep good manufacturing practice (GMP) and obtain the balance of the beer aroma through maintaining a proper concentration of volatiles such as esters, higher alcohols, carbonyl compounds (aldehydes and ketones), sulphur compounds and organic acids, which at concentrations above their sensory thresholds are perceived either detrimental or beneficial to beer flavour depending on its style [4,14]. In this way, the volatile profile is one of the unique characteristics of each beer style, determining its quality [15]. Pilsener, also commonly known as pils, represents the group of lager beers, which are generally brewed with the use of pale barley malts and fermented in relatively low temperatures (6-12°C) by bottom-fermenting yeast Saccharomyces pastorianus. Despite the fact that there are many variants of pilseners on the market throughout the world, which might stem from slight differentiation in choice of raw materials and methods of production, it is preferred that this style of beer be characterised by clean, crisp and refreshing hoppy taste, delicate fruity aroma, lean body (well attenuated beer), as well as clarity and colour intensity at the level of: 0-1 and 4-8°EBC respectively [16]. As opposed to the top-fermented beers, the volatile profile of the bottom-fermented ones is highlighted by aldehydes and ketones, rather than by esters and higher alcohols and this, by all means accounts for less intense taste sensations when consuming beers of pilsener style [17].

Acta Innovations 2021 no. 41: 65-80 67
https://doi.org/10.32933/ActaInnovations.41.6 ISSN 2300-5599 2021 RIC Pro-Akademia – CC BY
It is of note, however, that all of the abovementioned volatiles should be subject to control in order to obtain a clean flavour profile of the pilsener beer, since not only esters introducing fruity aromas and higher alcohols causing harshness negatively affect the flavour of lager, but also carbonyl compounds, i.e. aldehydes (acetaldehyde) and vicinal diketones (diacetyl) due to their very low sensory thresholds induce off-flavours such as grassy and buttery ones respectively [18]. Amongst other volatiles determining the quality of the pilsener beer, the sulphur compounds such as dimethyl sulphide (DMS) or methanethiol (methyl mercaptan) play a significant role, introducing at high concentrations unpleasant notes of cooked or rotten vegetables (e.g. maize, cabbage) [19]. According to the literature, however, subthreshold-levels of DMS (c. 30 µg/L) or even slightly higher concentrations, below 100 µg/L, are considered acceptable and beneficial to the flavour of lager [20,21]. Gas chromatography Given the fact that beer volatile organic compounds (VOCs) are present in beer at relatively very low concentrations (from ng to mg L-1), the need for accurate analyses of VOCs with the use of sensitive and modern techniques becomes apparent [12,19]. One of the most suitable and sophisticated analytical systems designed for both qualitative and quantitative analysis of extracted VOCs from beer is based on headspace gas chromatographic method coupled to mass spectrometry (HS/GC-MS). In generic terms, the identification is done by partitioning followed by MS (Mass Spectrometry) detection of analytes, being initially carried through a very thin capillary column by helium or another inert gas such as nitrogen or hydrogen, which is in contact with a stationary phase, i.e. an absorbent (e.g. porous polymers) covering the inner side of the column. Owing to different affinities of analytes to the stationary phase, the retention times will also be diverse, making it possible to identify individual compounds [12,19,22–24] (Figure 1). For more details on investment calculations with regard to GC-MS, especially meant for a craft brewery, refer to the source [12].
Figure 1. Ingredients of beer produced during fermentation and maturation. Source: The author’s own modification on the basis of Kucharczyk et. al (2017) [22].
Research purpose The aim of this study was to examine the volatile compounds profiles of craft and industrial (commercial) beers of pale Pilsener-style by the use of HS/GC-MS, with respect to beers’ flavour attributes developed following industrial and artisanal manufacturing methods, along with pointing out potentially resulting quality defects. Given a significant contribution of volatiles to beer sensory characteristics and concomitantly consumer acceptance, as well as the influence of different manufacturing practises on the issue, studies might be useful for brewers in terms of identification the reasons for off-flavours, showing the need for both having at their disposal of sophisticated analytical instruments and maintaining high-quality production standards at each stages of brewing, so that consumers can be supplied with beers of appropriate flavour character for specific style. Further, the physicochemical characterisation of beers will enable to determine if the basic beer parameters, as alcohol content, are in accordance with these specific properties included on the labels, as well as the analysis
Fermentation products of beer
wort
Main
Ethanol CO2
Glycerol
By-products
Aldehydes
Higher alcohols
Esters
Vicinal diketones
Fatty acids
Acetals
Sulphur compounds
Others

Acta Innovations 2021 no. 41: 65-80 68
https://doi.org/10.32933/ActaInnovations.41.6 ISSN 2300-5599 2021 RIC Pro-Akademia – CC BY
of other physicochemical attributes like beer haze or colour intensity will provide a better insight into the impact of the manufacturing scale on the quality of beer. Those results along with determined volatile compounds profiles of beers might also be of particular interest to consumers. Methods Materials A total of 12 Pilsener-style lager beers produced on a craft (6 beers – group I: A-F) and a massive (6 beers – group II: G-L) scale in Poland were collected for the study. The beers were purchased from the supermarkets or specialised craft beer shops, depending on their availability. The samples of commercial (industrial) beers were selected amongst beers being produced by the largest beer companies in Poland according to the literature [4]. Craft beer samples were chosen based on the affiliation of a brewery to one of the biggest Polish microbrewers association (PSBR). Beers produced by such brewery are distinguished by having the legally protected mark with the information „craft beer” claimed on their label. Analysis of volatile compounds through HS/GC-MS The analysis of volatile compounds from the hypersurface phase of the tested beers was carried out using the gas chromatography technique coupled with mass spectrometry and headspace attachment (HS-GC-MS). Beer samples with a volume of 10 ml were placed in a glass vial with a capacity of 20 ml containing approx. 4g of sodium chloride. The vial was then closed tightly with an aluminium cap with silicone/PTFE sept. After mixing, sample was analysed using the Agilent 7820A gas chromatograph, the Agilent 5977B GC/MSD mass detector (mass spectrometer) and the 7697A Agilent headspace phase sample feeder. The separation was made on a Restek Rtx-5 column with a length of 60m, a diameter of 0.32 mm and a film thickness of 1 μm. Helium was used as a carrier gas and the flow rate was 1.1 ml/min. The temperature of the ion source was 230°C and the quadrupole was 150°C, ionisation energy was 70eV. Mass acquisition mode in the range of masses 20-400. The identification of individual compounds was based on a comparison of the spectrum with that available in the NIST library. The content of dimethyl sulphide (DMS) and 2,3-butanedione was also measured by quantitatively comparing its retention time with the retention time of the standard for which the calibration curve was prepared. Each sample was analysed in 3 repetitions. Identification of volatiles was verified using linear retention indices (LRI) – calculated and found in the literature [25–29]. In gas chromatography method, the area of a peak generated is proportional to the amount of the compound that is present in the sample. The volatile compounds profile of the analysed samples was defined as the percentage of the surface area under the peak of a specific compound in relation to the sum of the surface areas of all identified compounds on the chromatogram. Physicochemical analysis of beer The basic physicochemical properties of commercial and craft beers were tested with the beer analyser equipment. The DMA 4500 M (Anton-Paar) density measuring instrument combined with the Alcolyzer Beer ME and Turbidity meter Haze QC ME modules were used for determination of beer’s: density (g/cm3), alcohol content (%v/v), original and final extract (°Plato), real degree of fermentation (RDF%), haze (°EBC), colour intensity (°EBC) and pH. All the measurements were performed in triplicate, by injection into the Beer Analyzer 50 mL of each sample previously decarbonated by the use of laboratory shaker. Statistical analysis Data collected from triplicate beer samples were subjected to statistical analysis using the STATISTICA 13 (Dell, StatSoft) [30]. In order to compare values, one-way analysis of variance (ANOVA) and Tukey HSD at significance level of α = 0.05 was performed. Results and discussion Physicochemical characterisation The most important physicochemical properties of examined beers are shown in Table 1. Statistically significant differences with respect to all measured parameters between the group of craft (group I: A-F) and the group of industrial (group II: G-L) beers were observed (P < 0.05) (Figure 2: a-g). These parameters influence beer sensory quality as well as its microbiological stability.

Acta Innovations 2021 no. 41: 65-80 69
https://doi.org/10.32933/ActaInnovations.41.6 ISSN 2300-5599 2021 RIC Pro-Akademia – CC BY
Table 1. Physicochemical properties of examined beers. Source: Results of the authors' research.
Parameter
Sample
Group I – craft beers Group II – industrial beers
A B C D E F G H I J K L
Alcohol content (% v/v)
3.99 ± 0.01h 5.38 ± 0.01b 5.34 ± 0.05bc 5.04 ± 0.04e 4.93 ± 0.04ef 3.90 ± 0.01h 4.83 ± 0.01fg 4.78 ± 0.11g 5.24 ± 0.02cd 5.42 ± 0.04ab 5.53 ± 0.02a 5.20 ± 0.01d
Final extract (°P) 2.51 ± 0.01c 1.78 ± 0.01b 1.97 ± 0.03e 2.26 ± 0.02d 2.54 ± 0.02c 2.71 ± 0.00a 2.63 ± 0.01b 1.48 ± 0.04i 1.72 ± 0.02g 1.51 ± 0.01hi 0.82 ± 0.01j 1.54 ± 0.01h
Colour intensity (°EBC)
8.43 ± 0.02j 13.63 ± 0.05c 15.13 ± 0.16b 12.30 ± 0.12d 11.05 ± 0.02f 17.32 ± 0.06a 11.88 ± 0.01e 7.95 ± 0.03k 9.03 ± 0.01i 10.51 ± 0.04g 9.84 ± 0.01h 7.08 ± 0.01l
Haze (°EBC) 1.06 ± 0.02ef 1.35 ± 0.01e 10.35 ± 0.58a 6.65 ± 0.21b 2.95 ± 0.08d 5.64 ± 0.03c 0.79 ± 0.01fg 0.24 ± 0.02h 0.38 ± 0.01gh 0.39 ± 0.02gh 0.53 ± 0.02gh 0.38 ± 0.03gh
Original extract (°P)
10.09 ± 0.01g 11.92 ± 0.02ab 12.02 ± 0.06a 11.75 ± 0.07bcd 11.82 ± 0.06bc 10.11 ± 0.01g 11.72 ± 0.02cd 10.56 ± 0.15f 11.61 ± 0.02d 11.74 ± 0.07cd 11.30 ± 0.03e 11.38 ± 0.01e
pH 4.53 ± 0.01a 5.23 ± 0.00a 4.80 ± 0.01b 4.65 ± 0.01d 4.61 ± 0.00e 4.57 ± 0.00f 4.79 ± 0.00b 4.27 ± 0.00j 4.72 ± 0.01c 4.57 ± 0.01f 4.42 ± 0.00i 4.45 ± 0.01h
DMS (µg/l) 54.40 ± 6.23bc 65.61 ± 5.37b 136.29 ± 20.18a 137.49 ± 13.66a 43.15 ± 4.04bcd 0.00 ± 0.00d 37.80 ± 32.73cd 38.15 ± 33.07bcd 0.00 ± 0.00d 0.00 ± 0.00d 0.00 ± 0.00d 0.00 ± 0.00d
Density (g/cm3) 1.0080 ± 0.00c 1.0051 ± 0.00f 1.0058 ± 0.00e 1.0070 ± 0.00d 1.0081 ± 0.00c 1.0088 ± 0.00a 1.0084 ± 0.00b 1.0039 ± 0.00i 1.0048 ± 0.00g 1.0040 ± 0.00hi 1.0014 ± 0.00j 1.0042 ± 0.00h
Real degree of fermentation (RDF%)
60.60 ± 0.06i 68.71 ± 0.05d 67.58 ± 0.27e 65.25 ± 0.16f 63.639 ± 0.1g 59.05 ± 0.04j 62.64 ± 0.06h 69.48 ± 0.49c 68.86 ± 0.11d 70.46 ± 0.04b 75.00 ± 0.07a 69.89 ± 0.05c
letters (a-l) within the same line (horizontally) differ significantly with a p value < 0.05
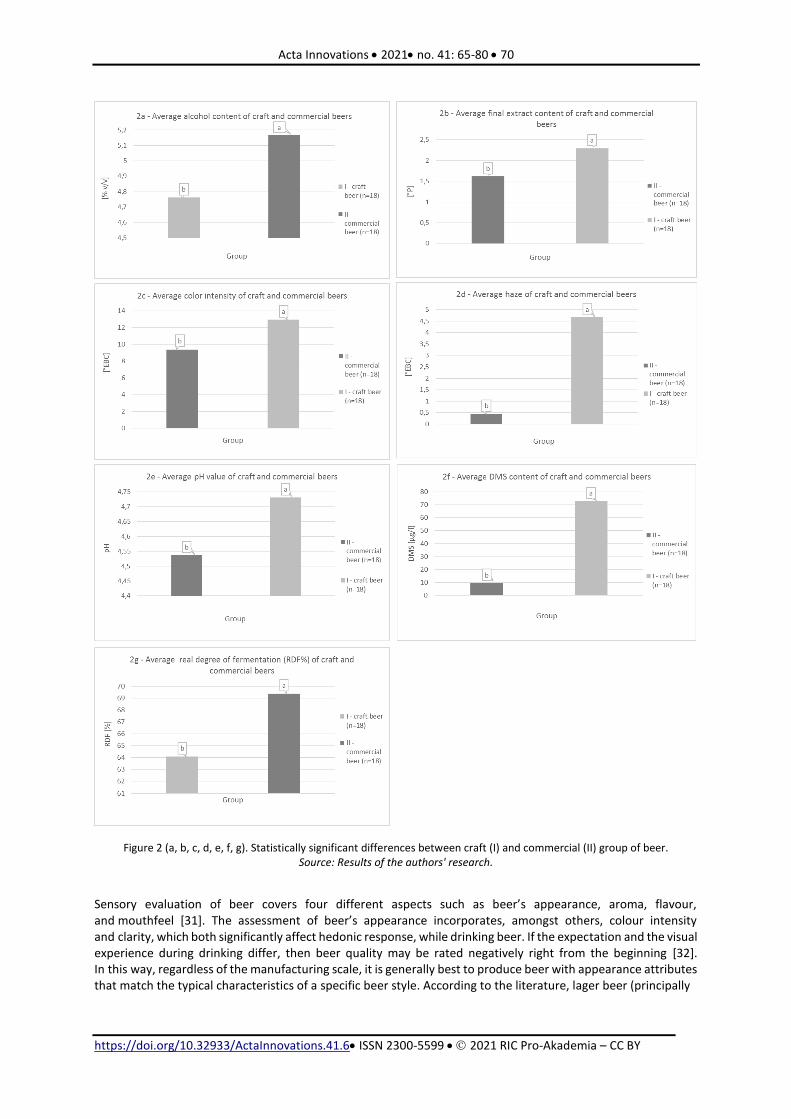
Acta Innovations 2021 no. 41: 65-80 70
https://doi.org/10.32933/ActaInnovations.41.6 ISSN 2300-5599 2021 RIC Pro-Akademia – CC BY
Figure 2 (a, b, c, d, e, f, g). Statistically significant differences between craft (I) and commercial (II) group of beer. Source: Results of the authors' research.
Sensory evaluation of beer covers four different aspects such as beer’s appearance, aroma, flavour, and mouthfeel [31]. The assessment of beer’s appearance incorporates, amongst others, colour intensity and clarity, which both significantly affect hedonic response, while drinking beer. If the expectation and the visual experience during drinking differ, then beer quality may be rated negatively right from the beginning [32]. In this way, regardless of the manufacturing scale, it is generally best to produce beer with appearance attributes that match the typical characteristics of a specific beer style. According to the literature, lager beer (principally

Acta Innovations 2021 no. 41: 65-80 71
https://doi.org/10.32933/ActaInnovations.41.6 ISSN 2300-5599 2021 RIC Pro-Akademia – CC BY
the pale Pilsener-style) is usually expected to not exceed 1°EBC haze, which is considered a brilliant (clear) beer [33]. In the twelve beers studied, haze values were in the range of 0.24 to 10.35°EBC (Table 1). Thus, a considerable variation in beer haze among samples was observed. It is of note that only beers made by industrial processes were characterised by a desirable haze for lager beer, i.e. < 1°EBC (0.45°EBC on average), while all craft beer samples exhibited higher values (4.67°EBC on average) (Table 1 and Figure 2d). The formation of haze is influenced by a lot of factors, including raw materials used in the process as well as mash, wort and beer production technology [34]. Craft beers, as opposed to industrial beers, are usually made without the addition of chemical adsorbents removing haze-active compounds during filtration (proteins and polyphenols) such as PVPP or silica gel, or by completely eliminating the process of beer filtration. It is probably the main cause of increased haze values measured in craft beers in comparison to beers brewed on an industrial scale. Similarly, colour intensity measured was also significantly higher among craft beers than among industrial beers (Figure 2c) (P < 0.05). In the Doorn et. at. (2019) study it was confirmed that, as the colour intensity of beer increased its rated ability to quench one’s thirst decreased [32]. Given that thirst-quenching quality of Pilsener-style lager beer is of great importance to consumers due to their wish to drink refreshing beer, it should be concluded that industrial beers in terms of colour intensity are of superior quality to craft ones. On the other hand, only two out of six commercial beers (samples H and L) had a colour of proper intensity for pilsener style, i.e. in the range of 4-8°EBC (Table 1) [16]. In contrast to parameters of beer haze and colour intensity, the average real degree of fermentation (RDF), and thus also the average alcohol content were significantly lower for the group of craft beers than for the group of industrial beers (P < 0.05) (Figure 2a, 2g). RDF determines the rate of real attenuation, that is the actual percentage of sugars consumed by yeast and converted into alcohol and carbon dioxide during the fermentation process. Hence from a sensory point of view, that parameter influence the textural attributes (so-called mouthfeel), as a lower RDF percentage gives rise to beers with higher levels of sweetness and syrupy taste, whereas the higher RDF%, the more refreshing, lighter and drier the beer [35]. Andrade et al. (2016) [36], when evaluating the quality of different brands of Pilsner-style beer, reported RDF between 59.02 and 69.44%. Overall our findings regarding RDF% are in accordance with findings reported by Andrade et al., except for four samples of industrial beers, namely H, J, K and L, which exhibited higher RDF% (Table 1). It has to be pointed out, however, that sugar syrups were used as malt adjuncts (partial substitutes of barley malt) when producing K and L beers, which significantly increased the content of easily fermented sugars in worts, hence also RDF% (information with respect to raw materials composition was claimed on the label). The labelling of beers must also indicate the alcoholic strength by volume. Considering that the tolerance allowed in terms of the indication of the alcoholic strength by volume for beers featuring alcoholic content below 5.5% v/v is 0.5% v/v [37], only three samples (two industrial beers – I and J, and one craft beer – B) fell short of that specific requirement (table 2). Tozetto et al. (2019) [38] when analysing 28 Pilsener-style lager beers, reported average alcohol content at the level of 4.7% v/v, which is more consistent with the results obtained for the group of craft beers (4.75% v/v on average) than for the group of industrial beers (5.15% v/v on average) (Figure 2a). The pH of the beers studied was in the range of 4.27-5.23. It is generally stated that lager beer should be characterised by a pH of around 4.0-5.0. Sample B of craft beer had the highest (5.23), whereas sample H of industrial beer the lowest pH (4.27) (Table 1). Also the average pH of craft beers was significantly higher than average pH of industrial beers (Figure 2e). To sum up, the results show that the manufacturing scale does seem to impact the physicochemical properties of the pale Pilsener-style lager beer. The average values of the basic characteristics of beers produced on a craft scale (by artisanal processes) deviates from standards for Pilsener-style beer to a higher degree than in the case of beers made following industrial processes. In this respect, from the point of view of the average consumer, industrial beers may be perceived of superior quality to craft beers. Volatile compounds identification The HS/GC-MS analysis of the pale Pilsener-style lager beers provided the information about volatile profile of each sample (Table 3), which paved the way for the characterisation of the flavours of individual beers as well as the comparison of the volatile compounds’ profiles between the groups of industrial and craft beers. The analysis of volatile compounds in craft and industrial beers of Pilsener-style with the use of HS-SPME/GC-MS made by Giannetti et. al. (2019) [5] showed that manufacturing scale has a substantial impact on the beer volatile compounds profiles, as only 13 out of 111 volatiles identified were simultaneously present in all 79 beers analysed (42 craft and 37 industrial products purchased on the Italian market). Based on the evaluation of average concentrations, expressed as TIC area, 6 out of 13 identified compounds were subsequently assigned to the group of craft beers, whereas the rest of them to the group of industrial beers, giving the discrimination as to which group of beers was characterised by a higher content of an individual compound. The authors

Acta Innovations 2021 no. 41: 65-80 72
https://doi.org/10.32933/ActaInnovations.41.6 ISSN 2300-5599 2021 RIC Pro-Akademia – CC BY
concluded their study with the encouragement for other scientists to further characterise quality marker compounds of craft beers, underlining the need for quantification of the identified markers by analysis of the pure standard. Therefore, in this study beers purchased on the Polish market were analysed in order to determine their volatile compounds profiles (qualitative analysis) with additional focus on quantitative analysis of dimethyl sulphide (DMS) and 2,3-butanedione (diacetyl), by using respective standards. These two volatile compounds are potentially present in beer and introduce, at high concentrations, unpleasant notes of cooked vegetables and butter respectively. In the analysed batch of samples a total of 57 volatile compounds were identified by using NIST spectrum library
and literature LRI values (Table 4). Those compounds can be classified into 6 groups, namely: esters (29), alcohols
(14), carboxylic acids (3), carbonyl compounds (6), terpenes (4) and sulphur compounds (1). The volatile
compounds profiles of 12 beers, 6 from craft group (A-F) and 6 from commercial group (G-L), are shown
in Table 3. From the results, it is clear that the volatiles production was higher in the beers made by artisanal
processes (especially in sample B) than in the industrial beers (Table 3). On average, the craft beers featured
higher quantities of all identified compounds from 6 mentioned groups, for instance, an average of 14 esters and
7 alcohols were identified in the craft beers, whereas an average of 9 esters and 6 alcohols were identified
in the industrial beers. These basic results are consistent with previous literature reports [11] and highlight just
how standardisation procedures being implemented in commercial breweries (filtration and pasteurisation)
as well as a better control of manufacturing processes in the case of industrial beers may contribute
to a flattening or a complete elimination of a specific volatile compounds from the finished product. On the one
hand, based on the results obtained it might be argued that craft beers retain more flavour attributes
or nutritional properties, nevertheless, as far as the pale Pilsener-style lager beer is concerned, it must
be stressed that too intense aromas disturb the clean profile desired for this style of beer and consequently
negatively affect the beer quality.
Table 2. Comparison of alcohol content measured and labelled for studied beers. Source: Results of the authors' research.
Parameters
Sample
Group I – craft beers
Group II – industrial beers
A B C D E F G H I J K L
Alcohol content measured (% v/v)
3.99 5.38 5.34 5.04 4.93 3.90 4.83 4.78 5.24 5.42 5.53 5.20
Alcohol content labelled (% v/v)
4.40 4.70 5.00 5.00 4.80 4.10 5.00 5.00 6.00 6.00 5.70 5.50
IΔAI 0.41 0.68 0.34 0.04 0.13 0.20 0.17 0.22 0.76 0.58 0.17 0.30
IΔAI – the absolute value of a difference between alcohol content measured and labelled for specific beer

Acta Innovations 2021 no. 41: 65-80 73
https://doi.org/10.32933/ActaInnovations.41.6 ISSN 2300-5599 2021 RIC Pro-Akademia – CC BY
Table 3. Average volatiles profiles (n=3) of 12 beers, 6 from commercial group and 6 from craft group. Source: Results of the authors' research.
Compound
Sample
Group I – craft beers Group II – industrial beers
A B C D E F G H I J K L
Acetaldehyde 0.039 ± 0.002f 0.063 ± 0.002e 0.155 ± 0.009b 0.129 ± 0.003cd 0.109 ± 0.004d 0.118 ± 0.003cd 0.131 ± 0.007c 0.109 ± 0.002d 0.167 ± 0.011b 0.258 ± 0.017a 0.071 ± 0.003e 0.160 ± 0.002b
Ethanol 86.881 ± 0.455ab 82.359 ± 0.383d 84.730 ± 0.781c 85.708 ± 0.468bc 87.367 ± 0.185a 87.032 ± 0.504ab 86.971 ± 0.499ab 82.996 ± 0.468d 86.081 ± 0.614abc 85.711 ± 0.536bc 82.949 ± 0.242d 87.206 ± 0.175a
Acetone 0.000 ± 0.000c 0.126 ± 0.017a 0.040 ± 0.008b 0.101 ± 0.021a 0.046 ± 0.010b 0.000 ± 0.000c 0.000 ± 0.000c 0.000 ± 0.000c 0.000 ± 0.000c 0.000 ± 0.000c 0.000 ± 0.000c 0.000 ± 0.000c
2-Propanol 0.000 ± 0.000b 0.459 ± 0.003a 0.000 ± 0.000b 0.000 ± 0.000b 0.000 ± 0.000b 0.000 ± 0.000b 0.000 ± 0.000b 0.000 ± 0.000b 0.000 ± 0.000b 0.000 ± 0.000b 0.000 ± 0.000b 0.000 ± 0.000b
2-Nitroethanol 0.000 ± 0.000a 0.000 ± 0.000a 0.030 ± 0.000a 0.000 ± 0.000a 0.000 ± 0.000a 0.000 ± 0.000a 0.000 ± 0.000a 0.000 ± 0.000a 0.000 ± 0.000a 0.000 ± 0.000a 0.000 ± 0.000a 0.000 ± 0.000a
Ethyl formate 0.000 ± 0.000c 0.000 ± 0.000c 0.029 ± 0.004a 0.011 ± 0.009b 0.000 ± 0.000c 0.000 ± 0.000c 0.000 ± 0.000c 0.000 ± 0.000c 0.000 ± 0.000c 0.000 ± 0.000c 0.000 ± 0.000c 0.000 ± 0.000c
Dimethyl sulphide 0.025 ± 0.003b 0.020 ± 0.000b 0.047 ± 0.005a 0.049 ± 0.004a 0.015 ± 0.002bc 0.014 ± 0.012bc 0.007 ± 0.012bc 0.012 ± 0.011bc 0.000 ± 0.000c 0.000 ± 0.000c 0.000 ± 0.000c 0.000 ± 0.000c
1-propanol 0.348 ± 0.005fg 0.598 ± 0.004c 0.308 ± 0.001hi 0.511 ± 0.009d 0.365 ± 0.020f 0.364 ± 0.006f 0.336 ± 0.005gh 1.398 ± 0.018a 0.410 ± 0.011e 0.538 ± 0.004d 0.663 ± 0.006b 0.300 ± 0.002i
Acetic acid 0.127 ± 0.016a 0.041 ± 0.007bcd 0.059 ± 0.002b 0.107 ± 0.011a 0.055 ± 0.008bc 0.129 ± 0.026a 0.031 ± 0.003bcd 0.045 ± 0.006de 0.023 ± 0.003ae 0.025 ± 0.004cde 0.000 ± 0.000e 0.032 ± 0.010bcd
Ethyl acetate 2.960 ± 0.146ef 4.168 ± 0.122b 4.660 ± 0.267a 3.260 ± 0.113de 3.035 ± 0.088ef 2.630 ± 0.128f 3.757 ± 0.220bc 2.702 ± 0.115f 3.2648± 0.153de 2.775 ± 0.171f 5.063 ± 0.063a 3.477± 0.052cd
Isobutanol 0.826 ± 0.007d 0.578 ± 0.009f 0.823 ± 0.030d 0.889 ± 0.026cd 0.958 ± 0.021bc 0.924 ± 0.023c 0.717 ± 0.010e 1.401 ± 0.032a 1.002 ± 0.045b 1.402 ± 0.037a 0.942 ± 0.013bc 0.828 ± 0.008d
3-Methyl-2-butanone 0.000 ± 0.000b 0.000 ± 0.000b 0.000 ± 0.000b 0.029 ± 0.002a 0.000 ± 0.000b 0.000 ± 0.000b 0.000 ± 0.000b 0.000 ± 0.000b 0.000 ± 0.000b 0.000 ± 0.000b 0.000 ± 0.000b 0.000 ± 0.000b
1-butanol 0.000 ± 0.000c 0.080 ± 0.000b 0.000 ± 0.000c 0.000 ± 0.000c 0.000 ± 0.000c 0.000 ± 0.000c 0.000 ± 0.000c 0.337 ± 0.006a 0.000 ± 0.000c 0.000 ± 0.000c 0.080 ± 0.000b 0.000 ± 0.000c
Methyl isobutyrate 0.000 ± 0.000b 0.067 ± 0.006a 0.000 ± 0.000b 0.000 ± 0.000b 0.000 ± 0.000b 0.000 ± 0.000b 0.000 ± 0.000b 0.000 ± 0.000b 0.000 ± 0.000b 0.000 ± 0.000b 0.000 ± 0.000b 0.000 ± 0.000b
Ethyl propionate 0.027 ± 0.006de 0.073 ± 0.006b 0.027 ± 0.006de 0.037 ± 0.006d 0.020 ± 0.000e 0.020 ± 0.000e 0.040 ± 0.000d 0.057 ± 0.006c 0.080 ± 0.010b 0.030 ± 0.000de 0.096 ± 0.003a 0.040 ± 0.000d
Propyl acetate 0.000 ± 0.000b 0.000 ± 0.000b 0.000 ± 0.000b 0.000 ± 0.000b 0.000 ± 0.000b 0.000 ± 0.000b 0.000 ± 0.000b 0.000 ± 0.000b 0.000 ± 0.000b 0.000 ± 0.000b 0.025 ± 0.001a 0.000 ± 0.000b
1-Butanol. 3-methyl- 4.773 ± 0.041ef 5.715 ± 0.045b 4.563 ± 0.134fg 5.080± 0.118cd 4.494 ± 0.057fg 5.168± 0.119cd 4.323 ± 0.053g 6.405 ± 0.128a 4.947 ± 0.166de 5.317± 0.128cd 4.391 ± 0.059g 3.940 ± 0.036h
1-Butanol. 2-methyl- 1.770 ± 0.024def 1.615 ± 0.031f 1.706 ± 0.075ef 1.885± 0.054cd 2.038 ± 0.037bc 1.810 ± 0.065de 1.839 ± 0.029de 1.921 ± 0.049bcd 2.046 ± 0.096b 2.448 ± 0.070a 1.778± 0.040de 1.694 ± 0.030ef
2-Pentanone. 4-methyl- 0.027 ± 0.001c 0.066 ± 0.002a 0.000± 0.000d 0.045 ± 0.003b 0.000± 0.000d 0.000± 0.000d 0.000± 0.000d 0.000± 0.000d 0.000± 0.000d 0.000± 0.000d 0.000± 0.000d 0.000± 0.000d
Ethyl isobutyrate 0.000 ± 0.000c 0.204 ± 0.012a 0.000 ± 0.000c 0.073 ± 0.004b 0.000 ± 0.000c 0.000 ± 0.000c 0.000 ± 0.000c 0.000 ± 0.000c 0.000 ± 0.000c 0.000 ± 0.000c 0.000 ± 0.000c 0.000 ± 0.000c
Isobutyl acetate 0.020± 0.000cd 0.000 ± 0.000e 0.037 ± 0.006b 0.010± 0.009d 0.020± 0.000cd 0.020± 0.000cd 0.020± 0.000cd 0.030± 0.000cb 0.000 ± 0.000e 0.020± 0.000cd 0.060 ± 0.000a 0.027 ± 0.006bc
Methyl isovalerate 0.000 ± 0.000a 0.020 ± 0.000a 0.000 ± 0.000a 0.000 ± 0.000a 0.000 ± 0.000a 0.000 ± 0.000a 0.000 ± 0.000a 0.000 ± 0.000a 0.000 ± 0.000a 0.000 ± 0.000a 0.000 ± 0.000a 0.000 ± 0.000a
2.3-Butanediol 0.000 ± 0.000b 0.000 ± 0.000b 0.000 ± 0.000b 0.000 ± 0.000b 0.020 ± 0.000a 0.020 ± 0.000a 0.000 ± 0.000b 0.000 ± 0.000b 0.023 ± 0.006a 0.027 ± 0.006a 0.030 ± 0.010a 0.020 ± 0.000a
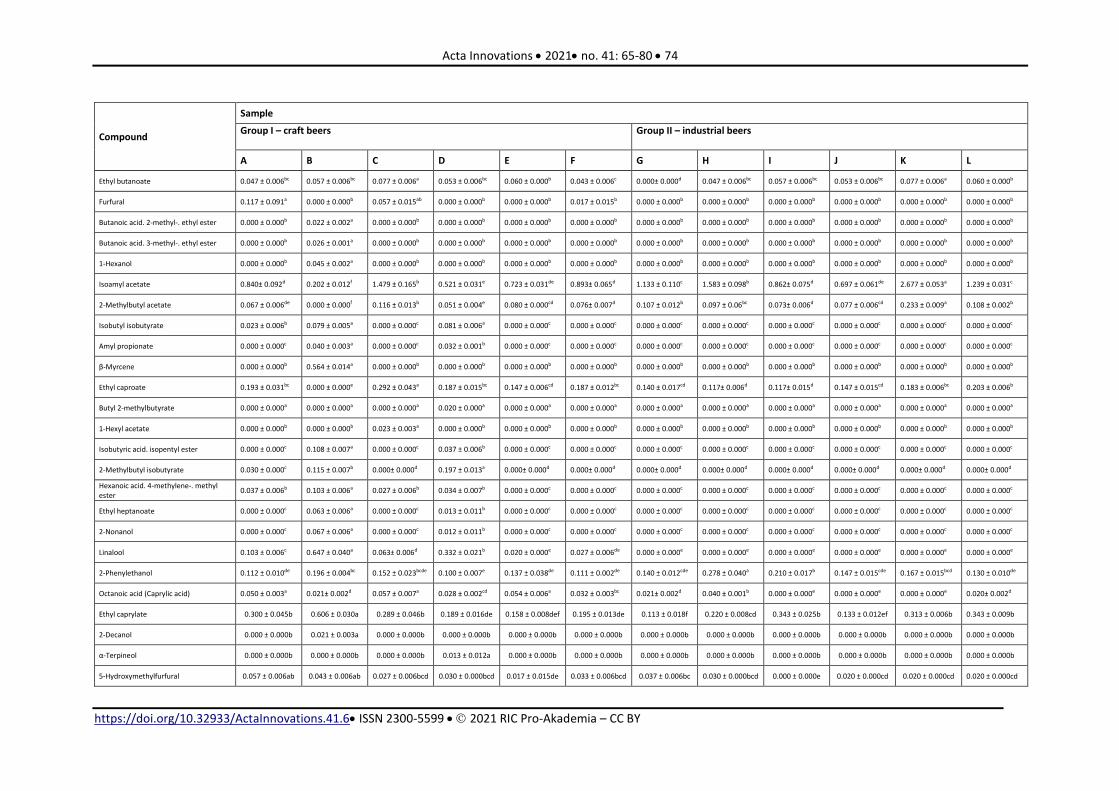
Acta Innovations 2021 no. 41: 65-80 74
https://doi.org/10.32933/ActaInnovations.41.6 ISSN 2300-5599 2021 RIC Pro-Akademia – CC BY
Compound
Sample
Group I – craft beers Group II – industrial beers
A B C D E F G H I J K L
Ethyl butanoate 0.047 ± 0.006bc 0.057 ± 0.006bc 0.077 ± 0.006a 0.053 ± 0.006bc 0.060 ± 0.000b 0.043 ± 0.006c 0.000± 0.000d 0.047 ± 0.006bc 0.057 ± 0.006bc 0.053 ± 0.006bc 0.077 ± 0.006a 0.060 ± 0.000b
Furfural 0.117 ± 0.091a 0.000 ± 0.000b 0.057 ± 0.015ab 0.000 ± 0.000b 0.000 ± 0.000b 0.017 ± 0.015b 0.000 ± 0.000b 0.000 ± 0.000b 0.000 ± 0.000b 0.000 ± 0.000b 0.000 ± 0.000b 0.000 ± 0.000b
Butanoic acid. 2-methyl-. ethyl ester 0.000 ± 0.000b 0.022 ± 0.002a 0.000 ± 0.000b 0.000 ± 0.000b 0.000 ± 0.000b 0.000 ± 0.000b 0.000 ± 0.000b 0.000 ± 0.000b 0.000 ± 0.000b 0.000 ± 0.000b 0.000 ± 0.000b 0.000 ± 0.000b
Butanoic acid. 3-methyl-. ethyl ester 0.000 ± 0.000b 0.026 ± 0.001a 0.000 ± 0.000b 0.000 ± 0.000b 0.000 ± 0.000b 0.000 ± 0.000b 0.000 ± 0.000b 0.000 ± 0.000b 0.000 ± 0.000b 0.000 ± 0.000b 0.000 ± 0.000b 0.000 ± 0.000b
1-Hexanol 0.000 ± 0.000b 0.045 ± 0.002a 0.000 ± 0.000b 0.000 ± 0.000b 0.000 ± 0.000b 0.000 ± 0.000b 0.000 ± 0.000b 0.000 ± 0.000b 0.000 ± 0.000b 0.000 ± 0.000b 0.000 ± 0.000b 0.000 ± 0.000b
Isoamyl acetate 0.840± 0.092d 0.202 ± 0.012f 1.479 ± 0.165b 0.521 ± 0.031e 0.723 ± 0.031de 0.893± 0.065d 1.133 ± 0.110c 1.583 ± 0.098b 0.862± 0.075d 0.697 ± 0.061de 2.677 ± 0.053a 1.239 ± 0.031c
2-Methylbutyl acetate 0.067 ± 0.006de 0.000 ± 0.000f 0.116 ± 0.013b 0.051 ± 0.004e 0.080 ± 0.000cd 0.076± 0.007d 0.107 ± 0.012b 0.097 ± 0.06bc 0.073± 0.006d 0.077 ± 0.006cd 0.233 ± 0.009a 0.108 ± 0.002b
Isobutyl isobutyrate 0.023 ± 0.006b 0.079 ± 0.005a 0.000 ± 0.000c 0.081 ± 0.006a 0.000 ± 0.000c 0.000 ± 0.000c 0.000 ± 0.000c 0.000 ± 0.000c 0.000 ± 0.000c 0.000 ± 0.000c 0.000 ± 0.000c 0.000 ± 0.000c
Amyl propionate 0.000 ± 0.000c 0.040 ± 0.003a 0.000 ± 0.000c 0.032 ± 0.001b 0.000 ± 0.000c 0.000 ± 0.000c 0.000 ± 0.000c 0.000 ± 0.000c 0.000 ± 0.000c 0.000 ± 0.000c 0.000 ± 0.000c 0.000 ± 0.000c
β-Myrcene 0.000 ± 0.000b 0.564 ± 0.014a 0.000 ± 0.000b 0.000 ± 0.000b 0.000 ± 0.000b 0.000 ± 0.000b 0.000 ± 0.000b 0.000 ± 0.000b 0.000 ± 0.000b 0.000 ± 0.000b 0.000 ± 0.000b 0.000 ± 0.000b
Ethyl caproate 0.193 ± 0.031bc 0.000 ± 0.000e 0.292 ± 0.043a 0.187 ± 0.015bc 0.147 ± 0.006cd 0.187 ± 0.012bc 0.140 ± 0.017cd 0.117± 0.006d 0.117± 0.015d 0.147 ± 0.015cd 0.183 ± 0.006bc 0.203 ± 0.006b
Butyl 2-methylbutyrate 0.000 ± 0.000a 0.000 ± 0.000a 0.000 ± 0.000a 0.020 ± 0.000a 0.000 ± 0.000a 0.000 ± 0.000a 0.000 ± 0.000a 0.000 ± 0.000a 0.000 ± 0.000a 0.000 ± 0.000a 0.000 ± 0.000a 0.000 ± 0.000a
1-Hexyl acetate 0.000 ± 0.000b 0.000 ± 0.000b 0.023 ± 0.003a 0.000 ± 0.000b 0.000 ± 0.000b 0.000 ± 0.000b 0.000 ± 0.000b 0.000 ± 0.000b 0.000 ± 0.000b 0.000 ± 0.000b 0.000 ± 0.000b 0.000 ± 0.000b
Isobutyric acid. isopentyl ester 0.000 ± 0.000c 0.108 ± 0.007a 0.000 ± 0.000c 0.037 ± 0.006b 0.000 ± 0.000c 0.000 ± 0.000c 0.000 ± 0.000c 0.000 ± 0.000c 0.000 ± 0.000c 0.000 ± 0.000c 0.000 ± 0.000c 0.000 ± 0.000c
2-Methylbutyl isobutyrate 0.030 ± 0.000c 0.115 ± 0.007b 0.000± 0.000d 0.197 ± 0.013a 0.000± 0.000d 0.000± 0.000d 0.000± 0.000d 0.000± 0.000d 0.000± 0.000d 0.000± 0.000d 0.000± 0.000d 0.000± 0.000d
Hexanoic acid. 4-methylene-. methyl ester
0.037 ± 0.006b 0.103 ± 0.006a 0.027 ± 0.006b 0.034 ± 0.007b 0.000 ± 0.000c 0.000 ± 0.000c 0.000 ± 0.000c 0.000 ± 0.000c 0.000 ± 0.000c 0.000 ± 0.000c 0.000 ± 0.000c 0.000 ± 0.000c
Ethyl heptanoate 0.000 ± 0.000c 0.063 ± 0.006a 0.000 ± 0.000c 0.013 ± 0.011b 0.000 ± 0.000c 0.000 ± 0.000c 0.000 ± 0.000c 0.000 ± 0.000c 0.000 ± 0.000c 0.000 ± 0.000c 0.000 ± 0.000c 0.000 ± 0.000c
2-Nonanol 0.000 ± 0.000c 0.067 ± 0.006a 0.000 ± 0.000c 0.012 ± 0.011b 0.000 ± 0.000c 0.000 ± 0.000c 0.000 ± 0.000c 0.000 ± 0.000c 0.000 ± 0.000c 0.000 ± 0.000c 0.000 ± 0.000c 0.000 ± 0.000c
Linalool 0.103 ± 0.006c 0.647 ± 0.040a 0.063± 0.006d 0.332 ± 0.021b 0.020 ± 0.000e 0.027 ± 0.006de 0.000 ± 0.000e 0.000 ± 0.000e 0.000 ± 0.000e 0.000 ± 0.000e 0.000 ± 0.000e 0.000 ± 0.000e
2-Phenylethanol 0.112 ± 0.010de 0.196 ± 0.004bc 0.152 ± 0.023bcde 0.100 ± 0.007e 0.137 ± 0.038de 0.111 ± 0.002de 0.140 ± 0.012cde 0.278 ± 0.040a 0.210 ± 0.017b 0.147 ± 0.015cde 0.167 ± 0.015bcd 0.130 ± 0.010de
Octanoic acid (Caprylic acid) 0.050 ± 0.003a 0.021± 0.002d 0.057 ± 0.007a 0.028 ± 0.002cd 0.054 ± 0.006a 0.032 ± 0.003bc 0.021± 0.002d 0.040 ± 0.001b 0.000 ± 0.000e 0.000 ± 0.000e 0.000 ± 0.000e 0.020± 0.002d
Ethyl caprylate 0.300 ± 0.045b 0.606 ± 0.030a 0.289 ± 0.046b 0.189 ± 0.016de 0.158 ± 0.008def 0.195 ± 0.013de 0.113 ± 0.018f 0.220 ± 0.008cd 0.343 ± 0.025b 0.133 ± 0.012ef 0.313 ± 0.006b 0.343 ± 0.009b
2-Decanol 0.000 ± 0.000b 0.021 ± 0.003a 0.000 ± 0.000b 0.000 ± 0.000b 0.000 ± 0.000b 0.000 ± 0.000b 0.000 ± 0.000b 0.000 ± 0.000b 0.000 ± 0.000b 0.000 ± 0.000b 0.000 ± 0.000b 0.000 ± 0.000b
α-Terpineol 0.000 ± 0.000b 0.000 ± 0.000b 0.000 ± 0.000b 0.013 ± 0.012a 0.000 ± 0.000b 0.000 ± 0.000b 0.000 ± 0.000b 0.000 ± 0.000b 0.000 ± 0.000b 0.000 ± 0.000b 0.000 ± 0.000b 0.000 ± 0.000b
5-Hydroxymethylfurfural 0.057 ± 0.006ab 0.043 ± 0.006ab 0.027 ± 0.006bcd 0.030 ± 0.000bcd 0.017 ± 0.015de 0.033 ± 0.006bcd 0.037 ± 0.006bc 0.030 ± 0.000bcd 0.000 ± 0.000e 0.020 ± 0.000cd 0.020 ± 0.000cd 0.020 ± 0.000cd

Acta Innovations 2021 no. 41: 65-80 75
https://doi.org/10.32933/ActaInnovations.41.6 ISSN 2300-5599 2021 RIC Pro-Akademia – CC BY
Compound
Sample
Group I – craft beers Group II – industrial beers
A B C D E F G H I J K L
Linalyl iso-valerate 0.000 ± 0.000b 0.063 ± 0.006a 0.000 ± 0.000b 0.000 ± 0.000b 0.000 ± 0.000b 0.000 ± 0.000b 0.000 ± 0.000b 0.000 ± 0.000b 0.000 ± 0.000b 0.000 ± 0.000b 0.000 ± 0.000b 0.000 ± 0.000b
Phenethyl acetate 0.033 ± 0.006d 0.000 ± 0.000e 0.063 ± 0.006c 0.000 ± 0.000e 0.033 ± 0.006d 0.030 ± 0.000d 0.063 ± 0.006c 0.123 ± 0.006b 0.060 ± 0.000c 0.040 ± 0.000d 0.143 ± 0.006a 0.070 ± 0.000c
Ethyl pelargonate 0.000 ± 0.000b 0.034 ± 0.008a 0.000 ± 0.000b 0.000 ± 0.000b 0.000 ± 0.000b 0.000 ± 0.000b 0.000 ± 0.000b 0.000 ± 0.000b 0.000 ± 0.000b 0.000 ± 0.000b 0.000 ± 0.000b 0.000 ± 0.000b
2-Undecanol 0.000 ± 0.000b 0.049 ± 0.007a 0.000 ± 0.000b 0.000 ± 0.000b 0.000 ± 0.000b 0.000 ± 0.000b 0.000 ± 0.000b 0.000 ± 0.000b 0.000 ± 0.000b 0.000 ± 0.000b 0.000 ± 0.000b 0.000 ± 0.000b
Methyl geranate 0.000 ± 0.000b 0.126 ± 0.011a 0.000 ± 0.000b 0.000 ± 0.000b 0.000 ± 0.000b 0.000 ± 0.000b 0.000 ± 0.000b 0.000 ± 0.000b 0.000 ± 0.000b 0.000 ± 0.000b 0.000 ± 0.000b 0.000 ± 0.000b
Capric acid (Decanoic acid) 0.020 ± 0.000a 0.000 ± 0.000a 0.000 ± 0.000a 0.000 ± 0.000a 0.000 ± 0.000a 0.000 ± 0.000a 0.000 ± 0.000a 0.000 ± 0.000a 0.000 ± 0.000a 0.000 ± 0.000a 0.000 ± 0.000a 0.000 ± 0.000a
4-Decenoic acid. ethyl ester. (Z) 0.000 ± 0.000b 0.027 ± 0.006a 0.000 ± 0.000b 0.000 ± 0.000b 0.000 ± 0.000b 0.000 ± 0.000b 0.000 ± 0.000b 0.000 ± 0.000b 0.000 ± 0.000b 0.000 ± 0.000b 0.000 ± 0.000b 0.000 ± 0.000b
Ethyl caprate 0.073 ± 0.006c 0.137 ± 0.015b 0.047 ± 0.012cde 0.020 ± 0.000e 0.020 ± 0.000ef 0.043 ± 0.006de 0.000 ± 0.000f 0.030 ± 0.000de 0.197 ± 0.023a 0.047 ± 0.006cde 0.033 ± 0.006de 0.057 ± 0.006cd
Humulene 0.000 ± 0.000b 0.027 ± 0.006a 0.000 ± 0.000b 0.000 ± 0.000b 0.000 ± 0.000b 0.000 ± 0.000b 0.000 ± 0.000b 0.000 ± 0.000b 0.000 ± 0.000b 0.000 ± 0.000b 0.000 ± 0.000b 0.000 ± 0.000b
Values marked by different letters (a-i) within the same line differ significantly with a p value ≤ 0.05
Apart from ethanol that constituted the major volatile compounds, in all 12 samples the largest share in the profile belonged to two esters: ethyl acetate (2.63 – 5.06%) and isoamyl acetate (0.20 – 2.68%) as well as two alcohols: 3-methyl-1-butanol (3.94 – 6.41%) and 2-methyl-1-butanol (1.62 – 2.45%), which is also in accordance with findings reported in the literature [23,39]. Volatile esters give the beer fruity character, so in generic terms our results demonstrated that craft beers might be characterised by fruity flavours to a higher degree than industrial beers. Nevertheless, it should be highlighted that the industrial beers showed a greater presence of isoamyl acetate. This volatile ester is characterised by a „banana flavour”. The sample K of industrial beer featured also significantly higher ethyl acetate content in comparison to other beers (P < 0.05) (Table 3 on the basis of results received from [30]). In the case of that specific sample (K), it may be assumed that such results may have stemmed from the addition of sugar syrups being added to wort when high gravity brewing technology is implemented (information about the addition of sugar syrups was included on the label of the beer marked with K letter). It has previously been shown that high-gravity brewing (>16°Plato) is associated with disproportionate higher levels of esters, particularly ethyl acetate and isoamyl acetate [39]. According to the literature, many commercial brewing companies and only some large craft breweries use HGB [40]. The results of present study also share a few of similarities with Giannetti’s et. al. (2019) [5] and Giannetti’s et. al. (2018) [11] findings in terms of other esters being detected in craft and industrial beers. Similarly, 2-methylbutyl isobutyrate was not detected in any of the industrial beers studied, whereas it was detected in 3 out of 6 craft beers (samples A, B and D). Isobutyl isobutyrate was also detected only in those three samples of craft beers. There is evidence to support the hypothesis that those specific esters come from unique hop cultivars and contribute with a green apple, apricot-like flavour [41,42]. This implies that craft breweries use some special hop varieties, apparently not being used in industrial breweries. With respect to hop-derived volatile compounds attention should be also paid to terpenes introducing woody and spicy flavours. These kinds of volatiles (e.g. the terpene alcohol – linalool – forming the pleasant citrus and fruity notes [43])

Acta Innovations 2021 no. 41: 65-80 76
https://doi.org/10.32933/ActaInnovations.41.6 ISSN 2300-5599 2021 RIC Pro-Akademia – CC BY
was only detected in craft beers. Giannetti et. al. (2019) [5] have also found that phenethyl acetate (characterised by a rose-like flavour) is more concentrated in industrial beers, which is in good agreement with our findings (table 3). Also higher alcohols play a crucial role in the flavour of beer. Of particular importance is 2-phenylethanol characterised as possessing „rose flavour” [44]. In line with previous studies [5], the highest content of 2-phenylethanol was in the industrial beers (sample H and I), which made them have a better fragrance, taste and rose like aroma. Giannetti et. al. (2019) [5] noted that industrial beers featured a higher acids content. Our results do not seem to confirm their observation, since carboxylic acids identified, i.e. acetic acid, octanoic acid and decanoic acid were either present at significantly higher levels in the craft beers (P < 0.05) (acetic and octanoic acid – samples A, D, F) or were not detected in the industrial beers whatsoever (decanoic acid) (Table 3). The control of both acetic acid and octanoic acid production during brewing is crucial since at concentrations above their taste thresholds (200 and 5 ppm for Pilsener-style respectively) they impart off-flavour [45–47]. Acetic acid contributes with vinegary odour, whereas octanoic acid with rancid notes [47]. The level of carboxylic acids in beer is mostly contingent on the yeast strain, however, it was also shown that beers obtained with a low level of wort saturation with oxygen were characterised by exceeding contents of octanoic acid and consequently by rancid flavours [46]. Beer volatiles from the group of carbonyl compounds are ketones and aldehydes. According to the literature, some specific compounds such as furfural or 2,3-butanedione (diacetyl) may be considered important markers of beer flavour deterioration [11,17]. Furfural is formed during beer ageing by Maillard reaction [11,17]. It was found that the industrial beers did not contain furfural, whereas 3 out of 6 craft beers contained that substance (sample A, C, F). On the other hand, 2,3-butanedione was not detected in any sample of the beer analysed in the study. One of the main purposes of the study was to investigate whether the manufacturing scale affect dimethyl sulphide (DMS) content in the finished product. DMS was the only sulphur compound detected in the beers. Through the evaluation of average concentration, expressed in µg/l, of dimethyl sulphide, it is clear that the craft beers are characterised by a significantly higher content of DMS than industrial beers (P < 0.05) (Table 1 and 3, Figure 2f). DMS was not detected in 4 out of 6 industrial beers, whereas the volatile compounds profile of all the craft beers included the presence of DMS. Additionally, in the case of the samples C (136.3 µg/l) and D (137.5 µg/l) the concentrations of DMS exceeded the limit values (100 µg/l) established for lager beer [20,21]. Therefore, it may be assumed that DMS adversely affect the aroma of the beers C and D and may lead to undesirable flavour impressions, while drinking them by consumers. DMS concentration in beer is dependent on the wort boiling technology (vigour of the boil) as well as on the wort aeration level prior to fermentation.

Acta Innovations 2021 no. 41: 65-80 77
https://doi.org/10.32933/ActaInnovations.41.6 ISSN 2300-5599 2021 RIC Pro-Akademia – CC BY
Table 4. Comparison of obtained LRI values with literature data.
Compound RT average LRI calc LRI lit Literature
Acetaldehyde 4.73
Ethanol 5.41
Acetone 5.80
2-propanol 5.89
2-Nitroethanol 5.90
Ethyl formate 6.11
DMS 6.21
1-propanol 6.77
Acetic acid 7.24
Ethyl acetate 7.77
Isobutanol 8.05
1-butanol 8.79
3-Methyl-2-butanone 8.78
Methyl isobutyrate 9.27
Ethyl propionate 9.79 710 696 [25]
Propyl acetate 9.85 713
1-Butanol. 3-methyl- 10.32 735 718, 747 [25,26]
1-Butanol. 2-methyl- 10.41 739 728, 744, 744 [25,27,28]
2-Pentanone. 4-methyl- 10.49 743
Ethyl isobutyrate 10.82 759 756 [27]
Isobutyl acetate 11.14 774 776 [27]
Methyl isovalerate 11.23 778
2.3-Butanediol 11.28 780 796 [25]
Ethyl butanoate 11.70 800 806, 800 [25,27]
Furfural 12.61 842 829, 845 [27,29]
Butanoic acid. 2-methyl-. ethyl ester 12.78 850 846 [27]
Butanoic acid. 3-methyl-. ethyl ester 12.83 852 854 [27]
1-Hexanol 13.17 868 880, 880 [25,27]
Isoamyl acetate 13.33 876 876, 871 [27,29]
2-Methylbutyl acetate 13.39 878 877, 873 [19,29]
Isobutyl isobutyrate 14.17 914
Amyl propionate 15.43 970
β-Myrcene 16.00 996 988, 991 [19,29]
Ethyl caproate 16.01 997 996, 1000, 996, 1000, 1003 [25–29]
Butyl 2-methylbutyrate 16.18 1004
1-Hexyl acetate 16.31 1010 1006 [25]
Isobutyric acid. isopentyl ester 16.35 1012 1014 [29]
2-Methylbutyl isobutyrate 16.45 1017
Hexanoic acid. 4-methylene-. methyl ester 16.77 1031
Ethyl heptanoate 18.19 1096 1095, 1097, 1097, 1101 [25,27–29]
2-Nonanol 18.32 1102 1107, 1098, 1102, 1103 [25,27–29]
Linalool 18.44 1108
2-Phenylethanol 19.10 1138 1119, 1135, 1118, 1112, 1113 [25–29]
octanoic acid (Caprylic acid) 19.48 1156 1169, 1179, 1192, 1180 [26–29]
Ethyl caprylate 20.34 1196 1196, 1193, 1198, 1198, 1202 [25–29]
2-Decanol 20.49 1203 1211 [29]
α-Terpineol 20.84 1220 1195 [25]
5-Hydroxymethylfurfural 21.21 1238
Linalyl iso-valerate 21.75 1264
Phenethyl acetate 22.02 1277 1260, 1260, 1255, 1257 [25,27–29]
Ethyl pelargonate 22.41 1296 1295, 1297, 1296, 1297 [25,27–29]
2-Undecanol 22.60 1305 1309 [25]
Methyl geranate 23.17 1334 1320 [29]
Capric acid (Decanoic acid) 23.61 1356 1387, 1382, 1373, 1366 [25–28]
4-Decenoic acid. ethyl ester. (Z)- 24.16 1384
Ethyl caprate 24.39 1396 1396, 1391, 1398, 1395, 1398 [25–29]
Humulene 26.62 1515 1463, 1454 [26,29]

Acta Innovations 2021 no. 41: 65-80 78
https://doi.org/10.32933/ActaInnovations.41.6 ISSN 2300-5599 2021 RIC Pro-Akademia – CC BY
Impact The results might have significant implications for improving the chemical-technical quality control system in a craft brewery whereby it would be possible to provide an average consumer with a somewhat more standardised final product in terms of beer flavour and physicochemical attributes. The Introduction of gas chromatography techniques in a brewery for the purpose of controlling the quality of wort and beer might have a positive impact on the efficiency of the overall brewing process, owing to easier evaluation and quicker identification of the reasons for obtaining an undesirable beer volatile profile and subsequent modification of brewing technology (regulation and proper setting of specific technological parameters). Conclusions The conducted research has shown that the scale of production significantly affects the profile of volatile compounds and physicochemical parameters of the pale Pilsener-style lager beers. Therefore, it is concluded that there is a clear need to control the quality of Pilsener-style beers available on the market, produced both on an industrial and a craft scale. Headspace gas chromatography coupled to mass spectrometry (HS/GC-MS) is a powerful and accurate diagnostic tool for determination of beer flavour attributes, including detection of potential off-flavours. Conflict of interest There are no conflicts to declare. Acknowledgements The study was carried out as part of a research project “Design and Implementation of non-alcoholic gruit beer” (POIR.04.01.04-00-0099/19), financed by The National Centre for Research and Development. We would also like to thank the entire RIC Pro-Akademia team for their valuable guidance and support during the preparation of this article. References [1] A.O. Olaniran, L. Hiralal, M.P. Mokoena, B. Pillay, Flavour-active volatile compounds in beer: production,
regulation and control, J. Inst. Brew. 123 (2017) 13–23. https://doi.org/10.1002/jib.389. [2] K. Lutosławski, R. Olędzki, Ł. Kiebel, Jakość sensoryczna piw jasnych górnej fermentacji produkcji
domowej i komercyjnej, Pr. Nauk. Uniw. Ekon. We Wrocławiu. (2018) 77–89. https://doi.org/10.15611/pn.2018.542.06.
[3] Polskie Stowarzyszenie Browarów Rzemieślniczych, Raport z działalności browarów zrzeszonych w polskim stowarzyszeniu browarów rzemiślniczych w 2019 roku, 2020. https://psbr.eu/resources/PSBR_Raport6.7.pdf.
[4] B. Wojtyra, Ł. Grudzień, Rozwój przemysłu piwowarskiego w Polsce w okresie tzw. piwnej rewolucji w latach 2011–2016, Stud. Ind. Geogr. Comm. Polish Geogr. Soc. 31 (2017) 52–67. https://doi.org/10.24917/20801653.311.4.
[5] V. Giannetti, M. Boccacci Mariani, P. Torrelli, F. Marini, Flavour component analysis by HS-SPME/GC–MS and chemometric modeling to characterize Pilsner-style Lager craft beers, Microchem. J. 149 (2019). https://doi.org/10.1016/j.microc.2019.103991.
[6] W. Maszkowski, M. Wysokiński, Distribution of beer in micro and small breweries in Poland, Ann. Polish Assoc. Agric. Agribus. Econ. 19 (2018) 159–164. https://doi.org/10.5604/01.3001.0010.7922.
[7] M. Jesús Callejo, W. Tesfaye, M. Carmen González, A. Morata, Craft beers: current situation and future trends, in: New Adv. Ferment. Process., IntechOpen, 2020. https://doi.org/10.5772/intechopen.90006.
[8] A. Baiano, Craft beer: an overview, Compr. Rev. Food Sci. Food Saf. 20 (2021) 1829–1856. https://doi.org/10.1111/1541-4337.12693.
[9] T. Podeszwa, Craft brewing - the grassroots activity of micro-manufacturers as a stimulant for market development and self-improvement in the brewing industry, Acta Innov. 15 (2015) 51–56.
[10] Polskie Stowarzyszenie Browarów Rzemieślniczych, Browary rzemieślnicze - definicja, (2021). https://psbr.eu/.
[11] V. Giannetti, M. Boccacci Mariani, P. Torrelli, Characterization of craft beer through flavour component analysis by GC-MS and multivariate statistical tools, 2018.

Acta Innovations 2021 no. 41: 65-80 79
https://doi.org/10.32933/ActaInnovations.41.6 ISSN 2300-5599 2021 RIC Pro-Akademia – CC BY
https://iris.uniroma1.it/retrieve/handle/11573/1082939/629981/Giannetti et al_Beers.pdf. [12] R. Manelius, Beer flavor component analyses for small breweries, Turku University of Applied Sciences,
2017. https://www.theseus.fi/bitstream/handle/10024/133536/Manelius_Robin.pdf?sequence=4&isAllowed=y.
[13] K. Kucharczyk, T. Tuszyński, The effect of temperature on fermentation and beer volatiles at an industrial scale, J. Inst. Brew. 124 (2018) 230–235. https://doi.org/10.1002/jib.491.
[14] Z.H. Mohammad, C.C. Ray, J.A. Neal, G. Cordua, A. Corsi, S.A. Sirsat, Implications of temperature abuse on unpasteurized beer quality using organoleptic and chemical analyses, Foods. 9 (2020) 1032. https://doi.org/10.3390/foods9081032.
[15] A. Siwek, M.A. Stachelska, M. Dziadkowska, P. Karpiński, M.W. Obiedziński, Związki lotne w piwach wyprodukowanych z udziałem ryżu, Przem. Ferment. I Owocowo-Warzywny. 1 (2016) 10–12. https://doi.org/10.15199/64.2016.7-8.1.
[16] C. Boulton, Encyclopedia of brewing, John Wiley & Sons, Ltd, Oxford, UK, 2013. https://doi.org/10.1002/9781118598115.
[17] S. Rossi, V. Sileoni, G. Perretti, O. Marconi, Characterization of the volatile profiles of beer using headspace solid-phase microextraction and gas chromatography-mass spectrometry, J. Sci. Food Agric. 94 (2014) 919–928. https://doi.org/10.1002/jsfa.6336.
[18] L. Cao, G. Zhou, P. Guo, Y. Li, Influence of pasteurising intensity on beer flavour stability, J. Inst. Brew. 117 (2011) 587–592. https://doi.org/10.1002/j.2050-0416.2011.tb00508.x.
[19] C. Martins, A. Almeida, S.M. Rocha, Recent advances and challenges for beer volatile characterization based on gas chromatographic techniques, in: Atta-ur-Rahman, S.A. Ozkan, R. Ahmed (Eds.), Recent Adv. Anal. Tech., Bentham Science Publishers, 2017: pp. 141–199. https://doi.org/10.2174/97816810844731170101.
[20] K. Kucharczyk, K. Zyła, T. Tuszyński, Simultaneous optimization of acetaldehyde and DMS concentrations for better sensory quality of beer fermented on an industrial scale, Foods. 9 (2020) 1043. https://doi.org/10.3390/foods9081043.
[21] M. Baldus, P. Kreuschner, M. Hutzler, F.J. Methner, On the behaviour of dimethyl sulfoxide in the brewing process and its role as dimethyl sulfide precursor in beer, BrewingScience. 71 (2018). https://doi.org/10.23763/BrSc18-01baldus.
[22] K. Kucharczyk, T. Tuszyński, Obecność diacetylu i 2,3-pentanodionu w piwie, Zywność. Nauk. Technol. Jakość. 24 (2017) 17–26. https://doi.org/10.15193/zntj/2017/113/207.
[23] A. Siwek, M.A. Stachelska, A. Ekielski, T. Zelazinski, E. Sobolewska, P. Karpinski, J. Rozmierska, M.W. Obiedzinski, Analiza profilu związków lotnych w piwach wyprodukowanych z udziałem grysu kukurydzianego, Przem. Ferment. I Owocowo-Warzywny. 1 (2016) 22–24. https://doi.org/10.15199/64.2016.3.5.
[24] H.E. Anderson, I.C. Santos, Z.L. Hildenbrand, K.A. Schug, A review of the analytical methods used for beer ingredient and finished product analysis and quality control, Anal. Chim. Acta. 1085 (2019). https://doi.org/10.1016/j.aca.2019.07.061.
[25] C. Martins, T. Brandão, A. Almeida, S.M. Rocha, Enlarging Knowledge on Lager Beer Volatile Metabolites Using Multidimensional Gas Chromatography, Foods. 9 (2020). https://doi.org/10.3390/foods9091276.
[26] X. Ji, Comparative investigation of volatile components and bioactive compounds in beers by multivariate analysis, Flavour Fragr. J. 36 (2021). https://doi.org/10.1002/ffj.3649.
[27] K. Thompson Witrick, S. Duncan, K. Hurley, S. O’Keefe, Acid and volatiles of commercially-available lambic beers, Beverages. 3 (2017). https://doi.org/10.3390/beverages3040051.
[28] K. Witrick, E.R. Pitts, S.F. O’Keefe, Analysis of lambic beer volatiles during aging using gas chromatography–mass spectrometry (GCMS) and gas chromatography–olfactometry (GCO), Beverages. 6 (2020). https://doi.org/10.3390/beverages6020031.
[29] E. Trovato, A. Arigò, F. Vento, G. Micalizzi, P. Dugo, L. Mondello, Influence of citrus flavor addition in brewing process: characterization of the volatile and non-volatile profile to prevent frauds and adulterations, Separations. 8 (2021). https://doi.org/10.3390/separations8020018.
[30] TIBCO Software Inc., Statistica, (2017). [31] M.G. Amato, Sensory evaluation, in: O. Garrett (Ed.), Oxford Companion to Beer, Oxford University Press,
2011. https://doi.org/10.1093/acref/9780195367133.001.0001. [32] G. Van Doorn, J. Timora, S. Watson, C. Moore, C. Spence, The visual appearance of beer: a review
concerning visually-determined expectations and their consequences for perception, Food Res. Int. 126

Acta Innovations 2021 no. 41: 65-80 80
https://doi.org/10.32933/ActaInnovations.41.6 ISSN 2300-5599 2021 RIC Pro-Akademia – CC BY
(2019). https://doi.org/10.1016/j.foodres.2019.108661. [33] A. Poreda, A. Czarnik, M. Zdaniewicz, M. Jakubowski, P. Antkiewicz, Corn grist adjunct - application and
influence on the brewing process and beer quality, J. Inst. Brew. 120 (2014) 77–81. https://doi.org/10.1002/jib.115.
[34] V. Psota, Z. Skulilová, J. Hartmann, The effect of the barley variety, location and year crop on the haze of congress wort, Czech J. Food Sci. 27 (2009) 158–164. https://doi.org/10.17221/156/2008-CJFS.
[35] P.H. Chlup, real degree of fermentation (RDF), in: O. Garrett (Ed.), Oxford Companion to Beer, Oxford University Press, 2011. https://doi.org/10.1093/acref/9780195367133.001.0001.
[36] A. Andrade, E. Lima, L. Meirelles, Avaliação da rotulagem e qualidade de diferentes marcas de cerveja tipo pilsen, 2016. https://www.researchgate.net/publication/329100815.
[37] Rozporządzenie Parlamentu Europejskiego i Rady (UE) nr 1169/2011 z dnia 25 października 2011 r. w sprawie przekazywania konsumentom informacji na temat żywności, zmiany rozporządzeń Parlamentu Europejskiego i Rady (WE) nr 1924/2006 i (WE) nr 1925/2006, 2011.
[38] L.M. Tozetto, R.F. Do Nascimento, M.H. de Oliveira, J. Van Beik, M.H.G. Canteri, Production and physicochemical characterization of craft beer with ginger (Zingiber officinale), Food Sci. Technol. 39 (2019) 962–970. https://doi.org/10.1590/fst.16518.
[39] M.P. Piddocke, S. Kreisz, H.P. Heldt-Hansen, K.F. Nielsen, L. Olsson, Physiological characterization of brewer’s yeast in high-gravity beer fermentations with glucose or maltose syrups as adjuncts, Appl. Microbiol. Biotechnol. 84 (2009). https://doi.org/10.1007/s00253-009-1930-y.
[40] K. Villa, high gravity brewing, in: O. Garrett (Ed.), Oxford Companion to Beer, Oxford University Press, 2011. https://doi.org/10.1093/acref/9780195367133.001.0001.
[41] K. Takoi, M. Degueil, S. Shinkaruk, C. ThiBon, T. Kurihara, K. Toyoshima, K. Ito, B. Bennetau, D. Dubourdieu, T. Tominaga, Specific flavor compounds derived from nelson sauvin hop and synergy of these compounds, BrewingScience. 62 (2009) 108–118. https://www.researchgate.net/publication/261476079.
[42] K. Takoi, Y. Itoga, K. Koie, J. Takayanagi, T. Kaneko, T. Watanabe, I. Matsumoto, M. Nomura, Behaviour of hop-derived branched-chain esters during fermentation and unique characteristics of Huell Melon and Ekuanot (HBC366) Hops, BrewingScience. 71 (2018) 100–109. https://doi.org/10.23763/BrSc18-14takoi.
[43] T. Podeszwa, J. Harasym, New methods of hopping (dryhopping) and their impact on sensory properties of beer, Acta Innov. 79 (2016) 79–86.
[44] C. Li, G. Dong, M. Bian, X. Liu, J. Gong, J. Hao, W. Wang, K. Li, W. Ou, T. Xia, Brewing rich 2-phenylethanol beer from cassava and its producing metabolisms in yeast, J. Sci. Food Agric. 101 (2021) 4050–4058. https://doi.org/10.1002/jsfa.11040.
[45] Y. Zhang, S. Jia, W. Zhang, Predicting acetic acid content in the final beer using neural networks and support vector machine, J. Inst. Brew. 118 (2012) 361–367. https://doi.org/10.1002/jib.50.
[46] S. Engan, H. Bryggeri, Organoleptic threshold values of some organic acids in beer, J. Inst. Brew. 80 (1974) 162–163. https://onlinelibrary.wiley.com/doi/pdf/10.1002/j.2050-0416.1974.tb03598.x.
[47] K. Shale, J. Mukamugema, R.J. Lues, P. Venter, K.K. Mokoena, Characterisation of selected volatile organic compounds in Rwandan indigenous beer ‘Urwagwa’ by dynamic headspace gas chromatography-mass spectrometry, African J. Biotechnol. 12 (2013) 2990–2996. https://doi.org/10.5897/AJB12.1173.
Acta Innovations 2021 no. 41: 81 81
ISSN 2300-5599 2021 RIC Pro-Akademia – CC BY
THANKS TO OUTSTANDING REVIEWERS FOR ACTA INNOVATIONS IN 2021
We would like to take this opportunity to thank all of Acta Innovations’ reviewers for their significant contribution to Acta Innovations. Their work is essential for success of the journal as they act as sentinel of science and research. Prof. Zvjezdana Findrik Blažević, Croatia Prof. Dejan Bezbradica, Servia Prof. László Gubicza, Hungary Prof. Ning Sun, USA Prof. Sasisanker Padmanabhan, India Prof. Cecilia Wilfred, Malaysia Prof. Tiago Lopes, Portugal Prof. Arkadiusz Piwowar, Poland Prof. Sinead Mowlds, UK Prof. Naved Malek, India Prof. Imran Khan, Oman Prof. Indra Bahadur, South Africa Prof. María Luisa González San José, Spain Prof. Ajay Kumar Sharma, India Prof. Olga Shanina, Ukraine Prof. Ewa Kochanska, Poland Prof. Natallia V. Samankova, Belarusia Prof. Nina I. Myachikova, Russia Prof. Anatoly Sergeyevich Dudyrev, Russia Prof. Nataliia Revutska, Georgia Prof. Oleksandr Datsii, Ukraine Prof. Maciej Dzikuć, Poland Prof. Anill Kumar Patil, India Prof. Maciej Sibiński, Poland Prof. Sergii Bespalko, Poland Prof. Anish Gupta, India Prof. W A Wijewardena, Sri Lanka Prof. Yogesh K. Dwivedi, UK Prof. Olha Prokopenko, Estonia Prof. Niranjan S Janardhanan, UK Prof. Sunil Chamoli, India Prof. Romana Matskiv, Ukraine Prof. Valeriy Koroviy, Ukraine Prof. Bipin Kumar, India
Prof. Abhishek Gautam, India Prof. Daniela Millan, Chile Prof. Run‐Cang Sun, China Prof. Boelo Schuur, The Netherlands Prof. Peter Deuss, The Netherlands Prof. Amit Joshi, India Prof. K K Yogesha, India Prof. Shashi Kant Verma, India Prof. Rajesh Maithani, India Prof. Sunil Kumar, India Prof. Alex A. Sàez, Columbia Prof. Claudio Augusto Oller do Nascimento, Brazil Prof. Kehou Pan, China Prof. Ivan Pukhovyi, Ukraine Prof. Valentyn Petrenko, Ukraine Prof. Muhammad Waqas Satti, Pakistan Prof. Usman Ali, Pakistan Prof. Wuletaw Mekuria, Ethiopia Prof. Eshete Woretaw, Ethiopia Prof. Adugnae Abebe, Ethiopia Prof. Maksym Dubyna, Ukraine Prof. Igor Britchenko, Bulgaria Prof. Pattabi Thirumal, India Prof. Vakhtang Chkareuli, Georgia Prof. Iryna Bashynska, Ukraine Prof. Oleksandr Deineha, Ukraine Prof. Dmytro Stefanyshyn, Ukraine Prof. Oksana Kuchai, Ukraine Prof. Anil Kumar, India Prof. Rahul Bhauguna, India Prof. Halyna Matviienko, Ukraine Prof. Vitalii Lavruk, Ukraine Prof. Elena Rozmetova, Ukraine Prof. Sahaidak Mykhailo, Ukraine
We would also like to thank the Acta Innovations Editorial Board and Advisory Board and the Acta Innovations’ community for their continued support of the journal, as authors, reviewers and readers. Rafał Łukasik, Editor-in-Chief