Process Capacity: Evaluation and Optimization - Content ...
16
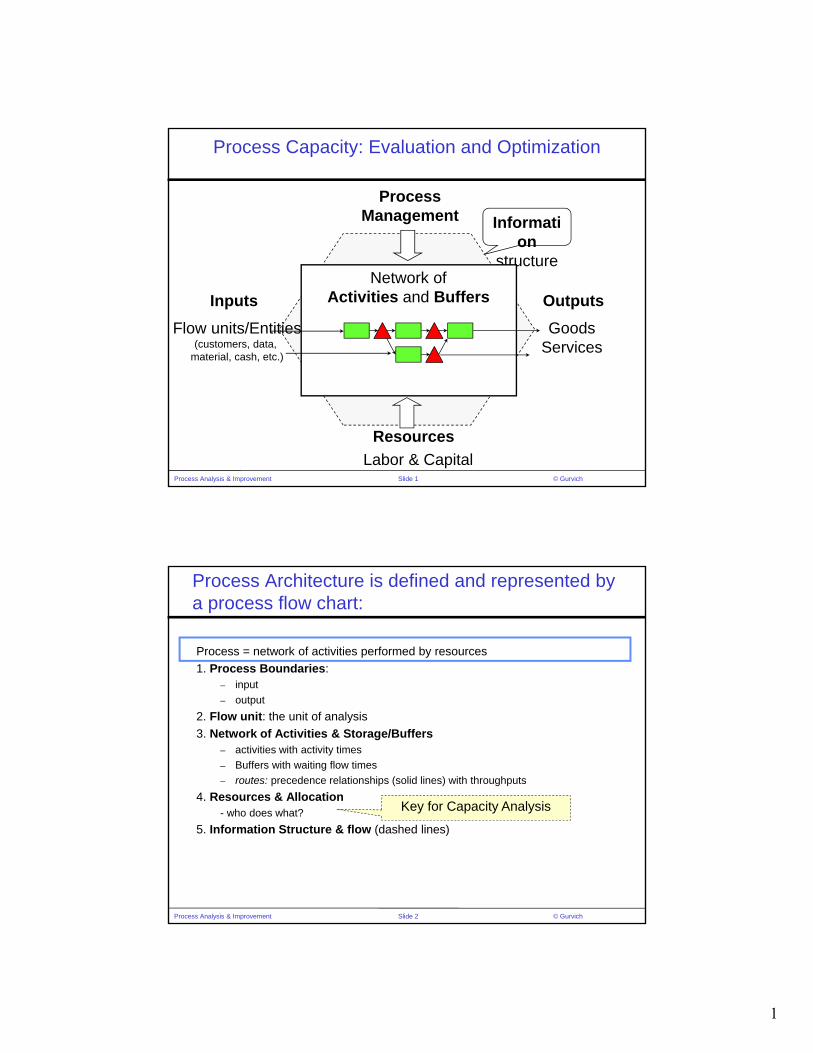
1 Slide 1 Process Analysis & Improvement © Gurvich Process Capacity: Evaluation and Optimization Informati on structure Outputs Goods Services Inputs Flow units/Entities (customers, data, material, cash, etc.) Labor & Capital Resources Process Management Network of Activities and Buffers Slide 2 Process Analysis & Improvement © Gurvich Process Architecture is defined and represented by a process flow chart: Process = network of activities performed by resources 1. Process Boundaries: – input – output 2. Flow unit: the unit of analysis 3. Network of Activities & Storage/Buffers – activities with activity times – Buffers with waiting flow times – routes: precedence relationships (solid lines) with throughputs 4. Resources & Allocation - who does what? 5. Information Structure & flow (dashed lines) Key for Capacity Analysis
-
Upload
khangminh22 -
Category
Documents
-
view
0 -
download
0
Transcript of Process Capacity: Evaluation and Optimization - Content ...
1
Slide 1Process Analysis & Improvement © Gurvich
Process Capacity: Evaluation and Optimization
Information
structure
Outputs
GoodsServices
Inputs
Flow units/Entities(customers, data,
material, cash, etc.)
Labor & Capital
Resources
ProcessManagement
Network ofActivities and Buffers
Slide 2Process Analysis & Improvement © Gurvich
Process Architecture is defined and represented by a process flow chart:
Process = network of activities performed by resources
1. Process Boundaries:– input
– output
2. Flow unit: the unit of analysis
3. Network of Activities & Storage/Buffers– activities with activity times
– Buffers with waiting flow times
– routes: precedence relationships (solid lines) with throughputs
4. Resources & Allocation- who does what?
5. Information Structure & flow (dashed lines)
Key for Capacity Analysis
2
Slide 3Process Analysis & Improvement © Gurvich
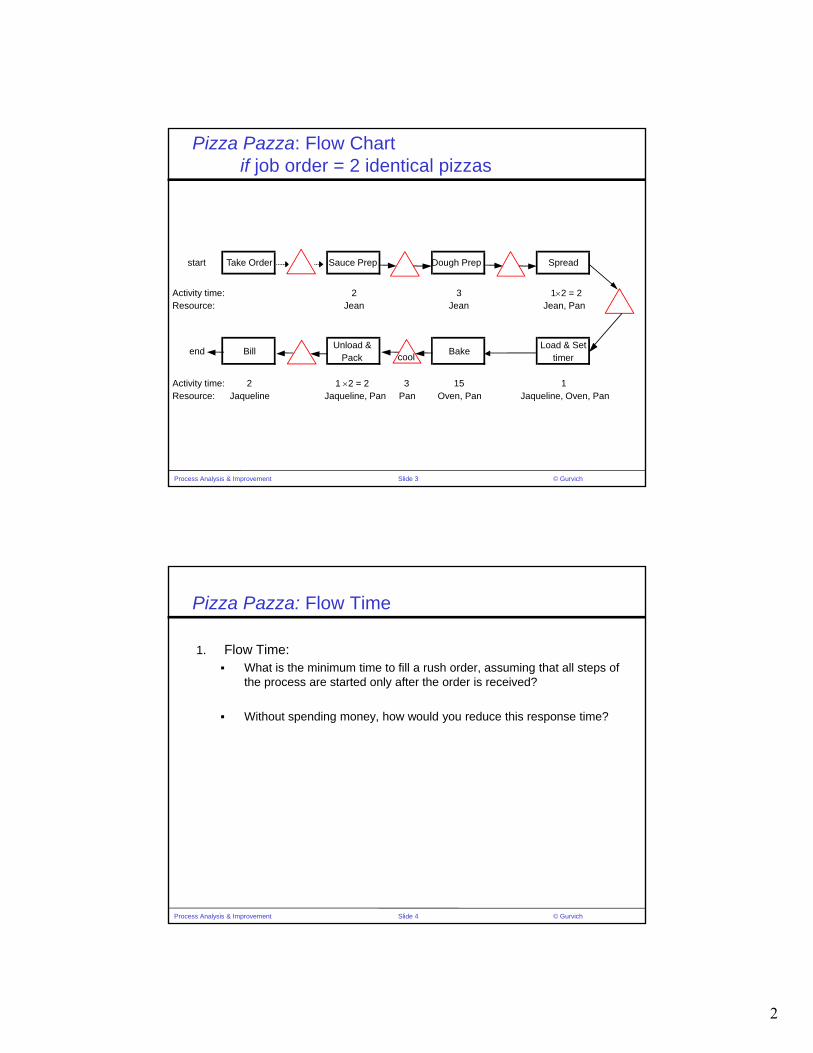
Pizza Pazza: Flow Chartif job order = 2 identical pizzas
start Take Order Sauce Prep Dough Prep Spread
Activity time: 2 3 12 = 2Resource: Jean Jean Jean, Pan
end BillUnload &
PackBake
Load & Set timer
Activity time: 2 1 2 = 2 3 15 1Resource: Jaqueline Jaqueline, Pan Pan Oven, Pan Jaqueline, Oven, Pan
cool
Slide 4Process Analysis & Improvement © Gurvich
Pizza Pazza: Flow Time
1. Flow Time: What is the minimum time to fill a rush order, assuming that all steps of
the process are started only after the order is received?
Without spending money, how would you reduce this response time?
3
Slide 5Process Analysis & Improvement © Gurvich
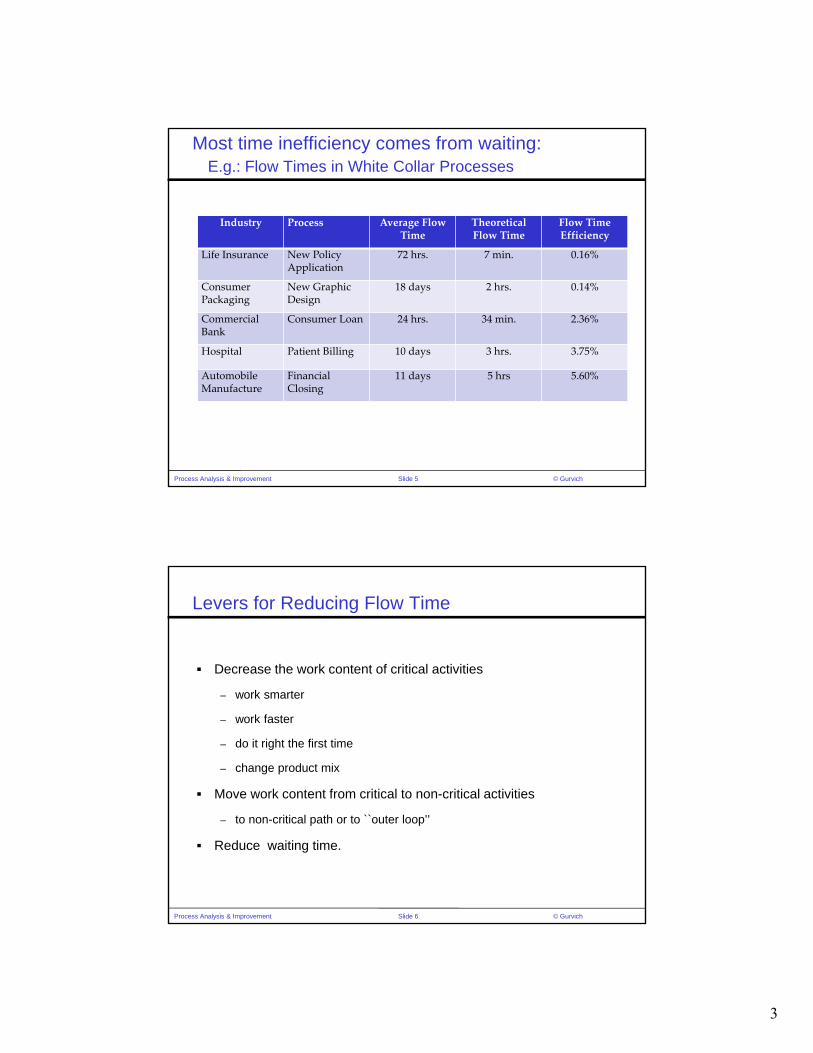
Most time inefficiency comes from waiting:E.g.: Flow Times in White Collar Processes
Industry Process Average Flow Time
Theoretical Flow Time
Flow Time Efficiency
Life Insurance New Policy Application
72 hrs. 7 min. 0.16%
Consumer Packaging
New Graphic Design
18 days 2 hrs. 0.14%
Commercial Bank
Consumer Loan 24 hrs. 34 min. 2.36%
Hospital Patient Billing 10 days 3 hrs. 3.75%
Automobile Manufacture
Financial Closing
11 days 5 hrs 5.60%
Slide 6Process Analysis & Improvement © Gurvich
Levers for Reducing Flow Time
Decrease the work content of critical activities
– work smarter
– work faster
– do it right the first time
– change product mix
Move work content from critical to non-critical activities
– to non-critical path or to ``outer loop’’
Reduce waiting time.
4
Slide 7Process Analysis & Improvement © Gurvich
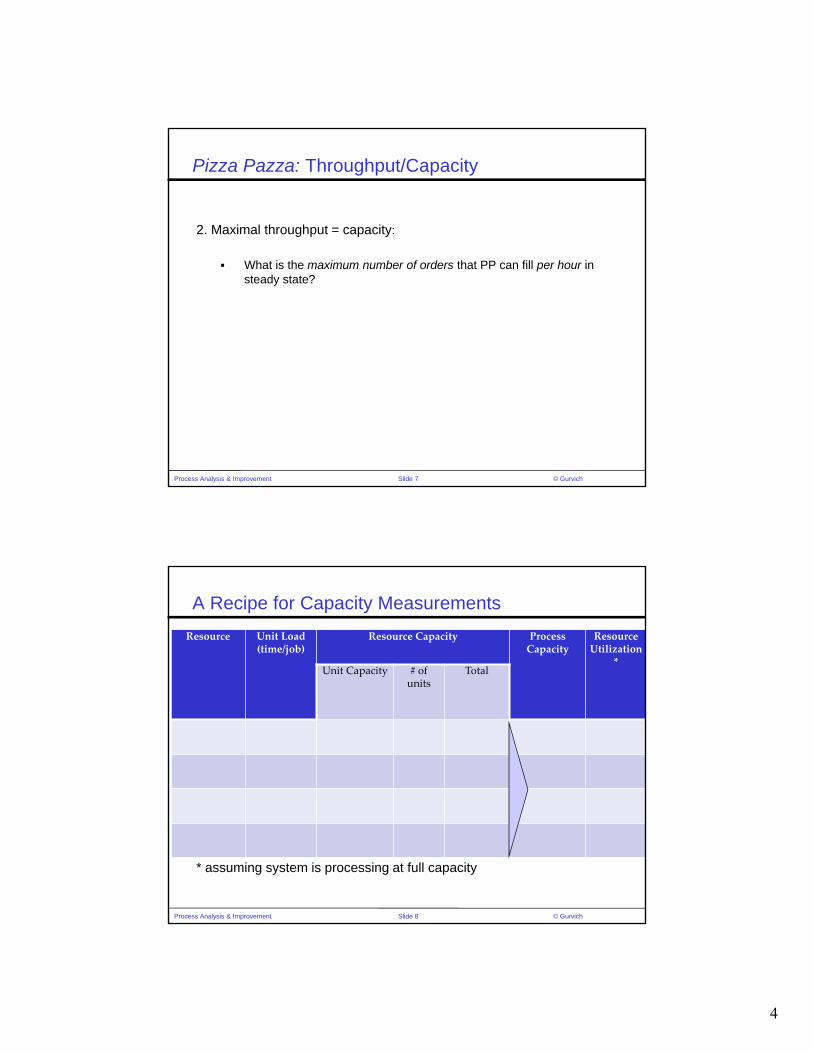
Pizza Pazza: Throughput/Capacity
2. Maximal throughput = capacity:
What is the maximum number of orders that PP can fill per hour in steady state?
Slide 8Process Analysis & Improvement © Gurvich
Resource Unit Load(time/job)
Resource Capacity ProcessCapacity
ResourceUtilization
*Unit Capacity # of
unitsTotal
A Recipe for Capacity Measurements
* assuming system is processing at full capacity

5
Slide 9Process Analysis & Improvement © Gurvich
Pizza Pazza: Let’s mathematize this
Slide 10Process Analysis & Improvement © Gurvich
Pizza Pazza: Flow Rate/Capacity Analysisif job order = 2 identical pizzas
2. What is the maximum number of orders that PP can fill per hour in steady state?
3. If the Jacqueline calls in sick one day, what is the maximum number of orders that PP can fill?
4. What is the minimum number of pizza pans needed to ensure that no order has to wait for a pan?
6
Slide 11Process Analysis & Improvement © Gurvich
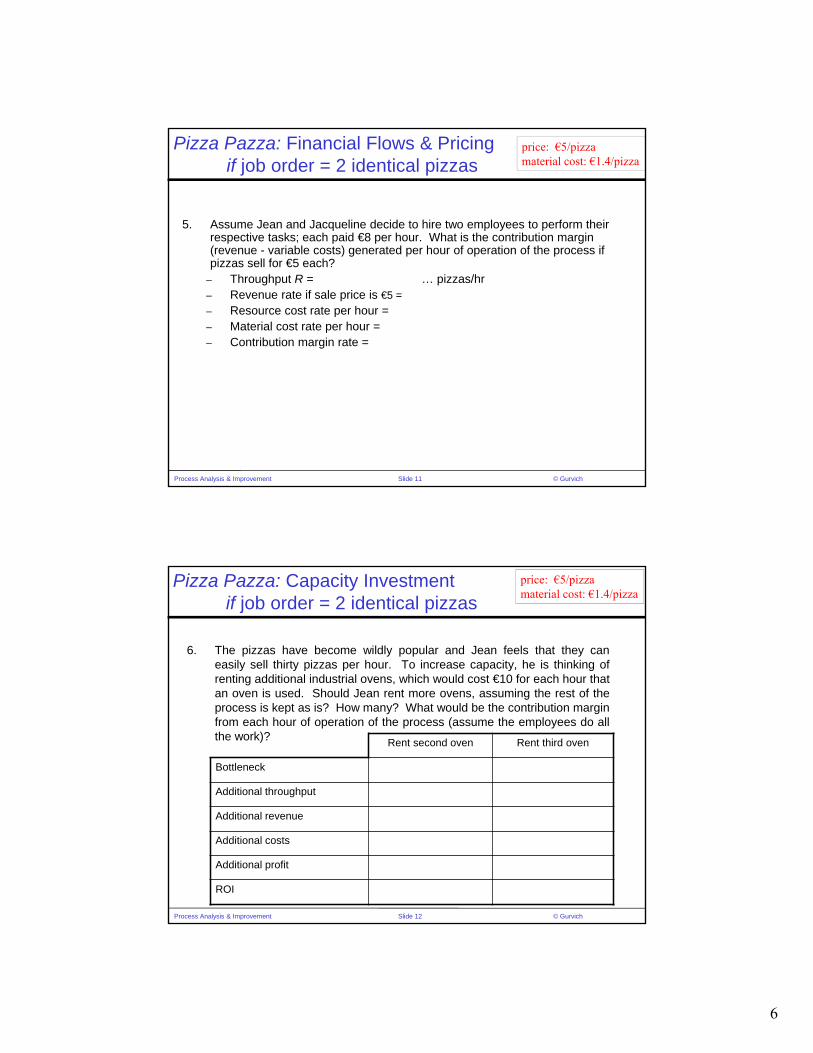
5. Assume Jean and Jacqueline decide to hire two employees to perform their respective tasks; each paid €8 per hour. What is the contribution margin (revenue - variable costs) generated per hour of operation of the process if pizzas sell for €5 each?
– Throughput R = … pizzas/hr– Revenue rate if sale price is €5 =
– Resource cost rate per hour =– Material cost rate per hour =– Contribution margin rate =
Pizza Pazza: Financial Flows & Pricingif job order = 2 identical pizzas
price: €5/pizzamaterial cost: €1.4/pizza
Slide 12Process Analysis & Improvement © Gurvich
6. The pizzas have become wildly popular and Jean feels that they caneasily sell thirty pizzas per hour. To increase capacity, he is thinking ofrenting additional industrial ovens, which would cost €10 for each hour thatan oven is used. Should Jean rent more ovens, assuming the rest of theprocess is kept as is? How many? What would be the contribution marginfrom each hour of operation of the process (assume the employees do allthe work)? Rent second oven Rent third oven
Bottleneck
Additional throughput
Additional revenue
Additional costs
Additional profit
ROI
Pizza Pazza: Capacity Investmentif job order = 2 identical pizzas
price: €5/pizzamaterial cost: €1.4/pizza
7
Slide 13Process Analysis & Improvement © Gurvich
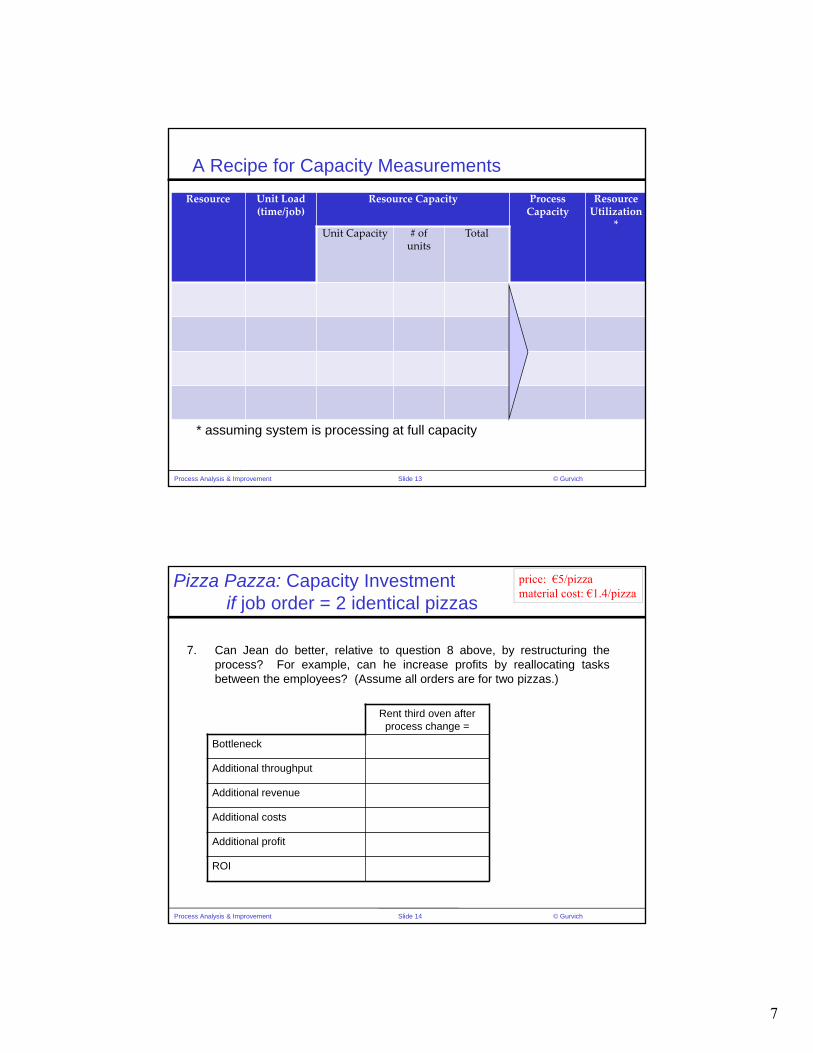
Resource Unit Load(time/job)
Resource Capacity ProcessCapacity
ResourceUtilization
*Unit Capacity # of
unitsTotal
A Recipe for Capacity Measurements
* assuming system is processing at full capacity
Slide 14Process Analysis & Improvement © Gurvich
7. Can Jean do better, relative to question 8 above, by restructuring theprocess? For example, can he increase profits by reallocating tasksbetween the employees? (Assume all orders are for two pizzas.)
Rent third oven after process change =
Bottleneck
Additional throughput
Additional revenue
Additional costs
Additional profit
ROI
Pizza Pazza: Capacity Investmentif job order = 2 identical pizzas
price: €5/pizzamaterial cost: €1.4/pizza
8
Slide 15Process Analysis & Improvement © Gurvich
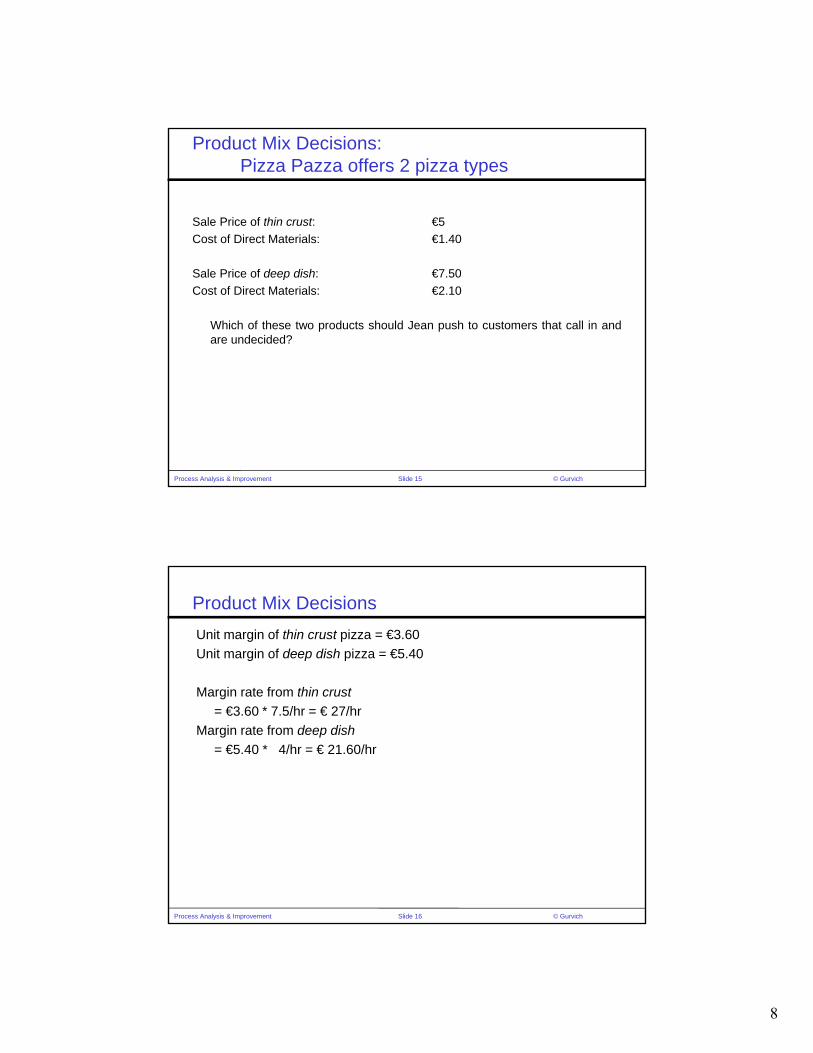
Product Mix Decisions:Pizza Pazza offers 2 pizza types
Sale Price of thin crust: €5
Cost of Direct Materials: €1.40
Sale Price of deep dish: €7.50
Cost of Direct Materials: €2.10
Which of these two products should Jean push to customers that call in andare undecided?
Slide 16Process Analysis & Improvement © Gurvich
Product Mix Decisions
Unit margin of thin crust pizza = €3.60
Unit margin of deep dish pizza = €5.40
Margin rate from thin crust
= €3.60 * 7.5/hr = € 27/hr
Margin rate from deep dish
= €5.40 * 4/hr = € 21.60/hr

9
Slide 17Process Analysis & Improvement © Gurvich
Solver Model for Optimal Product Mix Selection
xt: Number of thin crust pizzas sold.
xd: Number of deep dish pizzas sold.
Max 3.60 xt + 5.40 xd
subject to
16 xt + 25 xd < 1200
… < …
… < …
xt < 100
xd < 50
Technology/ResourceConstraints
Market/Demand Constraints
Assume we work 20 hrs = 1200min per week
Assume this is maximal weeklydemand
Slide 18Process Analysis & Improvement © Gurvich
Product mix: mathematize
10
Slide 19Process Analysis & Improvement © Gurvich
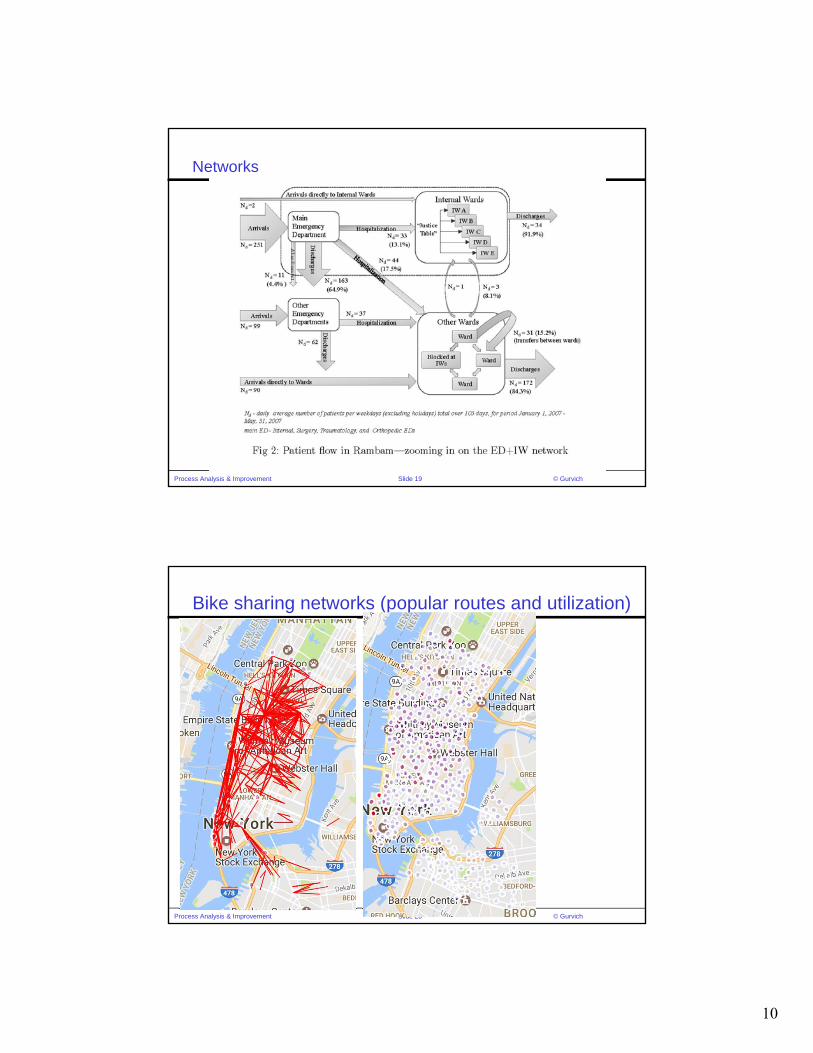
Networks
Slide 20Process Analysis & Improvement © Gurvich
Bike sharing networks (popular routes and utilization)
11
Slide 21Process Analysis & Improvement © Gurvich
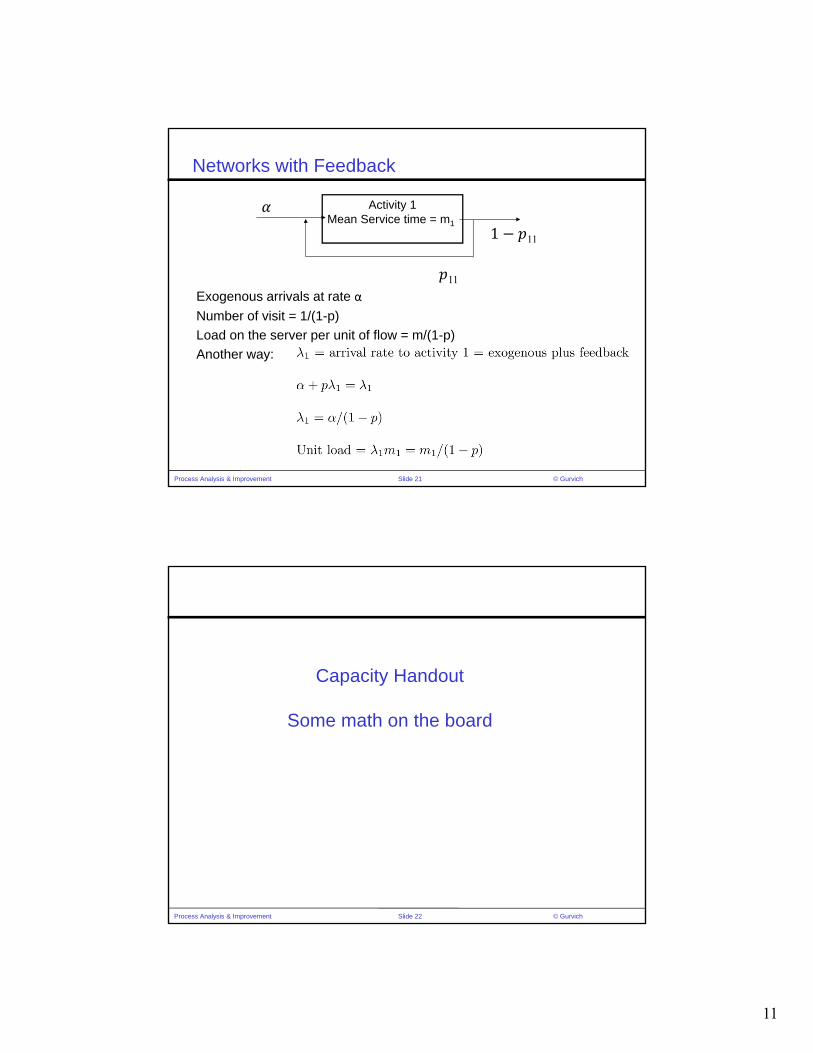
Networks with Feedback
Activity 1Mean Service time = m1
1 11
11
Exogenous arrivals at rate α
Number of visit = 1/(1-p)
Load on the server per unit of flow = m/(1-p)
Another way:
Slide 22Process Analysis & Improvement © Gurvich
Capacity Handout
Some math on the board
12
Slide 23Process Analysis & Improvement © Gurvich
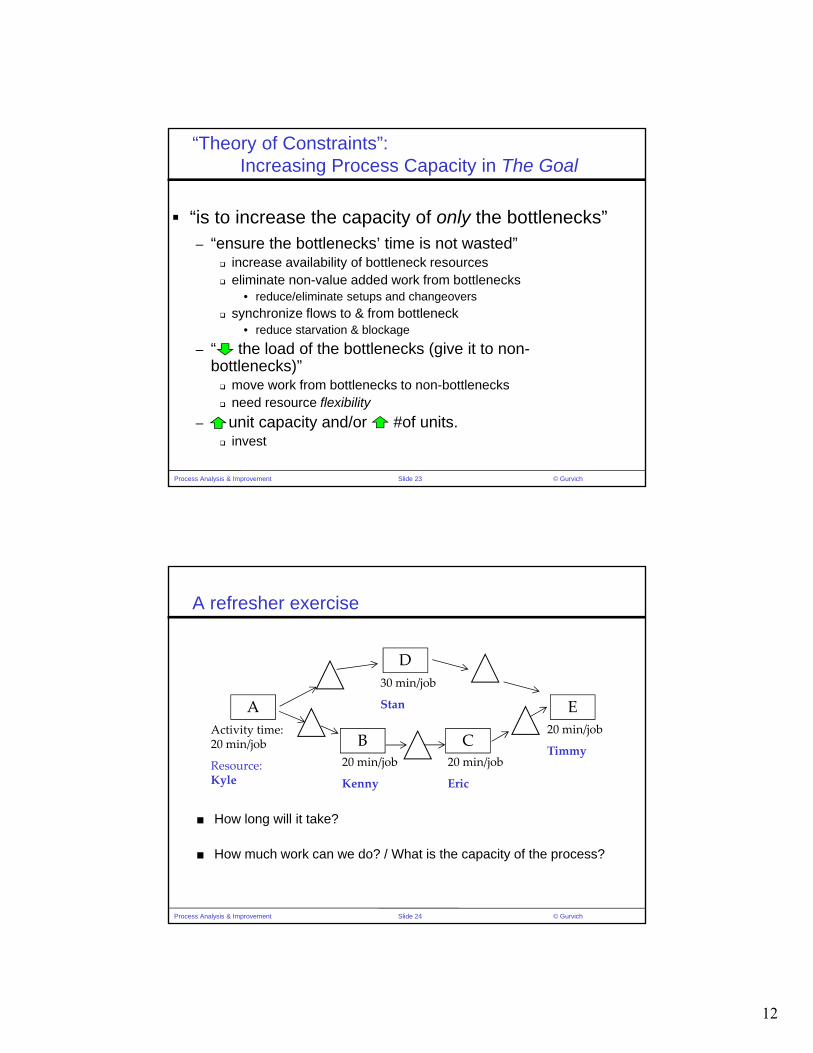
“Theory of Constraints”:Increasing Process Capacity in The Goal
“is to increase the capacity of only the bottlenecks”– “ensure the bottlenecks’ time is not wasted”
increase availability of bottleneck resources eliminate non-value added work from bottlenecks
• reduce/eliminate setups and changeovers
synchronize flows to & from bottleneck• reduce starvation & blockage
– “ the load of the bottlenecks (give it to non-bottlenecks)” move work from bottlenecks to non-bottlenecks need resource flexibility
– unit capacity and/or #of units. invest
Slide 24Process Analysis & Improvement © Gurvich
A refresher exercise
■ How long will it take?
■ How much work can we do? / What is the capacity of the process?
A
Activity time: 20 min/job
Resource: Kyle
D
30 min/job
Stan
B20 min/job
Kenny
C
E
20 min/job
Eric
20 min/job
Timmy
13
Slide 25Process Analysis & Improvement © Gurvich
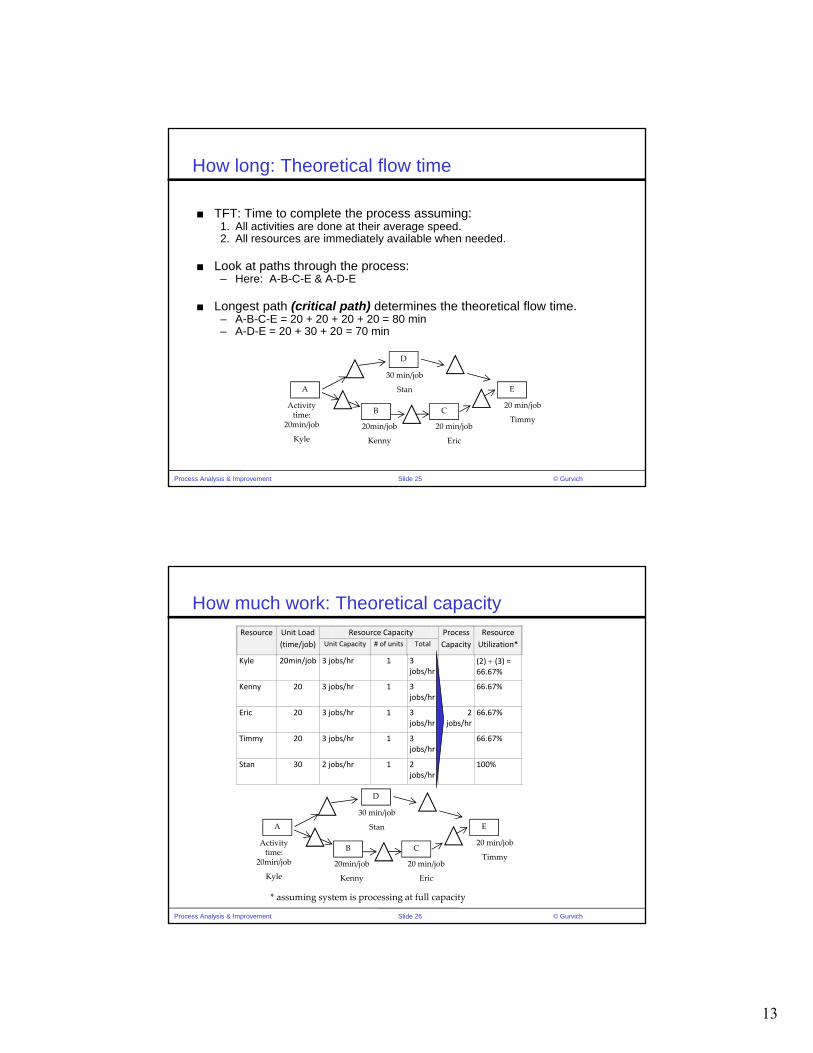
How long: Theoretical flow time
■ TFT: Time to complete the process assuming:1. All activities are done at their average speed.2. All resources are immediately available when needed.
■ Look at paths through the process:– Here: A-B-C-E & A-D-E
■ Longest path (critical path) determines the theoretical flow time.– A-B-C-E = 20 + 20 + 20 + 20 = 80 min– A-D-E = 20 + 30 + 20 = 70 min
A
Activity time:
20min/job
Kyle
D
30 min/job
Stan
B
20min/job
Kenny
C
E
20 min/job
Eric
20 min/job
Timmy
Slide 26Process Analysis & Improvement © Gurvich
How much work: Theoretical capacityResource Unit Load Resource Capacity Process Resource
(time/job) Unit Capacity # of units Total Capacity Utilization*
Kyle 20min/job 3 jobs/hr 1 3jobs/hr
(2) (3) = 66.67%
Kenny 20 3 jobs/hr 1 3jobs/hr
66.67%
Eric 20 3 jobs/hr 1 3jobs/hr
2jobs/hr
66.67%
Timmy 20 3 jobs/hr 1 3jobs/hr
66.67%
Stan 30 2 jobs/hr 1 2jobs/hr
100%
* assuming system is processing at full capacity
A
Activity time:
20min/job
Kyle
D
30 min/job
Stan
B
20min/job
Kenny
C
E
20 min/job
Eric
20 min/job
Timmy
14
Slide 27Process Analysis & Improvement © Gurvich
Process Changes: Impact on capacity and flow time
Process Change TFT Capacity
None
Reduce the average time for activity B by 5 mins
Kenny and Eric work in parallel
Reduce the average time for activity D(Stan) by 10 mins
Move 10 min’s work from Stan to Timmy
Kenny is fired and Kyle takes over
Slide 28Process Analysis & Improvement © Gurvich
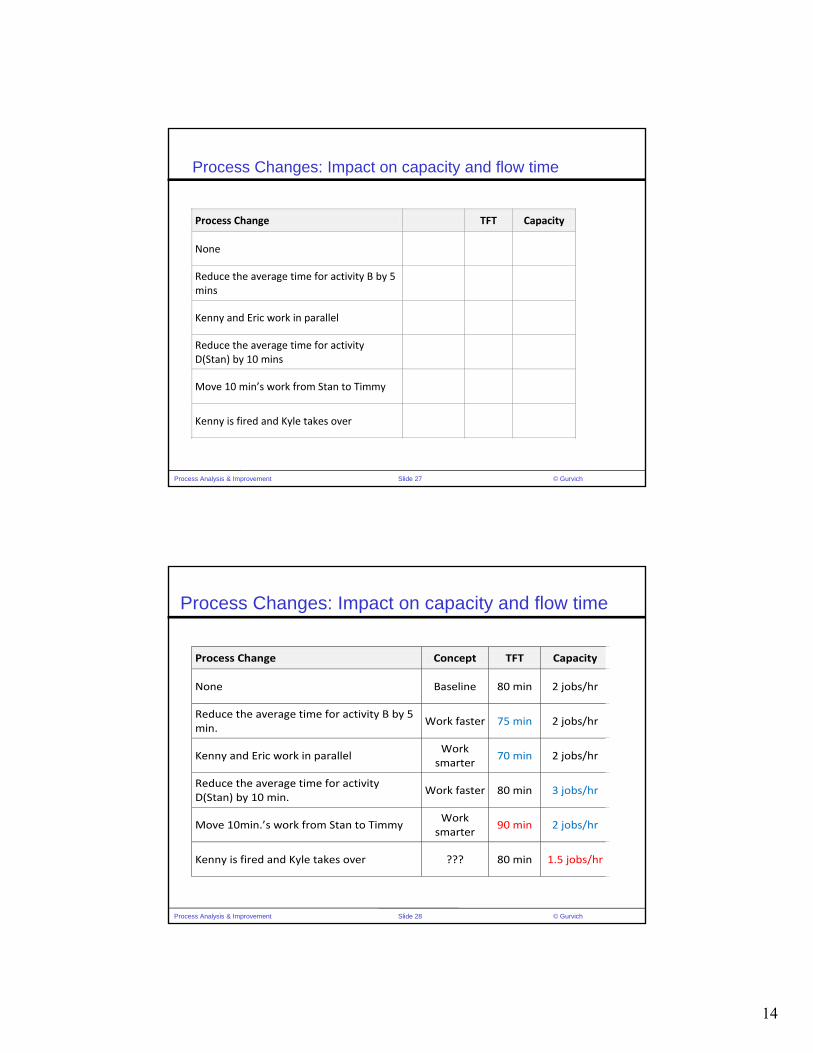
Process Changes: Impact on capacity and flow time
Process Change Concept TFT Capacity
None Baseline 80 min 2 jobs/hr
Reduce the average time for activity B by 5 min.
Work faster 75 min 2 jobs/hr
Kenny and Eric work in parallel Work smarter
70 min 2 jobs/hr
Reduce the average time for activity D(Stan) by 10 min.
Work faster 80 min 3 jobs/hr
Move 10min.’s work from Stan to Timmy Work smarter
90 min 2 jobs/hr
Kenny is fired and Kyle takes over ??? 80 min 1.5 jobs/hr
15
Slide 29Process Analysis & Improvement © Gurvich
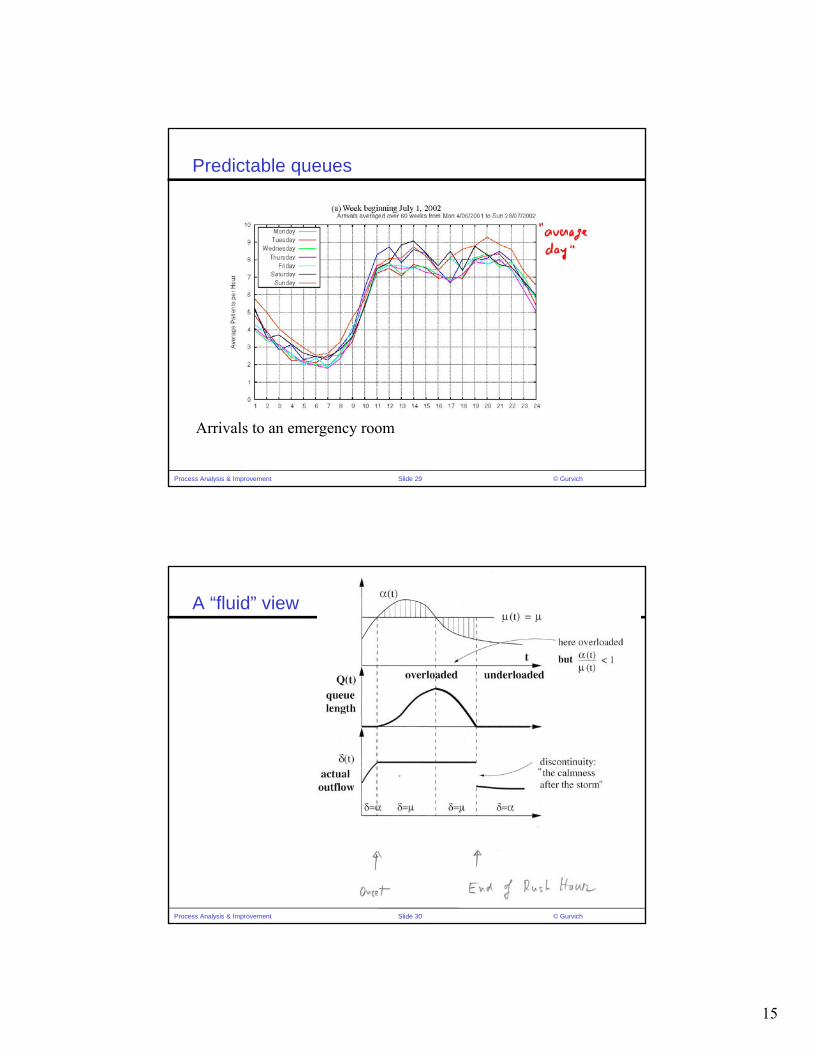
Predictable queues
Arrivals to an emergency room
Slide 30Process Analysis & Improvement © Gurvich
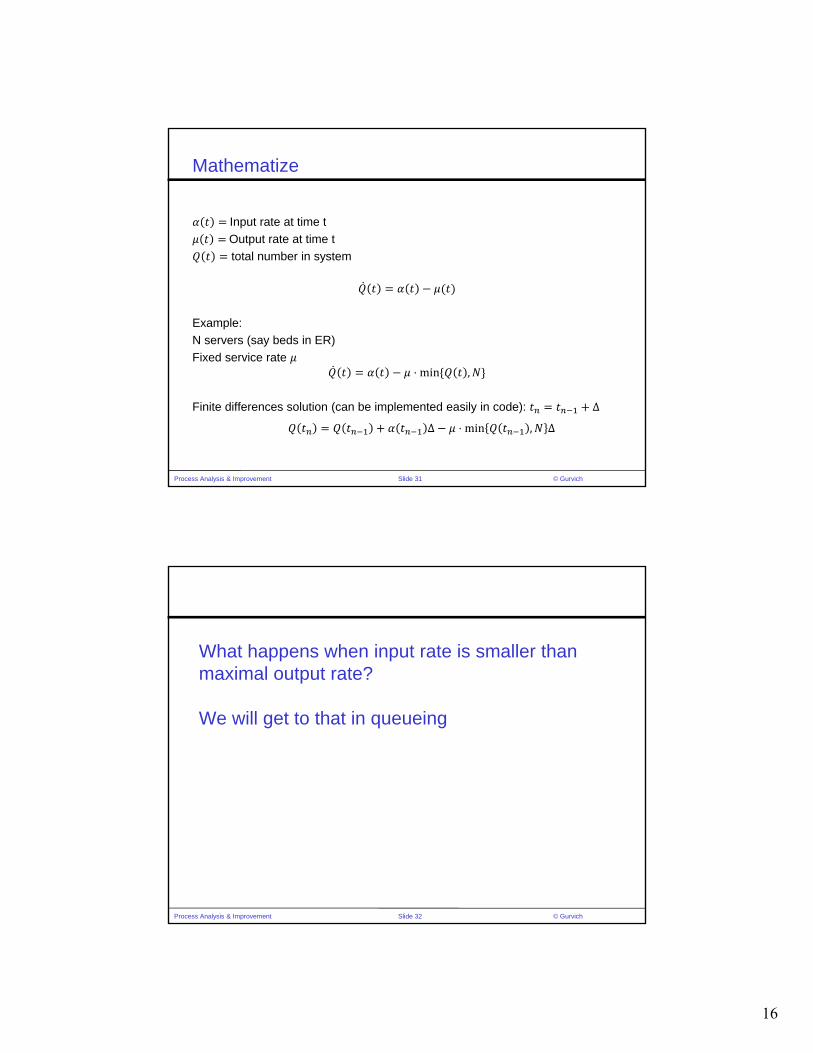
A “fluid” view
16
Slide 31Process Analysis & Improvement © Gurvich
Mathematize
Input rate at time t
Output rate at time t
total number in system
Example:
N servers (say beds in ER)
Fixed service rate ⋅ min ,
Finite differences solution (can be implemented easily in code): Δ
Δ ⋅ min , Δ
Slide 32Process Analysis & Improvement © Gurvich
What happens when input rate is smaller than maximal output rate?
We will get to that in queueing