Improvements to traceability for impedance measurements at RF
8
MEASUREMENT Impments to traceability for impedance measuments at RF in the UK by N. M. Ridler and J. C. Medley Knowing the impedance properties a circuit or device is afundamental requimentfor nearly all measuments. Howeve measuring these impedance properties to the required level accuracy can be a dcult task. This article describes new standards and techniques which have impved the quality the traceability services redfor these measurement requirements. The authors received the 1995 E Measurement Prizefor this work. Introduction T raceability to national measurement standards r electrical impedance at radio frequencies (RF) has historically been an area where the customer (i.e. UK science and technology) has been less than well-served. Before 1991, traceability was only available at three equencies-15 MHz, 100 MHz and 200 MHz-and was extremely time consuming in its implementation. For this reason, in the late 1980s the UK's National Physical Laboratory (NPL) initiated a programme of work aimed at improving the traceability service for its customers. The principle objectives of the work were to provide: (a) new primary national measurement standards (b) a traceability route to the standards, i.e. a measure- ment service, and (c) a coercily attractive service for NPs custo- mers. Consideration was also given to developing, as r as possible, generalised measurement techques which were independent of specialised instrumentation. This would have the additional advantage of the developed technology being readily transferable to other measurement laboratories, without degradation of performance. This article starts with an outline of the scope of the( research programme. A brief description of the measuring instruments used to provide access to the primary measurement standards is given before the primary standards themselves are discussed. Finally the accuracy (or uncertainty) assessment r the measurement system is looked at, leading to typical performance figures for the new measurement cility. Scope The scope of the work programme described in this article can be defined by examining individually some of the key words in the title. Impedance: The term 'impedance', when used in the context of electrical measurements at R can be applied to a wide range of measurement parameters which can be broadly grouped as either discrete circuit-element parameters or electromagnetic-wave parameters. Examples of discrete circuit-element parameters are: resistance, inductance and reactance; conductance, capacitance and susceptance; impedance and admittance (or, more generall immittance). Examples of electmagnetic-wave parameters where the impedance is implied are: voltage reflection coefficient (VRC), voltage standing-wave ratio (VSWR) and return loss. l these terms are related to each other and are used to demonstrate different electrical properties of RF electronic components. RF: The term 'RF' is less well-defined. It is used here to describe a equency range om about 100 kHz up to 3 GHz. For this region, the transmission medium in commonest use is coaxial line and measuring instruments, standards etc. are usually constructed with coaxial-connector interfaces. ENGINEERING SCIENCE AND EDUCATION JOURNAL FEBRUARY 1997 17
-
Upload
khangminh22 -
Category
Documents
-
view
1 -
download
0
Transcript of Improvements to traceability for impedance measurements at RF

MEASUREMENT
Improvements to traceability for impedance
measurements at RF in the UK
by N. M. Ridler and J. C. Medley
Knowing the impedance properties ef a circuit or device is a fundamental requirement for nearly
all RF measurements. However, measuring these impedance properties to the required level ef accuracy
can be a difficult task. This article describes new standards and techniques which have improved
the quality ef the traceability services C!lfered for these measurement requirements. The authors
received the 1995 IEE Measurement Prize for this work.
Introduction
Traceability to national measurement standards for electrical impedance at radio frequencies (RF) has historically been an area where the customer (i.e. UK science and technology) has
been less than well-served. Before 1991, traceability was only available at three frequencies-15 MHz, 100 MHz and 200 MHz-and was extremely time consuming in its implementation. For this reason, in the late 1980s the UK's National Physical Laboratory (NPL) initiated a programme of work aimed at improving the traceability service for its customers.
The principle objectives of the work were to provide:
(a) new primary national measurement standards(b) a traceability route to the standards, i.e. a measure
ment service, and(c) a commercially attractive service for NPL's custo
mers.
Consideration was also given to developing, as far as possible, generalised measurement techniques which were independent of specialised instrumentation. This would have the additional advantage of the developed technology being readily transferable to other measurement laboratories, without degradation of performance.
This article starts with an outline of the scope of the( research programme. A brief description of the measuring instruments used to provide access
to the primary measurement standards is given before the primary standards themselves are discussed. Finally the accuracy ( or uncertainty) assessment for the measurement system is looked at, leading to typical performance figures for the new measurement facility.
Scope
The scope of the work programme described in this article can be defined by examining individually some of the key words in the title.
Impedance: The term 'impedance', when used in the context of electrical measurements at RF, can be applied to a wide range of measurement parameters which can be broadly grouped as either discrete circuit-element parameters or electromagnetic-wave parameters. Examples of discrete circuit-element parameters are: resistance, inductance and reactance; conductance, capacitance and susceptance; impedance and admittance (or, more generally, immittance). Examples of electromagnetic-wave parameters where the impedance is implied are: voltage reflection coefficient (VRC), voltage standing-wave ratio (VSWR) and return loss. All these terms are related to each other and are used to demonstrate different electrical properties of RF electronic components.
RF: The term 'RF' is less well-defined. It is used here to describe a frequency range from about 100 kHz up to 3 GHz. For this region, the transmission medium in commonest use is coaxial line and measuring instruments, standards etc. are usually constructed with coaxial-connector interfaces.
ENGINEERING SCIENCE AND EDUCATION JOURNAL FEBRUARY 1997
17
MEASUREMENT
Coaxial lines come in a variety of sizes depending on application. The lines most c01mnonly used for precision measurements have a characteristic impedance of 50 ohms. For the highest precision measure1nents, 14 n1n1 ( these lines are usually specified by the inner diameter of the outer conductor) coaxial lines are used, whereas for more commercial applications
OET = detector
4
OUT = device under test
OUT
The scope of the work programme can now be stated clearly:
A facility providing measurements at the highest calibre at RF for components fitted with coaxial connectors to determine their impedance properties.
The term impedance is used generally here to indicate all the related
discussed the preferred size is 7 mm. For these reasons, the work programme concentrated
Fig. 1 Block diagram of a six-port reflectometer para1neters above.
initially on providing facilities in the 14 mm line size before developing these further to cater for 7 mm lines.
Ifoceability: Finally, the term 'traceability' has a formal definition1
• It is the property of the result of a measurement or a value of a standard whereby it can be related to stated references, usually national or international standards, through an unbroken chain of comparisons all having uncertainties. 'Improved traceability in the UK' implies enhanced access to UK national standards and (ultimately) the base quantities of the SI system-the international system of units.
(
(
85
) indicates coupled path
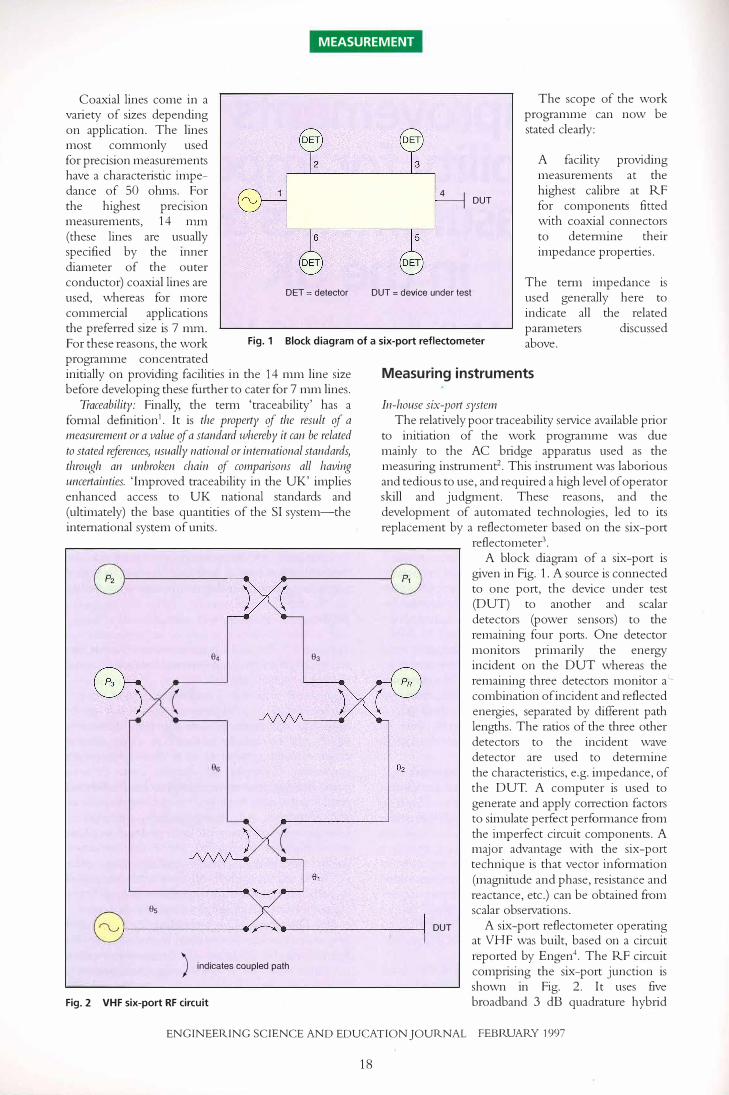
Fig. 2 VHF six-port RF circuit
83
Measuring instruments
In-house six-port systeni The relatively poor traceability service available prior
to initiation of the work programme was due mainly to the AC bridge apparatus used as the measuring instrument2
. This instrument was laborious and tedious to use, and required a high level of operator skill and judgment. These reasons, and the development of automated technologies, led to its replacement by a reflectometer based on the six-port
OUT
reflectometer3. A block diagram of a six-port is
given in Fig. 1. A source is connected to one port, the device under test (DUT) to another and scalar detectors (power sensors) to the remaining four ports. One detector monitors primarily the energy incident on the DUT whereas the remaining three detectors monitor a c combination of incident and reflected energies, separated by different path lengths. The ratios of the three other detectors to the incident wave detector are used to determine the characteristics, e.g. impedance, of the DUT. A computer is used to generate and apply correction factors to simulate perfect performance from the imperfect circuit components. A major advantage with the six-port technique is that vector information (magnitude and phase, resistance and reactance, etc.) can be obtained from scalar observations.
A six-port reflectometer operating at VHF was built, based on a circuit reported by Engen4
. The RF circuit comprising the six-port junction is shown in Fig. 2. It uses five broadband 3 dB quadrature hybrid
ENGINEERING SCIENCE AND EDUCATION JOURNAL FEBRUARY 1997
18

MEASUREMENT
couplers whose bandwidth is the limiting factor to the bandwidth of the six-port junction. The resistor symbols in Fig. 2 represent nominally matched 50 ohm loads. The signal path lengths, 8; (for i = 1 to 6), were adjusted during the instrument's development to ensure that only one of the detectors Pi, P2, P3 can ever approach zero signal at any one frequency over the entire range of operation, in this case 50 MHz to 250 MHz. These path lengths remain fixed when this criterion has been achieved.
It was found necessary to hermetically seal and temperature stabilise the couplers used for the six-port junction in order to achieve the desired stability for the system5• A temperature-controlled plate in contactwith the couplers was used to provide the temperature stabilisation-this is shown in Fig. 3.
A block diagram of the complete six-port system is given in Fig. 4 and a photograph of the system can be seen in Fig. 5 (which also shows a second, UHF, six-port). The computer controls all the instrumentation via the GPIB (general purpose interface bus). The computer screen also displays instructions for the operator to connect specific items (e.g. during calibration) or items' for measurement.
Thermistors are used as the detectors because of their extremely good linearity. PR is the incident, or reference, detector and Pi, P2 and A sample the combined incident and reflected signals. Two digital voltmeters (DVMs) are used to convert the analogue indications of the power meters into digital readings capable of being read by the computer. The switching of signal paths from the various power meters to the DVMs is performed by a multiplexer. A detailed description of the complete instrument can be found in Reference 6.
_/'
Commercial network analysers
Fig. 3 Photograph showing the six-port circuit comprising RF couplers surrounding the temperaturecontrolled plate
Commercial automatic network analysers (ANAs) are in general not based on the six-port technology (a notable exception is the Marconi 6210 reflection analyser7). Instead, each measurement port of the ANAis the test port of a 'four-port' reflectometer, with the remaining reflectometer ports connected to the source and two vector detectors. Vector detection is achieved using a heterodyne system, in which signals are converted to an intermediate frequency (IF) in such a way that relative magnitudes and phases are maintained.
However, despite their differences in construction, the calibration procedures employed on six-ports and
six-port junction
multiplexer
computer
digital voltmeters
OUT
Fig. 4 Block diagram of the VHF six-port instrumentation
ENGINEERING SCIENCE AND EDUCATION JOURNAL FEBRUARY 1997
19

MEASUREMENT
Fig. 5 The complete six-port system, including instrumentation
ANAs are very similar. With the data obtained by measurement of suitable devices, the six-port can be mathematically reduced to an equivalent four-port reflectometer8, after which identical routines can be applied to the two systems. This has meant that the majority of the software written to process the six-port measurement data and implement the accuracy assessment techniques (described later) can also be applied to data from ANAs.
Initial work concentrated on applying the software to data generated by an HP8753 ANA9, shown inFig. 6. It was found that, under normal circumstances, both six-port and commercial ANA systems produced similar levels of accuracy, implying that either system could be used for customer measurements. It was also encouraging to find measuring instruments based on different operating principles producing similar results
Fig. 6 The commercial ANA system evaluated during the work programme
for a measured parameter. Subsequent work using HP8510 and HP8751 ANAs has verified the technique up to 8·5 GHz10 and down to 100 kHz11
.
The accuracy assessments applied to both the sixport system and the commercial ANAs revealed that a detailed knowledge, and careful design, of the calibration items (i.e. primary standards) for the instruments was essential to ensure that optimum performance was obtained from the systems.
Primary standards
The characterising equation for a reflectometer (sixport or commercial ANA) can be expressed as follows:
w
AI'+B
er+ 1
ENGINEERING SCIENCE AND EDUCATION JOURNAL FEBRUARY 1997
20

I MEASUREMENT
where I' is the reflection coefficient of the DUT, w is the indication given by the reflectometer, and A, B, C are frequency-dependent coefficients, or 'calibration constants' .
Calibration is the process by which these three constants are determined. The conventional method of determination is to connect three ( calibration) items with known characteristics to provide three values of I'and observe the corresponding three indications w.
This leads to three complex simultaneous equations which can be solved for A, B and C. However, the physical characteristics of any artefact can never be known exactly. The departure from ideal in the characteristics of a calibration item produces an error in the determination of the calibration constants, i.e. an error in the instrument's calibration, which causes a subsequent error in the instrument's measurements. This problem is minimised by using calibration items which are s1mple structures with properties that can be accurately calculated by reference to fundamental electromagnetic theory.
At higher (microwave) frequencies, lengths of precision transmission line are used as primary standards for impedance measurements. Similar lines are used at RF, usually terminated with a short-circuit to provide a known phase change with respect to a 'flush' short-circuit (i.e. one connected directly at the instrument test port reference plane). Using two different lengths of short-circuited line in conjunction with the flush short-circuit provides the necessary three calibration items with the desired properties, i.e. simple structures with calculable behaviour.
This works well at microwave frequencies, where sufficiently different lengths of precision line to produce adequate phase differences can be manufactured. However, at VHF, due to the comparatively longer wavelength, this is no longer the case. Inadequate phase separation between the calibration standards (the offset short-circuits) produces erratic calibration and hence erratic system performance.
This problem has been minimised by introducing a new type of primary standard: the calculable opencircuit standard (see Fig. 7). Since there is an inherent phase difference of 180° between open- and shortcircuits, the two types of standard can be used in conjunction with each other, with adequate phase separation, to much lower frequencies (the complete VHF region). Fabrication details for calculable opencircuits in 14 mm coaxial line have been given in Reference 12, and in 7 mm coaxial line in Reference 13. The discontinuity capacitance caused by thetruncated inner of the coaxial line has been calculatedby Hodgetts14 and verified at VHF using a computerintensive equivalent-circuit technique15
.
Extending the use of precision lines to these relatively low frequencies introduces additional problems relating to skin depth effects that are not encountered at microwave frequencies. Skin depth refers to the tendency for electromagnetic waves to penetrate the walls of conductors to an increasing
Fig. 7 Open-circuit primary impedance standards
extent at low frequency. Manufacturers of precision lines attempt to minimise skin depth effects by producing conductors with a high conductivity. One approach is to plate brass (for strength, durability etc.) lines with a conduction layer (approximately 25 microns) of silver. This corresponds approximately with the maximum skin depth for electromagnetic waves in silver at VHF. However, silver tarnishes easily,
so a gold 'flashing' (of submicron thickness) is applied to the silver surfaces of the lines. The constitution of the resulting .multilayered line is shown in Fig. 8. Models, based on work carried out by Faraday Proctor 16
, were used to derive conductivity values for the composite lines; these models were verified by comparison with attenuation measurements made on the lines 17.
Fig. 8 Multilayered, high-conductivity lines are used as primary impedance standards
ENGINEERING SCIENCE AND EDUCATION JOURNAL FEBRUARY 1997
21

MEASUREMENT
Finally, at lower RF (i.e. below 30 MHz, where wavelengths are greater than 10 m) precision offset short-circuited lines could no longer be used in conjunction with the flush short-circuit. Instead, a precision, near-matched load with predicted reflection is used in conjunction with the calculable open-circuit and the flush short-circuit as calibration standards.
The reflection of the near-matched load is predicted from the load's pe1formance at VHF and DC. The VHF impedance measurements are made using the reflectometer (six-port or commercial ANA), calibrated with respect to the open- and short-circuited transmission lines, and the DC measurement (resistance only, since the reactance is zero, by definition) is made using an ohmmeter with traceability to the national DC resistance standard. Initially, an equivalent-circuit model derived from the measurement data was used to predict the load's performance at the intermediate frequencies 1 8. However, an alternative technique based on interpolation has since been adopted due to its versatility in application 11 .
Accuracy assessment
Having developed measuring instruments, calibration standards and a generalised measurement technique (allowing the calibration standards to be used, in principle, on any vector reflectometer), the next step in the work programme was to evaluate the accuracy, or uncertainty, for the overall system.
The accuracy of a measurement system is usually affected by a number of contributions: instrument
Fig. 9 Diagram in perspective representing the uncertainty profile over the reflection coefficient plane at VHF
uncertainty profile
at UHF
Fig. 10 Similar diagram to Fig. 9 showing the uncertainty profile at UHF
stability and noise floor; ability to characterise the properties of the calibration standards; quality of the DUTs, etc. Each contribution needs to be evaluated and combined to give an overall pe1formance figure, or uncertainty statement, for the system.
Generally, errors in a measurement system are random or systematic ( or both) in nature. This often affects the methods used to quantify the errors. For example, rand01n errors-noise, connection repeatability (of both the DUT and the calibration items)are usually treated statistically. This is done with this system by performing a number of repeated calibrations and measurements (usually ten). The effects of the random errors on the measurements will be exhibited in the variations seen in the different calibrations and different measurements.
International recommendations for the treatment of random errors (and more generally for the evaluation of the uncertainty in measurement) have recently been published 19. Generally, these have been followed for theevaluation of uncertainty in this system. However, a recent development11 has introduced robust statistical techniques for the evaluation of the random effects in the measurement process. These new procedures produce more efficient uncertainty intervals when gross errors (which can occasionally occur) are observed.
Systematic errors in the measurement results are predominantly due to errors in the parameters used to characterise the measuren1ent system, such as imprecise knowledge of the properties of the calibration standards. For example, the cross-sectional dimensions of the precision line standards will deviate to some extent from their ideal values due to manufacturing imperfections. These deviations affect the properties of
ENGINEERING SCIENCE AND EDUCATION JOURNAL FEBRUARY 1997
22

MEASUREMENT
the lines, which in turn affect the calculation of the calibration constants for the system, leading ultimately to errors in
Table 1: Summary capability for the new measuring system
Reflection coefficient uncertainty (95% confidence limit)
the measurements made using the system. The probable error limits are evaluated
for each of the parameters used to characterise the measurement system. This is then translated into the effect each error
Frequency range best case worst case matched load
VHF
UHF
has on the measurements made by the system. For example, the cross-sectional dimensions of the precision line standards are n1easured using an airgauging system, as described by Ide20
. This system allows continuous measurement of the diameters of the lines as a function of longitudinal length and axial rotation. The maximum deviations from ideal are then input into the computer programme used to calculate the results of the measurement system, i.e. the impedance of a DUT. The observed change in the result of the measurement system is related directly to the measured error in the precision line standard.
This technique is used for all the systematic error components affecting the measurement system. In addition to the cross-sectional dimensions of the line standards, these include assumptions about: the lengths of the line standards; the conductivity of the line standards; laboratory environmental conditions (temperature, humidity etc.); the model for the opencircuit calibration items; and RF source accuracy. A detailed description of the methods used to evaluate these contributions (together with more detailed information concerning the uncertainty evaluation process) is given in Reference 21.
The resulting overall uncertainty for the measure-
0-203
0-201 -
Q) ·o -Q)
! II II
11 II II
0
11
0
0-199 ()
0
Q)
� 0-197
0-195
-.:I" -.:I" LO c.o c.o c.o I"- I"-co co co co co � co co C\i
� � .,f
$cry 0)
Cl) ....J I cb ....J (_) ro C\J 0 I- 2
Cl) a: z cb a: w0
> z I- ci5a.. (_)
-
II
0-0005
0-0015
0-0016 0-0008
0-0030 0-0015
ment system is evaluated individually for each result produced by the system. This is because the uncertainty varies according to the frequency of the measurement as well as the impedance ( or reflection coefficient) of the DUT. Exploring the uncertainties produced over the entire reflection coefficient plane gives rise to a profile of uncertainty which can be represented by a surface in three dimensions. This is shown in Fig. 9 (for the VHF region) and Fig. 10 (for the UHF region), where the height above the reflection coefficient plane at any point is proportional to the measurement uncertainty. This information is summarised in Table 1, which gives best-case and worst-case uncertainties, along with a value for a matched load (nominally zero reflection coefficient), at VHF and UHF
International harmonisation
An important aspect of a national measurement standard is its harmonisation with other national standards in countries throughout the world. This ensures that measurements made in these countries have a common, equivalent basis. Such harmonisation is best demonstrated by an international measurement comparison exercise in which national laboratories
-
---
-0 II 0
II II
0
WR150/0-5 GHz
I"- 0) 0 0
� C\J
co co 0) 0) 0) 0) C\i ci .,f ci
� 0) �
0) ·2 ....J c.o ::::,
zLO
2 a.. cb
2 -.:I" cb z I-Cl) cb I- z a..(_) I- a.. Cl)
Fig. 11 Results obtained during an international measurement comparison exercise. The result produced by the NPL measuring system is second from the right
ENGINEERING SCIENCE AND EDUCATION JOURNAL FEBRUARY 1997
23

MEASUREMENT
measure a range of values (items) for a given physical quantity.
Having implemented the new national standard measurement facility for impedance in the UK ( as described in this article), it was decided to participate in an appropriate international comparison exercise. An exercise was chosen which had begun in 1984 (it was completed in 1993). Eleven national laboratories participated by measuring the impedance properties (reflection coefficient) of five terminations with contrasting impedance values at O· 5 GHz, 3 GHz and 7 GHz. (The RF calibration technique was extended to 7 GHz using two offset open-circuits in conjunction with the flush short-circuit.)
The results for the new UK facility showed excellent agreement with the results supplied by the other national laboratories, demonstrating the required harmonisation of this system with other national facilities. The uncertainties for the new system were amongst the lowest reported in the exercise, demonstrating a very-high-calibre measurement facility. As an example, Fig. 11 shows the results obtained for the reflection coefficient magnitude measurement of a mismatch termination (nominally 1 · 5 VSWR) at 0·5 GHz. This graph is typical of the results obtained in the exercise. It was taken from Reference 22, which contains a detailed report of the measurement
. .
companson exercise.
Conclusions
This article has discussed the recent improvements made in the UK for the traceability of impedance measurements at RF. The improvements have involved introducing new measuring instruments (with new measurement techniques), new primary national standards and generalised uncertainty evaluation techniques.
The resulting performance of the new capability is impressive: multi-octave frequency coverage (from 100 kHz to 3 GHz, also extending to 8·5 GHz); measurement periods reduced by several orders of magnitude compared with earlier techniques; and typical discrimination of 62 dB return loss (for matched loads at VHF).
Acknowledgments
The authors would like to thank Dr. U. Stumper for permission to use Fig. 11. The work described in this article was funded by the National Measurement System Policy Unit of the UK Government's Department of Trade and Industry.
References
1 ISO: 'International vocabulary of basic and general terms in metrology' (International Organization for Standardization, Geneve, Switzerland, 1993, 2nd edn.)
2 WOODS, D.: 'A precision dual bridge for the standardization of admittance at very high frequencies', IEE Proc.-C, June 1957, 104, Monograph No. 244R, pp.506-521
(
3 HOER, C.: 'The six-port coupler: a new approach to measuring voltage, current, power, impedance and phase', IEEE Trans. Instrum. Meas., November 1972, IM-21, (4), pp.466-470
4 ENGEN, G. F.: 'An improved circuit for implementing the six-port technique of microwave measurements', IEEE Mierow. Theory Tech., December 1977, MTT-25, (12), pp.1080-1083
5 RIDLER, N. M.: 'The development of a broadband VHF 6-port for high precision impedance measurements'. IEEColloquium Digest No. 1990/174, December 1990, pp.6/1-6/7
6 RIDLER, N. M.: 'New VHF impedance measuring instrument for UK national standard', IEE Proc., Sci. Meas. Technol., January 1994, 141, (1), pp.71-74
7 POTTER, C. M., HJIPIERIS, G., and FANTHOM, N. J.: 'A novel 250 MHz-26·5 GHz reflection analyzer'. Proc. 23rd European Microwave Conference, Palacio de Congresos, Madrid, Spain, September 1993, pp.302-304
8 HODGETTS, T. E., and GRIFFIN, E. J.: 'A unified treatment of the theory of six-port reflectometer calibration using the minimum of standards'. RSRE Report No. 83003, Royal Signals and Radar Establishment, August 1983
9 RIDLER, N. M., and MEDLEY, J. C.: 'Uncertainties for one-port coaxial measurements using an HP8753B vector network analyser'. 17th Automated RF and Microwave Measurements Society (ARMMS) Conference Digest, University of Nottingham, September 1992
10 MEDLEY, J. C., and RIDLER, N. M.: 'Traceable measurements in coaxial line on on HP8510C network analyser'. 18th Automated RF and Microwave Measurements Society (ARMMS) Conference Digest, University of Manchester Institute of Science and Technology (UMIST), April 1993
11 RIDLER, N. M., and MEDLEY, J. C.: 'Improving the traceability of coaxial impedance measurements at lower RF in the UK', IEE Proc., Sci. Meas. Technol., July 1996, 143, pp.241-245
12 RIDLER, N. M.: 'Improved RF calibration techniques for network analyzers and reflectometers', Mierow. Eng. Eur., October 1993, pp.35-39
13 RIDLER, N. M., and MEDLEY, J. C.: 'New calculable standards for reflectometers in 7 mm coaxial line'. 21st Automated RF and Microwave Measurements Society (ARMMS) Conference Digest, Paper No. 5, University of Surrey, September 1994
14 HODGETTS, T. E.: 'The calculation of the equivalent circuits of coaxial-line step discontinuities'. RSRE Memorandum No. 3422, Royal Signals and Radar Establishment, 1981
15 RIDLER, N. M., MEDLEY, J. C., BADEN FULLER, A. J., and RUNHAM, M.: 'Computer generated equivalentcircuit models for coaxial line offset open-circuits', IEE Proc.-A, September 1992, 139, (5), pp.229-231
16 FARADAY PROCTOR, R.: 'High-frequency resistance of plated conductors', Wireless Engineer, February 1943, 20, pp.56-65
17 KILBY, G. J., and RIDLER, N. M.: 'Comparison of theoretical and measured values for attenuation of precision coaxial lines', Electron. Lett., October 1992, 28, (21), pp.1992-1994
18 RIDLER, N. M., and MEDLEY, J. C.: 'Traceable reflection coefficient measurements in coaxial line at MF and HF'. IEE Colloquium Digest No. 1994/042, February 1994, pp.8/1-8/4
19 ISO: 'Guide to the expression of uncertainty in measurement' (International Organization for Standardization, Geneve, Switzerland, 1993, 1st edn.)
20 IDE, J. P: 'Traceability for radio frequency coaxial line standards'. NPL Report DES 114, National Physical Laboratory, July 1992
21 RIDLER, N. M., and MEDLEY,]. C.: 'An uncertainty budget for VHF and UHF reflectometers'. NPL Report DES 120, National Physical Laboratory, May 1992
22 STUMPER, U.: 'International comparison GT-RF 75-A4: reflection coefficient in 14 mm/50 Q coaxial line at 0·5 GHz, 3 GHz and 7 GHz', IEEE Trans. Instrum. Meas., December 1995, 44, (6), pp. 985-990
© Crown Copyright: 1997
The authors are with the Centre for Electromagnetic and Time Metrology, National Physical Laboratory, based at DRA Malvern, Malvern, Worcs. WR14 3PS, UK. (Mr. Ridler is employed by Assessment Services and works under contract to NPL.)
ENGINEERING SCIENCE AND EDUCATION JOURNAL FEBRUARY 1997
24
�
JJ