Improvements for Operational Performance in Baggage ...
62
Delft University of Technology FACULTY OF MECHANICAL, MARITIME AND MATERIALS ENGINEERING Department of Marine and Transport Technology Mekelweg 2 2628 CD Delft the Netherlands Phone +31 (0)15-2782889 Fax +31 (0)15-2781397 www.mtt.tudelft.nl This report consists of 62 pages. It may only be reproduced literally and as a whole. For commercial purposes only with written authorization of Delft University of Technology. Requests for consult are only taken into consideration under the condition that the applicant denies all legal rights on liabilities concerning the contents of the advice. Specialization: Transport Engineering and Logistics Report number: 2016.TEL.8072 Title: Improvements for Operational Performance in Baggage Handling Systems regarding Mishandled Baggage Author: V. Groeneweg Title (in Dutch) Verbeteringen voor operationele prestatie van bagage systemen met betrekking tot verkeerd afgehandelde bagage Assignment: literature Confidential: no Supervisor: Dr. Ir. Y. Pang Date: Nov. 28, 2016
-
Upload
khangminh22 -
Category
Documents
-
view
2 -
download
0
Transcript of Improvements for Operational Performance in Baggage ...

Delft University of Technology
FACULTY OF MECHANICAL, MARITIME AND
MATERIALS ENGINEERING
Department of Marine and Transport Technology
Mekelweg 2 2628 CD Delft the Netherlands Phone +31 (0)15-2782889 Fax +31 (0)15-2781397 www.mtt.tudelft.nl
This report consists of 62 pages. It may only be reproduced literally and as a whole. For commercial purposes only with written authorization of Delft University of Technology. Requests for consult are only taken into consideration under the condition that the applicant denies all legal rights on liabilities concerning the contents of the advice.
Specialization: Transport Engineering and Logistics
Report number: 2016.TEL.8072
Title: Improvements for Operational Performance in Baggage Handling Systems regarding Mishandled Baggage
Author: V. Groeneweg
Title (in Dutch) Verbeteringen voor operationele prestatie van bagage systemen met
betrekking tot verkeerd afgehandelde bagage
Assignment: literature
Confidential: no
Supervisor: Dr. Ir. Y. Pang
Date: Nov. 28, 2016

TUDelft FACULTY OF MECHANICAL, MARITIME AND MATERIALS ENGINEERING
Delft University of Technology Department of Marine and Transport Technology
Mekelweg 2 2628 CD Delft the Netherlands Phone +31 (0)15-2782889 Fax +31 (0)15-2781397 www.mtt.tudelft.nl
Student: V. Groeneweg Supervisor: Dr. Ir. Y. Pang Specialization: TEL Creditpoints (EC) 10
Assignment type: Literature Report number: 2016.TEL.8072 Confidential: NO
Subiect: Improvement for Operational Performance in Baggage Handling Systems regarding Mishandled Baggage
Airports are in general struggling to stay profitable while an increasing demand of flights results in the
increase in pressure to handle more passengers. The baggage handling of airports can be considered
to be one of the limiting factors to increase the capacity and to improve the service. With respect to
the operational performance of the baggage handling systems, one key performance indicator is the
number of mishandled baggage. The delayed, damaged and even lost baggage have significant
impact to the service quality, the customer satisfaction, the compensation costs and the throughput of
airports.
This literature assignment is to get insight in the causes of mishandled baggage concerning airports,
airlines and baggage handlers. The survey will provide the state of the art solutions to improve the
operational efficiency by reducing the amount of mishandled baggage in baggage handling processes.
The main tasks of this assignment is the following:
• to understand the functions of baggage handling systems and the relative equipment
» to study the indicators for the operational performance of baggage handling
• to explore the factors and the current trends of mishandled baggage
• to list the root-causes and to summarize the solutions for mishandled baggage
This report should be arranged in such a way that all data is structurally presented in graphs, tables,
and lists with belonging descriptions and explanations in text.
The report should comply with the guidelines of the section. Details can be found on the website.
Dr. Ir. Y. Pang

Improvements for Operational Performance in Baggage Handling Systems regarding
Mishandled Baggage
V. Groeneweg

[THIS PAGE INTENTIONALLY LEFT BLANK]

Abstract 5
Literature study V. Groeneweg
Abstract The process of baggage handling tends to be one of the limiting factors for the extension of airports. Furthermore the need for travelling increases, as well as the world’s population. However the airlines are currently struggling to stay profitable, what results is a focus of airlines to reduce costs. Furthermore the competition increases between the airlines to get the loyalty from the passengers to being able to provide their flight.
As a result of this given trend, the airlines and airports focus to improve the throughput of the system, decrease the costs and improve the delivered quality to the customer. One of the important factors in the industry for this is the factor of Mishandled Baggage, because every mishandled bag increases the costs for the airline.
This research focuses on methods to improve the operational efficiency of a Baggage Handling System regarding Mishandled Baggage. The whole procedure of baggage handling is defined with the available equipment. The process boundaries are set to be from the moment the passenger is decoupled from the baggage at the check-in desk until the pick up at the reclaim area.
To see the operational efficiency of the system in a broader perspective its share in the overall operational performance is determined.
It is found that the term operational efficiency is often incorrectly interchanged with productivity and performance. The difference between these terms is defined clearly as performance being the overarching umbrella of all terms, what describes the performance against a benchmark or goal. Below this the profitability defines how well a company operates in the market concerning the input and output price, while productivity only takes into account the amount of output for the amount of used resources.
Efficiency and effectiveness are also important terms in these categories. The two terms split the factors for the different categories into two groups. Efficiency concerns about how well the resources are used, while effectiveness is about how a process fulfills the wish of the customer.
The different methods of improvement are listed for the different causes what are in short:
Human errors Tracing errors Fallen bags Lack of resources
A wide variety of improvements is found for the process briefly it concerns:
Training and creation of awareness of the check-in agents to prevent the wrong placement of the bags into the system. This should also concern about the mistypes and correct attachment of the tags to the bags.
RFID implementation to have better tracking capabilities, what results in less staff members required to scan unreadable tags, while the ability of sorting optimized.
The system design has to be such that it prevents bags from falling. Some examples are a cart-based system, reduction of inclinations an declinations to an angle below 18° and by using slowly start and stop system consisting dynamic braking or clutches.
Efficient use of resources by implementation of preventive maintenance and adjustment of the flow principle from push to pull. This can be reached by having early arrival of bags in combination with an early baggage storage. Besides this the staff availability can be improved by (semi-)automation of the process and having shorter working days. To finalize the staff can work more efficient by improving communication and coordination.

6 Table of Contents
Literature study V. Groeneweg
Table of Contents
Abstract .................................................................................................................................. 5
Table of Contents .................................................................................................................... 6
List of Figures.......................................................................................................................... 8
List of Tables ........................................................................................................................ 10
Glossary ............................................................................................................................... 11
1. Introduction ................................................................................................................... 12
1.1 Problem description................................................................................................. 12
1.2 Research objective .................................................................................................. 12
1.3 Report outline ......................................................................................................... 13
2. Analysis of the BHS ....................................................................................................... 14
2.1 Traveling facts ......................................................................................................... 14
2.2 Different kinds of Baggage ....................................................................................... 14
2.3 Flow diagram of a BHS ............................................................................................ 15
2.4 Equipment for different BHS functions ....................................................................... 17
2.4.1 In-feed............................................................................................................. 17
2.4.2 Identification ..................................................................................................... 18
2.4.3 Screening ........................................................................................................ 18
2.4.4 Transportation .................................................................................................. 18
2.4.5 Sorting ............................................................................................................ 19
2.4.6 Storage ........................................................................................................... 20
2.4.7 Make-up .......................................................................................................... 20
2.4.8 Outlet .............................................................................................................. 21
2.5 Stakeholders ........................................................................................................... 22
2.5.1 Airport ............................................................................................................. 22
2.5.2 Safety and security ........................................................................................... 22
2.5.3 Customers ....................................................................................................... 23
2.5.4 Baggage system .............................................................................................. 23
2.5.5 Governments ................................................................................................... 24
2.6 Conclusion: Function and equipment of a BHS ......................................................... 24
3. Operational Performance ................................................................................................ 25
3.1 Definition ................................................................................................................ 25
3.2 Performance of a BHS ............................................................................................. 27
3.2.1 Performance indicators of a BHS ....................................................................... 27
3.3 Conclusion: Operational performance of a BHS ........................................................ 29

Table of Contents 7
Literature study V. Groeneweg
4. Mishandled Baggage ..................................................................................................... 30
4.1 MHB facts and trends.............................................................................................. 30
4.1.1 MHB procedure ............................................................................................... 31
4.2 Categories of MHB .................................................................................................. 31
4.3 Conclusion: Facts and trends of MHB ...................................................................... 33
5. Causes and improvements of MHB ................................................................................ 34
5.1 Human error ........................................................................................................... 34
5.1.1 Input faults ....................................................................................................... 34
5.1.2 (Un)loading faults .............................................................................................. 35
5.1.3 Stolen bags ..................................................................................................... 37
5.2 Tracing error ........................................................................................................... 38
5.2.1 Causes of tracing errors.................................................................................... 38
5.2.2 Methods to reduce tracing errors ....................................................................... 38
5.3 Fallen bags ............................................................................................................. 40
5.3.1 Causes of fallen bags ....................................................................................... 40
5.3.2 Methods to reduce fallen bags .......................................................................... 41
5.4 Lack of resources ................................................................................................... 42
5.4.1 Equipment planning .......................................................................................... 42
5.4.2 Staff availability ................................................................................................. 45
5.4.3 Communication ................................................................................................ 47
5.5 Conclusion: Causes and improvements .................................................................... 50
6. Conclusion .................................................................................................................... 52
6.1 Recommendations .................................................................................................. 53
Bibliography .......................................................................................................................... 54
Appendix .............................................................................................................................. 59
I. Cluster of Black box approaches of a BHS ................................................................... 59
II. Cluster of flow charts of a BHS .................................................................................... 61

8 List of Figures
Literature study V. Groeneweg
List of Figures Figure 2.1: Black box visualization of a BHS (Lodewijks 2016) .................................................. 15 Figure 2.2: Flow diagram based on the Delft Systems Approach (Lodewijks 2016) ..................... 16 Figure 2.3: A conventional check-in counter for baggage with a limited size (Lodewijks 2016). .... 17 Figure 2.4: The uDrop system at Paris Charles de Gaulle Airport (“Wikipedia” 2016) ................... 17 Figure 2.5: A Lufthansa counter for handling in special baggage(“Lufthansa” 2016) .................... 17 Figure 2.6: Containers and carts transported by a truck between the airplane and the make-up area (“Zimbio” 2016) .............................................................................................................. 19 Figure 2.7: A belt conveyor what transports bags (“Flight Deck Aviation” 2016) .......................... 19 Figure 2.8: A spiral chute to safely transport bags levels down (“Safeglide” 2016) ...................... 19 Figure 2.9: A pusher sorting system (“Vanderlande” 2016a) ...................................................... 19 Figure 2.10: A vertical sorter (“Vanderlande” 2016b) ................................................................ 19 Figure 2.11: A tilt tray sorting arrangement (“Airport Technology” 2016) ...................................... 19 Figure 2.12: Buffer lanes ........................................................................................................ 20 Figure 2.13: Automated storage and retrieval system (“Deutsche Bank” 2016) ........................... 20 Figure 2.14: Costs of a bagstore compared to buffer lanes (Kohlmann 2012) ............................ 20 Figure 2.15: Manual loading at Changai airport (“TNP” 2016) .................................................... 21 Figure 2.16: Semi-automated make-up with Stack@Ease (“AviationPros” 2016a) ....................... 21 Figure 2.17: Automated loading robot (“Vanderlande” 2016c) ................................................... 21 Figure 2.18: Loading of baggage from laterals (“Vanderlande” 2016d) ....................................... 21 Figure 2.19: Loading baggage from a carrousel (“Vanderlande” 2016d) ..................................... 21 Figure 2.20: Loading from chutes (Lemmen 2016) .................................................................. 21 Figure 2.21: Main stakeholder’s airport (Dijks et al. 2010) ......................................................... 22 Figure 3.1: Five performance objectives (Slack et al. 2001) ...................................................... 25 Figure 3.2: The tirple P model (Tangen 2005) .......................................................................... 26 Figure 4.1: Trend of passengers and bags mishandled (SITA 2015) .......................................... 30 Figure 4.2: Reasons for delayed bags in 2014 ........................................................................ 31 Figure 4.3: Breakdown in 2013 of mishandled bags ................................................................ 31 Figure 4.4: Possible process errors (Lemmen 2016) ................................................................ 32 Figure 4.5: Pie chart of causes of MHB, based on (Alsyouf et al. 2014) ..................................... 32 Figure 5.1: Check-in agent attaches bag-tag (“Allwidewallpapers” 2016) ................................... 35 Figure 5.2: Unloading and prioritization (McCartney 2014) ....................................................... 36 Figure 5.3: In-feed of bags from airplane (Lodewijks 2016) ....................................................... 36 Figure 5.4: Bag transported across the apron (“Planit” 2016) .................................................... 36 Figure 5.5: eTag tracing device (“Futuretravelexperience” 2016a) .............................................. 37 Figure 5.6: Bag delivery service at Gatwick airport(“Futuretravelexperience” 2016b) .................... 37 Figure 5.7: Concept with reclaim lockers (Boute 2016) ............................................................ 37 Figure 5.8: Employees scanning baggage by hand (Lemmen 2016) ......................................... 39 Figure 5.9: Vulnerable long barcode tag .................................................................................. 39 Figure 5.10: RFID tag in a barcode tag (“AviationPros” 2016b) .................................................. 39 Figure 5.11: ICS of vanderlande (“Vanderlande” 2016e) .......................................................... 41 Figure 5.12: Spacing dots at Athens airport (IATA 2012b) ........................................................ 41 Figure 5.13: Inclination in a BHS (“Clxengineering” 2016) ......................................................... 41 Figure 5.14: Example earliness distributions before and after 9 A.M. (T.S.A. 2007) ..................... 43 Figure 5.15: Flight arrival waves at A.A.S. (“KLM” 2016) ........................................................... 43 Figure 5.16: Throughput in 24 hours for a BHS (Lodewijks 2016) .............................................. 44 Figure 5.17: Throughput of bags for a flight with current system and early arrival (Beumer Groep 2012) ................................................................................................................................... 44 Figure 5.18: Vacuum lifting of bags ......................................................................................... 46 Figure 5.19: Exoskeleton used at Japanese airport (Weller 2015) .............................................. 46 Figure 5.20: Automated unloading equipment of Moderniek (van Kleef 2015) ............................ 46 Figure 5.21: Delay distribution(T.S.A. 2007) ............................................................................. 47 Figure 5.22: Check-in agents need to stick to procedures ....................................................... 49

List of Figures 9
Literature study V. Groeneweg
Figure: I.A—1 The black box of the baggage flow at an airport (Kohlmann 2012) ....................... 59 Figure: I.B—1: SADT/ IDEF0 of a BHS (van der Lande 2012) ................................................... 59 Figure: I.B—2 General explanation of an IDEF0 approach (Lukszo 2016) .................................. 59 Figure: I.C—1: Proper model visualization (Lodewijks 2016) ..................................................... 60 Figure: II.A—1: Flow chart of a BHS (Bentvelsen 2015) ........................................................... 61 Figure: II.B—1: Available baggage routes at A.A.S. (A.A.S. 2012) ............................................ 61 Figure: II.C—1: Flow chart of a BHS (Kohlmann 2012) ............................................................. 62 Figure: II.D—1:SADT/IDEF0 A1-A6 KLM BTS (van der Lande 2012) .......................................... 62

10 List of Tables
Literature study V. Groeneweg
List of Tables Table 3.1: Factors affecting the productivity of a BHS .............................................................. 28 Table 3.2: Factors affecting the profitability of a BHS ................................................................ 28 Table 3.3: Factors affecting the performance of a BHS ............................................................ 28

Glossary 11
Literature study V. Groeneweg
Glossary A.A.S. Amsterdam Airport Schiphol BHS Baggage Handling System CAPEX Capital Expenditure CDC Cargo Doors Closed EBS Early baggage storage Fibag First Bag on belt FSC Full-Service Carrier FTE Full Time Equivalent IATA International Air Transport Association ICS Individual Carrier System Irrate Irregularity rate, number of mishandled bags per 1.000 passengers KLM Royal Dutch Airlines; an international aviation company Labag Last Bag on belt LCC Low Cost Carrier MHB Mishandled Baggage OOG Out Of Gauge OPEX Operational Expenditure PIR Property Irregularity Report Prio Priority RFID Radio-Frequency Identification ROI Return on investment T2T Tail to Tail ULD Unit Load Device
12 Introduction
Literature study V. Groeneweg
1. Introduction Over the past decades the airline industry has grown enormously, this is caused by the general economic growth over the world and the increase of world population. This increasing demand results in more pressure on the existing airports to handle more and larger airplanes in a shorter period of time. The airline industry is struggling to maintain its profitability, so it pushes airports to provide short handling times against low prices (Tully 2014). This forces the airports to make the passenger and baggage handling more efficient. Although many improvements are implemented it turns out that baggage handling is still one of the biggest bottlenecks for an efficient air transport business model (SITA 2016).
1.1 Problem description Airports tend to improve the performance of the Baggage Handling System (BHS) what for example is done by a reduction in the costs, decrease in handling time and improvements in handling quality. An aspect what is of increasing importance for BHSs is the rate of Mishandled Baggage (MHB). This factor describes the amount of delayed, damaged or lost bags per 1000 handled bags. The factor is of urge for airlines because it displays on one side the costs of faults and, related to that, the delivered quality to the passenger. With the airlines struggling to stay profitable the costs are becoming more important, besides this the airlines aspire to provide a better quality to keep the loyalty from the passengers. The amount of mishandled bags has significant impact on the costs and the delivered quality to the passenger. This makes the MHB an important factor for airlines and airports.
Airports and airlines tend to decrease the amount of mishandled bags based on data provided about global mishandling rates. However there is lack of the specific causes for mishandled bags and no clear solutions are available for managements to decrease amount of mishandled bags.
1.2 Research objective This research focuses on airports, airlines and baggage handlers in general to get insight in possible causes of MHB in order to improve the systems to overcome those causes. Every airport requires its own specific research to get full insight in the problem, with this research a general framework of causes and solutions is provided. The framework can be used to work out improvement concepts. The report aims to answer the following research question
What are state of the art solutions to improve the Operational Efficiency of a Baggage Handling Systems by reducing the number of Mishandled Baggage?
This main research question is answered by answering the following set of sub-questions in the different chapters. The answers for the sub-questions are provided at the end of every chapter, while the answer on the main question is the combination of the sub-questions.
Chapter 2a What are the functions of the BHS and what are solutions to fulfill these functions? Chapter 2b What are the stakeholders of a BHS and what are important factors for them
concerning the function and design of BHS? Chapter 3a What is operational performance and how are Efficiency and Effectiveness related
to this? Chapter 3b What are key performance indicators for a BHS? Chapter 4 What is the MHB factor and what are current trends in this? Chapter 5 What are factors affecting the MHB of an airport and what are state of the art
solutions to improve them?

Introduction 13
Literature study V. Groeneweg
1.3 Report outline The chapters are structured following the order of the sub-questions. The reader who is not familiar with BHSs can get insight in the baggage handling process and available equipment in chapter 2. Following on this chapter 3 describes theoretically the definition of operational performance and how the factor of MHB fits in this. Some background information on the factor of MHB is provided in chapter 4 to get to know the current state and global trends. Finalizing the exact causes for MHB are categorized and listed in chapter 5 with improvements that are already advised or applied on existing BHSs.

14 Analysis of the BHS
Literature study V. Groeneweg
2. Analysis of the BHS The first step in the research is to understand the system. Within the airport the BHS is one of the most important factors for the limited capacity of an airport. Previously baggage handling did not exist and passengers had to walk their bags to a waiting airplane and there it would be slung into the hold (Vickers et al. 1998). Baggage handling started as service to the passenger and over time it changed to a requirement for the airplane handling (Bentvelsen 2015). Nowadays the handling is more complicated with different kinds of baggage as described in Chapter 2.2. The process of handling becomes more and more complex what is explained with the flow diagram in Chapter 2.3. The complexity and size of the systems increase what is related to the regulations as the requirement of screening all the bags after 9/11 (A.A.S. 2012). The different tasks of the BHS can be fulfilled by different equipment shown in Chapter 2.4, the choice of the equipment is based on the airport type and the current and future requirements of the stakeholders (Chapter 2.5)
2.1 Traveling facts In order to understand the system, the current state and trends of the industry are important to be identified. The number of passengers is constantly increasing, in 2015 it was expected to have 3.54 billion passengers transported by the airlines (SITA 2016). Continuing population growth and urbanization in Asia and Africa is said to be the main driver to increased demand for air transport (“UN” 2016). In combination with the economic growth and a desire to see more the world the industry is expected to grow to transport seven billion passengers in 2035 (SITA 2016). In terms of baggage it is expected grow respectively from five billion to ten billion bags from 2012 to 2035 (Duren 2011).
2.2 Different kinds of Baggage A variety of baggage is handled by the BHS, but mainly the process of can be grouped on different airplanes, bag-shapes and origin and destination. Firstly the input differs when handling wide- or narrow-body airplanes. For wide-body airplanes the baggage is loaded into Unit Load Devices (ULDs), as also called containers, whereas for narrow-body airplanes the baggage is unloaded from carts into the hold. The loading process differs in the handling procedure where wide-body loading is highly mechanical and for narrow-body labor intensive (van der Lande 2012).
Secondly the handling differs for the different kinds of destinations of the baggage. In total there exist three types of baggage flow: check-in baggage, transfer baggage and reclaim baggage.
Check-In Baggage This is the baggage with the current airport as the origin. The passenger delivered the bag at the check-in desk and after that the passenger and the bag are separated until the passenger arrives at the reclaim area. A special type of baggage is the oversized baggage, also called Out Of Gauge (OOG) baggage, what is handled separately. OOG-baggage Some baggage cannot be handled by the BHS, because of an exceptional shape or higher weight (more than 40 kilo). Examples can be skis, but also animals what require special guidelines and this. That is why this baggage is manually made-up for the transport to the airplane by the personal. At some airports there are special check-in and pick-up areas for OOG-baggage.

Analysis of the BHS 15
Literature study V. Groeneweg
Transfer Baggage The transfer baggage increases pressure on the capabilities of the BHS, because it goes through the whole baggage handling process. Different levels of urge are given to transfer bags to easily distinguish the available handling time span. The given groups are for Amsterdam Airport Schiphol (A.A.S.) (Jochems 2015).
No special label (> 90 minutes) Short Connection Baggage (SCB), (<90 minutes) Baggage what can be handled by the system with extra care to pass its short processing
time. Tail to Tail (T2T) Baggage, (<65 minutes) When the connection time is really short it gets a special treatment what means that the
baggage is brought by truck from one airplane to the other. HUB (Group larger then 25) If a large group of baggage all has the same transfer those bags are handled as one batch
to improve the transfer process.
Reclaim Baggage Reclaiming of baggage takes place at the airport of arrival where the passenger and bag come together in the reclaim area. The process itself does not consist of many steps, but there has to be taken into account that the baggage arrives in the right order. This is related to the following reclaim baggage types (Jochems 2015):
Regular reclaim baggage: No specific order required of arriving at the reclaim area Priority reclaim baggage: Some passengers have priority ticket what gives them the right of
having their bags as first on the reclaim belt.
2.3 Flow diagram of a BHS The different baggage flows as described in Chapter 2.2 can easily be distinguished in the process diagram of the BHS. All of the different functions are separated and fulfill together the main function of a BHS, namely:
“A BHS is a type of transport system installed in airports and which transports checked baggage from ticket counters to areas the bags can loaded onto airplane. A BHS also transports checked baggage coming from airplane to baggage claims or to an area where the bag can be loaded into another airplane (Lodewijks 2016).”
Black-box approach This process can firstly be seen as a black box to consider the right input and output combined with their requirements (Lodewijks 2016). The diagram visualizes everything what goes in and out the system combined with the used resources and the measured performance. Different approaches can be found in literature as listed in Appendix I. It is chosen to show the black box from Figure 2.1, what from its simplicity easily visualizes the process of baggage handling.
Figure 2.1: Black box visualization of a BHS (Lodewijks 2016)

16 Analysis of the BHS
Literature study V. Groeneweg
Flow-diagram As for the black box different approaches can be found in literature to visualize the process in a flow diagram, what is worked out in appendix II. For this report is chosen to use the diagram from Figure 2.2, what shows a clear separation between the passenger and the baggage flow. The reason for choosing this one is its ease in understanding the system.
From the baggage handling point of view, the passenger is of influence only at the moment he or she drops the bag into the system. For this reason the green arrows (passengers) go around the BHS functional box. The only important factor related to the passenger’s process is the fact that is checked if the passenger is boarded to the flight, before departure. This to ensure the bag does not travel without the passenger. In short the three different baggage flows can be described as following:
Check-in Baggage: The passenger drops of the baggage at the (self) check-in desk and the baggage goes into the screening area where the bag is checked for explosives. Bags can arrive before the make-up time what means that those need to be temporary stored. When the make-up area opens the carts or containers are filled with the bags for the flight. Finally the bags are loaded into the airplane by the ground handlers.
Transfer Baggage: This baggage goes through almost the whole BHS. The bag is unloaded from the inbound (arrived) flight and transported into the BHS. At this point the baggage is separated from reclaim baggage. Often the transfer baggage is located close to the take-out point of airplane to accelerate the unloading process. It is not required by law to screen all the transfer baggage, so it depends on the airport where the transfer baggage is merged into the Check-In flow (Lemain 2002). From the diagram it can easily be seen that transfer baggage has the most process steps, what causes transfer baggage in being the most critical baggage for the BHS (Jochems 2015).
Reclaim Baggage: This baggage is the easiest to handle, because it is just transported and put into the reclaim area. At this point the passenger and the bag are again brought together and the journey of passenger and the bag ends.
Figure 2.2: Flow diagram based on the Delft Systems Approach (Lodewijks 2016)

Analysis of the BHS 17
Literature study V. Groeneweg
2.4 Equipment for different BHS functions To have an understanding of the system an overview of available equipment is given for the functions from the flow-diagram of Figure 2.2. Information for this part is gathered from different literature (IATA 2004; A.A.S. 2012; Kohlmann 2012; Vickers et al. 1998; Bentvelsen 2015; Lemain 2002)
2.4.1 In-feed The main function of the check-in procedure is the feed-in of the baggage into the BHS, besides this it is to identify the passenger and hand-over the boarding pass. From the moment of check-in the airline is responsible for the bag. Summarizing, the check-in is required for (Lemain 2002):
Registration and labeling of bags Weighing and inning of costs for extra baggage Hand-over boarding pass
It is possible that the check-in procedure is performed on-site at the airport terminals or off-site at for example the parking lot or at railway stations. For off-site in-feed it is required to have a secure area likewise it is at the airport. The equipment for the in-feed can be split in the following categories:
Check-in counters The conventional method of the in-feed is a counter with an check-in agent, as from Figure 2.3. The passenger hands over the desired documents and the personal checks the baggage. The system has typically two or three conveyor belts to weigh and transport the bags to the collection conveyor what goes to the screening area.
Self-service check-in In response of high labor costs several airports replace the traditional check-in counters for self-service check-ins. This equipment checks any priority passes and the identity of the passenger. The output of this device is the boarding pass of the passenger, wherewith the passenger can drop-off its baggage at the drop-off point.
Baggage drop-off point A wide variety of drop-off points are available, from what one is shown in Figure 2.4. Typically the device asks for the boarding pass, weighs the bag an prints the bag-label. The passenger attaches this to the bag where-after the bag continuous to the screening area.
OOG-Counter Large-, heavy- or irregular shaped baggage is defined as OOG-baggage. It depends on the airport what is defined as OOG-baggage, and how it is handled. It can for example be handled by a separate OOG-Counter and OOG-system, or it can be brought directly to the airplane. As guideline is given that when the volume of OOG-baggage is ≥10% it should be considered to provide an automated OOG handling (IATA 2004). An example of an OOG-counter, where skis are delivered is seen in Figure 2.5.
Figure 2.3: A conventional check-in counter for baggage with a limited size (Lodewijks 2016).
Figure 2.4: The uDrop system at Paris Charles de
Gaulle Airport (“Wikipedia” 2016)
Figure 2.5: A Lufthansa counter for handling
in special baggage(“Lufthansa” 2016)

18 Analysis of the BHS
Literature study V. Groeneweg
2.4.2 Identification The right routing and monitoring of the bag is done by the tracking the bag through the system with the bag tag. This tag, also called license plate by the IATA (International Air Transport Association), can be a barcode or an RFID (Radio-Frequency Identification) label as defined by the IATA resolutions 1740b and 1740c.
Barcode The standard method of identification is the barcode. The barcodes are scanned with a barcode reader, camera system or a 3-imagining system. The system has problems when the tag is folded or below the bag what causes a misread, when this occurs the tag needs to be scanned by an operator.
RFID The technology of RFID tags is more reliable, because it has a reading rate of almost 100% (Madsen 2016). The implementation of the RFID at airports is still difficult, because airlines do not want to pay the extra costs of the RFID tag, while the number of lost bags is expected to decrease with RFID implementation.
Pattern recognition A methodology without the requirement of a tag is the ability to recognize the bag by its shape and color. This is possible since every bag is unique, disadvantage of this system that it is not able cope with the deformation of bags.
2.4.3 Screening As stated earlier all of the hold baggage need to be screened for explosives. Various methods for screening are manual checking, x-ray scanning, tomography scanning and diffraction scanning. The placement of the screening in the system and the strictness depends on the vision of the airport combined with countries regulations. A short list of the possibilities currently chosen by some airports (Bradley 2010):
Off-airport screening (City centre, hotels) Before approach of check-in (enter terminal, in front of check-in) At or immediately after the check-in desks Downstream in the BHS before the make-up area
2.4.4 Transportation The main task of the BHS is the transportation of the baggage from the check-in to the airplane with in between, if required, a storage facility and the screening area. A couple of different transportation methods are:
Manual transport On very small airports where the check-in desks are close to the make-up area manual transportation may be used, what could be a handling agent walking the bag through the system. Another good example of manual transport is the T2T transport (as shown in Figure 2.6) where tractor pulled carts transport the bags via the apron. This kind of transport is used, because of small short handling time or the occupancy of the route.
Conveyor The best known transportation equipment in the industry are conveyors. For this can either belt conveyors (like from Figure 2.7) or roller conveyors, from what the first are commonly used (Bentvelsen 2015). The conveyor can overcome height differences and can make corners as long as the systems maxima are taken into account. The design quest is to use multiple smaller conveyors or a couple of longer conveyors. With smaller conveyors the system is more flexible while for longer conveyors the system is more energy efficient and reliable against breakdowns.

Analysis of the BHS 19
Literature study V. Groeneweg
(Spiral) chute and elevators To let the baggage descent, without interruption and the use of energy a chute or either a spiral chute (Figure 2.8) can be used. It has to be taken into account that by the use of a chute the identification is lost, if that was given to the position of the bag on the belt.
A chute is commonly used before a manual make-up area. Besides chutes, elevators can be used to transport bags upward when limited space is available. Contrary to chutes the identification of the bags is kept with an elevator. Examples of elevators are forklifts, lifts, spiral and vertical conveyors.
Figure 2.6: Containers and carts transported by a truck between
the airplane and the make-up area (“Zimbio” 2016)
Figure 2.7: A belt conveyor what transports bags
(“Flight Deck Aviation” 2016)
Figure 2.8: A spiral chute to safely
transport bags levels down (“Safeglide” 2016)
2.4.5 Sorting Having an optimal performing BHS requires sorting equipment to ensure that the baggage arrives at the right location and time, supplied from different locations. A couple of examples are listed below.
Manual sorting The baggage is transported to an internal outlet area where an operator can separate the bags for the different locations. The process is labor intensive, but it has its advantages in the flexibility.
In-Line sorting This method is well applied when the throughput is an important key-point of the system. An initial solution: pushers and diverters (like Figure 2.9) , literally push the bag of the conveyor onto another conveyor. Secondly a well used solution is a vertical sorter (as shown in Figure 2.10) which is able to differ the output through a central levelable conveyor onto two different levels. Thirdly the bag can be put onto another belt at the right moment by using a side induction arrangement. With this technology the bag is queued on several conveyors and loaded onto the destination conveyor by speeding up and synchronizing the speed of the bag to destination.
Dedicated sorting equipment The conveyor itself can also be equipped with sorting equipment on individual bag carriers. For this bag carrier consists of a tilting surface (what is shown in Figure 2.11) or a small conveyor perpendicular of the main flow. The carrier acts when the bag passes a position, at what the bag needs to be sort out of the system. This equipment is used when throughput is one of the important factors of the system.
In-Line Individual Carrier System (ICS) The technology of the dedicated sorting equipment can also be applied to separate carriers improving the throughput of the system. The bags are put onto an individual cart which is switched from track to track like a train to reach its final destination on that track. Unloading of the ICS is done in the same manner of dedicated sorting equipment tilting or with a small conveyor.
Figure 2.9: A pusher sorting system
(“Vanderlande” 2016a)
Figure 2.10: A vertical sorter
(“Vanderlande” 2016b)
Figure 2.11: A tilt tray sorting arrangement
(“Airport Technology” 2016)

20 Analysis of the BHS
Literature study V. Groeneweg
2.4.6 Storage The system needs to store bags if the make-up area, where the containers and carts are loaded, is not yet open. The bags can already be in the system, because of early arrival of passenger or long transfers. For that a storage facility is required what can be done in several methods:
Manual storage In general an Early Baggage Storage (EBS) is automated, but when a small airport is considered it could also be a manual operation. An automated EBS is advised when the total required capacity is above 1000 bags and the input rates are more than 250 bags per hour (IATA 2004).
Virtual buffer A storage with a little investment is the virtual buffer where the bag is looped through the system until the make-up area is opened. Disadvantage of this system is that the throughput and capacity of the system decreases.
Belt conveyor buffer lines Next step in technology is to create a buffer area with conveyors that are loaded and stopped for a while. An example of such a setup is shown in Figure 2.12, in this bags can be sorted on the different conveyors based on the departure time of flights or sorted per flight. Bags can loop back to the start of the lane if not all of the bags need to be unloaded of the lane.
Storage and retrieval system A more automated solution is the application of separate carts that are stored separately on different levels on racks (Figure 2.13). The bags are individually accessible and by that the bags can be transported to the make-up area in the right order. A disadvantage of the system are the high investment costs, compared to the conveyor lanes solution as shown in Figure 2.14.
Figure 2.12: Buffer lanes
(Lemain 2002)
Figure 2.13: Automated storage and retrieval system
(“Deutsche Bank” 2016)
Figure 2.14: Costs of a bagstore compared to buffer
lanes (Kohlmann 2012)
2.4.7 Make-up Just like the boarding procedure of passengers bags also need to be checked before they enter the airplane. This check for the baggage is done at the make-up area where the personal scans the baggage label and the label of the ULD or baggage carts. This is done to ensure that the bags end up at the right flight and to specify its location of the bag in the airplane. It depends on the airport whether transfer baggage goes through the same make-up area, some airports have separate systems for transfer baggage.
Manual make-up The make-up process is still mostly a manual process (Kohlmann 2012). The staff picks up the bag from the output area of the BHS, scans the bag and puts it in the right ULD or cart to be transported to the airplane. An example of such a process is shown in Figure 2.15.
Analysis of the BHS 21
Literature study V. Groeneweg
Semi automated make-up In order to overcome the many health issues related to work of manual make-up solution are created to do have semi-automated make-up. An example of a solution for this is a lifting table (Figure 2.15) what eases the work of the operator by helping to lift the bag, pitfall is that it is still slower and it cannot handle 5-15% of all the bags (Kohlmann 2012). Another example of a solution is an inline conveyor that can be directed into the container or baggage cart. Disadvantage is that it cannot load the container anymore to the top, because of the height of the conveyor.
Automated loading Robots are sometimes used in the make-up area (Figure 2.17), but because this technology is relatively new the machine still needs supervision. Like the semi-automated solutions an operator is still required to load the last bags into containers (Kohlmann 2012). When the machine can operate without supervision manual and semi-automated loading becomes irrelevant (Bentvelsen 2015).
Figure 2.15: Manual loading at Changai airport
(“TNP” 2016)
Figure 2.16: Semi-automated make-up with
Stack@Ease (“AviationPros” 2016a)
Figure 2.17: Automated loading robot
(“Vanderlande” 2016c)
2.4.8 Outlet The bags leave the system on two sides of the system, at the make-up area where the bag is made ready to be transported to the airplane and at the arrival area where the passenger picks-up the bag. The method of the outlet is for both functions almost the same. A couple of different methods are:
Laterals A lateral is a long straight ending conveyor belt as shown in Figure 2.18. Bags from different flights are put on this lateral what means that the personal needs to check and sort out the bags for the location. The personal scans the bag to ensure that the bag is loaded on the right flight.
Carrousel A carrousel or racetrack (Figure 2.19) is what is known from for example most reclaim areas. Baggage can easily be picked up from several sides of the carrousel.
Chutes/bins The chutes or also called bins (Figure 2.20) can also be used on at the make-up area or either the arrival side for passengers, this is for example used at some airports with a high throughput of ski-equipment. Depending on the sorting capabilities of the system, the staff can put the bags directly into the right cart or firstly need to sort these.
Figure 2.18: Loading of baggage from laterals
(“Vanderlande” 2016d)
Figure 2.19: Loading baggage from a carrousel
(“Vanderlande” 2016d)
Figure 2.20: Loading from chutes
(Lemmen 2016)

22 Analysis of the BHS
Literature study V. Groeneweg
2.5 Stakeholders The performance of the BHS depends on the perspective, the airport has another interest than the passenger who takes the flight. To have a clear view on this a stakeholder analysis is done to know what parties are of concern in the design process of what their requirements are. Many stakeholders are involved in the baggage handling operations, besides that the handling needs to operate with other airports and standards. This combination makes that new technologies are still difficult to implement in the BHSs (Owusu 2016).
The stakeholder analysis is done with as basis Figure 2.21. The information required for this analysis is based on (Kohlmann 2012; Babeliowsky 1997; Bentvelsen 2015). The factors of importance for the different stakeholders are intended to categorize by the writer, this results in the categories; costs, throughput, quality and norms.
Figure 2.21: Main stakeholder’s airport (Dijks et al. 2010)
2.5.1 Airport The airport is the supplier of the facilities and leases this to the different service providers. The goal of the airport is to ensure a quality service to the passenger, what in the end supports regional growth (Schaar et al. 2010). Investors of airports are in general governmental organizations, airlines and private investors, this group initiates mostly the design of new facilities at the airport. The main factors of importance for these stakeholders are:
Costs o Capital expenditure (CAPEX) o Operational expenditure (OPEX) o Required space o Return on Investment (ROI)
Throughput o Capacity o In-system processing time
Quality o Reliability o Customer experience
2.5.2 Safety and security The people and baggage are respectively checked for safety and security reasons. The regulations on whenever and how the checks has to be performed differ for every airport and are mostly based on the governmental regulations. Both operations ensure that when the passenger or the bag is not secure both do not enter the airplane. Factors of importance of this group are:
Norms o Screening equipment regulations
Analysis of the BHS 23
Literature study V. Groeneweg
2.5.3 Customers The customers of the airport can be divided into the direct customer in the appearance of the airline and the indirect customers as the passengers, so the customers of the airlines.
Airlines The airlines take care of the check-in of passengers and the reconciliation, what is as explained to ensure that passengers do not travel without their bag. The airlines are the main users of the BHS what result in the performance of the BHS being of importance. Some airlines have their own handling unit what is mostly their home airport like for instance A.A.S. for KLM. Factors of importance for the airlines are:
Costs o OPEX
Throughput o Capacity o In-system processing time
Quality o Reliability o Customer experience
Passengers The final customers of the airport are the passengers. The baggage handling unit is not of much importance for the passenger, but it can influence the choose for an airport. The quality of the service is by that of great importance for the airport, because it has indirectly effect on the amount of handled passengers. The factors of importance are by that:
Quality o Reliability o Customer experience
2.5.4 Baggage system The BHS is operated by the handlers and one level below that the Operations and Maintenance group keeps up the system.
Handlers It differs per airport which parties operate the BHS. An airport may choose to hire one handler for all the flights, by that the handling is a service to the airlines. Other possibility is that airline hires a handler what results in several make-up locations at the airport. More handlers has market forces as a result, what can result in less operations costs. The different handlers are on one side competitors, but they also need to cooperate with each other when baggage needs to be transferred from one handler to another. The factors of importance for the handlers are listed below.
Norms o Ergonomics o Work regulations
Operations and Maintenance (O&M) The lifetime of a BHS is around 15-20 year and this can only reliable be reached when the system is maintained properly. The method of maintenance is of no importance in this chapter. The O&M stakeholder can be a department in directly working for the airports or as part of a separate company. The supplier of provides also often a contract to ensure the maintenance for a time period.
Throughput o Capacity
Norms o Work regulations
Quality o Reliability

24 Analysis of the BHS
Literature study V. Groeneweg
2.5.5 Governments The method of handling passengers and baggage at the airport depends completely on the regulations given by the national and municipal governments. Main aspect for the governments is the safety of the system and passengers combined with the working circumstances. The capacity of the airport is also mostly determined by the government as they regulate the amount of landings and the available space for the airport. Factors of interest for the government are:
Throughput o Capacity
Norms o Work regulations o Safety regulations o Landing rights o Airspace access o Airplane movements o Opening times
2.6 Conclusion: Function and equipment of a BHS The chapter concerned the whole part of functioning of a BHS including the stakeholders with their vision the system. The following questions were answered in this chapter:
What are the functions of the BHS and what are solutions to fulfill these functions? What are the stakeholders of a BHS and what are important factors for them concerning
the function and design of BHS?
As illustrated in this chapter the process of baggage handling is the whole process of transportation from the check-in desk until the reclaim area. The baggage handling also concerns of applying the right information to the bag at the check-in desk as well the whole process of tracing and screening.
On the input side the systems needs to handle different shapes and sizes of bags. It depends on the system what of this baggage is concerned as OOG-baggage. A special system and or counter needs to installed to handle this baggage.
A list of different handling methods are available to handle the bags in the different stages. Depending on the airport type other types of systems are chosen for the functions. Smaller airports tend to have more manual operations where-as larger airports have more automated systems, for example for sorting.
The stakeholders look at the system from their own perspective what results in a list of different important factors. The main stakeholder of the systems is seen as the airport what has to act with all the involved parties starting from safety and security, the customers what concern airlines and passengers and finally the BHS itself what contains the handlers and the operation and maintenance.
In short the factors of importance for the different stakeholders can be divided into factors concerning costs, throughput, norms and quality. For costs the return of investment of the system is of importance for airports what differs for airlines and handlers where the operational costs are of more importance. The quality of the system is of importance to almost all stakeholders, while this affects the available throughput concluding with the costs of the system.

Operational Performance 25
Literature study V. Groeneweg
3. Operational Performance Performance measurement is getting of more importance (Ittner et al. 1998) for companies nowadays, to measure how well the company or parts of it function related to history or to its competitors. This all is in essence summarized by Lord Kelvin (1824-1907) in his quote:
“When you can measure what you are speaking about, and express it in number your know something about it… [otherwise] your knowledge is of a meager and unsatisfactory kind; it may be the beginning of knowledge, but you have scarcely in thought advanced to stage of science.”
Although performance is used often as a management term the definition is not clearly defined. By that in literature and in management positions there is often misunderstanding of the used definition. This starts already from the term performance, some authors use this interchangeable with the term efficiency, effectiveness and profitability (Sink et al. 1989; Chew 1988; Sumanth 1984; Koss et al. 1993; Thomas et al. 1994; Jackson 1999). In general performance is a difficult matter because the measurables need to be specified for a specific company or system. Often measurements are done without a clear understanding of the system what results in sometimes optimizing of the wrong root-cause (Tangen 2005).
3.1 Definition The different use of definitions creates the requirement to clearly define the chosen definition. This also to see the difference with the often misused term of productivity for the same matter.
Firstly the term Operational Performance will be described, where-after there will be zoomed-into the terms that fall below the term of performance as stated in literature (Pekuri et al. 2011).
Performance is the umbrella of several terms and is by dictionary the achievement against some benchmark, so against some goals that were set up in advance (Chow et al. 1994). The term covers the economic and operational aspects, what can be summarized with the terms; costs, flexibility, speed, dependability or quality (Tangen 2005). The five terms are summarized in Figure 3.1 with the internal objective on the inner-circle and the outcome for the customer outside the circle.
Figure 3.1: Five performance objectives (Slack et al. 2001)

26 Operational Performance
Literature study V. Groeneweg
Profitability is the term that fits below performance and describes the success and growth of any business as the ratio between revenue and costs. A change in profitability does not directly results in a better operation procedure in the company, changes in cost or price inflation for example does not mean a better use of resources (Stainer 1997). The profitability of a system ,to conclude, can be defined by the output quantities (Nout) times the output unit price (Costout), per input quantities (Nin) times unit costs (Costin) as summarized in the following formula (Bernolak 1997).
Productivity zooms into the system and is often used as indicator for better performance of the company. Actually many people who make decision of plant efficiency do not know what it exactly is (Björkman 1991). It is defined as the ratio between output (i.e. produced goods) to input (i.e. consumed resources), opposite of this performance is for example also related to the economical affects. Often companies link productivity directly to profitability what results in a lack of improvements in productivity. The definition of productivity is well described by Bernolak:
“Productivity means how much and how well we produce from resources used. If we produce more or better goods from the same resources we increase productivity. Or if we produce the same goods from lesser resources, we also increase productivity. By “resources”, we mean all human and physical resources, i.e. the people who produce the goods or provide the services, and the assets with which the people can produce the goods or provide the services. The resources that people use include the land and buildings, fixed and moving machines and equipment, tools, raw materials , inventories and other current asset (Bernolak 1997).”
Summarizing, a good productivity is achieved by elimination of “waste” in the process as known from the lean principles. The productivity is summarized with the output quantities (Nout) per input quantities (Nin), as in the form of a formula:
Efficiency and effectiveness create the coherence and overlap between the improvement terms for the three P’s as shown in Figure 3.2. The terms are often confused with each other. In general it is described by the definition of Sink and Tuttle (Sink et al. 1989) as effectiveness is “doing the right things” whereas efficiency means “doing things right”. To explain this a little better Neely’s explanation is used:
“Effectiveness refers to the extent to which customer requirements are met, while efficiency is a measure of how economically the firm’s resources are utilized when providing a given level of customer satisfaction (Neely et al. 2005).”
From these definitions it can clearly be seen that effectiveness is strongly related to what the customer wants whereas efficiency describes utilization of resources and by that mainly effects the productivity ratio (Tangen 2005).
Figure 3.2: The tirple P model (Tangen 2005)
Operational Performance 27
Literature study V. Groeneweg
3.2 Performance of a BHS In the 90s the market for air handling in the EU was liberated to reduce the operation costs and to improve the quality of airplane handling. Before this time transportation was regulated, because it was seen as a part of public interest and involvement of the state was considered as necessary (Schmidberger et al. 2009).
The liberalization of the process resulted in competitive pressure on the air side, but also especially on the ground side (Albers et al. 2005). The importance of the performance of the BHS can be seen from the fact that ground handling, what includes handling of passengers, baggage and airplanes, is getting the biggest challenge and main factor that determines sustainable success (Gonnord et al. 2000; Wyld et al. 2005).
Currently the performance of airports is mainly viewed from the perspective of the airport as an organization, not for the different parts of as for example the BHS (Francis et al. 2005). Besides that the factors are mostly concentrated on the financial performance what is of importance for the investors. Schmidberger (Schmidberger et al. 2009) argues that a Performance Measurement System (PMS) is missing in the industry to combine the financial performance with the given quality, resulting in the ability to benchmark the performance with competitors. To improve the industries’ performance Schmidberger set up a PMS to answer the important question: “what are our competitors doing?”.
In this part the main performance indicators for the stakeholders are described. This is done following the description of the definition as stated in chapter 3. The separation of performance in efficiency and effectiveness is used to split the indicators in utility and customer agreement level.
3.2.1 Performance indicators of a BHS It is easy to create a complete list of measurables, but with that it is difficult to see the relations between the indicators. Although for companies it is common to have a list of 30 – 40 factors that describes the performance (Bernolak 1997). The performance of the system should be judged by an appropriate set of criteria that fits the objectives for the stakeholder for example the airline or airport (Lodewijks 2016). This requires an extensive research, because it is necessary to understand the inter-relations between the different factors.
Choosing the wrong indicator Choosing the right performance indicators is difficult and as stated, choosing the wrong indicators may lead to improvements of the wrong part of the process. An example of this is a story of a baggage handling process, where the essential performance indicator was “to get the plane of on time” (Friedli et al. 2013). When this was not reached the responsible department were blamed for that. The departments became very self focused on the indicator what resulted in handlers pushing bags a side, lost them or even put them on another plane to prevent late departure of the flight. Worst incident of all was a baggage handler who took a screw driver and stuck it in a conveyor, causing a halt. Therefore the system was considered as broken, so it was not the blame of the handling department. Obviously this did not improve the performance of the handling process, while just for the indicator it looked that the department was well functioning.
Categorization The categories from the definition of performance are used to list the indicators. Besides that the factors of productivity are split in efficiency and effectiveness factors. The list is based on literature (Weber et al. 2005; Bauer 2011; Kaplan et al. 1992; Bernolak 1997) and is created to visualize the writer’s vision on how several indicators can be categorized. The list is a shortlist, complete insight in the system is required to set-up a complete list of measures.
28 Operational Performance
Literature study V. Groeneweg
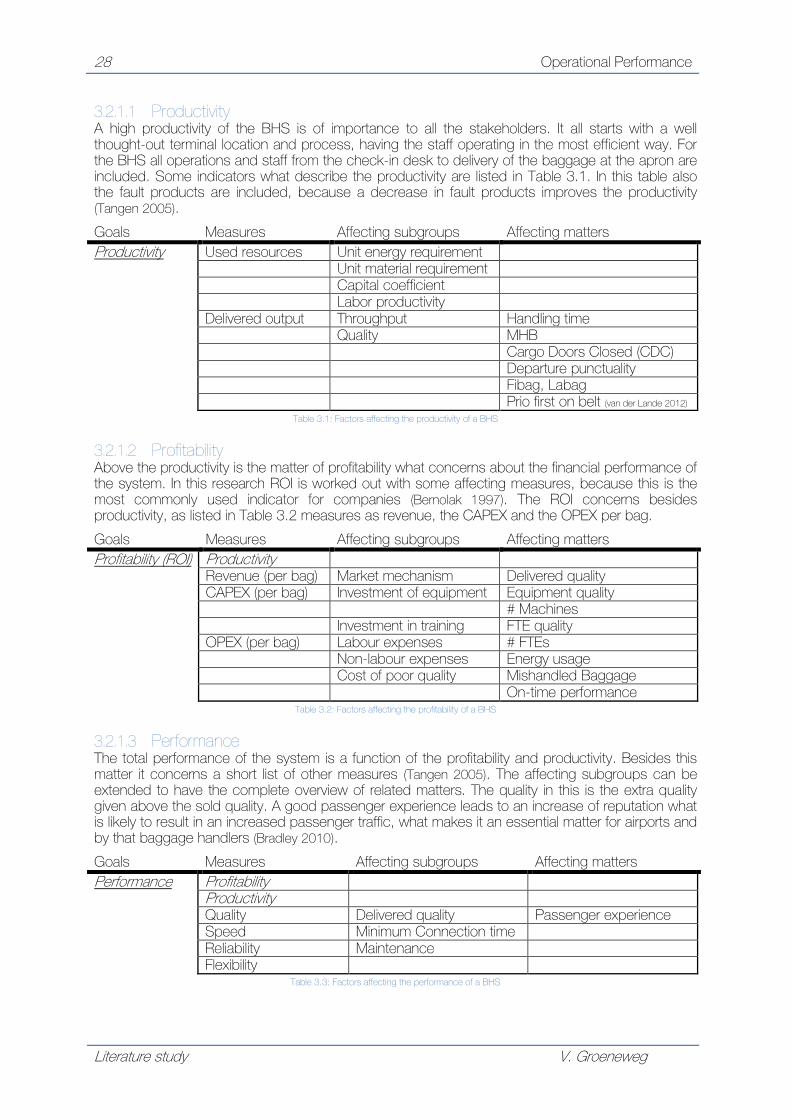
3.2.1.1 Productivity A high productivity of the BHS is of importance to all the stakeholders. It all starts with a well thought-out terminal location and process, having the staff operating in the most efficient way. For the BHS all operations and staff from the check-in desk to delivery of the baggage at the apron are included. Some indicators what describe the productivity are listed in Table 3.1. In this table also the fault products are included, because a decrease in fault products improves the productivity (Tangen 2005).
Goals Measures Affecting subgroups Affecting matters
Productivity Used resources Unit energy requirement Unit material requirement Capital coefficient Labor productivity Delivered output Throughput Handling time Quality MHB Cargo Doors Closed (CDC) Departure punctuality Fibag, Labag Prio first on belt (van der Lande 2012)
Table 3.1: Factors affecting the productivity of a BHS
3.2.1.2 Profitability Above the productivity is the matter of profitability what concerns about the financial performance of the system. In this research ROI is worked out with some affecting measures, because this is the most commonly used indicator for companies (Bernolak 1997). The ROI concerns besides productivity, as listed in Table 3.2 measures as revenue, the CAPEX and the OPEX per bag.
Goals Measures Affecting subgroups Affecting matters
Profitability (ROI) Productivity Revenue (per bag) Market mechanism Delivered quality CAPEX (per bag) Investment of equipment Equipment quality # Machines Investment in training FTE quality OPEX (per bag) Labour expenses # FTEs Non-labour expenses Energy usage Cost of poor quality Mishandled Baggage On-time performance
Table 3.2: Factors affecting the profitability of a BHS
3.2.1.3 Performance The total performance of the system is a function of the profitability and productivity. Besides this matter it concerns a short list of other measures (Tangen 2005). The affecting subgroups can be extended to have the complete overview of related matters. The quality in this is the extra quality given above the sold quality. A good passenger experience leads to an increase of reputation what is likely to result in an increased passenger traffic, what makes it an essential matter for airports and by that baggage handlers (Bradley 2010).
Goals Measures Affecting subgroups Affecting matters
Performance Profitability Productivity Quality Delivered quality Passenger experience Speed Minimum Connection time Reliability Maintenance Flexibility
Table 3.3: Factors affecting the performance of a BHS
Operational Performance 29
Literature study V. Groeneweg
3.3 Conclusion: Operational performance of a BHS In this chapter the performance of a BHS is approached form a theoretical point of view, what ends with the factors to describe the performance of a BHS. The questions answered in this chapter were:
What is operational performance and how are Efficiency and Effectiveness related to this? What are key performance indicators for a BHS?
Theoretical view on operational performance Firstly operational performance is considered as a kind of vague definition, because most people mean something else with it. As a result of this it is important to define the used definition to categorize the performance indicators in an appropriate way.
Operational performance is seen as the overarching umbrella what concerns the achievement of goals set in advance or compared to a kind of benchmark. Profitability falls below this and takes into account the profit earned per required costs. Often wrongly distinguished from this is productivity what explains how well the process functions concerning the amount of resources required to produce an amount of products. In this the costs are by that not included.
Efficiency and effectiveness describe factors in two main categories for performance, profitability and productivity. Efficiency describes how economically well a firm’s resources are utilized where-as effectiveness displays the ability to which extent the customer’s requirements are met.
Key performance indicators of a BHS The performance of a BHS can be increased by multiple indicators as seen from the given lists what are even still not all the indicators. As stated indicators influence each other and by that it is hard for companies to choose an appropriate set of criteria (Friedli et al. 2013). A decrease in handling time for example would suggest a improvement in productivity. Actually this is only the case when the output increases more than the amount of required resources.
From literature it is given that MHB is an often used indicator to measure a part of the performance of a BHS (Alsyouf et al. 2014). The tables provide that this indicator influences the performance of the system in several parts of the measurement. It also shows that this indicator contributes in efficiency matters, because of the costs, as well as the effectiveness what is a result of the increasing passenger experience.
As explained it has to be kept in mind that changes in the system affect the performance of the system. An improvement could by that improve one indicator while it affects another. It is strongly advised to deeply analyze the system to understand the factors affect each-other before doing improvements. This to have a clear view on the possible outcome of the improvements.

30 Mishandled Baggage
Literature study V. Groeneweg
4. Mishandled Baggage The key factor in ranking the performance of commercial air carriers and airports is the rate of MHB (“Air Travel Consumer Report” 2003; Bowen et al. 2003). This rate, also called irrate (irregularity rate), represents the amount of baggage per 1000 handled pieces not being able to reach the passenger’s destination on time without any damage. The rate of MHB is of such importance, because it is immediately related to the savings and passengers satisfaction. Having a mishandled bag as a customer directly reduces the customer’s pleasant of the trip what results in chosen having less faith in the specific airline of airport. It costs a service firm six times more to obtain a new customer as what it costs to retain the current customer (Wyld et al. 2005). Airlines and airport, of course want to reduce this feeling and the related costs as much as possible what results in factor of MHB being of high importance.
The factor of MHB can be divided into 4 different categories (Alsyouf et al. 2014):
Delayed (put on a later flight) Damaged Items missing from the baggage Lost or missing in its entirety
WorldTracer, a special service provided by SITA/IATA, takes care of the task to analyze the cause of the MHB and by that provides the number of MHB of 99% of all the airports. (A.A.S. 2012).
Finding the root-cause or to define whether the airline, airport or ground handler that caused the MHB is a complex operation. All the track points need to be analyzed for the specific bag through the handling process until the point where the bag is reported as missing. The complexity of this matter also results in having a MHB assigned to an airline or airport while this is not directly responsible for that. This matter needs to be taken into account when analysis is done on the number provided of rate of MHB.
4.1 MHB facts and trends The total amount of passengers transported by airlines keeps on increasing, from 1.89 billion in 2003 to 3.54 billion in 2015 (SITA 2016). These numbers are recorded with the worldwide amount of MHB from 2003 as shown in Figure 4.1. In 2007 the total number of MHB peaked till 46.9 million, with a cost of US$4.22 billion and a MHB rate of 18.88. Due to the recession and oil prices the industry focused more on the reduction on costs. This resulted with some technical innovation to an almost constant reduction of total MHB until 23.1 million bags in 2015. The related costs were reduced to US$2.3 billion with a average MHB rate of 6.53.
Figure 4.1: Trend of passengers and bags mishandled (SITA 2015)

Mishandled Baggage 31
Literature study V. Groeneweg
The profit of an airline is directly related to the amount of MHB, because on average one mishandled bag costs an airline US$100 (SITA 2014). In 2016 airlines had on average US$216 operating costs per passenger from what US$0.73 was of MHB. When this is put in perspective of the US$11.61 of profit per passenger it is clear that a reduction of the MHB rate affects the profit margin positively (SITA 2016).
Besides costs, the customer experience is of great importance to the airlines. On average the passenger wastes 1.7 days of its journey waiting for the bag (SITA 2016).
As a result of the airline’s focus to reduce costs, the Low Cost Carriers (LCCs) further discharge themselves from Full-Serivice Carriers (FSCs) by charging passengers for extras. The service-quality LCCs reduces roughly to 80% while the costs are only 50% of the FSCs, what declares the reason for the fast growth of LCCs (Franke 2004). The LCCs use narrow body airplanes and only invest in new technology with the aim to reduce the landing fee charges to an absolute minimum (Kohlmann 2012; Bradley 2010). The extra fees immediately affects the amount of bags passengers take with them, globally this reduced to 1.2 bags in 2015. The majority checks in one or more bags, but also one out of five passengers takes only carry-on bags (SITA 2016).
4.1.1 MHB procedure The MHB can be reported by the passenger with a Property Irregularity Report (PIR). The passenger can report this at the desk of lost and found or depending on the airline also online. A complete guide is given to the passenger to describe the bag. The same procedure is done when a bag arrives without a passenger and by that WorldTracer searches in its network for a match. It is said that 12% of the missing baggage cannot be linked to a passenger, because the passenger did not write the correct bag number on the PIR (Lemmen 2016).
4.2 Categories of MHB The gathering of MHB data is done by WorldTracer, what is yearly analyzed by SITA in a baggage report. The reports show that in the transfer part of the process the highest rate of mishandling is (45%). The technical reasons do not come out of the reports, but it is clear that the transfer baggage goes through most process steps while arrival and departure bags only have a part of that. The rate of transfer mishandling immediately declares the low MHB scores of transfers hubs like A.A.S. with approximately an irrate of 24 (per 1000 passengers, in 2015) , where 70% of the handled bags is a transfer bag (Lemmen 2016).
The worldwide baggage handling analysis of SITA in 2014 in Figure 4.2 visualizes in what part of the process the mishandling occurs. Next to that the results for 2013 of MHB are shown in Figure 4.3. The data is helpful when it is available from different airports and can be used to compare the handling process, according to the airport characteristics. Although this does not immediately gives insight in the technical reasons, because a fault can influence multiple categories.
Figure 4.2: Reasons for delayed bags in 2014
(SITA 2015)
Figure 4.3: Breakdown in 2013 of mishandled bags
(SITA 2014)

32 Mishandled Baggage
Literature study V. Groeneweg
The practical reasons for mishandling are investigated by Lemmen (Lemmen 2016) for the baggage handling process of A.A.S. The causes are not directly coupled to numbers, but it gives a good insight in the mishandling causes for different parts of the process. The process itself is categorized into; check-in, sorting, loading, transfer, unloading and reclaim. The main causes for the different procedures are clearly visualized in Figure 4.4 with the route the bag follows. In this can be seen that the causes are categorized on the procedure, but not yet on the kind of failure.
Figure 4.4: Possible process errors (Lemmen 2016)
This literature report aims to categorize the reasons of mishandling to the practical reasons, this to join improvements in general to the specific cause. Therefore the categorization of Alsyouf (Alsyouf et al. 2014) is used, who a separated failure modes. The categorization was based on a survey with 221 employees of an international airport in the United Arab Emirates.
The categorization is regrouped based on the writers vision to join causes to improvement methods. The combination of both charts is shown in Figure 4.5. The causes of MHB are separated into four main categories namely: Fallen bags, Human error, Lack of resources and others.
Figure 4.5: Pie chart of causes of MHB, based on (Alsyouf et al. 2014)

Mishandled Baggage 33
Literature study V. Groeneweg
4.3 Conclusion: Facts and trends of MHB The importance of the MHB rate, comes from the previous chapter and in this chapter the factor is put in more perspective to answer the following question:
What is the MHB factor and what are current trends in this?
From this chapter it results that the factor of MHB decreases the past years per 1000 handled bags. However still the rate is of great importance, because mishandled bags costs the airlines in general US$0.73 per handled passenger. What is a significant cost if it is seen in perspective with the US$11.61 profit per handled passenger.
Categorization It can be concluded from this chapter that faults occur in every step of the handling procedure, as shown in Figure 4.4. The main causes are grouped based on the data of Lemmen and the categories created by Alsyouf . When this grouping is a little simplified the main categories result in Fallen Bags (36%), Human errors (23%), Lack of resources (32%) and others (9%).

34 Causes and improvements of MHB
Literature study V. Groeneweg
5. Causes and improvements of MHB In this chapter the methods to reduce the number of mishandled bags related to main causes are given. The causes are divided into the categories from chapter 4; Human error, Fallen bags and Lack of resources. From literature is found that commonly errors are also related to errors in tracing, what has overlap with several categories. That is why an extra category is created what has overlap with human errors and technical failure from the category lack of resources in Figure 4.5. It is intended is to fit the solutions in one of these categories with subcategories, although a solution might also affect the causes in other categories.
5.1 Human error The human still plays an important part in the whole process of baggage handling, because the process itself is mostly labor intensive. The reason for this can be found in the investment costs of machines and the flexibility of manual operations. The downside of manual operations is that humans can make faults if something has to be done in an amount of repetitions.
In principle the human error occurs in three ways; input faults of the bag in the system by the staff or the passenger, (un)loading fault or stolen bags at the reclaim area.
5.1.1 Input faults The passenger arrives at the airport and is separated from its cargo-baggage at the check-in desk until the reclaim area at the outbound-airport. The bag’s important data is collected from a bag tag with a barcode what is attached to the bag at the check-in area.
5.1.1.1 Causes of Input faults Often mistakes at the check-in desk are:
Type error Attach of bag tag to wrong bag
A mistype by staff or the wrong bag tag is of high urge, because this can result in the bag going completely on another flight. Main reason for “unknown” tags were found to be the wrong first digit of the license plate (IATA 2012a). Reasons for this can be the lack of training or awareness of the staff.
5.1.1.2 Methods to reduce input faults A mistake at the check-in procedure by the staff can have big consequences on the correct handling of the bag. The errors caused by a mistake of the staff can be minimized by improving the quality of the staff. This means to improve the awareness of the staff to handle the bags following the procedure and being more aware of the mistakes and impact of that on the system. Options to improve what are found in literature are:
Training Decrease temporary workers Performance meetings Award perfectness

Causes and improvements of MHB 35
Literature study V. Groeneweg
Training The current training length on the handling procedures for the specific process is one month. It is stated that an increase of the training into a length of two months helps reducing the amount of MHB (Alsyouf et al. 2014). The correctness of labeling (Figure 5.1), including the often forgotten removal of the old baggage tags should be part of this training. The staff should be aware of the consequences caused by their mistakes. This can be achieved by giving an operation tour through the handling system, from practice is shown that this improves the performance of the system. (IATA 2012b)
Decrease amount of temporary workers Throughout the year the demand of the system is not equally divided. The winters, summers and festival months are the busiest seasons. The fluctuation in the demand requires an appropriate planning through the year for the staff. Temporary workers are because of this sometimes used, what could affect the quality of the handling process (“Beyond Point Solutions: Strategies for Optimizing Baggage Handling to Increase Customer Loyalty” 2014). Although it is mostly difficult to implement, it has to be intended to in general rely on full-time workers what improves the delivered quality.
Performance meetings Giving a better insight in the performance of the systems creates awareness of the staff to perform through a certain quality. This awareness can be achieved by having weekly meeting with the key-personal involved in baggage activities. The main performance and the identified issues can be discussed where-after the manager can discuss the results with the direct staff as for example the check-in agents (Hendry et al. 2010).
Award perfectness Often forgotten part to increase the involvement and thereby the quality of the staff is by awarding the excellent performing employees. It could also be decided to set certain performance goals for the team, what could improve the group banding (Alsyouf et al. 2014).
Figure 5.1: Check-in agent attaches bag-tag (“Allwidewallpapers” 2016)
5.1.2 (Un)loading faults The (un)loading faults occur in the transport process from or to the airplane across the apron by a truck. This kind of faults are also a category in the data collection for mishandled bags by SITA (SITA 2016), as seen in Figure 4.2 this represents 6% of all the causes.
5.1.2.1 Causes of (un)loading faults The faults in (un)loading are split up the following causes:
Forgotten bag / cart on apron Fallen bag of tug
Forgotten bag / cart on apron The bags and containers are, for both loading and unloaded, transported by a truck with several carts over the apron. A fault in the transport process may result in bags or carts left behind on the apron or bags arriving too late what can result in a bag missing the flight. Largest reason for this is the amount of different priority carts (Lemmen 2016). Another reason is for example seen at A.A.S., where a truck normally only takes two carts. Sometimes, by a mistake, three carts are taken to the unloading station what does not fit. One cart is parked outside to be picked-up after unloading, but when the driver forgets this it results in a late delivery of bags into the system.

36 Causes and improvements of MHB
Literature study V. Groeneweg
Bag dropped from tug A bag sometimes falls of the cart during transportation over the apron. It happens that the driver does not notice this fallen bag what results in a bag laying on the apron. A special SOS team is therefore on the apron to pick-up all the bags that lay on the roads. However sometimes still these teams arrive too late with the bags at the destination, what results in a bag missing its flight.
The process of (un)loading of the airplane by the ground handlers can be improved to reduce the amount of mishandled bags by a better prioritization the bags and the scanning of the carts coupled to the bags or even signal when bags fall bags of the carts.
Too much priority bags The organization of the priority bags needs to be improved to have a better overview of the different priorities. The staff needs to be trained to unload the airplane in such a manner that a certain priority is always placed on one specific (side of a) cart. This reduces the fact that some carts are sometimes forgotten (IATA 2012c).
Scan carts and destination An increase in the amount of scanning locations could reduce the amount of carts that are delivered to the wrong location. Carts can be scanned including the delivery location to check the correctness at the moment of delivery.
5.1.2.2 Methods to reduce (un)loading faults The process of (un)loading of the airplane by the ground handlers can be improved to reduce the amount of mishandled bags by a better prioritization the bags and the scanning of the carts coupled to the bags or even signal when bags fall bags of the carts.
Too much priority bags The organization of the priority bags (what is done at the moment shown in Figure 5.2) needs to be improved to have a better overview of the different priorities. The staff needs to be trained to unload the airplane in such a manner that a certain priority is always placed on one specific (side of a) cart. This reduces the fact that some carts are sometimes forgotten (IATA 2012c) and creates that the in-feed (Figure 5.3) is done in the right order.
Scan carts and destination An increase in the amount of scanning locations could reduce the amount of carts that are delivered to the wrong location. Carts can be scanned including the delivery location to check the correctness at the moment of delivery.
Fallen bags The bags that fall from the cart when driving across the apron (Figure 5.4) can be reduced by having enough carts at location. Besides this it is possible to signalize when a bag falls out of the cart using techniques from chapter 5.2.2 or even other techniques. The driver or the SOS team can with this immediately be informed when a bag lays on the apron.
Figure 5.2: Unloading and prioritization
(McCartney 2014)
Figure 5.3: In-feed of bags from airplane
(Lodewijks 2016)
Figure 5.4: Bag transported across the apron
(“Planit” 2016)

Causes and improvements of MHB 37
Literature study V. Groeneweg
5.1.3 Stolen bags At the final part of the travel the passenger picks-up the bag from the reclaim area, however nobody checks if the passengers take the right bag with them when they leave the reclaim area. For that it can (even accidentally) happen that the wrong bag is taken from the reclaim area. It is said that not much baggage at the reclaim area is stolen. This because of the high security level of the reclaim area and in airports, however this security level depends on the airport and the country what sometimes results in higher chances of stolen bags at the reclaim area (Hans 2015).
5.1.3.1 Methods to reduce stolen bags In industry there is, as stated, little difference in layouts of the reclaim areas. They differ in size and kind of belt, but besides this the principle is everywhere the same. Although this, new initiatives are brought up to decrease the amount of stolen bags and as a part of that have a better customer experience The initiatives are related to:
Improved tracing Reconciliation check Home-delivery Reclaim concept
Improved tracing For most airports it is still not possible to guarantee that all the bags are scanned in every step of the process. To prevent baggage of getting lost or stolen some airlines offer an optional service to track the baggage through the system. As a result of this technologies a better insight in the location of the bag is gained. An example of this is the eTrack and eTag technology by eviate and supported by Air France and KLM (Figure 5.5). Passengers can buy the device and put the flight data on it with an application. The device uses GSM, GPS and Bluetooth technologies to send the current location to the passenger. To meet flight regulations it uses a special flight mode to ensure that the device is switched off during the flight. Besides this, the improved tracing increases the passenger experience by decreasing the time at the check-in, because the bag can be immediately dropped off at the drop off point. Passengers need to wait until the roll-out of this technology, probably around June 2017 (SITA 2015).
Reconciliation check Most airports do not check if the passenger take the right bag with them. However at some airports people check manually if the passenger takes the right bag, but this is said to be very slow. A barcode reader could speed-up this process, but still the process would be considerable slow (Bite 2008). New tracing technologies might help in improving this process.
Home-delivery A service provided by some airlines and some external companies is to bring the bags to the destination of the passenger (Boute 2016). An example of a delivery point for this is shown in Figure 5.6. This results in passenger not having to wait at the reclaim area and carrying their bags, while it also reduces the amount of stolen bags. Travel Light a Dutch company provides for example door-to-door service within Europe for around sixty euro’s and Sendmybag.com from the UK even send bags over the world.
Improved reclaim A concept created by Boute (Boute 2016) to have a secure reclaim procedure with lockers what can only be opened by the passenger (Figure 5.7). However this needs probably extra space it does create some rest for the passenger. The passenger can pick up the bag from the locker when a message is received, a passenger is by that certain that the bag cannot be stolen.
Figure 5.5: eTag tracing device (“Futuretravelexperience” 2016a)
Figure 5.6: Bag delivery service at Gatwick
airport(“Futuretravelexperience” 2016b)
Figure 5.7: Concept with reclaim lockers
(Boute 2016)

38 Causes and improvements of MHB
Literature study V. Groeneweg
5.2 Tracing error Almost all of the airlines and airports still use the barcode technology to trace the bags. This technology has advantages in costs, but can have problems with traceability where it has an average read rate of 85% (Bite 2008). In the matter of MHB, 9,7% is said to be due of reading errors (IATA 2007).
5.2.1 Causes of tracing errors The reasons for the reading errors are from some part caused by human faults, what is explained in the previous chapter. Besides this the technology and the system design have influence on the traceability of the bags. For that main reasons of tracings errors are said to be:
Vulnerable tags Equipment design
Vulnerable tags The system used in general is tracing with barcode labels on the bags. This system is a great system from cost perspective and the ease of usage. However the tag itself is a long piece of paper which can only be read when it is visible. When it is not attached appropriate by the staff or something happens during operation this results in a misread error. One worker scans the unreadable tags manually and throws them back into the system. This causes little delay, however this can drastically increase when the amount of misread bags increases (van der Lande 2012).
Equipment design The sorting of bags can be done with high speed pushers which literally push the bag with a swing of the moving belt. The forces used to push the bags of the belt can be considerable and this is where the damage of the bag or bag label usually occurs (IATA 2004). The damage onto the bag can even result in an explosion when bags are transported what contain explosives with sensitive electronics, that are not yet cleared by the screening process.
5.2.2 Methods to reduce tracing errors The airlines are moved by the IATA to a better tracing rate with the resolution 753. Goal of this resolution is to decrease the amount of mishandles baggage and increase the passenger experience by having information of bag’s position. The resolution forces airlines and by that the airports to have the tracking points with airplane loading, arrivals inject and transfers inject (Madsen 2016). The technology required for tracking is still not chosen, what keeps space for airports to decide what is preferred. The currently well used barcode scanning method has some pitfalls, what results in the staff needing to scan unread tag manually as shown in Figure 5.8, therefore some improvement methods are shown for this technology.
5.2.2.1 Improved barcodes The complexity of the tracing system combined with the related risks and costs make that airports currently stay with the barcode technology. For most airports it is easier to invest in methods to improve the pitfalls of the barcode technology compared to an investment in a new technology. Some general methods to improve the reading rate of barcodes are listed below.
Less high speed pushers The designer of the BHS should keep in mind to decrease the amount of high speed pusher and use verti-sorters if possible. The pushers should be considered as second choice while they inflict in general more damage to baggage and can be the cause of label damage, as a result of the vulnerable bag label (Figure 5.9) (IATA 2004).
OCR Already commonly used is the automated tag reading, but sometimes this system cannot read the tags as a result of creases. Optical Character Recognition (OCR) is an algorithm that can be applied to the scan software to improve the reading rate positively (Madsen 2016).

Causes and improvements of MHB 39
Literature study V. Groeneweg
Colored tags The order of unloading the bags can be improvement by implementing different colors for several levels of urge. As an example of this at Athens International Airport they implemented different colors for short connection and long connection bags (IATA 2012b).
5.2.2.2 NFC The technology used to pay cashless is Near Field Communication (NFC) and can also be used to trace bags. NFC can be used without power and has a range of maximum ten centimeters. This short maximum distance, makes the it less usable for tracing bags as it might be a challenge to ensure the correct orientation of the bag. (Lemmen 2016)
5.2.2.3 GPS Global positioning of the bag can be provided with GPS, although this only accurate until a range of fifteen meters. This makes it less usable as tracing method for sorting of bags, but it can provided the passenger at least general information about the bag’s position.
5.2.2.4 RFID In general the RFID technology is seen as the innovation airports need to follow in order to improve their tracing in a reliable and cost-effective way. As a start of movement IATA (IATA 2007) created a transition plan to implements RFID tagging at 80 airports responsible for 80% of the baggage claims. The technology is still more expensive than barcodes, but price has fallen steadily the past years and is suspected to decrease further with a higher adoption in the industry. The technology uses similar to NFC a chip as shown in Figure 5.10, using radio waves to transfer data even without a battery. The RFID operates under a distance of 2-300 centimeters (“IATA - Travellers Frequently Asked Questions” 2016), with this a reading rate of 99.96% is achieved while for barcode scanning it is around 90% (McCartney 2014).
5.2.2.5 LoRaWAN An innovation what is part of the development of the Internet Of Things is the Long Range Wireless Networks (LoRaWAN). With KPN as service provider, the Netherlands is currently the only country with a nationwide network. An antenna provides a 10km range and nodes can perform over five year on only four penlight batteries. The technique is already being in the a concept testfase at Amsterdam Airports Schiphol for the tracing of bags. (“KPN Corporate” 2016)
Figure 5.8: Employees scanning baggage by hand
(Lemmen 2016)
Figure 5.9: Vulnerable long barcode tag
(“RFID Applications” 2016)
Figure 5.10: RFID tag in a barcode tag
(“AviationPros” 2016b)

40 Causes and improvements of MHB
Literature study V. Groeneweg
5.3 Fallen bags This category spreads from check-in desk until the make-up area, so it considers all the reasons for bag falling of mostly the conveyors. As seen in the pie-chart from Figure 4.5, the fallen bags is one of the main issues what causes MHB. This is one of the reasons why it is important to decrease the causes of fallen bags, but besides that a falling bag can cause damage in the system’s critical components such as sensors and moreover it affects the safety of the staff.
5.3.1 Causes of fallen bags The causes of fallen bags are mostly related to the equipment design and human faults or a combination between these two. In general it can the main causes can be divided into four main groups concerning:
Bag’s shape and position Inclinations and declinations Abruptly start/stop
5.3.1.1 Bag’s shape and position Most BHSs cannot handle irregular shaped or large bags. That is why most airports have separate desks for OOG-baggage. Main cause of falling bags is still the handling of irregular shaped and light weight bags through the normal system (Alsyouf et al. 2014). These bags have problems with sharp curves or steep declines in the belt.
The position of the bag on the conveyor is mostly important to avoid rolling of the bags and still having the right tracking capabilities. An example is that bags should not be places on the wheels on the conveyor while the bag can because of this start to move. Another part is that the bag should be correctly aligned on the belt such that it does move and the tag is easily readable for the system.
5.3.1.2 Inclination and declinations The number- and especially the degree of inclinations have affect on the amount of fallen bags. The bags are only kept in place by the down force combined and the friction with the bag. As a result of this also light bags tend have a high chance of falling of the belt (Alsyouf et al. 2014).
5.3.1.3 Abruptly start/stop Bags with wheels or with a cylindrical profile have high chances to roll if the (de)-acceleration is too high (IATA 2004). Main issue are the abrupt stops when a jam or conjunction occurs, as a result of one the of the hot-spot areas of fallen bags is the end of the sorting line (Alsyouf et al. 2014).

Causes and improvements of MHB 41
Literature study V. Groeneweg
5.3.2 Methods to reduce fallen bags The main issues for fallen bags can be prevented by changing a part of the design of the system. The solutions are listed for every problem that was pointed.
5.3.2.1 Bag shape and position The system can be improved to make the system less vulnerable for bag shapes and wrong positions. This can be done by having implementing the next for the system:
OOG information and training Cart based systems Bag scanning Spacing dots
OOG Information and training It must be clear for the passengers and especially the agents at the check-in desk what is considered as OOG-baggage. By that the amount of OOG-bags, what is put into the normal system will be reduced.
Cart based systems The transport of irregular bag shapes (car seats, rounded duffels) and light weight bags should be done with a cart based system or also called tubs, as one example an individual cart based system is shown in Figure 5.11. The bags are better kept in position what in combination with the cart tracking also results in better tracking capabilities (T.S.A. 2007).
Bag scanning The system should be able to recognize if oversize bags are put into the system. Besides this the orientation of the bag should be scanned with, so called, BMAs. After recognizing a wrong position a diverter can forward the bag to an area where an operator takes care of the position or put it into the OOG-system (T.S.A. 2007).
Spacing dots The system mostly has problems with handling of bags what have a short distance in between. It can result in tracking problems, but moreover blockages and baggage damage. The ground handlers try to empty the carts fast to reclaim area, so it is sometimes difficult to keep the distance. For that spacing dots on the conveyor (as shown in Figure 5.12) can help the ground handlers by instructing them to only put the bags on the dots (IATA 2012b).
5.3.2.2 Reduction of inclinations Due to the complexity of a BHS it is often required to have inclinations and declinations (like in Figure 5.13). These are a crucial reason for fallen bags, so by that the design rules should be taken into account. As provided by the IATA conveyor slopes should not exceed 18° (32%) (IATA 2004).
5.3.2.3 Abruptly start stop The abruptly start and stopping of the system needs to avoided to have no rolling bags as a result of this. The rolling bags can fall out of the system, but can also influence the tracking capabilities of the system. A system to avoid this is dynamic braking or clutch brakes on frequent stopping zones. It is required to use this system on all conveyors in diverts and merges (T.S.A. 2007).
Figure 5.11: ICS of vanderlande
(“Vanderlande” 2016e)
Figure 5.12: Spacing dots at Athens airport
(IATA 2012b)
Figure 5.13: Inclination in a BHS
(“Clxengineering” 2016)

42 Causes and improvements of MHB
Literature study V. Groeneweg
5.4 Lack of resources The last category is the lack of (efficient use of) resources. Having a better availability of the equipment and staff, immediately has effects the system’s throughput. A better planning of resources means a lower load on the system what means that there is more time to act when some flaws happen during the process like a falling bag. With the right amount of resources this would not result immediately result in MHB, while with a high peak load it can drastically increase the amount of mishandled bags. The causes are divided in equipment-, staff planning and communication in what the methods of improvements are directly joined these causes.
5.4.1 Equipment planning It is considered that the airport’s BHS is well designed; it is able to handle the required capacity over a certain time. However, sometimes it happens that the system cannot handle the required capacity anymore what results in delays. In this chapter the main causes of a lower available system capacity are given including the improvement methods.
5.4.1.1 Causes of equipment errors The availability of equipment is related to amount of maintenance what is provided to the system. Firstly a lack of maintenance, results in equipment breakdown what can result in long delays. Opposing the system can have a too safe maintenance planning what results again in a lower availability. Secondly the maximum capacity in a certain timespan of the system is determined by capability to flatten the peak loads applied to the bottlenecks of the system. The main causes of a lack of available capacity can by that be divided into:
Maintenance planning Throughput planning
5.4.1.1.1 Maintenance planning Having the right maintenance planning is of importance to keep the system running. Making the right choices for this planning is a difficult procedure especially when the system is already behind schedule. It is often easy to steal from the maintenance windows to process all left-behind bags, although this can have it effects on the long-term availability of the system. (SITA 2016) If a breakdown occurs, mostly the existing damage increases, because the systems keeps on moving for some time. It depends on the redundancy of the system and the kind of breakdown how much MHB is caused by the breakdown.
Research is done for one airport in United Arab Emirates to determine the specific failure causes of the system (Alsyouf et al. 2014). Out of this came that the most critical reasons were mechanical failures as wear, tear, broken tongue, S-conveyors, roller worn out and physical damage of a sensor. The electrical failures are very few compared to the mechanical failures.
5.4.1.1.2 Throughput planning The usage capacity of the BHS becomes more and more a critical issue. The systems are operating mostly near, or even above the design peak (SITA 2016). This creates the urge of having a good throughput planning, what is related to the arrival pattern of the passengers and the flight schedule.

Causes and improvements of MHB 43
Literature study V. Groeneweg
Passenger arrival The scheme of passenger arrival differs per airport, time and the kind of flight. The figures mostly look quite the same, but they are only a little shifted or stretched for different flights. The peaks in the arrival pattern of passengers can easily be seen in Figure 5.14, where the difference is shown for the time of the flight.
Figure 5.14: Example earliness distributions before and after 9 A.M. (T.S.A. 2007)
Flight schedule For every airport the flight schedule differs, what is related to the airport’s function and customers. In the design of the BHS it is of high importance to know the arrival pattern of the flights with the capacity and destination information. An example is the arrival pattern at A.A.S., where the flights are scheduled in seven so called “waves” as shown in Figure 5.15. The morning starts with the arrival of intercontinental flights (grey arrow) and the passengers including cargo transfer onto the European flights (black arrow). After this European and intercontinental flights arrive for the first complete “wave”, where-after the second wave starts.
Figure 5.15: Flight arrival waves at A.A.S. (“KLM” 2016)
5.4.1.2 Methods of improvement The availability of the equipment’s capacity can be improved in several ways that give a better maintenance planning or throughput planning. This to overcome the main causes as explained in the previous chapter.
5.4.1.2.1 Maintenance It is crucial to plan the maintenance in such a manner that the system keeps reliable through time while the maintenance activity itself does not cause too much downtime. For that it is important to choose the right maintenance policy what will vary from airport to airport, according to the size and complexity and the operational duty of the airport. (IATA 2004)
Preventative maintenance The system has different types of equipment requiring maintenance at different times. With preventative maintenance it is reported what the Mean Time Before Failure (MTFB) is of all the equipment in the system. Predictions on the availability can be made with available software packages what also list the required actions (IATA 2004). Based on the breakdown data of the system optimal replacement times can be suggested as done by Alsyouf (Alsyouf et al. 2014).
Advanced sensed maintenance Another possibility is to sense the habits of the different equipment within the system and maintain when a measured value is critical. The system is complex with all the different kinds of equipment what makes it difficult to implement such a sensor based system (Alsyouf et al. 2014).

44 Causes and improvements of MHB
Literature study V. Groeneweg
5.4.1.2.2 Throughput Currently the make-up process of most airports is based on the push principle with what the arrival of the bag at make-up is immediately related to the check-in time. This process is also called unmanaged flow. In the process the screening and make-up are bottlenecks in the handling process and by that the handling time is all determined by the availability of those resources. A reduction of the peak loads can be established by an improved flow management with a bag storage or an extended check-in time with a bag collection service.
EBS Nowadays more and more airport want to control the peak loads on the system what is done by changing over to a pull system. A pull system manages the flow through the system by setting an opening time of the make-up area for a flight or even certain bag types. This is achieved by sorting and storing the bags before they are send to the make-up location. As a result a storage decreases the peak loads of the system and decreases the handling time, but it requires on the other side investments, space and increases the complexity of the system. Methods to realize an EBS are described in chapter 2.4.6.
Bag collection service The control of the baggage flow can be improved by extending the first time of arrival. As a result of this the make-up area can start earlier with loading of containers and carts what reduces the peak load. Opposing of this more bags will be inside the system what requires more investments and a greater urge of security to the storage. An example of available and designed peak-capacity is given in Figure 5.16 for Johannesburg airport.
Figure 5.16: Throughput in 24 hours for a BHS (Lodewijks 2016)
An upcoming trend is to achieve this by giving passengers the ability to check-in before they arrive at the airport. This can be at their hotel, train stations or even with a pick-up service from their home. Besides the effect it has on the system throughput a pick-service also increases the passenger satisfaction. The passenger does not have carry the bags to the airport what results in happier passengers (Van Zundert 2010). In Figure 5.17 an example is shown of the possible peak reduction with an early retrieval of baggage. It easy to see the difference in peak load decreases and the load on the system is equally divided over time for this flight.
Figure 5.17: Throughput of bags for a flight with current system and early arrival (Beumer Groep 2012)

Causes and improvements of MHB 45
Literature study V. Groeneweg
5.4.2 Staff availability As stated the whole operation of baggage handling is labor intensive from the point of check-in until the moment the bag is stored inside the airplane. The staff is, because of this, an important factor in the available resources for the system.
5.4.2.1 Causes of staff errors Like the equipment the staff can be less available due to kind of handling procedure. The main cause of a decreased availability is illness of the staff what is a result of manual operations and planning.
5.4.2.1.1 Manual operations There is a great difference in the availability of staff, mostly caused by the amount of sick days (Schmidberger et al. 2009). The illness is comes from the fact that the staff has to deal with the handling of heavy baggage during their work. At first injuries occur at the check-in, where the operator lifts a bag on the weigh conveyor. At this part twist injuries of the lower back occur what results in the staff being off for weeks. Secondly the most common injuries occur at the make-up area and the (un)loading process of the plane. The repetitive operation combined with the heavy weight of some bags and the far stress required results commonly in injuries. All these injuries are serious what can have an operator not able to work for weeks (Bentvelsen 2015).
5.4.2.1.2 Planning At some airports the planning of the staff is such that they work four days of 12 hours, where-after they have four days of rest (Alsyouf et al. 2014). Those working conditions have impact on the performance, health and safety of the staff. It even has happened that baggage handlers felt asleep while working inside the airplane. Some accidents are even known where the handlers woke up after the airplane already departed (Miller 2015).
5.4.2.2 Methods of improvement The most important part what affects the availability of the staff is illness, what is a result of baggage handling being labor intensive. The two main opportunities are seen to optimize the availability of the staff being; process automation and change of planning.
5.4.2.2.1 Manual operations A global trend is uprising to increase the level of automation of BHSs (Bentvelsen 2015). This decreases the handling load on the baggage handlers and increases the handling accuracy. With automation also labor-related errors are reduces what reduces the operation costs (Abdelghany et al. 2006). Some available technologies to reduce the amount of manual operations are listed below.
Loading manipulator Several semi-automated solutions are available to load the bags into the containers and carts. Some are shown in chapter 2.4.7 and the lifting solution can be seen in Figure 5.18. The process becomes more safe for the staff by what availability of the staff increases. Mostly the process itself does not become faster (Kohlmann 2012), but with the higher availability it can result in less operational costs. The solutions differ in the capabilities to handle different shapes of bags and to load (till the top) containers with bags. With some solutions it is still required to load the top bags into the ULD (half) manually.
Exoskeleton A new innovation is implemented by Tokyo’s Haneda Airport to equip the baggage handlers with an exoskeleton (Figure 5.19). The skeleton supports the muscles of the operator to reduce the lifting load on the operator. Currently no other airports are found that use this kind of technique, this is probably because it is a new technique and to the costs what is around US$1.100 a month (Weller 2015).

46 Causes and improvements of MHB
Literature study V. Groeneweg
Automatic loading A so called robot is already used at some airport to load the bags into the containers. As expected the robot picks-up a bag from the conveyor and automatically puts it on the right place inside the ULD. Robots require a pull management of the bags and with that it can also determine on for-hand the most efficient loading. Taking into account the available system capacity, but also the filling rate of the ULD. Currently one operator can do supervision of maximum four robots. As said by the supplier one operator normally handles around 20-30 bags per hour, whereas a robot can have a capacity of 120-300 bag per hour. An advantage of a robot is that it almost never has to stop, as it said to have an projected availability of 95% (ABB Review 2002).
Automatic unloading The unloading process can be automated in different methods, one Is by lifting and vibrating the ULD what is shown in Figure 5.20. The amount of operators is drastically reduced and besides that the speed of unloading is increased to 24 containers an hour. With a smaller team it reduces the risk of mishandling due to human errors (Beumer Group 2013).
5.4.2.2.2 Planning While it is often the case that employees work 12 hours shifts it is tried to decrease the load of the baggage handlers with a change in planning. The handling safety and employees health improves with this, including the performance. However it is said that an optimal schedule is found, this schedule is not shared by Alsyouf (Alsyouf et al. 2014). Clear is that this will reduce the length of the shifts.
Figure 5.18: Vacuum lifting of bags
(“Airport-Technology” 2016)
Figure 5.19: Exoskeleton used at Japanese airport (Weller 2015)
Figure 5.20: Automated unloading equipment of Moderniek
(van Kleef 2015)

Causes and improvements of MHB 47
Literature study V. Groeneweg
5.4.3 Communication The efficiency of the usage of resources depends on how the different parties involved in the handling procedure are coordinated and how they communicate. A lack or faults in communication or result in less information in a part of the process what can cause of MHB.
5.4.3.1 Causes of communication errors Firstly different parties are involved on the airport itself, different perspectives on the goals to reach in this affect the performance of the system. Secondly the bags arrive at a certain time from the inbound airport, the external communication and adaption of the system determines how efficient the bags can be handled with a low number of mishandled bags. Summarizing the communication can be split up in:
Internal Communication External communication
5.4.3.1.1 Internal communication The process of handling baggage is a very dynamic process with many departments involved. As a result of this it is highly important of having a good internal communication between these departments. Currently some problems occur with the following processes:
Delayed flights Late check-in Re-routing
Delayed flights The transfer flights often have short connection times what is done to minimize the ground time of the airplane and by that increasing the throughput of the airport. A side affect of short transfer times is that the handling procedure is immediately affected when the flight is delayed. From research at KLM (van der Lande 2012) was concluded that a late transfer bag has 2.6 times more chance of becoming a MHB. The reason for this is that for delayed arrival the required higher demand for staff and equipment often lacks in availability. Therefore the urgent transfer process are pulled into the system while it probably is already impossible to have the connection.
A typical delay pattern is shown in Figure 5.21, from what can be seen that on average the flights arrive at the scheduled time (A0). Besides this it shows that the flight what are delayed often have a long delays.
Figure 5.21: Delay distribution(T.S.A. 2007)

48 Causes and improvements of MHB
Literature study V. Groeneweg
Late check-in The check-in desk delivers the input of bags and passengers for the make-up and boarding process. Therefore, the staff behind the check-in desk determine if the passenger and bag can still be handled in the time before departure. The late checked-in bag is not always communicated on-time to the make-up area what results in too late loading and in the end MHB (Hendry et al. 2010).
One step further, containers and carts from the make-up area have a minimum time to arrive at the airplane before the departure time of the flight. For A.A.S. the latest delivery time of bags to the airplane is ten minutes in advance of departure, although no regulations are set for the amount of baggage what is delivered at that time (van der Lande 2012). Related to this is the fact that up to 8% of the MHB of Air France was delivered ten minutes before the initial departure time (IATA 2012a). A lack of coordination and communication with the ramp agent causes this, when the holds are already closed and by that the baggage is refused.
Re-routing When a flight is canceled, the airline tends to transport the passenger to their destination as soon as possible. This done by re-routing the passenger on the next available flight to the destination. Problems occur when the re-routing of the passenger is not communicated to the make-up area. Secondly the check-in agent does not always take into account the minimum connection time of rerouting of the passenger and bag what results in bags left behind (Hendry et al. 2010).
5.4.3.1.2 External Communication The external communication is considered as the communication with other airports in order to have a more efficient baggage handling process. Currently the handling process is arranged by a load sheet what is provided by the inbound airport. Still some factors related to this affect the rate of MHB.
Load sheets It depends on the inbound airport how much care is taken of the loading order to make the unloading more efficient. “The trade off in this lies between flying more efficient by dividing the baggage evenly over the airplane and dividing the baggage in such a way that it helps faster handling by the platform department (van der Lande 2012).” It happens that a mistake is made on the load sheet with too many or too few registered bags, this can cause delays when there are not enough drivers for the amount of bags (Lemmen 2016).
5.4.3.2 Methods of improvement As listed errors occur in several parts of the process as a result of a lack of communication. These processes can be improved with some standard rules for the handling process to reduce the amount of MHB.
5.4.3.2.1 Internal Communication The errors with internal communication were recognized in the handling of delayed flights, late check-ins and the re-routing of passengers. The amount of bags that are mishandled due to these processes can be reduced with the next solutions.
Delayed flights The higher chance for delayed flights to become MHB is probably related to the unplanned higher demand for the system. It is by that suggested to give preference to handle scheduled short connections in front of short connection due to late arrivals (van der Lande 2012).

Causes and improvements of MHB 49
Literature study V. Groeneweg
Late check-in The acceptance of bags that arrive too late should be avoided, this can be done by training the check-in agents to strictly apply the cut-off time of baggage acceptance (IATA 2012a). While the passengers try to argue why they need to be accepted (Figure 5.22). When a passenger and its bag arrive just before the acceptance time it is importance to set a good communication between the different players in the handling process. In this manner the staff in the baggage room and drivers will wait on the bag to arrive and be ready to handle the specific bag. The bag will immediately be delivered to the flight what significant reduces the amount of bags that are left behind (Hendry et al. 2010).
Rerouting It is crucial to have a good insight in the minimum accepted connection times by the check-in agents. After rerouting it is important to communicate immediately the handling of the bag to the make-up area like with a late check-in. At US Airways they tried to implement automatic communication when a bag has a short connection time after rerouting (Hendry et al. 2010). The check-in agents have to be trained to stick to the rerouting procedure, because it turns out that changes in this procedures have effects on the bags not being recognized as rerouted bags (IATA 2012c).
5.4.3.2.2 External communication The communication between the inbound airport and the baggage handlers should be improved to reduce the errors that occur as a result of miscommunication of load sheets.
Load sheets The segregation of bags in the airplane is essential information for the baggage handlers to have an efficient unloading process. The position of the bag is important to get the bags with small connection times fast out of the airplane. The load sheets are furthermore important to ensure that there are enough resources available for that specific flight. The airports should implement norms for the delivery time and correctness of load sheets to ensure a certain handling quality. The inbound airport can handle the bags more efficient what reduces the number of mishandled bags. This fact is important for both airports while MHB reduces the customer’s trust for the inbound as well as the arrival airport.
Figure 5.22: Check-in agents need to stick to procedures
(“Muddling Through Leukemia” 2016)

50 Causes and improvements of MHB
Literature study V. Groeneweg
5.5 Conclusion: Causes and improvements The chapter provides a list of causes and improvements to reduce the number of mishandled MHB. All of this found in literature to answer the question of this chapter:
What are factors affecting the MHB of an airport and what are state of the art solutions to improve them?
As outcome of chapter 4 the categories for the causes and improvements were formed as human errors, tracing errors, fallen bags and lack of resources. The improvements sometimes might also affect causes of other categorizes, but it is intended to reduce this with these categories. The results of this chapter are discussed briefly according the listed categories.
Human faults The human faults are firstly related to input faults; the agents at the check-in desk make a type error or attach the tag to the wrong bag. Secondly it contains the faults of the (un)loading process, what is said to be at the transportation from or to the airplane across the apron. Mainly faults occur when a bag or cart is forgotten or when a bag falls of the tug. Lastly stolen bags are human faults occurring at the reclaim area, because it is mainly not checked whenever a passenger takes the right bag out of the reclaim area.
The improvements found for the input faults are mainly addressed to the staff quality. This can be prevented by more training and awareness to the staff. An example is a tour through the process to understand the outcomes of their faults. Another option is to decrease the amount of temporary workers while the staff willingness can be improved with performance meetings or awarding perfectness.
The faults made in the (un)loading process are said to be reduced by scanning more often the bags and/or carts. Besides this clear rules have to be determined where the different priorities of bag have to be placed.
The stolen bags at the reclaim area can be reduced by several methods, better tracing methods like eTag and eTrack with what KLM intends to start. Also the reclaim procedure can be improved with an extra check at reconciliation, delivery of bags at the address of destination or a concept with lockers instead of the reclaim belt.
Tracing error From literature is found that only 85% of the bags can be read properly, this including with new regulations of the IATA declares why airports want to invest in a better tracing.
At most airports still barcodes are used for tracing, but also some are already using RFID tags. The barcodes have some flaws with readability, but this can be reduced with choosing the right sorting equipment and improving the scanning with better software and colored tags.
As next step in tracing equipment the IATA intends to change to RFID tagging. It has many benefits compared to barcode tags, for example the read rate of 99.96%. Although the price decreases, it is still more expensive than barcode tags.
Fallen bags The prevention of fallen bags is of high importance while it reduces the damage of bags. Maybe of even more importance is the damage to the system and the decrease in safety of the staff. The main causes for fallen bags are the shapes and position of bag. the system’s design for inclinations and declinations and the amount of starts and stops.
The fallen bags can be prevented by firstly taking care of the shape and position of the bags. This can be done by providing information to the check-in agents and passenger about OOG-bags when a separate system is applied for these bags. The position can be ensured with cart based systems, a scan of the bag’s position before goes through the system or spacing dots on the belt to ensure the required spacing between bags. The inclinations and declinations should not exceed 18° to prevent bags falling. Lastly the start and stopping acceleration needs to be reduced for what dynamic braking or clutches are required. These systems are mostly necessary for diverts and merges.

Conclusion 51
Literature study V. Groeneweg
Lack of resources The system cannot always function for the designed throughput, because of a lack (of use of) resources. Reasons for this can be related to the availability of the equipment or staff. Next to this a lack of coordination and communication also concerns causes in this category, because it results in a decrease in usability of resources.
Equipment planning The equipment needs to have the right planning for the maintenance as well as the required throughput. The main causes of breakdowns are seen as mechanical issues what needs to be prevented to ensure that the damage not increases. This can be done by implementing software packages for preventive maintenance that based on the Mean Time Before Failure (MTBF) plan replacement actions at the right time. Another possibility is the usage of advanced sensing what facilitates the equipment with extra sensors to have a have a better insight in the current state of the equipment.
Another part of the equipment planning is related to the planning on the throughput of the system. Currently the throughput is mainly determined by the flight schedule and the arrival of passengers at the check-in desk. As a result the system has high peak loads while it is almost empty on other times. The peak loads can result in higher amounts of mishandled bags, because there are not enough resources available to handle when faults occur in the system. There are possibilities to reduce the peak loads by adjusting the flow management from a push- to pull system, in what the system determines the handling order of the bags. The pull principle can be implemented by having an earlier arrival of bags at the airport with for example pick-up services from home. As side effect the passenger’s experience is also improved. The bags can only be pulled by the system when the bags are temporary stored in the system, an example of this is the EBS.
Staff Availability The process of baggage handling is labor intensive what makes the availability of the staff of high importance for the functioning of the system. The mainly manual operations with heavy bags result in illness of the staff. Another reason is the planning of the staff with what the staff sometimes has to work long working days up to 12 hours and four days in a row.
The illness of the staff can be prevented with a (semi-)automation of the process. Examples of this are a loading manipulator, an exoskeleton or even loading robots. The loading and unloading part of containers can also be fully automated with robots. Next to this it is stated that the planning of the staff can be improved to reduce the illness by reducing the shift length with the same amount of staff required.
Communication Faults in communication and coordination can lead to MHB, what can be caused by faults in either internal or external communication with other airports.
For internal communication it can firstly be related to a lack of coordination for delayed flights. When a flight is delayed it has higher chances on bags becoming mishandled bags compared to scheduled connections with the same connection time. Often still the delayed flight is handled while it would be better to prioritize the scheduled short connections in such situations. Secondly the late check-in and rerouting of passengers is often not communicated well to the make-up area, what results in the bag arriving at make-up when it is already closed. A better training in procedures or an automatic system to inform the make-up area are solutions for this.
The external communication has to do with the inbound airport what provides load sheets of the airplane arriving at the airport. The location and flight information of all the bags is provided on such sheets gives the handlers the ability to know what bags are urgent and handle those as first. The load sheets often have mistakes in the amount or the place of bags what result in mistakes in the handling process. A norm needs to be brought up to improve the correctness of the load sheets, this improves the handling quality of the inbound airport as well as the airport of arrival.

52 Conclusion
Literature study V. Groeneweg
6. Conclusion The efficiency of a system concerns how well the resources of the system are utilized concerning a certain customer satisfaction. Mishandled bags cost the airports around $100 per piece, while it also affects the delivered quality and passenger’s trust in the airline or airport. To have it in perspective, in 2016 MHB cost the airlines on average US$0.73 per passenger, while the profit per passenger was on average US$11.61.This declares the importance of the factor for the stakeholders of the BHS.
This report is created to support the different stakeholders of the process with the next step to reduce the amount of MHB. The solutions are all based on what is implemented or at advised for excising systems, so it gives concepts for improvements. There is no one and only solution, so an improvement always needs to be created for system specific. Main question answered in this report is:
What are state of the art solutions to improve the Operational Efficiency of a Baggage Handling Systems by reducing the number of Mishandled Baggage?
The solutions are categorized based on the main causes of MHB, concerning: Human errors, Tracing errors, Fallen bags and Lack of resources. The following improvements are the outcome of this research:
Human errors Decrease the faults made by check-in agents by extending the length of training and making them more aware of the effect of their faults. This can also be done with a factory tour, performance meetings or by awarding perfectness. At the (un)loading process a standard for prioritization on the carts may reduce the unloading time, while extra scan moments and improved tracing methods can reduce the amount of forgotten bags and carts. Finally at the reclaim area the amount of stolen bags can be reduced by implementing an extra check at the exit, having a locker based principle for reclaiming, providing the passengers home-delivery or by giving the passenger the ability to trace their bags with technologies like eTag and eBag.
Tracing errors The current tracing system of most airports can be improved by reducing the faults that occur because of the vulnerable tag with barcode. It is advised to follow the movement intended by the IATA to implement RFID tags into the handling process what improves the tracing capabilities. The costs are higher than the bar code tags, but the trend is that the price is decreasing. Besides this, it is advised to increase the amount of tracings to prevent human faults at unloading and reclaim process, what is also required by the new regulation 753 of the IATA.
Fallen bags The design of the equipment needs to be such that it prevents the main causes of MHB. It needs to prevent that OOG-bags are put into the system. These are large or irregular shaped bags that have problems with inclinations or declinations and short corners. A solution to have less problems with this are cart based systems instead of conveyors what can better handle irregular shaped bags. Besides this the inclinations and declinations needs to be smaller than 18°, while on frequent stopping zones the system needs to be equipped with smooth start/stop system consisting dynamic braking or clutches.

Conclusion 53
Literature study V. Groeneweg
Lack of resources The availability and utilization of the resources needs to be improved to have a improved throughput with the same resources. This can be done at three levels: the level of equipment, staff or communication. Firstly the level of equipment the availability can be improved by having the right maintenance and throughput planning. For the maintenance planning it is advised to implement preventive maintenance with software what calculates the optimal actions based on the Mean Time Before Failure to decrease the downtime. The occupation of the equipment can be improved by implementing pull flow management instead of a push flow. For this an EBS can be used to reduce the peak-loads combined with an earlier arrival of bags with pick-up services. As a result of this more resources are available to handle the bags, what gives the ability to fix faults when they appear.
Secondly the staff availability is of high importance to the system, because of the labor intensiveness of the process. Illness decreases the availability and can be prevented with (semi-) automated solutions for (un)loading the containers, carts and airplanes. Other possibility is to change the planning of the staff, by reducing the length of the working days.
Lastly the usage of resources can be improved by having a better communication and coordination. This internal within the airport as well as external with other airports. It is stated that when a flight is delayed to a certain short connection time it has higher chances to have MHB as a planned short connection with the same connection time. As a result of this the priority should be changed from delayed- to scheduled short connection flights.
The internal communication between the check-in agents and make-up area should be improved for the cases when there is a late check-in and the rerouting of passengers. It is possible to use an automatic or by creating awareness of the agents to follow exactly the procedures.
External communication can be improved to have a more efficient unloading of the airplane. Currently the locations and number of bags are known in advance of arrival by the load-sheet provided by the inbound airport. However this often contains mistakes, what results in forgotten or late delivered bags. This can be reduced by setting norms for the correctness of the load-sheets.
6.1 Recommendations This report concerns the improvements found in literature, but further research is required to have the complete set of available improvements. It is recommended to continue a research for causes and improvements in relation with several airports. This to have insight in several types of airports with a result of a complete list of causes and, joined to that, the improvements. This all from a technical and practical point of view, what currently is missing in the analyses. Besides this the categorization needs to be set up for the different systems to have a better insight in the percentages related to the causes. Related to this it is important to see the effect of improvements on different indicators. It would support the industry to deeply understand the indictors used by the stakeholders and have a complete list how these affect each-other. This all to eventually set-up the right performance measurement system for a BHS and predict the effect of improvements on the system.

54 Bibliography
Literature study V. Groeneweg
Bibliography A.A.S. 2012. “Bagage Op Schiphol - De Route van Uw Koffer Op Een Internationale Luchthaven.”
Amsterdam: Amsterdam Airport Schiphol. http://www.observation-systems.nl/web/pub/BASS-TourguideNederlandsDigitaal.pdf.
ABB Review. 2002. “Weight Lifter.”
Abdelghany, Ahmed, Khaled Abdelghany, and Ram Narasimhan. 2006. “Scheduling Baggage-Handling Facilities in Congested Airports.” Journal of Air Transport Management 12 (2): 76–81. doi:10.1016/j.jairtraman.2005.10.001.
“Air Travel Consumer Report.” 2003. Washington, DC: Office of Aviation Enforcement - US Department of Transportation and Proceedings.
“Airport Technology.” 2016. Siemens VarioSort TTS 1100. Accessed November 15. http://www.airport-technology.com/contractors/baggage/siemens-airport/siemens-airport3.html.
“Airport-Technology.” 2016. Basic: Vacuum Lift for Baggage - Airport Technology. Accessed November 17. http://www.airport-technology.com/products/basic-vacuum-lift.
Albers, Sascha, Benjamin Koch, and Christine Ruff. 2005. “Strategic Alliances between Airlines and Airports—theoretical Assessment and Practical Evidence.” Journal of Air Transport Management 11 (2): 49–58. doi:10.1016/j.jairtraman.2004.08.001.
“Allwidewallpapers.” 2016. Top American Airline Baggage Check In Wallpapers. Accessed November 17. http://www.allwidewallpapers.com/american-airline-baggage-check-in/YW1lcmljYW4tYWlybGluZS1iYWdnYWdlLWNoZWNrLWlu/.
Alsyouf, Imad, Fatima Humaid, and Shaima Al Kamali. 2014. “Mishandled Baggage Problem: Causes and Improvement Suggestions.” In 2014 IEEE International Conference on Industrial Engineering and Engineering Management, 154–158. IEEE. http://ieeexplore.ieee.org/xpls/abs_all.jsp?arnumber=7058619.
“AviationPros.” 2016a. Stack@Ease. Accessed November 15. http://www.aviationpros.com/product/11245390/vanderlande-industries-inc-stackease.
———. 2016b. LAS Expansion Features RFID Technology To Track Baggage. Accessed November 17. http://www.aviationpros.com/press_release/10761995/las-expansion-features-rfid-technology-to-track-baggage.
Babeliowsky, M.N.F. 1997. “Designing Interorganizational Logistic Networks - A Simulation Based Interdisciplinary Approach.” TU-Delft. http://repository.tudelft.nl/islandora/object/uuid:f449c449-fc56-4282-9458-2a173bd8cb9a?collection=research.
Bauer, Eric. 2011. Design for Reliability: Information and Computer-Based Systems. John Wiley & Sons.
Bentvelsen, T. J. W. 2015. “Methodical Design of Baggage Handling System Concepts at Airports.”
Bernolak, Imre. 1997. “Effective Measurement and Successful Elements of Company Productivity: The Basis of Competitiveness and World Prosperity.” International Journal of Production Economics 52 (1): 203–213.
Beumer Groep. 2012. “New Processes for BHS, Why Not a “bag Factory?” presented at the Kingdom Airports, Aviation & Logistics Exhebition 2012, Jeddah, May.
Beumer Group. 2013. “Automated Container Unloader.”
“Beyond Point Solutions: Strategies for Optimizing Baggage Handling to Increase Customer Loyalty.” 2014. WNS.

Bibliography 55
Literature study V. Groeneweg
Bite, Katalin Emese. 2008. “Minimizing the Baggage Loss at Airports.” Periodica Polytechnica Transportation Engineering 36 (1–2): 29. doi:10.3311/pp.tr.2008-1-2.06.
Björkman, M. 1991. “Vad innebär produktivitet?” Verkstadsforum.
Boute, S. E. Z. 2016. “A Future Baggage Reclaim: Innovating around the Passenger at the A-Area.” Delft: TU-Delft.
Bowen, Brent D., and Dean E. Headley. 2003. “The Airline Quality Rating 2003.” Advanced Aviation Analytics Institute for Research. http://ntrs.nasa.gov/search.jsp?R=19990046603.
Bradley, L.W. Bradley. 2010. The Independent Airport Planning Manual. Woodhead Publishing. https://books.google.nl/books?id=OpRWAgAAQBAJ&printsec=frontcover&hl=nl&source=gbs_ViewAPI&redir_esc=y#v=onepage&q&f=false.
Chew, W. B. 1988. “No-Nonsense Guide to Measuring Productivity.” January. https://hbr.org/1988/01/no-nonsense-guide-to-measuring-productivity.
Chow, Garland, Trevor D. Heaver, and Lennart E. Henriksson. 1994. “Logistics Performance: Definition and Measurement.” International Journal of Physical Distribution & Logistics Management 24 (1): 17–28. doi:10.1108/09600039410055981.
“Clxengineering.” 2016. Clxengineering. Accessed November 17. http://www.clxengineering.com/industries/baggage-handling-systems-cbisisat-testing/.
“Deutsche Bank.” 2016. R&D Moet Bijdragen Aan de Missie van Het Bedrijf. Accessed November 15. https://www.deutschebank.nl/nl/content/over_ons_campagnes_cfo_event_van_r_en_d_naar_de_markt_artikelen_r_en_d_moet_bijdragen_aan_de_missie_van_het_bedrijf_4.html.
Dijks, R, and O Lenior. 2010. “Roles and Organisation.” Veghel.
Duren, F. v. 2011. “New BHS Model.” Veghel.
“Flight Deck Aviation.” 2016. Baggage Handling. Accessed November 15. http://www.flightdeckaviation.com/baggage-handling.
Francis, Graham, Ian Humphreys, and Jackie Fry. 2005. “The Nature and Prevalence of the Use of Performance Measurement Techniques by Airlines.” Journal of Air Transport Management 11 (4): 207–17. doi:10.1016/j.jairtraman.2004.10.003.
Franke, Markus. 2004. “Competition between Network Carriers and Low-Cost Carriers—retreat Battle or Breakthrough to a New Level of Efficiency?” Journal of Air Transport Management 10 (1): 15–21. doi:10.1016/j.jairtraman.2003.10.008.
Friedli, Thomas, and Daniel Bellm. 2013. “OPEX: A Definition.” In Leading Pharmaceutical Operational Excellence, edited by Thomas Friedli, Prabir Basu, Daniel Bellm, and Jürgen Werani, 7–26. Berlin, Heidelberg: Springer Berlin Heidelberg. http://link.springer.com/10.1007/978-3-642-35161-7_2.
“Futuretravelexperience.” 2016a. KLM Unveils New Permanent Bag Tag and Bag Tracking Device. Accessed November 16. http://www.futuretravelexperience.com/2014/03/air-france-klm-new-permanent-bag-tag-and-tracking-device-can-benefit-the-entire-industry/.
———. 2016b. Baggage Delivery Service Launched at Gatwick Airport. Accessed November 16. http://www.futuretravelexperience.com/2015/07/baggage-delivery-service-launched-at-gatwick-airport/.
Gonnord, Christian, and Fabien Lawson. 2000. “Airports: A Precious Resource of the Aviation Network.” Air & Space Europe 2 (5): 33–39. doi:10.1016/S1290-0958(00)80084-2.
Hans, Robert T. 2015. “Using a Biometric System to Check-in and Check-out Luggage at Airports.” In . Pretoria, South Africa: Department of Software Engineering, Tshwane University of Technology.
Hendry, Joanne, Phil Ryan, and Nicolas Bondarenco. 2010. “Baggage Improvement Program -US Airways Case Study.” IATA.

56 Bibliography
Literature study V. Groeneweg
IATA, ed. 2004. Airport Development Reference Manual. 9. ed., Effective Jan. 2004. Montreal: Geneva, International Air Transport Association.
———. 2007. “RFID Business Case for Baggage Tagging.” International Air Transport Association.
———. 2012a. “Baggage Improvement Program - Air France Case Study.” International Air Transport Association.
———. 2012b. “Baggage Improvement Program - Athens Case Study.” International Air Transport Association.
———. 2012c. “Baggage Improvement Program - KLM Case Study.” International Air Transport Association.
“IATA - Travellers Frequently Asked Questions.” 2016. http://www.iatatravelcentre.com/iata-travellers-faq.htm.
Ittner, C.D., and D.F. Larcker. 1998. Innovations in Performance Measurement: Trends and Research Implications. Journal of Management Accounting Research. Offprint. https://books.google.nl/books?id=GxxiHQAACAAJ.
Jackson, Mats. 1999. “Productivity – An Overall Measure of Competitiveness.” In Proceedings of the Second International Workshop. Intelligent Manufactruing Systems. http://www.iss.mdh.se/index.php?choice=publications&id=1950.
Jochems, Improving KLM Customer Ground Handling’s Competitive Market Position. 2015. “Improving KLM Customer Ground Handling’s Competitive Market Position.” TU-Delft. uuid:b04cb88e-901e-4057-945b-bcf2ea1a9375.
Kaplan, Robert S., and David P. Norton. 1992. “Balanced Scorecard: Measures That Drive Performance.” Harvard Business Review 70 (1): 71–79.
Kleef, Dennis van. 2015. “NetwerkNieuws-2015-10.pdf.” NetwerkNieuws, October.
“KLM.” 2016. Fact Sheet Network And Hub Systems. September 15. https://www.klm.com/corporate/en/images/008372%20Factsheet%20network_tcm729-342204.pdf.
Kohlmann, Karlijn. 2012. “A Design for the Future Make-up Process of the Baggage Handling System.” Master thesis, Delft: TU-Delft.
Koss, Ellee, and David A. Lewis. 1993. “Productivity or Efficiency— Measuring What We Really Want.” National Productivity Review 12 (2): 273–84. doi:10.1002/npr.4040120212.
“KPN Corporate.” 2016. The Netherlands Has First Nationwide LoRa Network for Internet of Things. Accessed October 31. https://corporate.kpn.com/press/press-releases/the-netherlands-has-first-nationwide-lora-network-for-internet-of-things-.htm.
Lande, A.M.M. van der. 2012. “An Analysis Of The Influences On The Operational Performance Of KLM` S Baggage Turnaround Services.” TU-Delft. http://repository.tudelft.nl/islandora/object/uuid%3Ad6ebf56e-0a46-4fc4-81d5-1e6c57755160?collection=education.
Lemain, T.R. 2002. “Get the Bag on the Right Track! ‘Development of a New Methodology for Baggage Handling System Design.’” TU-Delft. uuid:263c552c-58b8-402d-b8a2-a80bcba60098.
Lemmen, Myrthe. 2016. “Time Flies ... When Your Bag Was in the Skies!” University of Technology Delft.
Lodewijks, G. 2016. “Advanced Design of Baggage Handling Systems.” Slides presented at the ME1430 - TU-Delft, Delft, April.
“Lufthansa.” 2016. Excess and Special Baggage. Accessed November 15.
Lukszo, Zofia. 2016. “Integrated Plant Management - Slides Week 1.” presented at the SPM9537 - TU-Delft, November.
Madsen, Kim. 2016. “Baggage Handling Models That Can Help The Implementation Of Iata Resolution 753.” Beumer.

Bibliography 57
Literature study V. Groeneweg
McCartney, S. 2014. “The Wall Street Journal.” Newspaper. Baggage Claim: Airlines Are Winning the War on Lost Luggage. April 6. http://www.wsj.com/articles/baggage-claim-airlines-are-winning-the-war-on-lost-luggage-1401922595.
Miller, M. 2015. “The Washington Post.” Baggage Handler Snoozing in Cargo Hold Wakes up in a Panic - in the Air. April 14. https://www.washingtonpost.com/news/morning-mix/wp/2015/04/14/baggage-handler-snoozing-in-cargo-hold-wakes-up-in-a-panic-in-the-air/.
“Muddling Through Leukemia.” 2016. One Piece of Advice: Delegate, but Not to Me. Accessed November 17. https://muddlingthroughleukemia.wordpress.com/2015/01/09/one-piece-of-advice-delegate/.
Neely, Andy, Mike Gregory, and Ken Platts. 2005. “Performance Measurement System Design: A Literature Review and Research Agenda.” Edited by None. International Journal of Operations & Production Management 25 (12): 1228–63. doi:10.1108/01443570510633639.
Owusu, J. 2016. Talk about how to innovate in the BHS at airports with all the different stakeholders involved.
Pekuri, Aki, Harri Haapasalo, and Maila Herrala. 2011. “Productivity and Performance Management–managerial Practices in the Construction Industry.” International Journal of Performance Measurement 1 (1): 39–58.
“Planit.” 2016. Airport Baggage Handler Air Transport. Accessed November 17. https://www.planitplus.net/JobProfiles/View/469/125.
“RFID Applications.” 2016. Airport Tracking Luggage With RFID. Accessed November 17. http://rfidapplicatios.blogspot.nl/2010_06_01_archive.html.
“Safeglide.” 2016. Material Handling Chutes. Accessed November 15. http://www.safeglide.co.uk/.
Schaar, David, and Lance Sherry. 2010. “Analysis of Airport Stakeholders.” In Integrated Communications Navigation and Surveillance Conference (ICNS), 2010, J4–1. IEEE. http://ieeexplore.ieee.org/xpls/abs_all.jsp?arnumber=5503233.
Schmidberger, Stephan, Lydia Bals, Evi Hartmann, and Christopher Jahns. 2009. “Ground Handling Services at European Hub Airports: Development of a Performance Measurement System for Benchmarking.” International Journal of Production Economics 117 (1): 104–16. doi:10.1016/j.ijpe.2008.10.006.
Sink, D.S., and T.C. Tuttle. 1989. Planning and Measurement in Your Organization of the Future. Industrial Engineering and Management Press. https://books.google.nl/books?id=lXqAQgAACAAJ.
SITA. 2014. “The Baggage Report 2014.” SITA.
———. 2015. “The Baggage Report 2015.” SITA.
———. 2016. “The Baggage Report 2016.” SITA.
Slack, N, S Chambers, and R Johnston. 2001. Operations Management. 3rd ed. Harlow: Pearson Education Limited.
Stainer, Alan. 1997. “Capital Input and Total Productivity Management.” Management Decision 35 (3): 224–32. doi:10.1108/00251749710169431.
Sumanth, D.J. 1984. Productivity Engineering and Management: Productivity Measurement, Evaluation, Planning, and Improvement in Manufacturing and Service Organizations. International Student Edition. McGraw-Hill. https://books.google.nl/books?id=H5ZRAAAAMAAJ.
Tangen, Stefan. 2005. “Demystifying Productivity and Performance.” International Journal of Productivity and Performance Management 54 (1): 34–46. doi:10.1108/17410400510571437.

58 Bibliography
Literature study V. Groeneweg
Thomas, B.E., J.P. Baron, CONSTRUCTION ENGINEERING RESEARCH LAB (ARMY) CHAMPAIGN IL., United States. Army. Corps of Engineers, and Construction Engineering Research Laboratories (U.S.). 1994. Evaluating Knowledge Worker Productivity: Literature Review. USA-CERL Interim Report. Construction Engineering Research Laboratory. https://books.google.nl/books?id=BF9MYAAACAAJ.
“TNP.” 2016. Bag’s-Eye View of Changi Airport. Accessed November 15. http://backstage.tnp.sg/backstage/content/bag%E2%80%99s-eye-view-changi-airport.
T.S.A. 2007. “Planning Guidelines and Design Standards for Checked Baggage Inspection Systems.” Transport Security Administration.
Tully, S. 2014. “Airlines: Why the Big Boys Won’t Come Back.” Fortune, June 14. http://archive.fortune.com/magazines/fortune/fortune_archive/2004/06/14/372607/index.htm.
“UN.” 2016. World Urbanization Prospects. Accessed November 22. https://esa.un.org/unpd/wup/Country-Profiles/.
Van Zundert, H. C. W. 2010. “Off-Airport Baggage Check-In: A Logistics Network & Business Model for the Situation at Amsterdam Airport Schiphol.” TU Delft, Delft University of Technology. http://repository.tudelft.nl/assets/uuid:c32a7a2a-ee65-401e-8510-7ed645bcc2dc/Master_Thesis_Rick_van_Zundert.pdf.
“Vanderlande.” 2016a. Pushers Baggage Handling - Google Zoeken. Accessed November 15. https://www.vanderlande.com/baggage-handling/innovative-systems/sortation/pushersdiverters.
———. 2016b. VERTISORTER and VERTICROSS - Vanderlande. Accessed November 15. https://www.vanderlande.com/baggage-handling/innovative-systems/sortation/vertisorterverticross.
———. 2016c. Robot Loading (BAGLOAD). Accessed November 15. https://www.vanderlande.com/baggage-handling/innovative-systems/make-up/robot-loading-bagload.
———. 2016d. Manual Loading with Carousel and Lateral Conveyor-Based Solutions. Accessed November 15. https://www.vanderlande.com/baggage-handling/innovative-systems/make-up/manual-loading/.
———. 2016e. ICS. Accessed November 17. https://www.vanderlande.com/baggage-handling/innovative-systems/transportation/ics.
Vickers, K, and RW Chinn. 1998. “Passenger Terminal Baggage Handling Systems.” In IEE Colloquium.
Weber, Al, and Ivara Ron Thomas. 2005. “Key Performance Indicators.” Measuring and Managing the Maintenance Function, Ivara. http://www.computerised-maintenance-management-systems.com/articles/KPIs.pdf.
Weller, C. 2015. “Business Insider.” Japanese Airport Gets Robot Exoskeletons to Offset Declining Birthrate. June 6. http://www.businessinsider.com/japanese-airport-gets-robot-exoskeletons-to-offset-declining-birthrate-2015-7?international=true&r=US&IR=T.
“Wikipedia.” 2016. File:UDrop Bagdrop Kiosk.jpg - Wikipedia. Accessed November 15. https://en.wikipedia.org/wiki/File:UDrop_bagdrop_kiosk.jpg.
Wyld, David C., Michael A. Jones, and Jeffrey W. Totten. 2005. “Where Is My Suitcase? RFID and Airline Customer Service.” Marketing Intelligence & Planning 23 (4): 382–94. doi:10.1108/02634500510603483.
“Zimbio.” 2016. Delta Air Profit Trails Analysts’ Estimates on Rising Fuel Costs. Accessed November 15. http://www.zimbio.com/pictures/UfrY4ZwJ_2T/Delta+Air+Profit+Trails+Analysts+Estimates/5qYRvBSzXmV.

Appendix 59
Literature study V. Groeneweg
Appendix I. Cluster of Black box approaches of a BHS
The black box shown in the report was published by Lodewijks. This representation is chosen by the writer as a clear visualization of the process. However, the other diagrams found in literature are also shown in here to give the reader insight in visions of several writers.
I.A. Black box according to Kohlmann Usually black box approaches are horizontally, but Kohlmann rotated the box 90 degrees as can be seen in Figure: I.A—1. In this figure not many text is used, what makes it easy to understand. However 7 colors are used to show the different flows what makes the deeper understanding more difficult.
Figure: I.A—1 The black box of the baggage flow at an airport
(Kohlmann 2012)
I.B. SADT/IDF0 according to Vanderlande Closely related to a black box approach is an SADT/IDF0 (Structured Analysis and Design Technique / Integration DEFinition of function modelling) approach, what is shown in Figure: I.B—1. In this the inputs and outputs are respectively listed left and right as also with a black box approach. Besides this controls are put above, where the mechanisms are shown below the box, as explained in Figure: I.B—2.
Figure: I.B—1: SADT/ IDEF0 of a BHS
(van der Lande 2012)
Figure: I.B—2 General explanation of an IDEF0 approach
(Lukszo 2016)

60 Appendix
Literature study V. Groeneweg
I.C. Proper model visualization by Lodewijks A little closer look of the system can be applied with a proper-model as from Figure: I.C—1. This creates an overview of organizational relations from input to output. Listed from top to bottom as the orders, products and lastly the used resources.
Figure: I.C—1: Proper model visualization
(Lodewijks 2016)

Appendix 61
Literature study V. Groeneweg
II. Cluster of flow charts of a BHS The whole process of baggage handling consists of different procedures that have to be fulfilled. It depends on the focus of the writer how deeply these procedures are split up. Different approaches found in literature are listed to give the reader the ability to choose the chart what fits the reader’s view.
II.A. BHS process according to Bentvelsen The approach of Bentvelsen from Figure: II.A—1 shows similarities with the one from Lodewijks, but it differs in some important points. It can be seen that Bentvelsen places the boundaries of the baggage handling process a little different from Lodewijks. Lodewijks sees a BHS as the whole system from check-in until reclaiming, including the check if a passenger is on the plane before departure. Instead of this, Bentvelsen places these two procedures outside the boundary of the BHS.
Figure: II.A—1: Flow chart of a BHS
(Bentvelsen 2015)
II.B. BHS process according to A.A.S. Specific for the process of baggage handling at A.A.S. is the flow chart given in Figure: II.B—1. This figure easily visualizes the possibility of having T2T baggage. However, the relations between the passenger and the baggage are not clearly seen from this figure and it misses some procedures as seen in the flow diagram of Lodewijks.
Figure: II.B—1: Available baggage routes at A.A.S.
(A.A.S. 2012)

62 Appendix
Literature study V. Groeneweg
II.C. BHS process according to Kohlmann The black box of Appendix I.A is viewed in more detail in the flow diagram from Figure: II.C—1. It is clear that this research focuses on the make-up procedure, what is closely related to the screening system. As a result of this the screening procedure is worked out more detailed in this figure. The figure is a little difficult to read, what can be partly addressed to the fact to no different colors, shapes and or pictures are used.
Figure: II.C—1: Flow chart of a BHS (Kohlmann 2012)
II.D. BHS process according to Vanderlande The most detailed flow scheme available is shown in Figure: II.D—1, what is the decomposition of the IDF0 representation from appendix I.B. Like Figure: I.B—1 this includes the inputs and outputs on the left and rights side, with the controls (for example the task or instruction) are shown above and the used resources are listed below the figure. The diagram consists of a lot of details, what makes it a little difficult to read. However, the different baggage flows (check-in, transfer and reclaim) are easy to distinguish, where transfer goes through all the six steps while check-in and reclaim baggage respectively go only through three steps and one step.
Figure: II.D—1:SADT/IDEF0 A1-A6 KLM BTS (van der Lande 2012)