Running Head: FACILITATING CHANGE i Facilitating Change: How ...
Upload
khangminh22Category
view
3download
0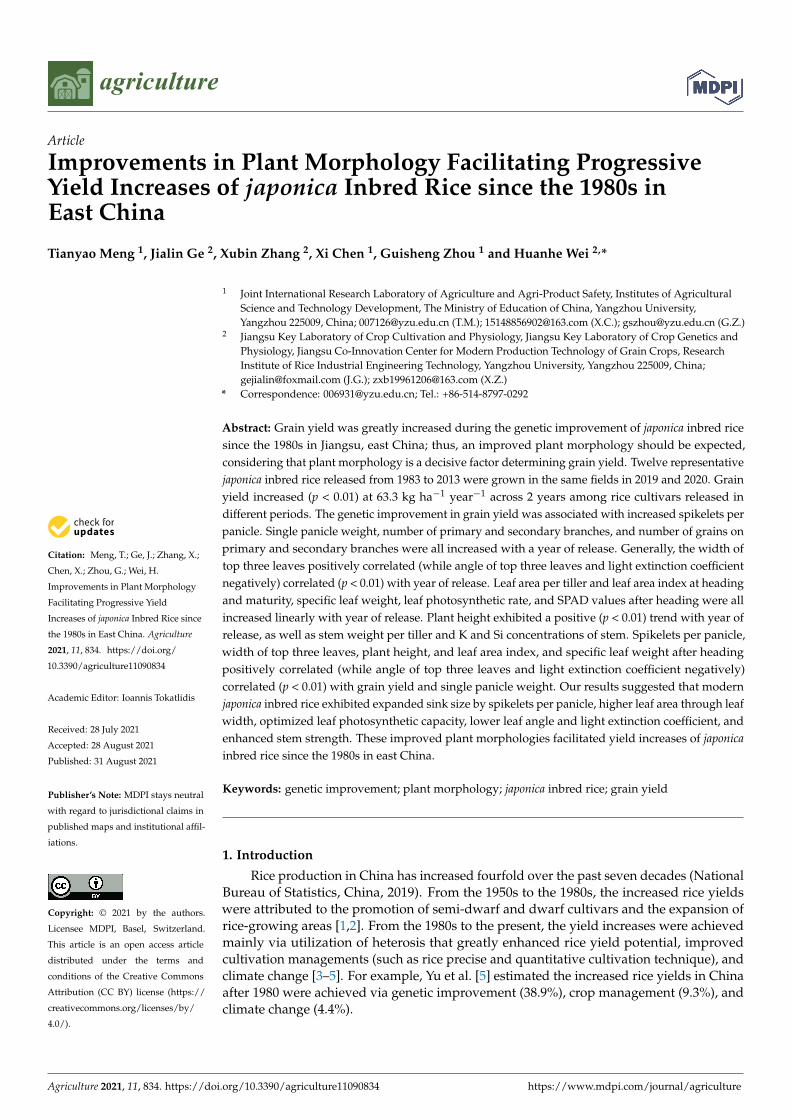
agriculture
Article
Improvements in Plant Morphology Facilitating ProgressiveYield Increases of japonica Inbred Rice since the 1980s inEast China
Tianyao Meng 1, Jialin Ge 2, Xubin Zhang 2, Xi Chen 1, Guisheng Zhou 1 and Huanhe Wei 2,*
�����������������
Citation: Meng, T.; Ge, J.; Zhang, X.;
Chen, X.; Zhou, G.; Wei, H.
Improvements in Plant Morphology
Facilitating Progressive Yield
Increases of japonica Inbred Rice since
the 1980s in East China. Agriculture
2021, 11, 834. https://doi.org/
10.3390/agriculture11090834
Academic Editor: Ioannis Tokatlidis
Received: 28 July 2021
Accepted: 28 August 2021
Published: 31 August 2021
Publisher’s Note: MDPI stays neutral
with regard to jurisdictional claims in
published maps and institutional affil-
iations.
Copyright: © 2021 by the authors.
Licensee MDPI, Basel, Switzerland.
This article is an open access article
distributed under the terms and
conditions of the Creative Commons
Attribution (CC BY) license (https://
creativecommons.org/licenses/by/
4.0/).
1 Joint International Research Laboratory of Agriculture and Agri-Product Safety, Institutes of AgriculturalScience and Technology Development, The Ministry of Education of China, Yangzhou University,Yangzhou 225009, China; [email protected] (T.M.); [email protected] (X.C.); [email protected] (G.Z.)
2 Jiangsu Key Laboratory of Crop Cultivation and Physiology, Jiangsu Key Laboratory of Crop Genetics andPhysiology, Jiangsu Co-Innovation Center for Modern Production Technology of Grain Crops, ResearchInstitute of Rice Industrial Engineering Technology, Yangzhou University, Yangzhou 225009, China;[email protected] (J.G.); [email protected] (X.Z.)
* Correspondence: [email protected]; Tel.: +86-514-8797-0292
Abstract: Grain yield was greatly increased during the genetic improvement of japonica inbred ricesince the 1980s in Jiangsu, east China; thus, an improved plant morphology should be expected,considering that plant morphology is a decisive factor determining grain yield. Twelve representativejaponica inbred rice released from 1983 to 2013 were grown in the same fields in 2019 and 2020. Grainyield increased (p < 0.01) at 63.3 kg ha−1 year−1 across 2 years among rice cultivars released indifferent periods. The genetic improvement in grain yield was associated with increased spikelets perpanicle. Single panicle weight, number of primary and secondary branches, and number of grains onprimary and secondary branches were all increased with a year of release. Generally, the width oftop three leaves positively correlated (while angle of top three leaves and light extinction coefficientnegatively) correlated (p < 0.01) with year of release. Leaf area per tiller and leaf area index at headingand maturity, specific leaf weight, leaf photosynthetic rate, and SPAD values after heading were allincreased linearly with year of release. Plant height exhibited a positive (p < 0.01) trend with year ofrelease, as well as stem weight per tiller and K and Si concentrations of stem. Spikelets per panicle,width of top three leaves, plant height, and leaf area index, and specific leaf weight after headingpositively correlated (while angle of top three leaves and light extinction coefficient negatively)correlated (p < 0.01) with grain yield and single panicle weight. Our results suggested that modernjaponica inbred rice exhibited expanded sink size by spikelets per panicle, higher leaf area through leafwidth, optimized leaf photosynthetic capacity, lower leaf angle and light extinction coefficient, andenhanced stem strength. These improved plant morphologies facilitated yield increases of japonicainbred rice since the 1980s in east China.
Keywords: genetic improvement; plant morphology; japonica inbred rice; grain yield
1. Introduction
Rice production in China has increased fourfold over the past seven decades (NationalBureau of Statistics, China, 2019). From the 1950s to the 1980s, the increased rice yieldswere attributed to the promotion of semi-dwarf and dwarf cultivars and the expansion ofrice-growing areas [1,2]. From the 1980s to the present, the yield increases were achievedmainly via utilization of heterosis that greatly enhanced rice yield potential, improvedcultivation managements (such as rice precise and quantitative cultivation technique), andclimate change [3–5]. For example, Yu et al. [5] estimated the increased rice yields in Chinaafter 1980 were achieved via genetic improvement (38.9%), crop management (9.3%), andclimate change (4.4%).
Agriculture 2021, 11, 834. https://doi.org/10.3390/agriculture11090834 https://www.mdpi.com/journal/agriculture
Agriculture 2021, 11, 834 2 of 16
Genetic improvement is a determinant factor for increased yields across many rice-growing countries, such as India, Japan, the Philippines, and Thailand [6–10]. In China,genetic progress in rice grain yield was reported in the northeast [11,12], southwest [13],south [14], and central China [15,16]. Such studies suggested that genetic progress greatlyincreased rice grain yield, which was associated with prolonged growth period [6,14], ex-panded sink size through spikelets per panicle [12,15], and increased biomass accumulation,harvest index, or both [9,10,15].
Plant morphology is a decisive factor influencing grain yield formation of rice, whichencompasses plant height, leaf shape and arrangement, and panicle branching pattern.The effects of genetic improvement on plant morphology were studied in maize [17,18],wheat [19,20], and soybean [21]. For example, Ma et al. [18] concluded that the geneticimprovement in maize grain yield was attributable to the reduced plant height and moreupright leaf posture. For rice, Wu et al. [12] reported that plant height decreased during thegenetic improvement of japonica inbred rice in northeast China, while Li et al. [14] reportedthat plant height increased during the genetic improvement of indica and japonica inbredrice in south China. Such research on rice indicated that the changes of plant morphologyto cultivar improvement varied with the specific cultivar types and experimental regions.
In China, indica hybrid rice and japonica inbred rice are two main cultivar types inproduction [22]. The past four decades have seen a dramatic shift in the cultivation areabetween indica hybrid rice and japonica inbred rice in Jiangsu, east China; the rate of japonicainbred rice planting area has increased from 10% in the 1980s to 90% today [23]. Such apronounced shift increased the provincial average rice yield from 7.3 t ha−1 in the 1980sto 8.6 t ha−1 nowadays [23,24]. To date, little information is available on changes in grainyield and related plant morphology during the genetic improvement of japonica inbred ricesince the 1980s in Jiangsu, east China.
In this study, twelve representative japonica inbred rice released from 1983 to 2013 ineast China were collected and grown in the same paddy fields. The main purposes of thecurrent study were (1) to evaluate changes in grain yield and plant morphological traits ofjaponica inbred rice released since the 1980s in Jiangsu, and (2) to elucidate possible causesfor changes in grain yield from the viewpoint of plant morphology during the geneticimprovement of japonica inbred rice.
2. Materials and Methods2.1. Experimental Site and Meteorological Information
Field experiments were conducted at the experimental farm (119.25◦ E, 32.30◦ N) ofYangzhou University, Jiangsu, China in 2019 and 2020. The experimental field soil belongedto sandy loam type with the following properties measured at 2 years: 15.8 g kg−1 organiccarbon, 1.4 g kg−1 total nitrogen (N), 29.7 mg kg−1 Olsen phosphorus (P), and 70.3 mg kg−1
available potassium (K). Generally, the rice experienced higher temperature and sunshinehours, and lower rainfall during the growing period in 2019 than the corresponding growthperiod in 2020.
2.2. Rice Cultivar, Experimental Design, and Field Management
Twelve japonica inbred rice released from 1983 to 2013 were grown in this field experi-ment. These rice cultivars were selected because they were all released by local breedinginstitutes, and well–adapted to the agro–ecological conditions of the study area. The ricecultivars were very popular and widely adopted by local farmers during historical periods.For example, Wuyujing 3 was famous for its high and stable grain yield and was widelyplanted with a cumulative area of 6.1 Mha as of 2020. Nanjing 5055 and Nanjing 9108 weregrown in a large area for their excellent grain quality in recent years [25]. Besides, theserice cultivars were generally considered representative during the breeding process ofjaponica inbred rice since the 1980s, and were always chosen as the control (CK) in the cropvariety regional trials conducted in Jiangsu, east China [23]. The rice cultivars were kindly
Agriculture 2021, 11, 834 3 of 16
provided by breeding institutes. The information on year of release, cross information,cumulative planting area, and breeding institute was seen in Table 1.
Table 1. The information on year of release, cross information, cumulative planting area, and breeding institute of ricecultivars.
Cultivar Year of Release Cross Information Cumulative PlantingArea (Mha) Breeding Institute
Yanjing 2 1983 Nanjing 11 1.0 Institute of Agricultural Sciences,Yancheng, Jiangsu
Sidao 8 1986 Aijing 22/Sidao 5 × Chengbao 1 0.4 Farm of Cotton Raw Seed, Siyang,Jiangsu
Wuyujing 2 1989 Zhongdan 1/79-51 × Zhongdan1/Yangjing 1 1.6 Farm of Rice–Wheat Breeding,
Wujin, Jiangsu
Wuyujing 3 1992 Zhongdan 1/79-51 × Zhongdan1/Yangjing 1 6.1 Farm of Rice–Wheat Breeding,
Wujin, Jiangsu
Wuyujing 5 1997 Wuyujing 3 × Bing 627 1.0 Farm of Rice–Wheat Breeding,Wujin, Jiangsu
Huaidao 5 2000 7208 × Wuyujing 3 2.2 Xuhuai Institute of AgriculturalSciences, Jiangsu
Wuxiangjing 14 2003 Jing 58 ×248-5/254-13//Wuxiangjing 9 1.3 Farm of Rice–Wheat Breeding,
Wujin, Jiangsu
Wujing 15 2004 Zaofeng 9/Chunjiang 03 Jing ×Wuyunjing 7 0.9 Farm of Rice–Wheat Breeding,
Wujin, Jiangsu
Wuyunjing 21 2007 Yun 9707 × Yun 9726 0.7 Institute of Agricultural Sciences,Wujin, Jiangsu
Wuyunjing 24 2010 Nongken 57/Kuihuahuang × 9746 0.8 Institute of Agricultural Sciences,Wujin, Jiangsu
Nanjing 5055 2011 Wujing 13 × Guandong 194 1.0 Jiangsu Academy of AgriculturalSciences
Nanjing 9108 2013 Wuxiangjing 14 × Guandong 194 1.8 Jiangsu Academy of AgriculturalSciences
The information on year of release, cross information, cumulative planting area, and breeding institute of rice cultivars is available from thewebsite http://www.ricedata.cn (accessed on: 12 April 2021).
This field experiment was laid in a randomized block design with three replicates.Each plot area was 24 m2 (6 m × 4 m) at 2 years. Pregerminated rice seeds were sownin seedbeds on May 20 and transplanted with four seedlings per hill into open fieldsfor 2 years. The hill spacing was 30 cm row and 12 cm plant. The total N rate was270 kg ha−1 with a ratio of 3:3:2:2 at 1 d before transplanting, 7 d after transplanting, atpanicle initiation, and at penultimate–leaf appearance stages, respectively. The total Pand K rates were both 180 kg ha−1 and were applied once as base dressing at 1 d beforetransplanting. The irrigation regime adopted in field experiment followed the alternatewetting and drying method, which applied multiple flooding and drainage during therice–growing cycle [26]. The weed and pest management were identical during the rice–growing period in all experimental plots. In the two–year field experiment, no lodgingphenomenon was observed in each plot.
2.3. Sampling and Measurement
The plants of five hills were sampled at heading and maturity to measure biomassweight and leaf area index. The sampled plants were divided into panicles, leaves, andstems. Leaf area index was determined through a leaf area meter (LI-3100C, Li-Cor, Lincoln,NE, USA), then the weights of the panicles, leaves, and stems were measured after oven–drying at 75 ◦C for 80 h. After weighing, stems were collected to grind through a 0.5 mmsieve using a Wiley mill (Thomas-Wiley Corp., Swedesboro, NJ, USA) to measure the Kand silicon (Si) concentrations. The K concentration was determined through flame atomicabsorption spectrophotometry; Si concentration was determined referring to the method ofTamai and Ma. [27].
Leaf morphologies, including leaf length, width, and angle of top three leaves, weremeasured at 30 days after heading (DAH) in the field. The photosynthesis active radiation(PAR) was measured using a line quantum sensor (LI-250, Li-Cor, Lincoln, NE, USA) at

Agriculture 2021, 11, 834 4 of 16
30 DAH. Such a measurement was conducted between 9:30–11:30 a.m. in the field on asunny day. The line quantum sensor was positioned 50 cm above the canopy to measurethe incident PAR (I0), then the sensor was positioned 5 cm above the field water levelto measure the incident PAR at the bottom (I). The light extinction coefficient (k) wascalculated by the following formula based on Beer–Lambert’s law:
k =logn
(I0I
)LAI
(1)
where logn is the natural log of the number. I0 is the incident PAR above the canopy and Iis the incident PAR at the bottom.
The plants of four hills were collected at full heading stage to measure specific leafweight, and photosynthetic rate and SPAD values of flag leaves. Specific leaf weight wascalculated as the ratio of leaf dry mass to leaf area. Leaf area was determined by a leafarea meter (LI-3100C, Li-Cor, Lincoln, NE, USA), and leaf dry mass was weighted afteroven-drying at 75 ◦C for 80 h. The leaf photosynthetic rate was determined between 9:30and 11:30 by three portable photosynthetic instruments (LI-6400, Li-Cor, Lincoln, NE, USA).
At maturity, the plants of 50 hills were collected to determine plant height, singlepanicle weight, number of primary and secondary branches, and number of grains onprimary and secondary branches. In each plot, rice plants from 200 hills were harvestedmanually for grain yield measurement with a moisture content of 14%; rice plants from100 hills were sampled to determine grain yield components, including panicles per m2,spikelets per panicle, filled-grain percentage, and grain weight.
2.4. Data Analysis
Data analyses were conducted with SAS version 9.4 (SAS Institute Inc., Cary, NC,USA). Means were compared by analysis of variance (ANOVA), followed by the leastsignificant difference (LSD) test. In the ANOVA, the source of variation included year,cultivar, and the interaction year × cultivar. The results of ANOVA showed that there wereno significant differences in grain yield and plant morphological traits between the twostudy years, therefore data averaged across 2 years were used for the following analysis(Table 2). The correlation coefficients were calculated using the Pearson method.
Table 2. Analysis of variance (ANOVA) of grain yield and the related morphological traits among year, cultivar, and theinteraction.
Source dfGrainYield
Spikelets perPanicle
Single PanicleWeight
Light ExtinctionCoefficient
Leaf Area Index LeafPhotosynthetic
Rate
SPADValues
Specific LeafWeight
PlantHeightHeading Maturity
Year 1 ns ns ns ns ns ns ns ns ns nsCultivar 11 ** ** ** ** ** ** ** * ** **
Year × Cultivar 11 ** ns ns ns ns ns ns ns ns nsTotal 71
ns, not significant at the 0.05 probability level according to the LSD test; *, significant at the 0.05 probability level according to the LSD test;**, significant at the 0.01 probability level according to the LSD test.
3. Results3.1. Grain Yield and Panicle Traits
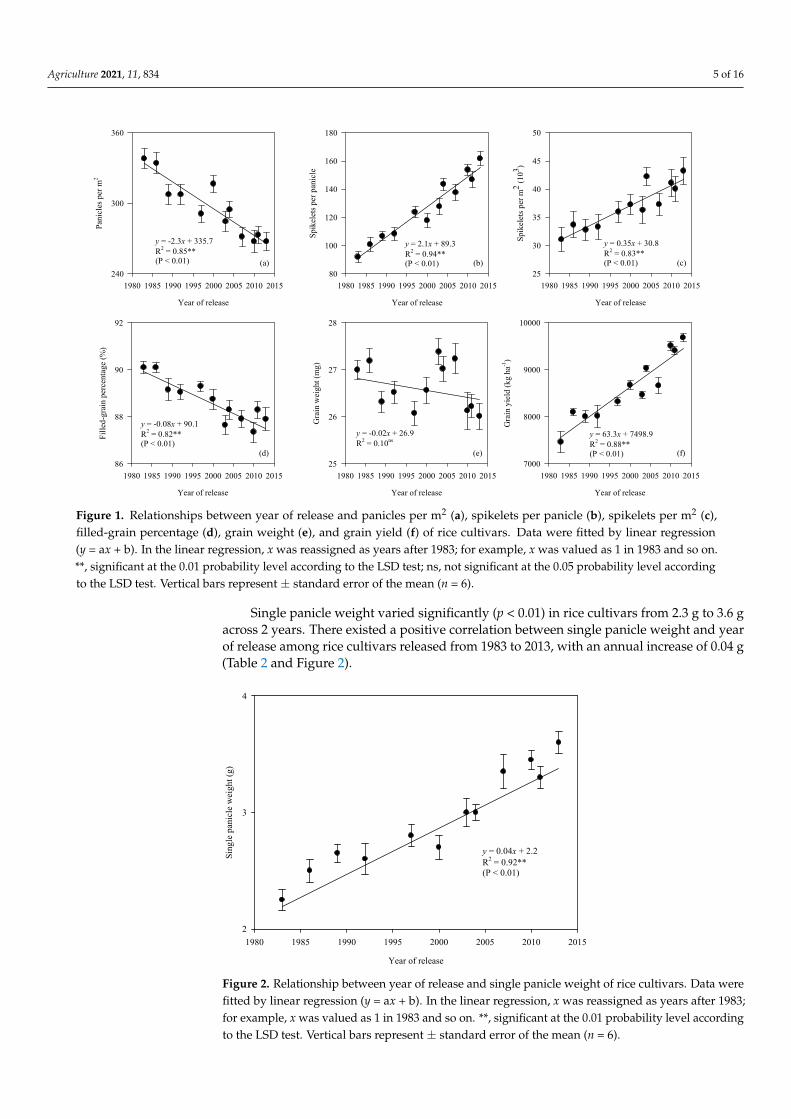
Grain yield differed significantly (p < 0.01) in rice cultivars released from 1983 to 2013.Grain yield increased (p < 0.01) linearly with year of release, and the annual incrementwas 63.3 kg ha−1 across 2 years. Panicles per m2 and filled-grain percentage exhibitednegative (p < 0.01) trends, while spikelets per panicle and spikelets per m2 exhibitedpositive (p < 0.01) trends with year of release (Table 2 and Figure 1).
Agriculture 2021, 11, 834 5 of 16
Agriculture 2021, 11, x FOR PEER REVIEW 5 of 17
Year × Cultivar 11 ** ns ns ns ns ns ns ns ns ns Total 71
ns, not significant at the 0.05 probability level according to the LSD test; *, significant at the 0.05 probability level according to the LSD test; **, significant at the 0.01 probability level according to the LSD test.
3. Results 3.1. Grain Yield and Panicle Traits
Grain yield differed significantly (p < 0.01) in rice cultivars released from 1983 to 2013. Grain yield increased (p < 0.01) linearly with year of release, and the annual increment was 63.3 kg ha−1 across 2 years. Panicles per m2 and filled-grain percentage exhibited neg-ative (p < 0.01) trends, while spikelets per panicle and spikelets per m2 exhibited positive (p < 0.01) trends with year of release (Table 2 and Figure 1).
(a)
Year of release
1980 1985 1990 1995 2000 2005 2010 2015
Pani
cles
per
m2
240
300
360
(b)
Year of release
1980 1985 1990 1995 2000 2005 2010 2015
Spik
elet
s per
pan
icle
80
100
120
140
160
180
(c)
Year of release
1980 1985 1990 1995 2000 2005 2010 2015
Spik
elet
s per
m2 (1
03 )
25
30
35
40
45
50
(d)
Year of release
1980 1985 1990 1995 2000 2005 2010 2015
Fille
d-gr
ain
perc
enta
ge (%
)
86
88
90
92
(e)
Year of release
1980 1985 1990 1995 2000 2005 2010 2015
Gra
in w
eigh
t (m
g)
25
26
27
28
(f)
Year of release
1980 1985 1990 1995 2000 2005 2010 2015
Gra
in y
ield
(kg
ha-1
)
7000
8000
9000
10000
y = -2.3x + 335.7R2 = 0.85**(P < 0.01)
y = -0.08x + 90.1R2 = 0.82**(P < 0.01)
y = -0.02x + 26.9R2 = 0.10ns
y = 63.3x + 7498.9R2 = 0.88**(P < 0.01)
y = 0.35x + 30.8R2 = 0.83**(P < 0.01)
y = 2.1x + 89.3R2 = 0.94**(P < 0.01)
Figure 1. Relationships between year of release and panicles per m2 (a), spikelets per panicle (b), spikelets per m2 (c), filled-grain percentage (d), grain weight (e), and grain yield (f) of rice cultivars. Data were fitted by linear regression (y = ax + b). In the linear regression, x was reassigned as years after 1983; for example, x was valued as 1 in 1983 and so on. **, significant at the 0.01 probability level according to the LSD test; ns, not significant at the 0.05 probability level according to the LSD test. Vertical bars represent ± standard error of the mean (n = 6).
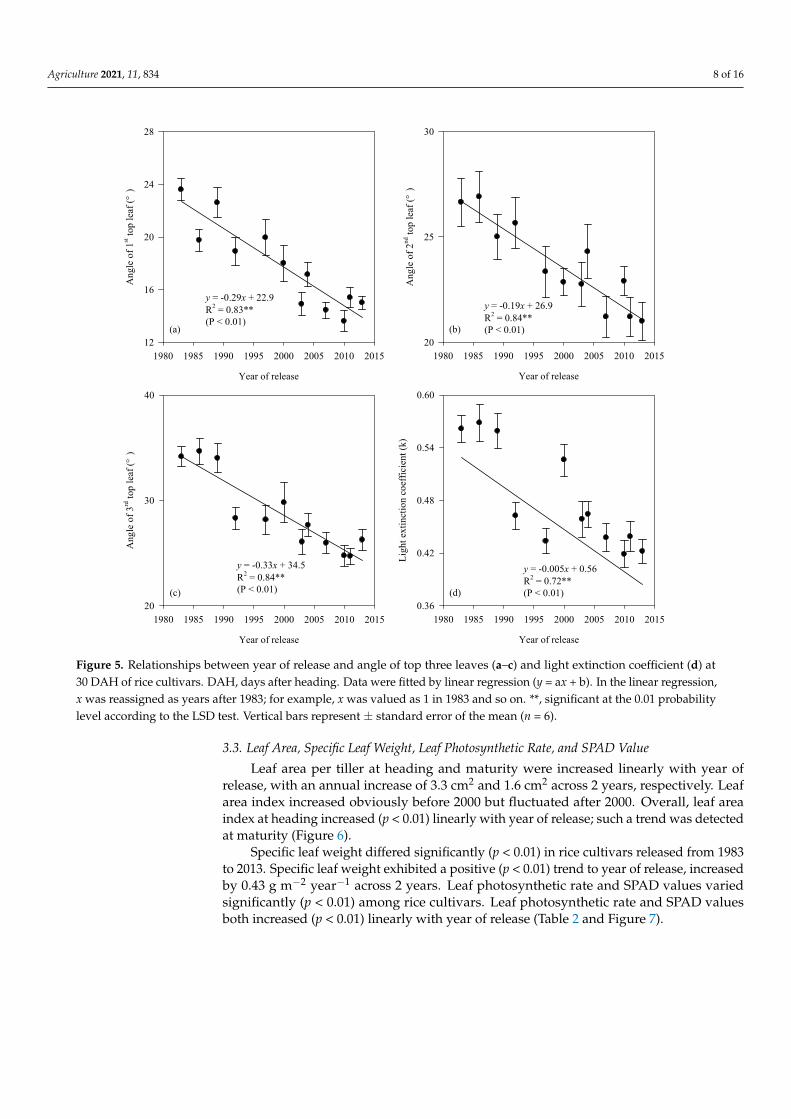
Single panicle weight varied significantly (p < 0.01) in rice cultivars from 2.3 g to 3.6 g across 2 years. There existed a positive correlation between single panicle weight and year of release among rice cultivars released from 1983 to 2013, with an annual increase of 0.04 g (Table 2 and Figure 2).
Figure 1. Relationships between year of release and panicles per m2 (a), spikelets per panicle (b), spikelets per m2 (c),filled-grain percentage (d), grain weight (e), and grain yield (f) of rice cultivars. Data were fitted by linear regression(y = ax + b). In the linear regression, x was reassigned as years after 1983; for example, x was valued as 1 in 1983 and so on.**, significant at the 0.01 probability level according to the LSD test; ns, not significant at the 0.05 probability level accordingto the LSD test. Vertical bars represent ± standard error of the mean (n = 6).
Single panicle weight varied significantly (p < 0.01) in rice cultivars from 2.3 g to 3.6 gacross 2 years. There existed a positive correlation between single panicle weight and yearof release among rice cultivars released from 1983 to 2013, with an annual increase of 0.04 g(Table 2 and Figure 2).
Agriculture 2021, 11, x FOR PEER REVIEW 6 of 17
Year of release
1980 1985 1990 1995 2000 2005 2010 2015
Sing
le p
anic
le w
eigh
t (g)
2
3
4
y = 0.04x + 2.2R2 = 0.92**(P < 0.01)
Figure 2. Relationship between year of release and single panicle weight of rice cultivars. Data were fitted by linear re-gression (y = ax + b). In the linear regression, x was reassigned as years after 1983; for example, x was valued as 1 in 1983 and so on. **, significant at the 0.01 probability level according to the LSD test. Vertical bars represent ± standard error of the mean (n = 6).
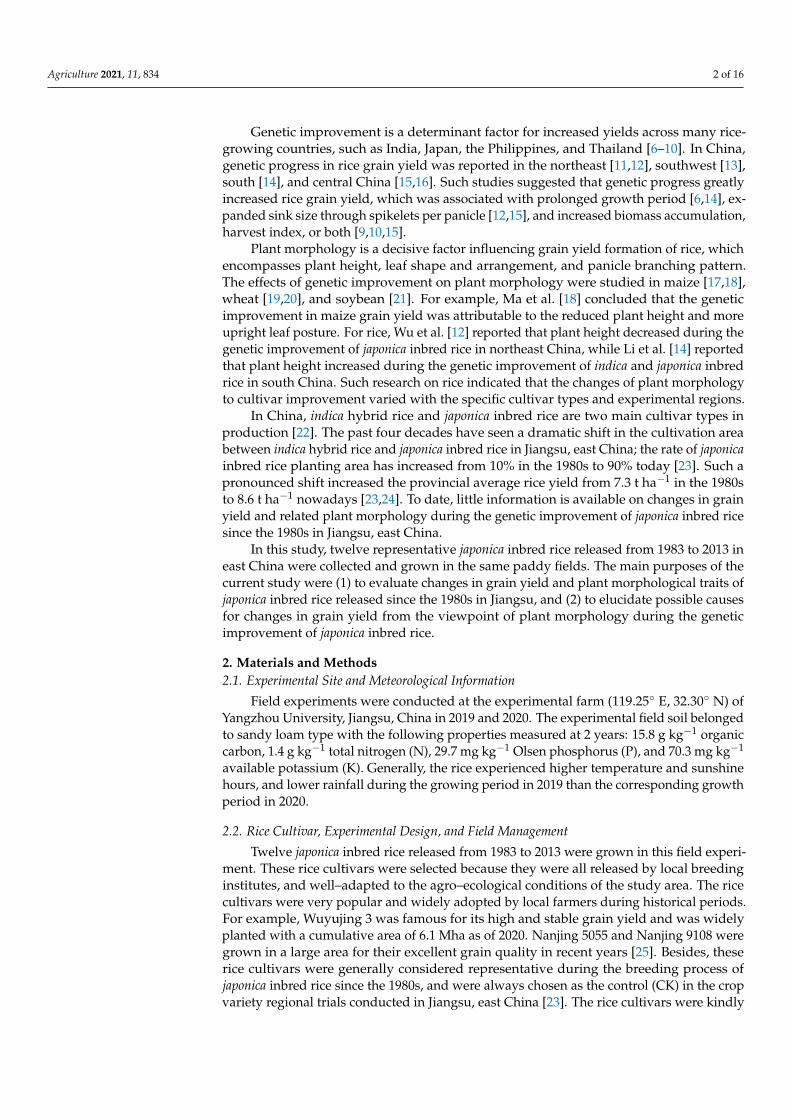
The number of primary and secondary branches increased (p < 0.01) with year of re-lease, and the annual increase in the number of secondary branches was more than that of primary branches. Similarly, the number of grains on primary and secondary branches both exhibited positive (p < 0.01) trends to year of release; the annual increase in number of grains on secondary branches averaged 1.30 across 2 years and was higher than that of grains on primary branches (0.83) (Figure 3).
Figure 2. Relationship between year of release and single panicle weight of rice cultivars. Data werefitted by linear regression (y = ax + b). In the linear regression, x was reassigned as years after 1983;for example, x was valued as 1 in 1983 and so on. **, significant at the 0.01 probability level accordingto the LSD test. Vertical bars represent ± standard error of the mean (n = 6).

Agriculture 2021, 11, 834 6 of 16
The number of primary and secondary branches increased (p < 0.01) with year ofrelease, and the annual increase in the number of secondary branches was more than thatof primary branches. Similarly, the number of grains on primary and secondary branchesboth exhibited positive (p < 0.01) trends to year of release; the annual increase in numberof grains on secondary branches averaged 1.30 across 2 years and was higher than that ofgrains on primary branches (0.83) (Figure 3).
Agriculture 2021, 11, x FOR PEER REVIEW 7 of 17
(a)
Year of release
1980 1985 1990 1995 2000 2005 2010 2015
Num
ber o
f prim
ary
bran
ches
8
10
12
14
(c)
Year of release
1980 1985 1990 1995 2000 2005 2010 2015
Num
ber o
f gra
ins o
n pr
imar
y br
anch
es
40
60
80
(b)
Year of release
1980 1985 1990 1995 2000 2005 2010 2015
Num
ber o
f sec
onda
ry b
ranc
hes
10
20
30
40
(d)
Year of release
1980 1985 1990 1995 2000 2005 2010 2015
Num
ber o
f gra
ins o
n se
cond
ary
bran
ches
30
60
90
y = 0.11x + 9.7R2 = 0.81**(P < 0.01)
y = 0.83x + 52.7R2 = 0.89**(P < 0.01)
y = 0.53x + 15.1R2 = 0.78**(P < 0.01)
y = 1.3x + 36.6R2 = 0.86**(P < 0.01)
Figure 3. Relationships between year of release and number of primary and secondary branches (a,b) and number of grains on primary and secondary branches (c,d) of rice cultivars. Data were fitted by linear regression (y = ax + b). In the linear regression, x was reassigned as years after 1983; for example, x was valued as 1 in 1983 and so on. **, significant at the 0.01 probability level according to the LSD test. Vertical bars represent ± standard error of the mean (n = 6).
3.2. Leaf Length, Width, and Angle, and Light Extinction Coefficient The width of the 1st top leaf was increased (p < 0.01) linearly with year of release, and
such trend was detected for the 2nd and 3rd top leaves. Generally, the length of the 3rd top leaf did not change significantly during rice cultivar improvement; the lengths of the 1st and 2nd top leaves increased (p < 0.01) linearly with year of release (Figure 4).
Figure 3. Relationships between year of release and number of primary and secondary branches (a,b) and number of grainson primary and secondary branches (c,d) of rice cultivars. Data were fitted by linear regression (y = ax + b). In the linearregression, x was reassigned as years after 1983; for example, x was valued as 1 in 1983 and so on. **, significant at the 0.01probability level according to the LSD test. Vertical bars represent ± standard error of the mean (n = 6).
3.2. Leaf Length, Width, and Angle, and Light Extinction Coefficient
The width of the 1st top leaf was increased (p < 0.01) linearly with year of release, andsuch trend was detected for the 2nd and 3rd top leaves. Generally, the length of the 3rd topleaf did not change significantly during rice cultivar improvement; the lengths of the 1stand 2nd top leaves increased (p < 0.01) linearly with year of release (Figure 4).

Agriculture 2021, 11, 834 7 of 16Agriculture 2021, 11, x FOR PEER REVIEW 8 of 17
(a)
Year of release
1980 1985 1990 1995 2000 2005 2010 2015
Leng
th o
f 1st to
p le
af (c
m)
18
24
30
36
(d)
Year of release
1980 1985 1990 1995 2000 2005 2010 2015
Wid
th o
f 1st to
p le
af (c
m)
1.2
1.8
2.4
(e)
Year of release
1980 1985 1990 1995 2000 2005 2010 2015
Wid
th o
f 2nd
top
leaf
(cm
)
1.0
1.5
2.0
(c)
Year of release
1980 1985 1990 1995 2000 2005 2010 2015
Leng
th o
f 3rd
top
leaf
(cm
)
35
40
45
(f)
Year of release
1980 1985 1990 1995 2000 2005 2010 2015W
idth
of 3
rd to
p le
af (c
m)
1.0
1.2
1.4
1.6
1.8
(b)
Year of release
1980 1985 1990 1995 2000 2005 2010 2015Le
ngth
of 2
nd to
p le
af (c
m)
25
30
35
40
y = 0.27x + 21.4R2 = 0.63**(P < 0.01)
y = 0.02x + 1.5R2 = 0.79**(P < 0.01)
y = 0.02x + 1.3R2 = 0.89**(P < 0.01)
y = 0.26x + 29.3R2 = 0.75**(P < 0.01)
y = 0.04x + 38.5R2 = 0.07ns
y = 0.01x + 1.2R2 = 0.85**(P < 0.01)
Figure 4. Relationships between year of release and length and width of 1st top leaves (a,d), 2nd top leaves (b,e), and 3rd top leaves (c,f) at 30 DAH of rice cultivars. DAH, days after heading. Data were fitted by linear regression (y = ax + b). In the linear regression, x was reassigned as years after 1983; for example, x was valued as 1 in 1983 and so on. **, significant at the 0.01 probability level according to the LSD test; ns, not significant at the 0.05 probability level according to the LSD test. Vertical bars represent ± standard error of the mean (n = 6).
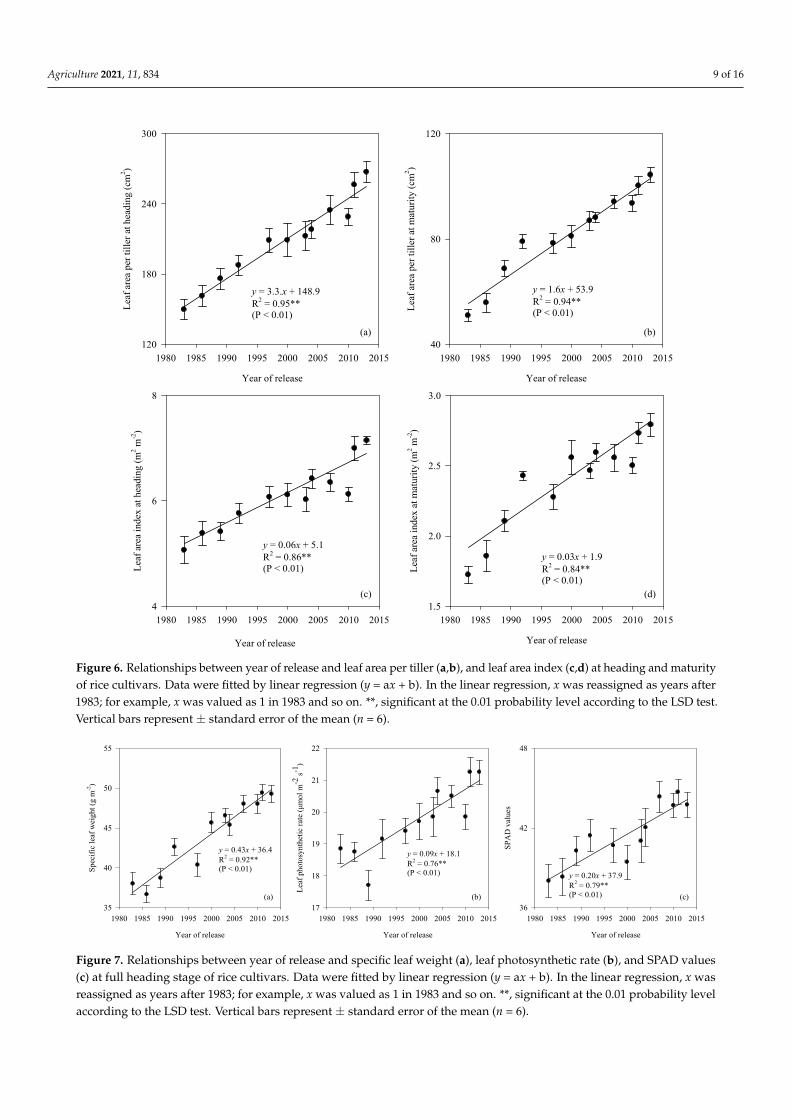
The angle of the top three leaves showed negative (p < 0.01) trends to year of release. Generally, the angle of the 3rd top leaf decreased by 0.33° year−1, and was higher than that of the 1st (0.29° year−1) and 2nd (0.19° year−1) top leaves. Light extinction coefficient varied significantly (p < 0.01) from 0.57 to 0.42 in rice cultivars released from 1983 to 2013 across 2 years. Light extinction coefficient showed a negative (p < 0.01) trend against year of re-lease, with an annual reduction of 0.005 (Table 2 and Figure 5).
Figure 4. Relationships between year of release and length and width of 1st top leaves (a,d), 2nd top leaves (b,e), and 3rdtop leaves (c,f) at 30 DAH of rice cultivars. DAH, days after heading. Data were fitted by linear regression (y = ax + b). Inthe linear regression, x was reassigned as years after 1983; for example, x was valued as 1 in 1983 and so on. **, significant atthe 0.01 probability level according to the LSD test; ns, not significant at the 0.05 probability level according to the LSD test.Vertical bars represent ± standard error of the mean (n = 6).
The angle of the top three leaves showed negative (p < 0.01) trends to year of release.Generally, the angle of the 3rd top leaf decreased by 0.33◦ year−1, and was higher thanthat of the 1st (0.29◦ year−1) and 2nd (0.19◦ year−1) top leaves. Light extinction coefficientvaried significantly (p < 0.01) from 0.57 to 0.42 in rice cultivars released from 1983 to 2013across 2 years. Light extinction coefficient showed a negative (p < 0.01) trend against yearof release, with an annual reduction of 0.005 (Table 2 and Figure 5).
Agriculture 2021, 11, 834 8 of 16
(a)
Year of release
1980 1985 1990 1995 2000 2005 2010 2015
Ang
le o
f 1st to
p le
af (°
)
12
16
20
24
28
(b)
Year of release
1980 1985 1990 1995 2000 2005 2010 2015
Ang
le o
f 2nd
top
leaf
(°)
20
25
30
(c)
Year of release
1980 1985 1990 1995 2000 2005 2010 2015
Ang
le o
f 3rd
top
leaf
(°)
20
30
40
(d)
Year of release
1980 1985 1990 1995 2000 2005 2010 2015
Ligh
t ext
inct
ion
coef
ficie
nt (k
)
0.36
0.42
0.48
0.54
0.60
y = -0.29x + 22.9R2 = 0.83**(P < 0.01)
y = -0.005x + 0.56R2 = 0.72**(P < 0.01)
y = -0.33x + 34.5R2 = 0.84**(P < 0.01)
y = -0.19x + 26.9R2 = 0.84**(P < 0.01)
Figure 5. Relationships between year of release and angle of top three leaves (a–c) and light extinction coefficient (d) at 30 DAH of rice cultivars. DAH, days after heading. Data were fitted by linear regression (y = ax + b). In the linear regression, x was reassigned as years after 1983; for example, x was valued as 1 in 1983 and so on. **, significant at the 0.01 probability level according to the LSD test. Vertical bars represent ± standard error of the mean (n = 6).
Figure 5. Relationships between year of release and angle of top three leaves (a–c) and light extinction coefficient (d) at30 DAH of rice cultivars. DAH, days after heading. Data were fitted by linear regression (y = ax + b). In the linear regression,x was reassigned as years after 1983; for example, x was valued as 1 in 1983 and so on. **, significant at the 0.01 probabilitylevel according to the LSD test. Vertical bars represent ± standard error of the mean (n = 6).
3.3. Leaf Area, Specific Leaf Weight, Leaf Photosynthetic Rate, and SPAD Value
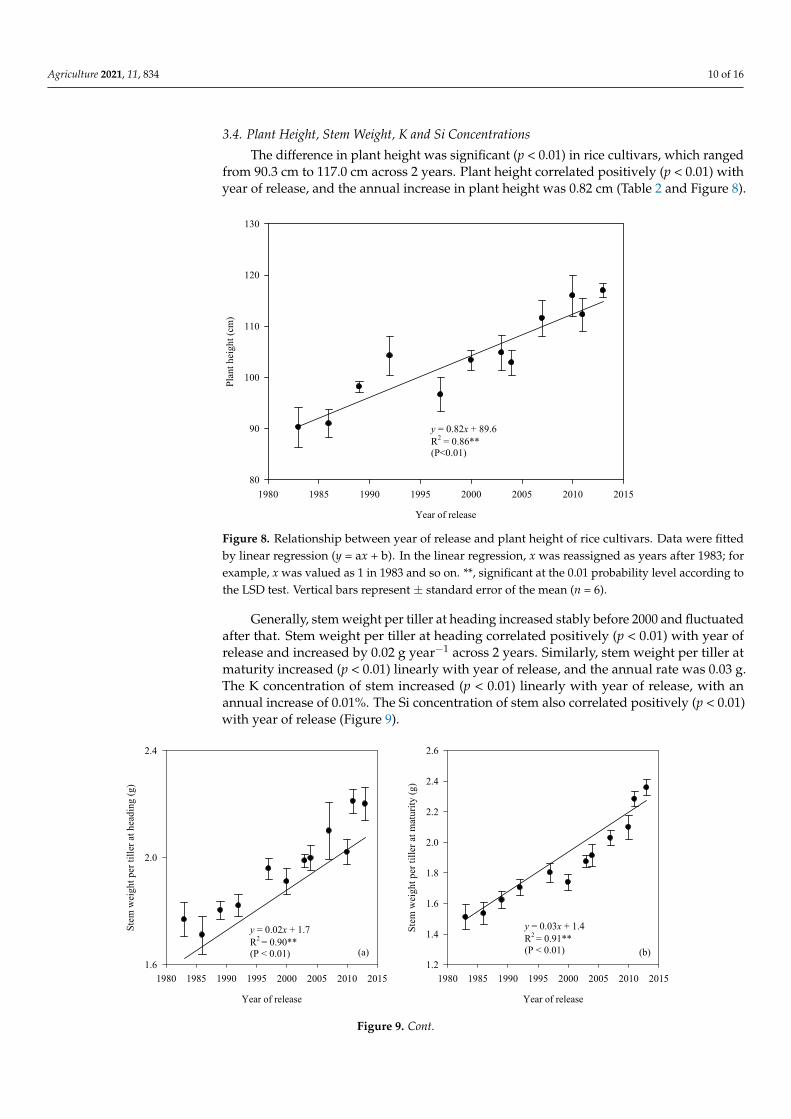
Leaf area per tiller at heading and maturity were increased linearly with year ofrelease, with an annual increase of 3.3 cm2 and 1.6 cm2 across 2 years, respectively. Leafarea index increased obviously before 2000 but fluctuated after 2000. Overall, leaf areaindex at heading increased (p < 0.01) linearly with year of release; such a trend was detectedat maturity (Figure 6).
Specific leaf weight differed significantly (p < 0.01) in rice cultivars released from 1983to 2013. Specific leaf weight exhibited a positive (p < 0.01) trend to year of release, increasedby 0.43 g m−2 year−1 across 2 years. Leaf photosynthetic rate and SPAD values variedsignificantly (p < 0.01) among rice cultivars. Leaf photosynthetic rate and SPAD valuesboth increased (p < 0.01) linearly with year of release (Table 2 and Figure 7).
Agriculture 2021, 11, 834 9 of 16
Agriculture 2021, 11, x FOR PEER REVIEW 10 of 17
(a)
Year of release
1980 1985 1990 1995 2000 2005 2010 2015
Leaf
are
a pe
r till
er a
t hea
ding
(cm
2 )
120
180
240
300
(b)
Year of release
1980 1985 1990 1995 2000 2005 2010 2015
Leaf
are
a pe
r till
er a
t mat
urity
(cm
2 )
40
80
120
(c)
Year of release
1980 1985 1990 1995 2000 2005 2010 2015
Leaf
are
a in
dex
at h
eadi
ng (m
2 m-2
)
4
6
8
(d)
Year of release
1980 1985 1990 1995 2000 2005 2010 2015
Leaf
are
a in
dex
at m
atur
ity (m
2 m-2
)
1.5
2.0
2.5
3.0
y = 3.3.x + 148.9R2 = 0.95**(P < 0.01)
y = 0.03x + 1.9R2 = 0.84**(P < 0.01)
y = 0.06x + 5.1R2 = 0.86**(P < 0.01)
y = 1.6x + 53.9R2 = 0.94**(P < 0.01)
Figure 6. Relationships between year of release and leaf area per tiller (a,b), and leaf area index (c,d) at heading and maturity of rice cultivars. Data were fitted by linear regression (y = ax + b). In the linear regression, x was reassigned as years after 1983; for example, x was valued as 1 in 1983 and so on. **, significant at the 0.01 probability level according to the LSD test. Vertical bars represent ± standard error of the mean (n = 6).
Specific leaf weight differed significantly (p < 0.01) in rice cultivars released from 1983 to 2013. Specific leaf weight exhibited a positive (p < 0.01) trend to year of release, in-creased by 0.43 g m−2 year−1 across 2 years. Leaf photosynthetic rate and SPAD values var-ied significantly (p < 0.01) among rice cultivars. Leaf photosynthetic rate and SPAD values both increased (p < 0.01) linearly with year of release (Table 2 and Figure 7).
Figure 6. Relationships between year of release and leaf area per tiller (a,b), and leaf area index (c,d) at heading and maturityof rice cultivars. Data were fitted by linear regression (y = ax + b). In the linear regression, x was reassigned as years after1983; for example, x was valued as 1 in 1983 and so on. **, significant at the 0.01 probability level according to the LSD test.Vertical bars represent ± standard error of the mean (n = 6).
Agriculture 2021, 11, x FOR PEER REVIEW 11 of 17
(a)
Year of release
1980 1985 1990 1995 2000 2005 2010 2015
Spec
ific
leaf
wei
ght (
g m
-2)
35
40
45
50
55
(b)
Year of release
1980 1985 1990 1995 2000 2005 2010 2015
Leaf
pho
tosy
nthe
tic ra
te (μ
mol
m-2
s-1)
17
18
19
20
21
22
(c)
Year of release
1980 1985 1990 1995 2000 2005 2010 2015
SPA
D v
alue
s
36
42
48
y = 0.43x + 36.4R2 = 0.92**(P < 0.01)
y = 0.20x + 37.9R2 = 0.79**(P < 0.01)
y = 0.09x + 18.1R2 = 0.76**(P < 0.01)
Figure 7. Relationships between year of release and specific leaf weight (a), leaf photosynthetic rate (b), and SPAD values (c) at full heading stage of rice cultivars. Data were fitted by linear regression (y = ax + b). In the linear regression, x was reassigned as years after 1983; for example, x was valued as 1 in 1983 and so on. **, significant at the 0.01 probability level according to the LSD test. Vertical bars represent ± standard error of the mean (n = 6).
3.4. Plant Height, Stem Weight, K and Si Concentrations The difference in plant height was significant (p < 0.01) in rice cultivars, which ranged
from 90.3 cm to 117.0 cm across 2 years. Plant height correlated positively (p < 0.01) with year of release, and the annual increase in plant height was 0.82 cm (Table 2 and Figure 8).
Year of release
1980 1985 1990 1995 2000 2005 2010 2015
Plan
t hei
ght (
cm)
80
90
100
110
120
130
y = 0.82x + 89.6R2 = 0.86**(P<0.01)
Figure 8. Relationship between year of release and plant height of rice cultivars. Data were fitted by linear regression (y = ax + b). In the linear regression, x was reassigned as years after 1983; for example, x was valued as 1 in 1983 and so on. **, significant at the 0.01 probability level according to the LSD test. Vertical bars represent ± standard error of the mean (n = 6).
Generally, stem weight per tiller at heading increased stably before 2000 and fluctu-ated after that. Stem weight per tiller at heading correlated positively (p < 0.01) with year of release and increased by 0.02 g year−1 across 2 years. Similarly, stem weight per tiller at maturity increased (p < 0.01) linearly with year of release, and the annual rate was 0.03 g.
Figure 7. Relationships between year of release and specific leaf weight (a), leaf photosynthetic rate (b), and SPAD values(c) at full heading stage of rice cultivars. Data were fitted by linear regression (y = ax + b). In the linear regression, x wasreassigned as years after 1983; for example, x was valued as 1 in 1983 and so on. **, significant at the 0.01 probability levelaccording to the LSD test. Vertical bars represent ± standard error of the mean (n = 6).
Agriculture 2021, 11, 834 10 of 16
3.4. Plant Height, Stem Weight, K and Si Concentrations
The difference in plant height was significant (p < 0.01) in rice cultivars, which rangedfrom 90.3 cm to 117.0 cm across 2 years. Plant height correlated positively (p < 0.01) withyear of release, and the annual increase in plant height was 0.82 cm (Table 2 and Figure 8).
Agriculture 2021, 11, x FOR PEER REVIEW 11 of 17
(a)
Year of release
1980 1985 1990 1995 2000 2005 2010 2015
Spec
ific
leaf
wei
ght (
g m
-2)
35
40
45
50
55
(b)
Year of release
1980 1985 1990 1995 2000 2005 2010 2015
Leaf
pho
tosy
nthe
tic ra
te (μ
mol
m-2
s-1)
17
18
19
20
21
22
(c)
Year of release
1980 1985 1990 1995 2000 2005 2010 2015
SPA
D v
alue
s
36
42
48
y = 0.43x + 36.4R2 = 0.92**(P < 0.01)
y = 0.20x + 37.9R2 = 0.79**(P < 0.01)
y = 0.09x + 18.1R2 = 0.76**(P < 0.01)
Figure 7. Relationships between year of release and specific leaf weight (a), leaf photosynthetic rate (b), and SPAD values (c) at full heading stage of rice cultivars. Data were fitted by linear regression (y = ax + b). In the linear regression, x was reassigned as years after 1983; for example, x was valued as 1 in 1983 and so on. **, significant at the 0.01 probability level according to the LSD test. Vertical bars represent ± standard error of the mean (n = 6).
3.4. Plant Height, Stem Weight, K and Si Concentrations The difference in plant height was significant (p < 0.01) in rice cultivars, which ranged
from 90.3 cm to 117.0 cm across 2 years. Plant height correlated positively (p < 0.01) with year of release, and the annual increase in plant height was 0.82 cm (Table 2 and Figure 8).
Year of release
1980 1985 1990 1995 2000 2005 2010 2015
Plan
t hei
ght (
cm)
80
90
100
110
120
130
y = 0.82x + 89.6R2 = 0.86**(P<0.01)
Figure 8. Relationship between year of release and plant height of rice cultivars. Data were fitted by linear regression (y = ax + b). In the linear regression, x was reassigned as years after 1983; for example, x was valued as 1 in 1983 and so on. **, significant at the 0.01 probability level according to the LSD test. Vertical bars represent ± standard error of the mean (n = 6).
Generally, stem weight per tiller at heading increased stably before 2000 and fluctu-ated after that. Stem weight per tiller at heading correlated positively (p < 0.01) with year of release and increased by 0.02 g year−1 across 2 years. Similarly, stem weight per tiller at maturity increased (p < 0.01) linearly with year of release, and the annual rate was 0.03 g.
Figure 8. Relationship between year of release and plant height of rice cultivars. Data were fittedby linear regression (y = ax + b). In the linear regression, x was reassigned as years after 1983; forexample, x was valued as 1 in 1983 and so on. **, significant at the 0.01 probability level according tothe LSD test. Vertical bars represent ± standard error of the mean (n = 6).
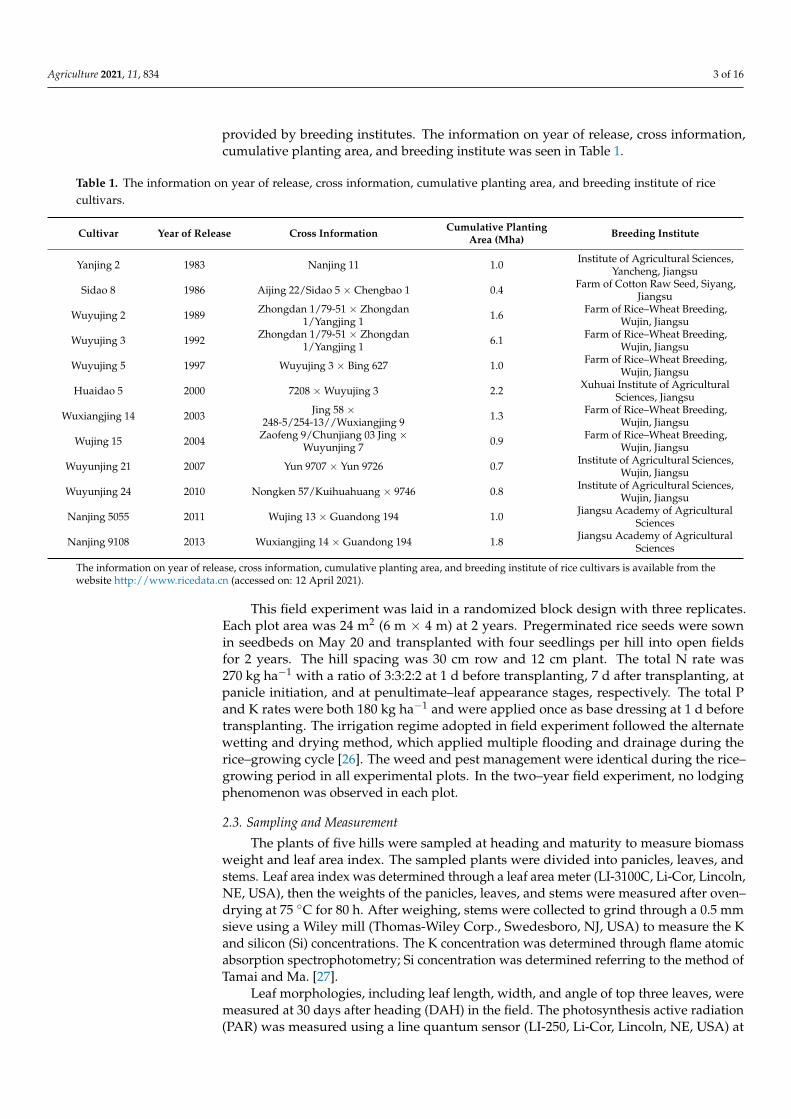
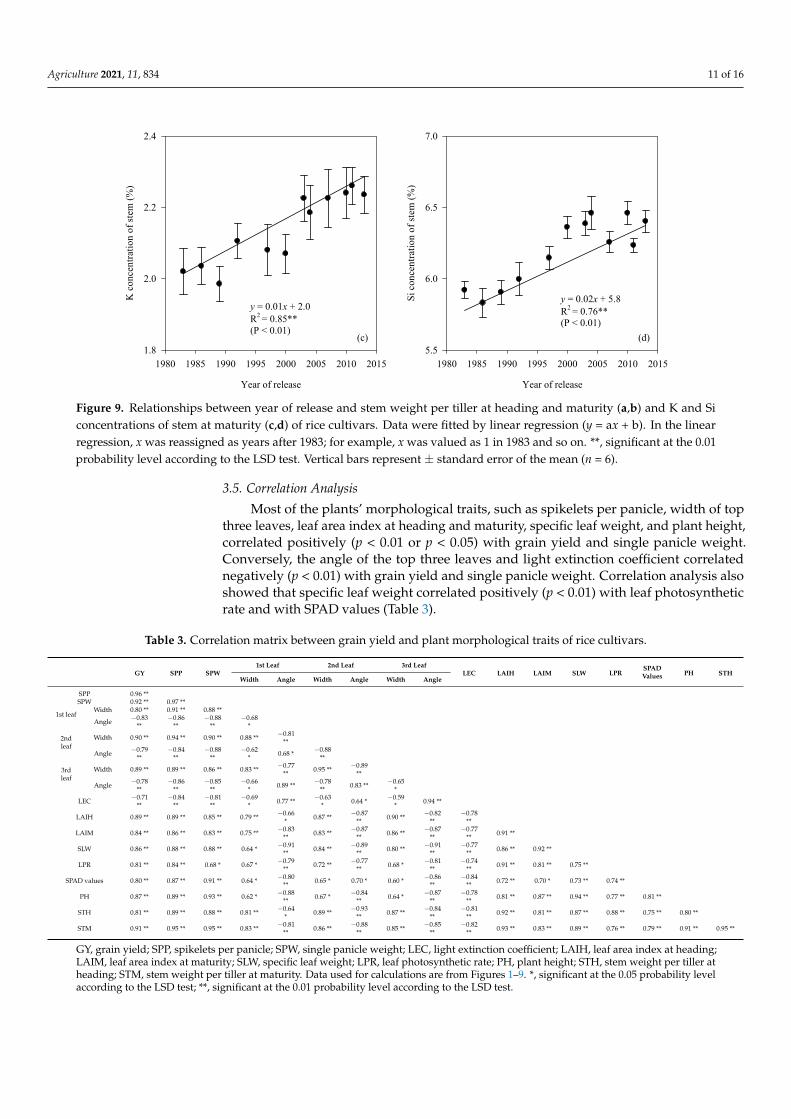
Generally, stem weight per tiller at heading increased stably before 2000 and fluctuatedafter that. Stem weight per tiller at heading correlated positively (p < 0.01) with year ofrelease and increased by 0.02 g year−1 across 2 years. Similarly, stem weight per tiller atmaturity increased (p < 0.01) linearly with year of release, and the annual rate was 0.03 g.The K concentration of stem increased (p < 0.01) linearly with year of release, with anannual increase of 0.01%. The Si concentration of stem also correlated positively (p < 0.01)with year of release (Figure 9).
Agriculture 2021, 11, x FOR PEER REVIEW 12 of 17
The K concentration of stem increased (p < 0.01) linearly with year of release, with an an-nual increase of 0.01%. The Si concentration of stem also correlated positively (p < 0.01) with year of release (Figure 9).
(a)
Year of release
1980 1985 1990 1995 2000 2005 2010 2015
Stem
wei
ght p
er ti
ller a
t hea
ding
(g)
1.6
2.0
2.4
(b)
Year of release
1980 1985 1990 1995 2000 2005 2010 2015
Stem
wei
ght p
er ti
ller a
t mat
urity
(g)
1.2
1.4
1.6
1.8
2.0
2.2
2.4
2.6
(c)
Year of release
1980 1985 1990 1995 2000 2005 2010 2015
K c
once
ntra
tion
of st
em (%
)
1.8
2.0
2.2
2.4
(d)
Year of release
1980 1985 1990 1995 2000 2005 2010 2015
Si c
once
ntra
tion
of st
em (%
)
5.5
6.0
6.5
7.0
y = 0.02x + 1.7R2 = 0.90**(P < 0.01)
y = 0.01x + 2.0R2 = 0.85**(P < 0.01)
y = 0.02x + 5.8R2 = 0.76**(P < 0.01)
y = 0.03x + 1.4R2 = 0.91**(P < 0.01)
Figure 9. Relationships between year of release and stem weight per tiller at heading and maturity (a,b) and K and Si concentrations of stem at maturity (c,d) of rice cultivars. Data were fitted by linear regression (y = ax + b). In the linear regression, x was reassigned as years after 1983; for example, x was valued as 1 in 1983 and so on. **, significant at the 0.01 probability level according to the LSD test. Vertical bars represent ± standard error of the mean (n = 6).
3.5. Correlation Analysis Most of the plants’ morphological traits, such as spikelets per panicle, width of top
three leaves, leaf area index at heading and maturity, specific leaf weight, and plant height, correlated positively (p < 0.01 or p < 0.05) with grain yield and single panicle weight. Conversely, the angle of the top three leaves and light extinction coefficient cor-related negatively (p < 0.01) with grain yield and single panicle weight. Correlation anal-ysis also showed that specific leaf weight correlated positively (p < 0.01) with leaf photo-synthetic rate and with SPAD values (Table 3).
Figure 9. Cont.
Agriculture 2021, 11, 834 11 of 16
Agriculture 2021, 11, x FOR PEER REVIEW 12 of 17
The K concentration of stem increased (p < 0.01) linearly with year of release, with an an-nual increase of 0.01%. The Si concentration of stem also correlated positively (p < 0.01) with year of release (Figure 9).
(a)
Year of release
1980 1985 1990 1995 2000 2005 2010 2015
Stem
wei
ght p
er ti
ller a
t hea
ding
(g)
1.6
2.0
2.4
(b)
Year of release
1980 1985 1990 1995 2000 2005 2010 2015
Stem
wei
ght p
er ti
ller a
t mat
urity
(g)
1.2
1.4
1.6
1.8
2.0
2.2
2.4
2.6
(c)
Year of release
1980 1985 1990 1995 2000 2005 2010 2015
K c
once
ntra
tion
of st
em (%
)
1.8
2.0
2.2
2.4
(d)
Year of release
1980 1985 1990 1995 2000 2005 2010 2015
Si c
once
ntra
tion
of st
em (%
)
5.5
6.0
6.5
7.0
y = 0.02x + 1.7R2 = 0.90**(P < 0.01)
y = 0.01x + 2.0R2 = 0.85**(P < 0.01)
y = 0.02x + 5.8R2 = 0.76**(P < 0.01)
y = 0.03x + 1.4R2 = 0.91**(P < 0.01)
Figure 9. Relationships between year of release and stem weight per tiller at heading and maturity (a,b) and K and Si concentrations of stem at maturity (c,d) of rice cultivars. Data were fitted by linear regression (y = ax + b). In the linear regression, x was reassigned as years after 1983; for example, x was valued as 1 in 1983 and so on. **, significant at the 0.01 probability level according to the LSD test. Vertical bars represent ± standard error of the mean (n = 6).
3.5. Correlation Analysis Most of the plants’ morphological traits, such as spikelets per panicle, width of top
three leaves, leaf area index at heading and maturity, specific leaf weight, and plant height, correlated positively (p < 0.01 or p < 0.05) with grain yield and single panicle weight. Conversely, the angle of the top three leaves and light extinction coefficient cor-related negatively (p < 0.01) with grain yield and single panicle weight. Correlation anal-ysis also showed that specific leaf weight correlated positively (p < 0.01) with leaf photo-synthetic rate and with SPAD values (Table 3).
Figure 9. Relationships between year of release and stem weight per tiller at heading and maturity (a,b) and K and Siconcentrations of stem at maturity (c,d) of rice cultivars. Data were fitted by linear regression (y = ax + b). In the linearregression, x was reassigned as years after 1983; for example, x was valued as 1 in 1983 and so on. **, significant at the 0.01probability level according to the LSD test. Vertical bars represent ± standard error of the mean (n = 6).
3.5. Correlation Analysis
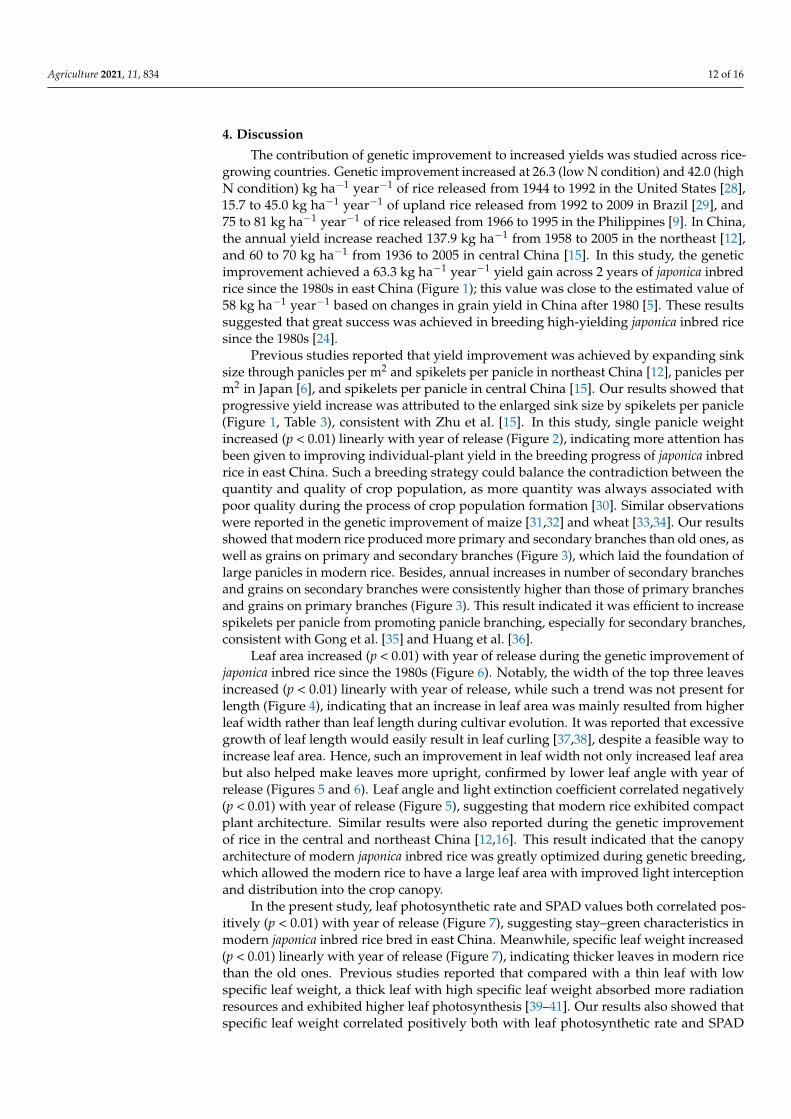
Most of the plants’ morphological traits, such as spikelets per panicle, width of topthree leaves, leaf area index at heading and maturity, specific leaf weight, and plant height,correlated positively (p < 0.01 or p < 0.05) with grain yield and single panicle weight.Conversely, the angle of the top three leaves and light extinction coefficient correlatednegatively (p < 0.01) with grain yield and single panicle weight. Correlation analysis alsoshowed that specific leaf weight correlated positively (p < 0.01) with leaf photosyntheticrate and with SPAD values (Table 3).
Table 3. Correlation matrix between grain yield and plant morphological traits of rice cultivars.
GY SPP SPW1st Leaf 2nd Leaf 3rd Leaf
LEC LAIH LAIM SLW LPRSPADValues PH STH
Width Angle Width Angle Width Angle
SPP 0.96 **SPW 0.92 ** 0.97 **
1st leafWidth 0.80 ** 0.91 ** 0.88 **
Angle −0.83**
−0.86**
−0.88**
−0.68*
2ndleaf
Width 0.90 ** 0.94 ** 0.90 ** 0.88 ** −0.81**
Angle −0.79**
−0.84**
−0.88**
−0.62* 0.68 * −0.88
**
3rdleaf
Width 0.89 ** 0.89 ** 0.86 ** 0.83 ** −0.77** 0.95 ** −0.89
**
Angle −0.78**
−0.86**
−0.85**
−0.66* 0.89 ** −0.78
** 0.83 ** −0.65*
LEC −0.71**
−0.84**
−0.81**
−0.69* 0.77 ** −0.63
* 0.64 * −0.59* 0.94 **
LAIH 0.89 ** 0.89 ** 0.85 ** 0.79 ** −0.66* 0.87 ** −0.87
** 0.90 ** −0.82**
−0.78**
LAIM 0.84 ** 0.86 ** 0.83 ** 0.75 ** −0.83** 0.83 ** −0.87
** 0.86 ** −0.87**
−0.77** 0.91 **
SLW 0.86 ** 0.88 ** 0.88 ** 0.64 * −0.91** 0.84 ** −0.89
** 0.80 ** −0.91**
−0.77** 0.86 ** 0.92 **
LPR 0.81 ** 0.84 ** 0.68 * 0.67 * −0.79** 0.72 ** −0.77
** 0.68 * −0.81**
−0.74** 0.91 ** 0.81 ** 0.75 **
SPAD values 0.80 ** 0.87 ** 0.91 ** 0.64 * −0.80** 0.65 * 0.70 * 0.60 * −0.86
**−0.84
** 0.72 ** 0.70 * 0.73 ** 0.74 **
PH 0.87 ** 0.89 ** 0.93 ** 0.62 * −0.88** 0.67 * −0.84
** 0.64 * −0.87**
−0.78** 0.81 ** 0.87 ** 0.94 ** 0.77 ** 0.81 **
STH 0.81 ** 0.89 ** 0.88 ** 0.81 ** −0.64* 0.89 ** −0.93
** 0.87 ** −0.84**
−0.81** 0.92 ** 0.81 ** 0.87 ** 0.88 ** 0.75 ** 0.80 **
STM 0.91 ** 0.95 ** 0.95 ** 0.83 ** −0.81** 0.86 ** −0.88
** 0.85 ** −0.85**
−0.82** 0.93 ** 0.83 ** 0.89 ** 0.76 ** 0.79 ** 0.91 ** 0.95 **
GY, grain yield; SPP, spikelets per panicle; SPW, single panicle weight; LEC, light extinction coefficient; LAIH, leaf area index at heading;LAIM, leaf area index at maturity; SLW, specific leaf weight; LPR, leaf photosynthetic rate; PH, plant height; STH, stem weight per tiller atheading; STM, stem weight per tiller at maturity. Data used for calculations are from Figures 1–9. *, significant at the 0.05 probability levelaccording to the LSD test; **, significant at the 0.01 probability level according to the LSD test.
Agriculture 2021, 11, 834 12 of 16
4. Discussion
The contribution of genetic improvement to increased yields was studied across rice-growing countries. Genetic improvement increased at 26.3 (low N condition) and 42.0 (highN condition) kg ha−1 year−1 of rice released from 1944 to 1992 in the United States [28],15.7 to 45.0 kg ha−1 year−1 of upland rice released from 1992 to 2009 in Brazil [29], and75 to 81 kg ha−1 year−1 of rice released from 1966 to 1995 in the Philippines [9]. In China,the annual yield increase reached 137.9 kg ha−1 from 1958 to 2005 in the northeast [12],and 60 to 70 kg ha−1 from 1936 to 2005 in central China [15]. In this study, the geneticimprovement achieved a 63.3 kg ha−1 year−1 yield gain across 2 years of japonica inbredrice since the 1980s in east China (Figure 1); this value was close to the estimated value of58 kg ha−1 year−1 based on changes in grain yield in China after 1980 [5]. These resultssuggested that great success was achieved in breeding high-yielding japonica inbred ricesince the 1980s [24].
Previous studies reported that yield improvement was achieved by expanding sinksize through panicles per m2 and spikelets per panicle in northeast China [12], panicles perm2 in Japan [6], and spikelets per panicle in central China [15]. Our results showed thatprogressive yield increase was attributed to the enlarged sink size by spikelets per panicle(Figure 1, Table 3), consistent with Zhu et al. [15]. In this study, single panicle weightincreased (p < 0.01) linearly with year of release (Figure 2), indicating more attention hasbeen given to improving individual-plant yield in the breeding progress of japonica inbredrice in east China. Such a breeding strategy could balance the contradiction between thequantity and quality of crop population, as more quantity was always associated withpoor quality during the process of crop population formation [30]. Similar observationswere reported in the genetic improvement of maize [31,32] and wheat [33,34]. Our resultsshowed that modern rice produced more primary and secondary branches than old ones, aswell as grains on primary and secondary branches (Figure 3), which laid the foundation oflarge panicles in modern rice. Besides, annual increases in number of secondary branchesand grains on secondary branches were consistently higher than those of primary branchesand grains on primary branches (Figure 3). This result indicated it was efficient to increasespikelets per panicle from promoting panicle branching, especially for secondary branches,consistent with Gong et al. [35] and Huang et al. [36].
Leaf area increased (p < 0.01) with year of release during the genetic improvement ofjaponica inbred rice since the 1980s (Figure 6). Notably, the width of the top three leavesincreased (p < 0.01) linearly with year of release, while such a trend was not present forlength (Figure 4), indicating that an increase in leaf area was mainly resulted from higherleaf width rather than leaf length during cultivar evolution. It was reported that excessivegrowth of leaf length would easily result in leaf curling [37,38], despite a feasible way toincrease leaf area. Hence, such an improvement in leaf width not only increased leaf areabut also helped make leaves more upright, confirmed by lower leaf angle with year ofrelease (Figures 5 and 6). Leaf angle and light extinction coefficient correlated negatively(p < 0.01) with year of release (Figure 5), suggesting that modern rice exhibited compactplant architecture. Similar results were also reported during the genetic improvementof rice in the central and northeast China [12,16]. This result indicated that the canopyarchitecture of modern japonica inbred rice was greatly optimized during genetic breeding,which allowed the modern rice to have a large leaf area with improved light interceptionand distribution into the crop canopy.
In the present study, leaf photosynthetic rate and SPAD values both correlated pos-itively (p < 0.01) with year of release (Figure 7), suggesting stay–green characteristics inmodern japonica inbred rice bred in east China. Meanwhile, specific leaf weight increased(p < 0.01) linearly with year of release (Figure 7), indicating thicker leaves in modern ricethan the old ones. Previous studies reported that compared with a thin leaf with lowspecific leaf weight, a thick leaf with high specific leaf weight absorbed more radiationresources and exhibited higher leaf photosynthesis [39–41]. Our results also showed thatspecific leaf weight correlated positively both with leaf photosynthetic rate and SPAD

Agriculture 2021, 11, 834 13 of 16
values (Table 3), suggesting that a higher specific leaf weight might be an important pa-rameter for reflecting improved leaf photosynthetic capacity and biomass production inhigh-yielding rice breeding [16,42].
Most existing literature reported a reduced trend of plant height during the geneticimprovement across maize- and wheat–production countries [18,43–45]. However, such atrend was not consistent during rice cultivar evolution. It was reported that plant heightwas increased [46,47], or reduced [12,28,29] during rice genetic improvement. In thisstudy, plant height was increased (p < 0.01) among rice released from 1983 to 2013 ineast China (Figure 8). The increased plant height promoted leaf extension, benefited lightinterception and leaf photosynthesis, and enhanced grain yield [46]. Besides, we observedthat plant height stabilized at nearly 115 cm in recently bred rice cultivars (released after2010) (Figure 8), which met the recommended plant height (110–120 cm) in the futurebreeding program of japonica inbred rice in China [48,49].
The larger sink size and heavier single panicle weight acquired a stronger stem torealize a higher yield potential in modern rice of our study (Figures 1 and 2). In this study,stem weight per tiller at heading and maturity both correlated positively (p < 0.01) withyear of release (Figure 9), indicating available assimilates production for stem enrichmentafter heading, which was beneficial for stem lodging resistance. Our results herein demon-strated that K and Si concentrations of stem both correlated with year of release (Figure 9).Generally, K and Si elements could help enhance lignified portions and increased thestrength of epidermal cells [50,51]. Therefore, higher stem weight per tiller and K and Siconcentrations contributed to the improvement of lodging resistance in modern japonicainbred rice in east China.
The coordination of the sink–source relationship is a critical factor for grain yield. It iswell documented that rice grain yield is generally sink–limited [52,53]. Our above resultsexhibited that sink (such as spikelets per m2, and single panicle weight) and source (suchas leaf area, specific leaf weight, and leaf photosynthetic rate) both increased along withgenetic cultivar improvement. Such results indicated that genetic progress has reducedsink limitation and maintained sink–source balance. Noteworthy, there existed a negativecorrelation between filled–grain percentage and year of release (Figure 1), indicating itis still a great challenge to improve synergistically sink size and sink–filling efficiency inmodern japonica inbred rice. This information also suggested that source increased relativelyslowly to meet the enlarged sink during the genetic improvement of japonica inbred ricesince the 1980s. Therefore, source-related capacities should receive more attention for ricefuture high-yielding breeding and cultivation practices.
5. Conclusions
The genetic improvement achieved a 63.3 kg ha−1 year−1 yield increase across 2 yearsof japonica inbred rice since the 1980s in east China. The morphological changes in japonicainbred rice have enlarged sink size through spikelets per panicle, increased leaf area by leafwidth, optimized leaf orientation and light distribution within the canopy, improved plantheight and leaf photosynthetic capacity, and enhanced stem strength. These improvedplant morphologies contributed to yield improvement of japonica inbred rice since the1980s. The declined filled-grain percentage in modern rice cultivars might be attributableto more attention for sink, while relatively less for source during the genetic improvement.Future breeding should focus more on source improvement on the basis of expanding sinkto develop high–yielding cultivars.
Author Contributions: T.M. and H.W. conceived, designed the experiments, and wrote the paper;J.G., X.Z., and X.C. performed the experiments; T.M., G.Z., and H.W. analyzed the data, revised themanuscript, and acquired funding. All authors have read and agreed to the published version of themanuscript.
Funding: This work was financed by the National Natural Science Foundation of China (31901448,32001466), Joints Funds of the National Natural Science Foundation of China (U20A2022), Key
Agriculture 2021, 11, 834 14 of 16
Research and Development Program of Jiangsu Province (BE2019343), Postdoctoral Research Foun-dation of China (2020M671628, 2020M671629), and Natural Science Foundation of the Jiangsu HigherEducation Institutions, China (19KJB210004).
Institutional Review Board Statement: Not applicable.
Informed Consent Statement: Not applicable.
Data Availability Statement: Not applicable.
Conflicts of Interest: The authors declare no conflict of interest.
References1. Luo, Y.C.; Zhang, Z.; Cao, J.; Chen, Y.; Zhang, L.L. Drivers of planting area and yield shifts for three staple crops across China,
1950–2013. Clim. Res. 2020, 80, 73–84. [CrossRef]2. Wang, Y.H.; Li, J.Y. Rice, rising. Nat. Genet. 2008, 40, 1273–1275. [CrossRef] [PubMed]3. Chen, C.Q.; Qian, C.R.; Deng, A.X.; Zhang, W.J. Progressive and active adaptations of cropping system to climate change in
Northeast China. Eur. J. Agron. 2012, 38, 94–103. [CrossRef]4. Ma, G.H.; Yuan, L.P. Hybrid rice achievements, development and prospect in China. J. Integr. Agric. 2015, 14, 197–205. [CrossRef]5. Yu, Y.Q.; Huang, Y.; Zhang, W. Changes in rice yields in China since 1980 associated with cultivar improvement, climate and crop
management. Field Crop. Res. 2012, 136, 65–75. [CrossRef]6. Anzoua, K.G.; Junichi, K.; Toshihiro, H.; Kazuto, I.; Yutaka, J. Genetic improvements for high yield and low soil nitrogen tolerance
in rice (Oryza Sativa L.) under a cold environment. Field Crop. Res. 2010, 116, 38–45. [CrossRef]7. Kumar, A.; Raman, A.; Yadav, S.; Verulkar, S.B.; Mandal, N.P.; Singh, O.N.; Swain, P.; Ram, T.; Badri, J.; Dwivedi, J.L.; et al. Genetic
gain for rice yield in rainfed environments in India. Field Crop. Res. 2021, 260, 107977. [CrossRef]8. Lafitte, H.R.; Courtoris, B.; Arraudeau, M. Genetic improvement of rice in aerobic systems: Progress from yield to genes. Field
Crop. Res. 2002, 75, 171–190. [CrossRef]9. Peng, S.; Laza, R.C.; Visperas, R.M.; Sanico, A.L.; Cassman, K.G.; Khush, G.S. Grain yield of rice cultivars and lines developed in
the Philippines since 1966. Crop Sci. 2000, 40, 307–314. [CrossRef]10. Saito, K.; Asai, H.; Zhao, D.; Laborte, A.G.; Grenier, C. Progress in varietal improvement for increasing upland rice productivity
in the tropics. Plant Prod. Sci. 2018, 21, 145–158. [CrossRef]11. Sun, J.; Liu, D.; Wang, J.Y.; Ma, D.R.; Tang, L.; Gao, H.; Xu, Z.J.; Chen, W.F. The contribution of intersubspecific hybridization to
the breeding of super-high-yielding japonica rice in northeast China. Theor. Appl. Genet. 2012, 125, 1149–1157. [CrossRef]12. Wu, Z.H.; Xu, K.Z.; Zhao, Y.J.; He, X.L.; Wang, X.L.; Ling, F.L. Changes of some agronomic traits in japonica rice varieties during
forty-seven years of genetic improvement in Jilin province, China. Chin. J. Rice Sci. 2007, 21, 507–512. (In Chinese)13. Liang, Y.S.; Nan, W.B.; Qin, X.J.; Zhang, H.M. Field performance on grain yield and quality and genetic diversity of overwintering
cultivated rice (Oryza sativa L.) in southwest China. Sci. Rep.-UK 2021, 11, 1846. [CrossRef]14. Li, R.H.; Li, M.J.; Ashraf, U.; Liu, S.W.; Zhang, J.E. Exploring the relationships between yield and yield-related traits for rice
varieties released in China from 1978 to 2017. Front. Plant Sci. 2019, 10, 543. [CrossRef]15. Zhu, G.L.; Peng, S.B.; Huang, J.L.; Cui, K.H.; Nie, L.X.; Wang, F. Genetic improvements in rice yield and concomitant increases in
radiation- and nitrogen-use efficiency in middle reaches of Yangtze River. Sci. Rep.-UK 2016, 6, 21049. [CrossRef]16. Zhu, G.L.; Ren, Z.; Liu, Y.Q.; Lu, F.G.; Gu, L.F.; Shi, Y.; Liu, J.W.; Zhou, G.S.; Nimir, N.E.A.; Mohapatra, P.K. Optimization of leaf
properties and plant phenotype through yield-based genetic improvement of rice over a period of seventy years in the YangtzeRiver Basin of China. Food Energy Secur. 2020, 9, e223. [CrossRef]
17. Haegele, J.W.; Cook, K.A.; Nichols, D.M.; Below, F.E. Changes in nitrogen use traits associated with genetic improvement forgrain yield of maize hybrids released in different decades. Crop Sci. 2013, 53, 1256–1268. [CrossRef]
18. Ma, D.L.; Xie, R.Z.; Niu, X.K.; Li, S.K.; Long, H.L.; Liu, Y.E. Changes in the morphological traits of maize genotypes in Chinabetween the 1950s and 2000s. Eur. J. Agron. 2014, 58, 1–10. [CrossRef]
19. Brancourt-Hulmel, M.; Doussinault, G.; Lecomte, C.; Bérard, P.; Buanec, B.L.; Trottet, M. Genetic improvement of agronomic traitsof winter wheat cultivars released in France from 1946 to 1992. Crop Sci. 2003, 43, 37–45. [CrossRef]
20. Zhou, Y.; He, Z.H.; Sui, X.X.; Xia, X.C.; Zhang, X.K.; Zhang, G.S. Genetic improvement of grain yield and associated traits in thenorthern China winter wheat region from 1960 to 2000. Crop Sci. 2007, 47, 245–253. [CrossRef]
21. Cober, E.M.; Morrison, M.J.; Ma, B.L.; Bulter, G. Genetic improvement rates of short-season soybean increase with plantpopulation. Crop Sci. 2005, 45, 1029–1034. [CrossRef]
22. Meng, T.Y.; Wei, H.H.; Li, X.Y.; Dai, Q.G.; Huo, Z.Y. A better root morpho-physiology after heading contributing to yieldsuperiority of japonica/indica hybrid rice. Field Crop. Res. 2018, 228, 135–146. [CrossRef]
23. Zhang, H.C.; Zhang, J.; Gong, J.L.; Chang, Y.; Li, M.; Gao, H.; Dai, Q.G.; Huo, Z.Y.; Xu, K.; Wei, H.Y. The productive advantagesand formation mechanisms of “indica rice to japonica rice”. Sci. Agric. Sin. 2013, 46, 686–704.
24. Wang, C.L.; Zhang, Y.D.; Zhu, Z.; Chen, T.; Zhao, Q.Y.; Zhong, W.G.; Yang, J.; Yao, S.; Zhou, L.H.; Zhao, L.; et al. Research progresson the breeding of japonica super rice varieties in Jiangsu Province, China. J. Integr. Agric. 2017, 16, 992–999. [CrossRef]

Agriculture 2021, 11, 834 15 of 16
25. Wang, W.T.; Cui, W.P.; Xu, K.; Gao, H.; Wei, H.Y.; Zhang, H.C. Effects of early- and late-sowing on starch accumulation andassociated enzyme activities during grain filling stage in rice. Rice Sci. 2021, 28, 191–199.
26. Zhang, W.Y.; Yu, J.X.; Xu, Y.J.; Wang, Z.Q.; Liu, L.J.; Zhang, H.; Gu, J.F.; Zhang, J.H.; Yang, J.C. Alternate wetting and dryingirrigation combined with the proportion of polymer-coated urea and conventional urea rates increases grain yield, water andnitrogen use efficiencies in rice. Field Crop. Res. 2021, 268, 101865. [CrossRef]
27. Tamai, K.; Ma, J.F. Characterization of silicon uptake by rice roots. New Phytol. 2003, 158, 431–436. [CrossRef]28. Tabien, R.E.; Samonte, S.O.P.B.; McClung, A.M. Forty-eight years of rice improvement in Texas since the release of cultivar
Bluebonnet in 1944. Crop Sci. 2008, 48, 2097–2106. [CrossRef]29. Breseghello, F.; Morais, O.P.; Pinheiro, P.V.; Silva, A.C.S.; Castro, E.M.; Guimarães, E.P.; Castro, A.P.; Pereira, J.A.; Lopes, A.M.;
Utumi, M.M.; et al. Results of 25 years of upland rice breeding in Brazil. Crop Sci. 2011, 51, 914–923. [CrossRef]30. Fasoula, V.A.; Fasoula, D.A. Principles underlying genetic improvement for high and stable crop yield potential. Field Crop. Res.
2002, 75, 191–209. [CrossRef]31. Duvick, D.N. The contribution of breeding to yield advances in maize (Zea mays L.). Adv. Agron. 2005, 86, 83–145.32. Gonzalez, V.H.; Tollenaar, M.; Bowman, A.; Good, B.; Lee, E.A. Maize yield potential and density tolerance. Crop Sci. 2018, 58,
472–485. [CrossRef]33. Royo, C.; Álvaro, F.; Martos, V.; Ramdani, A.; Isidro, J.; Villegas, D.; del Moral, L.F.G. Genetic changes in durum wheat yield
components and associated traits in Italian and Spanish varieties during the 20th century. Euphytica 2007, 155, 259–270. [CrossRef]34. Triboi, E.; Martre, P.; Girousse, C.; Ravel, C.; Triboi-Blondel, A.M. Unravelling environmental and genetic relationships between
grain yield and nitrogen concentration for wheat. Eur. J. Agron. 2006, 25, 108–118. [CrossRef]35. Gong, J.L.; Hu, Y.J.; Long, H.Y.; Chang, Y.; Li, J.; Zhang, H.C.; Ma, R.R.; Wang, X.Y.; Dai, Q.G.; Huo, Z.Y.; et al. Study on
collaborating characteristics of grain yield components and panicle traits of large panicle hybrid japonica rice. Sci. Agric. Sin. 2012,45, 2147–2158.
36. Huang, Y.Y.; Zhao, S.S.; Fu, Y.C.; Sun, H.D.; Ma, X.; Tan, L.B.; Liu, F.X.; Sun, X.Y.; Sun, H.Y.; Gu, P.; et al. Variation in the regulatoryregion of FZP causes increases in secondary inflorescence branching and grain yield in rice domestication. Plant J. 2018, 96,716–733. [CrossRef] [PubMed]
37. Jang, S.; An, G.; Li, H.Y. Rice leaf angle and grain size are affected by the OsBUL1 transcriptional activator complex. Plant Physiol.2017, 173, 688–702. [CrossRef]
38. Mantilla-Perez, M.B.; Fernandez, M.G.S. Differential manipulation of leaf angle throughout the canopy: Current status andprospects. J. Exp. Bot. 2017, 62, 5699–5717. [CrossRef]
39. Kanemura, T.; Homma, K.; Ohsumi, A.; Shiraiwa, T.; Horie, T. Evaluation of genotypic variation in leaf photosynthetic rate andits associated factors by using rice diversity research set of germplasm. Photosynth. Res. 2007, 94, 23–30. [CrossRef]
40. Peng, S.; García, F.V.; Laza, R.C.; Cassman, K.G. Adjustment for specific leaf weight improves Chlorophyll meter’s estimate ofrice leaf nitrogen concentration. Agron. J. 1993, 85, 987–990. [CrossRef]
41. Wei, H.H.; Yang, Y.L.; Shao, X.Y.; Shi, T.Y.; Meng, T.Y.; Lu, Y.; Tao, Y.; Li, X.Y.; Ding, E.H.; Chen, Y.L.; et al. Higher leaf area throughleaf width and lower leaf angle were the primary morphological traits for yield advantage of japonica/indica hybrids. J. Integr.Agric. 2020, 19, 483–494. [CrossRef]
42. Liu, X.; Li, Y. Varietal difference in the correlation between leaf nitrogen content and photosynthesis in rice (Oryza sativa L.) plantsis related to specific leaf weight. J. Integr. Agric. 2016, 15, 2002–2011. [CrossRef]
43. Beche, E.; Benin, G.; da Silva, C.L.; Munaro, L.B.; Marchese, J.A. Genetic gain in yield and changes associated with physiologicaltraits in Brazilian wheat during the 20th century. Eur. J. Agron. 2014, 61, 49–59. [CrossRef]
44. Tian, Z.W.; Jing, Q.; Dai, T.B.; Jiang, D.; Cao, W.X. Effects of genetic improvements on grain yield and agronomic traits of winterwheat in the Yangtze River Basin of China. Field Crop. Res. 2011, 124, 417–425. [CrossRef]
45. Vita, P.D.; Nicosia, O.L.D.; Nigro, F.; Platani, C.; Riefolo, C.; Fonzo, N.D.; Cattivelli, L. Breeding progress in morpho-physiological,agronomical and qualitative traits of durum wheat cultivars released in Italy during the 20th century. Eur. J. Agron. 2007, 26,39–53. [CrossRef]
46. Xiong, J.; Chen, G.L.; Wang, S.H.; Ding, Y.F. The difference in grain yield and plant type among typical japonica varieties indifferent years in Jiangsu Province. J. Nanjing Agric. Univ. 2011, 34, 1–6.
47. Zhang, H.; Chen, T.T.; Liu, L.J.; Wang, Z.Q.; Yang, J.C.; Zhang, J.H. Performance in grain yield and physiological traits of rice inthe Yangtze river basin of China during the last 60 yr. J. Integr. Agric. 2013, 12, 57–66. [CrossRef]
48. Chang, S.Q.; Chang, T.G.; Song, Q.F.; Zhu, X.G.; Deng, Q.Y. Photosynthetic and agronomic traits of an elite hybrid rice Y-Liang-You900 with a record-high yield. Field Crop. Res. 2016, 187, 49–57. [CrossRef]
49. Xu, Z.J.; Chen, W.F. Research progress and related problems on japonica super rice in northern China. Sci. Agric. Sin. 2016, 49,239–250.
50. Mulsanti, I.W.; Yamamoto, T.; Ueda, T.; Samadi, A.F.; Kamahora, E.; Rumanti, I.A.; Thanh, V.C.; Adachi, S.; Suzuki, S.; Kanekatsu,M.; et al. Finding the superior allele of japonica-type for increasing stem lodging resistance in indica rice varieties usingchromosome segment substitution lines. Rice 2018, 11, 25. [CrossRef]
51. Zhang, S.G.; Yang, Y.C.; Zhai, W.W.; Tong, Z.H.; Shen, T.L.; Li, Y.C.; Zhang, M.; Sigua, G.C.; Chen, J.Q.; Ding, F.J. Controlled-release nitrogen fertilizer improved lodging resistance and potassium and silicon uptake of direct-seeded rice. Crop Sci. 2019, 59,2733–2740. [CrossRef]

Agriculture 2021, 11, 834 16 of 16
52. Wei, H.H.; Meng, T.Y.; Li, X.Y.; Dai, Q.G.; Zhang, H.C.; Yin, X.Y. Sink-source relationship during rice grain filling is associatedwith grain nitrogen concentration. Field Crop. Res. 2018, 215, 23–38. [CrossRef]
53. Shi, W.J.; Xiao, G.; Struik, P.C.; Jagadish, K.S.V.; Yin, X.Y. Quantifying source-sink relationships of rice under high night-timetemperature combined with two nitrogen levels. Field Crop. Res. 2017, 202, 36–46. [CrossRef]
Copyright © 2022 FDOKUMEN