Identification of programmed cell death in situ via specific labeling of nuclear DNA fragmentation
9
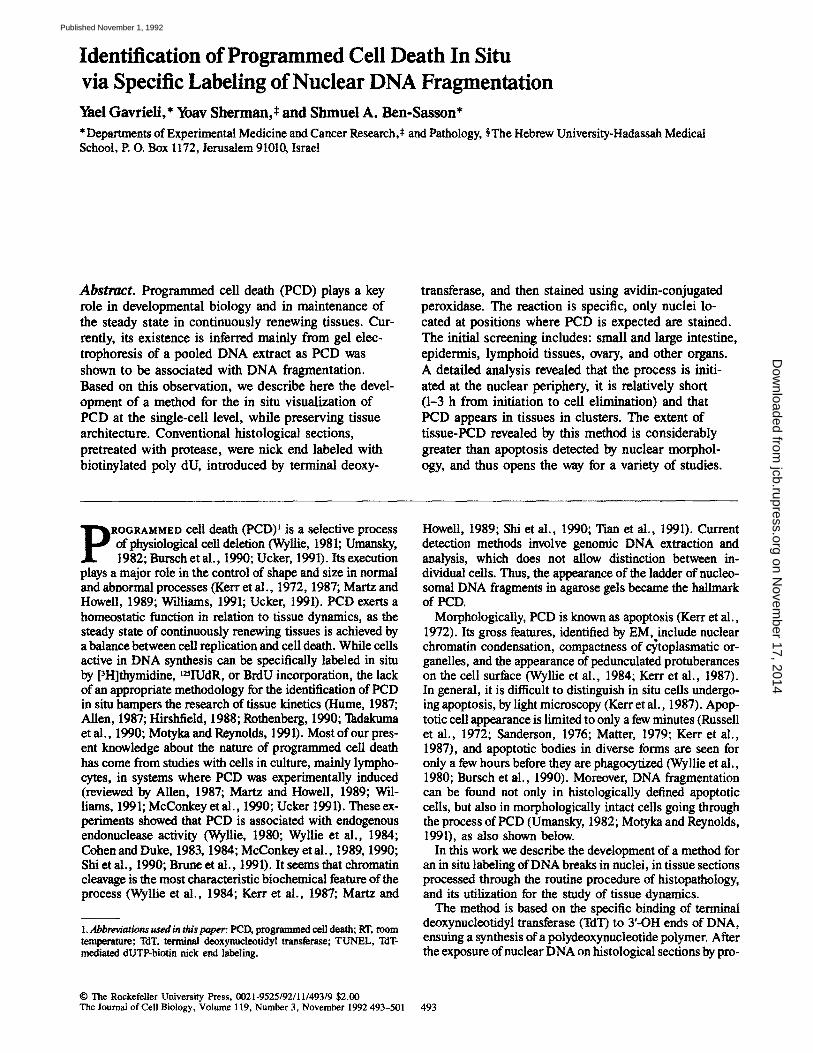
Identification of Programmed Cell Death In Situ via Specific Labeling of Nuclear DNA Fragmentation Yael Gavrieli,* Yoav Sherman,* and Shmuel A. Ben-Sasson* *Departments of Experimental Medicine and Cancer Research,* and Pathology, w The Hebrew University-Hadassah Medical School, P. O. Box 1172, Jerusalem 91010, Israel Abstract. Programmed cell death (PCD) plays a key role in developmental biology and in maintenance of the steady state in continuously renewing tissues. Cur- rently, its existence is inferred mainly from gel elec- trophoresis of a pooled DNA extract as PCD was shown to be associated with DNA fragmentation. Based on this observation, we describe here the devel- opment of a method for the in situ visualization of PCD at the single-cell level, while preserving tissue architecture. Conventional histological sections, pretreated with protease, were nick end labeled with biotinylated poly dU, introduced by terminal deoxy- transferase, and then stained using avidin-conjugated peroxidase. The reaction is specific, only nuclei lo- cated at positions where PCD is expected are stained. The initial screening includes: small and large intestine, epidermis, lymphoid tissues, ovary, and other organs. A detailed analysis revealed that the process is initi- ated at the nuclear periphery, it is relatively short (1-3 h from initiation to cell elimination) and that PCD appears in tissues in clusters. The extent of tissue-PCD revealed by this method is considerably greater than apoptosis detected by nuclear morphol- ogy, and thus opens the way for a variety of studies. p iaOGrtAMMEDcell death 0~D) 1 is a selective process of physiological cell deletion (Wyllie, 1981; Umansky, 1982; Bursch et al., 1990; Ucker, 1991). Its execution plays a major role in the control of shape and size in normal and abnormal processes (Kerr et al., 1972, 1987; Martz and Howell, 1989; Williams, 1991; Ucker, 1991). PCD exerts a homeostatic function in relation to tissue dynamics, as the steady state of continuously renewing tissues is achieved by a balance between cell replication and cell death. While cells active in DNA synthesis can be specifically labeled in situ by [3H]thymidine, mlUdR, or BrdU incorporation, the lack of an appropriate methodology for the identification of PCD in situ hampers the research of tissue kinetics (Flume, 1987; Allen, 1987; Hirshfield, 1988; Rothenberg, 1990; Tadakuma et al., 1990; Motyka and Reynolds, 1991). Most of our pres- ent knowledge about the nature of programmed cell death has come from studies with cells in culture, mainly lympho- cytes, in systems where PCD was experimentally induced (reviewed by Allen, 1987; Martz and Howell, 1989; Wil- liams, 1991; McConkey et al., 1990; Ucker 1991). These ex- periments showed that PCD is associated with endogenous endonuclease activity (Wyllie, 1980; Wyllie et al., 1984; Cohen and Duke, 1983, 1984; McConkey et al., 1989, 1990; Shi et al., 1990; Brune et al., 1991). It seems that chromatin cleavage is the most characteristic biochemical feature of the process (Wyllie et al., 1984; Kerr et al., 1987; Martz and t. Abbreviations used in th/s paper." POD, programmed cell death; RT, room temperature; TdT, terminal deoxynucleotidyl transferase; TUNEL, TdT- mediated dUTP-biotin nick end labeling. Howell, 1989; Shi et al., 1990; Tian et al., 1991). Current detection methods involve genomic DNA extraction and analysis, which does not allow distinction between in- dividual cells. Thus, the appearance of the ladder of nucleo- somal DNA fragments in agarose gels became the hallmark of PCD. Morphologically, PCD is known as apoptosis (Kerr et al., 1972). Its gross features, identified by EM, include nuclear chromatin condensation, compactness of cytoplasmatic or- ganelles, and the appearance of pedunculated protuberances on the cell surface (Wyllie et al., 1984; Kerr et al., 1987). In general, it is difficult to distinguish in situ cells undergo- ing apoptosis, by light microscopy (Kerr et al., 1987). APOp- totic cell appearance is limited to only a few minutes (Russell et al., 1972; Sanderson, 1976; Matter, 1979; Kerr et al., 1987), and apoptotic bodies in diverse forms are seen for only a few hours before they are phagocytized (Wyllie et al., 1980; Bursch et al., 1990). Moreover, DNA fragmentation can be found not only in histologically defined apoptotic cells, but also in morphologically intact cells going through the process of PCD (Umansky, 1982; Motyka and Reynolds, 1991), as also shown below. In this work we describe the development of a method for an in situ labeling of DNA breaks in nuclei, in tissue sections processed through the routine procedure of histopathology, and its utilization for the study of tissue dynamics. The method is based on the specific binding of terminal deoxynucleotidyl transferase (TdT) to T-OH ends of DNA, ensuing a synthesis of a polydeoxynucleotide polymer. After the exposure of nuclear DNA on histological sections by pro- 9 The Rockefeller University Press, 0021-9525/92/11/493/9 $2.00 The Journal of Cell Biology, Volume 119, Number 3, November 1992 493-501 493 on November 17, 2014 jcb.rupress.org Downloaded from Published November 1, 1992
-
Upload
independent -
Category
Documents
-
view
3 -
download
0
Transcript of Identification of programmed cell death in situ via specific labeling of nuclear DNA fragmentation
Identification of Programmed Cell Death In Situ via Specific Labeling of Nuclear DNA Fragmentation Yael Gavriel i ,* Yoav Sherman,* and Shmuel A. Ben-Sasson*
* Departments of Experimental Medicine and Cancer Research,* and Pathology, w The Hebrew University-Hadassah Medical School, P. O. Box 1172, Jerusalem 91010, Israel
Abstract. Programmed cell death (PCD) plays a key role in developmental biology and in maintenance of the steady state in continuously renewing tissues. Cur- rently, its existence is inferred mainly from gel elec- trophoresis of a pooled DNA extract as PCD was shown to be associated with DNA fragmentation. Based on this observation, we describe here the devel- opment of a method for the in situ visualization of PCD at the single-cell level, while preserving tissue architecture. Conventional histological sections, pretreated with protease, were nick end labeled with biotinylated poly dU, introduced by terminal deoxy-
transferase, and then stained using avidin-conjugated peroxidase. The reaction is specific, only nuclei lo- cated at positions where PCD is expected are stained. The initial screening includes: small and large intestine, epidermis, lymphoid tissues, ovary, and other organs. A detailed analysis revealed that the process is initi- ated at the nuclear periphery, it is relatively short (1-3 h from initiation to cell elimination) and that PCD appears in tissues in clusters. The extent of tissue-PCD revealed by this method is considerably greater than apoptosis detected by nuclear morphol- ogy, and thus opens the way for a variety of studies.
p iaOGrtAMMED cell death 0 ~ D ) 1 is a selective process of physiological cell deletion (Wyllie, 1981; Umansky, 1982; Bursch et al., 1990; Ucker, 1991). Its execution
plays a major role in the control of shape and size in normal and abnormal processes (Kerr et al., 1972, 1987; Martz and Howell, 1989; Williams, 1991; Ucker, 1991). PCD exerts a homeostatic function in relation to tissue dynamics, as the steady state of continuously renewing tissues is achieved by a balance between cell replication and cell death. While cells active in DNA synthesis can be specifically labeled in situ by [3H]thymidine, mlUdR, or BrdU incorporation, the lack of an appropriate methodology for the identification of PCD in situ hampers the research of tissue kinetics (Flume, 1987; Allen, 1987; Hirshfield, 1988; Rothenberg, 1990; Tadakuma et al., 1990; Motyka and Reynolds, 1991). Most of our pres- ent knowledge about the nature of programmed cell death has come from studies with cells in culture, mainly lympho- cytes, in systems where PCD was experimentally induced (reviewed by Allen, 1987; Martz and Howell, 1989; Wil- liams, 1991; McConkey et al., 1990; Ucker 1991). These ex- periments showed that PCD is associated with endogenous endonuclease activity (Wyllie, 1980; Wyllie et al., 1984; Cohen and Duke, 1983, 1984; McConkey et al., 1989, 1990; Shi et al., 1990; Brune et al., 1991). It seems that chromatin cleavage is the most characteristic biochemical feature of the process (Wyllie et al., 1984; Kerr et al., 1987; Martz and
t. Abbreviations used in th/s paper." POD, programmed cell death; RT, room temperature; TdT, terminal deoxynucleotidyl transferase; TUNEL, TdT- mediated dUTP-biotin nick end labeling.
Howell, 1989; Shi et al., 1990; Tian et al., 1991). Current detection methods involve genomic DNA extraction and analysis, which does not allow distinction between in- dividual cells. Thus, the appearance of the ladder of nucleo- somal DNA fragments in agarose gels became the hallmark of PCD.
Morphologically, PCD is known as apoptosis (Kerr et al., 1972). Its gross features, identified by EM, include nuclear chromatin condensation, compactness of cytoplasmatic or- ganelles, and the appearance of pedunculated protuberances on the cell surface (Wyllie et al., 1984; Kerr et al., 1987). In general, it is difficult to distinguish in situ cells undergo- ing apoptosis, by light microscopy (Kerr et al., 1987). APOp- totic cell appearance is limited to only a few minutes (Russell et al., 1972; Sanderson, 1976; Matter, 1979; Kerr et al., 1987), and apoptotic bodies in diverse forms are seen for only a few hours before they are phagocytized (Wyllie et al., 1980; Bursch et al., 1990). Moreover, DNA fragmentation can be found not only in histologically defined apoptotic cells, but also in morphologically intact cells going through the process of PCD (Umansky, 1982; Motyka and Reynolds, 1991), as also shown below.
In this work we describe the development of a method for an in situ labeling of DNA breaks in nuclei, in tissue sections processed through the routine procedure of histopathology, and its utilization for the study of tissue dynamics.
The method is based on the specific binding of terminal deoxynucleotidyl transferase (TdT) to T-OH ends of DNA, ensuing a synthesis of a polydeoxynucleotide polymer. After the exposure of nuclear DNA on histological sections by pro-
�9 The Rockefeller University Press, 0021-9525/92/11/493/9 $2.00 The Journal of Cell Biology, Volume 119, Number 3, November 1992 493-501 493
on Novem
ber 17, 2014jcb.rupress.org
Dow
nloaded from
Published November 1, 1992
teolytic treatment, TdT was used to incorporate biotinylated deoxyuridine at sites of DNA breaks. The signal was am- plified by avidin-peroxidase, enabling conventional histo- chemical identification by light microscopy.
The method of TdT-mediated dUTP-biotin nick end label- ing (TUNEL) was tested on a variety of tissues in which the migration of cells to their final destination is already delineated unequivocally or in tissues that are known for their active PCD. The results demonstrate that in many of these examples, where traditional criteria of apoptosis are missing, the topographical arrangement of nuclei labeled for DNA breaks by TUNEL is in perfect agreement with the ex- pected location of PCD. In addition to being a useful tool for the in situ identification of PCD, this method enables a quan- titation of the process in cell populations.
Materials and Methods
~ssue Preparation Tissue samples were fixed in 4% buffered formaldehyde, and embedded in paraffin. 4-6/~m paraffin sections were adhered to slides pretreated with 0.01% aqueous solution of poly-L-lysine (300,000 tool. wt.; Sigma Chemi- cal Co., St. Louis, MO). Deperaffinization was done by beating the sections for 10 rain at 70~ or 30 rain at 60~ Hydration was done by transferring the slides through the following solutions" twice to xylene bath for 5 rain, and then for 3 rain to 96% ethanol twice, 90% ethanol, 80% ethanol, and double distilled water (DDW). Fresh solvents are recommended as traces might interfere with the enzymatic reaction.
Thymocyte Preparation and Dexamethasone Treatment Male Sabra rats, 3-4-wk old (,~50 g), were sacrificed by decapitation. The thymus gland was removed, washed in PBS, and then placed in 4~ cold RPMI 1640 supplemented with 10% FCS, 2ram L-glutamine, 100 U/trd penicillin, and 0.1 mg/ml streptomycin. The thymus tissue was minced and the cells were separated by a metal pins comb. The cell suspension was filtered through 250-#m metal mesh and centrifuged for 4 rain at 400 g, at room temperature (RT). The supernatant was discarded, and the pellet was resuspended in 37~ RPMI 1640. Cell concentration was adjusted to 4 > 107 cells/ml. Dexamethasone was added to the cell culture to a final concentration of 1 ~M (from a 2 ram stock solution in ethanol, Sigma). Ceils were cultured in a humidified incubator under an atmosphere of 5 % CO2 in air, 37~ for 1.5, 3, 4.5, and 6 h. The control culture was in- cubated without dexamethasone for 6 h. 2-3 mi of the cell culture were processed for PCD staining and from the remaining of the culture (10-20 ml) the DNA was extracted.
Thymocyte Preparation for Cytology At the end of the incubation cells were centrifuged for 4 vain, 400 g, at RT. Most of the supernatant was discarded, and the pellet was resuspended in the remaining medium. 4% buffered formaldehyde was added to the suspen- sion brought to the original volume, and kept at RT. A drop of the cell sus- pension was put on slides precoated with 0.01% poly-L-lysine and air dried.
DNA Nick End Labeling of Tissue Sections Nuclei of tissue sections were stripped from proteins by incubation with 20 ~g/mi proteinase K (PK) (Sigma Chemical Co.) for 15 rain at RT, and the slides were then washed in DDW for 2 rain, four times. Endogenous peroxi- dase was inactivated by covering the sections with 2 % H202 for 5 rain at RT. The sections were rinsed with DDW, and immersed in TDT buffer (30 mM Trizma base, pH 7.2, 140 mM sodium cacodylate, 1 mM cobalt chlo- ride). TDT (0.3 e.u.//~l) and biotinylated dUTP in TDT buffer were then added to cover the sections, and then incubated in humid atmosphere at 37~ for 60 rain. The reaction was terminated by transferring the slides to TB buffer (300 mM sodium chloride, 30 mM sodium citrate) for 15 min at RT. The sections were rinsed with DDW, covered with 2% aqueous solu- tion of human serum albumin (HSA), or BSA for 10 rain at RT, rinsed in
DDW, and immersed in PBS for 5 rain. The sections were covered with Extra-avidin Peroxidase (BioMakor, Rehovot, Israel) diluted 1:10-1:20 in water, incubated for 30 rain, 37~ washed in DDW, immersed for 5 rain in PBS, and stained with AEC for about 30 min at 37~
DNA Nick End Labeling of Thymocytes (Cell Suspension) Slides with cell culture preparations were treated as tissue preparations, ex- cept the following: (a) No deparaffinization was needed; (b) the incubation with PK was omitted.
DNAase Treatment In Situ Sections were deparaflinated, processed through PK, and peroxidase inacti- vation as described. The sections were then pretreated with DN buffer (30 mM Trizma base, pH 7.2, 140 mM K cacodylate, 4 mM MgCI2, 0.1 mM IYFT). DNAase I (1 t~g/ml-100 ng/ml; Sigma Chemical Co.) dissolved in DN buffer was added to cover the section. After a 10-min incubation at RT, the slides were washed extensively with DDW, and continued to be processed through DNA nick end labeling.
DNA Extraction At the end of each incubation period, the thymocyte culture was centrifuged for 4 rain, 400 g. The pellet was resuspended in a lysis buffer (10 mM Tris- HCI, pH 8.0, 10 mM NaCl, I0 mM EDTA, 100/~g/mi PK, I% SDS), and incubated at 37~ till the mixture became clear. 100/~g/ml PK was added every few hours. The DNA was extracted by phenol/chloroform I:I (Chloroform-chloroform/isoamyl alcohol 24:1), method, precipitated over- night in -20~ ethanol containing 0.3 M final concentration NaAcetate, and centrifuged for 30 rain, 4~ at 12,000 g. The pellet was resuspended in TE buffer (0.1 M Tris-HCl, pH 8.0, I0 mM EDTA). The DNA was subse- quently treated with RNAase (I00/~g/mi) for I h at RT, incubated overnight with PK (I00 t~g/ml) at 37~ and finally reextracted with phenol, phe- nol/chloroform, chloroform, precipitated with ethanol, and resuspended as described above.
Agarose Gel Electrophoresis DNA samples, of'~0.2 #g each, were electrophoreticaUy separated on 1.8 % agarose gel containing ethidium bromide (0.4/~g/mi). DNA was visualized by a UV (302 nm) transilluminator and the gels were photographed with a polaroid camera.
Results
The feasibi~ty of PCD labeling in situ by the TUNEL method was first tested in the small intestine. The epithelium of this tissue has a high turnover rate. It is a simple columnar epithelium with a typical kinetics related to its unique ar- chitecture. Cells proliferate at the lower part of the crypt and migrate up the villus towards the lumen. As the cells move, they differentiate, senesce, and finally shed to the lumen (summarized by Wright and Alison, I984).
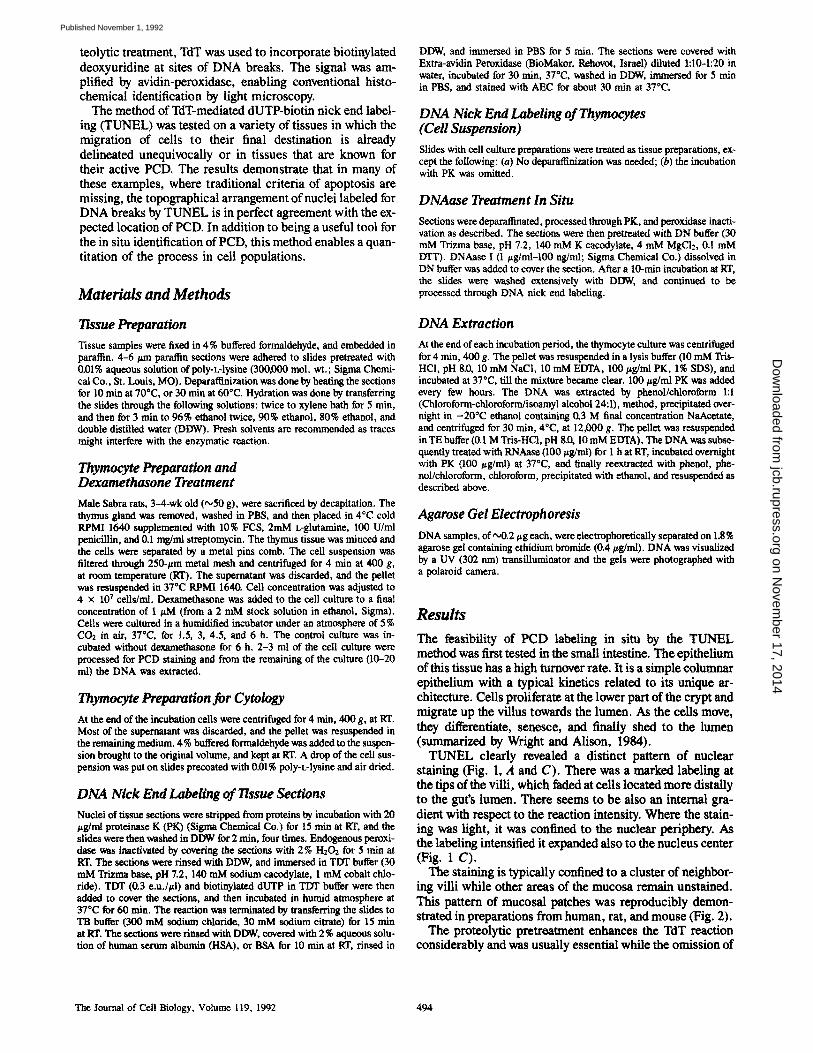
TUNEL clearly revealed a distinct pattern of nuclear staining (Fig. 1, A and C). There was a marked labeling at the tips of the villi, which faded at cells located more distally to the gut's lumen. There seems to be also an internal gra- dient with respect to the reaction intensity. Where the stain- ing was light, it was confined to the nuclear periphery. As the labeling intensified it expanded also to the nucleus center (Fig. 1 C).
The staining is typically confined to a cluster of neighbor- ing villi while other areas of the mucosa remain unstained. This pattern of mucosal patches was reproducibly demon- strated in preparations from human, rat, and mouse (Fig. 2).
The proteolytic pretreatment enhances the TdT reaction considerably and was usually essential while the omission of
The Journal of Cell Biology, Volume 119, 1992 494
on Novem
ber 17, 2014jcb.rupress.org
Dow
nloaded from
Published November 1, 1992
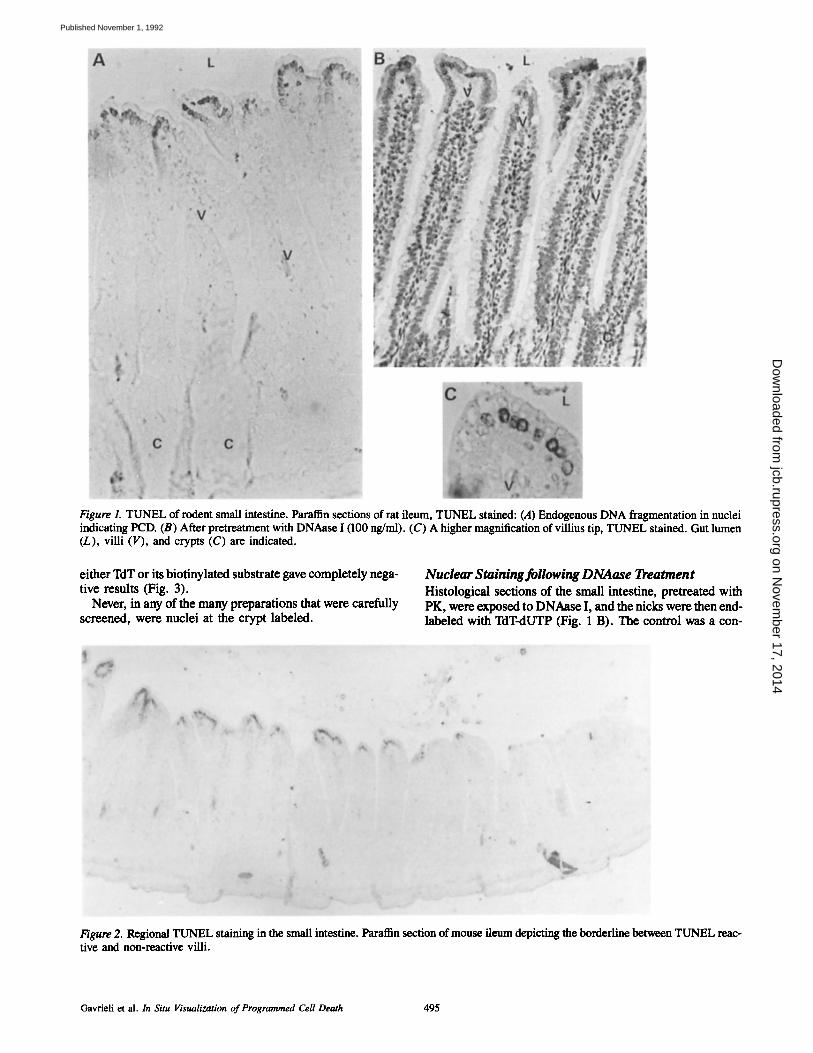
Figure 1. TUNEL of rodent small intestine. Paraffin sections of rat ileum, TUNEL stained: (A) Endogenous DNA fragmentation in nuclei indicating PCD. (B) After pretreatment with DNAase I (100 ng/ml). (C) A higher magnification of villius tip, TUNEL stained. Gut lumen (L), villi (V), and crypts (C) are indicated.
either TdT or its biotinylated substrate gave completely nega- tive results (Fig. 3).
Never, in any of the many preparations that were carefuUy screened, were nuclei at the crypt labeled.
Nuclear Staining following DNAase Treatment Histological sections of the small intestine, pretreated with PK, were exposed to DNAase I, and the nicks were then end- labeled with TdT-dUTP (Fig. 1 B). The control was a con-
Figure 2. Regional TUNEL staining in the small intestine. Paraffin section of mouse ileum depicting the borderline between TUNEL reac- tive and non-reactive villi.
Gavrieli et al. In Situ Visualization of Programmed Cell Death 495
on Novem
ber 17, 2014jcb.rupress.org
Dow
nloaded from
Published November 1, 1992
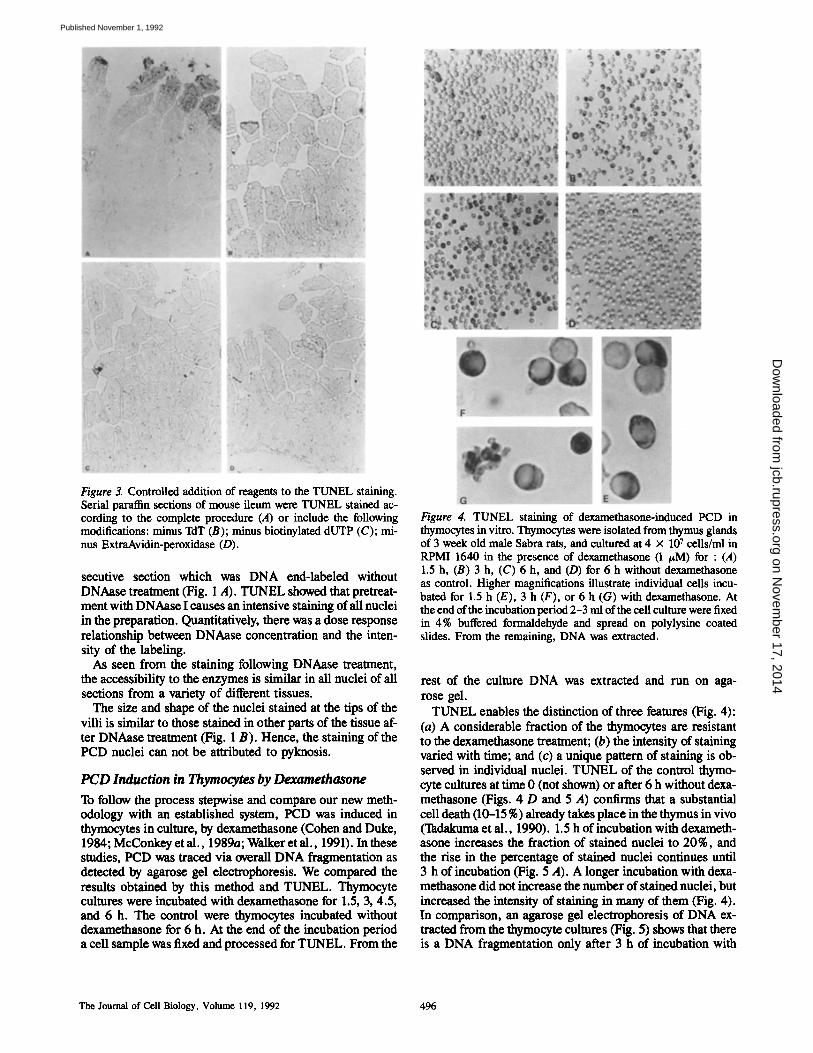
Figure 3. Controlled addition of reagents to the TUNEL staining. Serial paraffin sections of mouse ileum were TUNEL stained ac- cording to the complete procedure (A) or include the following modifications: minus TdT (B); minus biotinylated dUTP (C); mi- nus ExtraAvidin-peroxidase (D).
secutive section which was DNA end-labeled without DNAase treatment (Fig. 1 A). TUNEL showed that pretreat- ment with DNAase I causes an intensive staining ofail nuclei in the preparation. Quantitatively, there was a dose response relationship between DNAase concentration and the inten- sity of the labeling.
As seen from the staining following DNAase treatment, the accessibility to the enzymes is similar in all nuclei of all sections from a variety of different tissues.
The size and shape of the nuclei stained at the tips of the villi is similar to those stained in other parts of the tissue af- ter DNAase treatment (Fig. 1 B). Hence, the staining of the PCD nuclei can not be attributed to pyknosis.
PCD Induction in Thymocytes by Dexamethasone
To follow the process stepwise and compare our new meth- odology with an established system, PCD was induced in thymocytes in culture, by dexamethasone (Cohen and Duke, 1984; McConkey et al., 1989a; Walker et ai., 1991). In these studies, PCD was traced via overall DNA fragmentation as detected by agarose gel electrophoresis. We compared the results obtained by this method and TUNEL. Thymocyte cultures were incubated with dexamethasone for 1.5, 3, 4.5, and 6 h. The control were thymocytes incubated without dexamethasone for 6 h. At the end of the incubation period a cell sample was fixed and processed for TUNEL. From the
Figure 4. TUNEL staining of dexamethasone-induced PCD in thymocytes in vitro. Thymocytes were isolated from thymus glands of 3 week old male Sabra rats, and cultured at 4 x 10⁷ ceUs/ml in RPMI 1640 in the presence of dexamethasone (1 #M) for : (A) 1.5 h, (B) 3 h, (C) 6 h, and (D) for 6 h without dexamethasone as control. Higher magnifications illustrate individual cells incu- bated for 1.5 h (E), 3 h (F), or 6 h (G) with dexamethasone. At the end of the incubation period 2-3 ml of the cell culture were fixed in 4% buffered formaldehyde and spread on polylysine coated slides. From the remaining, DNA was extracted.
rest of the culture DNA was extracted and run on aga- rose gel.
TUNEL enables the distinction of three features (Fig. 4): (a) A considerable fraction of the thymocytes are resistant to the dexamethasone treatment; (b) the intensity of staining varied with time; and (c) a unique pattern of staining is ob- served in individual nuclei. TUNEL of the control thymo- cyte cultures at time 0 (not shown) or after 6 h without dexa- methasone (Figs. 4 D and 5 A) confirms that a substantial cell death (10-15 %) already takes place in the thymus in vivo (Tadakuma et al., 1990). 1.5 h of incubation with dexameth- asone increases the fraction of stained nuclei to 20%, and the rise in the percentage of stained nuclei continues until 3 h of incubation (Fig. 5 A). A longer incubation with dexa- methasone did not increase the number of stained nuclei, but increased the intensity of staining in many of them (Fig. 4). In comparison, an agarose gel electrophoresis of DNA ex- tracted from the thymocyte cultures (Fig. 5) shows that there is a DNA fragmentation only after 3 h of incubation with
The Journal of Cell Biology, Volume 119, 1992 496
on Novem
ber 17, 2014jcb.rupress.org
Dow
nloaded from
Published November 1, 1992
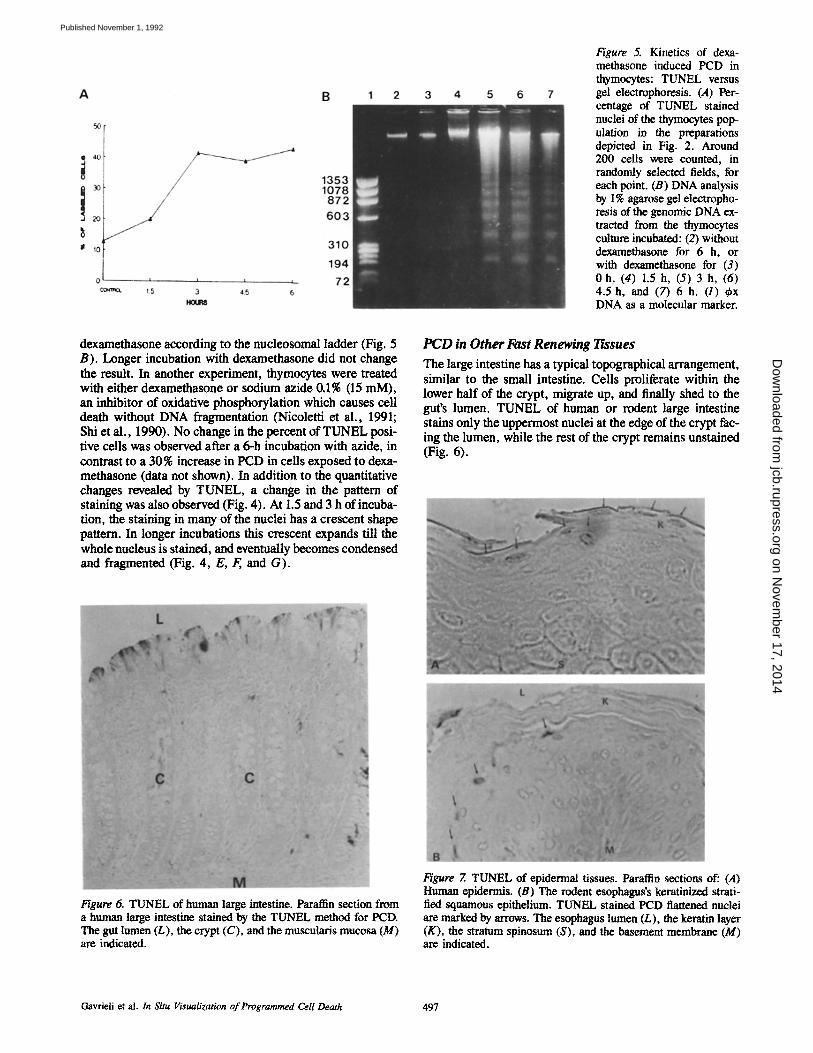
Figure 5. Kinetics of dexa- methasone induced PCD in thymocytes: TUNEL versus gel electmphoresis. (,4) Per- centage of TUNEL stained nuclei of the thymocytes pop- ulation in the preparations depicted in Fig. 2. Around 200 cells were counted, in randon~y selected fields, for each point. (B) DNA analysis by 1% agarose gel electropho- resis of the genomic DNA ex- tracted from the thymocytes culture incubated: (2) without dexamethasone for 6 h, or with dexamethasone for (3) 0 h, (4) 1.5 h, (5) 3 h, (6) 4.5 h, and (7) 6 h. (1) ~bx DNA as a molecular marker.
dexamethasone according to the nucleosomal ladder (Fig. 5 B). Longer incubation with dexamethasone did not change the result. In another experiment, thymocytes were treated with either dexamethasone or sodium azide 0.1% (15 mM), an inhibitor of oxidative phosphorylation which causes cell death without DNA fragmentation (Nicoletti et al., 1991; Shi et al., 1990). No change in the percent of TUNEL posi- tive cells was observed after a 6-h incubation with azide, in contrast to a 30% increase in PCD in cells exposed to dexa- methasone (data not shown). In addition to the quantitative changes revealed by TUNEL, a change in the pattern of staining was also observed (Fig. 4). At 1.5 and 3 h of incuba- tion, the staining in many of the nuclei has a crescent shape pattern. In longer incubations this crescent expands till the whole nucleus is stained, and eventually becomes condensed and fragmented (Fig. 4, E, F,, and G).
P C D in Other Fast Renewing 1~ssues
The large intestine has a typical topographical arrangement, similar to the small intestine. Cells proliferate within the lower half of the crypt, migrate up, and finally shed to the gut's lumen. TUNEL of human or rodent large intestine stains only the uppermost nuclei at the edge of the crypt fac- ing the lumen, while the rest of the crypt remains unstained (Fig. 6).
Figure 6. TUNEL of human large intestine. Paraffin section from a human large intestine stained by the TUNEL method for PCD. The gut lumen (L), the crypt (C), and the muscularis mucosa (M) are indicated.
Figure 7. TUNEL of epidermal tissues. Paraffin sections of: (A) Human epidermis. (B) The rodent esophagus's keratinized strati- fied squamous epithelium. TUNEL stained PCD flattened nuclei are marked by arrows. The esophagus lumen (L), the keratin layer (K), the stratum spinosum (S), and the basement membrane (M) are indicated.
Gavrieli et al. In Situ Visualization of Programmed Cell Death 497
on Novem
ber 17, 2014jcb.rupress.org
Dow
nloaded from
Published November 1, 1992
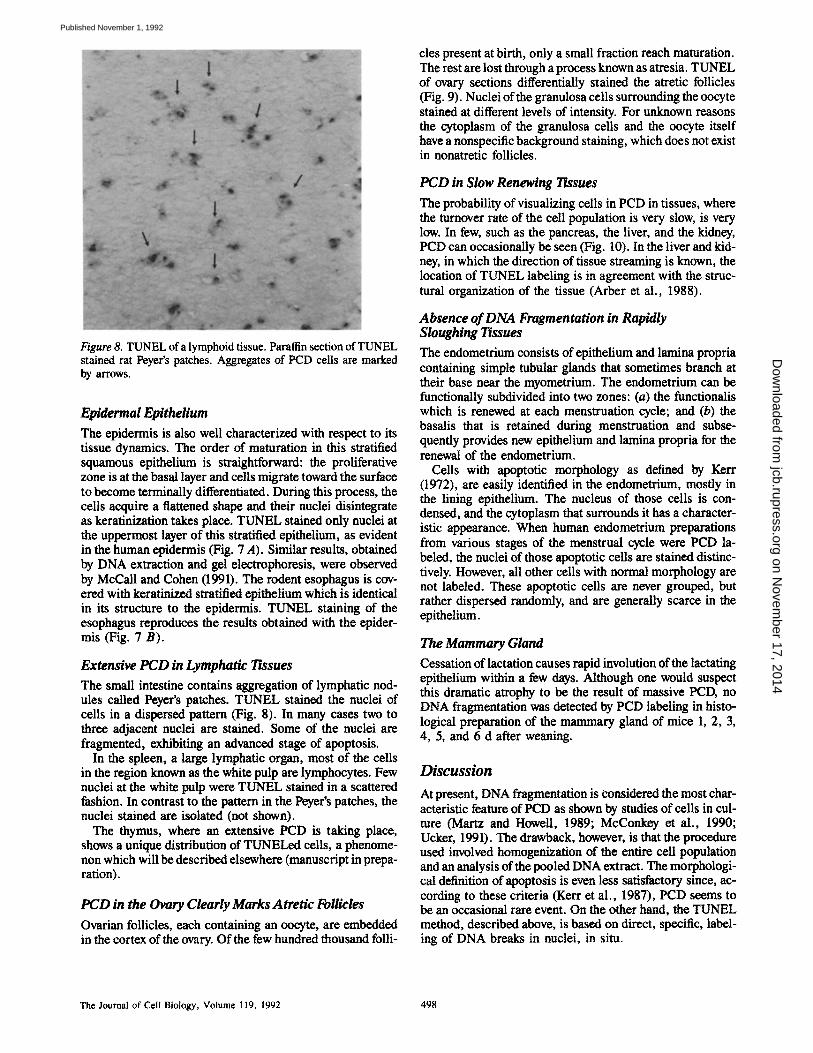
Figure 8. TUNEL of a lymphoid tissue. Paraffin section of TUNEL stained rat Peyer's patches. Aggregates of PCD cells are marked by arrows.
Epidermal Epithelium The epidermis is also well characterized with respect to its tissue dynamics. The order of maturation in this stratified squamous epithelium is straightforward: the proliferative zone is at the basal layer and cells migrate toward the surface to become terminally differentiated. During this process, the cells acquire a flattened shape and their nuclei disintegrate as keratinization takes place. TUNEL stained only nuclei at the uppermost layer of this stratified epithelium, as evident in the human epidermis (Fig. 7 A). Similar results, obtained by DNA extraction and gel electrophoresis, were observed by McCall and Cohen (1991). The rodent esophagus is cov- ered with keratinized stratified epithelium which is identical in its structure to the epidermis. TUNEL staining of the esophagus reproduces the results obtained with the epider- mis (Fig. 7 B).
Extensive PCD in Lymphatic Tissues The small intestine contains aggregation of lymphatic nod- ules called Peyer's patches. TUNEL stained the nuclei of cells in a dispersed pattern (Fig. 8). In many cases two to three adjacent nuclei are stained. Some of the nuclei are fragmented, exhibiting an advanced stage of apoptosis.
In the spleen, a large lymphatic organ, most of the cells in the region known as the white pulp are lymphocytes. Few nuclei at the white pulp were TUNEL stained in a scattered fashion. In contrast to the pattern in the Peyer's patches, the nuclei stained are isolated (not shown).
The thymus, where an extensive PCD is taking place, shows a unique distribution of TUNEI.~ cells, a phenome- non which will be described elsewhere (manuscript in prepa- ration).
PCD in the Ovary Clearly Marks Atretic Follicles Ovarian follicles, each containing an oocyte, are embedded in the cortex of the ovary. Of the few hundred thousand folli-
cles present at birth, only a small fraction reach maturation. The rest are lost through a process known as atresia. TUNEL of ovary sections differentially stained the atretic follicles (Fig. 9). Nuclei of the granulosa cells surrounding the oocyte stained at different levels of intensity. For unknown reasons the cytoplasm of the granulosa cells and the oocyte itself have a nonspecific background staining, which does not exist in nonatretic follicles.
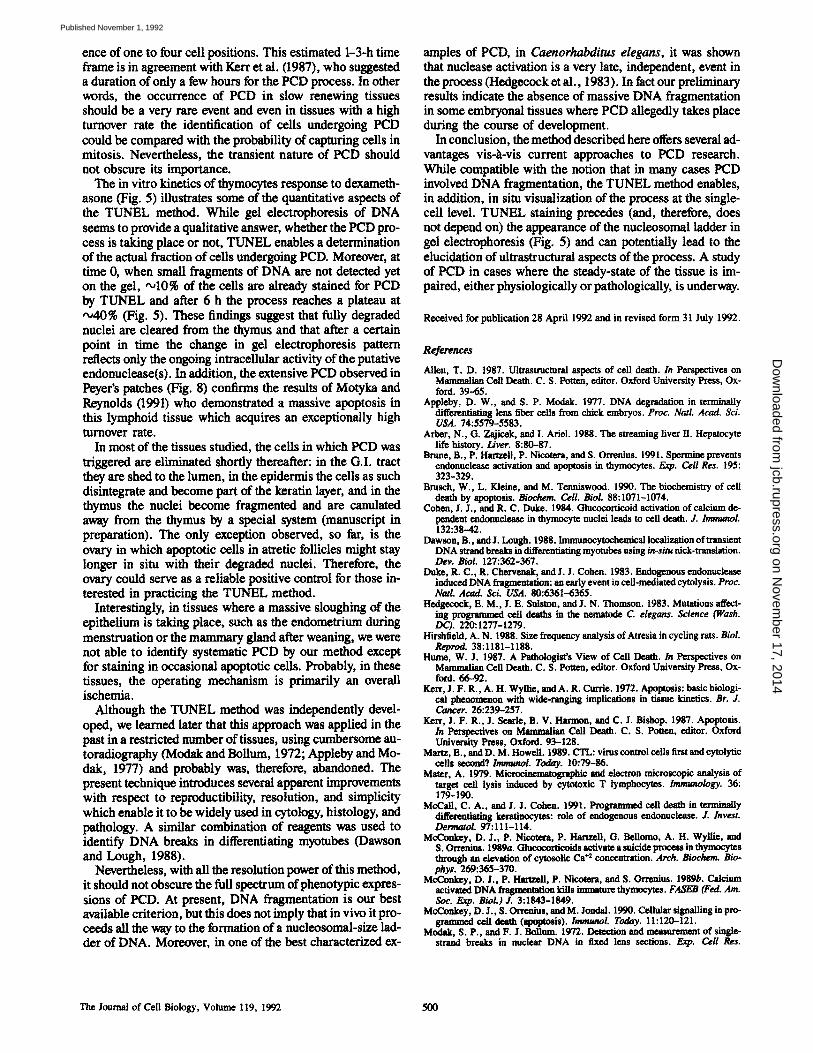
PCD in Slow Renewing Tissues The probability of visualizing cells in PCD in tissues, where the turnover rate of the cell population is very slow, is very low. In few, such as the pancreas, the liver, and the kidney, PCD can occasionally be seen (Fig. 10). In the liver and kid- ney, in which the direction of tissue streaming is known, the location of TUNEL labeling is in agreement with the struc- tural organization of the tissue (Arber et al., 1988).
Absence of DNA Fragmentation in Rapidly Sloughing Tissues The endometrium consists of epithelium and lamina propria containing simple tubular glands that sometimes branch at their base near the myometrium. The endometrium can be functionally subdivided into two zones: (a) the functionalis which is renewed at each menstruation cycle; and (b) the basalis that is retained during menstruation and subse- quently provides new epithelium and lamina propria for the renewal of the endometrium.
Cells with apoptotic morphology as defined by Kerr 0972), are easily identified in the endometrium, mostly in the lining epithelium. The nucleus of those cells is con- densed, and the cytoplasm that surrounds it has a character- istic appearance. When human endometrium preparations from various stages of the menstrual cycle were PCD la- beled, the nuclei of those apoptotic cells are stained distinc- tively. However, all other cells with normal morphology are not labeled. These apoptotic cells are never grouped, but rather dispersed randomly, and are generally scarce in the epithelium.
The Mammary Gland Cessation of lactation causes rapid involution of the lactating epithelium within a few days. Although one would suspect this dramatic atrophy to be the result of massive PCD, no DNA fragmentation was detected by PCD labeling in histo- logical preparation of the mammary gland of mice 1, 2, 3, 4, 5, and 6 d after weaning.
Discussion
At present, DNA fragmentation is Considered the most char- acteristic feature of PCD as shown by studies of cells in cul- ture (Martz and Howell, 1989; McConkey et al., 1990; Ucker, 1991). The drawback, however, is that the procedure used involved homogenization of the entire cell population and an analysis of the pooled DNA extract. The morphologi- cal definition of apoptosis is even less satisfactory since, ac- cording to these criteria (Kerr et al., 1987), PCD seems to be an occasional rare event. On the other hand, the TUNEL method, described above, is based on direct, specific, label- ing of DNA breaks in nuclei, in situ.
The Journal of Cell Biology, Volume 119, 1992 498
on Novem
ber 17, 2014jcb.rupress.org
Dow
nloaded from
Published November 1, 1992
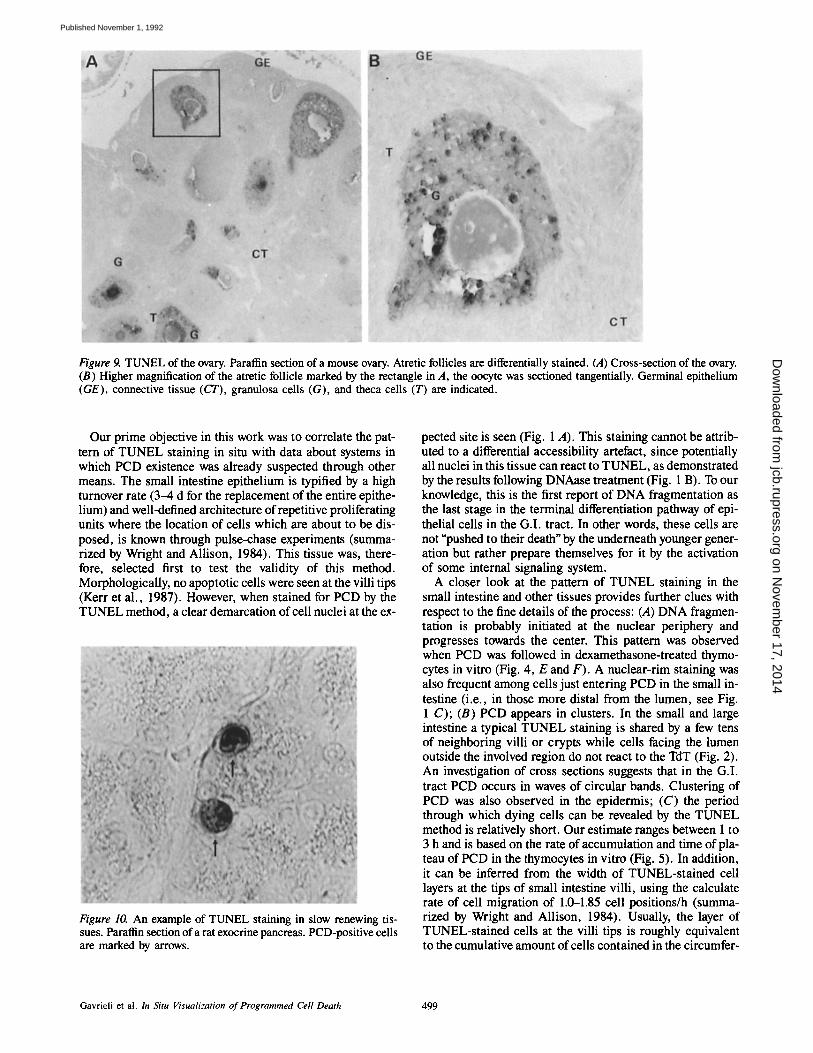
Figure 9. TUNEL of the ovary. Paraffin section of a mouse ovary. Atretic follicles are differentially stained. (A) Cross-section of the ovary. (B) Higher magnification of the atretic follicle marked by the rectangle in A, the oocyte was sectioned tangentially. Germinal epithelium (GE), connective tissue (CT), granulosa cells (G), and theca cells (T) are indicated.
Our prime objective in this work was to correlate the pat- tern of TUNEL staining in situ with data about systems in which PCD existence was already suspected through other means. The small intestine epithelium is typified by a high turnover rate (3--4 d for the replacement of the entire epithe- lium) and well-defined architecture of repetitive proliferating units where the location of cells which are about to be dis- posed, is known through pulse-chase experiments (summa- rized by Wright and Allison, 1984). This tissue was, there- fore, selected first to test the validity of this method. Morphologically, no apoptotic cells were seen at the villi tips (Kerr et al., 1987). However, when stained for PCD by the TUNEL method, a clear demarcation of cell nuclei at the ex-
Figure 10. An example of TUNEL staining in slow renewing tis- sues. Paraffin section of a rat exocrine pancreas. PCD-positive cells are marked by arrows.
pected site is seen (Fig. 1 A). This staining cannot be attrib- uted to a differential accessibility artefact, since potentially all nuclei in this tissue can react to TUNEL, as demonstrated by the results following DNAase treatment (Fig. 1 B). To our knowledge, this is the first report of DNA fragmentation as the last stage in the terminal differentiation pathway of epi- thelial cells in the G.I. tract. In other words, these cells are not "pushed to their death" by the underneath younger gener- ation but rather prepare themselves for it by the activation of some internal signaling system.
A closer look at the pattern of TUNEL staining in the small intestine and other tissues provides further clues with respect to the fine details of the process: (A) DNA fragmen- tation is probably initiated at the nuclear periphery and progresses towards the center. This pattern was observed when PCD was followed in dexamethasone-treated thymo- cytes in vitro (Fig. 4, E and F). A nuclear-rim staining was also frequent among cells just entering PCD in the small in- testine (i.e., in those more distal from the lumen, see Fig. 1 C); (B) PCD appears in clusters. In the small and large intestine a typical TUNEL staining is shared by a few tens of neighboring villi or crypts while cells facing the lumen outside the involved region do not react to the TdT (Fig. 2). An investigation of cross sections suggests that in the G.I. tract PCD occurs in waves of circular bands. Clustering of PCD was also observed in the epidermis; (C) the period through which dying cells can be revealed by the TUNEL method is relatively short. Our estimate ranges between 1 to 3 h and is based on the rate of accumulation and time of pla- teau of PCD in the thymocytes in vitro (Fig. 5). In addition, it can be inferred from the width of TUNEL-stained cell layers at the tips of small intestine villi, using the calculate rate of cell migration of 1.0-1.85 cell positions/h (summa- rized by Wright and Allison, 1984). Usually, the layer of TUNEL-stained cells at the villi tips is roughly equivalent to the cumulative amount of cells contained in the circumfer-
Gavrieli et al. In Situ Visualization of Prograramed Cell Death 499
on Novem
ber 17, 2014jcb.rupress.org
Dow
nloaded from
Published November 1, 1992
ence of one to four cell positions. This estimated 1-3-h time flame is in agreement with Kerr et al. (1987), who suggested a duration of only a few hours for the PCD process. In other words, the occurrence of PCD in slow renewing tissues should be a very rare event and even in tissues with a high turnover rate the identification of cells undergoing PCD could be compared with the probability of capturing ceils in mitosis. Nevertheless, the transient nature of PCD should not obscure its importance.
The in vitro kinetics of thymocytes response to dexameth- asone (Fig. 5) illustrates some of the quantitative aspects of the TUNEL method. While gel electrophoresis of DNA seems to provide a qualitative answer, whether the PCD pro- cess is taking place or not, TUNEL enables a determination of the actual fraction of cells undergoing PCD. Moreover, at time 0, when small fragments of DNA are not detected yet on the gel, -~10% of the ceils are already stained for PCD by TUNEL and after 6 h the process reaches a plateau at ,~40% (Fig. 5). These findings suggest that fully degraded nuclei are cleared from the thymus and that after a certain point in time the change in gel electrophoresis pattern reflects only the ongoing intracellular activity of the putative endonuclease(s). In addition, the extensive PCD observed in Peyer's patches (Fig. 8) confirms the results of Motyka and Reynolds (1991) who demonstrated a massive apoptosis in this lymphoid tissue which acquires an exceptionally high turnover rate.
In most of the tissues studied, the cells in which PCD was tr iggered are e l iminated shortly thereafter: in the G.I. tract they are shed to the lumen , in the epidermis the cells as such disintegrate and become part of the kerat in layer, and in the thymus the nuclei become f ragmented and are canulated away from the thymus by a special system (manuscr ipt in preparat ion) . The on ly exception observed, so far, is the ovary in which apoptotic ceils in atretic follicles might stay longer in situ with their degraded nuclei . Therefore, the ovary could serve as a re l iable posit ive control for those in- terested in pract icing the T U N E L method.
Interestingly, in t issues where a massive s loughing of the epi the l ium is taking place, such as the endomet r inm dur ing mens t rua t ion or the m a m m a r y g land after weaning, we were not able to identify systematic P C D by our method except for s ta ining in occasional apoptotic cells. Probably, in these tissues, the operat ing mechan i sm is p r imar i ly an overall ischemia. Although the TUNEL method was independently devel-
oped, we learned later that this approach was applied in the past in a restricted number of tissues, using cumbersome au- toradiography (Modak and Bollum, 1972; Appleby and Mo- dak, 1977) and probably was, therefore, abandoned. The present technique introduces several apparent improvements with respect to reproductibility, resolution, and simplicity which enable it to be widely used in cytology, histology, and pathology. A similar combination of reagents was used to identify D N A breaks in differentiating myotubes (Dawson and Lough, 1988).
Nevertheless, with aH the resolut ion power of this method, it should not obscure the full spec t rum of phenotypic expres- sions of PCD. At present , D N A fragmenta t ion is our best available cr i ter ion, but this does not imply that in vivo it pro- ceeds all the way to the format ion of a nucleosomal-s ize lad- der of DNA, Moreover, in one of the best character ized ex-
amples of PCD, in Caenorhabditus elegans, it was shown that nuclease activation is a very late, independent, event in the process (Hedge.cock et al., 1983). In fact our preliminary results indicate the absence of massive DNA fragmentation in some embryonal tissues where PCD allegedly takes place during the course of development,
In conclusion, the method described here offers several ad- vantages vis-a-vis current approaches to PCD research. While compatible with the notion that in many cases PCD involved DNA fragmentation, the TUNEL method enables, in addition, in situ visualization of the process at the single- cell level. TUNEL staining precedes (and, therefore, does not depend on) the appearance of the nucleosomal ladder in gel electrophoresis (Fig. 5) and can potentially lead to the elucidation of ultrastructural aspects of the process. A study of PCD in cases where the steady-state of the tissue is im- paired, either physiologically or pathologically, is underway.
Received for publication 28 April 1992 and in revised form 31 July 1992.
References
Allen, T. D. 1987. Ultrastructural asla~ts of cell death. In Perspectives on Mammalian Cell Death. C. S. Potten, editor. Oxford University Press, Ox- ford. 39-65.
Appleby, D. W., and S. P. Modak. 1977. DNA degradation in terminally differentiating lens fiber cells from chick embryos. Proc. Natl. Acad. SCi. USA. 74:5579-5583.
Arber, N., G. Zajicek, and I. Ariel. 1988. The streaming liver H. Hepatocyte life history. L/ver. 8:80-87.
Brahe, B., P. Harmfll, P. Nicotera, and S. Orrenlus. 1991. Spermine prevents endonuclease activation and apoptosis in thymocytes. Exp. Cell Res. 195: 323-329.
Brusch, W., L. Kleine, and M. Tenniswood. 1990. The biochemistry of cell death by apoptosis. Biochem. Cell. Biol. 88:1071-1074.
Cohen, J. J., and R. C. Duke. 1984. Glucocorticoid activation of calcium de- pendent endonuclease in thymocyte nuclei leads to cell death. J. Immunol. 132:38-42.
Dawson, B., and J. Longh. 1988. Immunocytochemical localization of transient DNA strand breaks in differentiating myotuhes using in-situ nick-translation. Dev. B/o/. 127:362-367.
Duke, R. C., R. Chervenak, and J. J. Cohen. 1983. Endogenous endonuclease induced DNA fragmentation: an early event in cell-mediated cytolysis. Proc. Natl. Acad. SCi. USA. 80:6361-6365.
Hedgecock, E. M., L E. Sulston, and J. N. Thomson. 1983. Mutations affect- ing pmgmnmied ce, ll deaths in the nematode C elegana. Science (Wash. DC). 220:1277-1279.
Hirshfleld, A. N. 1988. Size frequency analysis of Atresla in cycling rats. Biol. Reprod. 38:1181-1188.
Hun~, W. J. 1987. A Pathologist's View of Cell Death. In Perspectives on Mammalian Cell Death. C. S. Potten, editor. Oxford University Press, Ox- ford. 66-92.
Kerr, J, F. R., A. H. Wyllie, andA. R. CtLrrie. 1972. Apoptosis: basic biologi- cal phenomenon with wide-ranging implications in tissue kinetics. Br. J. Cancer. 26:239-257.
Kerr, J. F. R., J. Searle, B. V. Harmon, and C. J. Bishop. 1987. Apoptosis. In Perspectives on Mammalian Cell Death. C. S. Potten, editor. Oxford University Press, Oxford. 93-128.
Martz, E., and D. M. Howell. 1989. CTL: virus control cells first and cytolytic cells seomad? lreammo/. Today. 10:79-86.
Mater, A. 1979. M i c t ~ and electron microscopic analysis of target cell lysis induced by cTtotoxic T lymphocytes, lmmuno/ogy. 36: 179-190.
McCall, C. A., and J. J. Cohen. 1991. Programmed cell death in terminally differentiating keratinocytes: role of endogenous endonuclease. J. Infest. DermatoL 97:111-114.
McConkey, D. J., P. Nicotera, P. Hartzell, G. Bellomo, A. H. Wyllie, and S. Orrenius. 1989a. Glucocorticoids activate a suicide process in thymocyms through an elevation of cytosolic Ca +2 concentration. Arch. Biochem. B/o- phys. 269:365-370.
MeConkey, D. J., P. HertzeH, P. Nicotera, and S. Orrenius. 1989b. Calcium activated DNA fragmentation kills immature thymocytes. FASEB (Fed. Am. Soc. Exp. Biol.)J. 3:1843-1849.
McConkey, D. J., S. Orrenius, and M. Jondal. 1990. Cellular signalling in pro- grammed cell death (apopteais). lmmunol. Today. 11:120-121.
Modak, S. P., and F. J. Bollum. 1972. Detection and measurement of single- strand breaks in nuclear DNA in fixed lens sections. Exp. Cell Res.
The Journal of Cell Biology, Volume 119, 1992 500
on Novem
ber 17, 2014jcb.rupress.org
Dow
nloaded from
Published November 1, 1992
75:307-313. Motyka, B., and J. D. Reynolds. 1991. Apoptosis is associated with the exten-
sive B cell death in the sheep ileal Peyer's patch and the chicken bursa of Fabricius: a possible role in B cell selection. Fur. J. Immunol. 21: 1951-1958,
Nicoletti, I., G. Migliorati, M. C. Pagliacci, F. Grignani, and C. Riccardi. 1991. A rapid and simple method for measuring thymocyte apoptosis by propidium iodide staining and flow cytometry. J. lmmunol. Method. 139: 271-279.
Rothenberg, E. V. 1990. Death and transfiguration of cortical thymocytes: a reconsideration, lmmunol. Today. 11:116-119.
Russell, S. W., W. Rosenan, and J. C. Lee. 1972. Cytolysis induced by human lymphotoxin. Ann. J. Pathol. 69:103-118.
Sanderson, C. J. 1976. The mechanism ofT cell mediated cytotoxicity II. Mor- phological studies of cell death by time lapse microcinematography. Proc. Roy. Soc. LoncL B. 192:241-255.
Shi, Y., M. G. Szalay, L. Paskar, M. Boyer, B. Sigh, andD. R. Green. 1990. Activation-induced cell death in T cell hybridomas is due to apoptosis. J. lm- munol. 144:3326-3333.
Tadahuna, T., H. Kizaki, C. Odaka~ R. Kubota, Y. Ishimura, H. Yasita, and K. Okumura. 1990. CD4+CD8 + thymocytes are susceptible to DNA frag- mentation induced by phorbolester, calcium ionophore and anti-CD3 anti- body. Eur. J. Immunol. 20:779-784.
Tian, Q., M. Streuti, H. Saito, S. F. Schlossman, and P. Anderson. 1991. A
polyadenylate binding protein localized to the granules of cytolytic lympho- cytes induces DNA fragmentation in target cells. Cell. 67:629-639.
Ucker, P. S. 1991. Death by suicide: one way to go in mammalian cellular de- velopment? The New Biologist. 3:103-109.
Umansky, S. R. 1982. The genetic program of cell death. Hypothesis and some applications: transformation, carcinogenesis, ageing. J. Theor. Biol. 97:591- 602.
Walker, P. R., C. Smith, T. Yoodale, J. Leblanc, T. F. Whitfield, and M. Sikorska. 1991. Topoisomerase H-reactive chemotherapeutic Druss induce apoptosis in thymocytes. Cancer Res. 51:1078-1085.
Williams, G. T. 1991. Programmed cell death: apoptosis and oncogenesis. Cell. 65:1097-1098.
Wright, N., and M. Alison. 1984. The Biology of Epithelial Cell Populations. Clarendon Press, Oxford. 537-891 and 981-1004.
Wyllie, A. H. 1980. Glucocorticoid induced thymocytes apoptosis is associated with endogenous endonuclease activation. Nature (Lond.). 284:555-556.
Wyllie, A. H. 1981. Cell death: a new classification separating apoptosis from necrosis. In Cell Death in Biology and Pathology. I. D. Bowen and R. A. Lockshin, editors. Chapman and Hall, London. 9-34.
Wyllie, A. H., J. F. R. Kerr, and A. R. Currie. 1980. Cell death: the significance of apoptosis. Int. Re;,. Cytol. 68:251-306.
Wyllie, A. H., R. G. Morris, A. L. Smith, and D. Dunlop. 1984. Chromatin cleavage in apoptosis: association with condensed chromatin morphology and dependence on macromolecular synthesis. J. PathoL 142:67-77.
Gavrieli et al. In Situ Visualization of Programmed Cell Death 501
on Novem
ber 17, 2014jcb.rupress.org
Dow
nloaded from
Published November 1, 1992