Cooling dynamics in multi-fragmentation processes
13
Cooling Dynamics in Multi-fragmentation processes T.X. Liu, W.G. Lynch, M.J. van Goethem, X.D. Liu, R. Shomin, W.P. Tan, M.B. Tsang, G. Verde, A. Wagner 1 , H.F. Xi 2 , H.S. Xu 3 , National Superconducting Cyclotron Laboratory and Department of Physics and Astronomy, Michigan State University, East Lansing, MI 48824, USA, W. A Friedman, Department of Physics, University of Wisconsin, Madison, WI 53706, USA, S.R. Souza, R. Donangelo, Instituto de Fisica, Universidade Federal do Rio de Janeiro Cidade Universitária, CP 68528, 21945-970 Rio de Janeiro, Brazil L. Beaulieu, B. Davin, Y. Larochelle, T. Lefort, R. T. de Souza, R. Yanez, V. E. Viola, Department of Chemistry and IUCF, Indiana University, Bloomington, IN 47405, USA, R.J. Charity, and L.G. Sobotka, Department of Chemistry, Washington University, St. Louis, MO 63130, USA Abstract Fragment energy spectra of neutron deficient isotopes are significantly more energetic than those of neutron rich isotopes of the same element. This trend is well beyond what can be expected for the bulk multi-fragmentation of an equilibrated system. It can be explained, however, if some of these fragments are emitted earlier through the surface of the system while it is expanding and cooling. 1 Institut für Kern- und Hadronenphysik, Forschungszentrum Rossendorf, D-01314 Dresden, Germany. 2 Present address: Benton Associates, Toronto, Ontario, Canada. 3 Institute of Modern Physics, Lanzhou, China 1
-
Upload
independent -
Category
Documents
-
view
3 -
download
0
Transcript of Cooling dynamics in multi-fragmentation processes

Cooling Dynamics in Multi-fragmentation processes
T.X. Liu, W.G. Lynch, M.J. van Goethem, X.D. Liu, R. Shomin, W.P. Tan, M.B. Tsang,
G. Verde, A. Wagner1, H.F. Xi2, H.S. Xu3,
National Superconducting Cyclotron Laboratory and Department of Physics and Astronomy, Michigan State University, East Lansing, MI 48824, USA,
W. A Friedman,
Department of Physics, University of Wisconsin, Madison, WI 53706, USA,
S.R. Souza, R. Donangelo,
Instituto de Fisica, Universidade Federal do Rio de Janeiro
Cidade Universitária, CP 68528, 21945-970 Rio de Janeiro, Brazil
L. Beaulieu, B. Davin, Y. Larochelle, T. Lefort, R. T. de Souza, R. Yanez, V. E. Viola,
Department of Chemistry and IUCF, Indiana University, Bloomington, IN 47405, USA,
R.J. Charity, and L.G. Sobotka,
Department of Chemistry, Washington University, St. Louis, MO 63130, USA
Abstract
Fragment energy spectra of neutron deficient isotopes are significantly more energetic
than those of neutron rich isotopes of the same element. This trend is well beyond what
can be expected for the bulk multi-fragmentation of an equilibrated system. It can be
explained, however, if some of these fragments are emitted earlier through the surface of
the system while it is expanding and cooling.
1 Institut für Kern- und Hadronenphysik, Forschungszentrum Rossendorf, D-01314 Dresden, Germany. 2 Present address: Benton Associates, Toronto, Ontario, Canada. 3 Institute of Modern Physics, Lanzhou, China
1

The yields of particles emitted in intermediate energy [1,2], relativistic [3,4] and
ultra-relativistic [5] nuclear collisions have been successfully compared to equilibrium
statistical ensembles. This suggests the attainment of chemical equilibrium in such
collisions, motivating investigations [6-8] of phase transitions in strongly interacting
matter in systems where stationary thermodynamic equilibrium may not be achieved.
Such interpretations assume that the relevant degrees of freedom have time to equilibrate,
and that the observables being described reflect that equilibrium.
As in the case of the early universe, observables probing such degrees of freedom in
nuclear collisions may reflect a freezeout time when they cease to evolve. The yields of
particles emitted per central heavy ion collision have been described successfully, for
example, by equilibrium calculations for an expanding nuclear system at a freezeout
density of ρ≈1/6ρ0-1/3ρ0 [1,4,7]. Careful examinations of freezeout observables may
reveal non-thermal details of the freezeout configuration. In the case of nuclear systems,
such examinations can identify particles that escape through the surface of the system
before it undergoes bulk disassembly and most of its chemical observables freeze out. In
this paper, we show how the energy spectra of isotopically resolved fragments can allow
one to quantify such effects and assess the accuracy of a global freezeout approximation.
The expected properties for the energy spectra of fragments from the disassembly of
thermalized freezeout configuration are straightforward. Because nuclear interactions
between particles are assumed to be negligible after freezeout, the observed mean kinetic
energies of particles kE reflect the thermal kinetic energy , the collective
velocity at freezeout and the energy < > gained due to the accelerations of these
particles by the Coulomb field of the remaining system [9-11]:
T2/3
collv CoulE
CoulcollNk EvAmTE ++≈ 2
21
23 , (1)
where AmN is the mass of the fragment with A nucleons and mN is the nucleon mass. As
the Coulomb energy depends nearly linearly on the fragment charge and for light
fragments, Z≈A/2, Eq. 1 suggests a roughly monotonic dependence of kE upon A; this
2

has been used previously to extract values for the collective expansion velocity after
constraining < > with assumptions about the breakup density [9-11].
collv
CoulE
CoulEBecause depends on Z while the collective motion term depends on A, one
might minimize sensitivity to Coulomb effects and isolate the collective motion term by
comparing the mean energies of isotopes of each element. However, such studies,
performed previously for light charge particles Z≤2, observed mean energies for 3He that
are higher than those for 4He, contrary to Eq. 1 [12,13]. These observations could be
reproduced by assuming some emission of 3He particles through the surface of the
emitting source prior to a thermalized bulk disintegration and freezeout [12,13]. Since
early emission of light charged particles via dynamical mechanisms can be expected on
general grounds, such observations provide little guidance to the emission mechanisms of
heavier fragments. To probe such issues, one should measure isotopically resolved
energy spectra for fragments heavier than He.
In our experiment, 112Sn beams produced from the K1200 Cyclotron at the National
Superconducting Cyclotron Laboratory at Michigan State University bombarded a 112Sn
target of 5 mg/cm2 areal density. Nine telescopes of the Large Area Silicon Strip Array
(LASSA) [14] detected isotopically resolved particles with 1≤Z≤10. Each telescope
consists of one 65 µm single-sided silicon strip detector, one 500 µm double-sided silicon
strip detector and four 6-cm thick CsI(Tl) scintillators. The calibration of these telescopes
to an accuracy of better than 3% was achieved using alpha sources, elastic scattering and
direct fragmentation beams [15].
The center of the LASSA device was located at a polar angle of θ=32° with respect
to the beam axis, covering laboratory polar angles of 7°≤ θ ≤ 58° with an angular
resolution of about ±0.43°. The multiplicity of charged particles [14] measured with
LASSA and the 188 plastic scintillator - CsI(Tl) phoswich detectors of the
Miniball/Miniwall array [16] provided impact parameter selection. In the analyses
described below, central collisions, corresponding to a reduced impact parameter of
b/bmax ≤ 0.2 [15] (bmax ≈7.3 fm) were selected by a gate on the top 4% of the charged-
particle multiplicity distribution. Such central events display many attributes consistent
3

with bulk multifragmentation following expansion and spinodal decomposition at
densities of ρ≤1/3ρ0 [1,9,18].
Center of mass energy spectra for 2 ≤Z≤8 were obtained by averaging over center of
mass angles of 70° ≤θCM ≤110°. At these angles, the coverage of the LASSA array is
excellent, with losses only for fragments emitted at very low energies E/A< 0.2 MeV in
the center of mass, corresponding to small laboratory angles of θlab ≤7°. The data
presented below have been corrected for these efficiency losses and for multiple hits in
the detector telescopes.
In Fig. 1, we show the energy spectra for 11C (open circles) and 12C (closed circles).
The yield of 12C yield is nearly a factor of 10 higher than that for 11C reflecting its higher
binding energy. The peak in the energy spectrum occurs at higher energies for 11C than
for 12C and is broader. These two factors dictate a higher mean energy for 11C than for 12C.
In the left panel of Fig. 2, the measured mean energies are plotted as a function of the
mass number A using the same symbol for isotopes of the same element. The even Z
(Z=2, 4, 6, 8) elements are represented by closed symbols and the odd Z (Z=1, 3, 5, 7)
elements by the open symbols. Generally, CME increases with A; however, the lightest
isotopes in each element (3He, 6Li, 7Be, 10B, 11C, 13N) display a significantly larger mean
energies than the neutron rich isotopes. (The measured mean energy of the neutron
deficient oxygen isotope, 15O, is very uncertain due to insufficient statistics and is not
plotted.) This striking trend is contrary to that expected for fragment emission from a
single equilibrated source and described by Eq. 1.
Because sequential decay reduces the mass of the excited fragments produced at
breakup, the trend for an equilibrated system can differ from Eq. 1. To quantify such
effects, we modeled equilibrium breakup configurations composed of excited fragments
and light particles with the improved Statistical Multi-fragmentation Model (ISMM) of
ref. [19] and calculated the subsequent decay of the excited fragments with a Monte-
Carlo Weisskopf model [20]. In these calculations, we assumed an initial source with
A0=168, Z0=75 and E*/A = 6 MeV (roughly 75% of the total mass, charge and energy of
4

the combined projectile and target [21]). We assigned randomly an initial thermal
velocity to each fragment and light particle according to a Boltzmann distribution
characterized by a breakup temperature of T= 5.24 MeV [19] and positioned each particle
or fragment randomly within a volume of 8.3 fm. We added a collective velocity
max,collvRrvcoll
vv = to the thermal velocity, solved the classical equations of motion these
particles interacting via Coulomb forces, and varied ( ) Ncollcoll mAEv //2max, ⋅= (i.e.
) to describe the mass dependence of the experimental mean energies. AEcoll /
The optimal choice of collective velocity depends on details of the placement of
fragments within the volume. If one excludes initial configurations with any part of any
fragment outside R, the accepted configurations fragments will be more concentrated in
the interior than if one excludes only the configurations with the center of mass of any
fragment outside R. The fragments in the former case experience larger Coulomb forces
on average than in the latter case; thus, the collective energy per nucleon needed to
reproduce the <Ek> data, 0/ ≈AEcoll , is less than that for the latter case,
. MeV 2/ ≈AEcoll
As a typical example, we show the predicted 11C and 12C spectra (normalized to the
data) for the latter calculation in Fig. 1 as the solid histograms. The calculation
reproduces the peak of the 12C spectrum better than the peak of the 11C spectrum; neither
the 11C nor the 12C calculation reproduces the high-energy tails of the corresponding
experimental spectrum. The right panel in Fig. 2 shows the corresponding predicted mean
energies. Slightly reduced values for kE are calculated for symmetric N=Z fragments;
these reductions reflect strong secondary decay contributions to the yields of N=Z nuclei
from the secondary decay of heavier particle unbound nuclei that have somewhat smaller
initial velocities. The strength of these secondary decay contributions reflect the Q-value
for secondary decay, which favors decays to well bound N=Z nuclei and suppresses
decays to their N<Z neighbors. Thus, the calculation predicts slightly larger values
of kE for N<Z nuclei than for N=Z nuclei, but the calculated change in kE is much
smaller than that observed experimentally. We therefore conclude that the enhancement
5

in the measured kE for the N<Z fragments cannot be attributed to secondary decay.
Changing the assumptions about the spatial distribution of fragments or the collective
velocity at breakup does not change this conclusion.
3.0≤
0 ρ>
This failure and the aforementioned evidence for surface emission of helium isotopes
suggest that fragments may also be emitted through the surfaces of the system while it is
expanding and cooling. Because the binding energies of the neutron deficient isotopes are
significantly less than those of their neutron rich neighbors, their surface emission rates
will decrease relative to their neutron rich neighbors as the system cools. The Expanding
Emitting Source (EES) model [22] provides means to test this scenario because it
provides a self-consistent calculation of emission rates for each isotope from a
thermalized system while it is cooling and expanding.
To illustrate these ideas, we have performed an EES calculation, which assumes that
particles can be radiated from the surface of the expanding system prior to bulk
disintegration and during bulk disintegration itself. Unlike equilibrium models, which
assume the system to have already expanded, this time dependent model calculates the
expansion and emission of the system beginning at an earlier time as it expands through
saturation density. For 04.0 ρρ ≥
0
, the model specifically assumes surface emission bulk
emission for ρρ and a gradual transition from surface to the bulk emission for
densities, 0 03.04. ρρ > . For our EES calculations, we take saturation density,
E*/A=9.5 MeV, AO=224 and ZO=100 as the specific starting conditions.
As one example of the EES model results, we show the time evolution of 11C and 12C
yields. At the time of emission, the primary fragment of each isotope acquires an average
kinetic energy dictated by the instantaneous Coulomb barrier, expansion velocity and
temperature of the expanding system. (The early surface emission contributions increase
the value of the Coulomb and collective contributions above those obtained from the bulk
emission alone.) Taking this time dependence into account, we plot the kE values for 11C (dashed line) and 12C (solid line) as a function of the time of emission in the left panel
of Fig.3. Over the evolution of the source the carbon isotopes are emitted with a range of
6

kinetic energies but there is very little difference between the values for the two carbon
isotopes at any given time.
We next examine the emission rates as a function of time for the two isotopes. This
is shown in the lower right panel of Fig. 3 where the instantaneous rates for each isotope
are plotted and in the upper right panel of Fig. 3 where the ratio of the rates is plotted.
Here we find that the rate for the emission of 11C relative to that of 12C changes
drastically with time. The emission of the former is enhanced at earlier times and the
latter at later times. Within the EES model, the rates are determined primarily by three
factors: the spin degeneracy factors of each channel, free energy,
exp((Nf*n(T)+Zf*p(T))/T), and binding energy, exp(-Q/T). Here, f*n(p) (T) are the excited
free energy per neutron (proton) of the source, and Q is the Q-value associated with the
emission. The degeneracy factors favor 11C. The values for f* are negative and hence the
isotope with fewer nucleons is also favored by this factor. The magnitude of f*, however,
goes to zero like T2 so the relative advantage for 11C arising from this factor deceases as
the temperature goes down. The Q values are greatly influenced by the respective
binding energy factor, which strongly favors the N=Z isotopes; this preference
strengthens at reduced temperature. The net effect is that the preference for the 11C at the
highest temperatures shifts to 12C as the temperature falls with the emission and
expansion. We tested whether the binding energy is the dominant consideration by
forcing the binding energies for 11C and 12C to be equal. In this test calculation, the
relative emission rates for the two isotopes changed little with time.
In the EES model, 11C is preferentially emitted earlier than 12C, and the shapes of the
energy spectra are consequently not the same. In Fig. 1, we show the calculated energy
spectra for 11C and 12C (dashed lines) by taking integrating the spectra for emission from
the time evolving source over time. The EES model correctly predicts the energy
spectrum for 11C will be shifted to higher energies than that for 12C, and describes the
higher energy tails of the spectra better than do the SMM calculations; nonetheless the
slope of the spectra for both isotopes is still somewhat underpredicted. We note that it is
necessary to multiply the EES model predictions for both 11C and 12C by a factor of 0.3 to
match them to the data. We attribute this reduction to the fact that the emission of
elements with Z>10 are not considered in these EES model calculations.
7

The total yield of 12C contains contributions from the neutron decay of excited 13C
and the α decay of excited 16O. The yields of 11C are not affected significantly by
sequential decays. Integrating over the energy spectra, we find an average kinetic energy
of about 56.7 MeV for 11C and 45.2 MeV for 12C. The difference of about 11 MeV is in
qualitative agreement with the data. The calculation predicts a larger fraction (≈23%) of
the 11C fragments, a smaller fraction (≈7%) of the 12C fragments and an even smaller
(<6%) of the heavier (A>12) carbon isotopes are emitted from the surface before the
central density of the system expands below 0.4 ρ0 where bulk disintegration occurs. By
such low densities, the system has cooled to temperatures, T≤6 MeV, and it continues
cooling to lower temperatures where the emission of the poorly bound neutron deficient 11C is relatively suppressed. This same scenario applies to the other elements, each of
which shows similar patterns for relative emission. We show the EES calculations for the
mean energies of all isotopes in the middle panel of Fig. 2. The EES model reproduces
the basic trends of the data well.
In addition to these results, other considerations support the hypothesis of an early
surface emission of fragments prior to the bulk disassembly of the expanded system. For
lower incident energies, surface evaporation and fission are the basic decay modes of
equilibrated compound nuclei, and for energies similar to the present study, transport
theory predicts an abundant early emission of nucleons and clusters through the surface
of expanding systems. The preequilibrium emission of fragments have been previously
reported in proton induced reactions [23], and similar isotopic effects were observed.
Here we have shown how to extract the significance of such effects for
multifragmentation processes that have been widely interpreted as equilibrium bulk
disintegration. Our results are qualitatively consistent with conclusion regarding the
importance of surface fragment emission deduced previously from fragment-fragment
correlation data [24]. They point one direction towards obtaining more comprehensive
time dependent pictures of how fragmentation proceeds during the expansion of excited
system.
In summary, we have shown that the measured energy spectra of the IMF isotopes
produced in multifragmentation reveal the dynamics of the emission process. The more
8

energetic neutron deficient isotopes are consistent with the picture that they are emitted
earlier and more abundantly from the surface of the system while the source is expanding
and cooling.
This work is supported by the National Science Foundation under Grant
Nos. INT-0228058, PHY-01-10253, PHY-00-70818, PHY-00-70161 and by the DOE
under grant numbers DE-FG02-87ER-40316 and by CNPq, Brazil under the
contract No. 41.96.0886.00 of MCT/FINEP/CNPq (PRONEX).
REFERENCES
1. M. D'Agostino et al., Phys. Lett. B371, 175 (1996). 2. B. Borderie et al., Phys. Lett. B388, 224 (1996). 3. G.D. Westfall et al., Phys. Rev. Lett. 37, 1202 (1977). 4. B.-A. Li et al., Phys. Lett. B303, 225 (1993). 5. P. Braun-Munzinger, I. Heppe and J. Stachel, Phys. Lett. B, 465, 15 (1999). 6. P. Braun-Munzinger, J. Stachel, and C. Wetterich, Phys. Lett. B 596, 61 (2004). 7. J.P. Bondorf et al., Phys. Rep. 257, 133 (1995). 8. V. E. Viola, Nucl. Phys. A 734, 487 (2004). 9. N. Marie et al., Phys. Lett. B391, 15 (1997). 10. S.C. Jeong et al., Phys. Rev. Lett. 72, 3468 (1994) 11. W.-c. Hsi et al., Phys. Rev. Lett. 73, 3367 (1994). 12. H. Xi et al., Phys. Rev. C 67, R462 (1998). 13. V. E. Viola, K. Kwiatkowski, and W. A. Friedman, Phys. Rev. C 59, 2660-2669
(1999). 14. B. Davin et al., Nucl. Instr. Meth. Phys. Res. A 473, 302 (2001). 15. A. Wagner et al., Nucl. Instr. Meth. Phys. Res. A 456, 290 (2001). 16. R.T. de Souza et al., Nucl. Inst. Meth. Phys. Res. A 295, 109 (1990). 17. L. Phair et al., Nucl. Phys. A548, 489 (1992). 18. J.D. Frankland et al., Nucl. Phys. A 689, 940 (2001). 19. W. P. Tan et al., Phys. Rev. C 68, 034609 (2003). 20. V. Weisskopf, Phys. Rev. 52, 295 (1937). 21. These values are consistent estimated that take cooling by preequilibrium
emission and expansion prior to breakup into account, e.g.. P. Desesquelles et al., Nucl. Phys. A 633, 547 (1998) for example.
22. W.A. Friedman, Phys. Rev. C42, 667 (1990). 23. E. Renshaw et al., Phys. Rev. C 44, 2618 (1991). 24. E. Cornell et al., Phys. Rev. Lett. 75, 1475 (1995); Phys. Rev. Lett. 77, 4508
(1996).
9

FIGURE CAPTIONS: Figure 1: The solid and open points represent the measured center of mass energy spectra for 12C and 11C fragments, respectively. The solid lines represent the corresponding ISMM calculations. The dashed lines represent the corresponding EES model calculations. Figure 2: Left panel: experimental fragment mean kinetic energies. Middle panel: mean kinetic energies calculated with the EES model. Right panel: mean kinetic energies calculated with the ISSM model. Figure 3: Left panel: Mean center of mass kinetic energies for 12C (11C) calculated as a function of time with the EES model. Lower right panel: Emission rates for 12C (11C) calculated as a function of time with the EES model. Upper right panel: Ratio of the emission rate for 11C divided by the emission rate for 12C calculated with the EES model
10
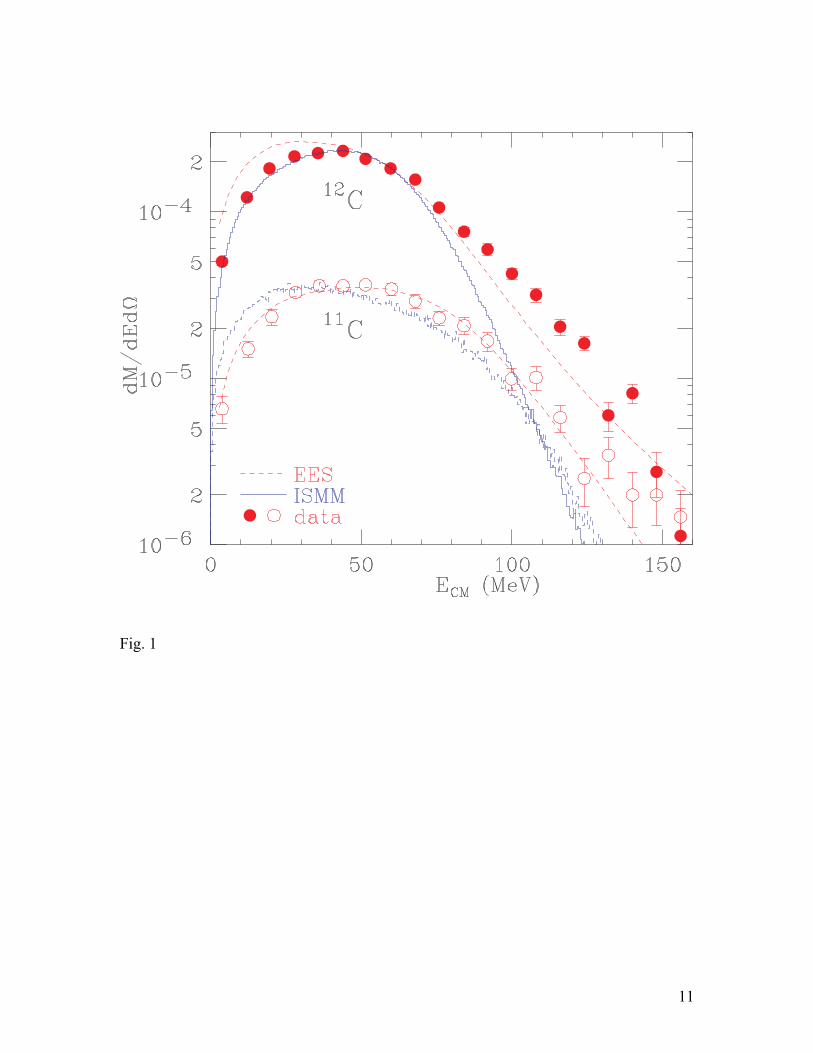
Fig. 1
11

Fig. 2
12

Fig. 3
13