Reversible addition fragmentation chain transfer polymerization - RAFT
Upload
khangminh22Category
view
1download
0
2(o'å.q1
FRAGMENTATION OF RARE GAS DIMERS
By
Timothy fames Irf Koy,B.SC. (Hons)
A thesis presented for the degree of
DOCTOR OF'PHILOSOPHY
in the department of
PHYSICS AND MATHEMATICAL PHYSICS
at the
UNIVERSITY OF' ADELAIDE
L996

Contents
Abstract
Statement
Acknowledgments
1 Introductory Remarks
1. 1 Introduction ........
1.2 Cluster Classification
1.3 Historical Perspective .......
1.3.1 Supersonic Molecular Beams
1.3.2 Cluster Mass Spectra
1.3.3 Cluster Growth
1.3.4 Evidence for Fragmentation
1.3.5 Cluster Ion Stability
1.4 Application of Cluster Research
1.5 Project Aim
2 Brief Review of Background Information
2.1 Introduction
2.2 Molecular Beam Theory
2.2.1 Continuum Expansion
2.2.2 Trunsition to Free Molecular Flow
2.3 Cluster Generation
2.3.1 Empirical Scaling Laws
2.3.2 Kinetics of Dimer Growth
2.3.2 Cfuster Ion Dependence on Source Parameters
2.4 Ionisation and Detection
2.4.I Electron Impact Ionisation
2.4.2 Approaches to Ion Extraction
2.4.3 Comments on Fragmentation
2.4.4 Detection of Metastable Ions
vi
vü
vüi
1
1
1
J
J
4
5
6
9
I7
20
22
22
23
23
28
31
31
35
38
42
42
50
51
52
54
11
2.5 Conclusion

3 Description of the Molecular Beam Apparatus
3.1 Introduction
3.2 Molecular Beam Chamber ....
3.2.1 Molecular Beam Chamber Vacuum System
3.2.2 Nozzle Assembly
3.2.3 Skimmer Assembly ............
3.2.4 Nozzle-Skimmer Distance
3.2.5 Gas Supply System
3.3 Interaction Chamber .............
3.3.1 Chamber Magnetic Shielding ........,........
3.3.2 Interaction Chamber Vacuum System
3.3.3 The Flag
3.3.4 Mass Flux Gauge
3.3.5 Electron Gun
3.3.6 Ion Optics
3.3.7 Mass Spectrometer
3.3.8 Ion Detection
3.4 Miscellaneous Equipment .............
3.4.1 Iris Diaphragm
3.4.2 Capillary Leak
3.4.3 Scattering Cell
3.4.4 Quadrupole Mass Spectrometer ............
3.5 Future Refinements
3.5.1 Automated Data Acquisition ...
3.5.2 Improved Iris Diaphragm
3.5.3 Time of Flight Mass Spectrometer
3.6 Conclusion
55
55
56
57
58
60
61
62
64
6s
65
68
68
73
87
92
96
99
99
100
101
101
r02
1,02
103
103
r04

4 Testing and Preliminary Experiments .............
4.1 Introduction .............
4.2 Mass Flux Gauge Calibration
4.3 The Flag Effect and the Extraction Potential...
4.4 Relative Ionisation Cross-sections
4.4.I T otal Ionisation Cross-sections
4.4.2 Partial Ionisation Cross-sections ....
4.4.3 Appearance Potentials
4.5 Potential Sources of Error
4.5.1 The Flag Effectiveness .....
4.5.2 The Ionisation Volume
4.5.3 Radial Distributions of the Monomer and Dimer Ion Beam
4.5.4 Molecular Beam Radial Density Distributions
4.5.5 Daly Detector Sensitivity
4.6 Nozzle-Skimmer Distance and the 'Break-away' Distance
4.7 Molecular Beam Scattering Measurements
4.7.1 Scattering Cell Measurements .......
4.1 .2 Interaction Chamber Scattering Measurements
4.8 Ion Beam Scattering Measurements
4.9 Dependence of Cluster Ion Formation on Source Parameters
105
105
105
108
It2
It2
It4118
t20
t20
t23
t29
r32
t3'7
r39
t45
t45
151
r52
r54
1584.10 Conclusion
lV

5 Rare Gas Dimer Fragmentation 159
159
159
159
165
170
t79
t82
184
184
186
191
r93
r93
t97
198
207
5.1 Introduction
5.2 Dimer Fragmentation using the Modified Lee and Fenn Method
5.2.1 The Method of Lee and Fenn
5.2.2 Limitations of the Lee and Fenn Method .................
5.2.3 The Modified Lee and Fenn Method
5.2.4 Argon Dimer Fragmentation
5.2.5 Relevance of the Modified Lee and Fenn Results
5.3 Dimer Fragmentation using the Relative Ionisation Cross-section .......
5.3.1 Normalisation of the Dimer Ionisation Cross-section
5.3.2 Rare Gas Dimer Fragmentation
5.3.3 Relative Fragmentation Probability for other Gases
5.4 The Fragmentation Probability Maximum
5.4.1 Further Evidence of a Maximum Fragmentation Probability
5.4.2 APossible Implication of the Maximum Fragmentation Probability ...
5.4.3 Discussion of Ionisation Induced Fragmentation
5.5 Conclusion .................
6 Summary and Future Work
6.1 Summary
6.2 Limitations of this V/ork
6.3 Future Work
Appendices
A A Comparison of Per{luoropolyether and Silicone Diffusion Pump Fluids
B Emission and Re-absorption of Diffusion Pump Fluid
Break-down Products
C Charge Accumulation on Stainless Steel Electrodes
208
208
2tl2t2
A-1
B-1
c-1
References
v
R-1

Abstract
This thesis describes the design, construction and testing of a molecular beam apparatus
for studying van der'Waals clusters. The clusters, formed by supersonic expansion are ionised
through electron bombardment, and mass analysed prior to detection with a Daly-type
detector.
To test the performance of the apparatus, measurements were made of the relative
ionisation cross-sections of the rare gases, and were found to be in excellent agreement with
generally accepted published results.
Two types of experiment are described for determining the dependence of the rare gas
dimer fragmentation on the energy of the ionising electrons. Firstly, a Modified Lee and Fenn
method is used to study the fragmentation of the Argon dimer and secondly, relative
ionisation cross-sections measurements are used to investigate the relative fragmentation of
rare gas dimers. The ease with which Lee and Fenn claim to have obtained reliable Argon
dimer fragmentation values, and the apparent discrepancy with other researchers, prompted a
detailed investigation of their method. Limitations of the method, together with possible
shortcomings in the measurements of Lee and Fenn are discussed.
This thesis reports for the f,rrst time that the dimer fragmentation probability reaches a
fairty large maximum in the vicinity of 100eV, and decreases for higher electron energies. For
all dimers studied, such a maximum in the fragmentation curve was found, suggesting that it is
a general feature of the fragmentation process, and possible reasons for this are discussed.
The ratio of the dimer to monomer gas kinetic cross-section for argon is measured to be
1.510.1, which is in good agreement with the work of van Deursen and Reuss. This work also
indicates that the ratio of the ionisation cross-sections for dimer to those for monomer is 1.4,
which agrees well with the ratio for the gas kinetic cross-sections.
v1

Statement
This thesis contains no material which has been accepted for the award of any other
degree or diploma in any University, and to the best of the author's knowledge and belief, it
contains no material previously published or written by another person except where due
reference is made in the text.
I consent to this thesis being made available for photocopying and loan by the librarian of
the University of Adelaide, subject to acceptance for the award of the degree.
James McKay, B.Sc. (Hons)

Acknowledgments
First and most importantly I thank my wife Niki, and my parents without whose support
and encouragement I would not have been able to undertake this work.
I thank E.H. Hirsch for developing in me a keen interest in experimental physics and for
providing the inspiration to persevere with this work, when at times progress seemed a long
way off. The enthusiasm displayed by Mr Hirsch will be carried with me throughout my
scientific career.
I thank Mr Bob Nation for the enthusiasm and dedication he showed to the construction
of the apparatus necessary for this project. The ability of the apparatus to conduct molecular
beam measurements is, to a large extent, due to his support.
I am indebted to Mr J. Smith and Mr M Shorthouse, of Eectronic Services, for the design
and construction of power supplies. Thanks also goes to Mrs J Hobbs and Mrs M Whiteford
who were very helpful in the procurement of equipment for this project.
I would like to thank the staff and former students of the Ultra-violet and Molecular
Physics group for the discussions, and the support given to me during this work.
I thank the Defence Science and Technology Organisation for the Cadetship which
allowed me to undertake this research, and for the provision of equipment and funds towards
this project. I am particularly indebæd to Dr J. Craig and Dr G Williams for granting me leave
from work to complete this thesis.
v11l

tIIIt
Front View
Rear View
The Molecular Beam Apparatus
IX

1 Introductory Remarks
1.1 Introduction
Ever since the pioneering work of Becker, Bier and Henkes (1956), clusters have been
a source of wonder to both chemists and physicists. While their initial discovery presented
additional difficulties to molecular beam researchers, the study of clusters soon grew to
encompass topics such as cluster generation, mass analysis and stability. It was not long
before researchers realised the usefulness of cluster growth as an intermediate state to the gas
- liquid phase transition. The study of the nucleation process has largely concentrated on
changes in the properties of clusters of increasing size, until the bulk material properties are
reached.
In one tiequently used technique the clusters are generated by expansion from a high
pressure stagnation volume into a region of low pressure via a small nozzle. The molecular
beam thus formed is sampled by a skimmer located downstream, allowing the central core of
the beam to pass into an interaction chamber. The interaction chamber contains an ionising
source and cluster ion detection system. The two most common means of generating cluster
ions are by photoionisation or by electron impact.
1.2 Cluster Classiflrcation
Clusters are generally defined as aggregates of atoms or molecules forming non-rigid
structures held together by physical and/or chemical bonds. Molecules on the other hand are
characterised by having definite composition and in most cases, definite structure. The most
stable structure of a cluster will depend on the number of constituents and will ofæn change
with an increase in cluster size.
Clusters can be classified in a number of ways. Firstly, they can be characterised by
size, as small , medium or large. A small cluster is one that has a large fraction of the tot¿l
number of constituents present on the surface. For example, Arsz has at least 32 atoms on the
surface. The properties of small clusters generally vary strongly with the number of
1

constituents, while a medium cluster, on the other hand, can be thought of as having
properties that vary only gradually with the number of constituents. A cluster is deemed to be
large if its properties approach those of the bulk material.
A second classification relates, not to the cluster size, but whether or not the
constituents are identical or not. For example, the dimer Ar2 is classifîed homonuclear while
the cluster ArXe is considered heteronuclear.
However, by far, the most common means of classifying clusters is by the strength of
the binding forces holding the clusters together. Table 1.1 displays a list of the most common
types of clusters and the corresponding binding energies.
Table 1.1: Cluster classif,rcation in terms of binding energies (From Jortner (1984) and Mark
(1e86)).
Jortner (19S4) classifies clusters into two categories according to their binding energies:
1. weakly bound clusters - Van der Waals , Molecular, Hydrogen bonded
2. Strongly bound clusters - Ionic, Metallic, Valence
Cluster classification is often reflected in the processos by which they are generated.
For example, the usual method of forming van der Waals and Hydrogen bonded clusters is
adiabatic gas expansion, where a molecular beam contaìning clusters is produced when a gas
under high pressure expands through a small nozzle into a region of low pressure. In the case
2
Cluster Type Example
(basic unit)
Binding forces Average
Binding Energy
(ev)
Van der Waals Rare gases, Nz, COz Dispersive plus
weak electrostatic
< 0.3
Molecular 12, ofganics Dispersive, electrostatic
(weak valence )
-0.3to1
Hydrogen bonded HzO , NH: H bonding, electrostatic - 0.3 to 0.5
Ionic NaCl Ionic bonding -2to4
Valence Cn,Ss Conventional covalent bonds -1to4
Metallic Nao, Cuo \{etallic bonding -0.5to3

of metallic or semiconductor clusters, laser vaporisation of a target rod, located within the
throat of a pulsed nozzle is often employed. A carrier gas (He) is used to condense the laser
generated vapour, thus resulting in the production of large clusters.
1.3 Historical Perspective
The number and variety of cluster experiments listed in the literature makes an attempt
to review the entire cluster field almost impossible. Therefore this section outlines a number
of experiments, together with the conclusions derived by the authors that are pertinent to this
thesis. The review is restricted to van der Waals clusters, generated by free jet expansion and
detected by electron beam ionisation and mass spectrometry. The reader's attention is drawn
to a number of general cluster review articles by Stein (1979), Märk and Castleman (1985),
Becker (1986), Beuhler (1987), Bueler and Freidman (1986) and Märk (1987), Stamatovic
and M¿irk (1991), just to name a few.
1.3.1 Supersonic Molecular Beams
The study of gas phase clusters stems from research into molecular beams over the
past 40 years. Until 1951 molecular beams were genorated using effusive oven sources and
were limited by the difficulties of low beam intensities and a large distribution of velocities in
the beam. In 1951 Kantrowitz and Grey proposed ¡he Noule Method of generating a
molecular beam. In their work the conventional oven source was replaced by a supersonic
nozzle, expansion through which formed a more or less mono-directional beam.
Becker, Bier and Henkes (1956) were the f,rrst to adequately conf,rrm the effectiveness
of the Kantrowitz and Grey nozzle sources, for -eenerating high intensity beams, reporting
evidence to suggest that the nozzle sources produced a naffower velocity distribution than the
conventional sources. These findings were supported by the work of Hagena and Henkes
(1960,1965) and later by Phipps, Griffith and Scott (1963).
The initial comparison of molecular beam intensity and velocity distribution with the
theory of Kantrowitz andGrey (1951) was hampered by the use of skimmed molecular beam
sources. The presence of a skimmer caused significant disturbance to the molecular beam,
resulting in lower than predicted beam intensities. Anderson and Fenn (1965) reported on
the velocity distributions in molecular beams of argon and investigated the effect of the
skimmer disturbance, illustrating how skimmer interference could decrease the molecular
beam intensity. Like the experiments of Becker, Bier and Henkes, they employed a time of
flight method to analyse velocity distributions.
J

1.3.2 Cluster Mass SPectra
The f,rrst observations of clusters in the mass spectra of molecular beams appeared in
the literature in 1961. Bentley (1961) reported a mass spectrum of COz obtained from a
molecular beam generated by expanding COz at -5atm through a pin-hole into vacuum. The
mass spectrum showed peaks corresponding to polymers of (COz)" , with n as large as 23.
Figure 1.1 illustrates the intensity of the (COÐ". polymers relative to that of the monomer.
1
0.1
1E-2
1 E-3
1E-4
1E-5
1 E-6
1E-7
1 E-8
aa
o
a
a
=U'cc)C,
C,oc)
(dc)E.
a
a
tta a aaaa
taa
a
0 4 I 12 16 20 24
n
Figure 1.1: Measured ion intensities for (COz)'. relative to the monomer COz*.
(afær Bentley (1961))
In the same year, Henkes (1961, 1962) published a similar mass spectrum of COz. In both
cases the researchers argued that their results indicated the formation of polymeric molecules
of COz. Henkes attributed their formation to condensation of COz occurring within the
molecular beam, with van der Waals forces responsible for holding the clusters together.
Using the original Bentley apparatus, Turnbull and Cuthbert (1962) observed
polymers of NzO, SOz and N2. They showed that these clusters (or polymers as they were
known at the time) were unstable to wall collisions and provided further evidence that these
structures wero not a result of ion - molecule reactions occurring within the mass
spectrometer.
In 1963 Greene and Milne (1963) reported polymeric species in the mass spectrum of
supersonic molecular beams of a large number of gases, including Ne, Ar, Nz , Oz, COz and
H2O. It was thought at the time that dimer formation could be through ion-molecule reactions
in the mass spectrometer. But Milne and Greene were able to show that this was not the case
by making observations on a molecular beam containing Ar and CO2. They found by raising
the COz component slightly, by 2.5Vo, the argon monomer to dimer ratio was increased by a
4
factor 3 whilst at the same time the monomer to dimer ratio for COz was lowered by a factor
of 7. However, such a small compositional change could not have significantly affecæd the
ion-molecule rate, which therefore could not be a factor. On the other hand they found that
the measured cluster signals depend critically on the expansion parameters, temperature (T6),
stagnation pressure (pJ and nozzle diameter (d').
At about the same time Leckenby, Robbins and Trevalion (1964) reported their
observations of cluster formation in supersonic molecular beams of several gases (see also
Leckenby and Robbins (1966)). They employed a magnetic sector field mass specffometer for
mass separation and cluster identification. Leckenby et al assessed several mechanisms for the
production of these polymeric molecules and asserted that these clusters are embryos from
which condensation nuclei are formed. Like Henkes (196I,1962), cluster formation was
attributed to adiabatic cooling of the gas as it expands from the high pressure gas reservoir
into a vacuum. Like Greene and Milne (1963), Leckenby et al observed similar increases in
the Ar monomer to dimer ratio as small amounts of COz were added to the Ar reservoir.
By the mid 1960's several groups had reported the existence of polymeric molecules
or clusters as they began to be known as. The presence of clusters was used by Fontijn and
Rosner (L967) to explain discrepancies in the NO + O chemiluminescence reaction rato to
form NOz , as determined by experiments in the upper atmosphore. Fontijn and Rosner point
out that reaction rates determined from upper atmosphere chemical releases or simulated
releases in low density wind tunnels is several orders of magnitude larger than that measured
using electrical discharge, flow-reactor techniques (see Fontijn et al (1964)) in the 1 torr
pressure regime.
The discrepancy is explained by demonstrating that clustering is likely in the rocket
release and wind tunnel experiments, where the nitric acid expands adiabatically prior to
reaction with oxygen and that the effect of clustering is to increase the reaction ratel.
1.3.3 Cluster Growth
Between 1968 and 1973, numerous authors published dat¿ on condensation during the
adiabatic expansion of high prsssure gases. Emphasis was on the kinetics of the growth of
small clusters, predominantly the dimer. A series of empirical scaling laws were established to
describe the interdependence of the source parameters, T0, P0, d". The laws describe how to
determine how any two of these parameters need to be changed to compensate for a change
in the third, in such a way that the mean cluster size remains constant.
1 Milne and Greene (1967) continued this study and postulated that the lower than expected NO dimer signal
(see Fontijn and Rosner (1967)) could be a result of electron impact fragmentation of (NO)2.
5

For example, Golomb et al (1970) repofted a mass spectrometric study of molecular
clusters formed in the supersonic expansion of argon and nitric oxide. The cluster ion
inænsities were measured as a function of stagnation pressure for various nozzle diameters
and the pressure conesponding to maximum dimer intensity deærmined. From their initial
work it was concluded that the maximum dimer intensþ was correlated well with Pod.
However, subsequent experiments by Golomb et al (1972) showed that a better correlation is
achieved with the scaling law podq , with g= 0.55 + 0.05 for most gases. The maximum
argon dimer intensity was also measured to scale with p"T;2'2 , with To the nozzle
temperature.
Milne et al (1970) use a kinetic model for the dimerisation process to determine the
argon dimer intensity as a function of the source parameters. As with most approaches to the
problem of cessation of dimer producing collisions, Milne et al assume ideal, isentropic
expansion up to a terminal Mach number, at which collisions become so infrequent that
conditions are frozen. They found that the calculaûed dimer concentration was significantly
different from that determined experimentally, but with the introduction of a correction factor
(see section 2.3.2),Milne et al claim to have fair agreement between the measured and
calculated values. Similar kinetic analyses were caried out by Dorf,reld and Hudson (1973) for
dimer formation in the expansion of polyatomic gases, in particular COz.
Hagena and Obert (1972) introduced the idea of corresponding jets when talking
about different gases in which the condensation process is very similar. Their corresponding
jets model combines the thermodynamic similarity of gases in the same state, for example the
rare gases, with the gas kinetic similarity of flow fields in geometrically similar nozzles.
Hagena and Obert show that for the rare gases Ne, Ar, Kr and Xe the mean cluster size is the
same if the po,To values are transformed according to their model for corresponding jets. This
has the implication that experiments on one gas can be used to determine the conditions under
which similar condensation effects will be observed with another gas.
1.3,4 Evidence for Fragmentation
By the laæ 1970's, cluster researchers were beginning to appreciate the significance of
fragmentation. No longer could the cluster ion mass spectrum be viewed as a direct
representation of the neutral cluster distribution. That is, the ionisation process which is a
prerequisite for cluster detection alters the cluster distributions in an unknown manner.
Fragmentation of neutral clusters brings the validity of empirical scaling laws and the
associated dimer growth rate results into question. The same can also be said for the
6

observation of magic numbers, to be discussed below, in the mass spectra of the rare gas
clusters.
Several attempts have been made to quantify the fragmentation effect for small
clusters. Lee and Fenn (1978), using a mass flux gauge to calibrate a quadrupole mass
spectrometer, find that the probability of fragmenting the argon dimer, as a result of electron
bombardment ionisation, is of the order of 90Vo . They point out that fragmentation effects
disturb mass spectrometric experiments to a greatsr degree than commonly accepted. Their
experiments wers criticised by Gentry (1982 ) for reasons to be discussed in section 5.2.2.
Helm, Stephan and Mark (1919) found the relative fragmentation probability for the
rare gas dimers to be independent of electron energy within the range from 60 to 180eV.
About the same time Gough and Miller (1982) measured CO dimer concentrations
using mass spectrometry in conjunction with laser bolometer determinations of the CO
monomer flux. They found a fragmentation probability of 0.85 for an electron energy of
100eV.
Another approach to the fragmentation problem is the crossed molecular beam
experiment. This method relies on the kinematically different behaviour of clusters of various
sizes in a scattering experiment. That is, clusters of different masses are scattered to different
angles provided their initial velocities are the same. This, rather elegant approach provides
reliable information on the fragmentation probability of small clusters. Worsnop et al (1984)
used this approach to investigate electron bombardment ionisation and fragmentation of the
rare gas clusters, Arn, Kro and Xeo. Their experiments used a xenon molecular beam to scatter
the rare gas clusters, while detection was achieved by means of a time of flight mass
spectfometer.
'Worsnop et al (1984) measured appreciable amounts of cluster fragments at angles
kinematically prohibited by direct scattering with Xe. They conclude that significant
fragmentation of the neutral clusters is occurring, resulting in the variety of species detected
in the time of flight analyser at a fixed scattering angle.
In the same year Buck and Meyer (1984) using a similar technique deærmined the
fragmentation probability of small argon clusters for three electron energies.
Their results are shown in table l.2.Here the fragmentation probability, f.o, represents the
fraction of Ar" that is detected as Ar-* following ionisation.
7

Dimer Trimer
En(eV) fzt fzz f¡r fzz fzz
30 0.5 0.5 0.47 0.s3 0
40 0.s2 0.48 0.52 0.48 0
100 0.62 0.38 0.6 0.4 0
Table 1.2: The probability ( f ) of fragmenting neutral argon dimers and trimers
by electron impact ionisation (after Buck and Meyer (1984)).
The implication of the Buck and Meyer results, is that in the range from 30 to 100eV
at least 50Vo of the argon dimers fragment into monomers as a result of ionisation. Further
still, Buck and Meyer report that all argon trimers are fragmenæd upon ionisation. This is
contrary to the work of others (for example, Dehmer and Pratt (1982) ), where the trimer ion
is detected when there is no evidence for the exisænce of larger clusters.
The use of crossed molecular beams for size selection of clusters has enjoyed
considerable use over the last decade. Buck and Meyer (1986,1988) used the same apparatus
to study fragmentation of other van der Waals clusters. Bewig, Buck and co-workers
(I992a,I992b,Igg3,Ig94) have also published data on the ionisation induced fragmentation of
hydrogen bonded and metal clusters.
While it is generally accepted that ionisation of small clusters ( n << 1000 ) induces
large fragmentation effects there is evidence to suggest that this is not always the case for
larger clusters. Gspann and Kortin g (1973) reported that large Hz and Nz clusters undergo
negligible fragmentation upon ionisation by electron bombardment. They used a specially
designed time of flight mass spectrometer to determine the molecular weights of clusters, in
the range 103 to 106, by measuring the change in the cluster speed, caused by the introduction
of a longitudinal electric field after ionisation. Gspann and Korting suggest that for large van
der Waals clusters, the complications in mass spectrometry arising from electron impact arc
much less severs than often anticipated. While acknowledging the contrast to mass
spectrometric studies of other molecules, Gspann and Korting say that for clusters 'it may be
not so much suryrising as van der'Waals bonds are not broken by ionisation of one
constituent'.
8

1.3.5 Cluster Ion StabilitY
Several areas of interest are closely relaæd to cluster fragmentation, in particular
metastable decay, magic numbers and multiply charged clusters.
Metastøble Decay
Excitation of clusters to repulsive states due to ionisation normally results in rapid
fragmentation. However, clusters can be metastable as a result of transitions with long
lifetimes, which may correspond to different mechanisms, depending on the mode of energy
storage and disposal in the ion. As an example, consider cluster ions in states from which
dissociation transitions are spin forbidden. Some ions will still undergo electronic
predissociation, but at a reduced rate. Whether a cluster is detected as the intact cluster ion
or as a daughter ion will depend on the decay rate À and the time between ionisation and
deæction.
A large number of studies exist on the properties of metåstable cluster ions with life
times as long as 200¡rs, for example, Märk and Scheier (1987a,1987b), Märk (1987)' Märk
et al (1gg6), Echt et al (1984), Stephan and Mark (1982a,1982b), Futrell et al (1982) and
Stace and Shukla (1980,1982a,1982b). These experiments use a variety of mass analysis
methods, usually involving two mass analysers separated by a field free region, in which the
parent ion decay rate is measured (see section 2.4.4 f.or a brief discussion on the detection of
metastable ions). In all cases measurement of the decay rate relies on accurate measurements
of the parent and metastable ion currents, together with a knowledge of both the flight time,
to, of the parent ion from the beginning of the field free region to the ion detector and the
flight time, Âto, of the parent ion within the field free region.
To eliminaæ the influence of competing effect of collision induced dissociation, the
ratio of the metastable ion culTent to the parent ion curent is measured as a function of the
background pressure, with the metastable decay rate calculated by extrapolation to zero
pressure ( see Deutsch et al (1985) and Mark (1987) for more information ). Figure 1.2
shows, as an example, the ratio of the metastable to the parent ion current for the
unimolecular decay of At21*, measured by Märk et al (1986).
9

0.12
0.0I
0.06
0.03
0.0 0
Ar
12Pressure (10
20 21Ar
++ Io(ú
L(¡)
C)
L
o
IIAr.,n'/ Arr., '
0 3 4-4To
rrl
Figure 1.2: Ratio of the metastable ion current to the parent ion current as a function of the
background pressure for the unimolecular dissociations Arzr*+ Arzo* and Arzr*-) Arts*. (after
Märk et al (1986)).
Small cluster ions have small decay rates, À,, between 10-3 and 10r 1 Mark (1987) and
references therein) unless special measures are taken during their preparation. For example,
Stephan and Mark (1985) have found that Arz* produced via associative ionisation has a
decay rate (1, - 5x10⁻²s-1) approximately 100 times greater that for Arz* produced by direct
ionisation, for which ì, - 5x10-as-1.
Several experiments have been conducted to study the dependence of the metastable
decay rate on the source conditions, the cluster size and species, and the transit time prior to
entering the freld free region. For example, metastable decay rates have been measured as a
function of cluster size for neon, Märk and Scheier (1987b), and for argon, Märk et al
(1986), with the decay rares observed to lie between -10s-1 Märk et al (1986) and -5x10⁻⁷s-1
Echt et al (1987). The decay rates show a significant change with the cluster size and the
position of magic numbers in the mass spectra reflects the large variation in the metastable
decay rate at each anomalous mass. Cluster ions of certain sizes, which correspond to
relatively stable structures, give rise to significantly lower metastable decay rates and this is
reflected by anomalously high intensities (at certain mass numbers) in the mass spectrum.
In 1983 Stephan and Mark (1983) reported that the decay rate for the unimolecular
dissociation Ar3** + Arz* + Ar is critically dependent on the source temperature, To. They
found that the decay rate for anozzletemperature To=220K (3x10⁻³s-1) wÍìs approximately
10

three orders greatsr than the decay rate for T.=160K (3s-t). Märk (1937) suggests that the
large difference arises from a change in the dominant mechanism through which trimer ions
are formed. According to them, at low source temperatures trimer ions are formed via
ionisation induced fragmentation of large (p3) neutral clusters whereas, at high source
temperatures, most of the trimer ions are produced through direct ionisation of the neutral
trimer. In the high temperature case, transitions from the neutral trimer in a triangular
configuration, see Cooper and Birge (1981), to the linear ¿urangement of Ar:*, see Wadt
(1981), are likely to result in strong fragmentation, which would account for the absence of
Arr* in the observations of Buck and Meyer (1984).
The use of a single metastable decay rate to describe the unimolecular dissociation of
cluster ions was questioned by Klots (19S5). He predicted that charged clusters having a
broad range of inærnal energies should display a correspondingly large range of evaporative
decay raæs Â. Märk and Scheier (1987a,1987b) confirmed Klots predictions with Ne,
where the decay rate \¡/as measured at several time windows following ionisation. They noted
that the metastable decay rate could change by more than a factor of 10 and that these
metastable cluster ions could not be assigned a unique lifetime.
Klots (1982,1985) predictions were also supported by Kamke et al (1986a, 1986b),
who found a single decay rate for the case of unimolecular dissociation of (NzO)¡*ions.
However, in this case the ions were known to be formed with a nalrow range of internal
energies.
Magíc Numbers
The observation of intensity peaks, occurring at 'magic' numbers of constituent
atoms, in the mass spectra of cluster beams, prompted considerable debate on the structure
and relative stability of clusters of various size. First evidence of magic numbers appears to be
from Kimoto and Nishida (1977),who investigated the mass spectrum of lithium clusters. In
1981, Echt, Sattler and Recknagel reported the observation of magic numbers in the mass
spectra of xenon clusters, part of which is shown in figure 1.3. Using a time of flight mass
analyser to observe the Xe spectra, Echt et al noted that the relatively high intensity of xenon
clusters with a 'ma-eic' number of atoms, in this case 55, 71,87 and 147 , must be attributed to
the higher stability of these clusters, which was stucturally explained in terms of closed shells
of hard spheres in a icosahedral geometry. Echt et al varied the ionisation energy and found
negligible difference in the relative heights of neighbouling peaks. From this, they concluded
that the effects of fragmentation are small. It is worth noting that when the xenon data were
compared to the mass spectra of argon, Echt, Sattler and Recknagel noticed differences in the
11

positions at which the magic numbers appeared. This suggested structural differences
between Ar and Xe clusters. Sattler et al continued this work, reporting magic numbers in
antimony (1981) and lead clusters (1982).
3.0T =175K0
55 7187
Ø.=c
-o(ú
c(1)
L¿Oco
2.0
147
1.0
0.0
50 75 100Cluster size n
125 150
Figure 1.3: A section of xenon mass spectra displaying the magic numbers 55,7I,87 and
I47 (altt Echt et al (1987)).
In 1983, Ding and Hesslich reported magic numbers in Ar and Kr and found that, in
the case of argon, the intensity anomalies occurred at the same constituent atom numbers
found by Echt et al (1981) for Ar and Kr. Similarities in the position of the Ar and Kr magic
numbers suggest that argon and krypton clusters are similar in structure, on the other hand
this structure is different fiom that of xenon. Like Echt et al, Ding and Hesslich argued that
the magic numbers correspond to particularly stable neutral clusters structures.
Hoping to shed light on the differences in magic number structure in rare gases,
Stephens and King (1983) investigated the occurrence of magic numbers in the mass spectra
of small helium clusters. They found distinct magic number enhancement of ion intensity for
clusters of 7, 10 , 14 and 30 atoms. Stephens and King note that there are marked differences
between their helium spectra and the previously published work on the other rare gas systems
Unlike previous researchers, they argued that a loss of atoms due to fragmentation can not be
excluded and the observed magic numbers are, to a large extent, representative of the relative
stability of cluster ions, rather than the neutral clusters from which they originate'
t2

A different approach to the problem was provided by Harris, Kidwell and Northby
(1984), in which positive argon ions were expanded to form a cluster ion beam. Magic
numbers were detected in the mass spectra and compared to the results of others for neutral
argon jet expansion. In the neutral argon expansion case, magic numbers appsar at
N=14, 16,Ig,2!,23,27 while in the argon ion case, the magic numbers appear at N=13, 19,
23,26, 29, 32 and 34. Harris et al, conclude that the occunence of magic numbers, for neutral
argon expansion, is deærmined by a combination of the stability of the charged cluster and the
stability of neutral cluster.
By the mid 1980's it was general accepted that fragmentation could not be neglected
when interpreting cluster mass spectra. Magic numbers are now, generally understood to
reflect the relative stability of cluster ions.
An understanding of the decay mechanisms, together with a knowledge of the times
over which they occur is paramount in interpreting magic numbers. In the paper, ' Onset and
evolution of magic numbers in mass spectra of molecular clusters' Casero and Soler (1991)
discuss the growth and decay of magic number peaks following ionisation.
The process can be viewed as follows. Immediately following ionisation the clusters
become liquid or structureless with no cluster size displaying special stability, ie magic
numbers are absent from the spectra. The clusters ions then commence evaporating monomers
in order to shed the large excess vibrational energy. Eventually, the cluster ions will have lost
sufficient energy to enable solid-like packed structures to form. Cluster sizes having well
packed structures will have increased stability, giving rise to magic numbers in the mass
spectra.
Casero and Soler maintain that the time required for the ionised clusters to cool down
by evaporation and to form solid-like structuros is very sensitive to the details of the forces
between the neutral molecules and between these and the dimer ion. If the time required for
the formation of solid-like structures (or for their decay) is dependent on the cluster species
then, for a fixed observation time window, it is possible that particular magic numbers will
appear in the mass spectrum of one species while not necessarily appearing in the mass
spectra of other, yet similar, species. This shows that care must be paid to the choice of the
time window when obtaining cluster mass spectra.
Casero and Soler explain the measured differences in the spectra of Ar and Xe by
showing that the formation of magic number peaks in xenon occurs at a later stage than in
argon.
13

Multíply charged clusters
In a multiply charged cluster, charges of equal sign must be in close proximity.
Therefore, particularly, for small multiply charged clusters, the Coulomb energy is often larger
than the binding energies, resulting in fragmentation through Coulomb explosion. The stability
of a multiply charged cluster increases for larger clusters'
Over recent years the study of cluster stability has included the search for multiply
charged clust€rs. The emphasis has been on determining the smallest size, tu, at which doubly
charged van der Waals cluster ions are observed, and identifying the decay channels through
which these clusters fragment.
The first observation of large (odd numbered) doubly charged vdW clusters was
reported by sattler et al (1gg1). They obseryed doubly charged xeo2* in the mass spectra of
Xe clusters ionised with 50eV electrons. Sattler et al report that the minimum appearance size
is n=53. Their observations are shown in figure 1.4, where the large peaks conespond to
singly ionised xenon clusters and the small peaks, at fractional mass numbers, conespond to
doubly ionised xenon clusters.
100
10
20 22 24 26 28 30 32 34 36 38 40
Cluste r size nlL
Figure 1.4: Singly and doubly charged ions in the mass spectrum of a Xe cluster beam
(after Sattler et al (1981)).
Scheier and Mark (1987a,1987b) reported the existence of triply charged argon
clusters, Afn3*, noting that the minimum appearance size was n=226. A summary of the
available data on the minimum appearance size of multiply charged vdW clusters is presented
53++
U)
--C,
-o(õ
>\=(nC<t)
C,
C,o
t4

in table 1.3 ( after Märk (1987)), where rrz ,rt3 and n4 are the minimum cluster sizes at which
doubly, triply and quadruply charged clusters are detected'
Cluster tuz fl3 n4
Ar 91 226
Kr 73
Xe 53 11,4 208
Nz 99 2t5
Oz 92
NzO 50 105 185
COz 44 108 216
HzO 34
Table 1.3: Appearance sizes of multiply charged van der Waals clusters
(after Märk (1987)).
Several models have been proposed to explain the minimum appearance size for multiply
charged clusters. The basis for most of these models is a liquid drop approximation analogous
to that of Lord Rayteigh (1882), where the limiting charge that can be placed on a drop is
given is by
J,t Õ (1.1)1
r2Z 4
mÂxe
where Z^*isthe maximum number of elemental charges e that can be accommodated by a
droplet of radius r with surface tension o . Minimum appearance sizes obtained using this
formula are approximately I.2 - l.5larger than the measured values.
Using a surface and electric energy liquid drop model Echt (1986,1988) has arrived at
the following simple relationship describing the minìmum size, nz of doubly charged cluster
10ns
15
(r.2)

where y is the atomic volume and Tu is the boiling temperature. Thus within the liquid drop
approximation, the minimum size for a doubly ionised cluster is inversely proportional to both
the radius and the fugacity of the atomic species. The agreement with the data in øble 1.3, is
illustrated by the linear plot shown in figure 1.5.
100 '-N 2rì
atK,
-Xeaa-\N20
80NC,
o.!(t,
c)c) 60C(u
(dG)o-o-
402
HZO -'
20
0 10 20
10000/Tbv30
(1/K )40
Figure 1.5: Appearance size rrz, versus the inverse of the product of the boiling temperature,
Tr, and the cube root of the molecular volume v, for the doubly charged vdW clusærs in table
1.3 (after Märk (1987)).
Combined with the interest in determining the appearance sizes of multiply charged
clusters, is an effort to understand the stability of the multiply charged clusters above the
appearance size. Researchers are attempting to measure metastable decay rates for various
dissociation channels associated with the decay of doubly and triply charged vdW clusters.
In particular, Kreisle et al (1986a,1986b) have found evidence of delayed Coulomb
explosion occurring in triply charged COz clusters. This is in contrast to doubly charged
clusters who decay solely through sequential evaporation of neutral monomers. All attempts
to detect metastable fission of triply charged argon or krypton clusters have been
unsuccessful.
16

1.4 Application of Cluster Researc
The study of clusters is not only important because of their intrinsic interest as a state
of matter intermediate between the gaseous and liquid phases, but also in view of their
potential role in many fields or practical applications. These fields are diverse and include
aerosols, chemical catalysts, photography, interphase physics and microengineering, to name
a few.
The importance of clusters to physical phase changes can involve a variety of
applications. The nucleation and growth of small metal clusters is of great importance for thin
film and solid state devices. For example, the development of the ionised cluster beam (ICB)
source, due to Takagi et al (Igi2) and Takagi (1986), was a major step forward in the quest
to produce high quality thin films. This technique utilises the vaporisation of elements and
expansion of the vapour through a small nozzle for the formation of clusters of a variety of
elements. The ICB method differs from conventional thin film deposition techniques in that it
provides tighter control over the kinetic energy and the ion content of the beam.
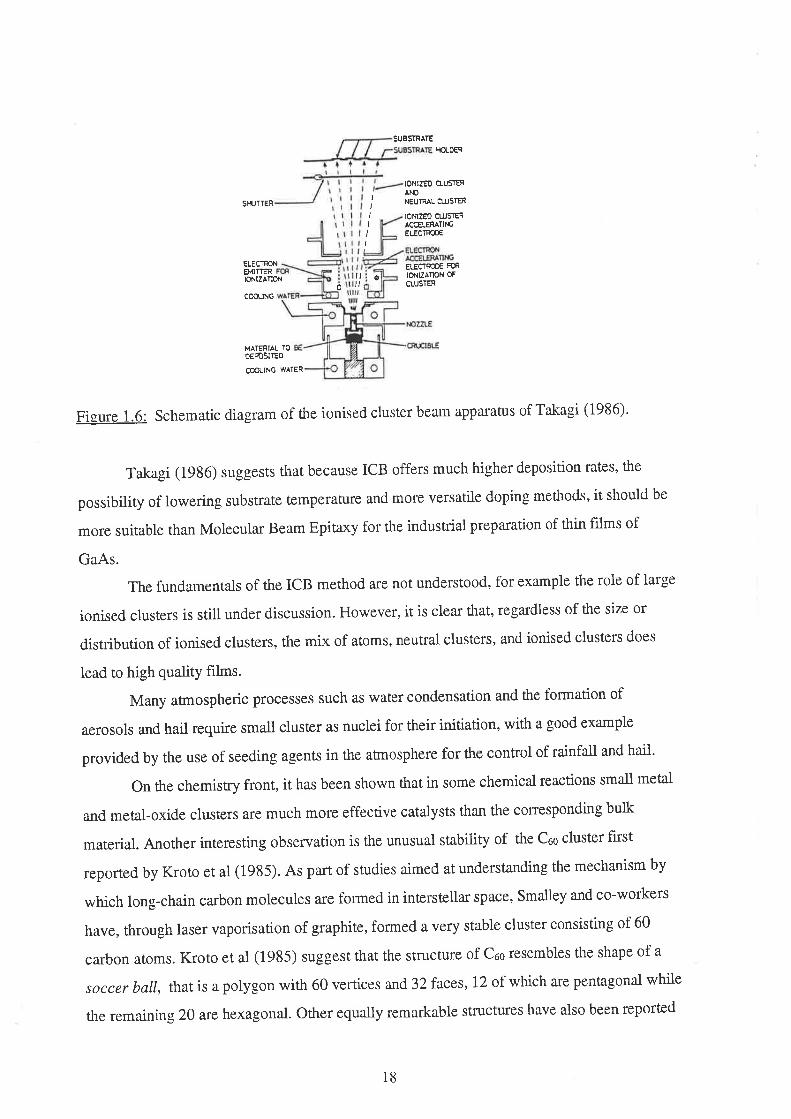
Figure 1.6 shows one of the ion sources used by Takagi and in this case the material to
be deposited is vaporised through direct heating of the crucible. The clusters formed during
the expansion from the nozzle are ionised through electron bombardment, and the resultant
cluster ions are accelerated and deposited on the substrate. Foilowing impact the kinetic
energy of the cluster ions can be converled to thermal energy, sputtering energy, implantation
energy or adatom energy. In the low energy range, Takagi (1984) has shown that the
acceleration voltage critically influences the adatom migration, nucleation density, sticking
coefficient and the enhancement of chemical reactions. Furthermore, control over these
processes can lead to high-quality, strongly adhering films that contain minimal stresses. High
quality films are particularly important where coatings with a high laser damage threshold are
required or for the production of semiconductor films for electro-optical devices.
ICB has been able to produce high quality crystalline films of metals and
semiconductors at pressures in the range from 10-7 to 10-6torr and with low substrate
temperatures.
t7
Sruf'rER
ELEC'TFONEMIITEFtoNlzanoN
COOLING
MATERIAL IOo€Ð5¡fEo
COOLING W^IER
IIII
II
SUBSfRAIE
IIOLOER
toNrzED cLLtSrEA¡ONEU'TFAL OIJSIER
IOMZEO CTUS]EFACÍELEF^fI}6ELECTRG
EIECÎFCOE FOR
IONEÁNON OF
CLUSÌENôilu
ø
Figure 1.6: Schematic diagram of the ionised cluster beam apparatus of Takagi (1986)'
Takagi (1986) suggests that because ICB offers much higher deposition rates, the
possibility of lowering substrate temperature and more versatile doping methods, it should be
more suitable than Molecular Beam Epitaxy for the industriat preparation of thin films of
GaAs.
The fundamentals of the ICB method are not understood, for example the role of large
ionised clusters is still under discussion. However, it is clear that, regardless of the size or
distribution of ionised clusters, the mix of atoms, neutral clusters, and ionised clusters does
lead to high quality films.
Many annospheric processes such as water condensation and the formation of
aerosols and hail require small clustsr as nuclei for their initiation, with a good example
provided by the use of seedin-e agents in the aünosphere for the control of rainfall and hait'
On the chemistry front, it has been shown that in some chemical reactions small metal
and metal-oxide clusters are much more effective catalysts than the conesponding bulk
material. Another interesting observation is the unusual stability of the Coo cluster first
reported by Kroto et al (1985). As part of studies aimed at understanding the mechanism by
which long-chain carbon molecules are formed in interstellar space, Smatley and co-workers
have, through laser vaporisation of graphite, formed a very stable cluster consisting of 60
carbon atoms. Kroto et al (1985) suggest that the structure of Coo resembles the shape of a
soccer ball, thatis a polygon with 60 vertices and32faces, 12 of which are pentagonal while
the remaining 20 are hexagonal. Other equally remarkable structures have also been reported
18
in the literature, for example Scheier and Mark (1987c) have discovered a stable cluster
consisting of 148 argon atoms.
These new types of clusters open up possibilities for new superconducting materials.
For example, Ceo forms salflike compounds with alkalis up to K¡Coo, which display
superconductivity at low temperatures. It is possible that new kinds of maærials may be
formed if micro-clusters of a given material could be embedded into a host of a different
material.
Cluster techniques have provided a tool to more closely investigate the process of
photography.In the photographic process, exposure to light of silver halide crystals ultimately
leads to neutral silver atoms being crystallised out. Silver clusters catalyse the developing
process, and the size of these clusters is critically important. Using a sputtering technique
Fayet et al (1986) deposited size selected silver clusters ions (Ag.*) on specimens containing
silver bromide microcrystals prepared from a photographic emulsion. Following this the silver
bromide was developed, and it was found that a critical minimum cluster size, n = 4, was
needed for development to take occur.
19

1.5 Project Aim
The present project is a result of the Ultra-Violet Atomic and Molecular Physics
Group commencing research into van der Waals clusters. In particular, the group is interested
in studying cluster fragmentation as a function of ionisation energy. From a review of the
available fragmentation information it was evident that several types of experiments would be
capable of providing information on fragmentation.
For instance, the ability of the crossed molecular beam technique to separate neutral
clusters according to their size would be a powerful means of studying the energy dependence
of cluster fragmentation, but the instrumental complexity of this technique was not
commensurate with the resources available to the group.
It was therefore decided to use the simpler Lee and Fenn (1978) method and to study,
in the first instance, fragmentation as a result of electron beam impact. The subsequent
development of a laser source would permit the method to be extended to the study of
photodissociation.
As a result, a two stage approach to the study of cluster fragmentation was
undertaken. In the first stago apparatus was constructed for studying small van der Waals
clusters. The clusters, formed by supersonic expansion are ionised through electron
bombardment, and mass analysed prior to detection with a Daly-type detector.
Subsequently a frequency doubled copper bromide laser, under development in the
group could be incorporated to provide a direct comparison between fragmentation resulting
from electron impact and photo-ionisation, and a time of flight mass spectrometer could be
included for studying the decay of metastable clusters.
This thesis describes the work carried out as part of the first stage. The aim of this
project was the study of electron impact induced fragmentation of small rare gas clusters as a
function of electron energy. In particular, the main effort was directed towards fragmentation
of the argon dimer, Arz, with a view to extending the work to Nez, Krz and Xez, ¿ls well as to
larger clusters.
The method of Lee and Fenn, which was adopted as a starting point, provides a simple
way of measuring the fragmentation of small clusters as a function of electron energy.
However, fragmentation values measured by Lee and Fenn are regarded as too high by a large
number of researchers, for example, Helm et al (1979), Gentry (1982), Buck and Meyer
(1984,1986). It appears that several deficiencies in their apparatus produced erroneous
results. This thesis discusses improvements to the method of Lee and Fenn, as well as the
ability of the method to obtain reliable fragmentation values.
20
In addition, a second approach was explored, which aimed to determine relative
fragmentation cross-sections by accurately measuring monomer and dimer relative ionisation
cross-sections. This thesis compares the ability of the two methods to provide information on
dimer fragmentation.
In the course of this project several other interesting observations were made. While
these observations were not directþ concerned with the fragmentation process, ttrey were of
sufficient intrinsic interest to be published in the literature.
2l
2. Brief Review of Background Information
2.1 Introduction
A discussion of the fragmentation of rare gas dimers is not possible without frrst
presenting some relevant background information. As this work relies on the generation of
clusters within a molecular beam it is fîtting to commence this chapter with a discussion of the
more important parameters relating to the formation of supersonic molecular beams and the
concomitant beam cooling.
Following the discussion on molecular beams a review of cluster generation is
presented. This deals with the onset of condensation and the effects of nozzle geometry and
stagnation volume parameters on the cluster signal intensity. For the most part the relations
presented are derived empirically and depend to a large extent on the particular nozzle -
skimmer assembly employed. Additional information on this, obtained during the course of
the present work is presented in chapter 4.
The main diff,rculty associated with cluster measurements is that mass separation and
detection of size-sele cted neutral clusters is, for all practical purposes, impossible. Ionisation
is required for cluster separation to occur within in a mass spectrometer. Therefore section
2.4 provide-s a discussion of the processes associated with the formation of cluster ions and
the diff,rculties associated with their detection.
22

2.2 Molecular Beam Theory
Due to their small binding energies, van der Waals clusters tend to be unstable in most
environments. For example, vd'W clusters will dissociate if they undergo wall collisions. As a
result, research into vdW clusters places stringent requirements on the conditions in which
they are generated. The most common environment for stable cluster generation is within a
supersonic expansion, which is described in the following section.
2.2.1 Continuum ExPansion
A supersonic molecular beam is formed if gas at high pressure is allowed to flow
through a small nozzle into a chamber at a pressure P6, in the millitorr range. A skimmer
selects the central portion of the beam and conducts it into a chamber at high vacuum. By the
use of suitable apertures, the result is a collimated molecular beam. The apparatus is shown
schematically in figure 2.1.
Skimmer
Detector
Pump Pump
Figure 2.1: Schematic diagram of cluster beam apparatus employing supersonic
expansion.
The nozzles used to produce supersonic molecular beams come in many different
shapes and sizes. Hagena and Obert (1972) have researched nozzles design, providing
comparisons between several different types. Two of the most common apertures are the
circular aperture, giving rise to an axial symmetric flow, and the slit nozzle with its
corresponding planar symmetric flow. The slit nozzles ænd to be employed in pulsed
molecular beam configurations while the circular nozzles are predominantly used in
continuous flow arrangements. In all nozzle cases, the supersonic molecular beams share
similar features and the cluster formation can be described in a similar manner.
NozzleMolecuarBeam
23

This discussion is limited to circular îozzles, the minimum area of which is known as the
throat, and can be described by
n=ldl (2.r)
where d" is the nozzle diameter.
If the source (stagnation) pressure is so high that the gas can be regarded as a
continuous medium then the flow pattern in passing through the nozzle is such as to cause the
random thermal energy of the molecules in the stagnation volume to be converted into
direcæd mass flow in the expanding jet. As distinct from low pressure effusive molecular
beams, there are binary collisions in the nozzle and further downstream. The effect of these
collisions gives rise to the unique properties of supersonic molecular beams, namely,
condensation.
Before discussing some of the ploperties of the expansion process let us look at the
structure of the continuum jet formed during the expansion, illustrated in figurre 2-2.
Jet Bou ndary Shock
Disc
CoreP,T M<<1 Flow
M>>1 M<1
M=1
Reflected Shock
Figure2.2: Banel shock system formed by continuum expansion (after Miller (1988)).
The complicated shock wave structure is a result of the expansion taking place in a
chamber with a finite background pressure. The chamber pressure, pu imposes a boundary
condition on the flow, ie the downstream local pressure must eventually reach that of the
background. However, the flow propagates with a velocity greater than the local speed of
sound, while the boundary information, that is, po, propagates at the speed of sound. As a
result, the expansion is "unaware" of the boundary conditions far downstream of the nozzle,
causing the flow to over expand. The requìrement that the flow adjust to meet the boundary
condition forms shock waves that tend to recompress the expansion.
24

Shock waves consist of regions of large density, pressure, temperature and velocity
gradients and can be thought of as shielding the flow from the background gas, which gives
rise to the isentropic core shown in figure 2.2.Thejet structure, as shown infigure2.2,
consists of a barrel shock surrounding the expansion and a Mach disc shock, pe¡pendicular to
the axis of expansion. The thickness of these shock waves is of the order of the local mean
free path. The region between the banel shock and the jet boundary is complex, consisting of
viscous, non isentropic flow.
Using light scattering ûechniques, Bier and Schmidt (1961) were able to measure the
position of the Mach disc for various expansion conditions. They found that the position of
the Mach disc is given by
(2.2)
This expression exemplifies the general fact that the flow field scales with the nozzle diameter,
dn.
From the work of Adamson and Nicholls (1959), it has been shown that the position
of the Mach disc corresponds to that at which a normal shock is able to raise the local
pressure to the background pressure, p6'
The emer.ging jet can undergo scattering if the background pressure is too high.
However, Campargue (1984) has pointed out a method which uses a very large background
pressure, pr = 0.1 - 1 ton, and a skimmer situated in front of the Mach disc to sample the
isentropic core. Under these pressure conditions the shock wave fronts form an effective
shield between the region inside the banel shock producing an aerodynamic cone of silence.
This method requires the design of special skimmers to limit the formation of additional shock
waves and / or excess scattering. However, the employment of high background pressures
permits large gas flows, and therefore high intensity molecular beams, to be handled with the
use of low speed mechanical PumPS.
By far the most common method of extacting the molecular beam is to lower the
background pressure to a point where the shock wave system does not play a meaningful role.
For example, a chamber pressure pu = 10-3 torr and a stagnation pressure pe =103 torr means
that the Mach disc is located approximately 600 nozzle diameters down süeam. For a 30¡r m
nozzle diameter this implies the Mach disc would be -20mm down stream of the nozzle.
1
^/ = o.et .( b\' .¿/vm - (.pu) ,
25
Similarly, the thickness of the disc would be -25mm, further indicating that within the scale of
the typical apparatus, the continuum shock Structure would not be observed.
While the skimmer location and design is not as critical for this approach, it requires
higher pumping speeds, ie S >100 L/s, to maintain a low background pressure, for moderate
flows. In either case, the molecular beam is obtained by sampling the isentropic core of the
expansion and the properties of the expansion are valid in both configurations.
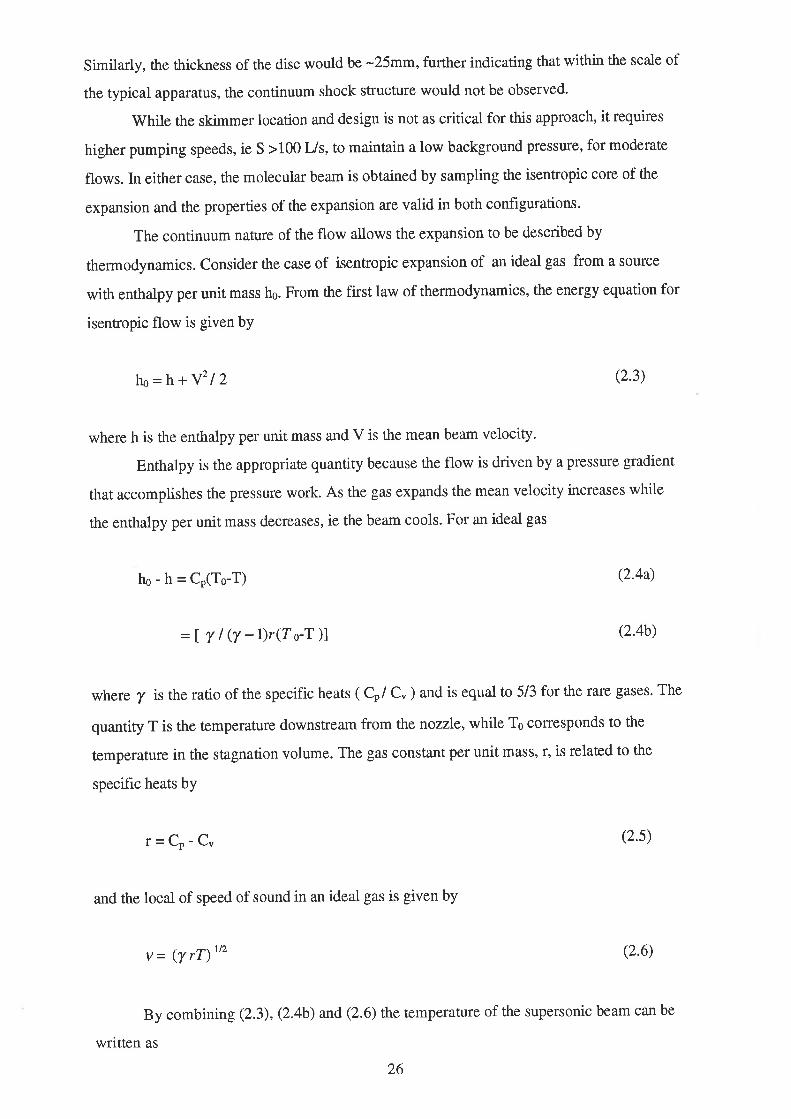
The continuum nature of the flow allows the expansion to be described by
thermodynamics. Consider the case of isentropic expansion of an ideal gas from a source
wittr enthalpy per unit mass ho. From the first law of thermodynamics, the energy equation for
isenffopic flow is given by
tro=h +Y212 (2.3)
where h is the enthalpy per unit mass and V is the mean beam velocity.
Enthalpy is the appropriate quantity because the flow is driven by a pressure gradient
that accomplishes the pressure work. As the gas expands the mean velocity increases while
the enthalpy per unit mass decreases, ie the beam cools. For an ideal gas
ho-h=Cp(To-T) (2.4a)
where 7 is the ratio of the specific heats ( Cp/ C" ) and is equal to 5l3 for the rare gases. The
quantity T is the temperature downstream from the nozzle, while Ts conesponds to the
temperature in the stagnation volume. The gas constant per unit mass, r, is related to the
specific heats by
=lTl(7-l)r(To-T)1
r=Cp-Cu
and the local of speed of sound in an ideal gas is given by
v = (y rT)'''
(2.4b)
(2.s)
(2.6)
By combining (2.3), (2.4b) and (2.6) the temperature of the supersonic beam can be
written as
26

T = To[1+(y -t)M')] -' (2.7)
where the Mach number, M is defîned as V/ v. For an isentropic process in an ideal gas the
pressure is related to the density by
p*p v (2.8)
and using this relation in conjunction with the ideal gas law allows the following relationships
for pressure and density to established.
p = po( | + U-1)M') Y | (r-Y)
p = po( 1 + (y -r)Mr\tt(,Y)
(2.e)
To allow the temperature, pressure and density to be plotted as a function of distance,
the Mach number must be known as a function of position. Ashkenkas and Sherman (1966)
have shown that for a continuous flow gas, and for distances greater than a few nozzle
diameters, the Mach number can be represented by
M=c(x/d')T-l
(2.10)
(2.rt)
where x is the distance downstream from the nozzle and c is a constant that depends only on
the ratio of the specific heats, T . In figure 2.3 the temperature and pressure for a monatomic
gas are plotted as a function of x/do, the dist¿nce measured in units of nozzle diameters. The
Mach number dependence on distance, arising from the expression of Ashkenkas and
Sherman, is also illustrated in figure 2.3.
|t is seen that both the temperature and the beam density fall monotonically with
distånce, whilst the Mach number rises monotonically.
27

1.0 30
V/Vinf in ity
0.8
20
0.6
15
0.410
0.2
0.0 0
10
Distance, X / D
15 20
Figures 2.3: Molecular beam parameters; pressure, p, temperature, T, velocity, V and Mach
number, M as a function of the distance x / d' (after Miller (1988)).
2.2.2 Transition to Free Molecular Flow
Figure 2.3 indicaæs that Mach numbers of any size, or any degree of cooling can be
achieved if the flow is measured suffrcientþ far downstream. However, the assumptions made
in deriving the Mach number equations are an ideal gas behaviour, constant Cn and a
continuum flow. It must be realised that changes in temperature and molecular velocity are
only brought about through molecular collisions. Once these become sufficiently rare, ie once
molecular flow is approached, the beam properties become frozen. It follows that there is an
upper limit on the Mach number, and this asymptotic value is known as the ûerminal Mach
number, M1.
Anderson and Fenn (1965) have found that the terminal Mach number is given by
25
o)-oE
z.E()(d
Fo-E(¡)
.9(oEoz.
5
50
Mr- e(a,th)u-Dtv (2.t2)
where e is a constant, characteristic of the gas and )"0 is the mean free path in the stagnation
volume. In particular, Anderson and Fenn (1965) found experimentally that for argon the
coefficient e = I33, so that for this gas
28

Mr = l33(podo)o'o (2.r3)
The ability of supersonic beams to generate large Mach numbers is worthy of
comment. In particular, does a large Mach number imply a large mean velocity V ? If we
assume for the moment that the total thermal enthalpy associated with the stagnation volume,
ho is converted into the directed flow, then the maximum flow velocity corresponds to
Y'^ol 2 =ho (2.t4)
(2.ts)
(2.16)
where y o is the speed of sound in the stagnation reservoir. For the case of monatomic gases
fy = %) this reduces to
v,n*= Jj, o
=III(T -1)] vo'
T,h,^
The maximum possible velocity therefore does not exceed "ß
ti-.t the speed of
sound and it is apparent that the large down stream Mach numbers do not result from a large
increase in the flow velocity, but rather from a decrease in the local speed of sound v, arising
from the decreases in the beam temperature. This point is emphasised by noting that although
the temperature continues to decrease, the flow velocity reaches a practically constânt value
within the first lew nozzle diameters. For example, the flow velocity of an expanding
monatomic gas is within I7o of. its maximum value within -7 nozzle diameters (see frgure
2.3).Inpractice this means that with a typical nozzle diameter of 30pm the essentially
constant velocity is obtained within 0.3mm of the nozzle.
Another topic of interest is the effect of gas mixtures on the beam velocity, V, in the
continuum flow. Rearranging equation 2.I5 and redefining the ideal gas constant as
r = R / W, where W is the gas molecular weight, gives
V.* (2.t7)
For an ideal gas mixtures it is convenient to define the molar average molecular weight
29

W =>x,.w, (2.18)
where X, is the mole fraction of the iú gas species. If 7 is equal for each species in the
mixture then equation2.!T leads to the result that the mean maximum velocity is proportional
to the reciprocal of the molar average molecular weight.
v2Jr T vw 'y-r'" (2.te)
mÐ(
Thus individual gas species may acquire energy well above or below the average,
depending on their masses. This means that it is possible to accelerate a heavy gas by injecting
it into a light carrier gas or decelerate a light gas by injecting it into a heavier one. If we
neglect any change in the average heat capacity wittr composition, the energy of the individual
species scale as
(2.20)
Since the terminal velocity is reached in the continuum expansion, long before non
equilibrium effects become important, this expression permits researchers to predict the
change in energy of a particular species within a gas mixture. However, it is important to note
that the ideal gas approximation, which implies that y is constant as a function of
temperature, may produce inaccuracies. For real gases y will.vary during the expansion as
the temperature drops by several orders of magnitude.
Throughout this discussion of supersonic molecular beams, the influence of unwanted
collisions with background molecules or jet molecules scattered from the skimmer is ignored.
The effect of these collisions is to reheat the beam by broadening the velocity distribution.
Similarly, condensation to form clusters will also cause local heating of the beam.
Toww
E
30

2.3 Cluster Generation
The ability of supersonic molecular beams to produce very low temperatures makes
them an ideal vehicle in which to investigate the nucleation process.
If we assume a source temperature of 300'K then from the curves of figure 2.3 at a
distance of, say, l0 nozzle diameters, the temperature has fallen by about 291'K. For a nozzle
diameær of 30pm (where )ddo = 10 corresponds to a distance of 0.3mm) and a typical
molecular velocity of 5x1Oacm/s, the temperature drop has occurred in about 6xl0-Tseconds.
This means that the cooling rate, over this length, is -5 x10⁸ Ks-r and it is not surprising that
these enormous rates of cooling will lead to supersaturation and the formation of clusters.
For clusters to form, molecules must undergo collisions. However, once formed,
further coltsions may result in disintegration. Therefore clusters will be effectively generated
only in a certain small region, along the length of the beam, where the collision frequency is
moderate. Since the flow field scales with the diameter of the nozzle (Levy (1980a,1980b) or
Miller (1988)), the numerical length of this region of cluster generation increases with nozzle
diameter, so that one expects the cluster yield to increase with dn, which is found
experimentally to be the case.
To a limited extent, the degree of condensation can be controlled by altering the
conditions of expansion through changes innozzLe geometry and / or variations in the
stagnation pressure Po and the nozzle temperature T0.
2.3.1 Empirical Scaling Laws
The difficulties associated with obtaining useful models for cluster generation has
forced experimentalists to employ scaling laws to correlate the outcome of different
experiments. The literature contains numerous examples of such scaling laws, in particular,
empirical laws for obtaining the same dimer concentration for changes in one of the source
parameters (pressure, temperature or nozzle diameter), for example Andres (1968)' Golomb
et al (1972) or Ng (1983).
One of the most useful discussions is provided by Hagena (1981), who gives scaling
laws for the production of cluster beams with a constant size distribution fol varying source
parameters. Hagena considered cluster growth in a small element of axial length dx of the
continuum flow, where the temperature decreases by dT in a time dt.
31
T T-dT
I
v=:l
x+
{- dx
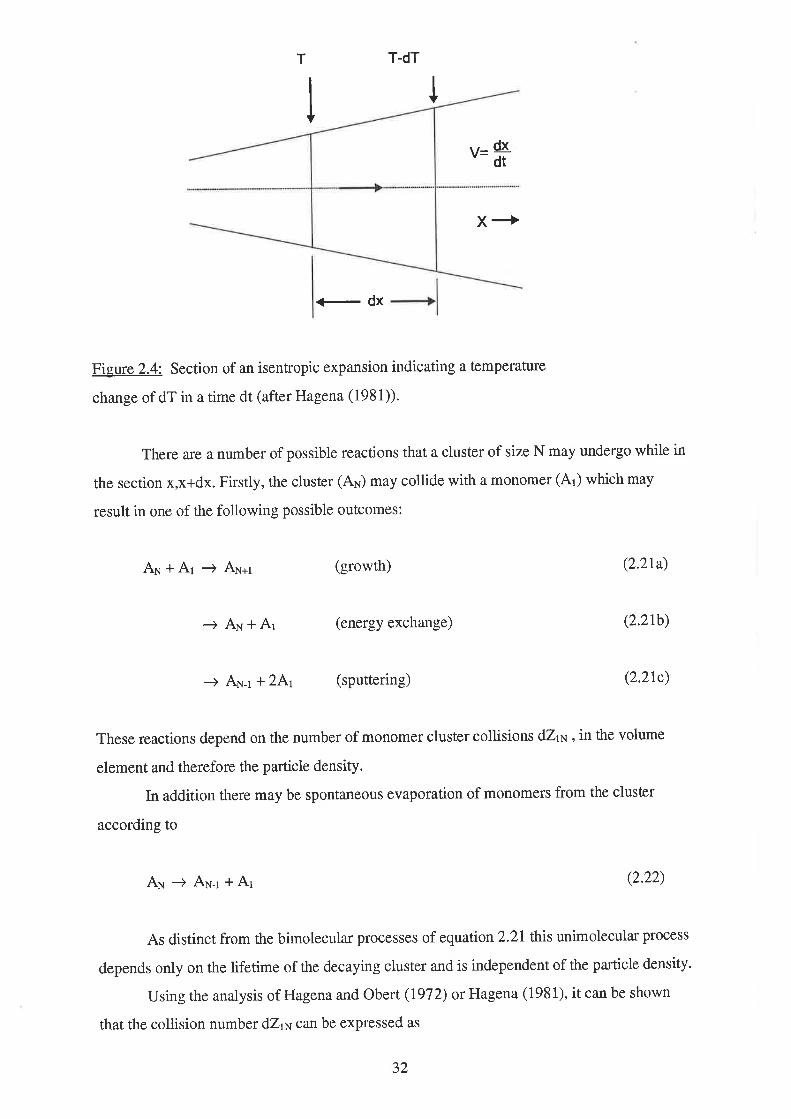
Figure 2.4: Section of an isentropic expansion indicating a Ûemperature
change of dT in a time dt (after Hagena (1981)).
There are a number of possible reactions that a cluster of size N may undergo while in
the section x,x+dx. Firstly, the cluster (A¡) may collide with a monomer (Ar) which may
result in one of the following possible outcomes:
Au+Ar I AN*t (growth) (2.21a)
ì AN + Ar (energY exchange) (2.21b)
ì Au-r +2At (sPuttering) (2.21c)
These reactions depend on the number of monomer cluster collisions dZw , in the volume
element and therefore the particle density.
In addition there may be spontaneous evaporation of monomers from the cluster
according to
AN I AN-r*Ar (2.22)
As distinct from the bimolecular processes of equation 2.21this unimolecular process
depends only on the lifetime of the decaying cluster and is independent of the particle density.
Using the analysis of Hagena and Obert(1972) or Hagena (1981), it can be shown
that the collision number dZrN can be expressed as
32

dZt* n no'dn'To2-y/2(y-t) (2.23)
where no afld To âro the source gas density and the nozzle temperature respectively. Similarly
the transit time dt can be expressed as
dt n d,.To2-rr2(Y-r) (2.24)
The number of collisions dZrrq is independent of the mass of the gas molecules,
reflecting the fact that the higher velocities of the lighter gas species are compensated for by a
corresponding shorter transit time across the element x, x+dx.
It follows from equations 2.23 and2.24 that more condensation into clusters will
occur if the stagnation densit! nç or the nozzle diameter is increased, or if the stagnation
temperature is lowered.In practice the available pumping speed and the maximum tolerable
background pressure place limits on how far the stagnation pressure or the nozzle diameter
can be increased. The product of the pumping speed ,1, in litres per second, and the
background pressure Pris known as the nozzle throughput t. The throughput can be related
to both the stagnation pressure and the nozzle diameter, after Miller (1988), by
(2.25a)
where the chamber temperature T" is normally assumed to be the room temperature and the
nozzlediameter is expressed in cm. The constant C is a function of the gas and has the units
of litres.cm-2.s-1.
To obtain a feel for the practical limits to which po and do can be increased, consider
an argon molecular beam entering a chamber that is evacuated by a roots blower with a
maximum pumping speedl of 2000Vs. H we place an upper limit of 2Omtorr on the chamber
pressure, the maximum throughput that can be tolerated is equal to 40tonVs. Now for a
nozzletemperature of 300'K and using the value of C = 14llcm2s for argon, from Miller
(1988), this results in
I This appears to be a good value for the maximum pumping speed achievable by a commercial roots blowerõõJJ
ø=,î ,,=r(+) ,tr po dn'

Po'dn(2.zsb)
C
which for T"=10 reduces to
Po'd,'=286 (2.26)
If we take a typical nozzle diameter of, say 20¡tm, we arrive at a maximum stagnation
pressure of 7.15 x LgTtorr or approximately g4Oatmospheres. Conversely, if we assume a safe
maximum stagnation pressure of, say l0atorr, the nozzle diameter must be less than -53pm.
By considering the parameters in equations 2.23 and2.24, together with the flow
conditions that will result in constant condensation, Hagena (19S 1) anived at a set of scaling
laws that show how the source parameters must be varied if a constant cluster distribution is
to be obtained. For example he has demonstrated that similar conditions for condensation
exist for source states for which, at d'=constant,
PoToo =cottst(2.27)
where q is in the range
(r.5y-1)/(1-T) < q < Y t(r-Y)
For the case of the rare gases this range reduces to -512 <r < -914. These limits imply a
naffow band of source states from which the same cluster distribution will be maintained.
That is, if the nozzle temporature is to be increased, for fixed do, and the cluster distribution is
to be unchanged, then the stagnation pressure must be altered according to eqtation2.27.
Changes in the nozzlediameær lead to changes in the transit time dt. Smaller nozzles
cause shorter transit times, ie a faster expansion, which is not favourable for condensation.
For fixed po and To, cluster sizes tend to increase for increasing dn. This means that either po
or T6 reQuire a coffesponding adjustment to produce beams with the constant condensation
conditions. Hagena has shown that constant condensation conditions will exist if the '
stagnation pressure and the nozzle diameter are changes according to
Í.7,2
T"
E1 3oo
po d,a = const
34
(2.28)

whereQisavaluethatliesintherange0<Q<l.ExperimentalresultsindicatethatQis
restrictedtotherange0.5<Q<landinthecaseofafgon,Q=0.Swasfoundtobeareliable
fit.
So far the discussion has been limiæd to the effect of collision number and the transit
time on the condensation conditions. However, scaling laws for different gases must consider
those gas specific properties that influence condensation. For example, the outcome of
bimolecular collisions will depend on the interatomic poûential, which in turn will determine
the boiling point and the heat of condensation.
In the case of the rare gases, the boiling point has a dramatic effect on the formation
of clusters. That is, the lower the boiling point, or the more ideal the gas, the smaller the
efficiency at which cluster are formed. Experiments under identical source conditions have
verified that the nucleation rate increases in the order: Ne : Ar : Kr : Xe (see Hagena and
Obert (1972) and Hagena (1981)).
As a consequence the same cluster distribution at source temperature Te, implies that
the stagnation pressure for neon has to be raised tenfold over that for xenon.
2.3.2 Kinetics of Dimer Growth
Several researchers have attempæd to correlate dimer measurements with nucleation
models, based on dimer formation in a free jet expansion (for example, Golomb et aI (1972),
Milne et a1(1970)). V/hite fragmentation places doubt over the usefulness of these models, a
discussion of the basis on which these models are formed, is enlightening.
The formation of a dimer can be described by a two step mechanism in which a binary
collision produces an orbiting intermediate state which is stabilised by a collision with a third
body. This second collision is required to remove the heat of condensation from the dimer,
and constitutes the majority of the collisions involved in the recombination process. This
process, for the case of argon, can be represented by the reactions
Ar+ ArK t,K ,t Arr.* (2.29a)
Ar, * ArAr + Arr*K z,Krz
35
(2.29b)

where Krr, Kr and Ktz, Kz are the forward and reverse reaction rates for reactions 2.29a and
Z.2gbrespectively. To simplify the analysis to two rate parameters, reactions 1 & 2 are often
approximated by the over atl ttrird order rate equation,
k (2.30)Ar+ Ar+ Ar Ar, + Ar
with kr and k the forward and reverse reaction rates respectively.
Assuming that an equilibrium rate constant can be relaæd to the forward and reverse
reaction raûes, ie assuming reaction (2.30) is reversible at the microscopic level the rate
equation
k,
(2.3t)
is obtained. Here n* ând rr¿ âro the argon monomer and dimer mole fractions respectively, V
is the flow velocity that relates the axial distance, f and the time. The equilibrium constant
is defined as
kKq k
(2.32)
and the forward reaction rate, kr, is taken as the termolecular collision rate constant, after
Frost and Pearson (1963), and given by
k= B.nt''.õo4.çkf I *)'''.le-Et.r cm6 molecules-'sec-t (2.33)
where o is the collision diameter, ô is the approach distance of the three molecules, T is the
temperature, m is the mass of the molecules, I is a steric factor, and E is the activation
energy. Golomb et al (1972) obtain for argon,
kr = 3 x 10-33 Trt' cm6 molecules-2sec-l or with T=300'K
dflor^ kr. ^
nAr"nAr-
T-7Lrt-ar Tt
r
kr= 5.2x 10⁻³² cm6 molecules-'sec-t
36

The dimer mole fraction at any point in the expansion is obtained by stepwise
integration of equation 2.31 with the appropriate choice of the parametefs, V, T, n¡¡ and Çq.
The flow velocity, V and the beam temperature, T can be obtained from the continuum
expansion expressions presented in section 2.1. Similarþ, the monomer mole fraction, flnr âS â
function of axial distance is known approximately from the molecular beam intensity
expressions of Anderson and Fenn (1965).
The most diffrcult parameter to deærmine is the equilibrium constant, Kq, as it
depends strongly on temperature. In the analysis of Golomb et al (1972), the Kq values
obtained from the statistical treatment of Stogryn and Hirschfelder (1959) have been chosen,
while Milne et al (1970), not satisfied with the Stogryn and Hirschfelder data at low
temperature, have calculated their own. Using dimer energy levels obtained from solutions of
the Schrodinger equation, with the dirner potential approximated by the Lennard-Jones
potential, Milne and co-workers calculated partition functions of the dimer. From these
functions they arrived at temperature dependent Kq values for use in equation 2.31.
In the s¿rme way that the continuum expansion is viewed as extending to a distance,
afær which the flow is taken to be molecular in nature, dimer formation is only possible while
the frequency of binary collisions is high. When the flow becomes collisionless dimer
formation ceases and a limiting dimer concentration is reached. This limiting concentration,
É'- i, calculated by using the flow parameters corresponding to the point at which the
terminal Mach number is reached. This approach neglects the evaporation of monomers
occurring afúer molecular flow is reached and the effect of collision induced dissociation
arising from background molecules. The results of Golomb et aI (1972) are displayed in figure
2.5 for the case of dimer formation in an argon beam.
37
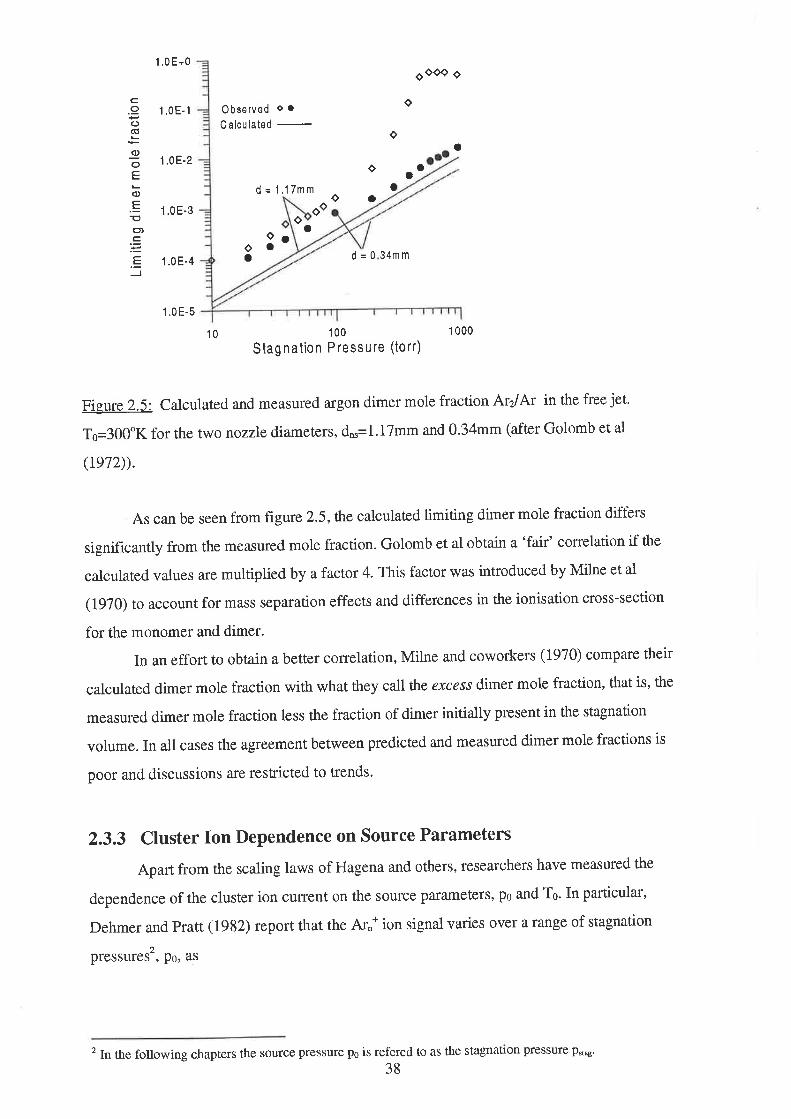
1.0E+0OOOO O
1,0E-1 0bserved o ¡C alcu lated
o
1.0E-2
d = 1.17mm
1 .0 E-3
1.0E-4
1.0E-5
10 100 1 000
Stagnation Pressure (lorr)
Figure 2.5: Calculated and measured argon dimer mole fraction Arz/Ar in the free jet.
To=300"K for the two nozzle diameters, d*=1.17mm and 0.34mm (afær Golomb et al
(te72)).
As can be seen from figure 2.5, the calculaæd limiting dimer mole fraction differs
significantþ from the measured mole fraction. Golomb et al obtain a'f.air' correlation if the
calculated values are multiplied by a factor 4. This factor was introduced by Milne et al
(1970) to account for mass separation effects and differences in the ionisation cross-section
for the monomer and dimer.
In an effbrt to obtain a better conelation, Milne and coworkers (1970) compare their
calculated dimer mole fraction with what they call the excess dimer mole fraction, that is, the
measured dimer mole fraction less the fraction of dimer initially present in the stagnation
volume. In all cases the agreement between predicted and measured dimer mole fractions is
poor and discussions are restricted to trends.
2.3.3 Cluster Ion Dependence on Source Parameters
Apart from the scaling laws of Hagena and others, researchers have measured the
dependence of the cluster ion current on the Source parametefs, Po ând To' In particular,
Dehmer and pratt (1982) repoft that the Aro* ion signal varies over a range of stagnation
pressures', po, as
2 In the following chapters the source pressure p6 is refered to as the stagnahon presSUre pstag'
38
a
tI
d=034mm
o
oo
aooo
Oo
O¡ao
a
c.9(J(ú
(¡)
oEo)
.EE(t,c
.EJ

(2.34)
1 E+3ArZ --- Ar
+4
1E+2 At3 \ Arô
1E+'l
Ar-c
10 100
Stagnation Pressure (ATM)
Figure 2.6: Dependence of the Aro* ion cunent on stagnation pressure (after Dehmer and
I or, n Poo'
where the values of g", are listed in table 2.L andtheir ion currents are shown in figure 2.6.
n ü"t
1 1
2 2.r
3 t2.I
4 16.2
5 1 8 1
6 18.5
Table 2.1: Exponents values for the power law dependence of Ar"* with Po (after Dehmer
and Pratt (1982)).
For n larger than 6 the exponent is so large, and the gap between successive clusters too small
for the power law fit to be of any use.
1 E+5
1 E+4
+I
+
oco(Jc)U)(ncJ
o(J
=U)co)cco
+
+
1
Pratt (1982))
39

From hgure 2.6 it is seen that with increasing cluster mass the curves become
progressively crowded, but one can find a pressure region in which, in addition to monomers
there are only dimers and no appreciable amount of trimers. Preparation of a beam conøining
only monomer,dimer and trimer is more difficult because the tetramer and larger clusters are
observed at stagnation pressures only slightly higher than that for trimer detection. Similarly,
preparation of beams containing only clusters smaller than the pentamer or hexamer, by
judicious choice of the stagnation pressure' is impossible'
Van Deursen et al (1975) measure similar exponents for the monomer and dimer,
however, the values of o¿,, for n>2 are a factor of 2 to 3 lower. Comparisons of power law
dependencies is complicated, since the values of ø o may depend on the orif,rce diameter and
the cluster size. Dehmer and Pratt found that a small change in the nozzle diameter of less
thanZ¡Vo displaces the Ar"* curves in figure 2.6 to larger stagnation pressures. This is
consistent with the scaling laws of Hagena and Obert (1912). However, for large changes in
the nozzle diameter, not only are the Aro* curves displaced to larger pressures? but the power
law dependence is altered, resulting in new values of oq'.
Al1 of the curves show a similar trend; from onset there is a region of linearity ,where
the power law approximation may be applied, and as the stagnation pressure increases the
graphs become non linear as some of the mass flow is diveræd to clusters of larger size.
The similarity of the values of ot, for clusters larger than the trimer and the fact that
these clusters appear within a relaúvely small range of stagnation pressures indicates that the
rate limiting step in cluster formation is the three body process by which dimers are formed,
with larger clusters being built up from dimers by two-body collisions. However, the presence
of fragmentation makes it extremely difficult to interpret the results in terms of neutral cluster
concentrations.
By observing the photoionisation of an Ar beam as a function of ttre stagnation
pressure and wavelength, Dehmer and Pratt (1982) were able to investigate certâin aspects of
the fragmentation process. At high stagnation pressures, where large cluster ions could be
detected, they noticed a signif,rcant change in the magnitude and energy dependence of the Ar:
photoionisation cross-section. The change reflected the fact that at high pressures the
dominant mechanism for trimer formation was via dissociative ionisation of larger clusters. In
order to obtain the 'true' trimer photoionisation relative cross-section curve, it is necessary to
minimise the amount of heavier clusters in the molecular beam.
The power law dependence of Arn* on the stagnation pressure is alæred, not only by
changes in the nozzlediameter, but also by changes in the source temperature and the nozzle-
40

skimmer distance. The cluster ion signal has also been found to show a power law
dependence on the source t€mperature, given by
I n To_u, (2.3s)Ar,
and like the stagnation pressure, this dependency is difficult to measure fol cluster larger than
the trimer. Table 4.g of chapter 4 lists the values of B. for Arn* measured during my work.
Since the formation of higher clusters leads to deviations from linearity, the use of
power law approximations allow researcherc to find regions where reliable dimer readings can
be recorded without undue distortion from the fragmentation of larger clusters. Similarly, the
approximations permit interpolation or extrapolation of the dimer measurements.
4T

2.4 Ionisation and Detection
To facilitate the study of clusters, there must exist a suitable means of deæction, and
given that it is not possible to produce clusters of a specific size or at a known number
density, the detection mechanism should allow clusters to be separated according to their size.
The most popular way in which this is achieved is via cluster ionisation and detection within a
mass spectrometer. The detector consists of an electron or photon source which ionises the
cluster beam, a mass filter for selecting ions on the basis of there mass to charge ratio and an
ion detector.
Since this work employs an electron source for the generation of cluster ions the
discussion will be limiæd to electron impact ionisation'
The use of mass spectrometers permits investigation of cluster ion properties ( ie
appearance potential, binding energies, stability, etc) as a function of the number of
constituents. However, the ability of ionisation and mass spectrometry techniques to aid in the
study of neutral cluster properties is severely limited by the many processes that may be
induced by the ionisation event. Hence, a quantitative understanding of the ionisation process
is necessary for the clust€r ion mass spectra to be unambiguously related to the neutral cluster
distribution.
2.4.1 Electron ImPact Ionisation
A simple means of ionising neutral clusters is through electron bombardment. If the
energy of the electron colliding with the cluster is greater than a critical value,
( appearance potential ) ionisation of some of the clusters will result. Increasing the energy of
the incident electron increases the number and variety of ionised species. That is, more
channels become accessible at higher electron energies. For example, ionisation of a raro gas
dimer, Rz may result in one of the following reactions ( after Mark(1987));
42

These reactions reflect electronic transitions occurring within the dimer. The transition
probability for each can be described in terms of the Frank Condon principle, allowing in
principle, a description of the ionisation process'
The first three of the above reactions are single step, direct ionisation processes'
where as the subsequent reactions can be viewed as two step processes'
Figure 2.7 is taken from Märk (1987) and illustrates the time evolution of the various
ionisation processes. It follows from this, that the cluster ion mass spectra may be dependent
on the time window, following ionisation, due to the presence of multi step or metastable
processes
0-16 10-t, 10-8 tO-s seconds
Rr* e +Rr* +2e
-) Rrt* + (Z+1)e
+A+ + R+2e
Single lonization
Multiple Ionization
Dis s o cíativ e I onization
Autoionization
Pr edissociation
Metastable Decay
Autoionization
Coulomb Explosion
A"- + hv
A-* + A**
A-2*+ A"
l Rr* +e +Rr* +2e
+R+R+el Rr** *2eè R* + R+2e
+ Rr* +3e
- Rr'** *3e) R* + R* +3e
A-- + A*
Ao-
evaporative stabilisationdissociative capture
resonance capture
fluorescence
autoionisation
i A,+hv
Ao'+e i 4..* A"+e
A-+A." predissociation
A.+ef (A-)i- A."*+2e parent ionfragment ionmetastable ion
Aor* + A"A-* + A"
4,2* + 3e double ionisationCoulomb explosionmetastable decaY
A^*+ A**+ A,rÀ i- ,^y
i
evaporative søbilisation
Fígvre 2.7: Time evolution of electron - cluster ionisation processes (after Mark (1987))
43

Ionísøtíon Effíciency
Determination of the ionisation efficiency is, in concept, a rather simple process. A gas
with a known number density N,, is bombarded with an electron beam of known energy,
cunent L and path length L (see figure 2.8) and the resultant ion current is given by
(2.36)LNoIr=1" e
where O, is the total ionisation cross-section and e is the charge.
Target Gas Nt
Ll Electron Trap
ElectronBeam le
Lens
IOn
lon Collector
Fi_eure 2.8: Schematic diagram of the experimental set up used to measure ionisation cross-
sections
Measuring the ion and electron cuffent as a function of the incident electron energy
allows the total ionisation cross-section to be deærmined. Since they involve monatomic
gases only, ionisation cross-sections of the rare gases (see Tate and Smith (1932), Rapp and
Englander-Golden (1965), Märk (1975), Stephan et al (1980), Krishnakumar and Srivistava
(1987)) have been measured far more thoroughly than many other species3.
If a mass spectromoter is incorporated into the experiment, paftial cross-sections can
be measured. For example, the cross-section for double ionisation of argon,
e + Ar + Ar2* + 3e could be determined by collecting only Ar2*. For a multiply ionised
particle with mass m and charge Z.e, the cunent I-7 is given by
3 It is worth noting that while ionisation cross-sections of the rare gases have been measured extensively over
the last 6 decades these measurements are still a topic of investigation today. See Märk and Dunn (1985) for a
series of excellent review articles on electron impact ionisaúon'44
+

I^z=Iø ZeorN,L (2.37)
where o, isthe partial cross-section for multþIe (Z) ionisation. The total cross-section is
related to the partial cross-sections by
6, =\6, Z (2.38)
Z
For a stationary gas, the number density is determined by measuring the pressure at a
given temperaturc, while the electron path length can be defined by the geometry of the
interaction cell. However, the study of clusters presents some additional difficulties. Firstly,
the stationary gas is replaced by a molecular beam and an accurate estimate of the number
density is more difficult. Even harder is estimating the interaction volume in which ions are
generated. The electron path length through the molecular beam will depend on the diameter
of the molecular beam and the beam divergence. These properties may depend on the source
parameters and to a lesser extent, on the gas. It is customary to calibrate the system with a
gas for which the cross-section is well established, ie helium in the work of Krishnakumar and
Srivastava (1988).
Energy Dependence of the lonísatíon Cross-sectíon
In the quantum theory of electron-atom collisions the incident electron, travelling
along the z-axis, is taken to be a planar de Broglie wave of angular momentum I and
wavelength
h (2.3e)2L e ffi"'1"
where m" and ve are the mass and the velocity of the electron. The incident wave is considered
to be scattered by an atom which rcpresents a centre of force whose potential falls off sharply
with distance, thus forming a 'well'. In the scattsring process an outgoing spherical wave is
presumed to arise at the scattering centre, and as in the theory of light, the amplitude of the
wave at a distant point is found by taking the sum of the amplitudes of the wavelets, allowing
for the phase changes which occur at the scattering obstacle (von Engel (1965)). The phases
have to be corrected for the polarisation caused by the displacement of the atomic electrons
45

with respect to the nucleus. Massey and Burhop (1952) have shown that the total collision
cross-section (in cm2) is given by
" " = þ\lru +1) sin2 4,
(2.40)
where l is the orbit¿l angular momentum quantum number and nr is the partial phase shift
between the scattered and the incident wave, which is a function of the electron energy Er and
the square of the wave number k.
Solutions to the scattoring problem primarily involve calculating the phase shifts, and
when these are small the cross-section will on the whole be small, since it is usual for only a
small number of phases to contribute ( Hasted (1964)). The maximum cross-section will arise
when the phase shift is an integral multiple of æ12, ie the wavelength of the electron is
comparable to the size of the atom. At the lowest impact energy it is only necessary to
consider the zero order phase shift, with 1= 0.
At high energies it is possible to fînd an expression for the phase shitis, using the Born
approximation, where the distortion of the incident electron waves by the atomic field is very
small, and may be treated as a small perturbation. The Born (1926) approximation holds when
the electron energy is large compared to the energy transferred in the ionisation or excitation
process, and in some instances it can account for the general features of the cross-section at
low impact energies, see chapter three of Massey and Burhop (1952).
It can be shown (Massey and Burhop (1952)) that for optically allowed transitions,
including ionisation, the cross-section for transitions from the ground state to the n-th state
can be approximately writtena as
oon =H-Vo^l'rog(b,) (2.4r)
where E is the electron snergy, e is the electronic charge and b is a constant that depends on
the energy difference of the levels involved in the transitions. (o' is proportional to ths
probability that a transition will occur between the two statos.
At high impact energies the cross-section falls-off as E 1 log E provided that (0" does
not vanish, ie for transitions that are optically allowed. If (0" is zero, ie for optically forbidden
o Usiog the simplif,rcations of Bethe (1930).
46

transitionss, the decrease at high impact energies becomes even faster, being proportional to
E-t.
These approximations are very convenient for impacts with small fractional loss, but
they are not correct when a considerable fraction of the incident energy is lost, ie at energies
near threshold. Experiments have shown that at low energies the Born approximation over-
estimates the ionisation cross-section by a maximum factor of about 2, see figure 2.9, but that
it is valid when the electron enefgy exceeds 7 times the ionisation energy. However, the
variation according to E-llogE only holds in a much higher range, see figure 2.10.
0.6
0.5 easured
0.4
C\¡ o(ü
Fat,
=C=
c.o(6
..t)C,o
ö-
0.3 Calcu lated
0.2
0.0
50 250
Figure 2.9: Comparison of measured (solid tine) and calculated (dashed line) ionisation
cross-sections for helium (afær Massey and Burhop (1952)). The cross-section is given in
units of nao2 where ao is the radius of the first Bohr orbit.
Good agreement is found between the calculated and the measured argon ionisation
cross-sections for electron energies greater than -1KeV.
5 Although these transitions correspond to a zero electric dipole moment, they may take place through a non-
zero magnetic quadrupole moment (see Herzberg (1967)).
47
01
0 100 150 200Electron energy (e.V.)

ì.-.- E Los (E)(t)
=c.=
_o(õ
c.oC)(I,u,at,at,o(JLo(ú
.u)co
100
Measured
10
1
't0 1 0000
Figure 2.10: Measured argon ionisation cross-section (after von Engel (1965)), and the
cross-section predicæd on the basis of the E-lLog(E) approximation. The calculated cross-
section is normalised to the measured data at an electron energy of 10aeV.
The physical significance of the departure from Bom's approximation at small impact
energies is explained by Massey and Burhop (1952). The basic assumption on which the
approximation is based is that there is only a weak interaction between an incident electron
and an atom so that the chance of a transition occurring in the atom during an impact is very
smal1, such that the chance of two such transitions can be neglected. If, however, the incident
electron is moving slowly so that it spends a considerable time in the neighbourhood of an
atom, the chance of two transitions occurring during the collision can not be ignored.
If the possibility of double collisions is allowed, then Massey and Burhop (1952)
postulate that it is possible that competing elastic processes will lead to an inelastic scattering
cross-section that is smaller than that predicæd on the basis of Botn's approximation, since
A rcnlcollísíon = A "l^ti"
* O in"torti"'
100 1000Electron energy (e.V.)
48

Threshold Behavíour of the lonisøtíon Cross'sectíon
One area attracting considerable attention6 is the study of the threshold behaviour of
the ionisation cross-section for atoms and molecules, ie a near threshold study of the variation
of the ionisation cross-section with electron energy'
The ionisation cross-section function is expected to be zero when the impact energy
E¡ is equal to the ionisation energy Ei, ând it has been postulated (Wannier (1953)) that the
cross-section for the formation of ions withzcharges should follow ann.Zth power law of
the form
or-(Er-E,)n'" (2.42)
where Er and Ei âfe the incident electron energy and the ionisation energy respectively. A
number of theoretical analyses, for example Wannier (1953, 1955), has put the value of n in
the range between 1 and 1.5.
A number of researchers have checked the threshold behaviour of the ionisation cross-
section for a number of molecules, and found good agreement between measured and
predicted appearance potentials, see for example, Dibeler and Reeese (1959), Dorman and
Morrison (1961) and Kim et al (1981).
The accuracy of the initial threshold studies was restricted by the thermal ensrgy
distribution of the thermionic sources used to ionise the target gas, setting a limit on the
resolution of the order of 0.2ev. However, the use of electron monochromators, with their
reduced energy spread has improved matters significantly.
An inherent difficulty associated with the use of electron monochromators stems from
the fact that electrons which are intercepted by the monochromator walls, ie those at energies
other than that to which the monochlomator is tuned, have a ceftain probability of being
transmitæd by the electron monochromator. This is due to the large reflection coefficient of
slow electrons and it is only through the use of very rough surfaces. such as carbonised or
platinised metals, that the reflection coefficient can be reduced to the order of 20 percent
(Hasted (1964)).
Marmet and Kerwin (1960) were able to minimise electron reflections within a'I27
degree analyser' by using high transmission cylindrical grids in favour of the usual cylindrical
electrodes, and as a result they obtained an energy spread of 0.04eV. With this improved
energy resolution Marmet et al (1975) wefe able to confirm that the ionisation cross-section
6 See for example, walsredt and Bell (1987), rilorsnop et al (1984), Ma¡k (1980) and Andersou et al (1980)'
49

for doubly charged rare gases can be approximated by n.z = 2, predicted on the basis of
eqtation2.42.
So far I have assumed that the gas is composed of only one molecular species;
however molecular beams will usually contain a distribution of cluster sizes, and the relative
concentrations of the various species will not be known. Therefore only limited ionisation
cross-section data on cluster beams is available, see for example Helm et al (1979), Buck and
Meyer (1984, 1986,1988).
2.4.2 Approaches to lon Extraction.
The main condition to be met when determining ionisation cross-sections, is to assure
that as the electron energy is varied, either the total number of ions folmed or a constant
fraction thereof are collected. The most common means to bring this about is to use a large
ion extraction potentials ( - lkv ) to withdraw all of the ions, regardless of the electron
energy.
While total ion collection is advantageous, this method has its drawbacks. In
particular, large poúentials will deflect the electron beam, thus creating an ionisation volume
that is electron energy dependent. The second difficulty arises from the fact that the extraction
potential affects the space potential in the ionisation volume, that is, the final electron energy
at the point of ionisation may differ from the nominal value significantly, causing a substantial
displacement of the appearanco potential.
Frequently extraction is at right angles to the molecular beam axis and the above
problems are overcome by employing a pulsed extraction technique where the electron source
is pulsed and an extraction potential is applied only during the off cycle. This allows total ion
collection with out disturbing the potentials within the ionisation region.
My approach was to extract along the axis of the molecular beam using a small
potential of only -15v, allowing the particles to exit from the ionisation region under their
own momentum. The fact that in this method the ions move at thermal energies over a
significant distance necessitates some care in the design of the ionisation region and the
extraction configuration. In pafticular, charge accumulation on the walls of the ionisation
volume and extraction electrodes, can disrupt the ion beam. ( see chapter 4).
This approach is simple, avoiding the need for pulsed high voltage power supplies and
proved to be reliable in practice.
50

2.4.3 Comments on Fragmentation
The expressions for the ionisation cross-section, presented so far, do not cater for
ionisation induced fragmentation. For a neutral cluster of size n, which fragments to a smaller
cluster ion of size k, the equation coffesponding to 2.36 is
1,,*=I"Nnef,,oonL (2.43)
where f ,,0 is the probability of fragmentation. Several attempts to quantify the relative
concentration of neutral van der Waals clusters have revealed substantial fragmentation
effects, for exampleLee and Fenn (1978), Helm etal (1979), Gough and Miller (1982) and
Buck and Meyer(1984).
Two factors are essentially rcsponsible for fragmentation, an intrinsic factor, the
occuffenco of lalge geometrical changes upon ionisation, and an extrinsic factor, the role of
excess energy in the various ionisation techniques employed. The ground state configuration
of the neutral cluster defines a Franck - Condon region of highest transition probability. If the
minimum energy geometry of the neutral and ionised clusters differs greatly, then the vertical
transition will result in the formation of clusters ions with a large excess vibrational energy. A
good example is provided by Ar3, where the geometry of the neutral túmer is triangular and
the geometry of the trimer ion is linear. The vertical transition implies that the trimer ion is
formed in an upper vibrational level, which may lead to dissociation of the trimer. The
unstable nature of the trimer ion is reflected by the fact that Buck and Meyer (1984) have
measured a fragmentation probabi]iry .f ,, = 1 for ionisation of Ar3.
A good description of ionisation induced fragmentation of rare gases is provided by
Haberland (1985) who explains the time evolution of a rale gas cluster ion. Ionisation, which
takes place at time to, results in the formation of a delocalised hole that is not attached to any
one atom, rather the hole hops between atoms. After -10-12 seconds, the hole becomes
localised and a dimer ion is formed, Rz*. The formation of a dimer ion is most favourable due
to the deep well in the R2* potential wells, which for argon is -1.23eV. HoweveL, the dimer
ion is formed with considerable excess energy due to the constraints imposed by the Franck-
Condon transition. This excess vibrational energy, of the order of leV, is distributed
throughout the cluster causing the cluster temperature to rise. As in the case of neutral
clusters in the free jet expansion, the hot cluster ions cool by sequential evaporation of
monomers
51

The occurrence of magic numbers in the mass spectra of the rare gases can be
interpreted as the formation of stable structures around the dimer ion. After about 10-8
seconds the cluster has released the heat of formation of the dimer ion and further
evaporations will stop, except in the case of metastable decay.
2.4.4 Detection of Metastable Ions
It will be noticed in figure 2.7 that a number of processes involve metastable clusters
ions. Although metastable clusters aro not dealt with in this work it is appropriate to mention
that experiments on these arc usually performed with a multistage mass spectrometer. Here a
magnetic sector field ( normally 900 ) followed by an electric sector field or time of flight
specíometer can be employed. A field free region is located before each of the two analysing
regions. Often the length of the field free regions may be varied so that the time window over
which the spectrum is recorded can be alæred.
The principles of tandem mass spectrometry are well illustrated by the work of Märk
(1982) who employs a magnetic sector preceding an electric sector field.
Consider an ion, m1+that decays in the first field free region, which lies in front of the
magnetic sector field, according to
mt*lm2++m3 (2.44)
1where the initial kinetic energy m,V' is equal to the sum of the energy of the fragments, ie
12
2
.V' .(m, * *r). The daughter ion mz* will continue to move along with the same original
velocity and according to Cooks et al (1973), these daughær ions will be transmitted through
the magnetic spectrometer with an apparent mass m*, where
m
2m1*- -t?r1
(2.4s)
This metastable peak would appear in the mass spoctra if the magnetic sector field was
used independently. However, the incorporation of the electric sector field, which is tuned to
the main accelerating voltage V, eliminates this peak from the mass spectra, since it only
transmits ions with an energy qV, ie the initial accelerating energy.
If the magnetic analyser is tuned to m*, then the m1+ ions decaying in the first field free
region, will be detected if the voltage across the electric sector is changed to V*, where
52

mr.v(2.46)
Similarly, to look at the decay in the second field free region, which lies between the magnetic
and electric sectors, the magnetic sector field is tuned to mr+, while the electric sector field
remains at V*.
This approach has the benefit of separating the peaks due to decomposition within the
two field free regions, from the conventional or unfragmented mass spectrum. Moreover, it
permits the metastable decay of size selected cluster ions to be studied.
V* IT\
53

2.5 Conclusion
This chapter has reviewed a number of topics relevant to the study of rare gas dimers.
While the fact that supersonic molecular beam can produce clusters has been known for
several decades, a general theory representing the growth and decay of van der Waals cluster
is currently not available. This is directly related to the difficulty in describing the flow
parameters in the transition region between the continuum and free molecular flow. In
addition, the measured data are distorted by ionisation induced fragmentation. To a limited
extent this has been over come through the use of empirical scaling laws which allow the
condensation conditions to be related to the source parameters po and To.
A better understanding of how the fragmentation probability depends on the ionisation
energy will assist in predicting cluster ion cluster intensities.
The next chapter describes the apparatus that was constructed to measure the rare gas
fragmentation probabilities, described in chapter 5.
54

3 Description of the Molecular Beam Apparatus
3.1 Introduction
The cluster generation apparatus consists of two vacuum chambers, shown
schematically in figure 3.1, differentially pumped and connected by a 0.6mm diameær
skimmer. The apparatus can be divided in two areas in accordance with the vacuum system.
Firstly, the equipment that is involved in the genoration of the molecular beam in which
cluster formation takes place is housed in the molecular beam chamber, while the second
chamber or interaction chamber includes all the apparatus necessaly for investigating the
relevant cluster properties.
During the course of this work numerous modifications or trial set-ups wsre
employed, but, this discussion will be limited to the final configuration employed in the cluster
fragmentation work. Occasionally however, the equipment was modified for particular
investigations, for example the scattering measurements of section 4.7. Abrief discussion of
the additional components is included.
Except where acknowledged, all of the components were built as part of this work.
This included, for example, the design, construction and testing of all vacuum chambers, the
electron and ion optics as well as the sector field mass spectrometer.
An attempt is made to describe the pro's and con's of the design as each element is
described. However, more details of testing and performance can be found in chapter 4.
Following a discussion of the molecular beam and interaction chambers, a brief discussion of
possible future refinements of the experimental set-up is included.
The design of the apparatus was to a considerable extent governed by the available
vacuum pumps. The roots blower available for the molecular beam chamber has an ultimate
pressure of 10-3torr and a pumping speed of 8llitres/s. If I wished to operate at not higher
than the usual background pressuro of 10 - l5mtorr, this put an upper limit on the gas
throughput from the nozzle of the order of 0.ltorrl-/s. If three porcent, say, of the total
55
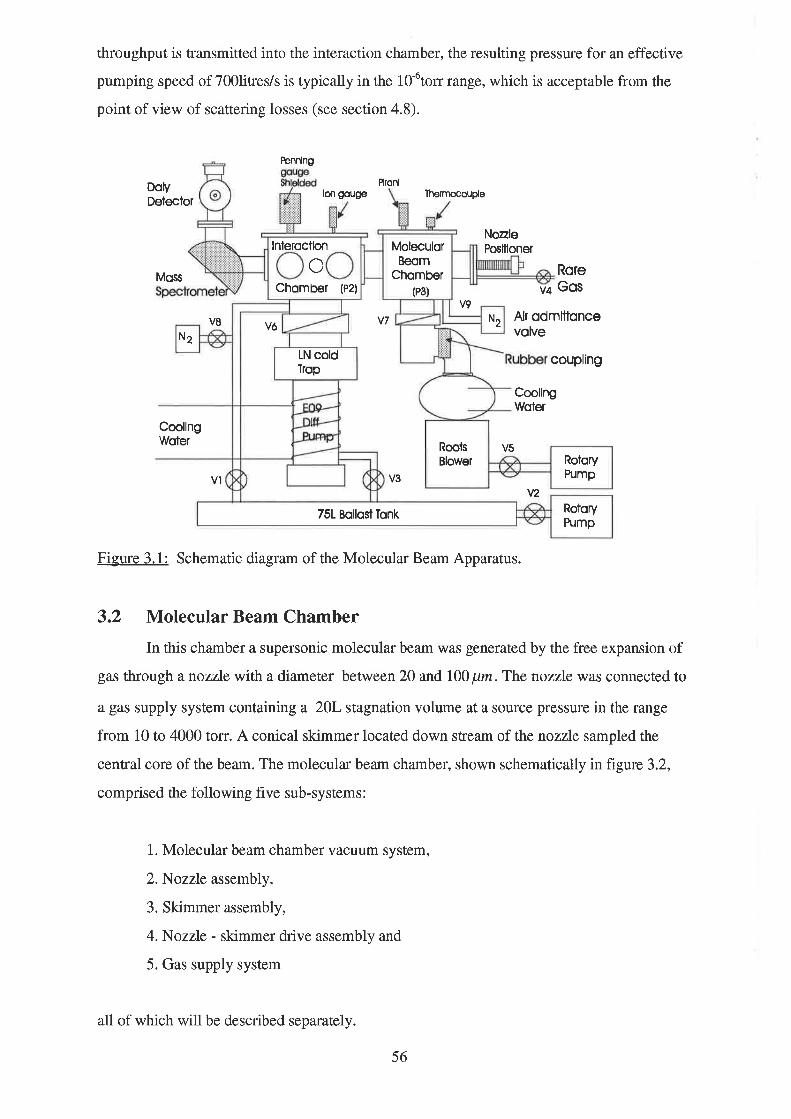
throughput is tlansmitted into the interaction chamber, the resulting pressure for an effective
pumping speed of 7O0litres/s is typically in the 10-6torr range, which is acceptable from the
point of view of scattering losses (see section 4.8).
Þnnlng
Plronl
Delectorlm gouge ïlernocouple
NozleFosltloner
MossRore
v4 GosV9
V8 v7 Alr odmlttoncevolve
coupling
CoolingWofer
CoollngWoter
V5
V] V3
v2
Figure 3.1: Schematic diagram of the Molecular Beam Apparatus.
3.2 Molecular Beam Chamber
In this chamber a supersonic molecular beam was generated by the free expansion of
gas through anozzle with a diameter between 20 and 100 ¡tm.The nozzle was connected to
a gas supply system containing a 20L stagnation volume at a source pressure in the range
from 10 to 4000 torr. A conical skimmer located down stream of the nozzle sampled the
central core of the beam. The molecular beam chamber, shown schematically in figure 3.2,
comprised the following five sub-systems:
1. Molecular beam chamber vacuum system,
2.Nozzte assembly,
3. Skimmer assembly,
4.Nozzle - skimmer drive assembly and
5. Gas supply system
DûV
Clnteroctlon
Chomber (P2)
MoleculorBeom
Chomber(P3)
N2
N2
LN coldTrop
Vó
RoolsBlower Rolory
Pump
751 Bollost TonkRotoryPump
all of which wi1l be described separately.
56

l(rywoy Stop
Nozle ossembV
NozleLJm
XiJ
\
P ron
souse
Solenold volve
lhermocouplegouge
/
Skimmer
Alumlnlumguide
Nozle
Gos
Sklmmerholder
tlp
suppv
Eleclricolfeed-lhrough(solenoid volve)
posltloner
VocuumSystem
Figure 3.2: Schematic diagram of the molecular beam chamber.
3.2.1 Molecular Beam Chamber Vacuum System
The molecular beam chamber was evacuated using an Edwards water cooled Roots
Blower backed by an Edwards rotary pump, as shown in figure 3.1. The pumping speed \'/as
measured to be 80l-s-t + 10Ls-1. The chamber pressure was -2mtorr in the absence of a
molecular beam and in the 8 - 2Omtorr rango with the molecular beam present.
The loots blower was decoupled from the beam chamber via a soft rubber hose to
reduce vibration, while the rotary pump contained an oil trap employing alumina beads as the
sorption matedal, to reduce hydrocarbon contamination.
The molecular beam chamber pressure P: wÍrs measured using an Edwards 1100 Pirani
gauge and an AEI thermocouple gauge. The thermocouple was used for control and inærlock
purposes to prevent accidental exposure of the roots blower or beam chamber to atmospheric
prossure. To enable ¡he nozzle flow rate to be measured, a capacitance manometer (membrane
gauge) was attached to the chamber. The manometer was calibrated against a Mcleod
gauge and used as a secondary pressure standard in the 0.1 - 100mtorr range.
For leak testing the skimmer was replaced by a flange isolating the two chambers and
molecular beam chamber pressure time curves were taken with the main valve (V7) closed.
From these curves the leak rate was estimated at 5x 10-s torrls-l.
57

3.2.2 Nozzle Assembly
The nozzle assembly contains a solenoid valve to interrupt the gas flow, a linear feed-
through attachment for varying ¡he nozzle with respect to the skimmer, the nozzle itself and
an aluminium guide which houses the compleûe assembly (see frgure 3.2). The two types of
sonic nozzles used throughout this work are shown in figure 3.3. The one on the right was
designed to allow the nozzle to be cooled to -250"K while the one on the left was of a simpler
design and operated at room temperature.
Wqter cooledIEC hot
spocers
NozlePTFE
Copper
s/s operturel{ozzleAssemW
Nozle
clo\,vs
Bross lop€r
(a) (b)
Figure 3.3: Room temperature nozzle (a) and the low tempsrature, Peltier cooled nozzle (b)
For experiments at room temperature a number of easily interchanged nozzle tþs of
various aperture diameters dn were constructed. These consisted of a stainless steel disc of
0.2mm thickness, in the centre of which a hole of diameter between 10 - 100pm was
arranged. The aperture disc was mechanically held by a series of metal claws that were an
integral part of the brass tapers, see figure 3.3a, whilst vacuum tightness was achieved
through the application of Ton Seal around the rim. The laser drilled apertures were obtained
from the Defence Science and Technology Olganisation in Adelaide or commercially through
TAAB, England, and a 20pm diameter was used predominantþ with this nozzle
configuration.
The low temperature nozzle, pictured in figure 3.3b, was designed as part of an
assembly in which the temperature of the nozzle was to be varied in the range 250 - 3100K
using a Peltier cell water cooled by a refrigeration unit. This design allowed for a commonly
available Thermo Electric Cooler (TEC) to be accommodated. A subsequent simpler design
will employ a custom built coolel and will allow nozzle temperaturos in the rango 230 - 3100K
to be reached. Thermal insulation of the nozzle was achieved using a PTFE spacer between
the nozzle and the assembly and by encasing all bolts in PTFE bushes.
For temperatures below 2l}oKthe TEC needed considerable input power, nominally
15 - 20watts, requiring water cooling of the hot junction of the TEC to remove the heat. The
ïpAlumnumbody
58

area of contact between the nozzle and the cold junction of the TEC was lapped and a thin
layer of silicone grease used to maximise the thermal contact between the two surfaces.
Similar measures were adopted for the hot junction and the water cooling plate. The nozzle
temperature was monitored using a thin Type K thermocouple enclosed in a stainless steel
sheath. The nozzle temperature tended to vary slowly when monitored for periods of 2 -3
hours while the TEC power and the gas loading were constant. This was thought to be due to
small changes in the thermal contact between the surfaces, demonstrating the impoftance of
stable thermal contact. The variation could be compensated for by altering the TEC power to
maintain a constant nozzle temperature. The internal volume, see figure 3.2b, was partially
filled with copper mesh to provide good thermal contact between the gas and the nozzle.Tlte
existence of temperature equilibrium was confirmed by measuring, as a function of the rate of
tomperature change, certain processes with a known temperature dependence, such as the
temperaturc dependence of the dimer ion current as described in section 4.9. The nozzle
temperature was raised and lowered at different rates with the dimer cuilent dependence on
temperature evaluated in each case. In all cases the expected functional dependence of the
dimer cunent with æmperature was obtained, indicating that good thermal contact had been
established with the gas.
The low temperature assembly used a similar type of nozzle tip to that used in the
room tsmperature nozzle, which was screwed into the alumínium body of figure 3.2b. The
nozzle diameters used predominantly with this configuration were 30 ¡tm and 65pm. In both
nozzle configurations the torr sealed apeftures were leak tested prior to assembly in the
molecular beam chamber.
When using small nozzles care was taken to avoid blockages which would interfere
with the gas flow for constant source conditions. Clearing a blockage required the removal of
the nozzle from the vacuum system followed by inspection under a microscope. For small
nozzles the blockage was cleared by directing a jet of argon atthe nozzle and observing the
orifice shape under a microscope, while for larger nozzles (with diameters greater than 50
pm) the foreign material was removed by poking a piece of 20 pm diameter wire through the
nozzle orifice. The most likely cause of the blockages was small metal shavings, produced as
a result of the frequent operation of the nozzle solenoid valve.
The aluminium guide w¿ìs a ligid structure, machined from a solid piece of aluminium
and canied both the nozzle and skimmer assemblies. It was accuraûely machined to ensure
that both were aligned correctly and to allow the nozzle - skimmer distance to be varied in a
controlled manner by means of a mechanical linear feed-through.
s9

The aluminium guide was fastened to the inside of the molecular beam chamber front
port and the whole assembly could be removed from the molecular beam chamber in one
piece to make adjustrnents.
3.2.3 Skimmer Assembly
For the skimmer to operate properly it must offer minimal inærferenco to the gas flow,
therefore its entrance must present a knife edge to the flow and both inner and outer surfaces
must be highly polished. The otherwise difficult task of obtaining a good finish on the inside
of the small cone is relatively easily accomplished by the method of Gentry and Giese (1975).
In my case the skimmer had a semi angle of 25o, aheight of 6mm and an opening at
the apex of 0.6mm. It was produced by electroforming a nickel layer of 0.lmm thickness on
an appropriately dimensioned, highly polished stainless steel mandrel, as shown in figure 3.4a.
The electroforming was performed at the DSTO Adelaide. The inside sutface f,rnish was
guaranteed by the smoothness of the mandrel and the outside could be readily polished on a
lathe. Subsequently the apex opening was created by machining off the tip of the cone. To
remove the cone from the mandrcl, the latter was plunged into liquid nitrogen, to loosen the
electroformed body through differential thermal contraction.
The nickel cone was soldered to a brass flange for insertion into the skimmer holder,
as shown in figure 3.4b. The brass flange provided a means of holding and manipulating the
skimmer with a reduced risk of damage to the skimmer. Exffeme caro was taken to avoid
contact with the completed skimmer tip as several attempts were required to produce an
acceptable skimmer.
The skimmer was located within a large blass flange, tetmed the skimmer holder,
which in turn was fastened to the aluminium guide that held the entire nozzle and skimmer
apparatus. Figure 3.4b illustrates the skimmer, while figure 3.5 shows the entire nozzle-
skimmer assembly inside the molecular beam chamber.
As well as centring the skimmer onto the axis of the nozzle, ie the molecular beam
axis, the skimmer holder served two other puryoses. Firstly, the skimmer holder electrically
insulaæd the skimmer from the remaining system, allowing the skimmer to be placed at any
desired electric potential (see section 3.3.5). Secondly, the skimmer holder set the distance
between the skimmer entrance and the centre of the electron gun at 1lmm. The skimmer
holder allowed the skimmer to protrude out from the aluminium guide and into the interaction
chamber. By altering spacer rings that made up the holder it was possible to alter the distance
between the skimmer exit and the electron gun.
60

Cone Tlp
removedElectroformed
".zNlcuelcone Bros flonge
Nlckel cone
Mondrel
Cleoronce holes
(a) (b)
Figure 3.4: The nickel cone electroforrned onto the stainless steel mandrel (a) and the
completed skimmer (b).
Figure 3.5: Internal view of the molecular beam chamber
3 "2.4 Nozzle-Skimmer Distance
Several experiments required an accurate knowledge of the nozzle-skimmer distance
and this was achieved using a calibrated linear feed-through, ie the nozzle positioner shown
in figure 3.2,to move the nozzle assembly within the aluminium guide.
The minimum nozzle-skimmer distance was set with the aluminium guide and
nozzle-sl<immer assembly removed from the molecular beam chamber. The skimmer was
6l

replaced with a blank of variable length used to calibrate ¡he nozzle-skimmer distance, with
the blank length set to the height of the skimmer plus a ceftain safety margin, nominally 1mm.
'lhenozzle was gently pushed up to the blank and the stops set on the aluminium guide.
Once the nozzle-skimmer distance was set, the skimmer blank was replaced by the
skimmer and the whole aluminium guide assembly was returned to the vacuum chamber. The
nozzle positioner was coupled to the end of the nozzle assembly, allowing accurate
displacement of the nozzle with respect to the skimmer. The nozzle positioner contained a dial
calibrated in 0.01mm graduations, the zero of which was set with the nozzle at the minimum
nozzle-skimmer distance, thus providing an accurate measuro of the nozzle-skimmer
separation. The nozzle positioner allowed the nozzle to be accurately displaced by up to
15mm.
3.2.5 Gas Supply System
The gas supply system, shown schematically in figure 3.6, is connected to the nozzle
assembly via a vacuum feed-through located on the rsar port of the molecular beam chamber.
The supply sysûem consisted of a20L stagnation volume designed to provide pressure
stability while the molecular beam was operating. The stagnation pressure was set by
adjusting the gas flow from the gas cylinder and was measured using a high quality
piezoelectric pressure transducer with a range from 1 - 5000 torr. A needle valve, shown
together with a bypass valve (for coarse adjustments) in figure 3.6, kept the stagnation
pressure constant by maintaining a dynamic equilibrium between the gas entering the
stagnation volume and that leaving through the nozzle. The stagnation pressure would remain
constant, to better than0.l%o, over a one hour time period. The reset ability of the flow
through the system, at any given stagnation pressure, was considerably better than I%o.
High purity and research grade gases provided by CIG (now BOC) and Matheson
respectively, with purity better than99.9Vo, were used throughout this work.
62

StognotionVolume(.|, 5 or 201)
RotoryPump
HighPurilyRoreGos
NozzleNeedleVolve PressureTronsducer
(r - 'K volve
Gos r-Gos Line toMoleculor BeomChomber
voVe
Gos lnletVolve
ïhermocouple Gouge
Figure 3.6: Schematic diagram of the Gas Supply System.
To reduce the usage of the more exotic gases the stagnation volume was reduced, or
in some instances removed altogether. Similarly, the stagnation volume could be filled with
gas admixtures by coupling to several gas sources.
A rotary pump connected to the supply system was used to evacuate the nozzle and
stagnation volume as required. This ¿urangement allowed the gas supply system to be
thoroughly purged of air or other impurities prior to filling with the molecular beam gas. Care
had to be exercised to ensure there was no cont¿mination of the gas line, ie from HzO, air etc.
63

3.3 Interaction Chamber
The interaction chamber, 340mm x 340mrn x 280mm in size, was constructed from
316 stainless steel. In it was arranged an accurately aligned platform which acted as an
optical bench for mounting the various electron and ion optical elements. The chamber lid
carried all the pressuro gauges and could be removed to provide easy aocess to the chamber.
The chamber walls contained eight ports centred along the molecular beam axis. Some of the
ports provided access to the electron gun, carried electrical feed-throughs and held the mass
flux detector. The remaining ports gave flexibility and facilitated the conduct of a number of
unexpected experiments because of the ease with which apparatus could be introduced to
almost any part of the chamber.
The molecular beam chamber was fastened to the interaction chamber with the port
carrying the nozzle assembly protruding 100mm into the interaction chamber.
The molecular beam was crossed at right angles by an electron gun located close to
the exit face of the skimmer. Ions formed as a result of the electron bombardment were
focussed by a series of ion lenses prior to mass separation within a 900 sector magnetic flreld.
The cluster ions were detected using either aFaraday cage or a high gain Daly detector.
A mass flux gauge was also available to measure the total number of molecules present
within the molecular beam. An internal view of the interaction chamber, configured for
dimer fragmentation experiments is pictured in figure 3.7.
R
ij¡t_
:}
oC
Internal view of the interaction Chamber
64
t-':
3agJl
Figure 3.7:

3.3.L Chamber Magnetic Shielding
The interaction chamber incorporated a 0.3mm thick lining of Conetic AA magnetic
shielding to reduce the effect of stray magnetic fields on the electron trajectories. With the
shielding in place, the average field strength in the vicinity of the electron gun was about
0.2Gauss.
To prevent saturation of the Conetic shielding by the strong stray field of the Penning
gauge, the gauge was enclosed in an iron shield and mounted on an extension tube -150mm
above the chamber lid. A similar approach was adopted with the permanent magnet of the
mass spectrometer. Here an extension tube of length 100mm was employed to displace the
mass spectrometer to a position where the fringing field, measured in the vicinity of the
electron gun, was about 0.2Gauss.
The Conetic shielding was handled with cale to avoid inducing a residual field,
particularly during folding, spot welding and cleaning. A degaussing wand was used for
demagnetisation following fabrication.
The shielding reduced the deflection of low energy electrons to a point wherc the
magnetic field played no significant role.
3.3.2 Interaction Chamber Vacuum System
The interaction chamber was evacuated by a Liquid Nitrogen trapped Edwards E09
diffusion pump, backed by an Edwards two stage rotary pump (see figure 3.1). The rotary
pump contained an oil trap employing alumina beads as the sorption medium.
The pumping speed, measured at the throat of the LN trap, was 700L/s and produced
an ultimate pressure of -2x10'7 torr in the absence of the molecular beam. V/ith the molecular
beam operating the chamber prossure was in the range 1x10⁻⁶ to 1x10-s torr. The LN trap was
connected to the bottom of the interaction chamber via a pneumatically operated Edwards 9
inch butter{ly valve. The chamber pressure was monitored using an Edwards 1100 Penning
gauge and an Edwards Ion 7 ion gauge. The Penning gauge was used for routine pressurc
monitoring and to operate an interlock preventing the operation of the electron gun at
pressures above 1x10-a torr. The ion gauge was used for experiments requiring more accurate
chamber pressure measurement. An AEI thermocouple gauge was also connected to the
chamber lid, providing a means for interlocking the operation of the main chamber valve (V6)
and the diffusion pump.A tank containing twenty minutes resorve water flow was maintained
in the event of mains water failure.
6.s

The fragmentation measurements depend critically on the stability of the electron and
ion optical syst€m, which means I had to suppress the build up of contamination layers on the
electrode surfaces undergoing particle bombardment. The main source of this contamination
is usually back-streaming of pumping fluid from the diffusion pump. Build of such deposits
does not occur if perfluoropolyether (Fomblin) diffusion pump fluid is used (Holland et al
(1973)). However, the literature suggests that the pumping speed for this fluid maybe
somewhat lower and there maybe instabilities that depend on the pump type (see Laurenson et
al (1979), Caporiccio et al (1978) and Holland et al (I972)).In view of this my pump (an
Edwards E09) was investigated in some detail and Fomblin 18/8 pumping speeds were
compared to those for DC 704.
Relative speed measurcments were carried out for the two pumping fluids using
Edwards E09 and E04 diffusion pumps. Nitrogen, argon and helium pumping speeds were
determined by introducing a known quantity of gas into the pump via a capillary leak, see
section 3.4.2, and measuring the concomitant prsssure rise at the throat of the pump with an
Edwards IG5 ion gauge. Care was taken to avoid gas beaming directþ into the pump jets by
incorporating a baffle below the gas inlet. While the pumping speeds for Fomblin were slightly
lower than those for DC704 they did not prcclude the use of the fluid in the interaction
chamber pumping system. The observations made in connection with this work have been the
subject of two publications, included as Appendices A and B respectively.
With Fomblin as the pumping fluid the only sources of hydrocarbon build up are back-
streaming from the backing pump and outgassing from elastomer O-rings.
The benefit of using Fomblin is illustrated in frgure 3.8 which shows two Edwards IG5
ion gauges after prolonged operation in vacuum. The IG5 gauge on the left was operated for
well over 1000 hours as part of the interaction chamber vacuum system, with the chamber
opened to the atmosphere approximately 30 times during the experiment. The gauge on the
right was operated (for about 100hours) on a separate vacuum system, pumped by a diffusion
pump containing DC704 oil. Both gaugos were cleaned prior to commencement of the
experiment and a liquid nitrogen trap was used on each system.
66
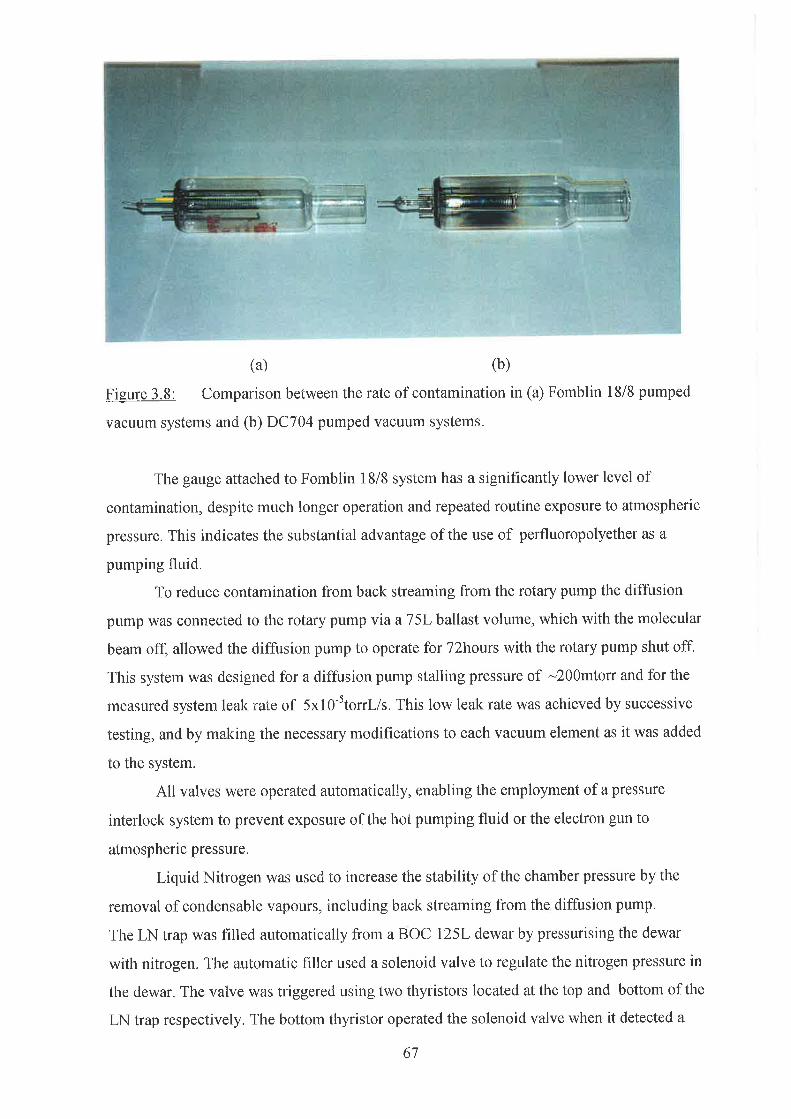
(a) (b)
Figure 3.8: Comparison between the rate of contamination in (a) Fomblin 18/B pumped
vacuum systems and (b) DC704 pumped vacuum systems.
The gauge attached to Fomblin l8/8 system has a significantly lower level of
oontamination, despite much longer operation and repeated routine exposure to atmospheric
pressure. This indicates the substantial advantage of the use of perfluoropolyether as a
pumping fluid.
To reduce contamination from back streaming from the rotary pump the diffusion
pump was connected to the rotary pump viaaT5I- ballast volume, which with the molecular
beam off, allowed the diffusion pump to operate for T2hours with the rotary pump shut off.
This system was designed for a diffusion pump stalling pressure of -200mtorr and for the
measured system leak rate of 5x1O-5torrl/s. This low leak rate was achieved by successive
testing, and by making the necessary modifrcations to each vacuum element as it was added
to the system,
All valves were operated automatically, enabling the employment of a pressure
interlock system to prevent exposure of the hot pumping fluid or the electron gun to
atmospheric pressure.
Liquid Nitrogen was used to increase the stability of the chamber pressure by the
removal of condensable vapours, including back streaming from the diffusion pump.
The LN trap was filled automatically from a BOC l25L dewar by pressurising the dewar
with nitrogen. The automatic frller used a solenoid valve to regulate the nitrogen pressure in
the dewar. The valve was triggered using two thyristors located at the top and bottom of the
LN trap respectively. The bottom thyristor operated the solenoid valve when it detected a
67

preset temperature rise (ie trap empty), and the top thyristor closed the solenoid valve when
the trap was full.
The filler ensured the LN trap was kept at a constant temperature twenty four hours a
day. On average, the dewar required refilling every 8 days.
3.3.3 The Flag
An aluminium shutter, called the flag, was placed -2mm away from the skimmer
holder and was used to intercept the molecular beam, allowing all molecular beam readings to
be corrected for the background signal. A rotary feed-through, located near the large port that
connected the two chambers, was used to swing the flag into and out of the molecular beam,
The rotary feedthrough was coupled to a solenoid which enabled remote operation of the flag.
The solenoid assembly ensured thatthe flag in and the flag oøl positions were accurately
reproduced after successive operation of the flag.
The flag can be seen in figure 3.7, where it is in the in position. It is also shown
schematically in figure 4.3 (chapter 4). In chapter 4 two effects associated with the flag are
discussed, namely, the effectiveness of the flag to separate the molecular beam and the
background gas components and secondly, a charge accumulation effect associated with the
surface of the ionisation box.
3.3.4 Mass Flux Gauge
To allow dimer fragmentation probabilities to be detemined using a modified Lee and
Fenn (1978) approach, a mass flux (or snorkel) gauge was incorporated into the system. The
mass flux gauge (MFG) determines the total mass flow per unit time in a molecular beam by
measuring the pressure rise caused by the gas flow into a known volume, part of which is an
ionisation gauge. The beam enters through an aperture which is as small as possible but on the
other hand must pass the entire beam. Failure to meet this criteria can lead to difficulties
which may have been involved in the work of Lee and Fenn (1978). The pressure rise is
proportional to the mass flow into the detector and the resultant ion current can be
represented as
Imr = Oú.fi.V (3.1)
where n is the molecular number density, V the molecular velocity and cr is a gaugo sensitivity
constant, which is a function of the gas as well as the geometry of the detector.
68

Fot high detector sensitivity, ie for a large pressure build up for a given mass flow, the
impedance of the entrance apefture for the beam molecules must be low compared to the flow
impedance for the beam molecules once they have suffered wall collisions within the detector.
This is achieved by using a small entrance aperture, or better still a tube (ie a low Claussing
factor) and a detector of large volume. The choice of the detector volume has to be balanced
against the need to minimise the time constant associated with the prossure change.
The geometry is such that all particles will undergo multiple wall collisions before they
are ionised and the clusters present will be fragmented into monomers in the couße of these
collisions. Therefore the ionisation cuffent is directly proportional to the total mass flow
within the molecular beam and independent of the ionisation cross-sections of the various
clusters present in the beam.
The mass flux deûector does not distinguish between molecular beams with different
cluster distributions, in contrast to the mass specttometer, which is capable of measuring
cluster ions of varying size separately.
Construction of the Mass Flux Gøuge
The detector was constructed around an Edwards IG5 ionisation gauge and the
effective detector volume consisted of the gauge itself and an attached aluminium cap, see
figure 3.9. The relevant dimensions of the mass flux gauge are given in table 3.1.
Total volume 130m1
Aperture diameter 1Omm
Cap diameter 25mm
Table 3.1: Mass flux gauge dimensions.
The gauge was housed within an aluminium tube and the whole assembly could be
pushed into the path of the molecular beam using a mechanical feed-through. The linear feed-
thlough contained a key way for fixing the cap orientation and a stop to ensure the correct
aperture position, relative to molecular beam axis, was maintained in consecutive
measufements.
The entrance aperture was set at 10mm and axially positioned such that the molecular
beam enteled the detector in the same manner in which it would enter the ion optical system
when the detector was withdrawn. The choice of aperture ensured that no effors wsre
introduced due to changes in the beam divergence with source parameters, sse section 4.5.2.
69

Èeomp
Moleculorbeom
lnterocllonChomber woll
PTFEtube
<1.€
lon gouge
{# r/o
houslng
Lineorfeed-through
Figure 3.9: Schematic diagram of the Mass Flux Gauge
The ion gauge was opemted with the same voltage configuration used in the Edwards
Ion 7 controller with the poæntials listed íntable 3.2.
Vcollætor 0v
V*o¿" 100v
Vfillament -100v
'labIe 3.2: Gauge operating potentials
The gauge electron cuffont must remain constant as the pressure inside the detector
changes. To meet my requfuements a power supply was custom built to provide electron
emission stabilisation superior to that of the commercial unit. The detector was operat€d with
an emission current adjustable in the range 0.1 to 1.0 mA. Varying the emission cuffent
provided a means of altering the detector gain, thus preventing saturation of the preamplifier.
The ion cuffent lvas amplified using a preamplifler contained within the ion gauge
housing, see figure 3.9. The preamplifier was built into a vacuum tight capsule placed close to
the ion collector of the ionisation gauge. By this means the length of the leads could be
restricted to 20mm which ensured a high signal to noise ratio. This high performance came at
the price of making any change in preamplifier gain diff,rcult. The preamplifier consisted of a
high gain (nominally 106) operational amplifier with a variable offset to allow for subtraction
of the signal in the absence of the molecular beam. The gain of the preamplifier was
determined by the ratio of the resistor pair used in the feedback loop of the operational
70
\port
cop

amplifior. Alteration of the gain of the preamplifier therefore required the detectors removal
from the vacuum system and, rather than doing this, the detector gain was changed by
changing the electron emission current as mentioned above. All connections to the ion gauge
and preamplifier were made through the centre of the vacuum linear feed-through which was
a st¿inless steel tube. These connections terminated in a BNC connector for the preamplifier
output and a Cannon D connector for the remaining wires. The mass flux gauge output was
measured using a Fluke digital voltmeter or a Rikadenki chart recorder.
If required the mass flux gauge could be placed in the f,reld free region of the ion
optics. The aluminium cap was electrically insulated from the rest of the detector housing and
was placed at the potential of the field free region so as not to cause a disturbance to the ion
optics. On some occasions the ion beam current collected by the cap provided a useful tool
for ion optics trouble shooting, obviating the need for opening the interaction chamber.
The corrcct alignment of the detector was achieved by scanning the molecular beam
with a small apefture of only 1.5mm. This produced the curves of f,rgure 3.10 representing
measurements at three source temperatures. The detector stop was set so that the detector
insertion depth corresponded to the maximum on the graph.
. = 2000torrlag- 30m icrons
S
27goK0 K
2
3050K
0
30
5
4
3
ps
dn
<t)
=o
=o-=ooc)(¡)
(l)o
o
40 50 60
Mass Flux Gauge position (mm)
Figure 3.10: Molecular beam profiles for three nozzle temperatures, taken with the MFG
using a 1.5mm entrance aperture located 40mm downstream from the entrancs to the
skimmer.
70
71

Once the position of the beam axis was determined with respect to the MFG entrance
aperture, the small aperture, ie 1.5mm, was replaced with the 10mm apefture. Section 4.2
contains information about the calibration and linearity of the mass flux gauge.
The molecular beam profiles of figure 3.10 are normalised at the detector maximum
and indicaæ that the radial density distribution changes with the source temperature. A similar
effect was observed if the stagnation pressure, instead of the source temperature, was altered.
Understanding the influence of changes in the molecular beam radial distribution was
important for the employment of the Lee and Fenn experiment, to be discussed in chapter 5.
Experiments for investigating the molecular beam divergence are described in chapter 4.
72

3.3.5 Electron Gun
A large section of this project related to the construction and testing of the electron
gun used for ionising the clusters in the molecular beam. The aim of this section is to
describe the electron gun with emphasis on the design characteristics.
Ðesign of the Eleclron Gun
The electron gun was designed to operate at a beam current of up to 1pA and at
energies between 15 and 500 e.V. The electron source was an AO50 tungsten hair pin
filament as used in type EMB02 AEI electron microscopes.
The gun elements needed to be easily disassembled for cleaning and the whole unit
had to be capable of being placed at lkv wrt ground potential (ie the chamber walls). The
electron gun was designed so that the electron beam axis intersected the molecular beam at
right angles with the point of intersection as close as practical to the exit face of the skimmer
(nominally 5mm).
The most important requirement for the electron gun was to keep the ionisation
volume, that is the volume of intersection of the molecular and electron beams constant as
the electron energy was altered. This was necessary if my measurements were to be
compared with published ionisation cross-section data without using a calibrating gas such
as He. Figure 3,11 shows the electron gun.
Figure 3.1 1: The Electron Gun.
73

Comstrwction af t\ae Electron Gwra
The electrode elements consisted of 12 circular stainless steel discs of 54mm
diameter and a thiokness of 0.5mm with central holes of appropriate diameter to pass the
electron beam. Three holes on a pitched circle of 32mm allowed these discs to be aligned on
three elosely frtting glass tubes. The distance between the discs was determined by stainless
steel spaeers and thin FTFE insulators, as shown in figure 3.12. PTFE was chosen due to its
suitability for ultra-high vacuurn in my temperature range of operation, Weston (1975), and
because any vapour given off by it does not lead to the formation of contamination layers.
Stainless steel rods with threaded ends passed through the glass tubes to enable the eleotron
gun to be clamped together as a rigid unit. Attached to this structure was the ionisation box
in which the electron beam was intersected with the molecttlar beam. On the side facing the
skimmer a sector was cut from the stainless steel discs to allow the beam axis to be placed
an extra 1Omm closer to the skirnmer than would otherwise be the case.
Figure 3.12: Electron gun elements: Hairpin filament, lens electrodes, deflector plates,
ionisation box, and miscellaneous PTFE and stainless steel spacers.
Electrical connections were made using gold leaf connectors spot welded to the
electrodes, while the filament was held in a rotatable flange that could be removed from the
gun without disturbing the gun position. This method of holding the filament proved useful
in two ways. Firstly, it permitted easy replacement of expended filaments. Secondly and
more importantly, since the use of a hairpin frlament implied a not strictly axial symmetric
beam, rotation of the filament provided one \ryay in which the overlap of the electron beam
and the molecular beam could be adjusted. The filament centre was placed at cathode
potential using a potential divider connected across the flrlament legs.
74

All materials used in the construction of the electron gun had vapour pressures low
enough to make outgassing negligible while the filament was operating.
Three deflector units were constructed by attaching four right angle electrodes, such
as the electrode Dl in frgure 3.13, to the basic disc element. The deflector units were
insulated from the discs and connected to separate power supplies to facilitate.ry deflection of
the electron beam.
The electron gun is comprised of three lenses; GLI, GLz and GL3, which are shown
in figure 3.13'. The extraction lens (GLl) focuses the electrons emitted by the filament onto
an aperture at the image plane GF1, where the electron energy is 100eV. This aperture is the
object for the retarding lens (GL2) which reduces the electron energy to 30eV and focuses the
electron beam onto an aperture at the image plane GF2. This aperture in turn forms the object
plane for the zoom lens (GL3) which produces a near parallel electron beam of the desired
electron energy that intersect the molecular beam in the ionisation box before collection in the
electron trap.
GL3 GL2 GL1IGFI
Ftrap
EEEE
lì1
Electron
Filament(cathode)
lonisationbox
Molecular
Figure 3.13: Schematic layout of the electron gun, ionisation box and the electron trap. The
electrode potentials are shown below the gun while the numerical values are listed in the text.
The three lens arc designated GLI,GL2 and GL3, where the lens electrodes are illustraæd by
thicker lines, which do not represent the relative thickness of the electrodes. The deflector
electrodes DI,D2 and D3 facilitaæ electron beam alignment, while the two apefture skims
GA1 and GA2 defîne the electron beam entering the retarding and zoom lenses respectively.
*The basic layout of this electron gun was copied from a gun used by a number of researchers at the Flinders
University, South Australia. In particular the use of disc shaped electrodes supported by a combinaúon ofinsulating rods and threaded stainless rods was not changed. Similarly, the composition of the retarding and
zoom lens is identical to that designed by the Flinders University School of Physical Sciences. \Vhile the
electron gun used in this work is very similar to guns developed at Flinders University a significant amount ofopúmisaûon has t¿ken place in order to provide a well collimated electron beam that is neady independent ofelectron energy. As an exarnple the electrode lens was purpose built following on from the work of Sao
(1959).
75
c

The electron gun was shielded from stray potentials by an aluminium shroud placed at
cathode potential. This shield also minimised the number of stray electrons emitted into the
interaction chamber.
Extrøction Lens
The extraction lens is a triode consisting of the cathode C, ie the hair pin filament, a
Wehnelt electrode W and the first anode E3. The initial configuration was based upon the
immersion objective of Sao (1959) with the oxide cattrode emitter replaced by the hair pin
filament. During the development of the gun the extraction lens was set up in a separate
vacuum system and its focal propefties evaluated for different voltage ratio combinations.
Bell Jor
^-t'
\ Rolorylln€orvocuum feed through
Rotoryvdcuumfeed through
Coge posilionet(stepper molor drven)
Figure 3.14: Electron gun test apparatus
Experímentnl Investígøtíon of the Extractíon Lens
'With reference to figure 3.I4, a shielded Faraday cage was swept across the electron
beam mapping out a profile of the beam. The electron current was plotted as a function of
cage displacoment, and the full width at half maximum (FWHM) used as a measure of the
beam diameter, as shown in figure 3.15a. The FWHM was plotted as a function of the
distance between the cage and the lens, allowing the focal point to be determined (see figure
3.15b). The focal point was measured for two orthogonal filament positions, and while there
was an obvious asymmetry in the electron beam, the position of the focus was the same for
each orientation.
76
J
Gbss rods
Elecïorì gun
2mmmnnêf
orJtgr
^.e-
El€ctodes,1
Fllorn€nt
Rotdlobley'uaøbos€ --------ù
8mm+l-
+l- 4mm0.1mm dlornolefop€rlure
Shleld€d ForodcrtCOge --.\-*

Initial extraction electrode configurations produced virtual images for all voltage
ratios, however, experimentation with the filament -'Wehnelt separation, Wehnelt thickness
and the size of both apertures provided an optimum configuration that could be used to
construct the electron gun (see øble 3.3).
dcathode - Wehnelt 2.5mm
dw"hn"lt E3 3mm
Aperture diameter
(both)
2mm
Wehnelt thickness 0.5mm
E1 thickness 0.2mm
Poæntialsr: W -5volts
Ez 1OOvolts
Table 3.3: Optimum Extraction lens configuration.
The'Wehnelt - cathode separation, Wehnelt thickness and the Wehnelt aperture
diameter proved to be critical while the dimensions of the first anodo, E3 were of [ttle
importance. The use of high quality commercially available filaments ensured the same
cathode - Wehnelt separation was reproduced after replacement of expended filaments.
12 a20 a
8mm a a
a
a10
8
6
EE
c.JI.IJ(¡)
oo(ú
.9(¡)
-
tt
2
U'.=c=-oG
cc,
Joc.oo(¡)
LU
a7.5mm
a
a
a
a
a
aa
a
a
aa
a
a6.5mm
m
5mm4mm
0 4
o.o 0.5 1.0 1.5 2.0 2.5 3,0 3.5 4.0 '1.5 '1.0 '0,5 0.0 0.5 1'0 1.5
Faraday cage position (mm) Electron Beam width (mm)
(a) (b)
Figure 3.15: Electron beam profiles (a) for various distances above the final extraction lens
configuration and the corresponding curvo (b) of FWHM versus height above E3.
8
4
7mm
a
a
a a
t With respect to the cathode potential C.
77

The voltage ratios were chosen such that the focus was located at the aperture GFl,
which was 8mm above E3. Figure 3.15b illustrates the position of the extraction lens focus
with respect to the first anode E3. This configuration was chosen so that the retarding lens
would have a suit¿ble object to focus and in doing so form an image at GF2.
The aperture skim GA1 was included to limit the divergence angles of the electrons
from the extraction lens and thereby limit spherical aberrations in the retarding lens. The use
of stops with diameter less than 1.5mm was avoided as this resulted in a large increase in the
rate of surface contamination as well as making the electron gun sensitive to small changes in
the deflector potentials.
The frlament was operated at between 2.2 and 2.5 amps and produced total emission
cunents between 10 and 200 micloamperes.
Determinatíon of the Retardíng l-ens Potentials
Once the extraction lens was characterised and the optimum geometry was
constructed the retarding lens was added and its properties investigated in the apparatus of
figure 3.14. The geometry for the retarding and zoom lenses was similar to that of Brunt et al
(1917) and the relevant parameters of the retarding lens are listed in table 3.4.
Aperture diameter, D 6mm
Electlode separation, A 3mm
Object distance, P 3
Image distance, Q 4
Poæntialst: Eq 290volts
Es 30volts
Table 3.4: Retarding lens parameters.
Using the aperture diameter as the unit for the conjugate object and image distances P
and Q, allowed the measured focal properties of GL2 to be compared to the data of Harting
and Read (1976). This was achieved by using the known position of the object, ie GFl, and
adjusting the retarding lens potentials until the required image distance Q was obtained.
The value of Q was determined by placing a lmm aperturc at the desired object
distance, ie at the second focus GF2, and maximising the cuffent entering a Faraday cage
located immediately behind the aperture. Once the potentials were determined, the lmm
aperture was removed and the electron beam was profiled with the test apparatus mentioned
78

previously. Several attempts were required before the optimum voltage ratios, Ey'Es and
E,slEz, corresponded to Q=4.
Good agreement was found between the voltage ratios measured experimentally
(shown in table 3.4) and those determined from the data of Harting and Read using the
parameters in table 3.4. This indicated that the lens aberrations were not large. On a similar
note, profiles of the electron beam showed that the beam waist was on axis and that only a
small beam deflection was required before the zoom lens.
Determínøtíon of the Zoorn Lens Potentíals
The final electron energy was determined by the potential E¡ on the final electrode of
three electrode zoom lens, the geometly of which is given in table 3.5.
Aperture diameter, D 5mm
Electrode separation, A 2.5mm
Object distance, P 4
Image distance, Q >30
Table 3.5: Zoom lens dimensions.
The aperture skimGA2,limited the divergence of the beam entering the zoom lens so
as to reduce spherical aberration.
The function of the zoom lens is to maintain the same focal distance irrespective of the
value of the electron energy given by Et. This was achieved by suitably changing the focussing
potential E6 on the centre elecÍode. In my case the focal distance was large such as to obtain
a near parallel beam. To ensure this over a range of electron energies meant that a curve of Eo
vorsus Er had to be obtained.
Initially this curve was determined in a separate bell jar system. Bearing in mind that a
parallel beam was desired, the lmm aperture and the Faraday cage were placed at the largest
distance from the zoom lens commensurate with the size of the bell jar, which limited Q to
-10. The current transmitted by the lmm aperture was measuled as a function of the zoom
lens focussing potential Bo. At each electron energy in the range from 15 to 500e.V. the
value of Eo coffesponding to the maximum cuffent was recorded against the electron energy
given by Er.
This method was improved when the completed electron gun was transferred to the
interaction chamber where the measurements could be made at larger image distances (Q-35).
79

In prefercnce to using a small aperture, in these measurements a Faraday cage with multiple
collectors was used.
Electron Trap
This multþle collector Faraday cage shown in figure 3.16 ultimately also served as the
electron trap in the final configuration of the apparatus, see figure 3.18. It was primarily
designed to allow the radial electron distribution to be approximately measured and to allow
the focal properties of the electron gun to be more accurately determined by monitoring the
current to the smallcentral collector.
The trap consisted of three concentric annular cuffent collectors which formed the
base of a shielded Faraday cage. The central one was in the form of a small Faraday cage with
an OD of 2mm while the second collector was an annulus of 3mm ID and 7mm width, with
the third collector being an annulus of 12mm ID and an 8mm width.
Multiplecollector
leleclron lrop
Figure 3.16: Schematic of multiple collector electron trap.
The multiple collector was placed at the end of a brass cylinder of length 65mm. PTFE
insulation between the multiple collector and the brass cylinder allowed the multiple collector
to be place d at apositive bias above the ionisation box potential2. With the brass cylinder at
box potential this proved a useful way of suppressing secondary electron emission from the
individual collectors. All collectors wore coated with colloidal graphite to decrease secondary
elecffon emission and the open end of the cylindel was machined to a knife edge for the same
reason.
2 To avoid perturbing the electron beam distribution measurements no bias potential was applied to themultiple collectors during these measurements.
g0
s,,oó¡no",,

Críteríonfor a Near Parallel Beam
The criterion adopted for a near parallel beam, with Q-35, was that the central
collector of 2mm diameter collect more than 90Vo of the total electron beam. Using this, the
relation found between the focussing and the electron energy is as shown in figure 3.17,
where it is seen that the lower end of the working range of the zoom lens is 20eV.
160
M easu
0 50 100 150 200Electron Energy, Ef (volts)
250
140
(t,
=o(OLU
(g
L<l)
oo-o).É(t,at,
=ooLr-
120
100
80
60
40
20
0
Figure 3.17: Zoom lens focussing requiremonts for a near parallel beam.
Using this curve and with the electron gun clean, the relative ionisation cross-section
for argon could be repeated to within 270 over a period of one year.
During subsequent investigation of the argon ionisation cross-section it was found that
the criticality of the focussing voltage adjustment varied somewhat over the range of electron
energy, as did the electron beam radial intensity distribution. Up to about 100eV, adjustment
to within *2volts ensured good reproducibility. At higher electron energies the adjustrnent
became less critical, and above -170eV a constant focussing potential of 150v could be used
up to ths maximum energy.
When the gun was properly focussed, for all the electron energies used in this work,
the outermost collector received no more than2Vo of the total curent, while the current to
the brass cylinder was one ordel smaller again.
Harting & ReadP=6Q=30
81

A comparison of the focussing voltage data and those of Harting and Read (1976) for
P=6 and Q=303, also shown in figure 3.17, shows good agreement over the range from 20 to
140eV, but at high energies my focussing potentials tended towards a near'þ constant value of
150v.
With regards to the discrepancy between the measured curve and that of Harting and
Read at high electron energies, it must be remembered that the curve of Harting and Read
refers to a constant image distance of Q=39. At such large image distances my measurements
can not detect changes in Q. An attempt to measure the lower branch of the Harting and
Read PQ curvo failed over most of the energy range. This reflected the intrinsically large
aberrations present in the lens when operated in this manner.
For consistency the uppsr branch of the Harting and Read voltage ratio curve, with
P=6, Q=30 was used to focus the zoom lens for energies less than 150eV, while for electron
energies above 170eV the focussing potential Eo remained fixed at -150volts. The validity of
this procedure is demonstrated by the fact that it allowed reliable relative ionisation cross-
sections up to 500eV to be obtained for all gases investigated.
On completion of the beam distribution measurements the three inner collectors wete
connected together and the trap cunent in subsequent experiments was monitored as the sum
of the three collectors. If at any later stage the zoom lens performanco was brought into
question, it could be checked by measuring the relative total ionisation cross-section for
argon. If the result was not within experimental error of that obtained previously, then the
electron gun was removed and cleaned. This procedure was undertaken three times over a 2
year period, and in each case cleaning the electron gun and ionisation box allowed the correct
relative ionisation cross-section to be msasured reproducibility.
The excellent performance of the electron gun, which to a large extent is deærmined
by that of the zoom lens, is highlighted in section 4.4 where relative total and partial ionisation
cross-sections are shown for argon. Not only is the electron gun capable of yielding
reproducible curves over long periods of time, but the normalised results also agree with the
data of several other researchers (Krishnakumar and Srivastava (1988), Orient and Srivastava
(1987) and Rapp and Englander-Golden (1966)).
t Here a number of Q values were frialed with the best agreement obtained when Q-3082

Ele ctron B eam Alígnment
To ensure proper beam intersection, the heights of the molecular beam and electron
gun axes were measured with respect to the optical bench in the interaction chamber. The
electron gun height was adjusted to bring the two axes to within 0.lmm of each other.
Similarly, the electron gun was checked for parallelism with the optical bench and found to be
so within less than 0.lmm over a length of 1ü)mm.
It was necessary for the electron trap to be accurately positioned with its. centre at the
same height as the electron beam axisa. As a first step and with the hairpin filament removed
the alignment was checked using a HeNe laser orientated along the axis of the electron beam.
The laser spot was observed at the electron trap with the multiple collector removed from the
brass cylinder and a translucent PTFE block insefted instead. Movement of the multiple
Faraday cage was made easier by supporting it separately on the optical bench.
Once the mechanical alignment of the gun structuro was completed, the alignment of
the electron beam itself was checked. For this a method was employed which permitted an
image to be produced of the area on a metal plate that has received electron bombardment.
The technique relies on the fact that, even with a very low hydrocarbon background in the
vacuum system, electron bombardment rapidly leads to the formation of an initially invisible
passivating layer. The latent image constituted by this layer can be 'developed' by immersing
the metal target, for instance brass, into an electrolytic solution of CuSO¿. Electro-deposition
onto the bombarded area is inhibited and an image of the electron beam cross-section appears
as a bright patch against the duller background on which copper has been deposited.
To apply this technique to the alignment of the electron trap a circular brass plate was
placed in front of the multiple collectors and an image of the beam cross-section was obtained
by bombarding this plate with a lpA beam at 30eV for 5 minutes. By using images formed in
this way the final alignment of the electron trap was achieved by a process of trial and error.
A 'photograph' was taken and the distance of the centre of the image from the trap centre
was measured. The electron gun was shifted accordingly and the procedure repeated. Once
completed, the alignment was checked at 80eV and shown to be invariant with electron
enefgy.
o This was particularly important for the electron beam distribution measurements where the electron beamhad to enter the central collecto¡ without applying a potential to the final deflector plates.
83

Ionßøtíon Box
Ionisation of the molecular beam occurs inside a molybdenum box spot welded to the
final electrode of the electron gun, see figure 3.18. The box provides a field free region with
the space potential (relative to the cathode) in the vicinity of the molecular beam equal to the
electron energy. The thermal ions produced are extracted from the box using a -10 to -15 volt
potential on the exit of the box.
The entrance and exit plates were made of non magnetic stainless steel which could be
easily removed from the box. Both plates have a 10mm hole through which the molecular
beam could pass. The performance of the ionisation box was insensitive to the position and
the size of the entrance aperture. On the other hand, the exit apefture size, potential and
location was critical for the detection of stable ion currents free from drift.
This project used an on-axis ion extraction geometry where the ions from the directed
molecular beam tended to leave the ionisation box under their own momontum. This had the
advantage that potentials of only a few volts needed to be used on the extraction electrode.
"IFOElectron
MolybdenumSkimmer
optics
Nozzlelon & moleculor
beoms
trop
lon
E,
(finol electrode) Electronbeom
VI
Figure 3.18: The optimum ionisation box - extraction electrode combination.
The extraction electrode configuration, shown in figure 3.18, provided the optimum
ion extraction performance and was obtained by trialing several combinations. Hele two exit
plates, separated by approximately 2mm, are employed. The inner plate is electrically
connected to the ionisation box whilst the outer is electrically insulated and canies the
extraction potential V"*¡ For reasons to be discussed in section 4.3 this potential was set at
l2volts with respect to the box.
84

Electron Gun Power Supply
A purpose built power supply was constructed after the electron gun had been tested
and the appropriate electrode potentials chosen. It was designed to provide all the potentials,
currsnt and voltage meters and the necessary fìlament regulation for routine operation of the
electron gun. The power supply was interlocked to the Edwards Penning 1101 controller to
prevent accidental filament damage.
The front panel facilitates easy access to all potentials and the current to each
electrode can be measured by removing individual cunent links and inserting a meter. A
shielded, 40 cable loom provided easy coupling from the rear of the power supply to a 40 pin
electrical feed-through on an interaction chamber port. Each cable was colour coded both
inside and outside of the vacuum chamber, while a separate, high cun'ent electrical feed-
through was used to connect the filament to the power supply. All internal wiring was PTFE
coated to reduce vapoul'pressure.
The electron gun power supply complised twelve separats supplies, one for each gun
electrode and one for each of the X and Y components of the three deflectors. The power
supply was designed so that at alater stage individual supplies could be modified for
computer control.
The power supply could be operated in either a regulated or unregulated mode. In the
regulated mode the filament cunent is continuously adjusted to provide a constant electron
trap current, preset from the front panel. The electron current stability is better than l7o over
periods of the order of 2 - 4 hours and the filament supply has no difficulty adjusting to
prsssure changes occurring as a result of changes to the molecular beam stagnation pressure.
Due to the instability of the electron trap current when operating in the unregulated mode, all
measurements were normally made in the regulated mode. For electron energies below -40eV
the electron tlap current was typically 0.02 - 0.4 uA, since at higher current levels space
charge difficulties were encountered.
The filament regulation used a comparator circuit that measured the amplified electron
trap current with a reference which was set by a potentiometer on the front panel. The
filament circuit was cuffent limiæd to prevent the filament fusing and a time constant of -0.5s
was incorporaûed into the comparator to prevent the filament supply from continually
'hunting'.
The regulating circuit was sensitive to exûsrnal pick up which was minimised through
the use of short, shielded cables between the chamber and the electron gun supply. Similarly,
all components were grounded from a common earthing point.
8s
The reliability of the electron gun power supply enabled routine ion cunent
measurements with an accuracy better than +l-0.57o.
Electron Gun Cleaníng Procedure
The electron gun elements were cleaned separately prior to the gun's initial assembly
All stainless sûeel elements were cleaned in a picHing solution of
207o
l0%o
707o
HNO¡
HF
HzO
at 600C for 5 minutes, prior to immersion in Decon 90 detergent. The components were then
rinsed in distilled water (700C), Acetone and finally Ethanol before drying in an oven at 500C.
The glass rods were cleaned using Chromic acid and rinsed in the same manner as the
stainless steel components. PTFE components were boiled in HNO: for 15 minutes and rinsed
in distilled wator followed by Ethanol. An ultrasound bath was used to assist with the cleaning
procedures.
After cleaning the electron gun was assembled in a dust fiee cupboard and handled
with gloves to reduce contamination. The filament was inserted last and the assembly placed
in to the interaction chamber.
The gun was removed from the chamber every 300 - 500 hours of operation, or when
the performance indicated the build up of insulating films. Usually the contamination was
small and individual electrodes could be cleaned mechanically using emery paper. However,
on several occasions a thorough clean of all surfaces was necessary.
One of the features of the electron gun was that it could be thoroughly cleaned
without disassembly.The entire stnrcture was immersed into the stainless steel pickling
solution for - 2minutes and rinsed in the manner described above. This procedure was
repeated several times until the electrode surfaces were clean. Care was taken to ensure
complete removal of the pickling solution prior to drying of the gun. This technique saved
considerable time and prevented incorrect reassembly of the electron gun.
86

3.3.6 lon Optics
The molecular beam, and therefore the ion beam, was known from mass flux gauge
measurements to be several millimetres in diameter. To image the ion beam without large
spherical aberrations a large diameter ion-optical lens was constructed.
Following extraction from the ionisation box, an einzel lens brought the ion beam to a
focus which lies in the object plane of a zoom lens. The zoom lens in turn directs a parallel
beam of the required energy into the mass spectrometer. The ion optics is shown
schematically in figure 3.19.
The construction of the ion optics was similar to that for the electron gun in that for
both lenses the individual elements were clamped together: with insulated rods. The einzel lens
was an aperture type and consisted of stainless steel discs of 75mm diameter with 7.5mm
spacing and a 15mm diameter central aperture. The zoom lens was a three cylinder type using
similar stainless steel discs, which however, were fitæd with stainless steel tubes of 10mm ID,
see figure 3.19.
The two lenses were constructed separately and then attached to a solid brass tube
which intemally constituted a f,reld free region. The brass tube like all electron and ion optical
elements was mounted on the optical bench with PTFE insulating spacers. Care was taken in
the positioning of these insulators to avoid charging effects.
Elnsel Lens(opeture)
Moss Flrx detectofor Forodol/coge
pon
Field freeregion
Zoom L¡ens
(cyllndricol)
/
-lT
lonlonisotion beom
Bross *ctomping
V3:VII
V4 V5
tods
Voccel
Figure 3.19: Schematic diagram of the ion optics assembly.
box
VI
87
GND

A circular hole was cut in the brass tube holding the ion lenses so that the mass flux
gauge could be inserted to sample the molecular beam. When the detector was withdrawn the
end of the aluminium cap was level with the inner wall of the brass tubes. This was at all times
placed at the same potential as the brass tube so that the field within the tube was not
perturbed by the presence of the detector.
Since it is easier to measure small cunents at ground poûontial all ion and electron
elements had to be operated at negative potentials with respect to ground. The construction
of the ion optics was such that the beam was well shielded from extemal fields except near the
entrance to the einzel lens where it was necessary to install a cylindrical shield, as shown in
figure 3.19.
Eínzel Lcns Perþrmance
The more important einzellens parameters are listed in table 3.6 where the poæntials
labelled in figure 3.19 are with respect to the ionisation box.
The optimum voltage ratioYzlVr for the einzel lens was experimentally determined.
For this the zoom lens was removed and a 1mm aperture was placed at the centre of the brass
tube which was in the object plane of the zoom lens. The current through this aperture was
measured with a well shielded Faraday cage. The value of YzlYt that gave the maximum
current transmission was deærmined for a variety of ion source conditions.
Lens geomeffy Three electrode
Apefture lens
Aperture diameter, A 15mm
Electrode separation, D 7.5mm
Vr,V¡ 50V (wrt box)
Nominal voltage ratio
YzlYt 7
Object distance, P -3
Image distance, Q 3
Table 3.6: Einzellens parameters.
t Vy'hen the mass flux gauge was either removed from the system or placed elsewhere, such as at the positionof the ionisation box, the hole was screened with a metal mesh.
88

One might expect changes in this ratio due to changes in electron and molecular beam
intersection as a result of changes in the electron beam energy or the accumulation of surface
charges within the ionisation box. All these factors proved negligible with the measured ratio
being -7. This was in good agreement with the value of 6.5 calculated from the data of
Harting and Read (1976) which refers to a point object.
The lmm aperture was removed and the total ion current transmitted by the enrc,l
lens was measured with a large aperture Faraday cage. It was measured to be >987o of the
total current extracted from the ionisation box.
As a further check, relative total ionisation cross-sections, ie measurements of the
total ion cuffent as a function of the electron energy, were determined with this arrangement.
When normalised, the results were identical to similar ones taken with the Faraday cage in
front of the einzel lens and agreed well with the published data of Krishnakumar and
Srivastava (1988). This confrrmed that the ion production and extraction system was free
fiom energy discrimination effects. However, the absence of discrimination effects was only
due to the fact that a large detector aperture (10mm) was used. Experiments showed that
when small apertures were used there were in fact discrimination effects and, as will be
discussed in chapter 4, therc were further effects due to changes in the molecular beam
composition.
Zoom Lens Performance
The results of the previous section show the need to work with large apertures. As far
as the resolving power of the mass spectrometer is concerned a large entrance aperture
implies a low resolving power. In my case an entrance aperture of 10mm and a central
trajectory of 75mm means a mass resolution of the order of 7.5, which is quite acceptable.
However, it was considered advisable to operate with a more or less parallel beam
entering the mass spectrometer to avoid particles being inûelcepted by the envelope walls,
particularly in the direction in which no magnetic focussing occurs. The zoom lens operating
parameters are lisæd in table 3.7.
89

Lens geometry Three electrode
Cylindrical lens
Cylinder diameter, A 1Omm
Electrode separation, D 1Omm
V¡ (from Einzel lens) 50v
V¿ 0.75 x Vs
Vs 0- lKv
Object distance, P 3
Image distance, Q >40 (-*¡
Table 3.7: Zoom lens parameters.
The near parallel beam irnplies a long image distance Q . To ensure expedmentally that
this was achieved the mass spectromeûer was removed from the interaction chamber and
replaced by a 400mm long extension tube, at the end of which a Faraday cage, preceded by a
10mm aperture, was attached. An aperture of similar dimensions was mounted on the optical
bench and served as the entranco aperture to the mass spectrometer. The focussing voltage V+
required to maximise the current into the Faraday cage was then determined as a function of
Vs, which detemined the final ion energy6.
Measurements showed that the fraction of cument transmitted through the extension
tube into the Faraday cage was very close to 1007o, showing that the beam was to a high
degree parallel. This condition was achieved for Vo=9.75yr.
These measurements were made at a range of ion energies corresponding to a range of
cluster masses and it was found that there was no signif,rcant mass discrimination. For example
in the voltage range from 100 to 350volts covering the argon monomer, dimer and trimer, the
transmission was constant to within 27o and in the voltage rango from 50 to 400 volts it was
constant to within 57o.
The transmission through the magnetic field of the mass spectrometer was then
checked by using an argon beam under conditions in which only singly charged monomer ions
werc formed. For this the extension tube was removed and the mass spectrometer put in
place. The current transmitted through the mass spectrometer was measured using a Faraday
cage that could inûercept the incident beam by operating a linear feed-thlough. It was found
that the mass spectrometer transmitted greater than907o of the incident ions and, while small
u This energy is given by the potential difference between the ionisation box and Vs which is always at groundpotential.
90

changes in the transmission could occur from day to day, the transmission was independent of
the energy of the ionising electrons.
Power Supply for the lon Optícs
The voltages for the ion optics were derived from two separate supplies. Firstþ, a
Fluke 0 - 2000 volt DC supply was used to raise the ionisation box above ground potential,
thus in effect setting the ion accelerating potential. A potential divider connectÊd across this
supply provided the zoom lens focussing potential, according to Va =0.75.Vs, as determined
experimentally by the method described in the previous section. This anangement allowed the
ion energy to be altered without the need to separately tune the zoom lens for each setting.
Secondly, a custom made power supply was coupled to the HT side of the Fluke
power supply and provided the potentials for the remaining electrodes of the ion lenses.
Table 3.8 shows the potentials applied to the ion optics for the detection of an argon
monomer beam, while the significance of the potentials can be seen in figure 3.19
Electrode Voltage (WRT Box)
Vu* 0
Vextpot -20
Vr,: -50
Yz -385
V4 -229
Vs -305
Ion Collector -305
Table 3.8: Ion optics potentials for the detection of the argon monomer.
While Vbo*, V"*t, Vr,¡ and V2 always remained the same the values of V+ and Vs refer
to the detection of the argon monomert. For other molecules these potentials vary as the
inverse of the molecular weight.
To reduce pick up all leads consisted of coaxial cables and BNC connectors were used
at both the power supply and the chamber ends. The high voltage glass metal feed-throughs
were enclosed in a box, terminating in the matching BNC connectors.
7 It should be noted that the voltages given are with respect to the ionisation box while physically, iondetection occurs at ground potential.
91

3.3.7 Mass Spectrometer
The mass spectrometer used in this project consisted of a permanent magnet and a
vacuum envelope which accommodated a 900 beam deflection and could be flanged to the
interaction chamber with an O-ring seal. The other end of the vacuum envelope was attached
to the ion detector in a similar manner. The most important spsctrometer parameters are listed
in table 3.9. The dimensions of the 900 vacuum envelope as well as the object and image
distances were arrived at from the results of modelling of ion trajectories within the magnetic
field.
Geometry 900 magnetic sector fîeld
Field strength (within the
confines ofthe pole faces) 1850 Gauss
Radius of curvature 75mm
Pole face separation 30mm
Table 3.9: Mass Spectrometer key parameters.
Unceftainty due to the position of the magnet with respect to the envelope was
removed by tracing the pole faces of the magnet onto the envelope, thus allowing accurate
resetting of the mass spectrometer configuration. Similarly, a purpose built cradle supported
the magnet and allowed for its orientation, with respect to the ion beam to be adjusted.
Modellíng lon T?ajectories wìfhín the Mass Spectrometer
Prior to modelling the mass spectrometer ion trajectories, the radial magnetic field
distribution was moasured using a Hall effect probe. These moasurements wero undertaken at
several positions from the two pole faces, and showed that over the region of interest the field
strength was insensitive to the distance from the pole face.
The symmetrical nature of the magnetic field is highlighted in fìgure 3.20 where the
field strength is plotted as a function of the radial distance from the csntre. Figure 3.20 also
shows the polynomial spline fit, used to represent the dependence of the magnetic field on the
radial position.
92

2000
1 500
1 000
500
-200 -150 -100 -50 0 50 100 150 200Radialdistance (mm)
Figure 3.20: Measured radial field strength (points) and the spline fit used for modelling
pulposes (solid line).
The spline fit was incorporated into a computer plogram written to trace ion
trajectories through the mass spectl'omoter. The program employed an iterative procedure
that calculated at each step the change in ion position in time dt where the ion moves under
the influence of the measured magnetic field. In successive runs the time increment dt was
reduced until no further change in the ion trajectory was detected. The program was checked
by applying it to the case without fringing fields which could be exactly solved by elementary
methods.
The modelling involved tracing ion trajectories for a variety of initial conditions. For
example, the argon monomer was selected and an initial velocity and position specified. The
corresponding focal properties were determined for a 90' deflection of the central ray by
looking at an ensemble of trajectories, each with a slightly different angle of incidence,
The dimensions of the interaction chamber were such that an object distance of
170mm was convenient. From the ray tracing, this object distance was found to correspond to
an image plane ( ie position of the exit slit) which was 210mm from the centre of the magnetic
field.
The trajectories illustrated in figure 3.21 conespond to ions with molecular weights in
the range from 20amu to 65amu, with each bundle of rays separated from the next by 5 amu.
Each bundle of rays represents an ensemble of ions, each with a slightly different angle of
incidence, cr , all of which are incident on the spectrometer from the same start point.
U'(¡,
=(ú(t)
o,C,oU,
!.9LL
0
93
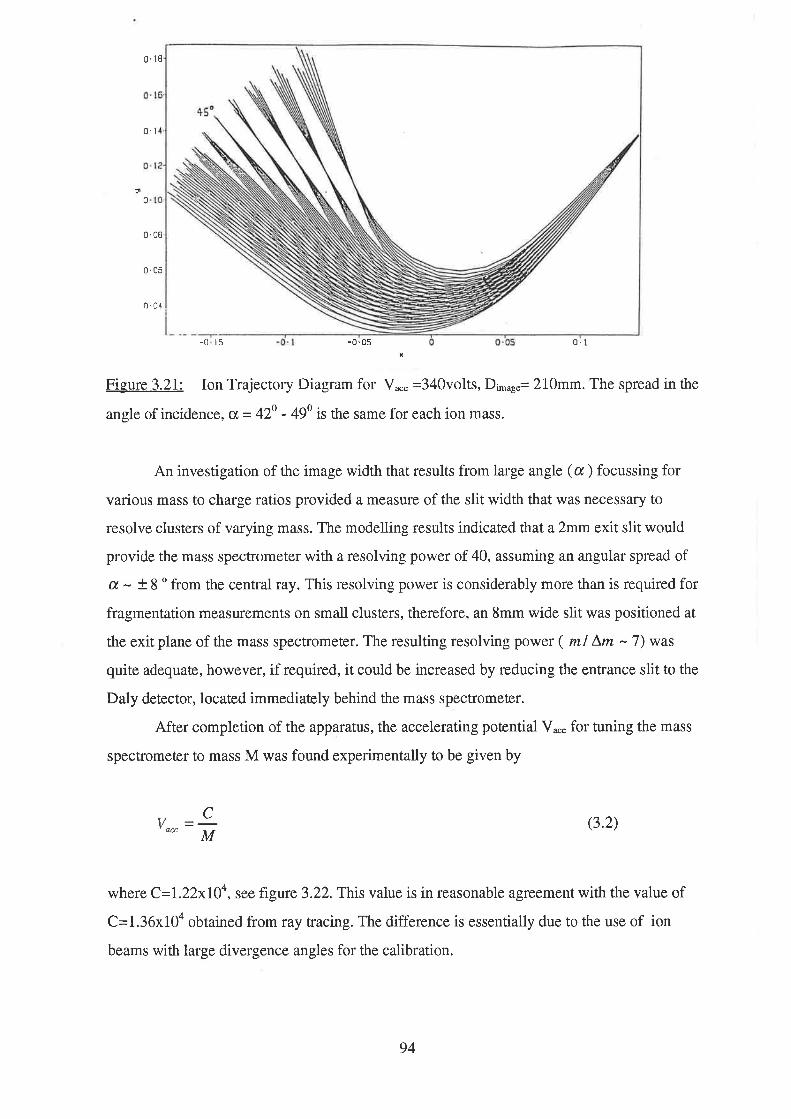
0.t8
0.1
0t
0'08
0.c5
n.04
-0 t5 -0. 05 0.rx
Figure 3.21: Ion Trajectory Diagram for Vu* =340volts, D¡our"= 210mm. The spread in the
angle of incidenco, c[, = 42o - 490 is the same for each ion mass.
An investigation of the image width that results from lalge angle (ø ) focussing for
various mass to charge ratios provided a measure of the slit width that was necessary to
resolve clusters of varying mass. The modelling results indicated that a 2mm exit slit would
provide the mass spectrometer with a resolving power of 40, assuming an angular spread of
s¿ - r 8 o from the central ray. This resolving power is considerably more than is required for
fragmentation measurements on small clusters, therefore, an 8mm wide slit was positioned at
the exit plane of the mass spsctrometer. The resulting resolving power ( ml Lm - 7) was
quite adequate, however, if required, it couid be increased by reducing ths entrance slit to the
Daly detector, located immediately behind the mass spectrometer.
After completion of the apparatus, the accelerating potential V*" for n"rning the mass
spectrometer to mass M was found experimentally to be given by
C(3.2)Vor"
M
where C=1.22x10⁴, see figure 3.22.Thtis value is in reasonable agreement with the value of
C=1.36x10⁴ obtained from ray tracing. The difference is essentially due to the use of ion
beams with large divergence angles for the calibration.
94

500
400
300
200
100
0
1 E-5
1E-6
1E -7
2
o
r, Ne2
2
o
.gLo)oo-o)C,
(õ(¡)q)o(J
co(Nz)z
Kr , Ar,
2
z)z
Kr2
0.00 0.01 0.02 0.03 0.04
Atom ic M ass U nit-1
Figure 3.22: Ion accelerating potential as a function of the ion mass. The line through the
data points is defined byY^u=I.22xl04lM.
An argon clusûer beam mass spectrum is shown in figure 3.23.Here the mass
spectrometer entrance apefture was 10mm, while a 8mm exit slit was employed, and the
output current was measured with the Daly detector, to be described in section 3.3.8.
o =3800torr'srag
T o=2500
K
Atg
4,2
t:ioo
coocoeo
+rA
o
oo
oEõco)
oo
o
ooo
ô'ooooo
I
A14
¡o
oo
1E-8
+
ooooOO
o+
o
oo
ooo
o
o
1 E-9
50 1 00 1 50 200 250 300 350 400Accelerating Potential (volts)
Figure 3.23: Argon mass spectra showing Aro*, with n=I - 4.It is apparent that clusters
smaller than the pentamer can be completely resolved.
95

The cluster ion signal was represented by the pulse height measured at the appropriate
focussing potential. This was justified by the fact that the mass line profiles were essentially
symmetrical and independent of the magnitude of the individual peak currents.
As a further check on the performance of the apparatus it was confirmed that the mass
spectrometer output was proportional to the electron beam cunent, and in the regime where
only monomers were present, it rose linearly with the stagnation pressure.
3.3.8 lon Detection
Usually ion detection was by means of a high gain Daly-type detector. The stability of
this detector relies on the stability of the secondary electron conversion electrode, a plastic
scintillator and a photomultiplier tube. In a sufficiently high current rango it was possible to
check on its overall performance with a retractable Faraday cage.
Faraday Cage
The Faraday cage had an internal diameter of 30mm and a length of 80mm. The cage
which was located on top of the Daly detector (see figure 3.24) coúd be lowered to -5mm
above the exit slit of the mass spectrometer by a linear feed-through. The rim of the cage was
machined to a knife edge and the entire collecting surface was coated with colloidal graphite.
The Faraday cage output was connected to a BNC connector via a vacuum electrical feed-
through. The Faraday cage cunent was measured on a Keithley 610C Electrometer, which in
tum was calibrated using a Keithley Picoampere source. The use of shielded coaxial cable and
of PTFE suppofts, between the Faraday cage and the outer walls to reduce microphonics,
enabled routine measurement of ion currents as small as -10-14 Amps.
Measurement of relative ionisation cross-sections near threshold, as well as the
measuroment of clusters above the dimer, dictated the use of a high gain detector.
Daly Detector
A modified Daly detector, similar to that of Richards (1984), was built by Mildren
(1989) and was used for the low current measurements. Figure 3.24 shows the schematics of
the ion scintillation detectol used in this work. The geometry of the device has been optimised
to make it almost insensitive to the energy with which the ions enter the device. Ions
transmitted by the mass spectrometer are accelerated by a large potential, ie in the range of 10
to 20KV, towards an aluminium electrode. The sutface of this electrode is highly polished to
rcduce field emission, hence reducing the background noise. Each ion produces several
96

secondary electrons which are accelerated towards a plastic scintillator covered by a -10nm
aluminium film at ground potential. The film served to block any photons emitted by the
conversion electrode, while allowing the electrons to reach the scintillator. Moreover, it
prevented surface charges from accumulating on the scintillator, the effect of which would
have been to deflect and eventually repel the incident electron beam. Photons produced by the
scintillator entered a photomultiplier tube which was outside the vacuum system. This
detector, as compared with electron multipliers or channeltrons, has the advantage that the
gain is not subject to change due to changes in the vacuum conditions.
SecondoryElecfion Emitter
MovobleForodoy Coge
HVI
ScintillotorEntronceAperture
Figure 3.24: Schematic diagram of the Daly detector
A 0 - 40Kv DC Cockroft and Walton (1932) power supply was used for the ion
acceleration. The gain depended on the setting of this potential and for typical operating
conditions was of the order of 107.
The photomultiplier could be operated in either the cument or the counting mode. In
the current mode the same electrometer described above was used to measure the
photomultiplier current. In the counting mode a pulse height discriminator was connected to
the photomultiplier, the output of which was connecæd to a Hewlett Packard gated counter.
The discliminator was set so that dark cunent pulses werc excluded.
The detector gain in the cuffent mode depends on three factors. Firstly, the secondary
electron coefficient of the conversion electrode, secondly, the scintillator efficiency and
thirdly, the gain of the photomultþlier tube. Whilst the photomultiplier tube gain was known
to be constant after an initial warln up time (-30min), the conversion electrodo was a
potential source of uncertainty.
97
,/nsulotlon

It was found that much improved stability could be obtained through conditioning the
conversion electrode at 30KV for 30seconds. This procedure reduced the background signal
from field emission, and subsequent operation of the detector in the 10 - 20KV range was
stable for several hours.
The gain of the detector could be checked by using the retractable Faraday cage,
described above, to measure the ion cuffent entering the Daly detector. It was found that,
from day to day, the gain at any detector potential did not vary by more than 2-57o.The
Faraday cage allowed an accurate calibration of the Daly detector gain, as a function of the
cluster size and detector potential, to be measured ( see section 4.5.5).
The advantage of operating in the counting mode is that the results are insensitive to
drifa in the secondary electron coefficient of the conversion electrode. The reason for this is
that since secondary electron emission occurs in less than 5x10-llseconds, see Wang (1945) or
Greenbach and Miller (1941), all electrons emitæd ardve within the time resolution of the
photomultiplier tube (-20ns) and effect the height of the pulses and not the number of pulses
produced.
A drawback associated with counting is the need to take many counts over fixed time
intervals (1-10 seconds) to obtain reliable results. Due to the high stability displayed by the
conversion electrode, the detector was operated in the cuffent mode. Nevertheless, counting
provided a secondary means to check on changes in detector gain.
98

3.4 Miscellaneous Equipment
While the apparatus described in the previous sections is sufficient to allow a
discussion of the dimer fragmentation experiments, it is worth mentioning four additional
pieces of equipment.
3.4.1 Iris Diaphragm
An iris diaphragm was employed to obtain the radial distribution of the molecular
beam at the exit of the skimmer and the radial distribution of the ion beam at the entranee to
the mass spectrometer, as described in section 4.5.3. The iris was obtained from a 35mm
camera and had a maximum clear aperture of 20mm. It was modifred for inclusion into the
interaction chamber. Figure 3.25 is a photograph of the iris diaphragm while the
configuration used for the experiments is shown schematically in figure 4.19.
Figure 3.25: Iris diaphragm
To prevent outgassing and charge accumulation on its surface the originally present
anodising layer and lubricating fluids had to be removed from the iris. With the iris at the
entrance to the mass spectrometer, the ion current transmitted and that striking the iris
diaphragm, could be measured separately,
A linear feed-through was calibrated against iris diameter using a series of standard
diameters, ie drill bits, the diameter of which was known. This allowed the radial
distribution to be measured continually over the range from 1 to 15mm.
The iris produced an aperture whose shape was sufficiently circular for radii greater
than -0,5mm, thus placing a lower limit on the measurement of the radial distribution.
99

3"4"2 Capilåany n-eaR<
For measurer¡"lents of the pulmping speed of the systern and for the experirnents
described in Appendix A a frxed capillary or standard leak was built. Figure 3.26 is a
photograph showing the capiilary leak and the display panel for the lealc inlet proSSlrro p1"n¡.
The capillary consisted of a silver t¡-rbe lm long and of an inside diameter -0.lmm. At the
input end of the capillary the pressuro pteak was measrrred with a piezoelectric pressure
transducer connected to a 100m1 gas reservoir.
When required the gas reservoir volume was increased by a 3 litre chamber to
provide increased pressure stability at high gas throughput. The leak throughput was
calibrated by measuring tl-re backgror.rnd pressure rise p¡, in a known volumeV and using the
following relationship
(3 3)
where Q is the leak throughput, p¡ is the stagnation pressure and t is the time. As expected
from the Poiseuille law, the throughput was proportional to p02, see figure 4.31.
Figure 3.26: The capillary leak
The capillary leak proved an invaluable tool throughout this work. It provided a
means of evaluating the degree of scattering present in the interaction chamber (see section
4.7).
O.t. n^p, = ï Jot' pu )) p¡
100

3.4.3 ScatterÅsÈg Ceål
A gas scattering cell was oonstructed so that the ratio of the gas kinetic cross-section
for the neutral argon monomer and dimer could be measured, see section 4.7 .1. The'
scattering cell, pietured in flrgur a 3.27 "
consisted of a brass tube with a 75mm internal
diameter and two movable aluminium fixtures carrying 3mm diameter apertures. The cell
length could be adjusted between 20 and 30n'rm by altering the separation of the two
fixtrlres.
Figure3.27: The scattering cell.
This cell could be placed on the axis of the molecular beam in the centre of the
interaction chamber. Gas could be introduced through one of the cell ports and the
attenuation of the molecular beam through scattering could be measured as a function of the
pressure within the cell, as determined by a membrane manometer attached to the second
pofttì. Measurements of the argon monomer and dimer scattering are included in section 4.7
3"4.4 QuadrupoEe Mass spectrtrnet€r
A Varian ARGA quadrupole mass spectrometer with a mass range of 1-100amu was
attached to the interaction throughout this work. The use of different flange adaptors
allowed the spectrometer to be connected to the interaction chamber in7 Positions.
It was put to several uses throughout this work, such as a helium leak detector or as a
means of looking for impLrrities present in the molecular beam and as a detector in the
scattering cell measurements of section 4.7.
8 Tl.rir ar.angetneut is shown schernatically in fìgure 4.30.
101

3.5 Future Reflrnements
With the benefit of hindsight three desirable refinements to the apparatus have
become apparent. V/hile not exhaustive, they represent areas where progress could be
expedited.
3.5.1 Automated Data Acquisition
After taking a large number of readings manually and making a similar number of
adjustments to the stagnation pressure, electron energy and mass spectrometer accelerating
potential, it is appropriate that a comment on possible automation and computer data logging
be made.
The addition of a Keithley 613 Digital Electrometer (or a similar instrument) with a
GPIB or RS232 interface facility would prove invaluable. This would allow much higher
accuracy than is cuffently available by digitising the recorder output of the 610C Keithley
electrometet.
Compuûer data logging employed in conjunction with computer controlled power
supplies would represent a powerful refinement to this apparatus. The electron gun power
supply has been designed so that individual potentials could be replaced by computer
controlled modules. This facility would, for example, permit the relative ionisation cross-
section of gases to be obtained automatically. That is, the electron energy would be set and
the corresponding focussing potential appted to the electron gun zoom lens automatically.
The current could be read and the difference obtained aftor automatic operation of the flag.
Automatic data acquisition would save considerable time and permit real time data analysis
through the use of commercially available spreadsheets. Similarly, automation would favour
the use of phase locked detection.
On a similar note the mass spectrometer power supplies could be computer controlled
to allow automated mass scans of the molecular beam or configured to monitor specific mass
lines (eg monomer and dimer signals) with time.
While power supplies could be automated with ease, automatic pressure control and /
or measurement within the tolerances required for this work may prove to be somewhat more
difficult.
Computer data logging would also enable the Daly detector to be more easily
operated in the counting mode, which would be useful from time to time.
102

3.5.2 Improved lris Diaphragm
Although only indirectly connecæd to the fragmentation problem, if one wishes to
pursue further measurements of the molecular beam structure, ie the radial distribution of the
various cluster sizes within the beam (as discussed in section 4.5.3), there is a need for a more
reliable iris diaphragm which will permit accumte measurements to -0.25mm radius. The
difficulty with the present affangement stems partly from the somewhat improvised manner in
which the iris is coupled to the feed-through and partly on the construction of the iris itself.
A signifrcant improvement would be obt¿ined if the äs was obtained from the
manufacturer, unanodized and free from high vapour plessure materials. Similarly, using a
high quality slimline iris diaphragm with a shape circular well below lmm in diameter would
represent a significant gain.
Using a vacuum compatible linear actuator to control the iris diameter from within the
interaction chamber would allow the iris coupling to be simplified by removing the need for a
linear feed-through. The actuator and iris could be assembled and calibrated as one unit
outside of the vacuum syst€m, similarly, it could be more easily mounûed within the chamber.
3.5.3 Time of Flight Mass Spectrometer
A relatively simple time of flight mass spectromster used in conjunction with the
sector mass spectrometer would provide additional information on the fragmentation channels
present in the unimolecular decay of clusters after ionisation. While many researchers have
investigated the unimolecular decay processss of a large number of cluster types and sizes, a
systematic study of the decay rates as a function of electron energy would be a useful
addition.
The pulsed electron beam necessary for such experiments could easily be achieved by
minor modifications to the electron gun.
103

3.6 Conclusion
The apparatus described in this chapter is capable of producing small clusters without
the need for pulsed molecular beam techniques. Clusters ions are formed through electron
impact on a supersonic molecular beam, and are detected in a magnetic sector field mass
spectrometer. The use of a high gain Daly detector allows the detection of low ion currents.
However, the detectors sensitivity for each species must be taken into account, if absolute
measurements are to be recorded.
To get long term stability of the electron-ion optical performance it is desirable to
reduce the growth of contamination on the lens electrodes. For this, the use of
perfluoropolyether diffusion pump fluid proved to be very beneficial.
Provision of a large ballast volume allowed the diffusion pump to be operated for
lengths of time without being connected to a rotary pump, thus reducing contamination from
the latter.
When designing a low energy elecffon gun, without using a collimating magnetic field,
it is important that the magnetic field remain smaller than the earth's field strength. This
implies the use of suitable magnetic shielding and the appropriate placement of magnetic
sources.
In chapter 4 the readers attention is drawn to those factors that may introduce error
into the fragmentation experiments of chapter 5, and how they relate to this equipment.
104
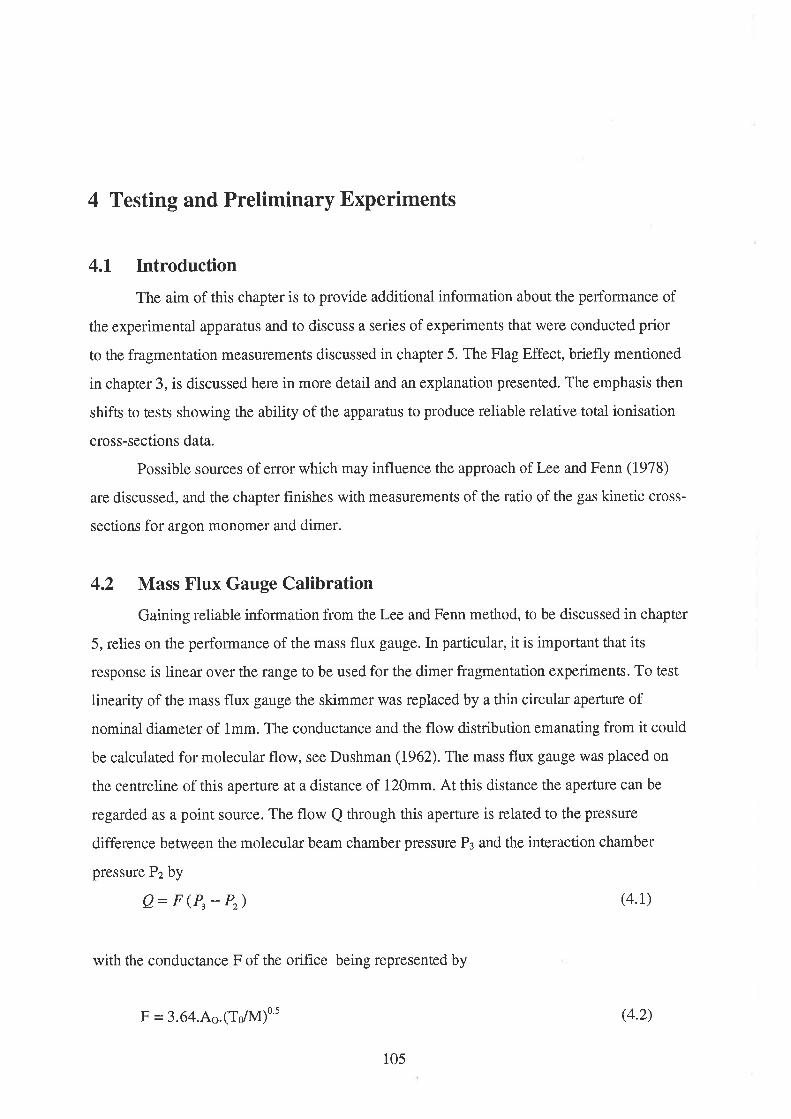
4 Testing and Preliminary Experiments
4.1 Introduction
The aim of this chapter is to provide additional information about the performance of
the experimental apparatus and to discuss a series of experiments that were conducted prior
to the fragmentation measurements discussed in chapter 5. The Flag Effect, briefly mentioned
in chapter 3, is discussed here in more detail and an explanation presented. The emphasis then
shifts to tests showing the ability of the apparatus to produce reliable relative total ionisation
cross-sections data.
Possible sources of error which may influence the approach of Lee and Fenn (1978)
are discussed, and the chapter finishes with measurements of the ratio of the gas kinetic cross-
sections for argon monomer and dimer.
4.2 Mass Flux Gauge Calibration
Gaining reliable information from the Lee and Fenn method, to be discussed in chapter
5, relies on the performance of the mass flux gauge. In particular, it is important that its
response is linear over the range to be used for the dimer fragmentation experiments. To test
linearity of the mass flux gauge the skimmer was replaced by a thin circular aperture of
nominal diameær of 1mm. The conductance and the flow distribution emanating from it could
be calculated for molecular flow, see Dushman (1962). The mass flux gauge was placed on
the centreline of this aperture at a distance of 120mm. At this distance the aperture can be
regarded as a point source. The flow Q throtrgh this aperture is related to the pressure
difference between the molecular beam chamber pressure Ps and the interaction chamber
pressure Pz by
Q= F (P, - Pr) (4.1)
with the conductånce F of the orifice being represented by
F = 3.64.Ao.(T/M)ot
105
(4.2)

where M is the molecular weight and To is the usual source temperature, and the aperture
area, in cm', is equal to As. Seeing that in these experiments P: rwes of the order of
5x10 3torr and the pressure in the interaction chamber Pz wâS of the order of 10-6torr,
equation 4.2 can be writæn sufficiently accurately as
Q= F.Pt
In these expedments the pressure in the molecular beam chamber was adjusted by
varying the inlet pressure to the capillary leak, see section 3.4.2, and was measured with a
capacitance manometor calibrated against a Mcleod gauge.
The flow through the aperture was measured by observing the initial pressure rise in
the interaction chamber when the valve Vo waS closed and the pressure P3 wâS kept at a
constant value. As seen in figure 4.la, this initial pressure rise, as measured with an ionisation
gauge, is linear with time and, moreover the slope obtained is a linear function of the pressure
P3, âS shown in figure 4.1b.
From this latter slope the conductance of the orifrce is derived as 0.08L/s compared
with the value of 0.092L1s theoretically expected for a circular aperture of lmm. The
discrepancy may be explained in tems of small departul€s in the circularity of the aperture
and unceftainties in the calibration factor of the ionisation gauge.
101.0Orif ice diameter = 1mmArgon
(4.3)
F = 0.0801/s1mm
I
b
4
2
an
J
o.if
o.(|
Iox(¡)
U)U)(¡)
o-(l)-oE(ú-co
0,8
0.6
0.4
P3= 4'5x10⁻³torr
O rifice diam eter = 1 m m
V. =351cnam Derso,'= 1 '4
-4Q = 4,67x10 torr
O
x
=o
(¡)-oE(ú
oo)L
V6 closed0.2
i0.0 0
0 2468Time (seconds)
02468Mol Beam chamber pressure (xto-3
10
to rr)
(a) O)
Figure 4.1: Pressure time curve (a) for a lmm diameter orifice connecting the two
chambers. The inter-chamber flow, curve (b), as a function of the molecular beam chamber
pressure.
106
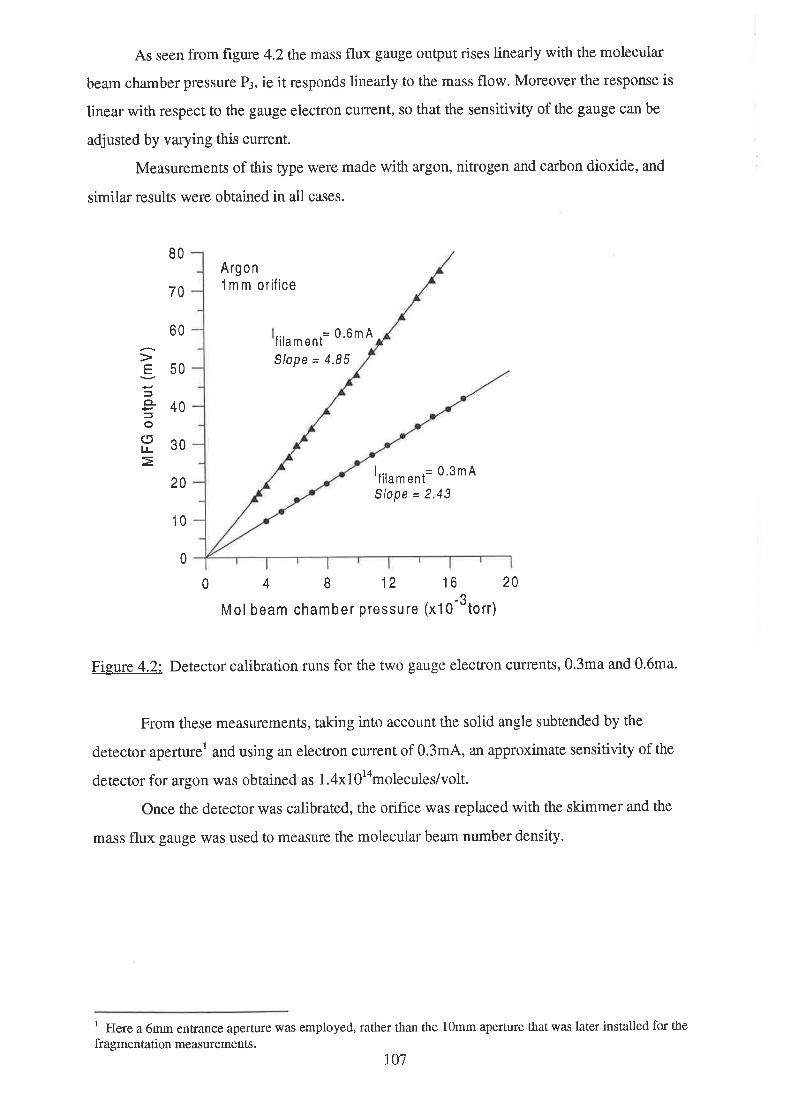
As seen from hgure 4.2 the mass flux gauge output rises linearly with the molecular
beam chamber pressure P3, ie it responds linearly to the mass flow. Moreover the response is
linear with respect to the gauge electron current, so that the sensitiviry of the gauge can be
adjusted by varying this current.
Measurements of this type were made with argon, nitrogen and carbon dioxide, and
similar results were obtained in all cases.
80
70
Argon'lm m orifice
60 = 0.6m4filam ent
50Slope = 4.85
40
30
201... .= 0.3m4lrlam enlSlope = 2.43
10
0
E
Joo(5LL
0 I4 12 16 20-3
M ol beam chamber pressu re (x1 0 torr)
Figure 4.2: Detector calibration runs for the two gauge electron currents, 0.3ma and 0.6ma.
From these measurements, taking into account the solid angle subtended by the
detector aperturel and using an electron current of 0.3m4, an approximate sensitivþ of the
detector for argon was obtained as l.4xlOlamolecules/volt.
Once the detector was calibrated, the orifice was replaced with the skimmer and the
mass flux gauge was used to measure the molecula¡ beam number density.
t Here a 6mm entrance aperture was employed, rather than the 10mm aperture that was later installed for the
fragmentation measurements.IO7

4.3 The Flag Effect and the Extraction Potential
It was found that when the flag was operated, to intenupt the molecular beam, it took
a considerable time for the ion current in the system to become stabilised. Since the effect of
operating the flag is primarily to slightty change the gas flow in the interaction chamber, and
since the vacuum time constant within the system was a small fraction of a second, the
observed ion current stabilisation times of a number of minutes could only be due to a
charging up effect, somewhere in the system.
Experimentation eventually found the ionisation box to be the seat of this effect. To
understand its nature and to eliminate its effect the usual extraction optics were removed and
replaced by a shielded Faraday cage locaæd 5mm from the extraction electrode. This cage
could be placed at up to -200 volts with respect to the extraction electrode, although it was
typically kept at the extraction potential. The ion collection configuration used to investigate
the flag effect is shown in figure 4.3.
ElectronTrop
Posilionerlonisqtion box
Shielded ForodoyCoge
Moleculor -Tl outer
beom lnner
E Vcoge
l0v -50v
GND
Figure 4.3: Ion collection configuration with the Faraday collector located 5mm behind the
ionisation box.
The flag effect is shown in figure 4.4a which shows a typical variation of the Faraday
cage cuffsnt with time. The slow current response was undesirable for the subsequent
fragmentation studies and needed to be eliminated. The measurements of figure 4.4a wete
made with the initial choice of material for the ionisation box, namely stainless steel. The
sluggish cuffent response could not be significantly diminished by cleaning the intemal box
fVextroct
ElectronGun
108

surface, but it could be practically eliminated if the stainless steel was replaced by materials
such as nickel, copper or molybdenum. It could, however be reinÍoduced if the inside
surfaces were coated with an insulating film, demonsffating the importance of maintaining a
clean sutface.
2.02.0
0.8 0.8
2
0.4 I 0.4Flag Out F lag ln ln
0.0 0.0
0.0 0.5 1 .0 1 .5 2.0 2.5 0.0 0.5 1.0 1.5 2'0 2.5
Time ( lO3seconds) Time ( l03seconds)
(a) 0)Fi_sure 4.4: Traces of ion current versus time where the step reflects the removal of the
flag from the molecular beam. Curve (a) is for the case where the Flag effect is present
(stainless steel box) while in the case of curve (b) the effect has been removed through the use
of a molybdenum box.
Figure 4.4b shows the ion current response for a molybdenum box that was used in all
subsequent experiments. The fact that the flag effect was significant with stainless steel but
not with any other clean metal suggests that it is due to charge accumulation on the quasi-
dielectric passivating layer on stainless steel. The following observations illuminate the effect
in more detail.
The flag effect was not present with the molecular beam off, illustrating that it was not
due to the movement of the flag per se. However, the effect was present if the molecular
beam was intem¡pted, not by the flag but by opening and shutting the solenoid valve in the
gas line. Experiments showed conclusively that the unscattered electron beam did not cause
the charge accumulation. In cases where the beam was periodically prevented from entering
the ionisation box2, the ion current response was similar to that of figure 4.4a caused by
2 To prevent any influence from possible surface charges on the electrodes ofthe gun itself, all potentials
within the gun were kept constant and beam iutenuption was achieved by applying a retarding potential at the
entrance to the ionisation box.109
.6U'
=c=-o(õ
Cc)
()c.o
6
2
U'
=-o(ú
cc)
(Jco
+Fla g
1F ag Out

interruption of the molecular beam. This experiment shows that the flag effect is solely due to
the intersection of the molecular and electron beams being intemrpted. The flag effect
experiments were conducted at several electron energies as well as at various electron beam
cuffents in the range from 0.1 to 2¡.tA, and in all cases the effect was pfesent.
Increasing the extraction potential increased the ion energy, making the ions less
sensitive to the surface potentials within the box, thus reducing the time constant associated
with operating the flag effect. However, the effect was not entirely removed, even at fairly
large poæntials. The flag effect could be influenced in a similar manner by increasing the area
of the extraction apefture, which increased the penetration of the extraction field within the
box.
Following routine cleaning of the gun and the ionisation box, a slight reduction in the
magnitude of the flag effect was observed, indicating a surface dependent phenomenon.
While the effect could be conrolled by suitable choice of materials for the ionisation
box and whilst it was understood in terms of surface charge accumulation, two interesting
questions were left unanswered. Was it ion or electron attachment to the surface, and what
was so special about stainless sæel ? These questions are discussed in more detail in
Appendix C.
I on Extractíon P otentíal
Even if a suitable material for the ionisation box , for example molybdenum, is chosen
it can in the course of time acquire a degree of contamination on which surface charges can
accumulate, albeit to a small extent. To counteract this a sufficiently large extraction potential
was needed. On the other hand the extraction potential will effect the space potential within
the ionisation box and, as a consequence, the electron energy at which ionisation takes place
will be some what different from the energy determined from the potential of the final
electrode of the electron gun. This shift in the effective ionisation potential can be of
relevance, particularly when measurements near the ionisation potontial are to be made.
Table 4.1 shows the effect of the extraction potential on the space potential in the
ionisation volume for my particular geometry, see figure 3.18. The values in the table were
obtained by modelling the ionisation box using the ion trajectory computer package
Macsimion.
It0

Extraction potential
(volts wrt box)
Space potential
(volts wrt box)
0 0.0
t2 0.25
20 0.4
30 0.65
Table 4.1: Space potential at the centre of the ionisation volume as a function of the
extraction potential.
As the thermal energy distribuúon from the thermionic emitter was of the order of
0.6 eV, and the determination of accurate appealance potentials was not the aim of this work,
the extraction potential was set at -l2volts. This produced a stable ion current for all electron
beam energies in the range 15 - 500 eV.
The ion current was reproduced within -2Vo ftom day to day, with the molecular beam
and electron gun parameters unchanged, even afte r - 1000 hours of operation of the elecffon
gun at beam currents between 0.1 - 0.6 uA. Results from the relative ionisation cross-sections
experiments, see section4.4, indicate that the appearance potentials are within 0.5eV of the
values recorded in the literature (see section 4.4.3).
111
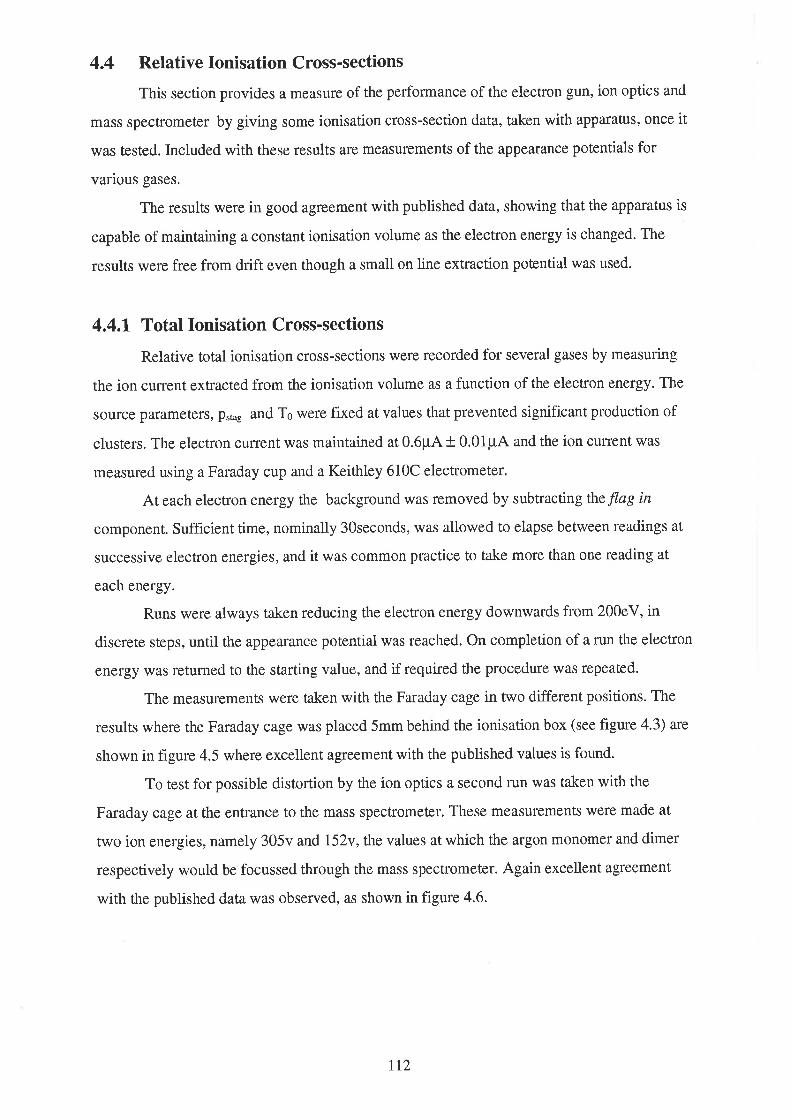
4.4 Relative Ionisation Cross-sections
This section provides a measure of the performance of the electron gun, ion optics and
mass spectrometer by giving some ionisation cross-section data, taken with apparatus, once it
was tested. Included with these results are measurements of the appsarance potentials for
various gases.
The results were in good agreement with published data, showing that the apparatus is
capable of maintaining a constant ionisation volume as the electron energy is changed. The
results were free from drift even though a small on line extraction potential was used.
4.4.1 Total Ionisation Cross-sections
Relative total ionisation cross-sections were recorded for several gases by measuring
the ion current extracted from the ionisation volume as a function of the electron energy. The
source parameters, psøg âild To wero fixed at values that prevented significant production of
clusters. The electron current was maintained at 0.6p4 + 0.01p4 and the ion cument was
measured using a Faraday cup and a Keithley 610C electrometer.
At each electron enorgy the background was removed by subtracting the flag in
component. Sufficient time, nominally 30seconds, was allowed to elapse between readings at
successive electron energies, and it was common practice to take moro than one reading at
each energy.
Runs were always t¿ken reducing the electron energy downwards from 200eV, in
discrete steps, until the appearance potential was reached. On completion of a run the electron
energy was returned to the starting value, and if required the procedure was repeated.
The measuroments were taken with the Faraday cage in two different positions. The
results where the Faraday cage was placed 5mm behind the ionisation box (see figure 4.3) are
shown in figure 4.5 where excellent agreement with the published values is found.
To test for possible distortion by the ion optics a second run was taken with the
Faraday cage at the entrance to the mass spectrometer. These measursments were made at
two ion energies, namely 305v and 152v, the values at which the argon monomer and dimer
respectively would be focussed through the mass spectrometer. Again excellent agreement
with the published data was observed, as shown in figure 4.6.
tt2

2.5
2.0
1.5
1,0
0.5
tçecEo3tC lo ra,
E,sr
¡ Present data
o Krishnakumar & Srivastava(1988)
(t)oE(ú
oF
x
c(l)L
OLo
oF
.tooo
oao
8o
oa
ôa
a
a
0.0
2.0
1.5
1,0
0,5
0 40 80 120 1 60Electron Energy (ev)
200
Ito+ o+o
lo*
¡ Monomer energy (305V)
+ D im er energy (1 52V)
o Krishnakumar& S rivastava (1 988)
200
Figure 4.5: Relative total ionisation cross-section for argon, where the collection
configuration of figure 4.3 is used ( L = 0.6p4, P.t g = 2440torr, To=300'K ).
2.5
(t)o-E(6o
I
Ox
c(l)LL
=()co
Io
+
I+
+
0.0
0 40 B0 120 1 60
Electron Energy (ev)
Fi-eure 4.6: Relative total ionisation cross-section for argon, with the Faraday cage located
at the entrance to the mass spectrometer. ( I" = 0.6p4, pstag = 2440torr, To=300"K ).
113

The fact that in the energy region of interest the transmission of the ion optics is
energy independent is seen from the fact that the two measured curyes represent the data, not
normalised in any way. On the other hand, the open symbols are the data of Krishnakumar
and Srivastava (1988), normalised, as before, to my data at 100eV.
While total ionisation data are useful, they do not allow separation of the individual
ion species. To overcome this, the ion beam was allowed to pass through the mass
spectrometer and relative partial ionisation cross-sections were taken.
4.4.2 Partial Ionisation Cross-sections
Relative partial ionisation cross-section data was taken with both the Faraday cage,
and the Daly detector. This allowed the Daly detector and the overall performance of the
systrem to be checked for discrimination with electron energy. As with the last section the
cross-section data for argon was compared to the results of Krishnakumar and Srivastava
(1e88).
The data for argon are represented in figure 4.7 fot channels,
Ar * e -s Ar* +2e
Ar*e+ Ar2'+3e
In the figure the crosses are used to designate the data of Krishnakumar and Srivastava
(1988), which are normalised to my values at 100eV. The good agreement between the
Faraday cage and the Daly detector ion current measurements is highlighted in figure 4.7 f.or
Ar*, where the Daly detector output is normalised to the Faraday cage at 100eV.
As in the previous cases the agreement between these results and the data of
Krishnakumar and Srivastava (1988) is good. There is also excellent agreement with my
values and those of Krishnakumar and Srivastava (1988) for doubly charged argon, again
showing that there is no energy discrimination in the range of interest.
tt4

25
.t)o-E(d
Iox
c(¡)L¿(J
o)Eoco
2.0
1.5
+A r
ìa+
Ê
*a
A
A+
2+r
ôâ*¡iâi+^.
o Faraday Cage
a Daly Detector
* Krishnakumar& Srivastava(1988)
1.0
0,5A
++++++++++
40 80 120 1 60 200
Electron Energy (ev)
Fi-eure 4.7: Relative partial ionisation cross-section data for argon ( L = 0.6p4, psmg =
2440torr, To=300oK ). In the case of singly ionised monomer cross-section the Daly detector
cuffent is normalised to the Faraday cage (raw data) at 100eV.
Figure 4.8 displays the relative partial ionisation cross-sections for COz, Nz and Oz
measured using the Daly detector. As in the case of argon, the source parameters were set to
values preventing signif,rcant cluster formation. In all cases the open symbols represent the
values from the literature normalised to my data at 100eV.
0.0
0
115

30+co
2
25
ttc!9oÊolorofoatr
Itrã o ..o- g(t,
=cf-o(ú
co)L
f()co
20
15
10
0
25
20
15
10
0
8oo
lo
atrOsa
9od
toÊtr
+
¡ao
n Rapp & Englander-Golden (1965)
O 0rient & Srivastava (1987)
o Present data
ëo
200
5
0 40 80 120 1 60
Electron Energy (eV)
(a)
N2
¡atr¡ortrltr3 3 8lso
strEItro
(t).=cf-o(d
E(l)
Joco
rt tra
tra
o
5
o Mark (1975)
o Rapp & Englander-Golden (1965)
¡ Present data
0 40 80 120 1 60
Electron Energy (eV)
(b)
200
116

trOSotr
tEotr
úObtr
+
2o
5
4
'tÊûctatrv.tr).3?
¡tro¡tro
Êoro¡ t..oJ(t).=cJ
-o(ú
C,(¡)L
=()co
tra
oo
3
to oo
o Mark (1975)
tr Rapp & Englander-Golden (1965)
¡ Present data
0 40 80 120 1 60 200Electron Energy (ev)
(c)
Figure 4.8: COz (a), Nz 0) and Oz (c) relative ionisation cross-sections, taken using the
Daly detector. The solid circles are the data from this work while the open symbols are the
literature values normalised at 100eV.
It is interesting to note that my data for Oz* and Nz* differ in a systematic way from
those of Märk (1975) yet shows good agreement with the data of Rapp and Englander-
Golden (1965). Similarly I have good agreement with the data of Orient and Srivastava
(1987) and Rapp and Englander-Golden (1965) for COz* and Nz*. This suggests that the data
of Mark (1975) and later that of Helm, Stephan and Mark (1979) and Sæphan, Helm and
Märk (1980) show for the rare gases a steeper decrease at high energies than may actually be
the case3.
The quality of the relative ionisation cross-section data and the fair agreement with
other researchers provides the reliability necessary to measure dimer relative fragmentation
probabilities, to be discussed in chapær 5.
3 A number of authors have observed discrepancies when comparing their daø to that of Märk and co-
workers. For example Rao and Srivastava (1992) for the ionisation of NH3, Charlton et al (1988) for the
ionisation of helium. Discrepancies are also reported by Krishnakumar and Srivastava (1988,1990) and Orientand Srivastava (19854 1985b, 1987).
TT7
2
1
0

4.4.3 Appearance Potentials
A check on the electron energy scale was accomplished by measuring the appearance
potential at which ions could be detected, and comparing these to known thresholds for single
ionisation. V/hile the absence of an electron monochromator prevented accurate threshold
measurements, it did allow a check for larger offsets in the appearance potential to be
conducted.
Threshold measurements were taken with the Daly detector and as with all detector
measurements, the electron gun and photomultiplier were operated for several hours prior to
data collection to eliminate drift.
The argon ionisation cross-section, displayed in figure 4.9, shows a threshold equal to
15.6 + 0.1 eV, which is in good agroement with the accepted first ionisation potential, E*
p=15.76eV.
60 a+
50 +Ar
U)
=c=-oL(ú
L(l)
=C)co
2 -=.-,I a
40
+
30a
+20
a
10+
12 13 14 15 16 17
Electron Energy (eV)18
Figure 4.9: Near threshold relative ionisation cross-sections for Ar * e + Ar* +2e and
Arr*e+Arr++2e.
oa
a
++
tI
Ar'o
0
118

Table 4.2 lists my measured appearancs potentials and the corresponding literature
values for the first ionisation poæntials for a series of gases. My value for Arz is lower, by a
few tenths of an eV, than that measured for argon, which is in agreement with the results of
Helm et al(1979).
Gas Measured Appearance
Potential (eV.)
First Ionisation
Potential (eV.)
Ar 15.5 + 0.1 15.76
Arz 15.2 !0.1 t5.2
Ne 2r.3 !0.1 2r.56
Kr r4.4 + 0.1 14.0
COz 14.1 + 0.1 14.4
Nz t4.2 + 0.1 14.54
Oz r3.2!0.1 13.61
Tabte 4.2: Measured appearance potentials for various gaseso
The ionisation potential data, except for Arz, were taken from von Ardenne (1956).
These results indicate that the energy scale is correct roughly within the thermal energy spread
of the electrons emitted by the filament.
a The uncertainty in the appearance potentials reflects the scatter in the measurements nea¡ threshold, rather
than the spread in the elect¡on beam energies resulting from thernionic emission.
119
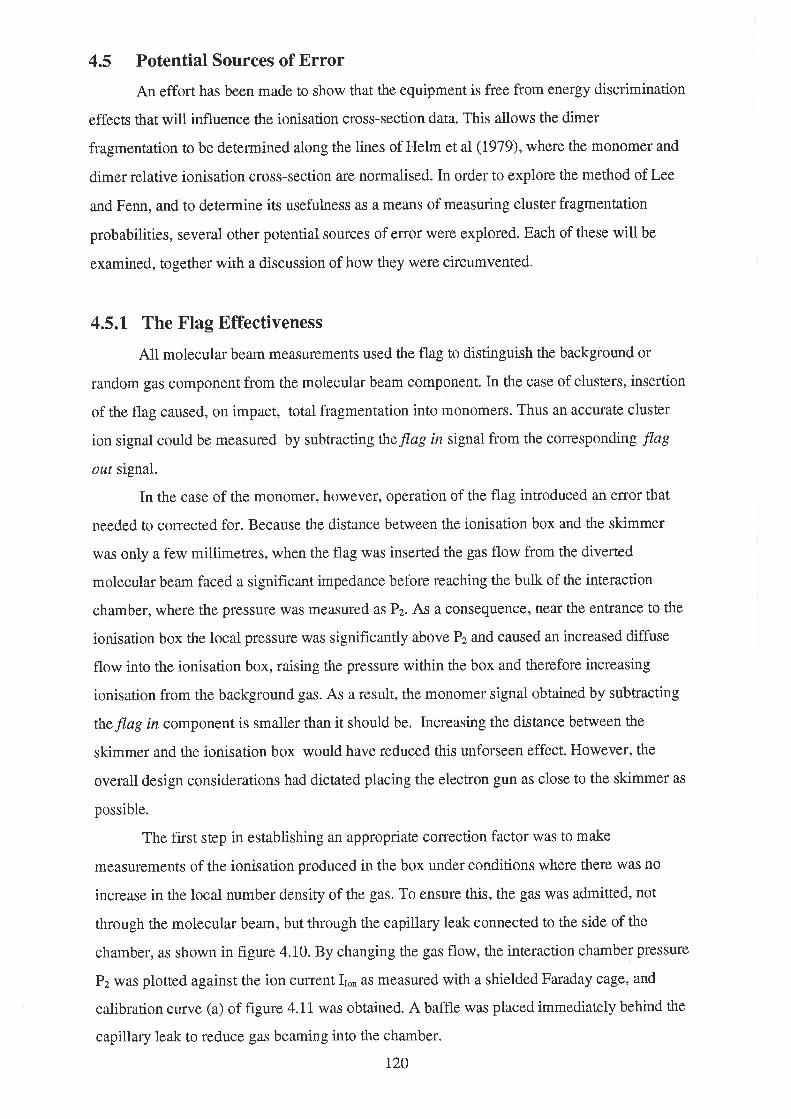
4.5 Potential Sources of Error
An effort has been made to show that the equipment is free from energy discrimination
effects that will influence the ionisation cross-section data. This allows the dimer
fragmentation to be determined along the lines of Helm et al (1979), where the monomer and
dimer relative ionisation cross-section ars normalised. In order to explore the method of Lee
and Fenn, and to determine its usefulness as a means of measuring cluster fragmentation
probabilities, several other potential sources of error were explored. Each of these will be
examined, together with a discussion of how they were circumvented.
4.5.1 The Flag Effectiveness
All molecular beam measurements used the flag to distinguish the background or
random gas component from the molecular beam component. In the case of clusters, insertion
of the flag caused, on impact, total fragmentation into monomors. Thus an accurate cluster
ion signal could be measured by subtractingtheflag in signalfrom the corresponding flag
out signal.
In the case of the monomer, however, operation of the flag introduced an error that
needed to corrected for. Because the distance between the ionisation box and the skimmer
was only a few millimetres, when the flag was insefted the gas flow from the diverted
molecular beam faced a significant impedance before reaching the bulk of the interaction
chamber, where the pressure was measured as Pz. As a consequence, near the entrance to the
ionisation box the local pressure was significantly above Pz and caused an increased diffuse
flow into the ionisation box, raising the pressure within the box and therefore increasing
ionisation from the background gas. As a result, the monomer signal obtained by subtracting
the flag in component is smaller than it should be . Increasing the distance between the
skimmer and the ionisation box would have reduced this unforseen effect. However, the
overall design considerations had dictated placing the electron gun as close to the skimmer as
possible.
The first step in establishing an appropriate comection factor was to make
measurements of the ionisation produced in the box under conditions where there was no
increase in the local number density of the gas. To ensure this, the gas was admitted, not
through the molecular beam, but through the capillary leak connected to the side of the
chamber, as shown in fìgure 4.10. By changing the gas flow, the interaction chamber pressure
Pz wâs plotted against the ion current Iroo âS measured with a shielded Faraday cage, and
calibration curve (a) of figure 4.11 was obtained. A baffle was placed immediately behind the
capillary leak to reduce gas beaming into the chamber.
L20

ElectronGun
Bofne
P2
cr¡ter
Boffrê
lhn*
ElecfrorìTrop
Shlelded ForodoyCoge
3tGosBollost
RotoryRrmp
t¡fêssure
Beom
Flogpo$loner
(bloc*lrrg
lnlerocflon Chomber
lon gougo(clumbetgeswre)
PreEsJre
Chomber
Node
Copllorytre0k
Fi-eure 4.10: Schematic of the Flag Effectiveness experiment.
This calibration was repeated with the IG5 gauge located at three different positions in the
chamber. The same results were obt¿ined indicating that there were no gas beaming effects
and no pressure gradients.
Curve (a) established the linea¡ relation between the chamber pressure and the ion
cuffent, which should be independent of the manner in which the gas enters the chamber,
provided the gas is uniformly distributed.
In the second phase of the experiment the capillary leak was shut off and the
molecular beam used to introduce the gas into the chamber. To prevent the beam from
entering the ionisation box the flag was placed in the /n position. A new calibration curve was
taken with the flow into the chamber varied by adjustment of the stagnation pressure. The
result in curve (b) is likewise linear, however it shows a significantly higher ion current than
that of curve (a) for the same pressure P2 meâsured by the ionisation gauge, ie for the same
gas flow into the chamber. The ionisation current is a direct measure of the local pressure
within the box and the results confirm that the flag is not completely effective, and that it
allows an additional component of diftise gas to enter the ionisation box. As a result of this
the pressure within the box is raised above Pz by a factor given by the ratio of the slopes of
curves (b) and (a).
t2t
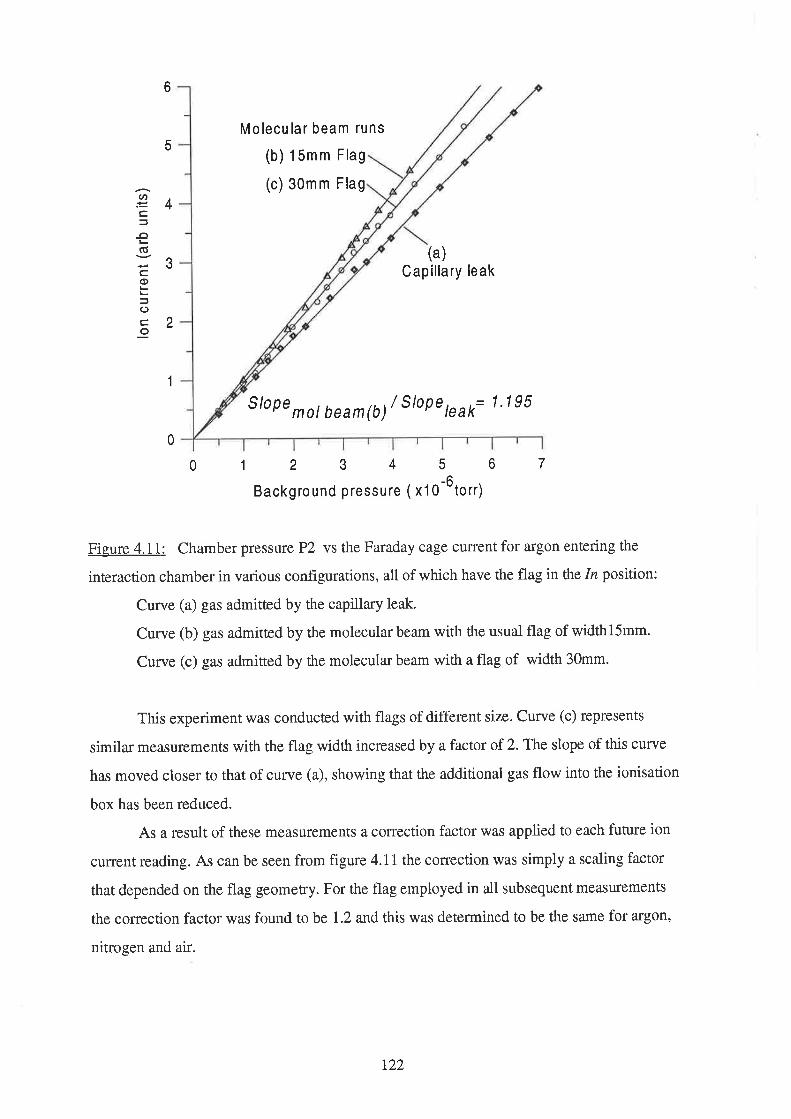
6
(t,
=c¿-oL(ú
C(l)
f()co
5
4
3
2
0
Molecu lar beam runs
(b) 15mm Flag
(c) 30mm Flag
(a)Capillary leak
Slope^0, beam¡6¡/ Slopeþak= 1.195
1
01234567-ô
Background pressure ( x10 to rr)
Figure 4.1 1: Chamber pressure P2 vs the Faraday cage cuffent for argon enæring the
interaction chamber in various configurations, all of which have the flag in the In position:
Curve (a) gas admitæd by the capillary leak.
Curve (b) gas admitæd by the molecular beam with the usual flag of widthl5mm.
Curve (c) gas admitted by the molecular beam with a flag of width 30mm.
This experiment was conducted with flags of different size. Curve (c) represents
similar measurements with the flag width increased by a factor of 2. The slope of this curve
has moved closer to that of curve (a), showing that the additional gas flow into the ionisation
box has been reduced.
As a result of these measurements a coffsction factor was applied to each future ion
current reading. As can be seen from figure 4.1 I the correction was simply a scaling factor
that depended on the flag geometry. For the flag employed in all subsequent measurements
the correction factor was found to be 1.2 and this was determined to be the same for argon,
nitrogen and air.
t22

4.5.2 The Ionisation Volume
The ionisation volume is the volume of intersection of the molecular and electron
beams. It is centrally located in the ionisation box and is the region from which the ions are
extracted.
If the intersection of the two beams changes during an experiment errors can arise.
Such a change may occur in ¡vo ways. Firstly, the elecffon beam shape may alær as the
electron energy is varied. At low electron energies below -20eV this would not be surprising
as the zoom lens is functioning as a retarding lens and large aberration may be present.
Moreover, the electron trap measurements indicate that the beam is not as well collimated at
energies below 20eY as it is for energies above 30eV.
Secondly, changes in the intersection volume may arise from changes in the shape of
the molecular beam. In the case of the relative ionisation cross-section measurements where
the source conditions are unchanged, the molecular beam will be constant. However, in the
Lee and Fenn method, where the stagnation pressure is increased to create a molecular beam
containing a small concentration of dimers, the size of the molecular beam will change.
From the radial density distribution measurements of the molecular beam, to be
described later in this chapter, it was observed that both the size and the radial density
distribution of the molecular beam change as the stagnation pressure is altered. Figrtte 4.I2
schematically illustrates the effect a large change in the stagnation pressure may have on the
interaction volume.
Moleculor beom divergenceHigh stognofion Low stognotion
Skimmer
NozzleAxis ofpropogotion
lnteroclionvolume(low p*)
Electron beom(into the pqge)
Figure 4.12: Schematic diagram of the possible change in shape of the interaction volume as
the stagnation pressure is increased.
This effect was observed with argon and a 65pm diameter nozzle in the following
manner. The flow into the interaction chamber Q, the monomor current I-on and the mass flux
t23

nolsl woro measured as the stagnation pressure was increased from po = 0 to p-*=2000torr,
with T0=2500K. The nozzle-skimmer distance was f,rxed at 10mm.
For both the flow Q and the mass flux n-o1the result was a straight line, as shown in
figure 4.13, indicating that the flow into the chamber was linear, and that the beam was not
significantly scattered. On the other hand, the monomer signal displayed a significantþ
different behaviour, see figure 4.14. The initial rise with stagnation pressure was linear,
however, a threshold was observed, beyond which the curve fell below the expected linear
rise. At this point it is worth noting that the flag efficiency experiments, described in the
previous section, were all conducted in the initial linear region.
1.5Argo n
To= 25ooK
dn= 65um
d = 10mmns
0.4
Total Flow
1.0
0,2
0.5
0.1
0.0 0.0
0 500 1000 1500Stagnation pressure (torr)
2000
(t)
=o
o-
o(5LL
30U)
J
o
oxøtoLL
Got--
CÐ
Figure 4.13: Total flow, Q and mass flux gauge output versus stagnation pressuro, p6
The initial incorrect interyretation was that the departure from linearity was solely due
to the production of neutral dimers in the molecular beam, which is the crux of the Lee and
Fenn approach. On the other hand, the dimer cuffent only becomes measurable at pressures
substantially higher than those where the initial departure from linearity occurred, and the
dimer ion current was too small to account for the magnitude of the departure, even allowing
for any reasonable degree of fragmentation.
t24

10 100
310 K 2500 K
a'aaa
+++a +++
a ++
I I
2
0
500 1 000 1 500 2000 0 500 1 000 1 500 2000Stagnation Pressure (torr)
Figure 4.14: Ar+ current as a function of stagnation pressure for two nozzle temperatures.
(d" = 65pm, d* = 10mm, electron energy = 40eV, L = 0.2LtA).
Figure 4.14 shows two monomer runs, each at a different source temperatures Towith
the point of departure indicated by an arrow. If dimer formation were the only process
involved in the departure from linearity one would expect this departure to be shifted to
higher pressures as the source temperature is raised and dimer production is lowered. In fact
linearity ceases at roughly the same stagnation pressure in both, and the departure is
comparable at both temperatures.
These measulrments were taken at the exit of the mass spectrometer when the ion
beam had traversed a distance of 70cm. To show that gas scattering does not cause the
departure from linearity the path over which scattering could occur was drastically reduced by
placing a Faraday cage immediaæly behind the ionisation box. For similar source conditions,
the total ion current was similar in shape to the curves of figure 4.14.
As will be shown in section 4.5.3, increasing the stagnation pressure has the effect of
increasing the molecular beam divergence and, hence the beam diameær within the ionisation
box. It follows, if we assume that the radial density within the beam is uniform, the most likely
cause of the non-linear ion current will be that the fraction of the molecular beam intercepted
by the electron beam decreases as the molecular beam diameter increases. It is also possible
that I am observing changes in the molecular beam radial number density as the stagnation
aI
6
4
(t)
--c=-o(õ
C,o)
=()C,o
+
I
6
4
2
0
0
I25

pressure is increased. This is supported by figure 3.10, where the mass flux gauge was used to
prof,rle the molecula¡ beam and the normalised beam density changes as the stagnation
temperature increased. In either case, the size of both the molecular and electron beams within
the ionisation box is very important.
While the monomer runs of figure 4.14 were very reproducible and the onset of non
linearity could be determined accurately, there exisæd no way to distinguish the deviation due
to dimer formation from the much larger non linearity due to changes in the molecular beam
shape. It might be thought that the solution would be to raise the temperature to ensure
negligible dimer formation. However, the fact that it was known that changes in nozzle
temperature could also bring about changes in the beam divergence (see figure 3.10), made
any such approach difficult to justify.
Another possible solution could be to construct a second electron gun with a
significantly larger beam diameter, so that the dependence of the ionisation volume on the
stagnation pressure would not be so great. This approach would have been both time and
resourco intensive, and as it later turned out was not required.
The first attempt at overcoming the problem involved restricting the molecular beam
diameter, thus confining the interaction volume to a known region. The ionisation box
entrance aperture was reduced from 10mm to 4.3mm and then to 2.4mm, with several runs of
total ion current versus stagnation pressuro taken at each setting. Results for the three
entrance apefiure diameters are displayed in figure 4.15, for anozzletemperature To-2500K.
4
3
Argon
To= 25ooK
d = 30umn
d = 10mmns
10mm ootrtr_
-4.3m m
.4mm
tI
0 1 000 2000 3000Stagnation pressure (torr)
Figure 4.15: Total ion current versus stagnation pressure for different ionisation box
entrance apertures.
('.r."K:"1o-E(d
ox
cc)
=C)c.9Cõ
oF
Otratr
atrtr
oo
2 atr
E
¡t
0
126

Only a slight change in shape is observed by reducing the aperture to 4.3mm,
indicating that the molecular beam diameter is roughly this size. This is consistent with earlier
measurements of molecular beam density profrles. In contrast, the2.4mm aperture produces a
large change in the shape of the curve and of the current measured. A comparison between
the 2.4mm and 10mm total ion currents, at 1500torr, indicates that approximately half of the
molecular beam is entering the ionisation box when the 2.4mm aperture is present.
A significant point is that the2.4mm run is linear out to larger pressures, ie po
-3000torr. This range of linearity is a reasonable one (for a 65pm diameter nozzle) for the use
of the Lee and Fenn method, see section 5.2.
My interpretation for the non-linearity at the high entrance aperture diameters is that
as it increases with pressure the diameter of the molecular beam becomes larger than that of
the electron beam which it intercepts. In consequence, a progressively smaller fraction of the
molecules are ionised. For a L4mm apertue the molecular beam entering the ionisation box
remains within the confines of the electron beam throughout and linearity results.
With the 2.4mm aperture in place, the Faraday cage was removed and the ion beam
detected after the mass spectrometer. Monomer runs were taken at a temperature of 3200K,
and linearity was observed for stagnation pressures between 1000 and 3000ton for a range of
electron energies.
The confinement of the interaction volume came at a price, which became evident
when the dimer current was me¿ìsured. While the 2.4mm aperture decreased the monomer
current to approximately half the original value, the dimer current was reduced by over an
order. Gas reflected by the aperture tended to scatter the molecular beam, increasing the
random gas component. If we assume that the dimer molecular diameter is twice that of the
monomer (ie monomer + monomer = dimer), then elastic scattering would constitute a factor
4 decrease in the dimer cuffent. The large reduction in the dimer cunent reflects the
preferential destruction of the neutral dimers in collisions. This reduction in dimer signal
rendered the use of the 2.4mm entrance aperturs impractical.
The method finally adopted to obtain linearity in the ion current - pressure relation
was entirely empirical. As was mentioned above, the departure from linearity is due to
changes in the molecular beam shape, and these variations depend on the operating conditions
in the expansion chamber, such as the stagnation pressure , úte nozzle diameter d' and the
nozzle- skimmer distance d*.
t27

These were systematically varied until the optimum results were obtained with a 30pm
nozzle and a d* in the range from 7 to 8mm. With these parameters linearity was obtained up
to -3200torr for To=320oK, which covered the range of interest (see figure 4.16).
Argon
TO= 320oK
d = 30umn
d =7mmNS
3.0
2.5
2.0
1.5
1.0
0.5
0.0
0 1 000 2000 3000Stag nation pressure (torr)
4000
Figure 4.16: Monomer ion current and total ion current versus stagnation pressure.
An interesting effect was seen when nozzle diameters greater than -50pm were
employed at d*>11mm. At large nozzle-skimmer distances (d^) the flow into the chamber
became non-linear at large stagnation pressures, although the amount of gas discharged from
the nozzle rose linearly. There appeared to be a stagnation pressure threshold, above which
the slope of the graph of molecular beam flow versus stagnation pressure showed a
pronounced change in slope, as shown in figure 4.17 wittr the 65¡rm diameûer nozzle that was
used previously.
The nozzle flow was checked and tbund to be linear with the stagnation pressure P.¡u,
by measuring P3 as a function of P.,"r. Similarly, the effect of scattering in the nozzle -
skimmer region was investigated by raising the molecular beam chamber pressure with ttre aid
of the capillary leak. That is, for a fixed stagnation pressure, the flow into the interaction
chamber was measured as a function of the molecular beam chamber pressure in the range
from 10 to 100mtorr, which was adjusted by varying the capillary leak rate. When
compensated for the background component, the flow was shown to be invariant under
changes in P¡, for nozzle skimmer distances between 5 and 12mm. Hence the non-linear
oE(g
I ox
C,c)
f(J
C.9(ú
oF
(t,
=C,J
-o(Ú
co)
f(J
c.9o)Eoco
6
5
4
3
2
Itotrl
1
0
m0n
t28
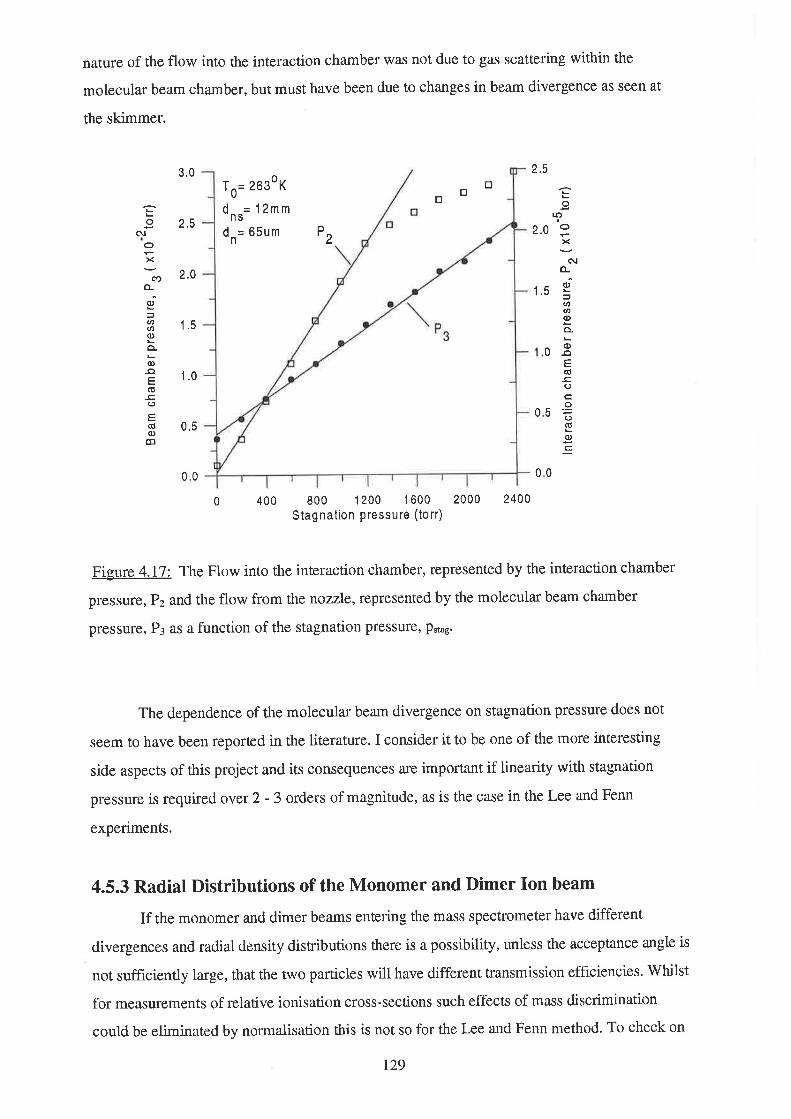
nature of the flow into the interaction chamber was not due to gas scattering within the
molecular beam chamber, but must have been due to changes in beam divergence as seen at
the skimmer.
3.0 2,5
To=
2630K
= 12mmNS
800 1200 1600Stagnation pressure (torr)
otr
o
xC\¡
fL(l)
anU)(¡)
o-(¡)-oE(ú
!oc.o()(õq)
c
rr)
0
05
00
tr
o
ox
cf,o-(r)
=.tU)(I)
o-
o)-oE(ú-c.c)
E(úc)
CD
d
2.5 d = 65umn
Pz 2.0 :
2.0
1.5
1.5
1.0
0.5
0,0
0 400 2000 2400
Figure 4.17: The Flow into the interaction chamber, represented by the interaction chamber
pressure, Pz and the flow from the nozzle, represented by the molecular beam chamber
pressure, Pg âs a function of the stagnation pressurel pstag.
The dependence of the molecular beam divergence on stagnation pressure does not
seem to have been reported in the literature. I consider it to be one of the more interesting
side aspects of this project and its consequences are important if linearity with stagnation
pressure is required over 2 - 3 orders of ma-enitude, as is the case in the Lee and Fenn
experiments.
4.5.3 Radial Distributions of the Monomer and Dimer lon beam
If the monomer and dimer beams entering the mass spectrometer have different
divergences and radial density distributions there is a possibility, unless the acceptance angle is
not sufficiently large, that the two particles will have different transmission efficiencies. Whilst
for measursments of relative ionisation cross-sections such effects of mass discrimination
could be eliminated by normalisation this is not so for the Lee and Fenn method. To check on
r29
<\¡

this, radial intensity distributions for monomer and dimer ions were measured using a
calibrated iris diaphragm (see section 3.4.I),which was placed at the entrance to the mass
spectrometer. The iris was accurately centred onto the axis of the molecular (and ion) beam
using a HeNe laser that had been aligned onto the skimmer from the rear of the interaction
chamber. The iris was placed at ground potential via an electrometer, permitting the current
striking the iris to be measured as a function of ttre iris diameær.
The current transmitted by the iris could be measured in two ways. Firstly, the total
argon ion current could be collected with a Faraday cage placed immediately behind the iris.
By measuring the sum of the iris and Faraday cage currents I was able to show that, as
expected, the total argon ion current was independent of the iris diameter for all ion energies
investigated.
The second method involved removing the Faraday cage and allowing the ion beam to
pass through the mass spectrometer, thus allowing the argon monomer and dimer ion currents
to be measured separately.
Using the first method, the Faraday cage measurements provided the transmitted ion
current as a function of the iris radius, see figure 4.18a. Measurements were taken at two ion
energies; l52eY and 305eV. For this the source conditions were chosen so that the molecular
beam contained a negligible amount of dimer, ie do=2Qp¡¡, To-300oK ând p.tus=1500ton . The
two curves are practically identical, although they are the raw data with no normalisation.
This indicates that the ion-optics transmission is the same for 305eV and 152eV particle
energy, which are the energies required for the mass spectrometor to be tuned to the
monomer and dimer ion respectively. From this integral curve the radial culrent distribution
can be found by differentiation. The figure highlights the fact that the ion beam radial density
is independent of the ion energy. Thus, any difference subsequently found in the radial density
distributions of monomer and dimer ions is not due to instrumental artefacts.
The measurements of figure 4.18a were taken with an electron beam energy of 30eV,
but experiments at 60eV and 100eV yielded curves of identical shape.
130

5To= 3000K
o =1 000torr'srag
3.5
l. Ð.o d¡ 5 ¡¡ 30
25
2.0
ToSOOo K
Prt. n=2
90Oto rr
dn=2oum oo
o
d =8mm .
O. .tr trtrDltoE|
2.0 3.0lris radius (mm)
ØÀE(ú
ox
Co)
=oc.9Eo)
=EØ(ú
t-
4
Ø--c-o(ú
É,o)
=()c.9Ðo=EØc(ú
F
E
atrE
E
fl'
2
d = 20umn
d =8mmns
rtl¡
.É#fF
Transmitted ion currentFirst Method
o f¡ = 152v
o 6¡ = 305v
aMonomer Mass separated ion currenls'" - -\'-' Second M ethod
\oa
3
't.5
1.0
0.5 atr
a
atr Dimer
I0.0
234lris radius (mm)
(a) O)
Figure 4.18: Radial profiles of the ion currents for an electron energy of 30eV.
In figure 4.18b the stagnation pressure has been increased to 2900ton, ensuring
dimers are present in the molecular beam. Both monomer and dimer ion currents are
measured by the Daly detector, and here the much smaller dimer cuffent is normalised to the
monomer cuffent in the flat region of the curve at 5mm iris radius. For the monomer ion, the
radial transmission prof,ile is practically identical with that of frgure 4.18a giving conf,rdence in
the accuracy of the readingss. Both curves of figure 4.18b begin to drop for beam radii less
than -2.5mm, but the decrease in dimer ion intensity is significantþ more rapid than that for
the monomer ion.
Because of tho departurc of the iris aperture from circularity below a radius of
-0.5mm, the good fit of the measured points must, to some extont, be regarded as foftuitous.
The results show clearly that the monomer ion radial distribution was significantly
naffower than the corresponding dimer distribution. This was checked for a variety of nozzle
skimmer distances, as well as for several stagnation pressures. A similar result was found with
a molecular beam of carbon dioxide.
From the fact that the curves of figure 4.18 have become flat at an iris radius of 4mm I
can conclude that both monomer and dimer ion beams are confined within a diameter of not
more than 8mm. Since on the other hand I have previously found (see section 3.3.6) that an
ion beam of 1Qmm diameter passes, essentially unimpeded through the mass spectrometer into
the ion detector, no error should be introduced through the differences in the monomer and
dimer ion radial distributions.
s The small existing differences can be explained by errors of the order of 0.2mm, in the iris diameter due to
the backlash in the coupling between the iris and the linear feed-through.
131
ô
atr
0.0 1.056 4,0 5.00

4,5.4 Molecular Beam Radial Density Distributions
The finding that the monomer ion beam appears to be narrower than the dimer ion
beam raises the question whether this reflects the actual distribution of these particles in the
neutral beam. This questioned will be investigaûed in the present section. The iris diaphragm
was taken from its original position, at the entrance to the mass spectrometer, and attached
to the skimmer holder approximately 10mm from the skimmer entrance6, as shown in figure
4.19. The iris diameter was controlled by a micrometer driver connected to the end of the
linear feed-through. An in situ calibration was carried out using a series of rods inserted into
the iris.
Radial density distributions were taken in the same manner as desuibed in the
previous section, however in this case the iris was used to profile the molecular beam prior to
its entry to the ionisation box.
An electron energy of 40eV, together with a beam current of 0.6pA, was used for all
of the measurements and the nozzle diameter was ltxed at 20pm. Measurements of the argon
monomer and dimer radial distributions were taken for several stagnation pressures in the
rangefromll00to3200torr,withasourcetemperature'Ts=300"K'Figure4'21aillustrates
the monomer and dimer signal as a function of the radius of the iris for a stagnation prcssure
of 2900ton, while tìgure 4.20b is the corresponding radial density, obtain by differentiation
of figure 4.20a.
LineorFeed-through
lon¡sotion box
Skimmer
Spocers(for increosedconduclonce)
Figure 4.19: Schematic diagram of the iris mounted on the skimmer holder.
6 To enable the iris to be mounted on the skimrner holder, the electron gun was temporarily moved a further
5mm away from the skimmer.r32
E ectronTlop
.Tf-
ElectronGun

5 4
3
2
.lftrtr
t
r Monomero Dimer (norm at 4mm)
1234lris radius (m m)
(a)
Radial Profiles:
(a) Transmission profile
(b) Radial density profile
PO= 2900lorr TO= 3000K
d =20um d =8mmn ns
0.0 0.2
o Monomero Dimer(norm at 0.5mm)
+ B, ¡rÉ?tr o
al,.=c.=-o(ú
--.t)coE
-E-oCÚ
É.
tr
aaotra
acl
#aa
a
o
tr
4
3
2
at>
=c.=-o(ú
co
o
o
o
0 0
5 0.4 0.ô 0.8
Beam radius (mm)
(b)
1.0 1.2
Figure 4.20b indicates that the dimers are concentrated closer to the centre of the
molecular beam than the corresponding monomer. It also shows that, for P.t'e =2900torr,
dn=20lrm and d*-8mm, both the monomer and dimer beam are very naffow and have, at the
location of the iris, a radius of not more than 0.4mm.
As the stagnation pressure is increased, both monomer and dimer beams increase in
diameter. Figure 4.21 illustrates this point with the use of a Carbon dioxide molecular beam
and anozzle-skimmer distance of 6mm. Two runs were taken at 2900ton and 2400torr
respectively. In each case the monomer, dimer and trimer were measured, with each of the
runs normalised in the linear region of the 2900ton dimer run at an iris radius of 3.4mm.
133

3.0
2.5
D =2900&2400torr' srag
T^=300o KU
!FaE
(to-E(õ
ox
c.q)
=oC.9Q)
.Eo
CD
2.0
1.5
1.0
0.5
o+â; o Dimer (29ootorr)
o Dimer (2400torr)+ Trimer (2900torr)
0,0
0 23lris radius (m m)
4
Fi-qure 4.21: COz*, (COr)r* and (COz):* as a function of the iris radius.
It is int€resting to note that within my measuring accuracy, the shape of the dense
core, within 0.5mm radius, is the same throughout for monomer, dimer and trimer, which is
shown for 2900torr. The pressure dependence is mainly expressed in the outer wings of the
curves, with the monomer possibly being more pressure sensitive.
The onset of the wings in the ffansmission profiles occurs practically at the radius that
forms the boundary of a beam from a point source located at the nozzle and limited by the
skimmer entrancet. This suggests that the wings originate from scattering processes within the
skimmer. Since the collision cross-section for the dimer and trimer is greater than that of the
monomer one would expect more of these particles to be scattered into the wings. It would
seem that the reason why the proportion of dimer and trimer clusters in the wings is much
smaller than that of the monomer is due to the fact that a substantial portion of these clusters
are fragmented in the collision process.
As the stagnation prsssure is lowered one would expect these scattering processes to
become less frequent. Measurements with argon do in fact show that as the stagnation
pressure is lowered the wings of the monomer curve become less, and approach those of the
dimer.
7 This is calculated for a nozzle-skimmer distance do,=8mm, a skimmer diameær d"=0.6mm and a nozzle-i¡is
distance of 23mm.134
5

To remove any ambiguity due to Mach number focussing or other mass separatlon
effects, an argon molecular beam was seeded with xenon by using a mixture of 2500ton of
argon and 100ton of xenon. As shown in figure 4.22, the Ar and Xe radial profiles are almost
identical, indicating that if there are any mass separation effects, they are very small.
However, as before the dimer has a significantly different transmission profile.
5TO=300oK
d =20m icronsn
d =4.25m mnsÐcfO f oO I EDtEo
-oþrï o"tróoS
'/"trog
ago
oXe
. Ar(norm to Xe at 4.2m m)
o Arr(norm to Xe at 4.2mm)
0 23lris rad iu s (m m )
4 5
Figwe 4.22: Radial transmission profrles of a molecular beam of Ar and Xe'
In the absence of a skimmer, measurements such as the above could reflect details of
the condensation mechanism. For example, the mechanism may dictate dimer formation in the
centre of the molecular beam, where the number density is higher. However, all history.of the
condensation process, such as the dimer distribution downstream from the nozzle, is lost
through skimmer interaction.
If the nozzle-skimmer distance is decreased two effects occur. Firstþ, the boundary of
the beam defined by the geometry increases and at the same time, the density of the beam
within the skimmer rises, leading to increased scattering. One would therefore expect the
intense core of the beam to extend outwards and the wings to become more prominent. This
is shown in figure 4.23,whichshows measurements for argon using nozzle-skimmer distances
of 8mm and 5mm. Curves are presented for both monomer and dimer and the geometrically
determined boundary radii are indicaæd by anows on the abscissa.
(t)o-E(ú
c\l
ox
Lo)
oc.o
4
3
2
et
&
0
135
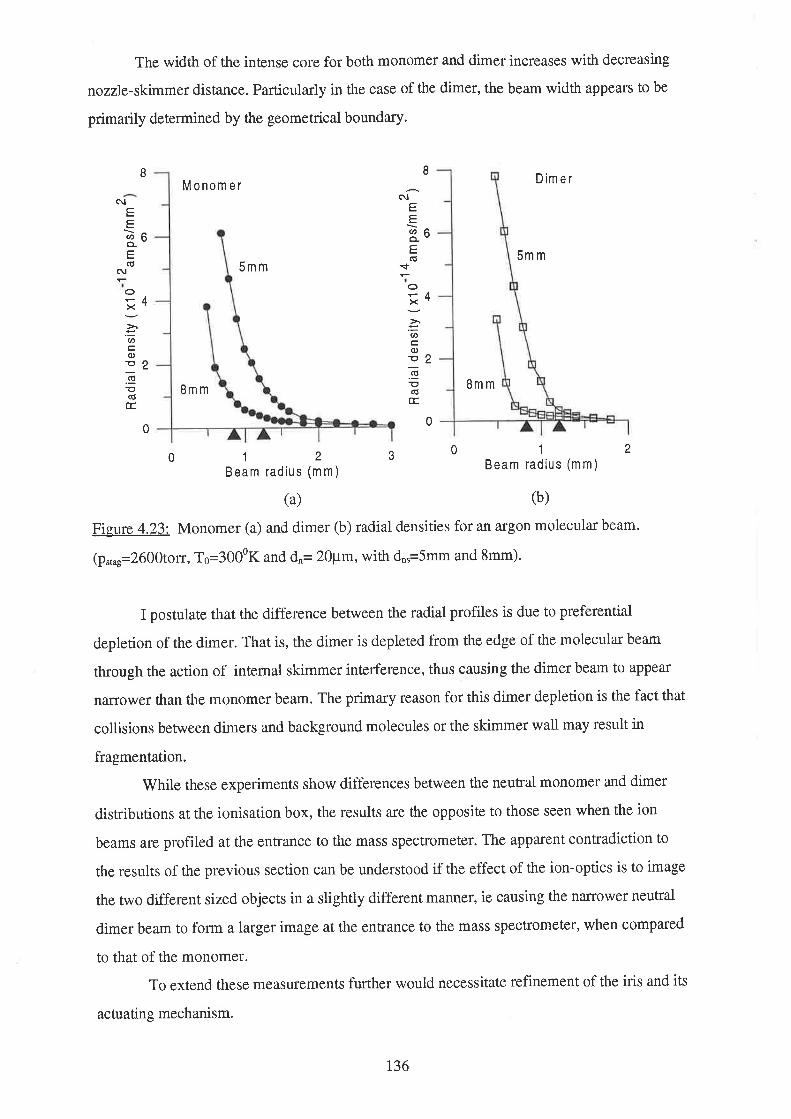
The width of the intense core for both monomer and dimer increases with decreasing
nozzle-skimmer distance. Particularly in the case of the dimer, the beam width appears to be
primarily determined by the geometrical boundary.
Monomer Dimer
5mm5mm
Bmm 8mm
II
4
2
<\lEE
36Ê,(ú
Éox
=.t)c(l)E
EE(õÉ.
6
4
2
C\¡
EEU)oE(6
ox
-_(t,c.(I)-o
EE(úÉ.
ñt
00
12Beam radius (mm)
32
0
(a) 0)
Figure 4.23: Monomer (a) and dimer (b) radial densities for an argon molecular beam.
(p.,"r=2600torr, T6=JQ00K and dn= 20pm, with d*=J¡¡m and 8mm).
I postulate that the difference between the radial profiles is due to preferential
depletion of the dimer. That is, the dimer is depleted from the edge of the molecular beam
through the action of internal skimmer interference, thus causing the dimer beam to appear
narrower than the monomer beam. The primary reason for this dimer depletion is the fact that
collisions between dimers and background molecules or the skimmer wall may result in
fragmentation.
While these experiments show differences between the neutral monomer and dimer
distributions at the ionisation box, the results are the opposite to those seen when the ion
beams are profiled at the entrance to the mass spectromster. The apparent contradiction to
the results of the previous section can be understood if the effect of the ion-optics is to image
the two different sized objects in a slightly different manner, ie causing the narrower neutral
dimer beam to form a larger image at the entrance to the mass spectlometer, when compared
to that of the monomer.
To extend these measuroments further would necessitate refinement of the iris and its
actuating mechanism.
01Beam radius (mm)
136

4.5.5 Daly Detector SensitivitY
The Daly detector, described in 3.3.8, amplifies the ion current transmitted through
the mass spectrometer with a gain of the order of 5x10⁷, thus allowing small cluster signals to
be measured with relative ease.
The Daly detector was calibrated for clusters of different size by comparing the
detector output with the current entering it, as measured directly with the retractable Faraday
cage, see figure 3.24.For this a current range had to be selected so that it was accessible for
measurement with both the detector and the Faraday cage. Firstly the conversion electrode
was placed at ground potential and the Faraday cage was lowered to the detector entrance to
collect all the ions exiting from the mass spectrometer. Faraday cage currents were recorded
for each of the resolved cluster species. In the case of argon, the cunent I¡,1o¡ for n=1 to 6 was
measured for, p"¡,r= 2000torr, To=2500K, dn=65pm, d*=8mm and an electron energy of 30eV
at a beam current of 0.4p4. The second column of table 4.3 lists the ion currents measured
with the retractable Faraday cage.
Cluster Faraday cage current
1x1o-124¡
PMT current
at 12Kv (x10 6A)
Gain(l2Kv, Ar)
(x107)
S(12Kv, Ar)
Ar 7.r5 80.8 1.13 1
Arz 0.24 2.74 r.Á 1.01
Ar¡ 0.115 3.r2 2.7r 2.4
Ar¿ 0.055 2.14 3.89 3.44
Ars 0.015 1.38 9.25 8.19
Aro -0.005 1.15 -23 -20
Table 4.3: Daly detector calibration data for argon using a 12Kv detector potential.
On completion of the Faraday cage measurements the cage was retracted and afær
conditioning, see section 3.3.8, the detector outputs Ip¡,¡¡ was measured as a function of the
conversion electrode potential V¿"r for each of the argon cluster species. The detector gain
Gain(Va"t, Aro) was calculated for each cluster size from,
I pa, = f rorotoy . Gain(Vo.r, Arr)
8 A photomultiplier voltage of 1.1Kv was used whenever ttre Daly detector was employed.
137
(4.4)

Similarly, the relative sensitivþ S(Vu",, Ar. ) of each species, relative to the monomor, was
calculated from
s(%*, Arn) -- G!ti?(v ¿o' Ar')Gain(Voo,Ar)
(4.5)
Figure 4.24 illustrates how the detector gain varies with deæctor potential for small argon
clusters.
20
t.-
16
12
.ArtrAroAr+AraAr
+
2
3
4
+
+
+
+
+
I
4
oFx
'(úc')
o(Jo)<t)o
tr
6*Ar
0
4 8 12 16
Detector potent¡al ( Kv )
20
Figve 4.24: Daly detector gain as a function of the detector potential.
Table 4.3 shows the detector data for argon clusters up to the hexamer for 12Kv. It
will be seen that here the sensitivity for the argon monomer and dimer are practically identical.
Therefore to simplify the data collection procedure the detector was operated at 12Kv where
ever possible.
To check that the detector sensitivity did not change with the shape of the ion beam
and falsify fragmentation readings, the monomer, dimer and trimer detector efficiencies were
measured at several electron energies, and for several stagnation pressures. In all cases the
detector efficiency showed no variation with either the electron energy or the stagnation
pfessure.
138

4.6 Nozzle-skimmerDistance andthe'Break-away' Distance
In section 4.5.4 differe-nces were described between the monomer and dimer radial
distributions, and the observation of a n¿urower dimer beam was explained in terms of dimer
fragmentation within the skimmer. As will become apparent, skimmer interaction can have a
substantial bearing on experiments of the Lee and Fenn type. Therefore this effect was more
closely investigaæd by measuring the molecular beam intensity as a function of the nozzle-
skimmer distance d*.
As I have shown in section 4.5.4, the diameter of the molecular beam core is
determined by the solid angle subtended by the skimmerentrance atthenozzle. On the other
hand the wings of the radial profiles are caused by collision processes within the skimmer, and
are thus dependent on the number density there. The wing profile will therefore vary with
stagnation pressure andnozzle-skimmer distance. When d* is large the number density will be
small, with few molecules scatt€red into the wings, and the molecular beam intensity should
1VafV aS æ
-' d,,'
used to generate an argon molecular beam. The portion of the molecular beam passing
through the skimmer into the interaction chamber was measured using either the mass flux
gauge in the position usually occupied by the ionisation box or by ionising the beam and using
the mass spectrometer output for detection.
In the latter case, the electron beam energy and current were fixed at 40eV and 0.6p4
respectively. The monomor and dimer currents, together with the total flow were measured as
a function of d^.
Figure 4.25ashows that the total flow into the chamber accurately follows an inverse
square law as d* is decreased. From figure 4.25b it is seen that the inverse square law also
holds for the monomer and dimer curves at large nozzle-skimmer distances, but ttre law
breaks down below a certåin nozzle-skimmer distance. The break down occurs earlier in the
case of the dimere.
The mechanism responsible for this breakaway appears to be the same as the one that
causes the development of the observed wings in the beam profiles of section 4.5.4, namely
e It might be thought that the existence of the breakaway distance is simply a consequence of changes in the
molecular and electron bearn overlap, as discussed in section 4.5.2. As the nozzle-skimmer distance is
decreased or the stagnation pressure is raised the beam profile will widen (see section 4.5.4) and some of the
beam molecules will move outsicle of the range of the electron bearn. To see that ttris is not the cause of the
breakaway we may note that the monomer beam is wider than ttre dimer beam so that one would on this score
expect the breakaway to occur hrst for the monomer, whilst experiments show the opposite to be the case.
. To check whether this is the case a 20pm nozzle, at room temperature, was
r39

scattering within the skimmer. Apart from leading to fragmentation, scattering in this case
also causes the molecules to be deflected out of the angle of acceptance of ttre beam detector,
while still contributing to the total flow into the interaction chamber.
100 100
Q = consl. dn,
2 4 6 8 10
Nozzle-skimmer distance (mm)
(a)
P.1.n=2 400t0 rr
To= 31ooK
dn=20/¿m
M onomer nst. dns
Dimer ( x10)
2 4 6 I 10
Nozzle skimmer distance (mm)
(b)
D = 2400torr'slag
To= 3100K
dn=20Pmato-Eõ 10
0
a
oxc.(1)
=(Jco
0
U'J
o
ox
o=o=(g
ot--
* -2
2
Fi_eure 4.25: The total flowt0 into the interaction chamber (a) and the monomer and dimer
beam cuffents (b) as a function of the nozzle-skimmer distance.
To investigate this further I measured the nozzle-skimmer distance at which the
logarithmic monomer and dimer curves begin to show deviation from linearity. This I shall call
the break-away distance ds. If the molecular beam attenuation is due to internal skimmer
interaction then the break-away distance dg should correlate with the mean free path of the
gas À and the number density n within the skimmer, that is
(4.6)
0.5
æ
where n is directly proportional to the stagnation pfessure, for constant d*.
Apart from this the breakaway me¿rsurements were made with a 20pm diameter nozzle, for which the pressure
broadening of the beam is much less than for the 65pm nozzle, used for the majority of the measurements in
section 4.5.2.to The total flow was determined by obsewing, with an ionisation gauge, the rate of pressure increase in the
ionisation chamber with valve Ve closed.
140

In order to check the relationship between the breakaway distance and the stagnation
pressure, the monomer current was measured as a function of the nozzle-skimmer distance for
several values of p.og in the range from 500 to 3800ton, as shown in figure 4.26.In all cases
the curves are well approximated by an inverse square law up to the break-away distance.
100TO= 31OoK
d n=20
¡'m
10
a+
U'oE(ú
ox-.(I)
=<)c.ooEoLoE
r 3800torr
^ 2650torr
t l Bootorr+ 1200torr
' 5 00to rr 2=Const. d
ns0n
0246
Nozzle skimmer distance (mm)10
Figure 4.26: Argon monomer cuffent versus nozzle-skimmer distance for stagnation
pressurss in the range between 500 and 3800ton.
This break-away distance is shown as a function of the stagnation pressure in figure
4.2i.Thelinear log-1og plot with slope 0.5 confirms that the break-away distance is
proportional to the square root of the stagnation pressure, as predicted by equation 4.6.
According to equation 4.6 the skimmer interl'erence should also be inversely
proportional to the mean free path. Thercfore the next step in the investigation of skimmer
interference was to measure the dependence of the break-away distance on I. For this the
electron gun was removed and the mass flux gauge was placed at the position previously
occupied by the ionisation box. The mass flux gauge output was measured as a function of the
nozzle-skimmer distance for several gases, see figure 4.28 andtable 4.4. The source
conditions were the same for each gas and the break-away distance was determined in the
usual manner.
m
a
1
t4r

TO=31 0oK
dn= 20Pm
d = const.p0.5
B stag
0.1 1.0 ^
1o,o
Stagnation Pressure ( 10"torr)
Figtre 4.27: Position of the break-away distance versus the stagnation pressure
1 0.0
.-con st.dml ns
-D P . =1000torr- srag
T ^ =3000KU
0H elium
0.1
1 10
Nozzle-skimmer distance (m m)
Figure 4.28: Mass flux gauge output versus nozzle-skimmer distance for helium and oxygen.
To deærmine the influence of the mean free path on the break-away distance by using
various gases, it was necessary to ensure the number density in the skimmer was the same in
each case. However the flow from the expansion nozzle varies with the molecular mass and
the gas viscosity. Therefore, the flow for each gas, relative to that for argon, was measuled
for the same source conditions, namely d*=5mm, a stagnation pressure of 1000torr and room
temperature. Making a coffection for the mass flux gauge sensitivity, the ratio of the mass
5
4EEfn
E(l)oC(g
.9E
(ú
=(dl¿(Úc)
m
3
2
(n
=o
=o-
o(5LL
Ia
aa
a
xygen
1
o
1.42

flux signal for each of the gases to that for argon provided a measure of the relative gas flow
Table 4.4 details the results for each of the gases, relative to argon.
For consistency all mean free path data was taken from the same source, namely
Dushman (1g62),even though these values differed sightly from those found in section 4.7.
Table 4.4: Relative change in the break-away distance as a function of the mean free Path.
Figure 4.29 illustrates the results of table 4.4, where the square of the ratio of the
break-away distances divided by the gas flow relative to that for argon is plotted against the
mean free path. An allowance is made for the mass flux gauge sensitivity using the data from
Edwards for the IG5 ionisation gauge.
2.0
2
c0
N
ØctCD
¿
o 1.6 Kr
1.2
(\l
i o'T
Ard
2 . ,-1= COIìSl. ^B
o
cc¡-o
!
Ø(ú
? 0.4Ne
0.0
0 3 6 I 12
Mean lree path (m m)15
Figure 4.29: Dependence of the break-away distance on the mean free path l,*tt'
H
Gas ^ / '11
^p (cm) Break-away
distance (mm)
Gauge sensitivity
relative to Nz
Relative flow
Q* / Qe'
dsz / relative
flow
COz 3.0 2.45 1.6 0.63 1.91
Krypton 3.1 2.3 1.85 0.72 t.52
Nitrogen 4.5 2.25 1 0.8 1 3 1
Argon 4.1 2.2 t.4 1 1
Oxygen 4.8 3.r 1 t.45 r.3'l
Neon 9.4 1.9 0.34 r.4 0.53
Helium 13.3 2.35 0.18 J 0.38
tt }"u ir the mean free path at 10-3torr.
r43

The fit of the square power law to the data (solid line) is a good approximation, with
the scatter in the results easily explained in terms of uncertainty in the choice of the mean free
path data and the mass flux gauge's sensitivity. As expected from equation 4.6, results
indicate that the break-away distance is inversely proportional to the square root of the mean
free path
The dependence of the break-away distance on the mean free path clearly shows that
the break-away is due to gas kinetic collision. In that case it should be possible to predict the
break-away distance for the argon dimer, using the ratio of the mean free paths as determined
in section 4.7. From equation 4.6 the ratio of the break-away distance for argon dimer to
monomer is given by12
If from figure 4.25b I take the break-away distance for the monomer as 2.4mm and
use 1.4 as the ratio of the mean free paths Ra,n¿ (see section 4.7), rhen the break-away
distance for the dimer should be,
( Lo, \o'du-o," =ld 'br-o, = 1t.+)o' '2.4 =2.8mm
L o,,(4.7)
Lo,
On the other hand figure 4.25b indicates that the dimer break-away distance is de-A¿
-3.3mm, which is -1.2 times the calculated value.
This discrepancy may be due to the fact that for dimers the break-away is not solely
due to particles being scattered out of the angle of acceptance of the detector, but that in
addition, fragmentation of dimers occurs in molecular collisions.
These skimmer interference experiments show that the effect in the case of the dimer
can be quite severe, even when the monomer is not disturbed, and that care should be taken to
operate at nozzle-skimmer distances where skimmer interaction will not cause undue
scattering of the molecular beam. This is particularly important for experiments similar to
those of Lee and Fenn, where dimer depletion through skimmer interaction will cause an over
estimate of the ionisation induced fragmentation probability. This can be checked by taking
runs of monomer and dimer current versus nozzle-skimmer distance and measuring the break-
away distance.
12 The same value of n in equation 4.6 applies for the monomer and the dimer
r44

4.7 Molecular Beam Scattering Measurements
In section 4.6 use was made of the ratio of the dimer and monomer gas kinetic cross-
sections. In the absence of other more detailed information it has been customary to assume
the dimer cross-section to be twice that of the monomer. Since on steric grounds one would
consider this to be an overestimate, measurements were made of the mean free path of the
argon monomer and dimer in argon and other target gases.
4.7 .l Scattering Cell Measurements
For the measursments of the neutral mean free path I, the electron gun, ion-optics and
magnetic sector mass spectrometer were removed and the scattering cell described in section
3.4.3,was placed in the centre of the interaction chamber, as shown in figure 4.30. A room
temperature nozzle, with d,=JQpm and d*=7mm, was used to produce an argon molecular
beam which contained -IVo dimer and negligible amounts of larger clusters.
G(Éllneforprgss¡Jrê meosJfêrn€nh
Moss fllÃgouge
Fbgpo6Íldìd
Nod€
Sldrfmd
Ouodrupob tvbssspectrorneter
Gos lhe forodlrJsflrE cell p{esilré
RM
CÇ¡loryteok
Figure 4.30: The scattering cell experiment'
The scattering cell contained 3mm diameter entrance and exit apertures, and was
centred on the axis of the molecular beam. The cell had two large ports, at right angles to the
beam axis, for connecting the capacitance monometer and the gas inlet (capillary leak).
Copocltorcemonorneter
Íbell
ÌvlcÂðbl€
Scdtldlng
Endsoperfure
3LG(6Bdo¡t
RolutyRrnp
Èe6arÞ
I45

The scattering cell was operatsd at pressures in the range between 0 - 2mtorr while
the interaction chamber pressure p2 was - 2 xl0-ston, with a molecular beam stagnation
pressure of 3000ton and anozzle-skimmer distance of 6mm. To eliminate outgassing and
ensure a negligible pressure gradient between the membrane gauge and the scattering cell, the
connecting vacuum lines were thoroughly cleaned,leak æsæd and evacuated for several hours
prior to commencing the experiment.
To simplify the scattering cell pressure measurements the capillary leak inlet pressure
was used to calibrate the scattering cell pressure. Figure 4.31 illustrates the scattering cell
calibration curve and shows that, as expected from the Poiseuille equation, the flow from the
leak is proportional to the square of the inlet pressure. This curve was checked against the
membrane gauge on a routine basis and found to be very constant.
2.0
-6 2.0cell = 2.7 4x10 D
' leak inlet
1.2
0.8
0.4
0.0
0 200 400 600 800Leak Stagnation pressure (torr)
Figure 4.31: Scatæring cell pressure calibration curve for argon.
The mass flux gauge could be inserted to measure the transmitted monomer beam
whilst the higher sensitivity of a quadrupole mass spectrometer located at the rear of the
chamber, see figure 4.30, allowed the transmitted dimer beam to be detected.
The experiment was simple in concept, and involved, for constant source conditions,
measuring the monomer and dimer signals as a function of the scatterìng cell pressure p..
When the inlet pressure to the capillary leak is zero the scattering cell pressure p. is
equal to the interaction chamber pressure P2, which is negligible compared to p. during the
scattering experiments. Therefore if the deæctor signal for clusters of size n is Io,¡ when p.
=Omtom, the detector signal at any scattering cell pressure p, is given by
P
.6o
oxc)
=at,(t,(l)
o-(¡)(J
(f)
r46

I n = I noe
L= 1+x
__l+xn h,
_L.p"
h
--lr+xLn
- -lr+x)vn
(4.8)
(4.e)
(4.10)
where the scattering path length L and the mean free path l, are in cm, and ttre influence of
the background pressure has been neglected. All collisions were assumed to result in the
incident molecule being removed from the molecular beam, and the angular resolution of the
detectors was assumed to be sufficient, that a correction to the detector signal could be
dispensed with.
The scattering cell pressure can be accurately measured and the geometrical cell length
I is well defined, but the scattering path tength is longer than the geometrical length because
of the high density gas flowing from the entrance and exit apertures. This gas flow causes the
scattering path length L to be longer than the geometrical length l by an amount x giving rise
to the effective scattering length
The r-elative signal, Io/ In,o is plotæd logarithmically as a function of p. and the slope Sn
of the resulting straight line determined. The slope is related to the mean free path by
s
To determine x, the scattering experiment was conducted with two cell lengths, namely
It = 2cm and l, = 3cm,and the two corresponding slopes Snl and Sn2 obtained, where
s
s 2
andn
n
Sn' 'I,- ,S,I
Lx 2
so that
sn -sn
t47
(4.11)

With argon as the target gas, the additional length was measured for Ar and Arz and
found to be equal to 1.25cm. In other words, the path length extends approximately two
aporture diameters from both the entrance and exit apertures. No difference was detected
between the value of x for the other target gases listed in table 4.5. Once the additional path
length x was obtained, the cell length remained set at 2cm for the mean free path
measurements.
Runs of monomer and dimer were taken alærnatively while the source conditions
remained constant. Each run took approximately ten minutes and was found to be very
reproducible. For each run, the mean free path Lt' was obtained using
3.25 (4.r2)L'S,
where L=3.25 = 2 + 1.25, ie the cell length plus the additional path length.
Figure 4.32 is an example of a run for Ar and Arz with an argon target gas, and table
4.5 summarises the results of several such runs. The errors üsted in øble 4.5 correspond to
the st¿ndard deviation of ten mean free paths.
2.8 To= 3oooK
o =2 500t0 rr' sragdn=20Æ
d = 6mmns\=2.9 Ar
2
2.0
1.6Ar
À = 4.11.2
0,8
0.0 0.2 0.4 0.6 0.8 1 '0
Cell Pressure ( x1o-3torr¡
Figure 4.32: Logarithmic attenuation versus scattering cell pressure for Ar molecular beam
scattered from an argon target gas.
t' At all times l, refers to the mean free path at lmtorr.148
n
2.4C..9(õ¿(¡)
(E
.s¿
E.=(úo)oJ

For argon in argon satisfactory agreemont was obtained between the mean free path
values found in the |iærature (Dushman (1962)), and the value of 1,1 = 4.lcm measured here.
For example, the similarity in the mean free path values for oxygen and argon is consistent
with the cross-section data of Dushman (1962), deærmined via viscosity measurements.
The most striking result is that the ratio of the argon monomer to dimer mean free
paths À1 t Ìuzis equal to -1.4. This ratio was found to be independent of the target gases that
were employed and was checked several times at a variety of source conditions. For example,
ratio ),r I Ìvz,is equal to -1.4 was reproduced when the nozzle diameter was increased to
30pm and the nozzle-skimmer distance set at 10mm.
Beam - Target Slope Xr (cm)
@ 10-3 torr
Ar-Ar -0.80 4.1 + 0.15
Arz - Ar -1.12 2.9 t0.15
Oz- Ar -0.16 4.3r0.15
Table 4.5: Summary of mean free path results
If the molecular diameter of the dimer was simply twice that of the monomer then the
ratio of the mean free paths would be two. However, this value decreases to -1.8 if steric
effects relaæd to the orientation of the two monomers are considered. For example, the target
gas will see an average molecular diameter that takes into account all possible orientations of
the dimer as it traverses the scattering cell.
The difference between the measured ratio and the expected value can not be
explained using this simple approach. The classical analysis, whereby dimers are viewed as
two contacting spheres of molecular diameter, õ.oo, and where collisions take place with an
argon monomer when dimers are a distance, õ-oo , from the centre of the target sphere, is not
sufficiently accurate.
Van Deursen and Reuss (I976,1917a,I977b) have taken similar measurements and
found that the monomer to dimer ratio for argon, is 1.40 t 0.05, which is in good agreement
with the ratio of the values in table 4.5. They discuss the logarithmic attenuation in terms of
the collision cross-section, oo defined as
t49

I . e-o ¡,ps'constil'o
which is related to the mean free path by
1o, *T
V(r) =
I (4.13)
(4.r4)
(4.1s)
(4.16)
(4.r1)
n
van Deursen and Reuss (1976) use a Lennard - Jones potential to discuss the
interaction of small van der Waals clusters with a tatget gas, which for heavy scattering
paftners is dominated by the attractive term,
c66r
With reference ro Landau and Lifshitz (1959) van Deursen and Reuss (1976) obtain
2
o = 8.083
where v is the averags relative velocity for different scattering partners, and is relaæd to
molecular beam velocity and the spread in the target gas velocity. Experiments with molecular
beam geometries, similar to those used throughout this work, have shown that the monomer
and dimer beam velocities are the same. Similarly, the velocity spread in the target gas is
independent of the incident species, and the following expression holds
(r)2l s
Using either the results of Van Deursen and Reuss, or the values in table 4.5, with
reference made to equation 4.14, yields
/- -1.1v6,Dímer -' ví,Monomer
150
(4.18)

van Deursen and Reuss (1977a,I977b) have extended this work to dimers of other gases and
in all cases have found that the dimer van der Waals constant Co.¡i-", is approximately twice as
large as the corresponding monomer value, C6,Mooo.o.
The physical significance of this is not immediately apparent, and it would be
interesting to extend this work to trimers and larger clusters.
4.7 .2 Interaction Chamber Scattering Measurements
During the course of the fragmentation measurements the pressure in the interaction
chamber P2 ma1' be in the l0storr range with the molecular beam on. The lengttr of the
particle trajectory through the chamber will be such that, on the basis of my mean free path
measurements L/1, wilt be -0.1, which in turn implies attenuation due to scattering could
amount to -10%o. This level of scattering would significantly effect the results of the Lee and
Fenn method.
To get an accurate scattedng correction factor, and to eliminate effors due to
uncertainty in the calibration factor of the ionisation gauge or due to possible pressure
gradients in the interaction chamber, a further set of measurements ìwere made. For this the
mass flux gauge was placed 20cm downstream of the skimmer entfance and the beam
attenuation was measurcd as a function of the chamber pressure, as measured with an
ionisation gauge, the pressure being varied by admitting gas through the capillary leak.
Instrumental constraints placed a limit on the pressure variations achievable. The
results are summarised in table 4.6.
Table 4.6: Results of scattering runs at two molecular beam stagnation pressures.
The fifth and sixth columns of the table show the measured transmission (7o) and that
calculatedlo from the mean free path data of section 4.7.1. The agreement is quite good.
la Calculated from the mean free path measured in the last section, l,n,=4.lcm, a path length of 20cm and an
ionisation gauge sensitivity of 1.4.
151
P"t"g
(torr)
Gas flow Pz
( x 10-storr)
MFG output
(volts)
7o Transmission
Measured
7o Transmission
Calculatedla
1350 OFF 2.3 0.915
1350 ON 3.95 0.855 93.4 94.2
1 150 OFF 2.r5 0.778
1 150 ON 3.9 0.73t 94.0 94.5

4.8 lon Beam Scattering Measurements
During the actual fragmentation experiments it is not scattering of the neutrals, but
rather scattering of the ion beam, as it passes through the ion-optical system, that is
important.
Measurements were therefore made of the ion current transmitæd through the ion
optics and the mass spectrometer as a function of the chamber pressure. Here the total path
length was 70cm. The results are shown in frgure 4.33 for an argon ion beam with p.* =
2650torrr, To = 3000K, an electron energy of 30eV and a current of 0.2p4.
1.8
Monomer
1.6
1.4
1.2 Dim er
1.0
0.8 T rim er
0,6
0.0 1,0 2.0 3.0 4.0 5,0
Chamber pressure ( x10'5torr¡
Figure 4.33: Argon cluster ion logarithmic attenuation versus chamber pressure, P2.
The Daly detector was operated at 12Kv where the gain is the same for the monomer
and the dimer. The logarithmic attenuation in f,rgure 4.33 is described by
.9(ú
L
<l)
(õ
.s¿
E
=(õo,oJ
In=In,o'e-k;P' (4.1e)
where k, is the attenuation coefficient for a cluster of size n and the chamber pressurett P, is
in units of 10 storr. The attenuation coeffîcients for argon ion - argon scattering are listed in
table 4.7 ,along with the predicted values based on the previously measured values of l,¡,, the
path length, L and the gauge sensitivity, S,,.
t5 Here the ionisation gauge seusitivity is included in the pressure readings
I52
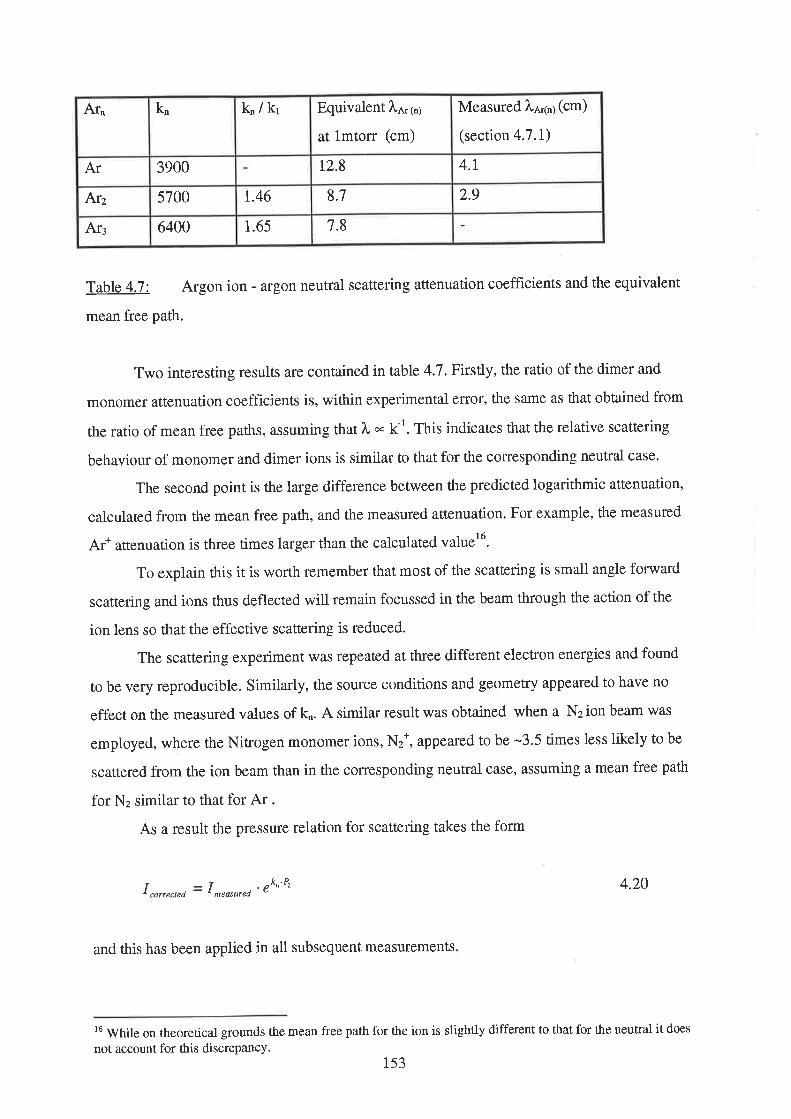
Aro k" ko/kr Equivalent À¡,1"¡
at lmton (cm)
Measured À¡a"¡ (cm)
(section 4.1.1)
Ar 3900 t2.8 4.t
Arz 5700 t.46 8.7 2.9
Ar¡ 6400 1.65 7.8
Table 4.7: Argon ion - argon neutral scattering attenuation coefficients and the equivalent
mean free path.
Two interesting resulc are contained in table 4.7. Firstly, the ratio of the dimer and
monomer attenuation coefficients is, within experimental error, the same as that obtained from
the ratio of mean free paths, assuming that l, - Kl. This indicates that the relative scattering
behaviour of monomer and dimer ions is similar to that for the corresponding neutral case.
The second point is the large difference between the predicted logarithmic attenuation,
calculaæd from the mean free path, and the measured attenuation. For example, the measured
Ar+ attenuation is three times larger than the calculated valuet6.
To explain this it is worth rsmember that most of the scattering is small angle forward
scattering and ions thus deflected will remain focussed in the beam through the action of the
ion lens so that the effective scattering is reduced.
The scattering experiment was repeated at three different electron energies and found
to be very reproducible. Similarly, the source conditions and geometry appeared to have no
effect on the measured values of k . A similar result was obtained when a Nz ion beam was
employed, where the Nitrogen monomer ions, N2*, appeared to be -3.5 times less likely to be
scattered from the ion beam than in the corresponding neutral case, assuming a mean free path
for Nz similar to that for Ar .
As a result the pressure relation for scattering takes the form
I "orr""t"d
= I ^"^ur"d'
€kn'P' 4.20
and this has been applied in all subsequent measurements
tu While on theoretical grounds the mean free path for the ion is slightly different to that for the neut¡al it does
not account for this discrepancy. 153

4.9 Dependence of Cluster Ion Formation on Source Parameters
It was convenient, particularly with the Lee and Fenn method, to have available
empirical expressions connecting the cluster ion currents with the source parameters p"t g, To.
As was shown in section 2.3.3, amongst others Dehmer and Pratt (1982) have established
such relations as power laws of the form
I P r,ogan
Arn
I n To-p,Arn
I have repeated Dehmer and Pratt's measurements for my experimental conditions and
figure 4.34 shows my results for the variation of the argon cluster ion currents with stagnation
pressure.
1E+0
Ar+
=2500K0
1E-1d = 65øm
n
d =8m mns
o<
and
T
(t,
--c-o(õ
çc)
f()c.o(¡)
U)
õ
+Ar
1E-2
1E-3
+
-Ar 6
+At4
t5
1E-4
1 0002
Stagnation pressure (torr)
Figure 4.34: Aro* cluster ion signal as a function of ttre stagnation pressure.
Table 4.8 shows that my values for the coeffrcient o,,, are fairly close to those of
Dehmer and Pratt (1982), and further more I find that crn increases linearly with cluster size,
as shown in figure 4.35.
+
55
154

Arr* Ct" <x^ - Dehmer and
Pratt (1982)
1 1 1
2 3.95 + 0.05 4.5
J 10.5 + 0.5 11.5
4 15 + 1.5 t7
5 t9 t2 20.5
6 -24t2.6 19
Table 4.8: The pressure exponents Oh as a function of the cluster sizo n, determined from the
curves of figure 4.34.
25
To=25ooK
d = 55r¿mn
dn==8m m
15
10
' P resent resultsoDehmer and Pratt
0
34Argon cluster size, n
5 6
20 o
Ê,
õ
co)=oo-x
LU
5
2
Figure 4.35: Dependence of the exponent o¿,, on the argon cluster size n.
Measurements of cr. for n smaller than 4 were found to be independent of the nozzle
diameter for do between 30 and 65pm, and seeing that there is good agreement with the data
of Dehmer and Pratt (1982) taken with a 10pm nozz\e,I can conclude a" (for n<4) is
independent of the nozzle size. Similarly, the power laws were found to be invariant under
155

changes in the nozzle-skimmer distance provided ttre break-away distance for the
corresponding cluster species was not exceeded.
Figure 4.36 and table 4.9 show the corresponding data for the temperature T6
variation.
100
Ar+
aa O¡
aa a
+,2A
3
C".=c=
_o(ú
c.(I)
(-)
e..9c)ct)
õ
+Ar
10 +Ar
250 260 270 280 290
Tem peratu re 1ot<¡
Figure 4.36: Temperature dependence of the cluster ion signals Ar"*.
n p"
1 0.5 + 0.02
2 8.5 + 0.2
J r3.5 + .15
4 23 + 1.5
5 30+ 2
Table 4.9: Temperature exponents Bo as a function of the cluster size n, determined from the
curves of figure 4.36.
As in the case of the pressurc exponents, the temperature exponent Bo increases
linearly with cluster size n, as shown in figure 4.37.
156
4
o =21 00to rr' slag
oo o
oO
o
dn
dn s
I
Ar-'5
= 65¡¿m
= 8mm

30
25
= const. T.B,n
0
20n
15
10 o =21ootorr's¡agd = 65øm
nd =8mmns
\t
Cluster size n
Fi_eure 4.37: The dependence of the exponents p, on the cluster size n.
These experiments have shown that there exists a pressuro range in which it is possible
to prepare a molecular beam containing only monomer and dimer. They have also shown that
the dimer and trimer ion current can be accurately approximated by power laws and that these
laws are, over a large region, invariant under changes innozzle diameter and the nozzle-
skimmer distance.
T
A
a-co)coo-xo)(¡)
=(úo)a-E<t)t-
5
0
542
r57

4.10 Conclusion
This chapter has discussed several experiments conducted prior to the investigation of
rare gas dimer fragmentation. For the most part, these experiments illustrate the performance
of the apparatus described in chapter 3. The ability of the equipment to obtain highly reliable
relative ionisation cross-sections, that agree well with the work of others, signifies that the
system does not suffer from errors introduced by changes in electron energy. This will allow a
quantitative investigation of fragmentation of the rare gas dimers as a function of the incident
electron energy.
Experiment has shown that the argon monomer and dimer ion beams have different
radial intensity profiles. To ensure that these differences do not lead to mass discrimination
effects at the Daly detector several measures were taken. Firstly, a large physical size for the
ion optics apertures was selected so that the entire beams could pass, secondly, it was ensured
that the beams were parallel as they entered the mass spectrometer and thirdly, the dimensions
of the mass spectrometer entrance aperture and the walls of its envelope were such that there
was negligible interception. The Daly detector calibration allows an absolute comparison of
the cluster ion curents entering it from the mass spectrometer, such a comparison is
necessary for the Lee and Fenn method (see section 5.2).
Besides demonstlating the satisfactory performance of the equipment, this chapter has
also highlighted several interesting observations concerning skimmer intetference and the
radial distribution of the monomer and dimer molecular beams.
On the basis of these results the apparatus described in chapter 3 is used in the
following chapter to investigate two methods for obtaining information on how the
fragmentation probability of rare gas dimers varies with electron energy.
158
5 Rare Gas Dimer Fragmentation
5.L Introduction
Two of the simplest methods of studying rare gas dimer fragmentation are discussed
and a series of results are presented. Firstly, a method similar to that of Lee and Fenn (1978)
is used to study the fragmentation of the argon dimer and secondly, relative ionisation cross-
sections measurements are used to investigate the relative fragmentation of the rare gas
dimers. The ease in which Lee and Fenn claim to have obtained reliable dimer fragmentation
values, and the apparent discrepancy with other researchers, prompted a detailed investigation
of this method.
Following a discussion of the original experiments, a modif,red Lee and Fenn method is
discussed and a comparison is made to the results of Lee and Fenn. The chapter finishes with
a comparison of the fragmentation data obtained from the literature, and a discussion of the
implications of the results.
5.2 Dimer Fragmentation using the Modified Lee and Fenn Method
A modifred Lee and Fenn experiment is used to investigate the energy dependence of
the Ar2 fragmentation. The method is discussed and compared to the original Lee and Fenn
approach.
5.2.1 The Method of Lee and Fenn
In the Lee and Fenn approach the molecular beam number density was measured in
two separate ways, firstly, with a mass flux gauge and secondly, with a quadrupole mass
spectrometer. The reason for the two measulements resides in the mass flux gauge's inability
to distinguish between clusters of different masses. That is, the many cluster - wall collisions
occurdng inside the gauge, ensure total cluster dissociation into monomer. Subtraction of the
159

monomer quadrupole signal from the mass flux gauge signal provides a measure of the
neutral dimer present within the beam.
Figure 5.1 is a schematic diagram of the Lee and Fenn apparatus and shows a single
chamber contâining both source and detection apparatus, with the molecular beam sampled
simultaneously by the quadrupole mass spectfometer and the mass flux gauge.
Mass Spectrometer
Mass fluxgauge
Pump
Figure 5.1: Schematic diagram of the Lee and Fenn experimont.
Equation 2.25aindicates that the nozzle throughput, and thus the molecular beam
number density, is proportional to the stagnation pressure, that is
n æ pstug (s.1)
where n is the molecular beam number density and p.,ug is the stagnation pressure. The key to
the Lee and Fenn method is the fact that the molecular beam number density is linear with
stagnation pressure, in the absence of disturbing effects. Thus, the stagnation pressure was
used as the control variable to change both the number density and the degree of
condensation.
In the fîrst stage, a low stagnation pressure region was employed to generate a
molecular beam devoid of clusters (see section 4.9). The mass flux current and the monomer
signal were measured as a function of the stagnation pressure, and expressed in terms of the
number density by
--------L n >
Nozzle
Shutter
I ,, = a,'nr'V
160
(s.2)

f *on = dt'flt (s.3)
where V is the molecular beam velocity, nr the monomer number density and the constants cxt
and crr include the ion transmissions and the detector sensitivities. Substituting Equation 5.3
into 5.2 allows the monomer current to be written as
I MF(s.4)
In this stage of the method, the currents I.oo and Ir,n' are linear with the stagnation pressure.
Once the normalisation factor, ar / (otn.V), had been obtained the stagnation pressure
was increased until dimers, but no higher polymers, were present within the molecular beam.
As in the low pressure case, the currents were plotted as a function of p.,,g , and the monomer
cunent was expressed as
I ro, = Qt.fr,.+ p' f ' üz'kz (5.s)
where nr and î2 àre the monomer and dimer number densities respectively, and ü1 and crz
include the transmission and detection efficiencies for the monomer and dimer respectively.
The constant, B, is the fraction of the fragmented dimer ions that appear as a monomer
cuffent.
At this stage Lee and Fenn make the assumption that Þ = 0 and assume that a negligible
fraction of the fragmented dimer is detected as a monomer current. Thus the monomer
current can be approximated by
Mon Iarvo(,
I ro, a&t.fl,
The neglect of B has been a source of controversy, and this will discussed shortly.
If we assume that a fraction, f , of the dimers fragment as a result of ionisation, then
the dimer cuffent is given by
(5.6)
I ,,^ = a, '(l- f )'n,
161
(s.7)

Since the monomer and dimer have essentially the same velocity (see Dittmers et al
(L972)), the mass flux current can be written as
I ,r = ü,'V (n, +2'nr)(s.8)
= d,(nr+2'nr)
where the factor of two is a result of each dimer being detected as two monomers.
Using the normalisation factor of equation 5.4, I-on is normalised onto I¡¡p.
Figure 5.2 illustrates the normalisation procedure for the case of ¡vo idealised curves
25
N orm alised I
mf
15 m0nAI
m0n
10
500 1 000 1 500 2000 2500Stagnation Pressure (torr)
Figure 5.2: Normalisation of the monomer cuffent onto the mass flux cuffent.
If clustering occurs molecules that would otherwise be registered as monomers are
detected at higher masses. Consequently, the formation of dimers results in the monomer
curve falling below the normalised mass flux curve. The difference, AI-on, between the
normalised mass flux curve and the measured monomer signal is a measure of the neutral
dimer present within the molecular beam. In the absence of larger clusters, ÂI-oo can be
expressed as
20U)
=c=-oC6
cq)
=()co
5
0
0
r62

= 2'dl.n2
where the factor of two is introduced to account for the fact that two monomers are required
to form a dimer. In the absence of dimers, where both I.oo and I¡,,n are linear, the monomer
difference is zero.
Lee and Fenn assume that the ion optic and mass spectrometer transmissions, and the
detection efficiencies are independent of the cluster species, which implies
(5.e)
&z=ü, (5.10)o1
where ozl ù is the ratio of the dimer to monomer ionisation cross-section. The measured
dimer ion current is then related to the neutral dimer number density by
N'o'= [ä
'1" -'*"')
(1, ", - r *..') =ó - r o,^.î +
N^o,=(l ,",-r,",)
o2
1 (s.11)2.ü,
If, like Lee and Fenn, we follow the general convention and assume ozl û = 2, we
arrive at equation 5.I2 n which all the parameters are obtained from the curves of Ivn, I.o,
and I¿i- versus P"or.
n2
(s.r2)
If the monomer difference is plotted against the dimer current over a range of P,¡u, for
which larger clusters are not present, we obtain a line, the slope of which is related to the
fragmentation, f, by
f 1_l
slope(5.13)
Figure 5.3 illustrates the results of Lee and Fenn for argon with an electron energy of
48eV.
r63

(n.=cJ
-oL(ú
(¡)()c(t)
(l)
=EL(¡)
EoEo
2000
1 600
1 200
800
400
E= 48eV
To=2950K
Slope = 15f = 0.93
0
0 40 80 120ldir.r (arb units)
160
Figure 5.3: 12 plotted against AI.oo for argon (after Lee and Fenn(1978)).
A summary of the fragmentation probabilities measured by Lee and Fenn is included in
table 5.1. The most strfüng point is the magnitude of the probabilities, which is always
greater than 0.9. These results suggest that in excess of ninety percentage of the neutral dimer
signal fragments during the ionisation event, and that the degree of fragmentation increases
with electron energy. Similarly, there was a negligible difference between the fragmentation
probability of the three van der Waal's dimers at an electron energy of 48eV.
Dimer Electron energy
(ev)
f(vo)
Arz 48 0.93
Arz 60 0.95
COz 48 0.93
Oz 48 0.9s
Table 5.1: Fragmentation probabilities according to Lee and Fenn (1978)
t64

5.2.2 Limitations of the Lee and Fenn Method
The results of Lee and Fenn suffer from errors that fall into two categories. Firstly,
effors associated with the limitations of the method and secondly, experimental enors
associated with the manner in which the measurements were conducted.
Límítøtíons of the Method
The method described in the previous section involves two simplifications, both of
which are capable of distorting the fragmentation probability. Firstly, it is diffrcult to justify
why p=9, should hold in general. Lee and Fenn have argued that a posteriori examination of
their experimental results suggests this is the case. They suggest that a large component of the
fragmented dimer ion is not detected in their mass spectrometer, possibly as a result of
metastable decay outside of the ion source, see Fenn and Lee (1982).
This is an unlikely explanation since Märk (1987), amongst others, has reported
negtigibly small metastable decay rates for rare gas dimers ion formed via direct ionisation.
Similarly, I was unable to observe a peak coresponding to the metastable decay of rare gas
dimers in either my mass spectra or those published in the literature. My measurements
reported in section 5.2.3 show that B is close to unity.
The second limitation of the analysis of l.ee and Fenn is the assumption that o216ç),
which, in the next section, I will show is not the case. Further examination of the method of
Lee zurd Fenn shows that this assumption is untenable.
Starting with equations 5.5 and 5.9 and assuming all of the fragmented dimer cunent
is detected as an additional monomer cuffent , ie p=1, we obtain
n2 - N^on
2.ü,
I (a, , - \ ^ o. I=,*;[ä' a'(n'*2' n')- o'' n' - f i' "'' "' )
n^=n^(r-!- Y)¿ ¿[ 2 or)(5.14)
For p = 1, the assumption that 6z I o1 = 2 leads to the conclusion that fragmentation is
always zero. Since my measurements indicatre that p is very close to 1, and since
fi'agmentation is known to occur, the ratio of the cross-sections must be less than2.
16s

Recalling that the method of determining the fragmentation, -f , using the slope of
ÂI-oo versus I¿¡o, relies on both 6z I 6t = 2 and Þ = 0, let the value of / calculated using this
erroneous method be called F. This constitutes a first approximation which is related to the
actual fragmentation / by
(5.1s)
where c,zt = azl or. This relation can be shown if we consider the approximation to / gained
by the employment of the method of Lee and Fenn, ie with F = 0 and 6zt = 2.
ta-1 I -N^on-10,.slope N
^on
(5.16)
If we assume Ê=1 and that o, is not constrained to be equal to 2 then F can be expanded as
follows
p- (s.17)
T. o,(", +2' nr) - or. n, - f ' üt. o zt. n2
which reduces to
(5.18)
or the equivalent form of equation 5.15.
The value of the measured fragmentation F depends on the ratio of the cross-sections.
Any attempt to interpret the results of a Lee and Fenn experiment requires a knowledge of
ozr, which must be obtained by a separate method. The difference between / and F is
displayed in figure 5.4, for five values of ozr.
166

1.0
0.8
0.6
0.4
0.2ooo oo
+++
+
o oo
o(fooo
F
+
o oo +
oo +o
oao
OAo o
AA
A
ü
.9(úL(¡)
Eo)(ú
LL
õo)
=U'(g(¡)
*oA
o
ooooo
+
ooo
^A A
(e)
0,0
0,0 0.2 0.4 0,6 0.8Correct Fragmentation
1.0
Fi_eure 5.4: Measured fragmentation F as a function of the coffect fragmentation,f , for five
values of ozr; (a) orr = 1,(b) 6zt=L25,(c) o2t=1.5, (d) o21=1.75 and (e) orr=2.
The solid line in figure 5.4 represents F = / . The lack of agreement between the
measured fragmentation F and the correct fragmentation / ,for all values of o21, indicates that
F is a poor approximation for f .
In some cases B may be slightly less than 1. If metastable decay of the dimer ion does
occur in the mass dispersive element then the amount of fragmented dimer ion that is detected
as an additional monomer current is reduced. Similarly, the extraction and transmission
efficiencies may be sensitive to the radial velocities of the dimer fragments. If a mass
spectrometer geometry with a very small acceptance angle is employed, a P < 1 may result. In
such cases, a small change in the velocity component of the fragmenting dimer may result in a
lower detection efficiencyl. However, in the mass spectrometer configuration of Lee and Fenn
it is diff,rcult to justify P << 1, accepting that metastable decay of Arz* is negligible.
1 Several authors have shown that transitions to repulsive electronic states can resut in the formation ofenergetic fragment ions (see Mark and Dunn (1985) and Rapp and Englander-Golden (1965). Furthermore
these energeúc fragment ions can lead to ion extraction errors if the apparatus is not appropriatelyconstructed. However, in my case, calculations of ion trajectories within the ionisation box have shown that
even ions with iniúal transverse velociúes as high as 5eV will leave the box in a reasonably paraxial beam
which will remain focussed by the subsequent ion lens. The ability of my ion extraction-detecúon system to
handle large ion beams (up to 10mm) has ensured that, in the abscence of signihcant metastâble decay, p is
equal to 1.
I6l

I believe that Lee and Fenn's inability to detect a significant additional monomer
current, ie Ê > 0, is a consequence of short comings in their apparatus, and does not lend
support to their original assumption that B = 0. These short comings will be discussed in detail
in the next section.
Límitations of the Apparatus
As indicated in the last section, the analysis of Lee and Fenn in which the fraction of
the fragmented dimer ion that is detected as a monomer current is neglected, is some what
untenable. An inspection of the Lee and Fenn data and the conduct of a number of
independent experiments suggests that the apparatus of Lee and Fenn introduces detection
efrors.
Unlike the ideal case of figure 5.2, the Lee and Fenn mass flux curve, displayed in
figure 5.5 shows considerable curvature for p,t"g greater than 1700torr. Lee and Fenn attribute
this non linearity to scattering from the background gas.
300
250
200
150
100
50
ooo
En=48eV
TO=2950K
éA
Am
Áo
ô
an.=E=-oL(ö
(¡)
=()LoC)o)c)o
f A\a
ÂA ooo
oo
6OoÂ
o x 1.26ô mon
a
ê
o
0
0 1 000D' stag
2000(to rr)
300 0
Figure 5.5: Mass flux cuffent and the normalised monomer current for argon.
(after Lee and Fenn(1978)).
While scattering is certainly present for the chamber pressures used in their experiment, ie up
to - 1 x10-s torr, it does not explain the large curvature. If we consider a path length
168

between the nozzle and the mass flux gauge, namely, 16cm and an argon mean free path of
4.1cm (at 10-3torr), then background scattering would produce a deviation from linearity of -57o,for a chamber pressure of 10-storr. However, the mass flux deviation in figure 5.5 at
their maximum stagnation pressure (p*oe = 3000torr) is more Iike 25Vo2. While the ionisation
gauge sensitivity or the presence of beaming effects may reduce the discrepancy, it is unlikely
to eliminate it.
I attribute the majority of the non ünearity in the monomer and mass flux currents to a
change in the divergence of the molecular beam with increasing stagnation pressure. The mass
flux gauge and quadrupole mass spectrometer sample the molecular beam at two different
positions down stream, and each detector has a different angle of acceptance. If the radial
distribution within the molecular beam changes with stagnation pressure the two detectors
will respond differently, and non linearly (see section 4.5.2). The unduly large dimer
concentrations measured by Lee and Fenn indicate that the monomer cunent is too low, ie the
mass spectrometer detection efficiency is decreasing at higher stagnation pressures. It is this
over estimate in the neutral dimer concentration that gives rise to the large fra-ementation
probabitities measurcd by Lee and Fenn (see table 5.2).
Helm et al (1979) suggest that the results of Lee and Fenn are falsified by a difference
in the extraction efficiency of the monomer and the dimer. It is possible that the ion
extraction, in the Lee and Fenn case, may critically depend on both the point of ion formation
and the ion kinetic energy.
' This assumes fhåt p5tug= 3000ton corresponds to the maximum nozzle flow, where Lee and Fenn measured
the chamber pressure to be -1O-storr.r69

5.2.3 The Modified Lee and Fenn Method
Estimation of the neutral dimer component in the beam, by making accurate
measurements of the monomer difference, ÂI.oo , is made particularly difficult by the fact that
ÁI-on is only about 5Vo of the total monomer current. Therefore, working out the neutral
dimer component to an accuracy of I}Vo rcqwres a measutement of ÂI-ooto within 0.5Vo.
In the experiments of Lee and Fenn, the monomer difference is obt¿ined by measuring
the difference between two non linear curves. The authors assume, but do not demonstrate,
that in the absence of dimer formation the two non-linear curves would, when normalised, be
identical.
However, as shown in the previous section, a non-linear monomer curve in the
absence of dimer formation is indicative of insffumental insufficiencies. In what I call the
Modified Lee and Fenn method I have ensured linearity of the monomer curve over the
pressure range of interest. This has been done by suitable choice of the nozzle diameter d" and
the nozzle-skimmer distânce d^ in accordance with the results of chapter 4. I have maintained
conditions which, in the absence of dimers, the monomer current is always proportional to the
stagnation pressure. Similarly, I am able to demonstrate that there is a region in which the
deviation of the monomer curve from linearity is due solely to dimer formation. Once this
configuration is est¿blished the mass flux gauge becomes redundant, simplifying the
measurement of the monomer difference.
The method is presented in seven steps, and reflects the order in which they were
conducted. It was customary to repeat certain steps to show that the system was stable with
time or to obtain repeat measurements.
Step 1 Creation of Díscrimínatíon Free Condítions
In the discussion ofthe apparatus, presented in chapters 3 and 4, possible sources of
discrimination were listed, and eliminated where possible. For example, the electron gun, ion
optics and mass spectrometer have been shown to be free of discrimination effects. Similarly,
every effort has been made to demonstrate that the monomer and dimer ion beams are
detected with equal probability, neglecting differences in the ionisation cross-section.
The method detailed in the followin-q steps was used when all sources of
discrimination had been investigated.
Step 2 Employment of the Mass Flux Gauge
The ionisation box was temporarily replaced by the mass flux gauge to show that the
molecular beam flux was linear with stagnation pressurc over the range of interest. A series of
lto

runs, detector output versus stagnation pressure, were taken at various nozzle temperatures
andnozzle-skimmer separation. Linearity was obtained with a 30pm orihce and anozzle-
skimmer distance of 7mm. Figure 5.6 illustrates the highly linear dependence of the MF
gauge output on stagnation pressure. The interaction chamber pressure, which directly
reflects the flow into the chamber, is also shown.
2.0
1.6 Ir¡-)
ox(l)
=U).t)(l)
o-
c)-oE(Ú.c.()
2
0.4
.n=oc)OJf(õ(5x=
LL(t<n(õ
I
7
6
5
4
3
2
1
Pcham ber
MFG 0.8
0.0
0 1 000 2000 3000Stagantion pressure (torr)
4000
Figure 5.6: Linearity of the mass flux gauge and the total flow into the interaction chamber
The fact that the graph is linear at pressures, where the dimer signal is appreciable,
suggests that Mach number focussing is not disturbing the ratio of the neutral dimer to
monomer entering the ionisation chamber as the stagnation pressure is increased. For if this
was not the case, through Mach number focussing, proportionally more dimers would be
entering the mass flux gauge and the graph of mass flux current versus stagnation pressure
would concave upwards, and be non linear.
Step 3 Obtøin Línearíty of the Total lon Current
Upon replacement of the ionisation box, the total ionisation current extracted from it
was then checked for linearity over the pressure range of interest. The Faraday cage used in
section 4.5.2 (see figure 4.3) was employed to collect the current at either the exit of the
ionisation box or at the entrance to the mass spectrometer. These measurements were
repeated at several electron energies.
0
t7l

With a nozzle diameter, do = 30pm, a nozzle-skimmer distance d^ = 7mm and a nozzle
temperature Ts = 3200K, the ion current was linear out to a stagnation pressure of 3000ton
(see figure 5.7). At pressures -3200torr a deviation from linearity was detected. The
deviation was due to a failure of the dimer current to fully compensate for the relative
decrease in the monomer cuffent due to the formation of dimers.
If I accept that two neutral monomers are required to form a dimer and that monomer
and dimer ions are detected with equal probability, then the deviation from linearity can be
attributed to ozr <2. Thatis, the dimer ionisation cross-section is not large enough to
compensate for the fact that two monomers are required to form a dimer. Further evidence
that ttre ratio of the ionisation cross-sections, ozr , is less than two will be presented in the
next section.
The ion current measurements were repeated at temperatures in the range 250 -
3200K, with the deviation from linearity displaced to lower pstag âs the temperature was
lowered. This reflects the decrease in the pressure required for the onset of dimer formation.
Figure 5.7 illustrates the total ion cuffent, as measured at the entrance to the mass
spectrometer, for two nozzle temperatures.
2.0
2.5
To=
U'o-E(ú
F
-Ioxc(l)
=Oc.oGoF
{1.5
1.0
0.5
To = 32ooK
0.0
0 1 000 2000 3000Stagnation P ressure (torr)
4000
Figure 5.7: Total ion current versus p"øg for To= 2500K and 3200K.
The ratio of the slopes of the regression lines (1.12 from figure 5.7) is in good
agreement with the theoretical change in the mass flux, ie JZZOIJZn = 1.13. The ability to
172

influence the deviation from linearity using the nozzle temperature indicaæd that the deviation
was not due to scattering from background molecules.
Step 4 Obtaín Línearíty of the Monomer Current
At this stage the Faraday cage was retracted and the Daly detector used to measure
the ion cunent as a function of stagnation pressure. I expected this to be linear up to the
point where dimer formation becomes signifìcant. The deviation from linearity should be at a
lower pressure for lower nozzle temperatures. With T0 - 2500K , the monomer cuffent shows
non linearity above pstag - 2000torr, and as in step 3, the onset of the non linearity is displaced
to higher stagnation pressures as the nozzle temperature is increased. For To - 3200K, the
monomer current is a linear function of p,og, for p.øg < 3000ton. For all of these cases the
mass flux gauge had previously shown that the molecular beam number density is linear with
pstag, âDd the scattering corrections, discussed in section 4.8, were applied throughout.
The use of the nozzle temperature to push the onset of dimer formation to higher
pressures demonstrates that the monomer signal is linear with p"øs, if the molecular beam is
devoid of clusters.
A check on the influence of the temperature was conducted in two ways. Firstly, the
pressure at which the monomer curve deviates from linearity was compared to the pressure at
which the dimer current is detected. This was repeated for severalnozzle temperatures and, in
all cases, the shift in the pressure at which a dimer cuffent was detected corresponded to a
shift in the pressure at which the monomer curve deviated from linearity. For a second check,
I noted that the mass flux was proportional to 1/ {To from equation 5.1 and plotted the slope
of the monomer as a function of nozzle temperature. This is illustrated in figure 5.8, where the
argon monomer cuffent was measured at an electron energy of 30eV. Here the slope is
proportionalto Il{To , which confrrms the predicted change in mass flow using equation.
5.1.
173

3.0P =140otorrsta g
2.7
En = 60eV
2.4
2.1
1,8
En = 3oev
1,5
6.5
Figure 5.8: Monomer current as a function of the nozzle temperature for electron energies of
30eV and 60eV.
These measurements were repeated at 80eV and 120eV and as before the 1/ {Ts dependence
was established. The ordinate points were displaced in proportion to the change in the
ionisation cross-section or with electron energy. Again this confirms that the overlap of the
electron and molecular beams were not effecæd by changes in the electron energy.
At this point I was convinced that any deviation of the monomer cutve from linearity
below 3000torr, rwas not due to any instrumental a-rtefacts, but solely due to the formation of
dimers.
Having established this, the monomer and dimer currents from then on were measured
as a function of the stagnation pressure, for p,tug < 3000ton and To = 2500K. To ensure
reliability in the readings a number of runs were taken and the greatest unceftainty at any
point did not exceed * | Vo. To achieve this accuracy the system was allowed to stabilise for 3
to 4 houls and care was taken to ensure pressure equilibrium was established for each
pressure setting. Once these precautions were taken monomer runs could be repeated half an
hour apart to the stated accuracy.
Measurements were made over an electron energy range from 20 to 200eV3.
3 The energy range was subsequently increased to 500eV for the fragmentation experiments in section 5.3.174
U)
=c)-o(Ú
c(l)
¿c)o)Eoo
5.5 5.7 5 I 6.1 6.3
to-o u ( x1o-2 r-o'5 )

Step 5 Measure Dimer Current
On completion of sæp 4 the monomer runs had been obtained with high reliability and
all that remained was to check the accuracy of the dimer readings.
The first test was a check on the pressure dependence of the dimer current. As
mentioned in section 4.9 the dimer current could be accurately represented by a power law.
All dimer readings were plotted logarithmically and ttre appropriate po!trer law fitted. At high
pressures the power law breaks down as the rate of production of dimer decreases as trimers
are formed. This occurred for a stagnation pressure about 2900torr, and provided an upper
limit, above which dimer fragmentation measurements were not attempted. Figure 5.9
displays the dimer current dependence on the stagnation pressure for three electron energies.
While the lines are displaced according to their relative ionisation cross-sections, the slopes
are equal. As in the monomer case, the deviation of the dimer cuffent form the power law can
be shifæd to higher pressures if the nozzle temperature is increased.
b)
(c)
A
¡Oaaa
(d)
5
3
2
1.0
(t).=c-o(d
cc)L
()o)
.Eo
5
3
2
0.1
2 3451 000
Stagnation Pressure (torr)
Figure 5.9: Dimer current versus p"þg for three electron energies; (a) 100eV, (b) 55eV and (c)
25eY. Curve (d) is the trimer current measured at25eY.
The second check on the dimer data was to measure the trimer current as a function of
the stagnation pressure and determine the pressurc at which the trimer ion appears. Curve (d)
of figure 5.9 shows that the trimer cunent below -3000ton is negligible. While alatge
fragmentation probability for the trimer may imply this is an over simplification and that a
t75

significant amount of trimer may be present in the molecular beam below 3000torr, the quality
of the power law fit to the dimer for variations in electron energy and nozzle temperature
suggest this is not so. Further in this connection, the graph of monomer difference ÄI-oo
versus dimer current is linear for p"øg < 3000ton ( see figure 5.10). The presence of the trimer
would cause a deviation from linearity. Additional evidence is gained by noting that no higher
polymers were detected before the trimer ion could be measured.
I conclude that for the pressure range of interest ttre trimer component can be
neglected. Since in this range the power law representation of the dimer is accurate, the
dimer values derived from this were used in the analysis, thus permitting easy interpolation or
extrapolation, as required.
Step 6 Look for Metastable Decay
The previous steps allowed the fragmentation probability to be determined if I
assumed that p = 1. It could be argued that p is smaller than 1 because of metastable decay
occurring within the mass spectrometer. Metastable decay can be represented as
Arr*e ) Arr*" +2e
- Ar* * Ar *2e after some time, t-"¡".
If this decay occurs during the transit through the magnetic field the monomer ion will not be
detected as a monomer, ie causing p to be less than 1. In this case a metastable peak would
occur at a fractional mass number. Measurements taken at significantly high mass resolution
showed no evidence of such peaks (see for example figure 3.23).
In the absence of metastable decay and in view of the results of chapter 4, I am
justified in accepting Þ = 1.
Step 7 Determínatíon of the Fragmentatíon Probabílìty
The monomer dìfference ÂI.o,, was determined in the same manner as L,ee and Fenn.
However, in view of the fact that I have taken precautions to ensure that in the absence of
dimers the monomer current is accurately linear, there was no need to employ the mass flux
gauge. The method of measuring the monomer difference is as that for the ideal case
illustrated in figure 5.2.
t76

Plotting the observed dimer current against the monomer difference, allowing for flag
effectiveness and Daly detector efficiencies etc, permitted the slope to be interpreted in terms
of equation 5.12. Figure 5.10 contains three plots of the monomer difference versus the dimer
current, for anozzle temperature, Ts = 2500K.
30
a)
(b
(c)
15
10
3, 2sE(ú
To= 25ooK
æ
20ox(I)(-)Lo)(¡)
=E<¡)
EoLo=
5
0
0 36912Dimer Current (x1 0-Bamps)
15
Figure 5.10: ÂI-o,versus I¿i," for electron energies; (a) 30eV, (b) 80eV and (c)120eV.
Following Lee and Fenn, ozr is assumed to be two, and the fragmentation probability
F (for each electron energy) derived from their analysis (with p = 0) is obtained from the
slopes of the regression lines in fîgure 5.10, noting through equation 5.13 that
1F=Islope
(s.1e)
Fragmentation probabilities were calculated from the monomer and dimer runs
collected in Step 4. The effor was determined by measuring the maximum and minimum
slope, consistent with the data at each electron energy. The spread in the fragmentation
probability was obtained from the extrenum values of the slope.
A check on the reliability of the fragmentation measurements was obtained by
measuring F at 30eV for three nozzle temperatures, To. The measured fragmentation
probability was found to be independent of the nozzle temperature, providing additional
confidence in the measurements.
r77

A second check was obtained by normalising the monomer ion curves taken at various
electron energies onto one curve, in accordance with their respective ionisation cross-
sections, as shown in figure 5.11. In the low pressure region where no dimers are present the
normalisation produced a straight line, once again indicating the validity of the results. Further
confirmation can also be derived from the curved portion of the graph where the non linearity
arises from dimer formation. Here I find that for electron energies resulting in fragmentation
with the same probability the curved portions are coincidental.
3.02.5
I$
2.3$
2.1
2500 3000
0T = 250 K
0
2.5
2.0
1.5 + 30eVo 40eVo 60eV¡ 100eV
1Dimer onset
1.0NormalisationPoint
0,5
0.0
ICII
EI(n
=L-o(ú
c<l)
()o)EoC,o
0
1
1 000 2000Stagnation Pressure (torr)
3000
Figure 5.11: Monomer ion current versus stagnation pressure. The 30eV, 40eV and 60eV
curves are normalised onto the 100eV curve ât p,ør=1400torr.
t78

5.2.4 Argon Dimer Fragmentation
The method described in the previous section was used to obtain the fragmentation
probability of Ar2 as a function of electron energy. However, the fragmentation probabilities,
F, obtained from step 7, need to be analysed in view of the discussion in section 5.2.2. With
reference to equation 5.5, two cases are considered, Þ = 0 and B = 1.
Case 7 Consíder p=0
In this instance the results of the modified Lee and Fenn method are taken atface
value, with F= / . That is, I assume that fragmenting dimer ions do not contribute to the
monomer ion current. Similarly, the ratio of the cross-sections ozr is assumed to be equal to 2
and the results are interpreted in the same manner as those of Lee and Fenn. The energy
dependence of the Ar2 fragmentation is displayed in Figure 5.12.
1.0
0.8
0.6
0.4
F=oArgon
**
--
Lee & Fenn
.=-o(ú-ooo-co(gco)Ect)(5
tL
Buck & Meyer_____.._
+Helm et al
r
0.2
Present results
80 120 1 60Electron energy (eV)
0 40 200
Figure 5.12: Case I Þ = 0: Arz ionisation induced fragmentation probability as a function of
electron energy.
There is a significant change in the fragmentation probability with electron energy,
with a maximum at about 60eV. For energies greater than about 80eV the fragmentation
probability decreases with increasing electron energy. The 'crosses' are the data of Buck and
r79

Meyer (1984), obtained using a crossed molecular beam experiment. Their values agree with
my results at 30eV and 40eV, while their value at 100eV is significantly higher.
The results of Lee and Fenn (solid diamonds) are much higher than those obtained
here and by Buck and Meyer. As indicated previously, I believe that the fragmentation values
of Lee and Fenn are too high because of discrimination in thefu apparatus which caused an
over estimation of the monomer difference, ^I-o,
.
While my results show agreement with those of Buck and Meyer, I believe this is
fortuitous since there is no basis for assuming that Þ = 0. I will discuss this point further
below.
Case 2 Consíder B=7
In this case the fragmenting dimer ions are assumed to be wholly detected as an
additional monomer current. This is consistent with the lack of metastable peaks in the argon
mass spectra and the performance of the system.
An inspection of equation 5.14 reveals that the fragmentation probability, obtained in
step 7, should always be F= 0if ozr = 2. However, the factthat Ihave obtained F+0
indicates that ozr is less than2.
The correct fragmentation probablhty, f is related to the estimated fragmentation
probability, F, by equation 5.15 and for absolute fragmentation probabilities to be obtained,
o21 must be known. The ratio of the cross-sectioîs ozr can be obtained if I accept the
fragmentation data of Buck and Meyer (1984) at one electron energy. In their crossed
molecular beam experiments the neutral dimer is size selected and the method allows
fragmentation probabilities to be measured without a knowledge of ozr. Rearrangement of
equation 5.15 yields
6r, (5.20)F.f_I
The values of ozr obtained from a calibration with the data of Buck and Meyer (1984) are
listed in table 5.2.
180

En (eV) F (7o)
ftomcase lf (7o) from Buck
and Meyer (1984)
6zt
30 0.4'7 0.5 1.39
40 0.48 0.52 1.39
100 0.49 0.62 1.47
Table 5.2 Values of ozr for three electron energies
From these figures I select ozr eQual to 1.4, indicating a value significantly smaller
than ozr = 2 usually assumed in fragmentation studiesa. I therefore use the value of o¿ = 1.4
This is
shown in figure 5.13, along with the previously displayed uncorrected curve.
0,8
0.6
0.4
ß=1Argon
Buck & Meyer
=-o(õ_ooo-c
_9(d
c(¡)
E(')(ú
LL
T-Ttt I -tr I IrlfIôo0t
+'/
rI (F=1üõt+dsr
f Ë{ït*T
¡
+'
É=0
0.2
0.0
40 80 120 1 60Electron energy (eV)
200
Figure 5.13: Case 2 Þ = 1 : Ar2 fragmentation probability versus electron energy.
a It should be noted that steric considerations indicate this should be smaller than 2181
0

The corrected curve has a more pronounced maximum than the previous one and
shows slightly better agreement to the Buck and Meyer value at an electron energy of 100eV.
There are two salient results from this investigation. Firstly,I have established that
the ratio of the ionisation cross-sections is - 1.4, which is similar to the ratio of the dimer to
monomer gas kinetic collision cross-section obtained in section 4.7. Secondly, there is the
existence of a maximum in the variation of the fragmentation probability with electron energy.
It is interesting to note that McCann and Flannery (1979) and Flannery et al (1981)
have found that the cross-sections for ionisation of the metastable dimers Arz*, Krz* and
Xe2*are between 40Vo and S}Tohigher than the corresponding metastable monomer ionisation
cross-sections, as determined by Ton-That and Flannery (917). While their calculations do
not refer to total cross-sections for single ionisation of neutral dimers, it is comforting to see
that the ratio of dimer to monomer agrees with the value of 1.4 determined above.
I consider that, for the investigation of the energy dependence of the rare gas dimer
fragmentation, the usefulness of the Modified Lee and Fenn has been exhausted. It's
application to other rare gases would require a knowledge of ozr for each gas, for which data
is not readily available. In addition, an inherent difficulty of the method is that it involves
measurement of the relatively small monomer difference, ÂI-on.
The question arises whether this maximum applies only to argon or whether it is a
genelal feature of other gases. To answer this question only relative fragmentation
probabilities are required. V/ith this in mind, a simpler approach which provided accurate
relative fragmentation probabilities was employed.
5.2.5 Relevance of the ModifÏed Lee and Fenn Results
It is interesting to note that in the experiments of Gough and Miller (1982) it was
possible to determine both the ratio of the cross-sections and the degree of fragmentation.
Here Gough and Miller used an infrared laser to excite CO present within a helium molecular
beam. The monomer flux was subsequently detected using a liquid helium cooled bolometer,
and this in turn provided a calibration for their mass spectrometer. The fact that it was not
possible to detect absorption in the case of the CO dimer enabled the bolometric
measurements to provide a direct measurement of the monomer flux even when the molecular
beam contained a substantial dimer component.
Gough and Miller report that for 100eV electrons 857o of the ionised CO dimer
immediaæly fragmented and the resulting monomer ion current contributes to the monomer
signal, ie their analysis suppolts the use of B=1 in the absence of metastable mass peaks.
t82

Gough and Miller (1982) argue that their data is of a high quality by showing that the
measured relationship between the CO mass spectrometer current and the CO flux is in good
agreement with that calculated from their analysis. However two points needs to be
considered. Firstly, Gough and Miller (1982) have measured the ratio of the ionisation cross-
sections (dimer:monomer) to be equal to 2, which from my results for argon is too large.
Secondly, Gough and Miller used the stagnation pressure as the control variable to adjust the
CO monomer and dimer flux, and their pressure dependence shows a significant deviation
from linearity at pressures below which dimer formation is present. As in the Lee and Fenn
experiments, the fragmentation value hinges on the determination of the neutral dimer
concenffation in the molecular beam which is obøined by measuring the difference between
two non-linear curves. Moreover the curves correspond to two source conditions namely, a
helium molecular beam containing, in the first instarice l7o CO and in the second case 207o
co.
It is possible that the results of Gough and Miller were, to a limited extent, affected by
changes in the relative sensitivity of the mass spectrometer and laser-bolometer as the
molecular beam divergence increases with stagnation pressure.
The use of additional measurements to calibrate mass spectrometers is a novel
approach to the problem of fragmentation of small van der Waals dimers within mass
spectrometers. However care must be taken to account for the fragmented dimer that appears
as an additional monomer signal. Similarly, when the stagnation pressure is used as the
variable to control both the degree of condensation and the magnitude of the mass
spectrometer signals it is important that the effects of changes in molecular beam divergence
are not interpreted as an increased neutral dimer component.
183

5.3 Dimer Fragmentation using the Relative Ionisation Cross-sections
This approach was similar to that of Helm et al (1979) and as a first step involved the
measurement of the relative ionization cross-section of both the monomer and dimer under
source conditions where larger clusters were not present. The cross-sections were obtained in
the same manner as that described in section 4.4.
The two curyes were then normalised at an electron energy which in principle was
arbitrary, but for which the value of 30eV was chosen for reasons to be discussed below.
5.3.1, Normalisation of the Dimer lonisation Cross-section
With reference to Figure 5.14, if the dimer curve is normalised to the monomer curve
at the electron energy Er , with a normalisation factor k, the ordinate difference between the
two normalised curves at any electron energy E is given by
^(E)= I-on-kIdî^ (s.2r)
where the monomer and dimer cuffents are defined by
I ^o,
= ht.6 t + nr.o r. f (E) (s.22)
10,-=flz.az.Q-f@)) (s.23)
where n, and n2 aÍe the neutral monomer and dimer number densities, o, and o, are the
monomer and dimer ionisation cross-sections respectively and f(E) is the fragmentation
probability at E.
184

(t=C,)-o(ú
C,o)
()
o
2.0
1.5
1.0
0.5
XKl=1,m0ê= o)
-.1xk
dim
m0n
0 1 00 200 300 400 500
EE
Figure 5.14: Dimer and monomer currents normalised at Er = 30eV.
If the dimer cuffent is small compared to the monomer current then the difference, Â, can be
expressed as
^(E) = nt.o r - k.nt.6 r.(1 - /(E)) (s.24)
Here the assumption that nz is negligible in comparison to n1 is fully justifred because,
contrary to the Modif,red Lee and Fenn method, I can measure the monomer ionisation cross-
section at a pressure so low that no dimers are present. Subsequently, the dimer cross-section
is determined at a pressure sufficiently high to yield a dimer signal. The fact that the monomer
is also present is of no consequence. The method has the additional advantage that the
ionisation cross-section runs are made at constant pressure which means there were no delays,
which in the modified Lee and Fenn method were necessary for pressure stabilisation.
Attheenergy E= El, where the normalisationis made, Â=0 andf (E) =f ( El ) so
that
185
(s.2s)

By substituting equation (5.25) into equation (5.24) and assuming that o21 is independent
of electron energyt we arrive at
(s.26)
This allows the relative fragmentation probability to be obtained by measuring the difference
 and the monomer current l-oo at each electon energy E. The values are easily converted
into absolute probabilities if ¡(tt) is known from other measurements. Such measurements
exist for argon at 30eV which is the normalisation point (Buck and Meyer f = 0.5).
For a further test of the overall ion - optical performance of the apparatus, the relative
ionisation cross-section of several monomers, in addition to argon, were determined and
found to be in good agreement with the values published by Krishnakumar and Srivast¿va
(19SS) (See top curves of figure 5.15a-d), confirming that my measurements did not suffer
from any significant discrimination effects.
A check on the fragmentation measurements was obtained by repeating the ionisation
cross-section measurements at a variety of stagnation pressures and fol a range of nozzle
temperatures. The fragmentation probability was found to be invariant for changes in source
conditions, provided higher polymers were not present.
5.3.2 Rare Gas Dimer Fragmentation
Figure 5.15 displays the relative ionisation cross-section data for the rare gas
monomers and dimers. The open symbols are the most recent [terature data, taken from
Krishnakumar and Srivastava (1988) for the monomer and from Helm et al (1979) for the
dimer, while the solid symbols ret'er to measurements taken as paft of this work.
5 Here the ratio of the dimer to monomer cross-section o21 at ânj electron energy E is assumed to be equal to
the ratio at the energy of nonnalisation Er, ie ozr G') = ozr (Er). This assumpúon is based on the addiúvityrule which asserts that the cross-section for ionisaúon of the argon dimer should be equal to a constant times
the cross-section for ionisation of the monomer.The additivity rule has been investigated by a number ofauthors and found to be very reliable for a variety of molecules over the energy range from -50eV to 200eV(see Margreiter et al (1990a,1990b), Tarnovsky and Becker (1993) and Tarnovsky et al (1993)). For example,
Ocvos and Stevenson (1955) measured the ionisation cross-section for a number of molecula¡ species and
found that these cross-sections were equal to the sum of the atomic cross-section of the constituent atoms.186

8.0
7.0
6.0
5.0
4.0
3.0
2.0
1.0
0.0
4.0
3,5
3,0
2.5
2.0
1.5
1.0
0.5
0.0
N eon11r' l^--ÊnI r¡Monomer
-/D+ç.ô
ê-.'èà+,
R
fl=cf-o(ú
LoL
JC)
co
n,
A
frûI
tm eriÞ *ç++s*{þ€s,ç
200 300 400 500Electron Energy (ev)
(a)
Argon
O¡>
Dimer
l, r-;
^
400 500
Æ
saI^e.
.=C.
=-o(ú
C,o)(Jco
0 100
100
A ¿ Monomer"nA--'
"Êåå^,.\.:.::î:;:
0 200 300E lectron Energy (ev)
(b)
187

2.0
2.4
1.6
1.2
0.8
Krypton
Monomer
å ô åa,O1 É
o
Dimer
1 00 200 300 400Electron Energy (ev)
(c)
Xenon
aÀI
.=cf-o(d
co
=(Jco
EÈ
ÊÊå
1l:te
0.4
0.0
16
14
12
10
0
M onom er
500
500
.ry\Ê
a
ít
atr
^A()
âoa
^
U).=L
_o(ú
cogJ()co
I
6
4
2
0
n
aa Ão¡,aaa 1g !,ao a
D mer
1 00 200 300 400Electron Energy (ev)
(d)
fl.,,^ìf, r-;Ã
3t3
0
Figure 5.15: Relative ionization cross-sections for the monomer and dimer of the rare gases:
(a) Ne, (b) Ar, (c) Kr and (d) Xe. To reduce clutter the dimer curves are not normalised on
to the monomer curves. The literature values (open symbols) are notmalised at 100eV.
188

My measurements of the monomer cross-sectionsu are in good agreement with the
published data. Also in the case of the dimer, where the measuring accuracy is intrinsically
lower, the agreement with Helm et aI (1979) is generally good below 140eV. Above 140eV
the data of Helm et al lie signifrcantly lower than this data. Given the good agreement
between the monomer curves and the published data, out to 500eV, I am confident that the
apparatus does not suffer from significant energy discrimination and the data can be relied
upon.
The argon dimer fragmentation probability, derived from the data in figure 5.15b, is
shown in figure 5.16. For comparison, fragmentation values from the Modified Lee and Fenn
method are also included, and show good agreement with the data from the ionisation cross-
section method. In both cases the fragmentation scale was normalised at 30eV with the data
of Buck and Meyer (1984).
ITIT^
=-o(g-ooo-L
o'F(g
L
oEC')G'
LL
0.8
0.6
0.4
0.2
0.0
{'rü
^ I-
"^^t I.rl-^it^+ TI
Using ArrCross-section data
E Using Mod L & F with É=1
-T+l
2000 40 80 120 1 60Electron energy (eV)
Figure 5.16: Comparison of Ari fragmentation pr:obability derived from the Modified Lee and
Fenn and the Ionisation Cross-section methods.
6 The lack of error ba¡s in the relative ionisation cross-section cu¡ves is explained by noting that the
uncertainty in the ion current readings was in all cases smaller than the size of the symbols in the curves.189

This good agreement rests on adopting a fragmentation value of 0.5 at 30eV. If
normalisation had been made at 100eV, where Buck and Meyer give a fragmentation value of
0.62 (see table 5.2) the agreement between the two methods would be poor. This result is
evidence that the modified Lee and Fenn method is providing genuine Ar2 fragmentation data
and that it is not plagued by serious discrimination effects.
For all the rare gases investigated, ttre normalisation was carried out at 30eV, and in
the absence of other data the argon value of 0.5 for f (Et ) was used throughout. Adoption of
a different value would affect the fragmentation curve numerically, but would not affect its
general character significantly.
0.80.8Ne
osaoaoa(r,r-a2
tro
=-o(d-ooo-Co'=(ú
c(l)
E(')CÚ
LL
#tr6
=_o(ú-ooL
o-C.
.9(d
c(¡)
Eo)(dLlr
eX
0 1 00 200 300 400 500Electron Energy (eV)
2
aôtc
Kr2
0 1 00 200 300 400 500Electron energy (eV)
0.6 0.6
0.4
Ar2
8cg0,4 cEsEErEEsBs A
a^
Ia
0.2 0.2
Figure 5.17: Ionisation induced fragmentation of rare gas dimers as a function of the
electron energy. For the case of Ar2, Kr2 and Xez two separate runs are shown and in each
case, the frst run is indicated by the solid symbols while the open symbols indicate the second
run.
190

In all cases the probability of fragmentation passes through a maximum at an electron
energy dependent on the nature of the gas, similar to the manner in which the ionisation cross-
section varies with electron energy. The good agreement between separate runs, shown in
figure 5.17, indicates that the data is of a high quality. Similarþ, the absence of systematic
effors is highlighted by both results of chapter 4 and the good agreement with the published
curves for the monomer ionisation cross-sections.
In contrast to my results, the work of Helm et al (1979) indicates that the
fragmentation probability is almost constant for electron energies above 60eV, and shows no
evidence of a decrease at energies above this value. However, two factors need to be
considered. Firstly, the data of Helm et al is limited to energies below 180eV. and secondly,
their ionisation cross-sections displays a sharp decrease above -I20ev in all cases. Their
monomer data shows a similar decrease, which is not observed by either Krishnakumar and
Srivastava (1983) or within this work, suggesting there may be a discrimination effect
involved in the data of Helm et al (1979)7 .
5.3.3 Fragmentation Data for Other Gases
The study of dimer fragmentation was extended to other gases in an effort to
determine if the maximum in the fragmentation curves is a general feature of the
fragmentation process. Dimers of Oz , Nz and COz were generated under the same conditions
used to investigate the fragmentation of the argon dimer. Ionisation cross-sections were
measured and fragmentation curves were obtained using the normalisation method described
in section 5.2.I, see figure 5.18.
7 As mentioned in section 4.4.2, antmber of authors have postulaæd that the apparatus of Märk and co-
workers may have suffered from discrimination effects, and that these effects may be responsible for the rapid
decrease in ttreir ionisation cross-sections above -120eV (see Charlton et al (1988) or Rao and Krishnakuma¡(1992)).
191
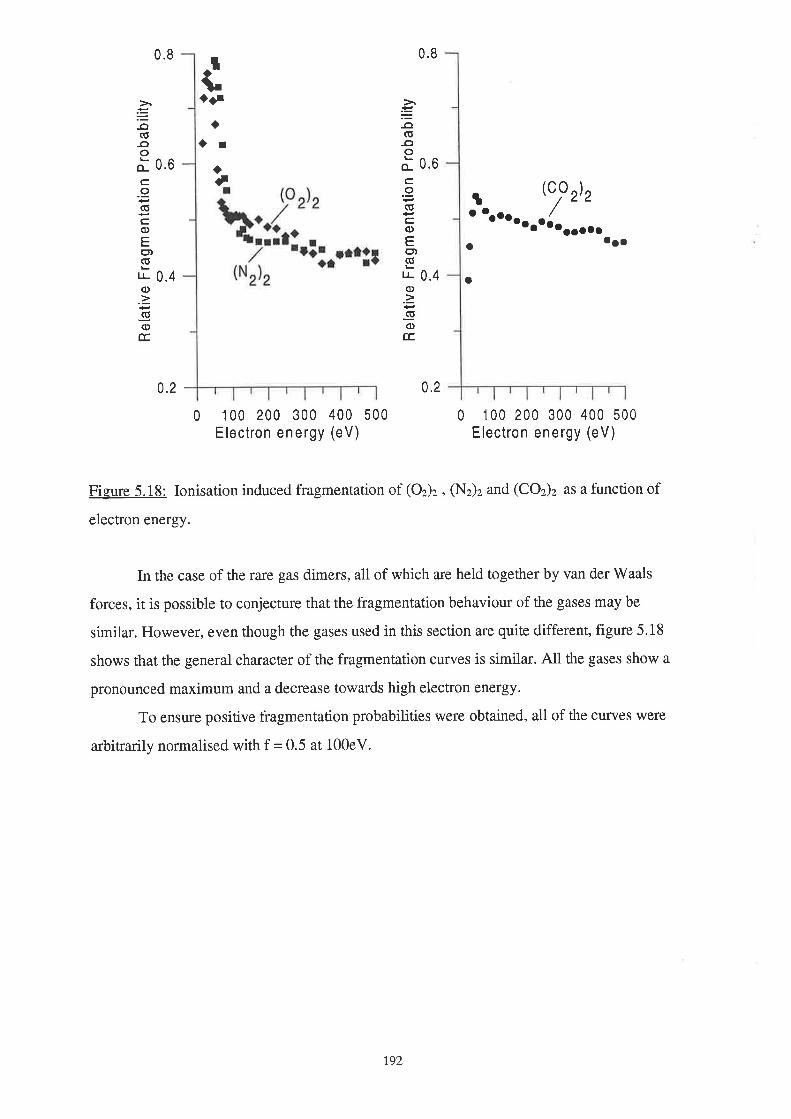
0.8
0.2
It...r
0.8
0.2
a
a
0.6
0.4
=-o(õ-ooL
o-c.9(g
co)Eo,(EL
LL(l)
(ú<t)
E.
a0.6
0.4
=-o(ú-ooo-
.9(ú
c(l)
Eg)(g
lJ-<t)
(gq)É.
aI
aJ t ¡cl z)z
' oa'aaaaaloaaloo
0 1 00 200 300 400 500Electron energy (eV)
o¡o
0 100 200 300 400 500Electron energy (eV)
Figure 5.18: Ionisation induced fragmentation of (Oz), , (Nz)z and (COz)z as a function of
electron energy.
In the case of the rare gas dimers, all of which are held together by van der Waals
forces, it is possible to conjecture that the fragmentation behaviour of the gases may be
similar. However, even though the gases used in this section are quite different, figure 5.18
shows that the general character of the fragmentation curves is similar. All the gases show a
pronounced maximum and a decrease towards high electron energy.
To ensure positive fragmentation probabilities were obtained, all of the curves were
arbitrarily normalised with f = 0.5 at 100eV.
10t

5.4 The Fragmentation Probability Maximum
The similarity of the observed energy dependence of the fragmentation probability in
the case of a number of dimers suggests that this dependence may be a general feature of the
fragmentation process. Further evidence for a maximum in the fragmentation probability
cufves of other gases is presented and its implications are discussed.
5.4.1 Further Evidence for a Maximum Fragmentation Probability
An examination of the literature provides other examples of a maximum fragmentation
probability. The example most relevant to the argon fragmentation results of the previous
sections is provided by the work of Kohl et al (1967) who measured the cross-section for
electron impact fragmentation of the bismuth dimer. Here the relative concentrations of the
molecular species of bismuth were measured with a mass spectrometer. In their case the dimer
intensity was of a similar magnitude to the monomer while larger clusters were approximately
two orders smaller. Kohl et al determined the relative cross-sections for the following
channels, shown in figure 5.19,
Bi+e+Bi*+2e and
Biz+e+Bf+Bi+2e
The interesting result in figure 5.19 is that the fragmentation channel reaches a
maximum in the vicinity of 30eV and then decreases for larger electron energies. In contrast,
the relative ionisation cross-section for the monomer is almost constânt as the electron energy
is increased from 30 to 80eV. This means that the decrease observed in the fragmentation
channel is not due to an overall decrease in the ionisation cross-section, but rather it is due to
a decrease in the probability of ionisation induced fragmentation as the electron energy is
incrcased. Kohl et a18 determined that the probability that electron impact ionisation will lead
to fi'agmentation of Biz is 0.6 at 60eV.
8 Work on the fragmentåtion of bismuth clusters has been continued by, amongst othets, V/alstedt and Bell(1987). It is interesting to note that they have not commented on the high energy dependence of the ionisation
induced fragmentation, rather Walstedt and Bell (1987) invesúgated the energy thresholds for the
fragmentation of clusters larger than 20 atoms.193

20
16
12
0
trtrtrdf
aao
otrtr
a O¡
trtro tr Bi
aa
+ e ---t Bi++ Bi + 2e2
tr
tr
tr
tr
I
o
.=U'
o)
.=co
oI
ota¡o
o.otofa
aa
20 30 40 50
Electron energy (eV)
Bi + e-> Bi++ 2e
60 70
t4 IE
atr
100
Fi-eure 5.19: Relative cross-sections for the formation of Bi+ ions by ionisation of Bi and
through the dissociative ionisation of Biz (after Kohl et al (1967)).
A second example of a maximum fragmentation probability is provided by Völpel et al
(1993) who measured the absolute cross-section of the electron impact ionization of Coo* as a
function of electron energy. They show data for the fragmentation channel Coo* -) Cso*
without further ionisation, and the channel Cuo* + Cso2* wittr further ionisation. In each case
the cross-section goes through a pronounced maximum. In the first case the maximum is
observed near 35eV and in the second case near 60eV. These maxima and the accompanying
decrease in the fragmentation for higher energies are shown in figure 5.20.
As for the previous section the ionisation cross-section for the fragment¿tion channels
decrease at a much faster rate than the corresponding total ionisation cross-soction.
194

C\¡
E(J(o
Io
Co(J(¡)U'
¡anØoC)
co.F(ú(JoU>
.9.ô
10
0
A A^AA
A
A
aIl¡
aoa
A¡I^
c6o* - cso
A
c *--t c 2+60 56
ao
+
aO
400 500
A
A6
o
a
a4
2
a
A
aA
.A
é
0 100 200 300Electron Energy (eV)
Figure 5.20: Energy dependence of the fragmentation channels Coo* + e -) Cso* +.. and
Cuo* + e -) Cse+ + ... (after Völpel et al (1993))e.
An analysis of the work of Hoareau et al (1988) on the fragmentation of iead clusters
also suggests that the ionisaúon induced fragmentation probability passes through a
maximum. However their data are not sufficient to allow a definitive conclusion to be drawn.
A number of studies have been undertaken on the dissociation of molecules other than
clusters. The majority of these studies involve measuring the partiat ionisation cross-sections
for electronic transitions leading to fragmentation. While two examples will be presented in
the following section it is worth mentioning here a particular result with Nz. Winters (1965)
has investigated the adsorption of energetic Nz* ions on nickel and molybdenum surfaces and
postulated that the mechanism causing adsorption is dissociation of N2* upon collision with
the surface, and the subsequent adsorption of the resulting atomic nitrogen. Winters was able
to deduce the total dissociation cross-section for Nz âs â function of electron energy from
measurements of the adsorption rate in the absence of ionic absorption. He found that the
total absolute dissociation cross-section has a maximum at an electron energy of about 90eV
and decreases monotonically at larger energies, see figure 5.2I. By comparison to the cross-
sections for dissociative ionisation, measured by Rapp et al (1965), Winters estimated that
dissociative ionisation accounted for about one third of the dissociative events over much of
the energy range.
t95

2.5
E 2.0
N2
ôT
(o
o
.9o(t)aØØo()c.9.gooØ.9o
a
5
0
05
00
050 100 150 200Electron Energy (eV)
250 300
Figure 5.21: Total dissociation cross-section of Nz as a function of electron energy.
(afær Winters (1965))
The results of Winters (1965) differ from the previous examples, not only because
they refer to a molecule (rather than a cluster), but also because they are dominaæd by non-
ionising transitions. As mentioned in chapter 2, the cross-section for all excitations, including
the transitions relevant to the dissociation experiments of Winters (1965), will fall off at high
electron energy. This is in contrast to the rare gas dimer fragmentation results of section 5.3
where all transitions coffespond to ionisation, and a change in fragmentation reflects a drop in
the probability of a repulsive transition relative to that for a bound ftansition leading to a
stable ion.
A distinction needs to be made between the relative behaviour of individual channels
as a function of electron energy, ie dissociative ionisation to non-dissociative ionisation, and
the overall nature of the electron - molecule scattering process with its high energy fall off.
e The byproducts of the dissociation channels were not listed by Völpel et al (1993)196

5.4.2 A Possible Implication of the Maximum Fragmentation Probability
The character of the energy dependence of the rare gas dimer fragmentation
probability is reminiscent of the variation with electron energy of the cross-section for
ionisation. As was shown in section 2.4.3, this can be approximated in the high energy limit by
the function E-llog(E).
If this, or a similar approximation, was found to be valid for the fragmentation
probability, then the dimer concentration in molecular beams could be determined with much
less uncertainty due to fragmentation, by carrying out the measurements at high electron
energies.
A numerical example will illustrate the procedure. Let us assume the E-lLog(E)
approximation to hold with suffrcient accuracy from energy E1 at the maximum of the
fragmentation curve, where the fragmentation f (Er) = Í . At an energy E2, much higher than
Er, the fragmentation probability will be equal to
5.27
Seeing that /, can never be greater than 1, a maximum value for /, is obtained when
/, is taken as unity, which, for E1=lQQeV and Ez=2OkeV results ín f , 30.022.
That is, with my assumption, the error due to fragmentation could not be greater than -2Vo.
At these high energies the ionisation cross-sections would have decreased by a similar
amount. But in practice the detector will usually have enough reserve sensitivity to cope with
this. In addition, at high electron energy the beam cuffent can be increased by orders of
magnitude without encountering space charge difficulties, so the decrease in ionisation cross-
section could be compensated for.
Whilst the assumed rate of decrease with electron energy is unlikely to be a general
feature of the fragmentation process, especially in light of the discussion in the next section,
the above discussion highlights the need for further experiments at high energies.
Unfortunately, operation at 20KeV would need extensive modification of the existing
apparatus, so an examination of the higher energy fragmentation dependence will be left to a
future investigation.
f, = fr. Los(E, - Er) l= f,. Log(E,) +
197

5,4.3 Discussion of Ionisation Induced Fragmentation
The observed maximum in the rare gas dimer fragmentation probability curve has not
been reported previously. In contrast, the only information available in the literature suggested
that the fragmentation probability is independent of electron energy for energies greater than
60eV (Helm et al (1979)). This section discusses the meaning of a maximum fragmentation
probability. To simplify matters somewhat the discussion is limited to the fragmentation of the
rare gas dimers.
Electroníc States of the Rare Gas Dimer lons
Before any comments can be made on the fragmentation probability we must look at
the transitions that may take place when a rare gas dimer is ionised. For this a knowledge of
the potential energy curves for the respective electronic staæs is lequired. A number of
theoretical studies of the shape of the rare gas dimer potentials have been undertaken. In
particular Stevens et aI (1977) and Wadt (1980,1981) have calculated the potential energy
curves for Nez*, Ar2*, Kr2* and Xez* and have, in each case, determined the theoretical
transition moments for transitions from the ground ionic states to upper repulsive ionic st¿tes
The potential energy curves for Arz* are shown in figure 5.22 where the effects of spin orbit
coupling have been omittedto.
6
5
4
Ar+
2
2 IIu
,n
2.4 2.8 3.2 o 3.6
lnter-n uclear D istance (A)
2 +xs
3
2
(¡)
>\g)(¡)L
LU
+2 xu
0
2.0 1 4.0
Figwe 5.22: Potential energy curves of Arz* (after Stevens et al (1977))8
ro More detailed calculations of these curves including spin orbit effects are given by Stevens et al (1977) and
Wadt (1980). The effect of the spin orbit coupling is to slightly mix the X and lI states which results in each
of the lI states splitting into two separate states, thus leading to a total of 6 electronic ståtes.
198

Here the ground ionic state \*exhibits an attractive potential, with a binding energy
of about l.ZeY at the equilibrium interatomic separation of 2.464,. The other three electronic
states lie above the 2å* ground state in the order'[r, 'llu and 2Ir*. The equilibrium radius for
the weakly bound Ar2 ground state 1Ir* is indicated by the arrow on the abscissa.
For the singly charged dimer ions of the rare gases Ne, Ar, Kr and Xe the shape and
structure of the potential energy curves are very similar, and as Helm et at (1979) point out,
generalised remarks can be made about raro gâs dimer ffansitions. The implication of the
poæntial energy curyes is that ionisation transitions will occur between the weakly bound
(-10meV) dimer ground state 1Ir* to one of a number of ionic states (see figure 5.22), some
of which will be repulsive in nature, thus leading to fragmentation.
Photod.íssocíatínn
In discussing ionisation induced fragmentation on the basis of these potential energy
curves it is convenient to discus f,rrst, the simpler case of photodissociation (see Lee et al
(1978), Lee and Smith (1979) and Rose et al (1979)). Dissociative dipole transitions are
allowed from the ionic ground 2À* state to the repulsive 2lI, and 2Ir* stateslt. The
arrangement of the potential energy curves of figure 5.22 shows that these transitions should
be broad-band continua, widely separated in wavelength. The curves of figures 5.23 show this
for the case of photodissociation of Arz*.
The curves show that for each repulsive state (ie a dissociative transition), the cross-
section goes through a mæcimum and decreases at higher photon energy. Unlike the maximum
in the electron impact fragmentation data these curves can be more easily understood.
Collisions between photons and clusters are different in character from those between
electrons and clusters (von Engel (1965)). A photon ionises the cluster with a maximum
probability at a ceftain critical wavelength or energy which is of order 0.1 to leV above the
ionisation threshold. By contrast an electron of that energy has nearly zero probability of
transferring energy ineversibly to the cluster and requires perhaps 5 to 10 times the ionisation
energy to reach the maximum ionisation probability. The general reason (von Engel (1965)) is
that after an electron collision there are three bodies, ie the ion and two electrons, to carry
away any excess energy and momentum, whereas after a photon collision there are only two
bodies, ie ion and electron, and hence more stringent conditions apply.
11 The repulsive state 2llo* is not optically accessible from the ground ionic state 2Eo* and as expected, a
negligible transition probability is detected. ßg

030.6
0,5
0.1
0.0
Ar ++
22Ar
o
C
=oo
oo
Nco 0.2
@
0.0
tsvens et al (1 977)
Lee et al (1 978)
500 550 600 650 700 750 800 850 900 950
Wavelength (nm)
04
03
NEo
@
o
co'=oo
oO
Slevens €t al (1 977)
' Lee and Smith (1 979)
0
200 250 300 350 400
Wavelength (nm)450 500
(a) 0)Figure 5.23: Ar2* photodissociation cross-sections for the transitions:
(a) 2ro*+v l 2lls (b)'ä*+v + 2>r*
(Compiled from the data of Lee and Smith (1919), Lee et al (1978) and Stevens et al (1971))
With this in mind a significant number of transitions will only occur if the photon
energy is less than -leV greater than the difference between the two levels. Further still the
transition probability will be negligible unless the Franck-Condon overlap is large. The net
effect of increasing the photon energy is to successively '-ap' out the transition probability
for each electronic state. The fact that there will be only a small number of vibrational levels
that will correspond to a significant transition probability for each electronic state (either
repulsive or attractive) means that transitions to each electronic state will go through a
maximum as the photon energy is increased. Hence the fragmentation curves of figure 5.23
exhibit a maximum.
Elpctron Impact Processes
In the case of electron bombardment, once the electron energy is greater than the
energy required to access the highest electronic state, then as the electron energy is increased
transitions to all electronic states remain possible as distinct from the photon case, where only
one transition will generally occur. It is generally assumed that the relative probability of
transitions through the various available channels is independent ofelectron energy, once the
energy exceeds a threshold of about 50eV. The assumption becomes untenable when both
allowed and forbidden processes are present. Since the former vary in ttre high energy limit as
E-ll.og E and the latter as E-1. As we will see below this is of crucial importance for the
interpretation of my expedmental results.
200

Before continuing the discussion of dimer fragmentation it is worth considering the
dissociation of small, more tightly bound molecules, a process which in principle should be
similar, and for which experimental evidence exists showing that the relative transition
probability does vary with electron energy.
For example Rapp et al (1965) have measured cross-sections for dissociative
ionisation, from threshold up to lKeV. They investigated nine gases (Hz,Dz, CO, NO, Nz,
Oz, COz, NzO and CH¿) by collecting those ions reaching an ion collector afær passing
through a0.25Y letarding potential. The æchnique rests on the assumption that transitions to
repulsive electronic states will produce ions with kinetic energies greater than -0.25V, so that
the employment of a0.25Y potential barrier is a means to separate out the dissociative
ionisation component.
The results of Rapp et al (1965) for the gases Nz, Oz and COz are shown in frgure
5.24, where the ordinate is the fraction of total ionisation corresponding to ions with kinetic
energy >0.25V.
From O
40
30
20
10
c.9(d.9,co(úoFo-oo\
(t)É.oco)Éo)CJ
LL
2
From CO2
From N2
0
10 100 1000Electron E nergy (eV)
Figure 5.24: Fragment ion currents as a fraction of the total ion cuffent versus electron
energy (after Rapp et al (1965)).
The curves show that dissociative ionisation reaches a maximum, relative to the total
ionisation cross-section, in the vicinity of 2ü)eV before decreasing at higher electron energies
On the assumption that ions with significant kinetic energy arise from repulsive electronic
transitions, these results indicate that the relative probability of dissociative transitions
decreases with increasing electron energy. Furthermorc, it is possible that the curves tend
201

towards asymptotic values at high energy and that these values depend on the molecule
species.
These results are analogous to my results with rare gas clusters and they suggest that
transitions with different energy dependence are involved.
Similarly, Orient and Srivastava (1985a,1985b,1987) have determined the dissociation
cross-sections for electron impact ionisation of HzO, COz, CO, CII¿ and NH3. Figure 5.25
shows the cross-sections for the following dissociative channels:
(a) HzO+e+HO*+H+2e
(b) COr+e+CO+O+2e
(c) CO+e +C*+O+Ze or
O*+C+2e
In the figure I have defined the relative fragmentation probability as the dissociation cross-
section(s) divided by the corresponding total ionisation cross-section.
0.4
Hz o+e-+HO++2e
+ e -fCO++ ze (x6)
03=-o(õ-ooo-Co
.(d(JoU).9ô(t)
(dc)É.
0.2
0.1
co
CO + e-)C++ 2e
-)O++ 2e
1 00 200 300Electron Energy (eV)
0.0
0 400
Fi-qure 5.25: Relative dissociation probability as a function of electron energy
(Compiled from the data of Orient and Srivastava (1987))
As before the figure shows that after passing through a maximum, the probability for a
dissociative transitions decrcases with electron ener-qy. Particularly in the case of HzO this
202

decrease is initially quite pronounced, but in other cases it is less so. Again the relative
transition probability changes with electron energy, such that the ionisation cross-section for
transitions to repulsive electronic states decreases more rapidly than that to bound states.
The overall shape of the COz curve is similar to that of Rapp et at (1965), shown in
figure 5.24,however the position of the maximum is lower by about 100eV in the case of the
Orient and Srivast¿va (1987) data. The measurements by Krishnakumar and Srivastava (1990)
of the ionisation cross-section of Nz provide additional evidence that the results of Rapp et al
(1965) are qualitatively correct. This is shown in figure 5.26 where I have divided the
dissociative channels by the total ionisation cross-sectionl2. The curve is similar to that of
Rapp et al (1965), in that, the dissociative component rises to a maximum in the vicinity of
200eV before decreasing gradually at higher energies.
0.3
0.2 o¡o¡aa
0.1
0.0
200 400 600Electron energy (eV)
800
Fi_eure 5.26: Ratio R of the dissociative to the total ionisation cross-sections for N2, as a
function of electron energy (compiled from the results of Krishnakumar and Srivastava
(1eeO)).
12 As noted by Krishnakumar and Srivastava (1990) the dissociative channel includes a small contributionfrom N22* which is detected at the same mass line as N*. Using the results of Märk (1975) for N22*,
Krishnakumar and Srivastava (1990) conclude that the dissociative channel N* will have, at most a 107o
contribution from N22*, and as such, the N22* signal will only slightly effect the shape of the N* cross-section.203
oa
a
a
a a-(úo:É,(¡)
E(>)(5
É.
oo
o
a
0
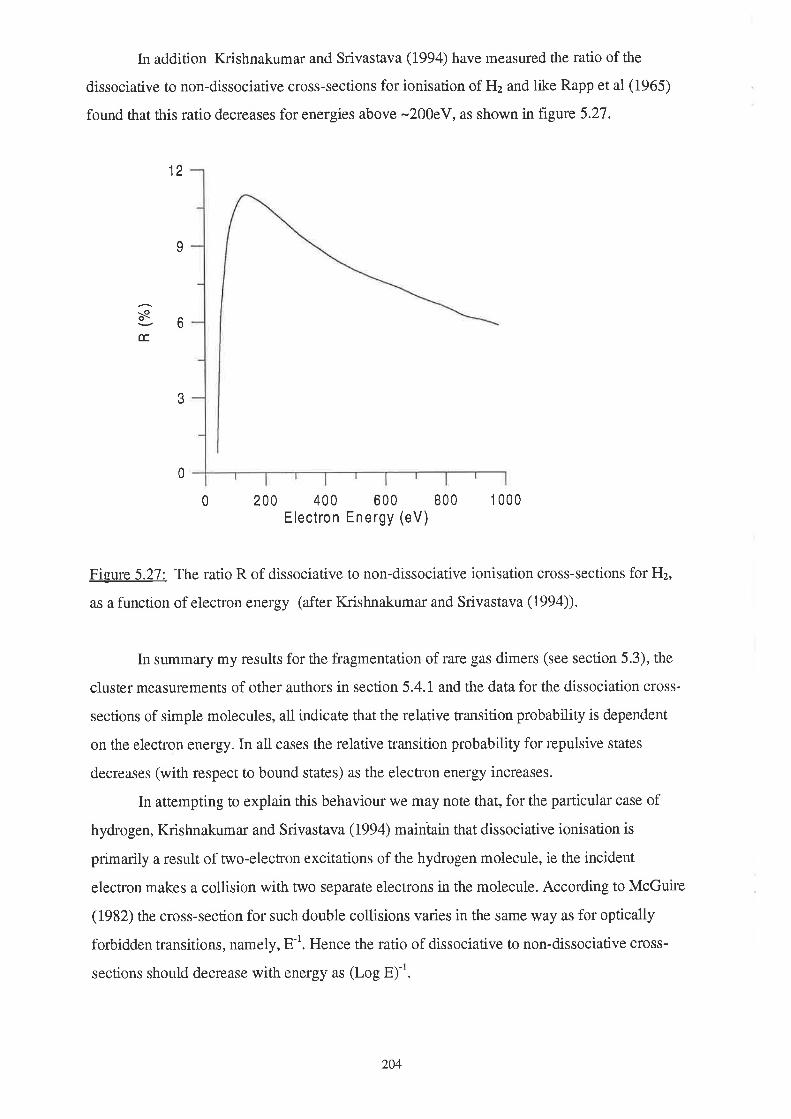
In addition Krishnakumar and Srivastava (1994) have measured the ratio of the
dissociative to non-dissociative cross-sections for ionisation of Hz and like Rapp et al (1965)
found that this ratio decreases for energies above -200eV, as shown nfigwe 5.27.
12
0
200 400 600 800Electron Energy (eV)
1 000
Figure 5.27: The ratio R of dissociative to non-dissociative ionisation cross-sections for H2,
as a function of electron energy (after Krishnakumar and Srivastava (1994)).
In summary my results for the fragmentation of rare gas dimers (see section 5.3), the
cluster measurements of other authors in section 5.4.1 and the data for the dissociation cross-
sections of simple molecules, all indicate that the relative transition probability is dependent
on the electron energy. In all cases the relative transition probability for repulsive states
decreases (with respect to bound states) as the electron energy increases.
In attempting to explain this behaviour we may note that, for the particular case of
hydrogen, Krishnakumar and Srivastava (1994) mainiain that dissociative ionisation is
primarily a result of nvo-electron excitations of the hydrogen molecule, ie the incident
electron makes a collision with two separate electrons in the molecule. According to McGuire
(1982) the cross-section for such double collisions varies in the same \ryay as for optically
forbidden transitions, namely, E-l. Hence the ratio of dissociative to non-dissociative cross-
sections should decrease with energy as (Log E)-1.
I
6èe
É.
3
0
204

Similar approaches have been used to explain the cross-section ratio for double to
single ionisation of helium by impact of electrons, protons and alpha particles (see Charlton et
al(1988), Edwards et al(1990) and McGuire (1982)).
The experiments with H2 suggests that the observed decrease in the rare gas dimer
fragmentation probability is similarly due to differences in the energy dependence of the
various channels involved in the process, such as double collisions events and optically
forbidden transitions.
With this in mind I have modelled the influenced various combinations of allowed and
more rapidly decreasing repulsive transitions (optically forbidden or double collisions leading
to dissociaive single ionisation) will have on the fragmentation probability of rare gas dimers,
as determined by the method of normalising the relative ionisation cross-sections for the
monomer and the dimer (see section 5.3). Fragmentation is assumed to result from transitions
to a number of repulsive ståtes, sorne fraction of which are deemed to be forbidden.
0.5Arr(f=0.42 at 200eV)
Fraction of repulsive transitionsthat are optically forbidden:
0%
40%
0o/o
0.2
lo
4
03
0=-o(õ-ooo-c.o(õ
co)Eo)(õ
LL
100 1 00000
Figure 5.28: The calculated fragmentation probability as a function of the electron energy for
several combinations of optically allowed and optically forbidden transitions.
Figure 5.28 shows the calculated fragmentation probability for Arz as a function of
electron energy with the percentage of dissociative transitions that are forbidden as a
parameter. The curves have been normatsed at 200eV, an energy at which I have arbitrarily
1 000 1 0000Electron energy (eV)
20s

chosen for the commencement of the E-llogE and E-r approximations to holdl3. The
fragmentation / =0.42 at 200eV was taken from figure 5.17 and each of the calculated curves
corresponds to a different fraction of optically forbidden transitions. The figure shows that
when all repulsive transitions are optically allowed no change in the fragmentation probability
is seen, and that as the fraction of optically forbidden transitions increases, the fragmentation
decreases with increasing electron energy, at a faster rate.
The figure shows that it is possible to find a mixture of states for which the
fragmentation probability shows an energy dependence similar to that observed. However,
this analysis has ignored factors such as metastable decay, dissociation occurring from the
continuum of the ground state, etc and is essentially of heuristic value.
The fragmentation probability and its energy dependence will depend on the particular
molecular species. It is likely that the fragmentation probability will show two general
features, namely, a maximum in the vicinity of 100eV followed by a decrease to an asymptotic
value at high energy. The magnitude of the decrease will be determined by the number of
transitions that decrease at high energy faster than the usual E-tLogE dependence.
Further work at high electron energies is required to see whether the fragmentation
probability continues to decrease with increasing electron energy or if an asymptotic value is
approached. Furthermore it is important to see how this high energy dependence of the
fragmentation changes as the cluster species changes. For example the neon dimer
fragmentation probability shows a significantly smaller dependence on the electron energy
than the other rare gases.
t3 V/hile this energy is below the the range over which the approximation is generally accepted to hold, ie inthe KeV range, it allows a general t¡end to be observed in a region where the fragmentaion probability forargon was previously measured.
206

5.5 Conclusion
The Lee and Fenn assumption, that the fragmented dimer is not detected as an
additional monomer current, ie p = 0, is not justifred. The inclusion of this additional
monomer current reduces the usefulness of the method as the ratio of dimer to monomer
ionisation cross-sectioÍt, 6zt, tends to 2.In a discrimination free system, and in the absence of
metastable decay, the Lee and Fenn method provides a check on whether o21 is equal to 2. If
ozr is not equal to 2, the method is capable of providing additional information on the dimer
fragmentation. However, the inclusion of two unlcrown parameters, the fragmentation
probability and the ratio of the ionisation cross-sections, requires the fragmentation
probability to be calibrated at a known value. When this is done, reliable measurements of the
fragmentation probability can be made as a function of electron energy. Similarly, the value of
ozr cân be determined.
These experiments have shown that with increasing electron energy the dimer
fragmentation probability passes through a maximum in the vicinity of 100eV afær which it
decreases towards higher energies. The position of the maximum and the accompanying
decrease at higher energies is dependent on the gas, in much the same way as the monomer
ionisation cross-section.
The agreement between the ratio of the gas kinetic cross-sections (section 4.7) and the
ratio of the ionisation cross-sections, for the case of argon, suggests that the ionisation event
is affected by changes in the size of the molecule, similar to the interaction of the dimer to
monomer in the scattering experiments.
207

6 Summary and Future Work
6.1 Summary
The work described in this thesis represents the first stage of the Ultraviolet and
Molecular Physics Group's research into clusters, that is, the construction of apparatus for
the generation and detection of small van der V/aals clusters, and a study of the fragmentation
of rare gas dimers by electron impact. The second stage of the research programme will
include a tunable laser source for photoionisation studies of clusters.
Design, construction and testing of the equipment described in chapters 3 and 4
accounted for the majority of the my time while undertaking the wolk described in this thesis.
In particular the construction of the molecular beam and interaction chambers, together with
their accompanying vacuum systems required a large amount of time.
The development and testing of the electron gun, ion optics and mass spectrometer, to
a stage where they could be confidently employed with in the Modified Lee and Fenn method
proved the most difficult task of this work. For example, the Flag Effect, described in chapær
4 (and Appendix C) lead to the realisation that surface charges on stainless steel electrodes
can cause difhculties when working with ion sources. The influence of charge accumulation
on the surface of stainless steel does not appear to have been previously reported. The
significance of the effect will depend on the ion energy, and it will be particularly severe when
thermal ions are involved. At the other extreme of high energy it will be negligible, but in an
intermediate energy range it may well lead to unsuspected systematic enor.
To obtain stable ion current measurements, so that fragmentation runs could be
conducted over a long time, the formation of carbonaceous layers had to be minimised. This
was achieved by use of perfluoropolyether diffusion pump fluid. A review of the liærature
indicated that the use of Fomblin 18/8 in standard diffusion pumps could lead to differences in
performance and some instabilities, see Holland et al (1972) or Laurenson et al (1979). To
208

test whether Fomblin 18i8 coutd be incorporated into my pumping system, where it was
advantageous to operatÕ the diffusion pump in conjunction with a large ballast volume, the
performance of Fomblin 18/8 was further investigated.
The success of the fragmentation work is due to the excellent performance of tho
apparatus, which is best illustrated by the high quality of the relative ionisation cross-section
results of chapters 4 and 5. The consistency of these results allowed the relative
fragmentation probabilities to be determined with confidence. A number of researchers sffess
that, because of drift in their apparatus ionisation cross-sections or fragmentation data had to
be taken within a few minuûes. This was not important in my work, where, in general
repeatable ion current readings could be taken half an hour apart.
The development of the cluster fragmentation apparatus highlighted several factors
that should be considered when experiments are conducted under different source conditions.
Firstly, this work has highlighted the fact that skimmer interaction can falsify measurements of
the Lee and Fenn type. It also shows the importance of operating at source parameters and
nozzle-skimmer distances that minimise inærnal skimmer interaction. In addition, differences
in the radiat density profiles of the monomer and dimer can lead to a different overall
sensitivity in the deæction of monomers and dimers. Ultimately these differences are
attributable to collision induced dimer fragmentation near the skimmer walls.
One of the most surprising observations of this work, which has not been reported
previously, was that the molecular beam divergence depends on the sourco pressure. This
could introduce severe error into molecular beam experiments and may account for some of
the diff,rculties of the Lee and Fenn measurements. The ability to sample molecular beams
reliably, depends critically on the geometry of the detector and on the dependence of the
molecular beam divergence on the source parameters.
In the present work fragmentation data were collected over a period of 18 months
( November 1993 to July 1995). During this time the Lee and Fenn Method was investigated
and the method described in section 5.2 developed after much experimentation. Much of the
earlier data was rejected due to a difficulty in interpreting the monomer difference, ÂI.oo, as a
measure of the neutral dimer number density. However these experiments show that the
results of Lee and Fenn lead to an overestimate of the neutral dimer number density. Similarly,
this work supports Gentry's (1982) critique of the Lee and Fenn method and the consequent
limitations placed on the usefulness of their approach.
209

This thesis has described experiments for studying ionisation induced fragmentation of
rare gas dimers as a function of electron energy, and reports for the frrst time the existence of
a maximum fragmentation probability. For all the dimers studied, such a maximum was found,
with the fragmentation probability decreasing monotonically for electron energies greater
than -100eV, pointing to this as a possible general feature of the fragmentation process.
The agreement between the fragmentation results for Arz using the Modified Lee and
Fenn Method and those found via the ionisation cross-sections, provides confidence in the
operation of the equipment and the method used to analyse the data. The use of the data of
Buck and Meyer to calibraæ ttre fragmentation scale has allowed absoluûe fragmentation
probabilities to be determined for Arz for electron energies from 20 to 500eV. For other
dimers, for which Buck and Meyer do not provide data, only the relative fragmentation
probability has been obtained as a function of electron energy.
The ratio of the gas kinetic cross-sections for argon, measured in this work, are in
good agreement with the results of van Lumig and Reuss(1978). It is interesting to note that
these ratios are very close to the ratio of the ionisation cross-sections, determined with help of
the data of Buck and Meyer.
210

6.2 Limitations of this Work
The fragmentation studies described in this thesis are limited to the study of dimers.
This limitation stems from the inability of the supersonic expansion to produce clusters of one
size only (Dehmer and Pratt (1982)). If the molecular beam could be restricted to clusters of
size n, it would be a simple matter of measuring the fragment¿tion probabilities for each of the
available channels, n + m, by measuring the ratio of the ion current to the total ion cuffent
for each channel.
Selection of neutral clusters of known size is possible with the crossed molecular beam
technique of Buck and Meyer (1984). However this requires very considerable resources. The
fact that two molecular beams are required means that two high capacity pumping aggregates
are needed. Moreover the apparatus is complicated because it entails aligning two molecular
beams and requires that the mass spectrometer, electron gun and ion optics be capable of
rotating through a known angle.
The Modifred Lee and Fenn method has the advantage of reduced cost and
complexity, but is unable to select neutral dimers. As a result one is left with two unknown
paramsters, namely the fragmentation, / and the ratio of the ionisation cross-sectiorls, ozr.
Consequently, to obtain the fragmentation probability f we need to know the ratio of the
ionisation cross-sectiorls ozr.
The method can be employed to investigate dimer fragmentation because there exists
a range of source parameters in which the molecular beam contains dimers (and monomers),
but no larger clusters. Any attempt to extended is use beyond the dimer is made difficult by
the small range of stagnation pressures over which the beam contains only monomer, dimer
and trimer.
2tr

6.3 Future Work
As indicaæd in the first chapter, the next stage of the research programme will allow
photoionisation experiments to be conducæd, and facilitaæ a direct comparison of cluster
fragmentation using electron impact and photoionisation sources. Furthermore, a time of
flight mass spectrometer will permit metastable decay to be investigated more fully.
In relation to the fragmentation experiments described in this thesis, the next step is
the construction of a high energy electron gun. It is proposed that a 20KeV electron gun be
employed to investigate the dimer fragmentation at high energies, in particular, to see if the
fragmentation probability continues to decrease monotonically with electron energy for all the
rare gas dimers. If this is the case, it is conceivable that the dimer fragmentation will become
very small. On the other hand it may also be that once the fragmentation channels with a
strong energy dependence have become ineffective, the fragmentation probability will
asymptotically approach a finite value.
Further work should be conducted to determine whether the fact that the ratio of the
gas kinetic cross-section for monomers and dimers is a good approximation to the ratio of the
ionisation cross-sections, ¿ts established for argon in chapter 5, is a generally applicable rule.
Should this be confirmed, dimer fragmentation could generally be measured without going to
the complexity of the crossed molecular beam arrangement. Similarly the importance of
accurately determining the degree to which the ratio of the dimer to monomer ionisation
cross-section is independent of electron energy can not be understated.
212

Appendix A

E H Hirsch and T J McKay. (1992) A comparison of perfluoropolyether and silicone
diffusion pump fluids
Vacuum, v. 43 (4), pp. 301-304, 1992
NOTE: This publication is included in the print copy of the thesis
held in the University of Adelaide Library.
It is also available online to authorised users at:
http://dx.doi.org/10.1016/0042-207X(92)90160-X

Appendix B

E H Hirsch and T J McKay. (1992) Emission and re-absorption of diffusion pump
fluid breakdown products.
Vacuum, v. 44 (1), pp. 47-50, 1993
NOTE: This publication is included in the print copy of the thesis
held in the University of Adelaide Library.
It is also available online to authorised users at:
http://dx.doi.org/10.1016/0042-207X(93)90011-X

Appendix C

Surface Charges on Stainless Steel Electrodes .
E.H. Hirsch and T.J. McKay , Department of Physics and Mathematical Physics, University ofAdelaide , South Australia.
Abstract: Experiments show that charge can accumulate on the passivating surface layer of stainlesssteel electrodes , causing changes in the ion optical performance of apparatus.Details ofthe effect are discussed.
1. Introduction.In this paper we report some observations of charge accumulation on electrode surfaces caused by theadsorption of electrons and positive ions. These observations were made in the course of work on Argonclusters using the apparatus shown schematically in figure (1) A molecular beanq formed by thesupersonic expansion of Argon into a vacuum, passed through a skimmer into a chamber at a pressure
of about 4xl0 - 6 Torr. Here it traversed an ionisation box at ground potential, where it was intersectedby a beam of 40 e.V. electrons. The positive ions formed entered for mass analysis through a system ofelectrostatic lenses into a magnetic field sector (not shown in the figure ) . It was desirable for the clusterwork to keep the space potential in the interaction region of the box as constant as possible . Thereforeno extraction potential was applied ; the ions from the molecular beam moved towa¡ds the exit undertheir own momentum, and the two apertures at the exit end of the box were both placed at groundpotential to act as a screen against the ion lens potentials ,
The molecula¡ beam could be intemrpted by placing a metal shutter into its path . It was found thatwhen this shutter was opened , the ion current transmitted through the apparatus took a substantial timeto reach a stable value , and the cause of this long time constant is the subject of the present report .
2. Experiment¡l Observations.
Experiments showed that the ionisation box was the seat of the effect , and to concentrate on this part ofthe apparatus, the ions leaving the box were made to enter a Faraday cage situated l0 mm from the exitaperture and placed at a potential of - 60 Volts ( see figure I ) .
Typical curyes of the change in Faraday cage current with time a¡e shown in figure 2 .In the course of ourexperiments ,which were made on an occasional basis over a period of some months, this change tooktwo distinct forms .In the early stages it was cha¡acterised by a¡ initial rapid increase, followed by aslow asymptotic rise towards a final value Ii,that was closely approached in about l0 minutes (curve a).At a later stage a monotonically decreasing trend towa¡ds I¡ wâs observed , as shown in curve b). Weshall discuss the reason for this change in behaviour in Section 3 below.
With all other experimental parameters well controlled , the only direct consequence of shutter opera-tion could be slight changes in the gas flow pattern within the chamber, leading to a local pressure rise inthe ionisation box , and thus to an increase in ions produced from the background gas. Since the pump-ing time constant everywhere in the system was only a small fraction of a second , a time constant of l0
2
minutes seemed only explicable in terms of a charging -up process that aflected the ion-optical per-
formance.
Chemical or mechanical cleaning of the box ,which in the first place was made of type 304 stainless steel ,
had little effect ,but we discovered that the sluggish current response could be entirely eliminated by
using in its stead materials such as molybdenum, nickel or copper mesh . It therefore seems reasonable
to attribute the slow cunent stabilisation to a gradual accumulation of charge on the passivating layer
covering the stainless steel surface, leading in turn to a slow change in surface potential.
3. Discussion of Charge Accumulation.
To discr¡ss in more detail the build-up of charge on the passivating layer we must remember that bothelectrons and positive ions are present ,and that these will contribute in different ways , depending on
their trajectories in the electric field within the box.
The general nature of this field is indicated by figure 3 , which shows the potential along the æris of the
molecular beam, calculated for zero wall potential . A small negative potential gradiørt of the order of afew milli-Volts / mm prerrails over most of the volume, but it increases monotonically towards the exitaperture . As we shall see below , in this field configuration a large portion of the ions will be accelerated
through the exit aperture into the Faraday cage, but the electrons , with the exception of a small fractionthat escapes through the entrance aperture ,are retained .
Under or¡r pressure conditions most of the electrons in the beam do not undergo gas collisions and do notcontribute to the wall charge , since the unscattered electrons enter a deep trap , at the base of which ahigh positive bias suppresses any back scattering . There are however two additional groups of scatteredelectrons , namely those beam electrons irrvolved in ionisation, and those ejected from the molecule du-ring ionisation I
. In our energy range ( beam energy - 2x ionisation potential ) the scattering of boththese groups cannot as yet be described quantitatively ,but experimentally it is known that both groupsare scattered in broad lobes about the electron beam axis , the ionising electrons being scatteredforwards, and the ejected electrons backwards'.Whilst the scattering is not isotropic , its angulardistribution is fairly wide , and taking into consideration reflection at the wall, electrons are likely toimpinge over the entire wall surface , albeit not at a uniform rate . Moreover , since two scatteredelectrons correspond to each posiúvé ion created ,the net wall charge will be negative.
We have no direct evidence of either the magnitude of the wall potential or of its distribution over thesurface,but since the space potential within the box tends to move with the potential at the boundary , wecEn say that the charging process will not be limited by a retarding potential at the wall . In principle theupper limit would be reached when the space potential has been depressed to a level where the electronbeam energy is reduced to the ionisation threshold , but in practice there are several other limiting factorsoverriding this.
One such limiting factor stems from the fact that dynamic equilibrium of surface coverage is established
after a time equal to the mean residence time r of the adsorbed particles on the surface . This time is
given by 3
r: ro x exp ( W/kT ) (l)

3
where W is the adsorption energy and ro represents the oscillation time of particles in the adsorbed
state, for which the value l0-r3 seconds is usually adopted . Clearly r must at least be equal to our
observed equilibration time of 10 minutes . For this time equation (l) yields an adsorption energy ofabout 0.9 e.V. , a reasonable value for adsorbed charged particles according to de Boe¡ a.
Ultimately the surface potential is limited by the dielectric srength of the passivating layer ,which
typically ónþ sustains à potential difference of the order of I Volt 5 . This layer acts as the dielectric of
th-e..condenier" formed by the metal wall and the surface charge . Details of the layer properties a¡e not
well known u , but if reasorrable values for thickness and dielectric constant are introduced, a surface
potential of the order of I Volt seems plausible for our ionisation conditions. In our calculations ofp-tirt. trajectories further below we therefore assume wall potentials in this range.
both forward and backwards scattered electrons have broad energy spectra" with typical energies in the
range of a few electron Volts @hrhardt et al. loc. cit. ) . These are fa¡ less affected by the weak surface
rtr.tgr fields than the positive ions , whose energJ is about two orders lower , and it is to the ion trajecto-
ries that we must now turn our attention .
Two groups of ions need to be considered ,the first group being that formed from the molecula¡ beam
molecules-.Under our experimental conditions these molecule_s move prior to ionisation with essentially
unidi¡ectional a¡cial speædi corresponding to about 0,059 e.V.7 . They ar^e ionised in the small region ofintersestion of molecular - and .l."tron b.am , and computer simulations of their trajectories shows
that except in the very rare cases where gas collisions occur, all positive ions from this group are
focussed into the Fa¡ad ay cage, without making any contribution to wall charges within the box .
The second ion group is formed,from the Ma¡rwellian background gas . These ions can originate
anywhere along the electron beam . Their pre-ionisation speed is thermal , coresponding to about 0.039
e.V. , and their initial velocity distribution is isotropic. As in the first group ,those with an initial down-
stream component of velocity are found to be focussed into the Faraday cage without wall collisions ;
only those background gas ions with an initiat upstre¿Lm component of velocity can either enter the
Faraday cage or impact on the box wall at locations that depend , for a given point of origin, on the
initial direction of motion and on the wall potential . It is only ions from this last group that can con-
t¡ibute to wall charges and the observed ternporal change in the Faraday cage current .
To illustrate how the trajectory of these ions depends on the wall potential , Figure 4 shows trajectories
in the mid-plane of the box for an ion originating at an arbitrarily selected point P on the left edge of the
electron beam , 8 mm below the molecular beam a:cis , and assuming a launching angle <p of t600 withrespect to the latter . Starting with the wall uniformly at ground potential , this ion initially remains in
the-box, but as the wall potential becomes progressively more negative, its point of impact on the wall
moves , and in this particular case the ion will leave the box and enter the Faraday cage only for wall po-
tentials in the range from - 0 46 to - |.125 Volts ; at more negative potentials it \'/ill remain within the
box.
The potential range in which an ion contributes to the Faraday cage curent in this way depends on both
its initial position and direction of motion . As distinct from the example of figure 4 , there clearly a¡e also
ions with different launching parameters which initially pass into the Faraday cage, but which , with
increasing wall potential will ultimately not reach it , and thus cause a reduction rather than an increase
in the measured current .
The current characteristics of figure 2 represent the resultant contribution from all ions .In some
instances this amounts to an overall increase in current with time (curve a) ) and in others to a decrease
(curve b) ).We attribute this difference in behaviour to changes in the wall potential distribution , caused

4
by uncontrolled changes in surface condition . In a selÊpassivating material such as stainless steel the
pfusivating layer arisãs from reaction of the metal surface with orygen and moisture from the ambient
at*ospneã. According to a model proposed by Okamoto e the layer is gel-like or microcrystalline, and
contains bound water in several forms . Both the amount of water present and its mode of bonding can
change with time .Okamoto was in fact able to show that by slightly warming stainless steel for a short
timeln vacuum , the amount of bound water in the layer could be reduced , and the properties of the layer
altered. We conjecture that prolonged exposure to vacuum at room temperature , such as in our
experiments , could produce comparable effects .These might at least parti.ally be reversed by subse-
quènt re-admission of uir . We believe that changes in surF¿ce condition produced in this v/ay may
account for the two tlpes of current-time characteristics shown in figure 2.
To illustrate how sensitive the ion trajectories ,and through them the current-time characteristics ,can in
some circumstances be to even minute local changes in wall potential , Figure 5 shows two trajectories
for a background gas ion launched from P at q : 1730 . For the first trajectory the wall potential is taken
as -0.460 Votts throughout ; in the second instance the potential is locally raised by 0.003 Volts in the
small region indicated .As a result of this small local change in potential by only 0.7%;o the trajectory is
switctrø from one slope of a potential ridge to the opposing one , causing an ion that in the first case im-
pacted on the upstrearn end olthe box , to exit now into the Faraday cage .In view of this extraorrlinary
sensitivity to small potential changes, and since the actual wall potential distribution is not known, the
ion trajectories we present here can have heuristic value only .
4. Conclusion.In summary, the ultimate cause of the observed slow stabilisation of the Faraday cage current is a local
increase of the background preszure within the ionisation box when the shutter is withdrawn from
molecula¡ beam path , The corresponding rise in the rate of ion production from the background gas
causes the wall charges to adjust slowly to a new equilibrium configuration, and the resulting small
changes in electric fietd in turn afu the fraction of ions reaching the Faraday cage and cause the slow
curent resporu¡e.
By zufficiently increasing the negative potential gradient in the box it is possible to swamp the effect ofttre wall charges and to ensure that , irrespective of the wall potential, practically all ions produced
within the box are at all times withdrawn from it . If for example we relax in our experiments the demand
for very small potentiat gradients in the ionisation region and place the outer exit aperture at '20 Volts ,
the slow response of the meazured current is drastically reduced .
Effects simila¡ to those we have described a¡e not restricted to our particular apparatus , but are liable to
occur in the ion source of any mass spectrometer operated with a sufficiently small extraction potential.
Changes in any parameter affecting the ionisation rate , such as system pressure , electron beam
intensþ and focussing etc .can produce the necessary changes in wall potential. If , as is usually the case ,
there is no molecular beam ,and the ions are formed from a Maxwellian gas , there will be no large ion
component with its initial direction of motion towards the exit aperture . One would then expect the
proportion of ions susceptible to deflection by wall charges to be larger than in our experiments.
The significa¡ce of the effect depends of course on the particle energy . It is particularly severe , and
therefore readily noticed in our c¿lse , where thermal ions are involved . At the other extreme of high
energy it'rÀ/ill be negiligible , but in an intermediate energy range it may well lead to unsuspected
systematic error.

5
In conclusion we would expect the effect to occur also in the absence of a passivating layer, if carbo-
naceous or silicone films are produced on the electrodes by particle bombardment . In our experiments
this factor was insignificant , since the hydrocarbon background in the residual gas \ilas extremely low
through the use of perfluoropolyether as a pumping fluid.
References.
lC.J. Ioachain, )(\lI Int. Conf. The Physics of Elect¡onic and Atomic Collisions, New York,lrlY'
(1e8e)2 H.Ehrha¡dt, K. Jung, G. Knoth and P .Schlemmer ,Z.Phys. D , I ,3, (1986 )3 J.H. de Boer , The Dynamical Character of Adsorption , Ordord Universþ Press, (1953 ), p.30.
4 J.H. de Boer, " Atomic Forces and Adsorption " in Advances in Colloid Science 3, 1, Interscience
Publishers , Irc., New York, (1950 ).5 J.C. Scully , "The Fundamentals of Corrosion " 3rd Ed. Perganron Press, p. I I l, (1990)
6 RW. Cahn, P.tla¿sen, E.J. K¡amer , Ed. "Materials Science and Technology " 3B ,p.291, NCH ,
Weinheim, (1994)
7 Scoles G. Ed. " Atomic and Molecular Bea¡n Methods " 1, P.17 , O.U.P. Odord, (1988)
8 D.A. Dahl, I.E. Delmorte and A.D. þpelhans ,Rw. Sci. Instnrm. 61,607, (1990)
9 G. Okamoto, Corros. Sci. 13, 471,(1973)

electrontrap
shutter
exit aperture
skimmerFanaday cage
molecr¡larbeam
\/
elec{ronbeam
Figure 1.
Experimental anangement (schematic )

a)
-tÞo(i,Ec=
Cots:JooolGoooo(úIL
1.50
1.25
r.00
0.75
0.50
0.25
0.00
0.00 2.00 4.00 6.00
time min.8.00 10.00
Figure 2.
Typical approach of ion current to final value It
For significance of curves a) and b) see text.

oõ
Ecooo-
0.00
{.50
-1.00
-1.50
0.00 10.00 20.00
Distance from enfance aperture mm
Figure 3
Potential on a,ris of molecular beam.
Note: Distance between entrance and exit apertures 30 mm
30.00

.3-0.43 V
entrance exit
-1 .19 P
mm
Figure 4.
lon trajectory for several wall potentials.
ln each case wall potential constant throughout
0.0 v

exitentrance
2
P
el0 mm
Figure 5.
Etrecf of local change in wall potential.
Curve :l : wall potential - 0.460 Volts throughout.Curve 2 : potential in seclion a-b raised to - 0.457 Volts
1

References
Adamson, T. C. and Nicholls, J.A. (1959), J. Aero. Íci.,26, pp 16.
Anderson, J.B. and Fonn, J.B. (1965), Phys. Fluids,8, pp 700
Anderson, S.L., Hirooka T.P., Tiedemann.W., Mahan B.H. and Lee Y.T. (1980 ), J. Chem.
Phys.,73, pp 4779.
Andres, R.P., in Zettlemoyer, A.C. (Ed.), (1968), Nucleation, Dekker, New York, pp 69
Ashkenhas, H. and Sherman, F.S. (1966) , Proceedings of the 4th Syntposittm on Rarefied
Gas Dynamics, 2, pp 784.
Becker, E.W. (1986), Z. Phys. D ,3, pp L
Becker, E.W., Bier, K. and Henkes, W. (1956), Z. Phys.,146, pp 333.
Bentley, G. P. (1961), Nature (London), 190, pp 432.
Bethe (1930), Ann. der Physik,5, pp 325.
Beuhler, R.J., (1987), Phys. Rev. Lett.,58, pp 13.
Beuhler, R. J. and Friedman, L., (1986), Chem. Rev., 86, pp 521.
Bewig, L., Buck. U., Mehlmann, C. and Winter,M. (I992a), Rev. Sci. Instrum. , 63,pp 3936.
Bewig, L., Buck. U., Mehlmann, C. and Winter, M. (1992b), Ber. Bunsenges. Phys. Chem.,
96, pp 1188.
Bewig, L., Buck. U., Mehlmann, C. and'Winter, M. (1993),2. Phys. D,26, pp 5104.
Bewig, L., Buck. U., Mehlmann, C. and Winter, M. (1994), J. Chem. Phys.,100, pp 2765.
Bier, K. and Schmidt, B. (196t),2. Angew. Phys.,13, pp 493.
Bray, I. (1995), J. Phys. 8,28, pp L435.
Born, M. (1926), Z. Phys.,37, pp 863.
Buck, U. and Meyer, H., (1984), Phys. Rev. Lett.,52, pp 109.
Buck, U. and Meyer, H., (1986), J. Chem Phys.,84,pp 4854.
Buck, U. and Meyer, H. (1988), J. Chem. Phys.,88, pp 3028.
Campargue, R. (1984), J. Phys. Chem.,88, pp 4466.

Caporiccio, G., Steenrod, R.4., Laurenson, L. (1978), J Vac Sci Technology, 15, pp 775.
Casero, R. and Soler, J.M. (1991) J. Chem. Phys.,95, pp 2927 .
Castleman, A.W., Jr., Kay,8.D., Hermann, V., Holland, P.M. andMärk, T.D, (1981),
Suf.Íci.,106, pp 179.
Charlton, M., Anderson, L.H., Brun-Nielsen, L., Deutch,8.I., Hvelplund, P., Jacobsen,
F.M., Knudsen, H., Laricchia, G., Poulsen, M.R. and Pedersen, J.O. (1988), J. Phys.
B: At. Mol. Opt. Phys.,2l,ppL545.
Cockroft and Walton (1932), Proceedings of the Royal Society,136' pp 619.
Cooks, R.G., Beynon, J.H., Caprioli, R.M. and Lester, G.R., (1973), Metastable lons,Elsevier, Amsterdam.
Cooper, T.M. and Birge, R.R., (1981), J. Chem. Ph7's.,74,pp 5669.
Darrach, M. and McConkey J.W. (1993),The physics of Electronic and Atomic Collisions,
AIP proceedings,295, pp 81 1.
Dehmer, P.M. and Pratt, S.T., (1982), J. Chem. Phys.,76, pp 843.
Deutsch, H., Leiter, K. and Märk, T.D. (1985), Int. J. Mass Spectrom. Ion Processes,67,pp 191.
Dibeler, V.H. and Reese, R.M (1959), J. Chem. Phys.,3l, pp 282.
Ding, A. and Hesslich, J., (1983) , J. Chem. Phys. Lert.,94, pp 54.
Dittmers, H.J., Schutze,C., Fischer, B. and Schuger, (1972),2. Physk Chem. N. L, 80,
pp 220.
Dorfield, W.G. and Hudson, J.8., (1973), J. Chem. Phys.,59, pp 1253.
Dorman, F.H. and Morrison, J.D. (1961), Canad. J. Phys.,35, pp 575.
Dushman (1962),Scientific Foundations of VacuumTechnique,2ndedition,Wiley.
Echt, O., in Mark, T.D. and Howorka, F. (Eds) (1986), Sympositun on Atomic and Surface
Physics Obertraun Austria, pp 272.
Echt, O. (1988), Electroníc and Atomic Collisions, pp 719.
Echt, O., Sattler, K and Recknagel, E. (1981), Phys . Rev. Lett., 47, pp II2l.
Echt, O., Kreisle, D., Knapp, M. and Recknagel, E., (1984), Chem. Phys. Lett.,108, pp 40.
Echt, O., Cook, M.C. and Castleman,4.W., Jr., (1987), J. Chem. Phys. Lett.,l35,pp229.
Fayet, P., Granzer, F., Hegenbart, G., Moisar', E., Pischel, B. and Woste, L. (1986), Z. Phys.
D,3,pp 299.

Fenn, J.B. and Lee, N. (1982), Rev. Sci. Instrum.,53, pp 1494.
Flannery, M.R., McCann, K.J. and Winter, N.W. (1981), J. Phys. B: Mol. Phys.,14,pp 3789.
Fontijn, A.., Meyer, C.B. and Schifl H.I. (1964), J. Chem. Phys., 40, pp 64.
Fontijn, A. and Rosner, D.E. (1967), J. Chem. Phys., 46, pp 3275.
Frost, A.A. and Pearson, R.G. (1963), Kinetics and Mechanism, JohnWiley & Sons Inc.,New York, pp 69.
Fursa, and Bray, I. (1995), Phys. Rev. A, 52, pp 1279.
Futrell, J.H., Stephan, K. and Märk, T.D. (1982), J. Chem. Phys.,76, pp 5893.
Gentry, W.R. (1982), Rev. Sci. Instntm., 53, pp 1492.
Gentry, W.R. and Giese, C. F. (197 5), Rev. Sci. Inst., 46, pp 104.
Golomb, D., Good, R.E., Bailey, 4.8., Busby, M.R. and Dawbarn, R., J. (1972), Chem.
Phys., 57, pp 3844.
Golomb, D., Good, R.E. and Brown, R.F. (1970), J. Chem. Phys.,52, pp 1545.
Gough, T.E. and Miller, R.E. (1982), J. Chem. Phys. Lett.,87, pp 280.
Greenbach and Miller (1947), Physical Review,72, ppl60.
Greene, F.T, and Milne, T.A. (1963), J. Chem. Phys., 39, pp 3150.pp 4242.
Gspann, J. and Korting, K. (1973), J. Chem. Phys.,59, pp 4726.
Haberland, H. (1985), Surf. Íci.,156, pp 305.
Hagena, O.F. (1981), Surf.,Sci., 106, pp 101.
Hagena, O. F. and Henkes, W. (1960), Z. Naturforsch,lS2, pp 851.
Hagena, O.F. and Henkes, W. (1965), Z. Naturþrsch. Teil A,20, pp 1344.
Hagena, O.F. and Obert, W. (1972), J. Chem. Phys.,56, pp 1793.
Harris, I.4., Kidwell, R.S. and Northby, J.A. (1984), Phys. Rev. Lett., 53, pp 2390.
Harting, E. and Read, F. M. (1916), Electostatic Lenses, Elsevier Scientific Publishing Co.
Hasted, J.B. (1964) , Physics of Atomic Collisions, Butterworths, London.
Helm, H., Sæphen, K. and Märk, T.D. (1979), Phys. Rev. 4.,19, pp 2154.

Henkes, W. (1961), Z. Naturforsch,l6a, pp 842.
Henkes, W. (1962), Z. Naturþrsch. Teil A,17, pp 786.
Herzberg, G. (1967), Molecurlar Spectra and Molecular Structure,3,Yan Nostrand,Princeton, pp 47L
Hoareau, 4., Melinon, P., Cabaud, 8., Rayane, D., Tribollet, B. and Broyer, M. (1988),
Chent. Phys. Lett.,l43,pp 602.Holland, L., Laurenson, L. and Baker, I. (1972), Vacuum,22, pp 315.
Holland, L., Laurenson, L., Hurley, R.E. and Willaims, K (1973). Nuclear Instrument
Methods,3, pp 555.
Jortner, J. (1984), Ber Bunsenges. Phys. Chem.,8E, pp 188.
Kamke, 'W., Kamke, B., Kiefl, H.U. and Hertel, I.V. (1986a), J. Chem. Phys. lætt.,122,pp 356.
Kamke,'W., Kiefl, H.U. and Hertel, I.V. (1986b), J. Chem. Phys.,84, pp 1325
Kantrowitz, A. and Grey, J. (1951), Rev. Sci. Instr.,22, pp 328.
Kim, Y.B., Stephan, K., Mark, E. and Mark, T.D. (1981), J. Chem. Phys.,74,pp 677L.
Kimoto, K. and Nishida, I. (1977), J. Phys. Soc. Jprt.,42, pp 2071.
Klots, C.E. (1982), Radiat. Phys. Chern.,20, pp 51.
Klots, C.E. (1985), J. Chem. Phys.,83, pp 5854.
Kohl, F.J., Uy, O.M. and Carlson, K.D. (1967), J.Chem. Phys., 47, pp 2667 .
Kreisle, D., Echt, O., Knapp, M. and Recknagel, E. (1986a), Phys. Rev. A,33, pp 768.
Kreisle, D., Echt, O., Knapp, M., Recknagel, E., Leiter, K., Märk, T.D., Saenz,J.I. and
Soler, J.M. (1986b), Phys. Rev. Lett.,56, 1551.
Krishnakumar, E. and Srivastava, S.K. (1988), J. Phys B: At. Mol. Opt. Phys.,21, pp 1055.
Krishnakumar, E. and Srivastava, S.K. (1990), J. Phys B: At. MoL Opt. Phys.,23, pp 1'893.
Krishnakumar, E. and Srivastava, S.K. (1994), J. Phys B: At. MoL Opt. Phys., 27, pp L251.
Kroto, H.W., Health, J.R., O'Brien, S.C., Curl, R.F. and Smalley, R.E.(1985), Nature,31.8, pp 152.
Landau, L.D. and Lifshiø, E.M. (1959), Quantu,n Mechanics, Pergamon Press, London.
Laurenson, L., Dennis, N.T.M. and Newton, J. (1979),Vauum,29, pp 433.
Leckenby, R.E. and Robbins, E.J. (1966), Proc. R. Soc. London Ser. 4,291,pp 389.

Leckenby, R.E., Robbins, E.J. and Trevalion, P.A. (1964), Proc. R. Soc. I'ondon Ser. A,
208, pp 409.
Lee, L.C. and Smith, G.P. (1979), Phys. Rev. 4,19, pp 2228.
Lee, L.C., Smith, G.P., Miller, T.P. and Cosby, P.C. (1978), Phys. Rev. A, 17 , PP 2005.
Lee, N. and Fenn, J.B. (1978) , Rev. Sci. Instrutn., 49, pp 1269.
Levy, D.H. (1980a), Ann. Rev. Phys. Chem.,3l, pp 197 .
Levy, D.H. (1980b), in Wooley R.G. (Ed), QuantumDynamics of Molecules, Plenum Press,
New York.
Lord Rayleigh (1882), Philos. w8.,14, pp 185.
Margreiter, D.,'Walder, G., Deutsch, H., Poll, H.U., Winkler, C., Stephan, K. and
Märk, T.D. (1990a),Int. J. Mass Spectrom. Ion Phy.,100, pp 143.
Margreiter, D., Deutsch, H., Schmidt, M. and Märk, T.D. (1990b),
Int. J. Mass Spectrom. Ion. Phy.,100, pp 157.
Märk, T.D. (1975), J. Chem. Phys.,63, pp 373t
Märk, T.D. (1982),Int. J. Mass Spectrom. Ion Phy., 45, pp I25.
Märk, T.D. (1986), Adv. Mass Spectrom., pp 379
Märk, T.D. (1987),Int. J. Mass Spec. Ion Processes.,79, pp l.
Märk, T.D. and Dunn, G.H. (1985), Electron Impact lonisation, New York: Springer
Märk, T.D., Egger, F. and Cheret, M. (1.977), J Chent. Phys., 67, pp 3795.
Märk, T.D. and Castleman,4.W., Jr. (1985), Adv. At. MoI. Phys,20, pp 65.
Märk, T.D. and Scheier, P. (1987a), J. Chem. Phys.,87, pp 1456
Märk, T.D. and Scheier, P. (1987b), J. Chem. Phys. Lett., 137, pp 245.
Märk, T.D., Scheier, P., Leiter, K., Ritter, W., Stephan, K. and Stamatovic, A. (1986),Int.
J. Mass Spectrom. Ion Processes,74, pp 281.
Marmet, P. and Kerwin, L. (1960), Canad. J. Phys,,38, pp 787.
Marmet, P., Bolduc, E. and Quemener , J.I. (197 5), Canad. J. Phys., 53, pp 2438.
Massey, H.S.W. and Burhop, E.H.S (1952), Electronic and lonic Impact Phenomena,
Clarendon Press, Oxford.
McCann, K.J. and Flannery, M.R. (1979), Appl. Phys. Lett.,34, pp 543.

Mildren, R. (1989), Honours thesis,University of Adelaide.
Miller, D. (1988), in Scoles, G.(ed) Atomic and Molecular Beam Methods,l, OxfordUni Press.
Milne, T.A. and Greene, F.T. (1967) , J. Chem. Phys., 47, pp 3668, 3684, 4095.
Milne, T.4., Vandergrift, A.E. and Greene, F.T. (1970), J. Chem. Phys.,52,pp 1552.
Ng, C.Y. (1983), Adv. Chem. Phys.,52,pp 263
Orient, O.J. and Srivastava, S. K. (1985 a), Fourteenth Int. Conf. on the Phys. of Electronicand Atomic Collisions, North Holland, pp 273.
Orient, O.J. and Srivastava, S. K. (1985b), Fourteenth Int. Conf. on the Phys. of Electronicand Atomic Collisions, North Holland, pp 274.
Orient, O.J. and Srivastava, S. K. (1987), J. Phys. B: At Mol. Phys.,20, pp 3923.
Otvos, J.V/. and Stevenson, D. P. (1956), J. Am. Chem. Soc.,7E, pp 546.
Phipps, J.4., Griffirh, D.G. and Scott, J.E., Jr. (1963), Bull. Am. Phys. Soc. 8, pp 550.
Rao, M.V.S. and Srivastava, S.K. (1992), J Phys. B: At. MoI. Opt. Phys.,25, pp 2175.
Rapp, D and Englander-Golden, P. (1965), J. Chem. Phys.,43,pp 1464.
Rapp, D., Englander-Golden, P.,and Briglia D.D. (1965), J. Chem. Phys.,42, pp 4081.
Richards J. (1984), J. Phys. E: Sci. Instrlun.,17, pp 1081.
Rose, T.L., Katayama, D.H., Welsh, J.A. and Paulson, J.F. (1979), J. Chem. Phys.,70,pp 4542.
Sao, E.A. (1959), Jenaer Jahrbuch, 1, pp 115,
Sattler, K., Muhlbach, J., Echt, O., Pfau, P. and Recknagel, E. (1981), Phys. Rev. Lett., 47,
pp 160.
Sattler, K., Muhlbach, J., Pfau, P., and Recknagel, E. (1982), J. Phys. Lett.,87A', pp 418
Scheier, P. and Märk, T.D. (1987a), J.Chent. Phys.,86, pp 3056
Scheier, P. and Märk, T.D. (1987b), J. Chem. Phys. Lett.,136, pp 423.
Scheier, P. and Märk, T.D. (1987c), Int. J. Mass Spectromy.Ion. Proc.,76, Rl1.
Stace, A.J. and Shukla, A.K. (1980), htt, J. Mass Spectrom. Ion Phys.,36, pp ll9.
Stace, A.J. and Shukla, A.K. (1982a), J.Am. Chem. 9oc.,104, pp 5314.
Stace, A.J. and Shukla, A.K. (1982b), J. Chem. Phys. Lett.,85, pp 157.

Stamatovic, A.S. and Märk, T.D. (1991), Rapid comm^s in Mass Spec.,5, pp 51
Stein, G.D. (1979), Phys. Teacher, pp 503.
Stephan, K., Helm, H. and Märk, T.D. (1980), J. Chem. Phys.,73, pp 3763
Stephan, K. and Märk, T.D. (1982 a), J. Chem. Phys. Lett.,87 , pp 226.
Stephan, K. and Märk, T.D. (1982b), ,/. Chem. Phys. Lett.,90, pp 51.
Stephan, K. and Märk, T.D. (1983) Int. J. Mass Spectrom. Ion Phys., 47, pp I95.
Stephan, K. and Märk, T.D. (1985), Phys. Rev. 4,32, pp 1447 .
Stephens, P.W. and Kittg, J.G. (1983),Phys. Rev. Lett.,51, pp 1538.
Stevens, W.4., Gardner, M., Karo, A. and Julienne, P. (1977), J. Chem. Phys., 67, pp 2860.
Stogryn, D.E. and Hirschfelder, J.O (1959), J. Chem. Phys.,31, pp 1531
Takagi, T., Yamada,I, Kunori, M. and Kobiyama, S. (1972), Proc.2nd Int. Conf.IonSources, Vienna, osterreiche Studiengesellschaft für Atomenenergie, pp 790.
Takagi, T. (1984), J. Vac. Sci. Technol.,2, pp 382
Takagi, T. (1986), Vacuum,36, pp 27.
Tarnovsky, V. and Becker, K (1993), The physics of Electronic and Atomic Collisions, AIPproceeding s, 29 5, pp23 4.
Tarnovsky, V, Kurunczi,P., Rogozhnikov, D. and Becker, K. (1993),Int. J. Mass Spec. IonPhys.,128, pp181.
Tate, J.T. and Smith, P.J. (1932), Phys. Rev.,39, pp 270.
Ton-That, D. and Flannery, M.R. (1977), Phys. Rev. A,15, pp 517
Turnbull, A.H and Cuthbert, J. (1962), Proceedings of A.S.T.M. Cottference on MassSpectrometry (New Orleans - unpublished).
van Deursefl, 4., van Lumig, A. and Reuss, J. (1975), Int. J. Mass Spec. Ion Phys.,l8,pp 129.
van Deursen, A. and Reuss, I. (1976), Chem. Phys. Lett.,40, pp 336.
van Deursen, A. and Reuss, I. (7977a), Int. J. Mass Spectrom.Ion Phys.,23, pp 109.
van Deursen, A. and Reuss, I. (I9l7b), Int. J. Mass Spectrom. Ion Phys., 24, ppl99
Völpel, R., Hofmaû, G., Steidl, M., Schlapp, M., Trassl, R. and Salzborn, E. (1993),
Physical Review Letters, 71, pp3439.

von Ardenne, M. ( 1956), Tabellen der Elektron en Physik ionen Physik und
ubermikro skro skopie, 1, Veb Deutcher Verlag der wissenschaffer, Berlin.
von Engel, A. (1965), Ionized Gases, Clarendon Press, Oxford.
Wadt, W.R. (1980), J. Chem Phys.,72,,PP 3915.
Wadt, W.R. (198I),AppI. Phys. Lett.,38, pp 1030.
'Walstedt, R.E. and Bell, R.F. (1987), J Chem. Phys.,87, pp 1423.
Wang (1945), Physical Review,68, pp284.
Wannier, G.H. (1953), Phys. Rev.,90, pp 817.
Wannier. G.H. (1955), Phys. R¿v., 100, pp 1180.
'Weston, G. F. (1975), Vacuum,25, pp 469.
Vy'inters, H.F. (1965), J. Chem. Phys.,44, pp 1472.
'Worsnop, D.R., Buelow, S.J. and Herschbach, D.R. (1984), J. Phys. Chem.-,88, pp 4506.
Copyright © 2022 FDOKUMEN