Labeling and Detection of Marrow Derived Mesenchymal ...
96
Labeling and Detection of Marrow Derived Mesenchymal Stromal Cells using Magnetic Resonance Imaging by Emidio Tarulli A thesis submitted in conformity with the requirements for the degree of Master of Health Science Graduate Department of the Institute of Biomaterials and Biomedical Engineering University of Toronto Copyright c 2008 by Emidio Tarulli
-
Upload
khangminh22 -
Category
Documents
-
view
0 -
download
0
Transcript of Labeling and Detection of Marrow Derived Mesenchymal ...

Labeling and Detection of Marrow Derived Mesenchymal
Stromal Cells using Magnetic Resonance Imaging
by
Emidio Tarulli
A thesis submitted in conformity with the requirementsfor the degree of Master of Health Science
Graduate Department of the Institute of Biomaterials and BiomedicalEngineering
University of Toronto
Copyright c© 2008 by Emidio Tarulli

Abstract
Labeling and Detection of Marrow Derived Mesenchymal Stromal Cells using Magnetic
Resonance Imaging
Emidio Tarulli
Master of Health Science
Graduate Department of the Institute of Biomaterials and Biomedical Engineering
University of Toronto
2008
Stem cell therapies hold great promise for diseases such as stroke, where few effective
treatment options exist. Clinical translation of experimental stem cell therapies requires
the ability to monitor delivery and behaviour of cells non-invasively in-vivo with clini-
cal imaging modalities such as MRI. This thesis presents the translation of established
methods for labelling and imaging stem cells with specialized MRI systems to a more
clinically relevant setting.
A methodology for harvesting and labelling a cell population containing stem cells
with iron oxide for detection with a clinical MRI system is presented and single cell
detection is demonstrated in-vitro. The feasibility of detecting iron oxide labelled stem
cells intravenously delivered in a rat model of stroke is tested. Results demonstrate that
while MRI is highly sensitive to the presence and distribution of iron oxide containing cells
in-vivo the true origin of these cells remains ambiguous with the current methodology.
ii

Dedication
To my family; past, present and future.
iii

“Two roads diverged in a wood, and I—
I took the one less traveled by,
And that has made all the difference.”
- Robert Frost
iv

Acknowledgements
First and foremost I would like to thank my supervisor, Dr. David Mikulis, for giving me
the opportunity to take on this project and connecting me with the resources to make it
possible. I am greatly indebted to my co-supervisor, Dr. Greg Stanisz, for adopting me
into his lab and making all the necessary resources available, which was quite extensive
in what became a very interdisciplinary project. Without the support and constant
encouragement of my supervisors this work would not have been accomplished. I also
owe a debt of gratitude to Dr. Chris Heyn who was a constant source of direction. Dr.
Heyn’s foundational PhD thesis was the inspiration for this project. I would also like
to thank the other members of my advisory committee, Dr. Cindi Morshead and Dr.
Adrian Crawley, for insightful questions and suggestions to guide me along the way.
I would also like to show my appreciation to various people who helped me to learn
and apply the techniques required for these experiments. Special thanks go to:
• Amy Hoyles and Nadia Sachewsky for teaching me the essentials of bone marrow
extraction and cryosectioning as well as performing all of the stroke procedures.
• Anoja Giles for extensive cell culture supplies, training and insightful suggestions
for in-vitro experiments in addition to allowing 24 hour access to the lab and being
exceptionally accommodating.
• Sujata Syam for a crash course on confocal microscopy and step by step sample
preparation.
• Joydeep Chaudhuri for much appreciated assistance with tissue sectioning and his-
tology.
• Andrea Vaags for taking an enormous amount of time to help design, execute and
troubleshoot various immunohistochemistry experiments and for expert advice with
epifluorescent microscopy.
v

• Sofia Chavez for great help with implementing susceptibility weighted imaging.
• The entire Stanisz Lab and especially Lisa Didiodato and Voytek Gretka for con-
stant company, support and encouragement during the long MRI sessions through-
out the year.
• Dr. Nancy Lobaugh for patient training with animal handling, injections and per-
fusions.
Final thanks go to my family and friends who continue to be my source of strength
and support in all my endeavours.
vi

Contents
List of Tables ix
List of Figures x
1 MRI Monitoring of Stem Cell Therapies 1
1.1 Introduction . . . . . . . . . . . . . . . . . . . . . . . . . . . . . . . . . . . . . . . 1
1.1.1 Stem Cell Therapy, Stroke and Imaging . . . . . . . . . . . . . . . . . . . 2
1.1.2 MRI Stem Cell Tracking . . . . . . . . . . . . . . . . . . . . . . . . . . . 4
1.2 Principles of Magnetic Resonance Imaging . . . . . . . . . . . . . . . . . . . . . . 6
1.2.1 Brief Description of MRI Physics . . . . . . . . . . . . . . . . . . . . . . . 6
1.3 Image Contrast in MR . . . . . . . . . . . . . . . . . . . . . . . . . . . . . . . . . 12
1.3.1 Gadolinium . . . . . . . . . . . . . . . . . . . . . . . . . . . . . . . . . . . 13
1.3.2 Superparamagnetic Iron Oxide (SPIO) Particles . . . . . . . . . . . . . . 15
1.3.3 MR Pulse Sequences . . . . . . . . . . . . . . . . . . . . . . . . . . . . . . 16
1.3.4 Signal to Noise Ratio, Contrast to Noise Ratio . . . . . . . . . . . . . . . 21
1.4 Hypothesis and Thesis Overview . . . . . . . . . . . . . . . . . . . . . . . . . . . 22
1.4.1 Hypothesis . . . . . . . . . . . . . . . . . . . . . . . . . . . . . . . . . . . 22
1.4.2 Thesis Overview . . . . . . . . . . . . . . . . . . . . . . . . . . . . . . . . 22
2 In-vitro MRI of MPIO labeled rMSCs 24
2.1 Introduction . . . . . . . . . . . . . . . . . . . . . . . . . . . . . . . . . . . . . . . 24
2.2 Methods . . . . . . . . . . . . . . . . . . . . . . . . . . . . . . . . . . . . . . . . . 26
2.2.1 Cell Sample Preparation . . . . . . . . . . . . . . . . . . . . . . . . . . . . 26
vii

2.2.2 Cellular Iron Quantification and Localization . . . . . . . . . . . . . . . . 27
2.2.3 Contrast Uptake Efficiency and Biological Effects on Cell Function . . . . 29
2.2.4 Cellular MRI and Correlative Fluorescence Microscopy . . . . . . . . . . . 31
2.3 Results . . . . . . . . . . . . . . . . . . . . . . . . . . . . . . . . . . . . . . . . . . 32
2.3.1 MPIO Particle Uptake and Localization Characteristics . . . . . . . . . . 32
2.3.2 Labeling Efficiency and Biological Effects of MPIO Particle Loading . . . 33
2.3.3 In-vitro MRI and Comparison with Optical Microscopy . . . . . . . . . . 39
2.4 Discussion . . . . . . . . . . . . . . . . . . . . . . . . . . . . . . . . . . . . . . . . 42
3 Detecting MPIO-rMSCs in-vivo 49
3.1 Introduction . . . . . . . . . . . . . . . . . . . . . . . . . . . . . . . . . . . . . . . 49
3.2 Methods . . . . . . . . . . . . . . . . . . . . . . . . . . . . . . . . . . . . . . . . . 52
3.2.1 Experimental Design . . . . . . . . . . . . . . . . . . . . . . . . . . . . . . 52
3.2.2 Stroke Model . . . . . . . . . . . . . . . . . . . . . . . . . . . . . . . . . . 53
3.2.3 rMSC Preparation and Delivery . . . . . . . . . . . . . . . . . . . . . . . 54
3.2.4 Longitudinal MRI Studies . . . . . . . . . . . . . . . . . . . . . . . . . . . 54
3.2.5 Histopathology and Correlative Microscopy . . . . . . . . . . . . . . . . . 54
3.3 Results . . . . . . . . . . . . . . . . . . . . . . . . . . . . . . . . . . . . . . . . . . 56
3.3.1 Longitudinal MRI . . . . . . . . . . . . . . . . . . . . . . . . . . . . . . . 56
3.3.2 MRI Sequence Comparison . . . . . . . . . . . . . . . . . . . . . . . . . . 56
3.3.3 MRI and Histopathology . . . . . . . . . . . . . . . . . . . . . . . . . . . 58
3.4 Discussion . . . . . . . . . . . . . . . . . . . . . . . . . . . . . . . . . . . . . . . . 62
4 Thesis Summary and Conclusion 67
4.1 Thesis Summary . . . . . . . . . . . . . . . . . . . . . . . . . . . . . . . . . . . . 67
4.2 Conclusion . . . . . . . . . . . . . . . . . . . . . . . . . . . . . . . . . . . . . . . 67
Bibliography 69
viii

List of Tables
1.1 MRI Contrast Agents for Cellular Imaging . . . . . . . . . . . . . . . . . 5
1.2 MR Sequence Parameters . . . . . . . . . . . . . . . . . . . . . . . . . . 17
3.1 MRI Parameters . . . . . . . . . . . . . . . . . . . . . . . . . . . . . . . 55
ix

List of Figures
1.1 Spin Echo Sequence Concept . . . . . . . . . . . . . . . . . . . . . . . . . 18
2.1 Confocal microscopy of MPIO-rMSCs. . . . . . . . . . . . . . . . . . . . 34
2.2 Cellular Iron Uptake. . . . . . . . . . . . . . . . . . . . . . . . . . . . . . 35
2.3 Flow Cytometry of MPIO labeled rMSCs 24 Hours Post-Labeling. . . . . 37
2.4 Flow Cytometry of MPIO labeled rMSCs 120 Hours Post-Labeling. . . . 38
2.5 Plating efficiency and proliferation of MPIO-rMSCs. . . . . . . . . . . . . 40
2.6 In-vitro MRI of MPIO loaded rMSCs. . . . . . . . . . . . . . . . . . . . . 41
2.7 In-vitro MRI of single plane MPIO loaded rMSCs. . . . . . . . . . . . . . 43
2.8 In-vitro MRI and Correlative Microscopy of MPIO labeled rMSCs. . . . . 44
3.1 Experiment Design. . . . . . . . . . . . . . . . . . . . . . . . . . . . . . . 53
3.2 Longitudinal MRI . . . . . . . . . . . . . . . . . . . . . . . . . . . . . . . 57
3.3 Comparison of Contrast from MRI Sequences . . . . . . . . . . . . . . . 59
3.4 MRI and Corresponding Histology. . . . . . . . . . . . . . . . . . . . . . 60
3.5 Immunohistochemistry . . . . . . . . . . . . . . . . . . . . . . . . . . . . 61
x

Chapter 1
Magnetic Resonance Imaging as a
Tool for Monitoring of Stem Cell
Therapies
1.1 Introduction
This thesis presents the development and application of a methodology for effectively
labelling rat bone marrow derived mesenchymal stromal cells (rMSCs, a cell population
containing mesenchymal stem cells [1]) with micron sized superparamagnetic iron oxide
(MPIO) particles to enable detection with a clinical MRI system. This introductory
chapter begins with a review of the current state of the art for detecting and tracking
stem cells focusing on the application of these techniques toward imaging injected stem
cells in pre-clinical animal models of stroke. The following section provides a review of
the essential concepts from MRI necessary to understand how MPIO contrast agents are
detected and how they can be used for imaging cells. This chapter concludes with an
outline of the thesis, objectives and hypotheses.
1

Chapter 1. MRI Monitoring of Stem Cell Therapies 2
1.1.1 Stem Cell Therapy, Stroke and Imaging
Despite the advances in medical technology over the past century and the tremendous
impact that medicine has made in some areas such as infectious disease, there remains
a large number of injury-related and degenerative conditions where there is little if any
effective treatment. Ongoing research in stem cell based therapies holds great promise
for the emerging fields of tissue engineering and regenerative medicine where the goal is
to develop novel treatment strategies to address these needs.
A stem cell is characterized as an unspecialized cell with the ability to maintain its
unspecialized state or to differentiate into a more specialized cell type when dividing.
These properties make stem cells of great interest in the treatment of degenerative or
injury-related diseases where, ideally, stem cells could be used to replace or repair lost
or damaged tissues. While the potential therapeutic applications of tissue engineering
are seemingly endless, in regenerative medicine some of the areas of active research and
development include: replacement of insulin secreting islet cells in diabetes [2], tissue
restoration of damaged myocardium post infarction [3, 4] and repair of the central nervous
system [5]. In the central nervous system specifically, stem cell therapies are being
actively investigated in animal models of diseases such as spinal cord injury and stroke
[6, 7, 8].
While the role of stem cells in stroke is not fully understood, motivation for stem
cell implantation as a potential stroke therapy is supported upon a foundation of recent
research. Studies have shown that the adult brain has native regenerative capacity [9, 10,
11, 12]. This is thought to be due to adult neural stem cells that have been identified in the
subventricular zone of the lateral ventricle, and the subgranular zone of the hippocampal
formation [13]. Adult neural stem cells supposedly migrate into the cerebral infarct area
and regenerate some neurons, a hypothesis supported by the observation that some stroke
patients regain lost function over time [10]. Studies within a rat stroke model have shown
that injection of growth factors and erythropoietin encourage regeneration of neural tissue

Chapter 1. MRI Monitoring of Stem Cell Therapies 3
and ultimately result in regained motor function [14, 15]. Since the potential exists for
neural regeneration, the post stroke environment may be ideal for neurosupplementation
using stem cells.
A recent review by Parr et al. [6] has summarized a number of studies showing
therapeutic benefit of mesenchymal stem cell (MSC) therapy in rodent models of stroke.
While initial use of MSCs focused on tissue engineering bone, cartilage, muscle, marrow
stroma, tendon, fat, and other connective tissues [16] it has also been demonstrated that
MSCs can be influenced to differentiate into neural cells in-vitro [17]. Furthermore, it
has been shown that MSCs release a plethora of bioactive, immunosuppressive molecules
capable of creating a regenerative microenvironment potentially limiting the extent of
injury and facilitating regeneration in damaged adult tissues [16, 18]. Therefore, MSCs
could also play a neuroprotective role in stroke. As an additional benefit, MSCs can
be easily harvested from the bone marrow, rapidly expanded in-vitro and are believed
to be immunopriveleged, potentially obviating the need for immunosuppresion following
transplantation [16].
While these initial studies provide evidence for therapeutic benefit of MSC therapy,
more research is required to better understand the regenerative mechanism. Moreover,
to facilitate clinical translation the ability to monitor stem cell behaviour in-vivo is crit-
ical when trying to establish both therapeutic benefit and patient safety. In humans
non-invasive methods are the only viable option for implanted cell tracking. The modal-
ities most suitable for in-vivo cell tracking include single photon emission tomography
(SPECT) [19], positron emission tomography (PET), bioluminescent imaging [20] and
MRI [21, 22]. MRI has emerged as the predominant modality for cellular imaging due to
superior temporal and spatial contrast, absence of ionizing radiation and the ability to
detect even single cells under certain circumstances [23, 24]. Moreover, MRI is suitable
for monitoring surrogate measures of treatment efficacy such as tissue regeneration. In-
vivo cell tracking using MRI is being actively pursued for a variety of clinical applications

Chapter 1. MRI Monitoring of Stem Cell Therapies 4
of cell based therapies [7, 25, 26, 27].
1.1.2 MRI Stem Cell Tracking
A number of strategies have been developed in order to make cells detectable with MRI.
All cell labelling strategies set out to create specific signal-altering characteristics allow-
ing cells to be detected against the background. In addition to providing sufficient signal
contrast, the ideal characteristics of a cellular contrast agent include: biocompatibility,
lack of genetic modification or perturbation to the target cell, single-cell detection, the
ability to quantify cell numbers at a given locus, minimum label dilution with cell divi-
sion, minimum transfer to non-target cells, and the ability to image target cells over a
period of months to years [26, 28]. These ideal characteristics may not all be explicitly
necessary to effectively track a cell based therapy. The four major classes of contrast
agents currently used for MR cell labelling include: Gadolinium (Gd) based compounds,
superparamagnetic iron oxide (SPIO) nanoparticles, micron sized SPIO particles (MPIO)
and MR reporter genes [7].
The properties of each cell labelling strategy including sensitivity, labelling methods
and advantages/disadvantages are summarized in Table 1.1 adapted from Politi [7], Fran-
gioni et al. [26] and Kraitchman et al [27]. Of these contrast agents, MPIO particles
provide very high sensitivity with straightforward labelling methods - both of which are
desirable for clinical applications. MPIO particles are available in various sizes up to 10
µm diameter and contain more than 60% magnetite by weight with a polymer coating
rendering them biologically inert and suitable for long term detection. The conjugation
of a fluorescent marker allows double labelling of cells for detection with both MR and
fluorescent micrscopy. Furthermore, fluorescent MPIOs have been used to effectively la-
bel and detect cells with both in-vitro and in-vivo MRI and have not been demonstrated
to cause cell death or impaired differentiation capacity thus far [3, 23, 24, 29, 30, 31].
For the purposes of this thesis, fluorescent MPIO particles were chosen as the contrast

Chapter 1. MRI Monitoring of Stem Cell Therapies 5
agent. In the next section our attention turns to the basic princliples of MRI and how
these cellular contrast agents can be detected.
Table 1.1: MRI Contrast Agents for Cellular Imaging
MR Contrast
Agent
Gd-based SPIO/MPIO MR-reporter gene
Relative MR Low High/Very High Very Low
Sensitivity ≈ 105 cells Single cells Tissue Level?
Labelling
Methods
Direct Non Specific (In-
cubation with contrast
agents ± Transfection
Agents)
Direct Non Specific
(Magentofection/ Magne-
toeletroporation)
Gene Transfection (Viral
vectors, Electroporation)
Indirect specific
(receptor mediated)
Indirect specific
(receptor mediated)
Advantages Positive contrast detec-
tion
High sensitivity No contrast dilution with
cell division
Less ambiguous quantifi-
cation
Minimal biological effects No exogenous contrast re-
quired
SPIOs are FDA appoved
MPIOs do not require use
of TAs
Disadvantages Low sensitivity Negative contrast detec-
tion
Complicated labelling
procedure
Possible toxicity Endogenous sources of
negative contrast con-
found quantification
Very low sensitivity to
date
Contrast dilution with cell
division
Contrast dilution with cell
division
MPIOs not FDA ap-
proved

Chapter 1. MRI Monitoring of Stem Cell Therapies 6
1.2 Principles of Magnetic Resonance Imaging
This section provides a basic overview of the essential theory behind nuclear magnetic
resonance needed to understand the origin of image contrast in the MR signal and how
it can be manipulated by contrast agents in order to detect cells. In summary, the
following steps are required to produce an MR image. The protons contained within
the sample must be placed in a strong magnetic field tuning them to the resonance
frequency. Energy is then transmitted into the sample via radio frequency (RF) pulses
at the resonance frequency. Subsequently, the sample dissipates the absorbed energy
through a process known as relaxation. Selective excitation of a pre-defined area to
image within the sample is achieved using gradient coils to spatially modify the magnetic
field. If enough information is collected during relaxation of the sample post excitation,
an image can be produced that accurately reflects the sample’s proton environments.
There are several thorough descriptions of each aspect of this process tailored to the
intended audience. For a more mathematical description the interested reader is referred
to any of these more theoretical texts [32, 33]. For a more applied perspective on MRI
the reader is referred to any of the following more clinically oriented texts [34, 35].
A brief section of MR physics is presented after which the focus shifts to the predom-
inant contrast mechanisms in MR images. To conclude this section the pulse sequences
used throughout this thesis are presented and the concepts of signal to noise and contrast
to noise ratios (SNR and CNR respectively) are described as they provide a useful means
of characterizing pulse sequence performance in terms of contrast agent detection.
1.2.1 Brief Description of MRI Physics
Every proton and neutron within the nucleus of an atom possesses a property known as
a nuclear spin. When combined, these nuclear spins within an atom impart a net nuclear
spin angular momentum or magnetic spin to the nucleus. In atoms with an even mass

Chapter 1. MRI Monitoring of Stem Cell Therapies 7
number (sum of the number of protons and neutrons) the magnetic spins oppose each
other and results in an atom with a zero net magnetic spin. However, for atoms with an
odd mass number the excess spin within the atom results in a net magnetic spin. Some
examples of nuclei with a non zero magnetic spin include 1H, 13C, 23Na, 31P. Any nuclei
with a non zero magnetic spin exhibits resonance and can theoretically be detected by
nuclear magnetic resonance (NMR). However, given the abundance of hydrogen within all
living things, it is the natural atom of choice for producing images with NMR, commonly
referred to as magnetic resonance imaging (MRI). The interested reader is referred to
[33] for a more thorough discussion of MRI including the necessary quantum mechanics.
The remainder of this section focuses on the MR properties of the hydrogen atom.
It has been established that protons have a net spin angular momentum, which gives
rise to a magnetic dipole moment (�µ), called spin. When a hydrogen atom is placed within
an external magnetic field ( �Bo) two interesting things happen: the spin aligns itself either
parallel or anti-parallel to the external field (quantum angular momentum �J = ±12) and
the spins precess around �Bo, just as a spinning top precesses about a gravitational field.
Each spin orientation, parallel (low energy) and anti-parallel (high energy) is separated
by a difference in energy given by Equation 1.1, where �Bo is the external magnetic field,
h̄ is the Dirac constant (reduced Plank’s constant) and γ is the gyromagnetic ratio, a
constant known for each nuclear species (for 1H, γ = 267.52 × 10⁶rads−1T−1).
∆E = γh̄Bo (1.1)
To understand why the spins would precess around around �Bo we consider the torque
that �Bo exerts on �µ. Here torque is expressed as the rate of change of the angular
momentum �J . Recalling that angular momentum is related to �µ by the gyromagnetic
ratio (�µ = γ �J) we can express the behaviour of the spin (�µ) placed in the presence of �Bo
by Equation 1.2.

Chapter 1. MRI Monitoring of Stem Cell Therapies 8
∂ �J
∂t= �µ × �Bo
∂�µ
∂t= γ�µ × �Bo (1.2)
Equation 1.2 is a differential equation which can be solved explicitly for the condition
when �Bo is time invariant (i.e. �Bo is constant assumed here to be oriented along the
longitudinal z axis). The general solution is expressed in Equation 1.3, which is a simple
rotation matrix of the initial vector �µo clockwise about �Bo at the frequency given by
γBo. This frequency is the resonant frequency, commonly called the Larmor frequency
(ωo = γBo) and is fundamental to MR experiments. The Larmor frequency for 1H (42.5
MHz/T) at clinical field strengths (1 − 3 T) is 42.5 − 127.5 MHz.
�µ(t) =
⎛⎜⎜⎜⎜⎜⎜⎝
cos(γBot) sin(γBot) 0
−sin(γBot) cos(γBot) 0
0 0 1
⎞⎟⎟⎟⎟⎟⎟⎠
�µ(0) (1.3)
Thus far we have described the behaviour of a single hydrogen atom magnetic spin in
the presence of an external magnetic field, however, we are interested in the behaviour of
a much larger number of hydrogen atoms contained within our object to be imaged. The
first consideration when taking a large number of hydrogen atoms is the relative number
of spins in the parallel (low energy) versus anti-parallel (high energy) orientation as spins
from each state oppose each other and reduce the net magnetization. Analytically, the
ratio of spins in the lower energy state (n+) to the higher energy state (n−) is given by a
Boltzmann distribution as given in Equation 1.4, where ∆E is the energy difference given
in Equation 1.1, T is absolute temperature in Kelvin and k is the Boltzmann constant
(1.381 × 10⁻²³JK−1).
n−n+
= e∆E/kT (1.4)

Chapter 1. MRI Monitoring of Stem Cell Therapies 9
At 1 Tesla there is approximately 3 excess spin aligned with �Bo for every 106 hy-
drogen atoms at room temperature [32]. While this is a relatively small amount, when
considering the sheer number of hydrogen atoms in a single cubic centimeter of water
(≈ 12×1023) there are sufficient excess spins to produces a detectable net magnetization
when added together. It is important to note that although individual spins may have
components in the transverse (xy) plane perpendicular to �Bo (which by convention is
oriented in the longitudinal z axis) these spins are all randomly oriented out of phase
and result in no net transverse magnetization, thus �M =∑
�µ is oriented along the z axis.
The bulk magnetization aligned with the external field �Bo for a fixed volume is given by
Equation 1.5.
Mo =γ2h̄2ρ �Bo
4kT(1.5)
Here the proton density within the volume is given by ρ. Equation 1.5 illustrates the
only modifiable parameters to increase the net magnetization of an object are decreasing
T and increasing �Bo. In-vivo tissues only tolerate slight changes in temperature thus we
are left with increasing �Bo and hence the motivation behind higher field MR scanners.
Recalling that the Larmor frequency of a proton is determined by the �Bo field it
experiences it becomes clear that any modification to field affecting a proton causes a
change in its Larmor frequency. This simple fact is the basis of being able to selectively
excite a region of interest such as an image slice inside a sample and consequently makes
MR imaging possible. Equation 1.6 describes the external magnetic field of the MR
scanner over space.
�B(x, y, z) = �Bo + �BG (1.6)
Through manipulation of �BG we can spatially vary the external magnetic field �B
throughout the sample in all three dimensions, and hence the Larmor frequency of the
protons. By controlling the Larmor frequency throughout our sample, we can spatially se-

Chapter 1. MRI Monitoring of Stem Cell Therapies 10
lect the section of our sample that we wish to image by applying an RF pulse of a defined
frequency range (restricted bandwidth). A more thorough description of selective exci-
tation and subsequent image reconstruction is outside of the scope of this introduction.
The interested reader is referred to any number of excellent resources [33, 34, 35, 36].
MR Signal Behaviour and Detection
The net magnetization �M cannot be effectively measured while oriented with �Bo in the
longitudinal z axis. In order to detect �M an RF pulse ( �B1) is applied to the sample
containing �M . �B1 is the magnetic component of the RF pulse (EM wave emitted from
RF coils) aligned in the transverse plane perpendicular to the resting net magnetization
�M . The force that �B1 exerts creates a torque on �M rotating it around �B1. As a result,
�M will now have a component in the transverse plane which precesses at the Larmor
frequency ωo as similarly shown for individual spins in Equation 1.3 with the following
result in Equation 1.7. The process of rotating �M using an RF pulse is known as RF
excitation. The same RF coils used to rotate �M can now be used to detect this precessing
magnetization in the transverse plane (Mxy) according to Farraday’s law of induction.
The change in magnetic flux Φ through the coil induces an electromotive force (EMF),
ε, measured as a time varying voltage (ε = −∂Φ∂t
).
Mxy(t) = Moxye
−iωot (1.7)
The EMF signal recorded is proportional to the initial transverse magnetization Moxy
of all spins within the sample volume and is given by Equation 1.8. Moxy(x, y, z) is the
initial transverse magnetization at time zero (t = 0) after RF excitation for any position
(x, y, z) within the sample volume.
ε(t) ∝∫
x
∫y
∫zMo
xy(x, y, z)e−iωotdxdydz (1.8)
Depending on the amount of energy used in the RF excitation pulse, the angle of

Chapter 1. MRI Monitoring of Stem Cell Therapies 11
rotation can be precisely controlled. Rotating �M by 90o completely into the transverse
plane gives the maximum detectable signal. However, the absorbed energy used to rotate
�M is eventually dissipated as the transverse component Mxy decays and �M returns to
the equilibrium position oriented along z, the longitudinal axis of the static field Bo.
This signal decay corresponding to the dissipation of absorbed energy is referred to as
relaxation. The decay of transverse magnetization is described by Equation 1.9 which is
a first order differential equation. When solved for a 90o RF excitation pulse, a simple
exponential decay results with T2 corresponding to the time required for the net transverse
magnetization to reduce to 36.8% of its inital value.
dMxy
dt= −Mxy
T2(1.9)
In practice, the transverse relaxation is also affected by magnetic field inhomogeneities
and represents the overall transverse relaxation time constant comprised of both reversible
and irreversible processes denoted T ∗2 . The dephasing of spins due to interactions with
dipolar fields (often caused by nearby spins) is a time dependent process and irreversible,
this is defined as the pure T2 relaxation effect. Dephasing due to interactions with
externally applied static magnetic field gradients and field inhomogeneities is a reversible
process which can be recovered. The contribution of reversible and irreversible effects to
the overall T ∗2 is given by Equation 1.10, where T
′2 and T2 are irreversible and reversible
processes respectively.
1
T ∗2
=1
T′2
+1
T2
(1.10)
Once the net magnetization �M has been rotated into the transverse plane and the
RF pulse has been removed, the longitudinal component of the net magnetization also
begins to return to its previous alignment with Bo by releasing the absorbed RF energy.
The regrowth of the longitudinal magnetization is described by Equation 1.11. Here T1,
the spin-lattice relaxation, is defined as the amount of time required for the longitudinal

Chapter 1. MRI Monitoring of Stem Cell Therapies 12
magnetization to return to 63.2% of its inital value at thermal equilibrium.
dMz
dt= −Mz − Mo
T1
(1.11)
The Bloch Equation is a phenomenological equation describing the overall behaviour
of the bulk magnetization ( �M) during relaxation and is given in Equation 1.12. Mx, My
and Mz are the components of �M along the unit vectors i,j and k in the x, y and z axes
respectively. Mo is the bulk magnetization along z at thermal equilibrium as defined by
Equation 1.5.
d �M
dt= γ �M × �B − Mxi + Myj
T2− (Mz − Mo)k
T1(1.12)
Incorporating T ∗2 relaxation effects into Equation 1.8 gives Equation 1.13. This time
varying voltage signal is commonly referred to as a free induction decay (FID) and is the
basic MR signal recorded.
ε(t) ∝∫
x
∫y
∫zMo
xy(x, y, z)e−iωote− t
T∗2 dxdydz (1.13)
1.3 Image Contrast in MR
The image contrast we observe in MR originates from the amplitude (∝ Moxy) and phase
(e−iωot) measured in our MRI signal. Therefore, processes that affect the amplitude or
phase of the measured MR signal are potential sources of image contrast. This property
is one of the great strengths of MRI, as it is possible to manipulate the contrast in the
image based upon the method of acquisition. This also complicates the interpretation of
MR images as the contrast observed can potentially originate from a number of sources
depending on how the image was acquired. Consequently, it is necessary to understand
the sources of MR contrast and how to acquire images to represent the contrast of interest.
In this section, endogenous and exogenous contrast mechanisms are briefly described.

Chapter 1. MRI Monitoring of Stem Cell Therapies 13
While our discussion is limited to contrast mechanisms affecting the signal originating
from the hydrogen protons in water, which are predominantly imaged in MRI, it is worthy
to note that there have been many recent developments in gaining contrast through the
imaging of other atoms including 13C [37, 38, 39, 40], 19F [41, 42, 43, 44, 45] and 23Na
[46, 47, 48, 49, 50, 51].
MRI provides high resolution regional contrast based on differences in tissue com-
position producing images of anatomical structures. The major characteristics of tissue
composition that affect the MR signal are water content (proton density ρ) and net mag-
netization relaxation properties. The affect of ρ on signal contrast is fairly intuitive with
more protons per unit volume providing more MR signal all else being equal. On the
other hand, net magnetization relaxation properties are composed of longitudinal relax-
ation time T1, transverse relaxation time T2/T∗2 as described in the previous section.
These are the major determinants of contrast between tissues in MRI. Tissues possess
different ρ, T1 and T2/T∗2 due to physical environment, water mobility and interactions
with macromolecules and cell membranes. In general, an image pixel is brighter when
there is a greater contribution to the MR signal acquired from the particular pixel region,
whereas darker pixels correspond to a much smaller MR signal contribution. To further
improve contrast, one can increase the strength of the MRI static field ( �Bo), change
acquisition parameters or use MR contrast agents.
1.3.1 Gadolinium
The contrast agents predominantly used for cellular MRI include heavy metals of the
lanthanide series such Gadolinium (Gd) and superparamagnetic iron oxides (SPIO). More
recently, there has been interest in developing MR-reporter genes, which can produce a
number of MRI detectable changes when expressed in the cell. The use of MR-reporter
genes has two distinct advantages over currently used methods of cell labelling. Firstly,
gene expression is only present in viable cells meaning detection of contrast also implies

Chapter 1. MRI Monitoring of Stem Cell Therapies 14
cell viability. Second, all cells originating from a cell with an MR-reporter gene also
contain the gene, and therefore express the contrast. This circumvents the limitations of
contrast agents that are diluted with ongoing cell division. Despite these advantages the
use of MR-reporter genes is still in its infancy and is unsuitable for cell tracking due to
lack of sensitivity at present [52].
Heavy metals from the lanthanide series such as Gd contain unpaired electrons, which
create very strong magnetic dipole moments in the presence of an external magnetic field.
Each unpaired electron creates a magnetic dipole moment over 600 times that of water
protons. Water protons in close proximity to Gd experience a powerful interaction which
promotes longitudinal relaxation and effectively shortens the T1 (and to a lesser extent
T2 and T∗2) causing hyperintensities on T1-weighted images. Substances that tend to
align their atomic magnetic dipoles with an external magnetic field, strengthen the local
field and exhibit no net magnetism in the absence of the external magnetic field are
referred to as paramagnetic [28]. Gd is toxic to cells in its ionic form, thus chelators such
as diethylenetriamine penta-acetic acid (DTPA) are used to produce Gd-DTPA which
is non-toxic. Gd-DTPA was the first MR contrast agent developed and has been used
clinically for over 20 years to image tissues.
Gd-DTPA has not been widely adopted as an intracellular contrast agent for several
reasons. Firstly, high intracellular concentrations of Gd-DTPA are necessary to produce
sufficient contrast. Secondly, dechelated gadolinium is known to be toxic and detailed
knowledge of the metabolic fate and excretion pathway of paramagnetics such as Gd-
DTPA is currently not available, making clinical translation a challenge [27]. There is
ongoing research investigating the development of customized Gd-based nanoparticles to
overcome the limitations of sensitivity and possible cytotoxic effects [53, 54, 55]. Several
applications of these particles for positive contrast of implanted stem cell tracking in
stroke has been reported [54, 56, 57, 58].

Chapter 1. MRI Monitoring of Stem Cell Therapies 15
1.3.2 Superparamagnetic Iron Oxide (SPIO) Particles
Superparamagnetic iron oxide (SPIO) particles are the predominant contrast agent for
cellular imaging and has been in use for over a decade. The description of the physical
and chemical properties of SPIO has been summarized from a comprehensive review
by Thorek et al. [28]. SPIO particles are composed of single or multiple iron oxide
cores embedded within a polymer matrix coating. The surface of this polymer can be
modified to contain functional groups allowing the attachment of peptides or antibodies
for targeted uptake. Fluorophores or radiotracers can also be conjugated to these particles
to allow multi-modal imaging. Sizes of SPIOs range from monocrystalline iron oxide
nanoparticles (MIONs) ≈ 3 nm in diameter, ultra small iron oxide (USPIO) particles
≈ 10 nm and MPIOs (micron sized iron oxide particles) can be as large as 10 µm [28, 30].
Within these particles the iron atoms are arranged in the crystalline structure such
that their magnetic spins interact and align parallel with each other creating magnetic
domains which extend a certain distance within the crystal. At long range adjacent mag-
netic domains become anti-aligned. The transition between these two domains is called a
Bloch wall, which becomes thermodynamically unfavourable at the nanometer scale (≈ 14
nm) [28]. The result is single domain crystals, which are classified as superparamagnetic.
Superparamagnetic substances are characterized by the strong paramagnetic nature
of the particles at this scale. Compared with paramagnetic substances such as Gd, SPIO
also exhibits no magnetism when the external magnetic field is removed. However, SPIO
has a much larger susceptibility due to alignment of the magnetic moments of the entire
crystal with the applied field. Magnetic susceptibility χ is defined as a material specific,
unitless constant of proportionality between the external magnetic field and the degree
of magnetization within the material. Materials with high magnetic susceptibility expe-
rience a large increase in magnetization within the material when placed in an external
magnetic field. The net magnetization of SPIO is three orders of magnitude larger than
that of paramagnetic substances and causes large disturbances in the local magnetic field
Chapter 1. MRI Monitoring of Stem Cell Therapies 16
through disrupting the phase of surrounding protons. These disturbances or field inho-
mogeneities cause disruption of phase coherence of water protons and have a potent effect
on transverse relaxation, T∗2.
Thus, SPIO is imaged indirectly through its effect on longitudinal and transverse re-
laxation of the surrounding water protons. Although it has been shown that SPIO can
generate detectable T1 contrast, typically SPIO contrast is imaged with MRI by using
sequences sensitive to transverse relaxation and susceptibility (T2 and T∗2 weighted imag-
ing) [28]. For the purposes of this thesis T2 sensitive sequences of interest include spin
echo (SE) and balanced steady state free precession (b-SSFP) while T∗2 sensitive sequences
include spoiled gradient recalled echo (SPGR) and susceptibility weighted imaging (SWI).
1.3.3 MR Pulse Sequences
All MRI sequences are composed of a series of RF excitation pulses and subsequent
recording of the resulting MR signal. An MRI sequence can be thought of as a general
recipe for creating an image with basic set of ingredients. By varying the amounts of the
different ingredients in the recipe the resulting image changes. The relevant ingredients
for understanding the MR pulse sequences used in this thesis are summarized in Table
1.3.3.
Spin Echo (SE)
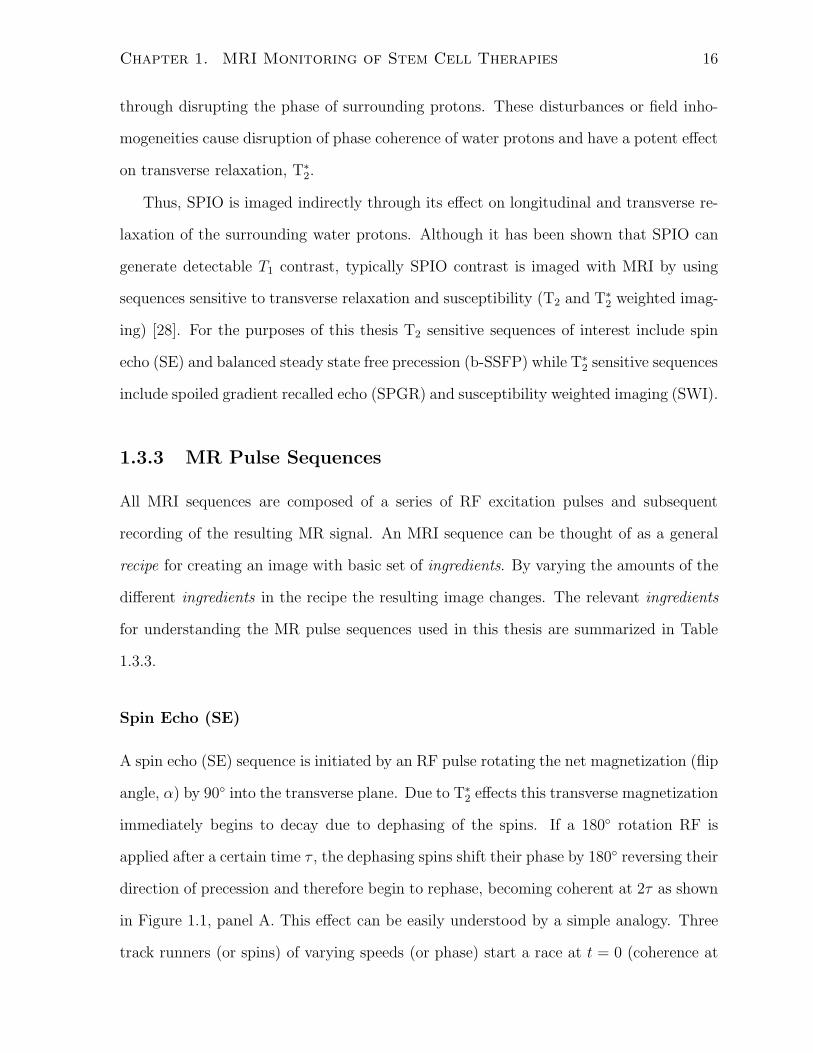
A spin echo (SE) sequence is initiated by an RF pulse rotating the net magnetization (flip
angle, α) by 90◦ into the transverse plane. Due to T∗2 effects this transverse magnetization
immediately begins to decay due to dephasing of the spins. If a 180◦ rotation RF is
applied after a certain time τ , the dephasing spins shift their phase by 180◦ reversing their
direction of precession and therefore begin to rephase, becoming coherent at 2τ as shown
in Figure 1.1, panel A. This effect can be easily understood by a simple analogy. Three
track runners (or spins) of varying speeds (or phase) start a race at t = 0 (coherence at

Chapter 1. MRI Monitoring of Stem Cell Therapies 17
Table 1.2: MR Sequence Parameters
Parameter Units Definition
Flip Angle degrees Amount of rotation of the net magnetiza-
tion into the transverse plane
Matrix pixels In plane resolution of the resulting image
Time to Repitition (TR) milliseconds Amount of time between RF pulse excita-
tions
Time to Echo (TE) milliseconds Amount of time delay between RF excita-
tion pulse and recording of the MR signal
or echo
Number of Excitations (NEX) number Number of times the entire imaging exper-
iment is repeated
Field of View (FOV) millimeters Dimensions of the volume to be imaged
Slice Thickness millimeters Thickness of the sample averaged into a
single 2D image
Voxel Dimensions millimeters Smallest volume element from which MR
signal is localized

Chapter 1. MRI Monitoring of Stem Cell Therapies 18
Figure 1.1: Concept behind spin echo sequences. (A) Spin behaviour during SE pulse sequence.
Fast spins (F) dephase more quickly than slow spins (S). The 180◦ phase shift causes S spins
to be ahead of the F spins causing them to rephase and become coherent again at 2τ . (B)
Track runner analogy of the spin echo conept. (C) RF pulse and FID signal diagram. The
180◦ refocusing pulse suppress the reversible transverse relaxation,T′2. Figures adapted from
Hashemi et al. [35]
excitation) and after a certain time (t = τ) are separated (dephased) by a certain distance.
If the runners reverse direction at t = τ (180◦ phase shift) the distance between them
decreases (rephase) until they all arrive back at the starting line at t = 2τ as depicted in
Figure 1.1, panel B. The recorded MR signal in relation to the applied SE pulse sequence
is shown in Figure 1.1, panel C. The ampliude of the two echoes is proportional to T2
and the T′2 effects have been effectively suppresed by the use of the 180◦ refocusing pulse.
Consequently, SE sequences can be used to produce images with T2 weighted contrast.
A long TR is typically used in SE to allow longitudinal magnetization to fully recover

Chapter 1. MRI Monitoring of Stem Cell Therapies 19
before the next 90◦ excitation pulse. This minimizes the influence of T1 on the image
contrast. Varying the TE of a spin echo sequence adjusts the amount of T2 relaxation
allowed to occur prior to signal acquisition. A SE sequence with a very short TE and long
TR minimizes the contribution of T1 and T2 to the overall image contrast resulting in a
proton density weighted image. On the other hand a long TR, long TE image minimizes
the contribution of T1 and proton density to the overall image contrast resulting in a T2
weighted image.
Spoiled Gradient Recalled Echo (SPGR)
Spoiled Gradient Recalled Echo (SPGR) uses steady state free precession (SSFP) which is
achieved during a train of RF pulses using a very short TR (TR�T1, T2). The steady state
is achieved when longitudinal and transverse magnetizations reach a dynamic equilibrium
where the behaviour of the magnetization between excitation pulses is identical from
pulse to pulse [32]. The theoretical foundations of SSFP were formally described by Carr
[59] in 1958, however, only recently has SSFP imaging become feasible with advances
in MR hardware and software. SPGR pulse sequences utilize the steady state for fast
imaging achieved with successive RF pulses separated by a short TR with α typically
much less than 90◦. Magnetic field gradients refocus the magnetization and an echo is
formed at TE, when the signal is acquired. The transverse magnetization after data
collection is destroyed or spoiled prior to the next RF excitation pulse using unbalanced
gradients and/or RF energy. Since the sequence is unbalanced, the net magnetization
is not refocused and T ∗2 decay occurs making SPGR extremely sensitive to sources of
susceptibility and field inhomogeneities such as SPIO. SPGR sequences with small α
and short TE are more proton density weighted, while increasing α produces more T1
weighting. Extending TE increases the amount of T ∗2 decay and hence adds T ∗
2 weighting
to the overall image contrast.

Chapter 1. MRI Monitoring of Stem Cell Therapies 20
Balanced Steady State Free Precession (b-SSFP)
Recently, a number of SSFP based techniques including balanced SSFP (b-SSFP) have
gained popularity for detecting SPIO labeled cells [23, 60]. b-SSFP is an implementation
of SSFP where the residual magnetization at the end of each cycle is completely refocused
into a single magnetization vector. The ability of b-SSFP to completely refocus the
magnetization with each cycle results in extremely high signal to noise ratio (SNR) per
unit time, sensitivity to field inhomogeneities and predominantly T2
T1weighted contrast
[61]. These features make b-SSFP ideal for angiographic and cardiac applications [61].
Unfortunately, b-SSFP sequences suffer from banding artifacts if the frequency range
across the subject exceeds ± 12TR
which is especially problematic at higher field strengths
[61, 62]. Therefore, it is difficult to implement b-SSFP without specialized strategies to
compensate for these effects such as phase cycling or more powerful imaging gradients.
Susceptibility Weighted Imaging (SWI)
Susceptibility weighted imaging (SWI) is currently being applied to separate arteries
from veins on MR angiography based upon differences in blood oxygenation that result
in detectable phase differences [63, 64]. Deoxyhemoglobin is paramagnetic and exhibits
greater susceptibility than oxyhemoglobin which is not. SWI is achieved by performing
an SPGR acquisition with a specific TE and flow compensation to suppress phase changes
due to chemical shifts from fat and flow respectively [63]. The low spatial frequency na-
ture of spatial variations are used to reduce the background field effects [63]. Accounting
for these factors leaves two sources of susceptibility: susceptibility field changes from
paramagnetic deoxyhemoglobin and susceptibility field changes from the presence of a
contrast agent, such as SPIO. In constructing the SWI image both magnitude and phase
information from the acquired SPGR images is incorporated to produce the final image.
Therefore, SWI is a very sensitive to sources of susceptibility and potentially useful to
detect SPIO, although other sources of susceptibility such as the presence of hemorrhage

Chapter 1. MRI Monitoring of Stem Cell Therapies 21
could possibly confound interpretation.
1.3.4 Signal to Noise Ratio, Contrast to Noise Ratio
Signal to Noise Ratio, SNR
One of the fundamental measures of MRI image quality is the signal to noise ratio (SNR).
This is defined mathematically by Equation 1.14. S, is the signal amplitude and σnoise
is the standard deviation of the noise.
SNR =S
σnoise(1.14)
SNR is dependent on tissue parameters (proton density ρ, T1,T2), acquisition param-
eters (sequence, voxel volume V , readout time tro) and the MR system used to create the
measurements (static field strength Bo and receiver coil properties). The tro is a product
of NEX, phase encodes and time per acquisition. While tissue parameters are fixed for a
given sequence, the other factors contribute to the overall SNR as follows:
SNR ∝ BoV√
tro (1.15)
Contrast to Noise Ratio, CNR
Another important measure of MR image quality of particular interest in cellular MRI
is the contrast to noise ratio (CNR), which characterizes the ability to detect a signal
change due to labeled cells against a homogenous background. The CNR is defined in
Equation 1.16 as the difference in signal between the region of interest, in this case Scell
and Sbackground divided by the standard deviation of the noise in the image σnoise. Hence,
MR sequences that maximize the difference between Scell and Sbackground generates the
highest CNR and provides the best cell detection.

Chapter 1. MRI Monitoring of Stem Cell Therapies 22
CNR =Sbackground − Scell
σnoise
(1.16)
1.4 Hypothesis and Thesis Overview
1.4.1 Hypothesis
It is the intent of this thesis to test the following hypothesis:
1. Rat marrow derived mesenchymal stromal cells (rMSCs) can be effectively labeled
with micron sized superparamagnetic iron oxide particles (MPIOs) with minimal
negative biological effects and detected with a clinical 3 Tesla MRI system using
conventional imaging sequences and simple surface coils.
Furthermore, this thesis will test the feasibility and explore the limitations of detecting
intravenously delivered MPIO labeled rMSCs with a 3 Tesla clinical MRI system using
conventional imaging sequences in a permanent focal ischemia stroke model in rats.
1.4.2 Thesis Overview
The principle goal of this work was to translate the current tools for labelling and imaging
stem cells used with specialized hardware and experimental MRI systems to a more clin-
ically relevant setting. Specifically, this thesis focuses on labelling an rMSC population
containing mesenchymal stem cells with MPIO. All MRI was performed using a 3 Tesla
clinical MRI system with a simple RF surface coil and conventional imaging sequences.
In Chapter 2, the ability to detect single MPIO labeled rMSCs using a clinical MRI
system is presented. In Chapter 3, the feasibility of applying these methods to detect
intravenously delivered MPIO labeled rMSCs in-vivo in a rat stroke model is tested.
Well established methods from the literature have been implemented to harvest, grow
and label rMSCs with MPIO. Similarly, routine tests to determine basic cell function have

Chapter 1. MRI Monitoring of Stem Cell Therapies 23
been used to assess cell viability, plating efficiency, growth rate and labelling efficiency.
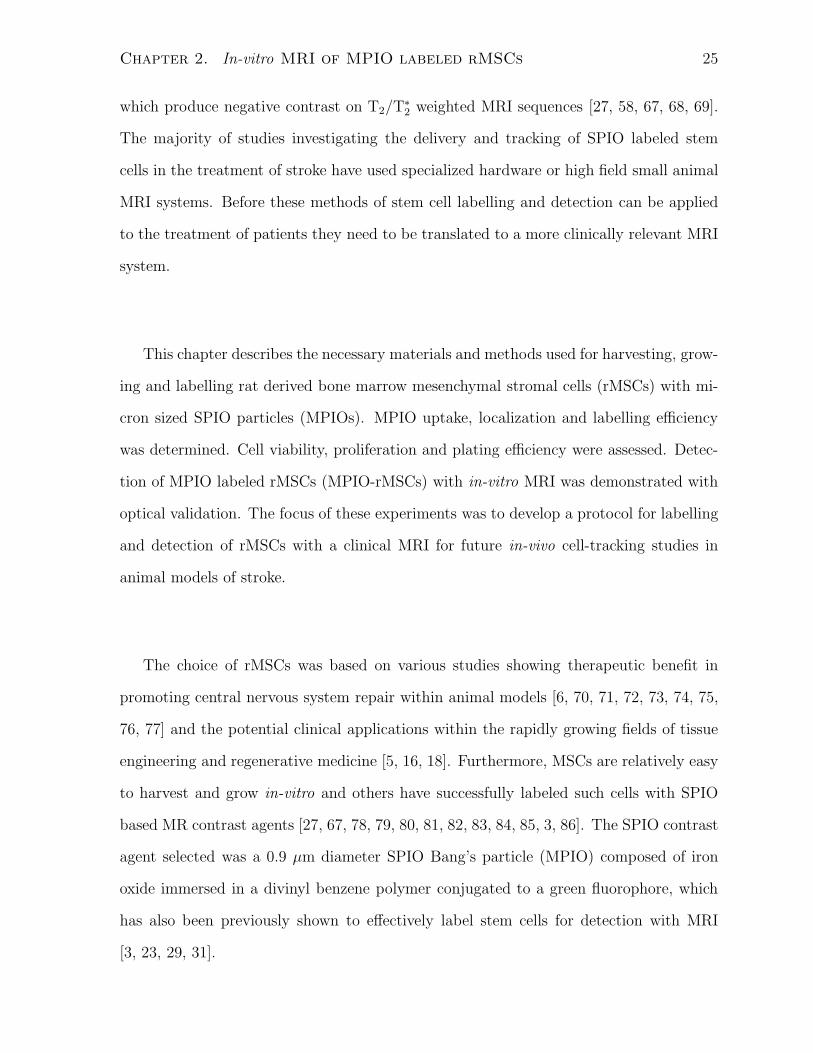
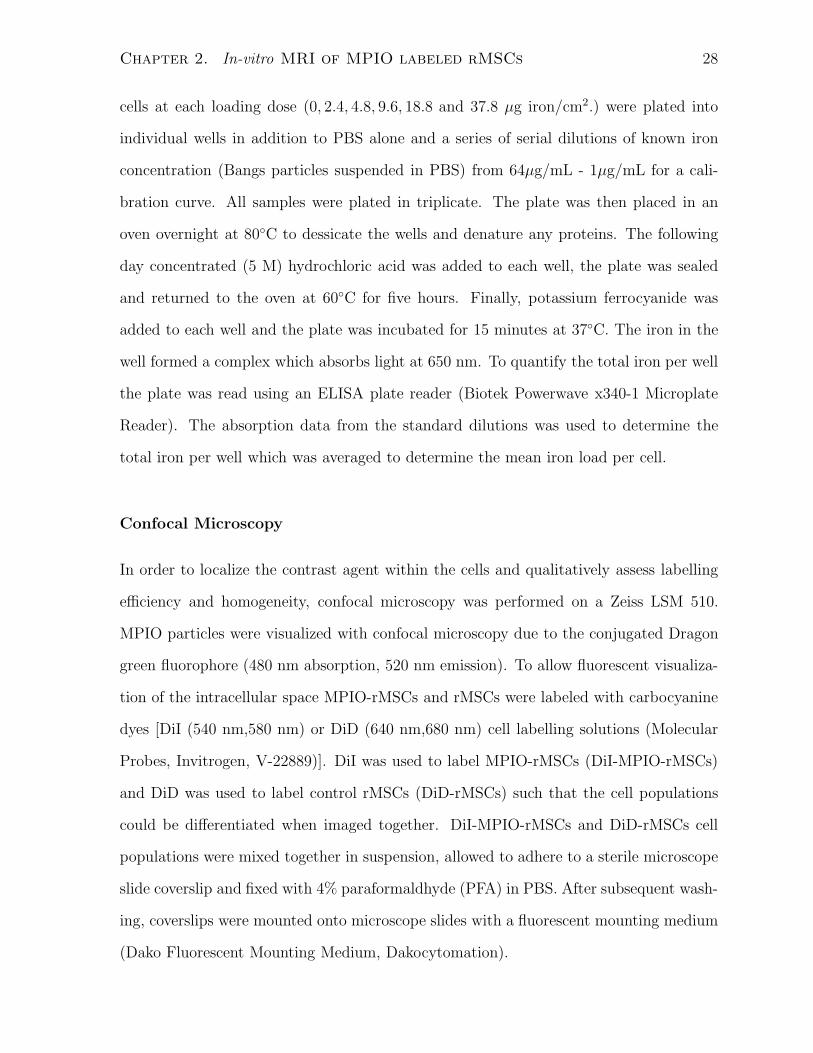
In-vitro imaging of MPIO labeled rMSCs was performed using SPGR MRI sequences
which are highly sensitive to the presence of iron. Optical validation studies to verify
single cell detection followed directly from the foundational work of Chris Heyn [65].
The established rat stroke model employing permanent focal devascularization per-
formed in the lab of Greg Stanisz was used for the detection feasibility study. Following
the experimental treatment strategy in this stroke model developed by Cindi Morshead
initiating growth factor supplementation, intravenous injection of MPIO-rMSCs was per-
formed 3 days post stroke. The protocol for combined immunohistochemical and Prus-
sian blue staining to facilitate epifluorescence and confocal microscopy was adapted from
Andrea Vaags.
My contributions to this work included: cellular work including harvest, plating and
maintenance, biological function assays, cell phantom preparations and MR imaging,
data analysis and microscopy, animal handling, MR imaging sessions and intravenous
injections, animal sacrifice and perfusions, tissue specimen fixation, sectioning and im-
munohistochemical, fluorescent and prussian blue staining for histology. All stroke proce-
dures were performed by Amy Hoyles. This project was completed under the supervision
of Greg Stanisz and David Mikulis.

Chapter 2
In-vitro magnetic resonance imaging
of micron sized superparamagnetic
iron oxide labeled rat bone marrow
derived mesenchymal stromal cells
2.1 Introduction
Non-invasive monitoring of stem cell therapies is essential in establishing both the treat-
ment efficacy and safety of clinical applications. Imaging modalities capable of stem cell
detection and tracking in-vivo include optical imaging, PET, SPECT and MRI. MRI is
very useful for stem cell therapy monitoring in that it combines high contrast and 3D
spatial resolution with the ability to detect small numbers of cells.
Currently, MRI is being used to monitor a variety of experimental stem cell therapies
targeting various diseases including myocardial infarction and stroke [20, 26, 66, 67].
The most commonly used method of detecting delivered stem cells with MRI involves
labelling stem cells with superparamagnetic iron oxide (SPIO) based contrast agents
24
Chapter 2. In-vitro MRI of MPIO labeled rMSCs 25
which produce negative contrast on T2/T∗2 weighted MRI sequences [27, 58, 67, 68, 69].
The majority of studies investigating the delivery and tracking of SPIO labeled stem
cells in the treatment of stroke have used specialized hardware or high field small animal
MRI systems. Before these methods of stem cell labelling and detection can be applied
to the treatment of patients they need to be translated to a more clinically relevant MRI
system.
This chapter describes the necessary materials and methods used for harvesting, grow-
ing and labelling rat derived bone marrow mesenchymal stromal cells (rMSCs) with mi-
cron sized SPIO particles (MPIOs). MPIO uptake, localization and labelling efficiency
was determined. Cell viability, proliferation and plating efficiency were assessed. Detec-
tion of MPIO labeled rMSCs (MPIO-rMSCs) with in-vitro MRI was demonstrated with
optical validation. The focus of these experiments was to develop a protocol for labelling
and detection of rMSCs with a clinical MRI for future in-vivo cell-tracking studies in
animal models of stroke.
The choice of rMSCs was based on various studies showing therapeutic benefit in
promoting central nervous system repair within animal models [6, 70, 71, 72, 73, 74, 75,
76, 77] and the potential clinical applications within the rapidly growing fields of tissue
engineering and regenerative medicine [5, 16, 18]. Furthermore, MSCs are relatively easy
to harvest and grow in-vitro and others have successfully labeled such cells with SPIO
based MR contrast agents [27, 67, 78, 79, 80, 81, 82, 83, 84, 85, 3, 86]. The SPIO contrast
agent selected was a 0.9 µm diameter SPIO Bang’s particle (MPIO) composed of iron
oxide immersed in a divinyl benzene polymer conjugated to a green fluorophore, which
has also been previously shown to effectively label stem cells for detection with MRI
[3, 23, 29, 31].

Chapter 2. In-vitro MRI of MPIO labeled rMSCs 26
2.2 Methods
2.2.1 Cell Sample Preparation
Cell Harvest and Culture
rMSCs were obtained and cultured as described previously by Javazon et al. [1]. Briefly,
rMSCs were harvested from bone marrow aspirates obtained from the tibias and femurs
of male Long-Evans rats (Charles River Laboratories) 60 days post gestation. A 21-gauge
needle was inserted into each bone shaft and flushing was performed to collect the whole
bone marrow with 3 mL of complete α-modifed Eagle’s medium (αMEM, Gibco,12571-
063) containing 20% fetal bovine serum (FBS,Gibco,12319-018), 2 mM L-Glutamine, 100
U/mL penicillin (Gibco,15140-122), 100 µg/mL streptomyocin (Gibco,15140-122) and 25
ng/mL Amphotericin B (Sigma, A2942). Once all of the bones were flushed, 9 mL of
cold red blood cell lysis buffer (Stem Cell Technologies, 07800) was added, the suspension
was then incubated at 37◦C for 6 minutes and centrifuged at 450 g for 7 minutes. Cells
were washed two more times by resuspension in fresh complete media and subsequent
centrifugation. Following the third resuspension the cells were filtered through a 70 µm
nylon filter (BD Falcon, 352350) to remove any bone fragments or clots. Filtered cells
were then plated onto a 75 cm2 tissue culture flask. The cells were grown in complete
αMEM at 37◦C and 5% CO2. After three days the medium was replaced leaving only
the adherant cells in culture. The cells were then expanded to 90% confluence. This
population was defined as passage zero (P0).
Passaging of rMSCs
Cells at P0 were washed with phosphate buffered saline (PBS, Sigma, D8537) without
Ca2+ and Mg2+ and then detached by incubation in 0.25% trypsin 0.1% ethylenedi-
aminetetraacetic acid (trypsin-EDTA, Gibco, 25300-054) for 5-10 minutes at 37◦C. Fresh
complete medium was added to deactivate the trypsin and cells were centrifuged for 7

Chapter 2. In-vitro MRI of MPIO labeled rMSCs 27
minutes at 450g. Cells were counted using a hemocytometer and then plated into 175
cm2 tissue culture flasks at initial densities of 500-1000 cells/cm2 (Passage 1 - P1). Cells
were refed by replacing the complete medium every 3-4 days. Once cultures reached con-
fluence the cells were passaged again as described above. The proceudure was repeated
up to five times. All experiments were performed with cells at P3-P5.
Labeling of rMSCs with MPIO Particles
Prior to labelling, cells were plated into a 6 well plate (Corning Costar, 3516) at approxi-
mately 500,000 cells per well. Cells were allowed to adhere for 12 hours. The medium was
replaced with fresh complete medium and the MPIO contrast agent was added. These
MPIO particles (MPIOs) are composed of a divinyl benzene polymer with a mean di-
ameter of 0.9 µm immersed with 62% magnetite (Fe3O4) by weight and a Dragon Green
fluorophore with 480 nm peak absorption and 520 nm peak emission spectra (Bangs Labs,
MC05F). MPIO doses of 2.4, 4.8, 9.6, 18.8 and 37.8 µg iron/cm2 were used for labelling
experiments. The cells were incubated with MPIOs for 6, 24 or 48 hours to allow en-
docytosis to occur after which they were washed three times while still adherent inside
the wells with PBS to remove free contrast agent. After initial washing the cells were
detached with trypsin-EDTA and washed three of four more times by repitive centrifuga-
tion (100g, 5 minutes) and resuspension in PBS. Prior to the final centrifugation the cells
were counted using a hemocytometer and the final suspension of cells was adjusted to the
desired concentration in PBS or complete media as the intended experiment required.
2.2.2 Cellular Iron Quantification and Localization
Colorimetric Iron Assay
The mean iron dose per cell was determined by a colorimetric iron assay as described by
Bernas et al. [31]. After labelling, cells were resuspended in PBS at a concentration of
2 × 10⁶ cells/mL. Using a 96 well plate (Corning Costar, 3596) approximately 200,000
Chapter 2. In-vitro MRI of MPIO labeled rMSCs 28
cells at each loading dose (0, 2.4, 4.8, 9.6, 18.8 and 37.8 µg iron/cm2.) were plated into
individual wells in addition to PBS alone and a series of serial dilutions of known iron
concentration (Bangs particles suspended in PBS) from 64µg/mL - 1µg/mL for a cali-
bration curve. All samples were plated in triplicate. The plate was then placed in an
oven overnight at 80◦C to dessicate the wells and denature any proteins. The following
day concentrated (5 M) hydrochloric acid was added to each well, the plate was sealed
and returned to the oven at 60◦C for five hours. Finally, potassium ferrocyanide was
added to each well and the plate was incubated for 15 minutes at 37◦C. The iron in the
well formed a complex which absorbs light at 650 nm. To quantify the total iron per well
the plate was read using an ELISA plate reader (Biotek Powerwave x340-1 Microplate
Reader). The absorption data from the standard dilutions was used to determine the
total iron per well which was averaged to determine the mean iron load per cell.
Confocal Microscopy
In order to localize the contrast agent within the cells and qualitatively assess labelling
efficiency and homogeneity, confocal microscopy was performed on a Zeiss LSM 510.
MPIO particles were visualized with confocal microscopy due to the conjugated Dragon
green fluorophore (480 nm absorption, 520 nm emission). To allow fluorescent visualiza-
tion of the intracellular space MPIO-rMSCs and rMSCs were labeled with carbocyanine
dyes [DiI (540 nm,580 nm) or DiD (640 nm,680 nm) cell labelling solutions (Molecular
Probes, Invitrogen, V-22889)]. DiI was used to label MPIO-rMSCs (DiI-MPIO-rMSCs)
and DiD was used to label control rMSCs (DiD-rMSCs) such that the cell populations
could be differentiated when imaged together. DiI-MPIO-rMSCs and DiD-rMSCs cell
populations were mixed together in suspension, allowed to adhere to a sterile microscope
slide coverslip and fixed with 4% paraformaldhyde (PFA) in PBS. After subsequent wash-
ing, coverslips were mounted onto microscope slides with a fluorescent mounting medium
(Dako Fluorescent Mounting Medium, Dakocytomation).

Chapter 2. In-vitro MRI of MPIO labeled rMSCs 29
2.2.3 Contrast Uptake Efficiency and Biological Effects on Cell
Function
Fluorescence Activated Cell Sorter (FACS) Analysis
Serial fluorescence activated cell sorter (FACS) analysis was performed (BD Biosciences,
FACSCalibur) once (n=1) to assess labelling efficiency and viability on MPIO-rMSCs
and control rMSCs plated at high plating density (HPD), near confluence or at low plat-
ing density (LPD) over a five day period. Aliquots of cells were collected at 24,48,72,96
and 120 hours and analyzed. To differentiate between live and dead cells, propidium
iodide (PI) was added at 5 µg/mL. Cell samples were analyzed for size (forward scatter),
granularity (side scatter), PI−/+ (live/dead) and green fluorescence from MPIO+/− (la-
beled/unlabeled). Dead cells were PI+ as the disrupted cell membrane allowed PI into
the cell whereas live cells are PI− with intact cell membranes. The thresholds for live
versus dead and MPIO labeled versus unlabeled cells (≈ 20 and ≈ 200 respectively) were
determined using test and control samples prior to the longitudinal experiment and gate
values were held consistent throughout. Solutions were adjusted to a concentration of
106 cells/mL prior to analysis and 10, 000 event counts were used to characterize each
sample.
Colony Forming Unit Assay
To determine the effect of MPIO particle loading on plating efficiency a colony forming
unit assay was performed. Cells labeled at ≈ 44 and ≈ 54 pg iron/cell and unlabeled
controls were plated in 100 mm diameter petri dishes in 10 mL of complete medium at
densities of 250, 500 and 1000 cells per plate and incubated for 10 days at 37◦C and 5%
CO2. Subsequently, the medium was removed and the plates were stained with 5 mL
methylene blue solution (3g methylene blue in 1 L 50% ethanol in distilled water) for
10 minutes after which the methylene blue was removed and the plates were rinsed with

Chapter 2. In-vitro MRI of MPIO labeled rMSCs 30
water and allowed to dry. An initial survey of the stained plates was used to determine
the threshold size of a macroscopic colony, which was then applied to enumerate the total
colonies formed in each of the plates at the various densities and MPIO particle loading
levels. Each condition was tested in triplicate and the experiment was repeated 3 times
(n=3).
Cell Metabolism and Proliferation
Post labelling cell metabolism and proliferation was assessed using an methyl tetrazolium
salt assay (MTT assay, 3-(4,5-Dimethylthiazol-2-yl)-2,5-diphenyltetrazolium bromide as-
say, Invitrogen, V13154). After 24 hours incubation with MPIO and subsequent washing
as previously described, MPIO-rMSCs and rMSC controls were suspended into complete
medium without phenol red and 10% fetal bovine serum (FBS) and plated into 96 well
plates at 10, 000 cells per well in triplicate. The assay was run over a 6 day period and
repeated in triplicate. On each day of the assay the 10 µL of MTT solution was added
to each microwell and the cells were incubated for four hours during which the metabolic
activity of the mitochondria converted the MTT into purple formazan crystals. After
the incubation period the media was removed from the well and 100 µL of an anionic
solvent, sodium dodecyl sulfate in dilute hydrochloric acid (SDS-HCl), was added and
the plate was returned to the incubator overnight to allow the SDS-HCl to dissolve the
formazan crystals rendering the well a shade of purple proportional to the initial amount
of formazan crystals and hence metabolic activity of the cells. The produced color in-
tensity was quantified using a 96-well plate reader (Biotek Powerwave x340-1 Microplate
Reader) by reading absorbance at 570nm and subtracting off background absorbance at
650nm. To determine whether MPIO particle loaded cells were less metabolically active
than unlabeled cells the MTT assay was performed on fixed cell numbers (10,000 30,000
and 60,000) for medium (≈ 44 pg/cell) and high (≈ 54 pg/cell) loading levels as well as
unlabeled controls over 5 days [87].

Chapter 2. In-vitro MRI of MPIO labeled rMSCs 31
Growth Assay
Post labelling cell growth rate was assessed over seven days using an in-vitro growth
assay. Labeled and unlabeled cells were plated in triplicate into seven identical six well
plates at 10, 000 cells per well in 2 mL of complete medium. On each day of the exper-
iment one plate was used for counting. Briefly, adherent cells were removed from each
well of the six well plate by incubation with 250 µL trypsin-EDTA for 5 minutes and
subsequently quenched with 750 µL complete medium. After centrifugation at 450g for
five minutes cells were resuspended at a density of 10 − 100 × 104 cells/mL to facilitate
counting. Samples from each well were counted in triplicate using a hemocytometer. The
experiment was repeated 3 times (n=3).
2.2.4 Cellular MRI and Correlative Fluorescence Microscopy
Cell Sample Preparation
Gel phantoms were used for imaging MPIO loaded rMSCs in bulk (greater than 1000)
and at the single cell level. Cells were suspended in 4% gelatin in sterile PBS at 37◦C
and serial dilution gel phantoms were created with 106, 5 × 10⁵, 105, 5 × 10⁴, 104, 5 × 10³
and 103 cells non-uniformly suspended in 500µL total volume in 6 × 50 mm borosilicate
glass NMR tubes (VWR, 6820-068). Samples were cooled and stored in a refrigerator at
4◦C to allow solidification. For fewer than 1000 cells, cells were plated onto a single plane
gelatin (gel) sandwich using the microwells (6 mm diameter) of a 96 well plate (Corning,
3596). To create a flat meniscus on which to place the cells 50µL of 8% PBS-gel was
added to each well and allowed to solidfy. Then approximately 5µL of 2% PBS-gel was
carefully added so as to fill and flaten the hardened meniscus. The desired amount of
cells suspended in 2% gel-PBS was then added and allowed to adhere onto the hardened
gel surface. Finally, the remainder of the well was filled with 2% PBS-gel resulting in a
single layer of cells sandwhiched between layers of 8% and 2% PBS-gel.

Chapter 2. In-vitro MRI of MPIO labeled rMSCs 32
MR Experiments and Optical Validation
All imaging was performed on a clinical 3 Tesla GE Signa MRI scanner (GE, Milwaukee,
USA) . All specimens were placed directly onto the center of a 3 × 5 cm receive only
rectangular surface coil and aligned with the scanner isocenter. Imaging gel phantoms
was achieved using two dimensional spoiled gradient recalled echo (2D-SPGR) sequence.
The SPGR parameters were: 20◦ flip angle, 30× 30× 1 mm FOV, 1 mm slice thickness,
512 × 512 matrix and 15.63 kHz receive bandwidth. The number of excitations (NEX),
time to repetition (TR) and time to echo (TE) ranged from 8 − 70 NEX, 57 − 111 ms
and 11 − 34 ms respectively, depending on the sample. For the NMR tube phantoms
and single plane phantoms these parameters were: TE/TR 34/111 or 24/57 ms with 24
NEX and TE/TR 24/57 ms with 70 NEX respectively. MR images from single plane
phantoms were compared to phase contrast and epifluorescence microscopy performed
using a Leica DM RB Fluorescent Microscope with Cool Snap Digital Camera.
2.3 Results
2.3.1 MPIO Particle Uptake and Localization Characteristics
MPIO Localization
Localiztion of the MPIO particles post labelling and washing was achieved with confocal
microscopy. Total particle uptake was heterogeneous throughout the population as shown
in a representative sample at high magnification in Figure 2.1. Panel A shows DiI-
MPIO-rMSCs and untreated control DiD-rMSCs labeled with DiI(red) and DiD(blue)
endosomal fluorescent markers respectively. Panel B shows green fluorescence from the
MPIO particles present within the mixed cell population. Panel C shows co-localization
of endosomal DiI(red) and MPIO particles (green) revealing a cytoplasmic, granular
distribution of MPIO particles only within the DiI labeled cells that were incubated with

Chapter 2. In-vitro MRI of MPIO labeled rMSCs 33
MPIO. The untreated DiD labeled control rMSCs do not fluoresce green. In panel D,
Nomarski optics reveal the outlines of the rMSCs with the MPIO particles clustered
in perinuclear organelles. Each incubation concentration and plating density clearly
showed a perinuclear, cytoplasmic granular distribution of MPIO particles in the rMSC
population.
MPIO Particle Uptake
MPIO particle uptake by rMSCs was observed to be a function of MPIO concentration
and incubation time. Figure 2.2 shows the relationship of average iron per cell versus
iron incubation concentration per unit area. The average iron content per cell plateaued
after 24 hours at an incubation concentration of 18.8 µg/cm2 resulting in approximately
54 pg iron/cell. There was no observable difference in average iron loading between 24
and 48 hour incubation times. Decreasing the incubation time to 6 hours resulted in
decreased average iron uptake, approximately half (27 pg iron/cell) of the 24 hour value
at the same incubation concentration (18.8 µg/cm2).
2.3.2 Labeling Efficiency and Biological Effects of MPIO Par-
ticle Loading
Labeling Efficiency
Fluorescence activated cell sorting (FACS) analysis by flow cytometry observed 89% of
MPIO-rMSCs were alive and labeled after 24 hour incubation with MPIO particles at
18.8 µg iron/cm2. Figure 2.3 summarizes the results of the flow cytometry analysis of
MPIO-rMSCs versus unlabeled control rMSCs. In Figure 2.3 panels A and B are the size
(forward scatter) versus granularity (side scatter) plots showing increased side scatter
observed in labeled (B) versus unlabeled cells (A) respectively. Panels C and D are
PI versus MPIO green fluorescence plots with quadrants defining the gating thresholds

Chapter 2. In-vitro MRI of MPIO labeled rMSCs 34
Figure 2.1: Confocal microscopy performed on DiI-MPIO-rMSCs and DiD-rMSCs. (A) Multi-
channel confocal acquisition showing fluorescent endosomal labelling of the MPIO treated(red)
and untreated(blue) rMSCs with lypophilic carbocyanine dyes: DiI (red) and DiD (blue). (B)
Single channel confocal acquisition of green fluorescence originating from MPIO particles. (C)
Multi-channel co-localization of endosomal DiI(red) and MPIO particles(green) revealing a
cytoplasmic, granular distribution of MPIO particles within the MPIO treated cells whereas
untreated control rMSCs show no green fluorescence. (D) Nomarski optics (differential interfer-
ence) revealing the outlines of the adherent rMSCs and MPIO particles clustered in perinuclear
organelles. A subconfluent population of rMSCs were exposed to MPIO particles for 24 hours
while identically plated control rMSCs were not. rMSCs incubated with MPIO particles were
labeled with an endosomal fluorescent marker, DiI(red) while untreated control rMSCs were
labeled with DiD(blue) so as to differentiate the populations after being mixed together and
simultaneously imaged.

Chapter 2. In-vitro MRI of MPIO labeled rMSCs 35
Figure 2.2: Average iron uptake per cell is shown as a function of iron incubation concentration
for three different incubation times. Error bars are representative of the standard deviation of
3 samples per data point. After 6,24 and 48 hours of incubation with MPIO particles cells
were washed, counted and loaded into a 96 well microplate. Treatment with hydrochloric acid
and potassium ferrocyanide produces a blue pigment proportional to the amount of ferric iron,
quantified by absorbance at 650 nm on a microplate reader. Error bars represent standard
deviation of 6 samples at each loading. Experiment was repeated in triplicate and typical
results are shown.

Chapter 2. In-vitro MRI of MPIO labeled rMSCs 36
for sub-populations of live labeled (cells with MPIO,LL), live unlabeled (cells without
MPIO, LU), dead labeled (DL) and dead unlabeled (DU)]. Panel E is the histogram
of MPIO green fluorescence distribution for the live cells within the MPIO-rMSCs and
control rMSC populations.
FACS analysis after 120 hours incubation showed 78% MPIO-rMSCs at high plating
density (MPIO-rMSCs-HPD) were live and labeled versus 29% of MPIO-rMSCs at low
plating density (MPIO-rMSCs-LPD). Figure 2.4 summarizes the results of flow cytom-
etry analysis for MPIO-rMSCs-HPD, MPIO-rMSCs-LPD and unlabeled control rMSCs.
Panels A,B and C contain FSC-SSC plots showing densely plated cells (B) retain more
granularity as compared to cells plated at low density (C) and unlabeled controls (A).
Panels D,E and F are MPIO fluorescence versus PI plots showing the subpopulations of
live/dead, labeled/unlabeled cells in unlabeled controls (D) and labeled cells plated at
high (E) and low (F) density. There were no significant differences in viability between
labeled and unlabeled cells over the course of the experiment regardless of the incubation
concentration of MPIO used for labelling [9.8 or 18.8 µg iron/cm2 (ANOVA, p= 0.61)].
The distribution of MPIO green fluorescence after 120 hours incubation is shown in panel
G. The distribution of live-labeled cells plated at HPD (black) is furthest to the right
and contains more green fluorescence compared with cells plated at LPD (gray) versus
live-unlabeled cells (white). Panels H and I show confocal microscopy of the cell suspen-
sions from the HPD (B,E) and LPD (C,F) conditions respectively. Cells in suspension
were allowed to adhere to a slide coverslip and were stained endosomally with DiI (red).
Panel H shows more green fluorescence (MPIO particles) retained within HPD cells as
compared with those at LPD (panel G). An LPD cell with strong green fluorescence is
indicated with a white arrow.

Chapter 2. In-vitro MRI of MPIO labeled rMSCs 37
Figure 2.3: Flow cytometry of MPIO labeled rMSCs 24 Hours Post-Labeling. Labeled and
unlabeled rMSCs were analyzed for size (forward scatter), granularity (side scatter), viability
(PI−/+) and MPIO green fluorescence. (A,B) Size versus granularity plots showing increased
granularity in labeled A, versus unlabeled cells B after 24 hours incubation. (C,D) PI versus
MPIO green fluorescence plot showing sub-populations [live labeled with MPIO (LL), live un-
labeled (LU), dead labeled (DL) and dead unlabeled (DU)] within the cell populations from
A,B. (E) Histogram characterizing the MPIO green fluorescence distribution gated to include
the live control rMSCs (white) versus live MPIO-rMSCs (black).

Chapter 2. In-vitro MRI of MPIO labeled rMSCs 38
Figure 2.4: Flow cytometry of MPIO labeled rMSCs 120 Hours Post-Labeling. MPIO-rMSCs
and unlabeled control rMSCs were analyzed for size (forward scatter), granularity (side scatter),
viability (PI−/+) and MPIO green fluorescence. (A,B,C) Size versus granularity plots of labeled
and unlabeled cells at 120 hours in culture post labelling. High plating density (HPD) MPIO-
rMSCs (B) are more granular when compared with low plating density (LPD) MPIO-rMSCs
(C) or unlabeled control rMSCs (A). (D,E,F) PI versus MPIO plots showing 78% MPIO-rMSCs
at high plating density (MPIO-rMSCs-HPD) were live and labeled versus 29% of MPIO-rMSCs
at low plating density (MPIO-rMSCs-LPD). (G) Histogram showing the distribution of MPIO
green fluorescence in live cells from MPIO-rMSCs-HPD (black) and MPIO-rMSCs-LPD (gray)
versus control rMSCs (white). (H,I) Confocal microscopy of HPD and LPD cell suspensions
after mounting and DiI staining (red). More MPIO green fluorescence is observed in the HPD
versus LPD cells in general. An LPD cell with strong green fluorescence is indicated with a
white arrow.

Chapter 2. In-vitro MRI of MPIO labeled rMSCs 39
Plating Efficiency and Proliferation
To assess the effect of loading rMSCs with MPIO particles on plating efficiency and prolif-
eration, colony forming unit (CFU), methyl tetrazonium salt (MTT) and in-vitro growth
assays were performed. The CFU assay revealed no significant difference (ANOVA,
p= 0.813) on the plating efficiency (colonies formed as a percentage of cells plated) of
MPIO-rMSCs versus unlabeled control rMSCs as shown in Figure 2.5, panel A. The MTT
assay on controlled cell numbers with various MPIO loading levels shows no significant
difference (ANOVA, p= 0.77, 0.34 and 0.50) in the metabolic activity of labeled versus
unlabeled cells for 10, 000, 30, 000 and 60, 000 cells as shown in Figure 2.5, panel B. In
panel C, the serial MTT assay shows significantly less metabolic activity in labeled versus
unlabeled cells at 24,48, 72 and 96 hour time points (ANOVA, p=0.001, 0.004, 0.000 and
0.026), which later diminished, see Figure 2.5, panel C. The in-vitro growth assay also
shows significantly slower growth in MPIO-rMSCs versus versus control rMSCs from 48
to 120 hours, see Figure 2.5, panel D. Doubling time for the first 72 hours in culture was
estimated at 22 and 48 hours for control rMSCs and MPIO-rMSCs respectively. From
72-120 hours in culture the doubling times were estimated at 22 and 30 hours for control
rMSCs and MPIO-rMSCs respectively. The plateau in both the MTT and growth curve
assays correspond to cells reaching confluence. All error bars represent standard devia-
tions of at least 3 samples at each data point. All experiments were repeated at least in
triplicate and representative results are shown.
2.3.3 In-vitro MRI and Comparison with Optical Microscopy
Bulk Phantoms
NMR tube phantoms containing highly labeled MPIO-rMSCs (≈ 54pg/cell) and control
rMSCs uniformly distributed at a concentration of 105 cells/mL were imaged using a
2D-SPGR sequence with TR/TE of 111/34 ms, 24 NEX, 30 × 30 mm FOV, 1 mm

Chapter 2. In-vitro MRI of MPIO labeled rMSCs 40
Figure 2.5: Colony forming unit (CFU), methyl tetrazonium salt (MTT) and in-vitro growth
assays were performed to assess the effect of MPIO loading on plating efficiency and prolifera-
tion. (A) Plating efficiency as assessed by a colony forming unit (CFU) assay shows no signifi-
cant difference in plating efficiency in MPIO loaded versus unloaded cells (ANOVA, p= 0.813).
(B) An MTT assay performed on controlled numbers of MPIO-rMSCs versus unloaded cells
showing no significant difference in metabolic activity (ANOVA, p= 0.77, 0.34 and 0.50). (C)
A longitudinal MTT assay showing significantly less metabolic activity in MPIO loaded cells at
24, 48, 72 and 96 hours (ANOVA, p=0.001, 0.004, 0.000 and 0.026). (D) A growth curve assay
performed over 7 days shows substantially slower proliferation observed from 48 to 120 hours
in MPIO loaded rMSCs versus unlabeled cells. All error bars represent standard deviations of
at least 3 samples at each data point. All experiments were repeated at least in triplicate and
representative results are shown.
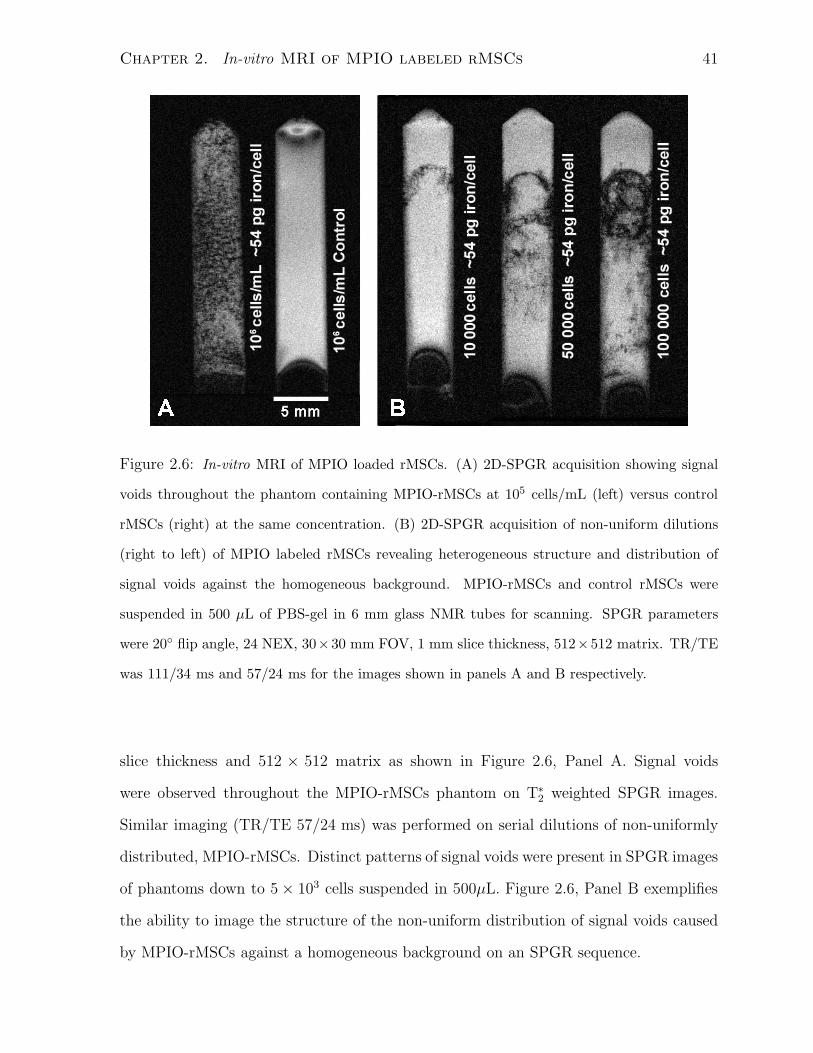
Chapter 2. In-vitro MRI of MPIO labeled rMSCs 41
Figure 2.6: In-vitro MRI of MPIO loaded rMSCs. (A) 2D-SPGR acquisition showing signal
voids throughout the phantom containing MPIO-rMSCs at 105 cells/mL (left) versus control
rMSCs (right) at the same concentration. (B) 2D-SPGR acquisition of non-uniform dilutions
(right to left) of MPIO labeled rMSCs revealing heterogeneous structure and distribution of
signal voids against the homogeneous background. MPIO-rMSCs and control rMSCs were
suspended in 500 µL of PBS-gel in 6 mm glass NMR tubes for scanning. SPGR parameters
were 20◦ flip angle, 24 NEX, 30×30 mm FOV, 1 mm slice thickness, 512×512 matrix. TR/TE
was 111/34 ms and 57/24 ms for the images shown in panels A and B respectively.
slice thickness and 512 × 512 matrix as shown in Figure 2.6, Panel A. Signal voids
were observed throughout the MPIO-rMSCs phantom on T∗2 weighted SPGR images.
Similar imaging (TR/TE 57/24 ms) was performed on serial dilutions of non-uniformly
distributed, MPIO-rMSCs. Distinct patterns of signal voids were present in SPGR images
of phantoms down to 5 × 10³ cells suspended in 500µL. Figure 2.6, Panel B exemplifies
the ability to image the structure of the non-uniform distribution of signal voids caused
by MPIO-rMSCs against a homogeneous background on an SPGR sequence.

Chapter 2. In-vitro MRI of MPIO labeled rMSCs 42
Single Plane Phantoms
Figure 2.7 shows imaging of single plane phantoms performed using 2D-SPGR sequence
with a TR/TE of 57/24 ms, 30 × 30 mm FOV, 1 mm slice thickness and 512 × 512
matrix giving voxel dimensions of 60× 60 µm. Nine wells in a three by three well corner
of a 96 well plate were used to produce the single plane phantoms. The number of
cells decreases by column from left to right at 1000, 500 and 250 cells whereas the iron
loading varies by row from top to bottom: unlabeled control, ≈ 44 pg iron/cell, ≈ 54
pg iron/cell. The plane containing the cells was localized by performing an 8 NEX scan
with 2 mm slice thickness orthogonal to the microwells as shown in Figure 2.7, panel
A. The plane containing the cells contains dark signal voids sandwiched between bright
layers of PBS-gel. Figure 2.7, panel B shows signal voids distributed along the surface
of phantoms with MPIO-rMSCs containing ≈ 54/44 pg iron/cell. The calculated SNR
at 70 NEX and 1 mm slice thickness as calculated with Equation 1.14 was ≈ 30. CNR
(see Equation 1.15) for isolated signal voids was ≈ 23/20 for phantoms with ≈ 54/44 pg
iron/cell respectively.
Figure 2.8, panel A shows MR images from one of the wells of the single plane phan-
toms showing discrete signal voids. Panel B shows the corresponding phase contrast
image of the same microwell. The chosen region of interest is magnified showing five sig-
nal voids in Panel C. Phase contrast and epifluorescence microscopy of the same region
containing five cells are shown in Panel D and E respectively. Both phase contrast and
epifluorescence images show MPIO loaded cells, which fluoresce green, colocalizing with
the signal voids detected with MRI.
2.4 Discussion
In-vitro single cell detection of MPIO-rMSCs was achieved for the first time using a clini-
cal 3T MR scanner with conventional SPGR scanning protocols and a simple surface coil.

Chapter 2. In-vitro MRI of MPIO labeled rMSCs 43
Figure 2.7: In-vitro MRI of single plane MPIO loaded rMSCs. Single plane phantoms of
MPIO labeled rMSCs were created in a three by three corner of a 96 well plate. (A) Scan plane
localization using 2D-SPGR, TR/TE 57/24 ms, 8 NEX and 30 × 30 mm FOV orthogonal to
the microwells.(B) 2D-SPGR acquisition of the cellular plane with TR/TE: 57/24 ms, 70 NEX,
30×30 mm FOV, 1 mm slice thickness and 512×512 matrix giving voxel dimensions of 60×60
µm in plane. Calculated SNR (see Equation 1.14) at 70 NEX was 30. Estimated CNR (see
Equation 1.15) for isolated signal voids for phantoms with ≈ 54/44 pg iron/cell was ≈ 23/20.

Chapter 2. In-vitro MRI of MPIO labeled rMSCs 44
Figure 2.8: In-vitro MRI and Corresponding Optical Microscopy of MPIO-rMSCs. (A) MRI
from a single microwell showing signal voids in the presence of MPIO-rMSCs on a single plane.
(B) Phase contrast microscopy of the same microwell from A showing distribution of cells.
(C) Magnification of the region of interest from the MRI in A showing five signal voids in a
distinct pattern. (D) Phase contrast microscopy of the region of interest showing five cells in
the same distinctive pattern. (E) Epifluorescence microscopy showing five distinct regions of
MPIO particles fluorescing green which co-localize to the same distinctive pattern from both
the cells in D and the signal voids from C.

Chapter 2. In-vitro MRI of MPIO labeled rMSCs 45
The MPIO loading was found to be highly efficient and without serious adverse effects on
rMSCs based on assessment of viability, proliferation, metabolism and plating efficiency.
MPIOs have been used to label several different types of cells including glioma cells, T
cells, macrophages,hepatocytes and stem cells [23, 24, 29, 31, 88, 89, 90]. Furthermore,
single cell detection of MPIO labeled cells with in-vitro MRI has been previously demon-
strated [29, 30, 60, 83, 91, 92]. However, these studies used either specialized high field
MR systems or customized hardware such as gradient inserts or send/receive coils. This
is the first demonstration of single cell detection of MPIO labeled rMSCs using a clinical
3T MRI system, conventional SPGR imaging sequences and simple receive only surface
coils. The methodology developed in this work implements clinically translatable tools to
achieve sensitive detection of iron loaded stem cells and herein lies its greatest strength.
The other major contribution of this work lies in the characterization of MPIO particle
uptake and investigation of labelling localization and efficiency, metabolic effects, plating
efficiency and proliferation of MPIO-rMSCs. In this study loading levels of > 50 pg of
iron per cell were achieved, corresponding to > 100 MPIO particles within a single cell, as
quantified by colorimetric iron assay and qualitative observation by confocal fluorescence
microscopy. Others have achieved similar iron loading levels of 10-100 pg iron/cell or
more labelling various cell types with MPIOs including MSCs [30, 31, 93, 94]. The colo-
calization of green fluorescence and fluorescent cell marker DiI from confocal microscopy
(see Figure 2.1, panel C) in addition to the increased granularity and green fluorescence
as detected by flow cytometry (see Figure 2.3) strongly support that the MPIO particles
were localized intracellularly in perinuclear cytoplasmic organelles. The mechanism of
MPIO entry into MSCs by phagocytosis/endocytosis has been demonstrated previously
by transmission electron microscopy [29].
Cell labelling with MPIO was highly efficient and did not require the use of transfec-
tion agents to achieve high levels of iron loading, thus simplifying the labelling process
[21, 83, 95]. Analysis of MPIO-rMSCs by flow cytometry showed efficacious and non-

Chapter 2. In-vitro MRI of MPIO labeled rMSCs 46
toxic labelling of cells with approximately 94% survival rate post labeleling with 95% of
viable cells being labeled. Several reports in the literature show that cells appear to have
a high tolerance to MPIO particles with typical post labelling survival rates as high as
95% [24, 29] in agreement with our experience.
FACS analysis of MPIO-rMSCs maintained in culture post labelling showed loss of
intracellular MPIO over time (see Figure 2.4). The labeled proportion of MPIO-rMSCs
decreased to 78% at 120 hours from 89% at 24 hours (see Figure 2.3, Panel E). In
comparison, the labeled proportion of cells plated at low density was only 29% at 120
hours (see Figure 2.3, Panel E). These findings indicate that when labeled cells are
plated at high density and have limited room to proliferate the majority of cells retain
enough contrast agent to be considered labeled. Conversely, when labeled cells are plated
at lower density and are not limited in their proliferation, the amount of intracellular
contrast agent rapidly decreases, likely being divided between the daughter cells.
Alternatively, the loss of contrast could be due, in part, by cells actively ejecting the
contrast agent or apoptosis of labeled cells releasing the contrast agent into the culture
media. Free MPIO in the culture media could be ingested by other cells or deposited
into extracellular structures. This could be further investigated by analyzing the cul-
ture media for the presence of free MPIO particles. In addition, confocal microscopy of
MPIO labeled cells in culture at various time points additionally labeled with Bromod-
eoxyuridine (BrdU), labelling actively dividing cells, could be used to determine which
sub-populations of cells are actively dividing and to what extent these cells retain the
contrast agent. Similar observations from FACS analysis of MPIO labeled glioma cells
and monocytes/macrophages have been reported [29, 89]. The flow cytometry data sup-
ports the expectation of increased retention of intracellular contrast agent when cells are
not rapidly dividing.
While we have shown, like many others [29, 89] that the intracellular MPIO particles
do not seem to have any cytotoxic effects or cause any metabolic impairment we have also

Chapter 2. In-vitro MRI of MPIO labeled rMSCs 47
observed an impairment in the rate of proliferation of MPIO loaded rMSCs (see Figure
2.5) both by the MTT assay and in-vitro growth curve assay. While, MTT assays are
commonly used to determine effects on proliferation of iron loaded cells [29, 31, 3] it is
important to recognize that this assay is a measure of metabolism. Increased metabolism
could be due to increases in cell number or changes in cell metabolism while in culture.
Therefore, with an MTT assay it is not possible to preclude the possibility that some
cells may be dying and additional metabolism from other cells can mask this affect.
The results of the growth curve assay suggest that impaired proliferation is likely the
dominant effect.
The estimated doubling time for control-rMSCs and MPIO-rMSCs (≈ 54pg iron/cell)
was approximately 22 and 48 hours respectively. MPIO-rMSCs later regained a prolif-
erative doubling time of approximately 30 hours. The slower rate of proliferation might
be due, in part, to difficulty in reorganizing the organelles and cytoskeleton in the pres-
ence of > 100 micron sized particles when trying to divide. The observation that the
proliferation rate of the MPIO loaded cells increases at later time points may be due to
cells being able to divide rapidly once dilution of the intracellular contrast agent reaches
a certain level. A further investigation using live confocal microscopy of dividing cells
with and without MPIO loading would provide evidence to substantiate these claims.
The cell death assays used showed that the majority of labeled cells were viable in
culture. These idealized culture conditions will not be present once cells are delivered
in-vivo therefore this assessment of viability is somewhat limited. It may be beneficial
to compare the response of MPIO-rMSCs to controls rMSCs in a non-ideal environment
such as in-vitro conditions of ischemia or reduced nutrients. While it has also been
shown that MPIO particles do not affect the ability of MSCs to differentiate into chon-
drocytes, adipocytes and osteocytes [29], to fully determine the effect of intracellular
MPIO particles on cell function assessments of protein levels and gene expression would
be beneficial.

Chapter 2. In-vitro MRI of MPIO labeled rMSCs 48
In-vitro MRI revealed easily detectable signal voids against a homogeneous back-
ground that are attributed to aggregates of cells as well as single cells loaded with MPIO
particles. Using the gold standard of optical validation, individual cells can be attributed
to discrete signal voids. However, even in the idealized single plane phantom, a single
signal void may represent two or more cells in close proximity. Therefore, quantification
of cells present within signal voids on SPGR sequences is a formidable challenge.
Nevertheless, the signal void pattern observed in the single plane phantom was rep-
resentative of the planar distribution of cells within the slice (see Figures 2.7 and 2.8).
Distinct patterns of signal voids were also observed in the non-uniform cell dilution
phantoms as shown in Figure 2.6, panel B. Unlike the single plane phantoms, the cells
are distributed throughout the thickness of the imaging plane and multiple cells can
potentially occupy a single voxel. The ability to detect these patterns of signal voids
demonstrates the possibility of imaging the structural distribution of iron loaded cells
in-vivo within the context of surrounding anatomy.
In summary, detection of single MPIO-rMSCs has been achieved in-vitro with a clini-
cal MRI system. Cellular MPIO uptake was characterized as both efficient and non-toxic.
In addition, MPIO loading was found to produce no substantial negative biological effects
other than impaired rate of proliferation. The feasibility of applying this methodology
for detection of MPIO-rMSCs delivered in-vivo will be explored in Chapter 3.

Chapter 3
Feasibility of detecting MPIO
labeled rMSCs in-vivo
3.1 Introduction
Over the past few decades great progress has been made in the prevention, diagnosis and
treatment of stroke [96]. This progress was made possible in no small part by extensive
research using animal stroke models, which has deepened our understanding of the patho-
physiology behind cerebral ischemia, as well as the advancement of imaging techniques
to localize and determine the threat and extent of cerebral damage [97]. Despite these
improvements stroke is still associated with high mortality and morbidity and an effective
therapy is still desperately needed. Recently, there has been a plethora of experimental
therapeutics that have shown great promise in animal models, but ultimately fail to make
the transition from bench to bedside [96, 98, 99]. Identifying the contributing factors has
been the focus of considerable attention in the medical community, including the Stroke
Therapy Academic Industry Roundtable (STAIR) [100, 101, 102].
Many recommendations have been made by the STAIR committee to assist investi-
gators in the design of studies to develop novel stroke therapies from pre-clinical animal
49

Chapter 3. Detecting MPIO-rMSCs in-vivo 50
models to phase III clinical trials. Specifically, the STAIR-II committee suggests the
design of early clinical trials requires careful consideration of: therapy administration
route, dose range and duration, time from stroke onset to treatment, distribution to
proposed site of action and evidence of therapeutic activity by clinical and/or surrogate
markers. While these recommendations focus on the development of novel drug based
stroke therapies, the same guiding principles can be used to assist in the development
of stem cell based therapies now actively being investigated for the treatment of several
diseases including stroke [5, 18].
The delivery of exogenous stem cells is currently being investigated in animal mod-
els as a treatment for stroke. Mesenchymal stem cells (MSCs) are of particular interest
due to their ready availability from bone marrow. The initial use of MSCs focused on
applications in tissue engineering. However, the unanticipated observation that MSCs
produce a myriad of bioactive, immunosuppressive molecules capable of creating a re-
generative microenvironment in damaged adult tissues [16] has opened the possibility
of using MSCs to treat stroke. It has also been shown that MSCs can be influenced
to differentiate into neural cells in-vitro [17]. Therfore, MSCs could potentially provide
both neuroprotection and neuroseuplementation therapy in stroke. The potential mech-
anisms of action of these cells include: integration into host neuronal circuitry, reduced
death of host cells, host plasticity stimulation, increased neovascularization, attenuation
of inflammation and recruitment of endogenous progenitors [5].
Further motivation is provided by a recent review by Parr et al. [6] summarizing a
number of studies showing therapeutic benefit of mesenchymal stem cell (MSC) therapy
in small animal models of stroke. These studies have demonstrated functional recovery
post stroke with MSCs delivered via intravenous, intrarterial or intracerebral injection.
While intrarterial and intracerebral injections maximize the likelihood of MSCs reaching
the target tissue, they are also the most invasive methods of delivery and pose tangible
risks to the patient. Thus, an intravenous injection route is potentially the safest route

Chapter 3. Detecting MPIO-rMSCs in-vivo 51
of administration provided therapeutic benefit can be demonstrated [70, 71, 72, 74, 75,
76, 103]. A recent clinical trial intravenously injecting autologous MSCs into five stroke
patients has demonstrated safety and some degree of benefit up to a year post stroke
[104].
While the aforementioned studies have shown that MSCs can provide therapeutic
benefit in stroke within the rat animal model there is a general lack of understanding as to
their precise mechanism of action. Recalling the STAIR-II committee recommendations,
optimizing MSC therapy for stroke will require assessment of: administration route, dose
range and duration, time from stroke onset to treatment, distribution to proposed site
of action and evidence of therapeutic activity. Combining magnetic resonance imaging
(MRI), a well established modality for the clinical assessment of stroke, with the recent
innovations in MRI based cell tracking provides a powerful tool for the development of
MSC therapy for stroke.
MRI based imaging of iron labeled stem cell migration in the presence of stroke has
been previously reported by a number of groups [8, 78, 105]. Hoehn et al. demonstrated
the ability to track embryonic stem cells injected into the contralateral hemisphere and
were observed to migrate towards the stroke lesion [105]. Walczak et al. have very
recently reported the ability to track intrarterially injected MSCs persisting in the stroke
affected hemisphere [78]. While these studies used administration routes that are both
invasive and pose significant risks to the patient including additional stroke, they also
used high magnetic field specialized small animal MRI scanners. These factors will pose
a formidable challenge when considering transitioning to clinical trials. Therefore, one
aspect of our feasibility study is to translate the currently established methods of iron
labeled stem cell delivery and tracking to a minimally invasive and more clinically relevant
context.
The other aspect of this feasibility study is to explore the limitations of established
methodology for detecting iron-loaded cells in the presence of stroke. Several studies ex-

Chapter 3. Detecting MPIO-rMSCs in-vivo 52
ploring cell tracking with MRI use combinations of labeling cells with fluorescent tracking
molecules combined with MR contrast agents [24, 23, 78, 56]. Once contrast on MRI can
be colocalized with fluorescence it is often concluded that cell tracking has been achieved.
Recent studies have shown that transplanted MSCs labeled with fluorescent tracking dyes
transfer those dyes to host cells after rejection and were detected up to 12 weeks post
implantation [106]. In addition, it has been shown that iron oxide labelled cells cannot
be differentiated from hemorrhage in the myocardium [107]. Macrophages can also be
labelled with iron-oxide in-vivo and subsequently detected with MRI [108, 109, 110].
In Chapter 2, we presented the ability to harvest, grow and label rat bone marrow
derived mesenchymal stromal cells (rMSCs, a cell population containing mesenchymal
stem cells) with micron sized superparamagentic iron oxide particles (MPIO) without
significant negative biological effects aside from decreased proliferation. We then demon-
strated the ability to detect these MPIO-rMSCs in-vitro using a clinical MRI system
with conventional imaging sequences. In the present chapter we report our initial ex-
perience testing the feasibility of detecting intravenously injected MPIO-rMSCs at the
site of injury in a rat stroke model of permanent focal devascularization using a clinical
MRI system. Specifically, we will compare whether the injection of MPIO-rMSCs can be
differentiated from injection of free MPIO particles.
3.2 Methods
3.2.1 Experimental Design
The study design was as follows. Each animal received a baseline MRI session prior to the
stroke procedure performed on Day 0. A post stroke MRI session was performed on Day
1. On Day 3 each animal received an intravenous injection according to the treatment
group. The treatment groups were: unlabeled rMSCs (n=2), DiI labeled rMSCs (n=2),
MPIO labeled rMSCs (n=2), DiI and MPIO labeled rMSCs (n=2) and MPIO alone in

Chapter 3. Detecting MPIO-rMSCs in-vivo 53
Figure 3.1: Timeline for longitudinal study.
PBS (n=3). Two more MRI sessions were performed on Day 7 and 14. On Day 15 animals
were sacrificed, organs of interest were removed and histopathology was performed. The
experimental time line is summarized in Figure 3.1.
3.2.2 Stroke Model
Male Long Evans rats (n=11) 60-90 days post gestation at the start of the experiment
were used as subjects. Animals were housed and maintained in the Sunnybrook Research
Vivarium according to the regulations set forth by the Canadian Council on Animal Care.
On the day of stroke (defined as Day 0) surgery animals were deeply anesthetized with
isofluorane and given ketoprofen for analgesia. Following the methodology of Kolb et
al. [14] a rectangular hole was drilled into the frontal and parietal bones over the right
hemisphere running +3/− 4 mm (anterior/posterior) to Bregma and 1.5/4.5 mm lateral
to midline. Once the dura was removed, the pia and cortical surface were detached of
the supplying vaculature by mechanically rubbing the surface with sterile, saline soaked
cotton swabs. The model of focal, permanent devascularization (stroke) is described in
more detail elsewhere [111]. The rectangular hole in the skull was closed using bone
wax secured with contact cement. The animals were monitored post surgery for any
complications and returned to group housing after 24 hours.

Chapter 3. Detecting MPIO-rMSCs in-vivo 54
3.2.3 rMSC Preparation and Delivery
Cells were harvested, grown and labeled with MPIO particles to achieve ≈ 54 pg iron/cell
as described in the methods of Chapter 2. Cells were additionally labeled with DiI
(Molecular Probes, Invitrogen, V-22889), filtered into a cell strainer flow cytometry tube
(BD Bioscience,352235) and kept on ice prior to injection. Cells were resuspended by
vortexing prior to loading into a 1 mL syringe (BD Bioscience, 309628). Animals were
treated three days post stroke with either: ≈ 3 × 10⁶ MPIO loaded rMSCs (≈ 54 pg
iron/cell), ≈ 3× 10⁶ rMSCs without MPIO or MPIO suspended in sterile PBS (≈ 160µg
iron). Injections were performed via an intravenous 24 gauge catheter inserted in the tail
vein. The total injected volume for each animal did not exceed 0.7 mL.
3.2.4 Longitudinal MRI Studies
Serial MR imaging sessions were performed on each animal while anesthetized with isoflu-
orane and monitored via pulse oximetry, each session lasting not longer than 2 hours.
Each scanning session consisted of a FSE with two echo times (proton weighted and T2
weighted), T∗2 weighted SPGR and a modified SPGR for susceptibility weighted imaging
(SWI). Imaging was performed on day −7 , day +1, day +7 and day +14. Scanning
parameters are summarized in Table 3.1.
3.2.5 Histopathology and Correlative Microscopy
Animal Sacrifice and Tissue Perfusion
At the study conclusion animals were sacrificed by lethal dose of sodium pentobarbitol
intraperitoneal injection followed by transcardial perfusion with 100 mL of sterile PBS
followed by 100 mL of 4% Paraformaldhyde (PFA) in PBS. The brain and spleen were
removed and stored overnight in 4%PFA-PBS. The following day tissue samples were
placed into 20% sucrose-4%PFA-PBS and stored at 2-4◦C until the tissues sank in the

Chapter 3. Detecting MPIO-rMSCs in-vivo 55
Table 3.1: MRI Parameters
Sequence 3DSPGR FSE SWI
Flip Angle 20o 90o 20o
Matrix 256 × 256 256 × 256 512 × 256
TR 25 ms 4500 ms 43 ms
TE 7 ms 35 & 75 ms 25 ms
NEX 4 4 2
FOV 40 × 40 × 20 mm 40 × 40 × 17 mm 80 × 40 × 28 mm
Slice Thickness 1 mm 1 mm 1 mm
Voxel Dimensions 160 × 160 × 1000 µm 160 × 160 × 1000 µm 160 × 160 × 1000 µm
Scan Time ≈ 12 mins ≈ 26 mins ≈ 9 mins
fluid. The tissues were then stored in 20% sucrose PBS at 2-4◦C prior to sectioning.
Cryosectioning, Immunohistochemistry and Histological Staining
Sectioning was performed on a Leica Cryostat CM 3050S. Samples were frozen and
mounted using OCT (Tissue-Tex, Indiana, USA) and sectioned at 10 µm. Sectioned
samples were mounted onto microscope slides (VWR, 48311-703) and stored at −20oC
prior to staining. Primary antibodies for staining microglia and macrophages were un-
conjugated CD11b/c (OX42 equivalent) primary mouse anti-rat antibody, 1/200 dilution
(Abcam, 1211) and unconjugated CD68 (ED1 equivalent) antibody 1/100 (AbD Serotec,
MCA341R).
Fluorescent secondary staining of the primary antibody was performed using a Cy5
(649 nm excitation, 670 nm emission) conjugated IgG goat anti-mouse secondary anti-
body 1/500 dilution (Jackson ImmunoResearch, 115-175-003). Prussian blue (PB) stain-
ing was performed for detection of ferric iron through treatment with hydrochloric acid
and potassium ferrocyanide which produced a bright blue pigment visible with bright
field and appears black with Nomarski optics (differential interference contrast, DIC).

Chapter 3. Detecting MPIO-rMSCs in-vivo 56
Finally, a fluorescent nuclear stain was performed using 4’,6-diamidino-2-phenylindole
dihydrochloride (DAPI) at 1/50, 000 dilution in PBS (Sigma,D9542). Once staining was
completed slides were mounted with coverslips using an aqueous fluorescent mounting
medium (Fluorsave,Calbiochem).
Multi-channel epifluorescent microscopy was performed using a Zeiss Axiovert 200M.
A multi-channel acquisition was acquired to simultaneously image each section for Prus-
sian blue staining (black on Nomarski), DAPI nuclear stain (blue) and Cy5 labeled
CD11b/c or CD68.
3.3 Results
3.3.1 Longitudinal MRI
Longitudinal MRI scanning sessions provide temporal monitoring over the course of the
study. Figure 3.2 summarizes SPGR imaging sequences for representative animals from
each treatment group. Substantial negative contrast is observed within and surrounding
the ischemic region on day 7 following treatment on day 3 in the MPIO-rMSCs and
MPIO alone treated groups when compared with the animal treated with rMSCs-alone.
The negative contrast observed on day 7 persists and increases at day 14 in the same
MPIO-rMSCs and MPIO alone treated groups.
3.3.2 MRI Sequence Comparison
The different tissue contrast provided by each of the MRI sequences is shown in Figure
3.3. The same representative animals from each treatment group and image slices shown
in Figure 3.2 from day 14 are shown in conjunction with the FSE and SWI images of the
same slices. The SWI images show the most negative contrast within the ischemic region,
followed by the SPGR images. In animals treated with MPIO-rMSCs and MPIO alone,
proton and T2 weighted images from the FSE show delineation between areas of negative

Chapter 3. Detecting MPIO-rMSCs in-vivo 57
Figure 3.2: Longitudinal MRI showing images acquired with 3DSPGR for representative an-
imals from each treatment group. Following treatment on day 3, MPIO-rMSCs and MPIO
alone animals show negative contrast appearing within and surrounding the ischemic region
when compared to rMSCs-alone on day 7. Negative contrast persists and increases in these
animals at day 14.

Chapter 3. Detecting MPIO-rMSCs in-vivo 58
contrast and hyperintensities within the ischemic region. Conversely, animals receiving
rMSCs-alone only showed hyperintensities within the ischemic region. The FSE images
also provide sufficient contrast to identify anatomical structures such as the ventricles
and corpus collusum.
3.3.3 MRI and Histopathology
Histopathology revealed the extent and composition of the tissue within and surrounding
the ischemic region. In Figure 3.4 MRI of the lesion site from the sequences summarized
in Figure 3.3 is compared with bright field microscopy of histological sections. Anatom-
ical structure is represented by proton and T2 weighted images, with hyperintensities
corresponding to areas of lost tissue replaced by fluid visible on histology. In the ani-
mals treated with rMSCs-alone, little negative contrast is present in T2,T∗2 and proton
weighted images. The SWI image from the same animal contains an area of negative
contrast at the outer surface of the brain toward the lesion edge that tested positive for
cells containing ferric iron on Prussian Blue (PB) staining. No positive PB staining was
detected in the lesion periphery in the animals treated with rMSCs-alone.
In both MPIO-rMSCs and MPIO alone groups, negative contrast and positive PB
staining is present in the area containing the lesion and in the lesion periphery close to
the ventricle and corpus collosum. Negative contrast is most pronounced in SWI and T∗2
weighted images but also present on proton and T2 weighted images. Qualitative compar-
ison of the areas of negative contrast on MRI to the PB staining pattern reveals negative
contrast on T2 and proton weighted images is more specific to areas with positive PB
staining. High magnification epifluorescence microscopy shows PB positive areas (black
on Nomarski) closely associated with cell nuclei (bright blue) in all treatment groups
(see bottom of Figure 3.4). Immunohistochemistry staining for cell markers expressed on
microglia and macrophages (CD11b/c,CD68) showed the majority of iron positive cells
are CD68 positive in both the lesion site and periphery in Figure 3.5.

Chapter 3. Detecting MPIO-rMSCs in-vivo 59
Figure 3.3: Comparison of MRI imaging sequence contrast on day 14. SPGR, SWI and FSE
images for the same slice within representative animals from each treatment group. SWI im-
ages provide the most negative contrast within the ischemic region of the MPIO-rMSCs and
MPIO-alone treated animals followed by SPGR. Proton and T2 weighted images show delin-
eation between areas of negative contrast and hyperintensities within the ischemic region of
MPIO-rMSCs and MPIO-alone treated animals. Conversely, animals receiving rMSCs-alone
only showed hyperintensities within the ischemic region. FSE images reveal anatomical struc-
tures such as the ventricles and corpus collusum.

Chapter 3. Detecting MPIO-rMSCs in-vivo 60
Figure 3.4: MRI of lesion site for representative animals from rMSCs-alone, MPIO-rMSCs and
MPIO-alone treatment groups with corresponding histology. Areas of negative contrast on MR
images show Prussian Blue positive staining for the presence of iron. DAPI staining reveals
location of cell nuclei relative to iron deposits (black on Nomarski).

Chapter 3. Detecting MPIO-rMSCs in-vivo 61
Figure 3.5: Immunohistochemistry and fluorescent microscopy of iron containing cells in the
lesion site and periphery. Prussian Blue positive staining for the presence of iron appears black
on Nomarski optics. DAPI staining in blue reveals location of cell nuclei relative to black
iron deposits. Staining for microglia and macrophages (CD11b/c,CD68) in cyan and fuscia
respectively. Scale bars represent 30 µm.

Chapter 3. Detecting MPIO-rMSCs in-vivo 62
3.4 Discussion
This chapter presents, to our knowledge, the first report of a comparison between intra-
venous delivery of MPIO-rMSCs and free MPIO particles showing similar detection of
negative contrast on MRI due to the presence of iron in the periphery of a stroke lesion
with a clinical MRI system and conventional imaging sequences. These results raise into
question the ability to detect the intravenous delivery of iron labeled cells in the presence
of stroke unambiguously.
This detection was achieved by using MR sequences sensitive to the presence of MPIO
by means of localized changes in T2,T∗2 and susceptibility. Our initial experience suggests
that this mechanism is independent of whether the MPIO is delivered alone or contained
within rMSCs. However, evidence of partial tissue regeneration in the stroke lesion
was only observed in animals receiving MPIO-rMSCs and rMSCs. Histology confirmed
the presence of iron and suggests the iron is localized within cells. While others have
previously shown the ability to detect the delivery and migration of iron oxide within
stem cells using MRI in the presence of stroke, these studies have used more invasive
intrarterial and intracerbral injection methods and specialized high field experimental
MRI systems [78, 105]. We have demonstrated non invasive monitoring and detectable
changes in response to an intravenous injection with a clinical field strength MRI system
without specialized hardware. Our methodology provides a clinically relevant tool for
further investigation of stem cell therapy for stroke.
These observations raise a number of questions for further consideration. Iron con-
taining cells were found within the stroke lesion of all treatment groups including the
rMSCs-alone treated group although to a much lesser extent. These endogenous iron de-
posits could be due to hemosiderin resulting from digestion of damaged blood cells and
hemorrhage within the stroke [112]. It has already been shown that hemorrhage within
myocardial infarction can interfere with tracking iron oxide labeled cells [107]. Although
others have demonstrated that MPIO injected directly into infarcted myocardium is

Chapter 3. Detecting MPIO-rMSCs in-vivo 63
rapidly cleared and does not persist [3], our observations suggest the delivery route and
target site may also play a role in retention of MPIO.
In the MPIO-rMSCs and MPIO-alone animals PB staining in the stroke lesion was
much stronger than in the rMSCs-alone animals suggesting at least part of the iron
detected was from the exogenously delivered MPIO. The possibility exists that MPIO-
rMSCs released their MPIO contents through cell lysis caused by damage upon injection
due to shear forces or cell death post injection. It is estimated that the vast majority
(> 95%) of intravenously injected cells become trapped in the lungs, liver and spleen
and the released MPIO is likely taken up by the reticuloendothelial system [65]. Despite
the limited survival of these cells, studies have shown that small numbers of MSCs can
cross the blood brain barrier and localize to the stroke lesion after intravenous injection
[5, 113].
The iron containing cells in the surrounding tissue within the stroke lesion also exhibit
significant autofluorescence in the green and red channels occupied by DiI and MPIO flu-
orescence. This autofluorescence combined with edge effects (autofluorescent scar tissue
boundaries) confound the ability to identify the source of the iron unambiguously by
means of fluorescence of MPIO and DiI alone. Transmission electron microscopy may be
able to determine what extent of this intracellular iron is MPIO more conclusively based
on the large particle size (≈ 0.9µm).
While the iron we observe appears to be cellular given the close proximity to cell
nuclei, it is not clear as to which cells are now labelled with iron. In the MPIO-rMSCs
and MPIO-alone animals iron containing cells were also detected in the periphery of the
stroke lesion close to small vessels along the corpus collosum and near the ventricle. Given
the similar morphology and distribution of these cells in both treatment groups, these
cells could potentially be macrophages/microglia that have ingested MPIOs released into
the vasculature and have subsequently started to migrate toward the stroke. Immuno-
histochemical staining showed that the majority of iron positive cells were CD68 positive

Chapter 3. Detecting MPIO-rMSCs in-vivo 64
which supports this claim. Furthermore, several groups have reported the ability to label
macrophages in-vivo with iron oxide [90, 114, 108, 115, 116, 117].
The majority of iron positive cells were also positive for CD68, however, there were
also a few iron positive cells that were CD68 negative. Therefore, we cannot conclude
whether some of the iron containing cells in the stroke lesion are in fact MPIO-rMSCs at
present and this is one of the major limitations of this study. Further limitations include
limited numbers of animals in each treatment group (n=3 or 4 per group) and lack of
a cell specific marker that demonstrates viability for the injected cells. This limitation
can be circumvented through the use of bone marrow from an animal expressing green
fluorescent protein (GFP) in all cells similar to Coyne et al. [106]. This would allow
detection of viable cells arriving at the lesion site and could be combined with staining
for other phenotypic markers to provide insight into transplanted cell fate. One study
found 4% of intravenously injected MSCs in the brain with 60% of these cells in the
ischemic boundary zone on day 14 post stroke [103]. Phenotypically, less than 5% of the
MSCs found in the brain expressed some neuronal and angiogenic markers [103].
Many studies using iron oxide and fluorescent dyes to label cells for detection with
MRI and optical validation have relied upon PB staining combined with fluorescence
microscopy to verify the presence of transplanted cells [3, 23, 24, 78]. Our observations
suggest that these methods of histology are insufficient to conclusively determine the
identity of iron containing cells when studying areas of ischemia, hemorrhage and necrosis
such as stroke. Furthermore, it has also been shown that stem cells transplanted into
a normal rat brain were rejected by an inflammatory response and transferred their
fluorescent labels to host neurons and glia [106].
Therefore, one must exercise caution in the interpretation of PB staining and flu-
orescence as verification of the presence of transplanted cells, especially in the brain.
These iron containing cells may simply be phagocytic cells such as macrophages/microglia
which have typically been ruled out or confirmed fairly easily with immunohistochemistry

Chapter 3. Detecting MPIO-rMSCs in-vivo 65
(IHC). Some studies now suggest that in the pathologic brain, such as that post-stroke,
markers such as CD11b/c and CD68 may not be entirely specific for macrophages/microglia
further complicating the issue [118]. This finding calls into question the interpretation of
similar staining to identify macrophages/microglia which is commonly practiced in the
field of iron based MRI cell tracking.
Unfortunately, most stem cells can only be uniquely characterized by a panel of cell
differentiation (CD) markers which is a formidable task in IHC of tissue sections. A
highly specific test for the presence of transplanted cells is clearly needed. Consequently,
many groups have started to investigate MR reporter genes that will allow detection with
non-invasive imaging which implies viability and unambiguous detection of transplanted
cells at the time of sacrifice [52].
Interestingly, only some of the animals treated with rMSCs showed some evidence of
what might be tissue regeneration. The best evidence of this was observed in the MPIO-
rMSCs treated animal showed in Figure 3.4. None of the MPIO-alone treated animals
showed similar evidence of tissue regrowth. The timing of treatment delivery is likely a
contributing factor and will need to be further investigated. The ideal treatment window
for MSC therapy may be after the acute phase of ischemia has subsided. A preliminary
experiment where MPIO-rMSCs were injected at two weeks post stroke resulted in the
most tissue regeneration of all treated animals to date. Shen et al. [72] found that
functional recovery can occur when delivering MSCs as long as 1 month after the initial
stroke episode. The time of sacrifice chosen for this study may have also been premature,
as the lesion site was still evolving from day 7 on day 14. Further studies varying the
timing of treatment and allowing more time for recovery and observation will be necessary
in order to fully assess this treatment strategy. Behavioural tests for functional recovery
should also be added to complement the assessment of tissue loss and regrowth from MRI
and histology.
The feasibility of detecting groups of iron containing cells within our current stroke

Chapter 3. Detecting MPIO-rMSCs in-vivo 66
model and imaging methods has been established. However, our results have shown that
intravenous delivery of MPIO-rMSCs cannot be differentiated from the injection of MPIO
alone in our current stroke model. Furthermore, this study underlines several sources of
ambiguity within investigations of MR based cell tracking in the presence of stroke. As
strategies to overcome some of the current limitations of iron oxide based cell labelling
and tracking are further developed we will be able to understand the mechanisms at play
more clearly.

Chapter 4
Thesis Summary and Conclusion
4.1 Thesis Summary
Chapter 2 demonstrated the ability to detect single MPIO labeled rMSCs in-vitro using
a clinical MRI system. The uptake of MPIO particles was characterized and the effects
of MPIO labeling on viability, proliferation and plating efficiency were determined. High
levels of iron loading were observed to significantly decrease the rate of proliferation
of MPIO-rMSCs in culture. Chapter 3 tested the feasibility and identified some of the
limitations of applying the methodology developed in chapter 2 toward detection of intra-
venously delivered MPIO labeled rMSCs in-vivo in a rat stroke model with longitudinal
monitoring using MRI.
4.2 Conclusion
The principle goal of this work was to translate the current tools for labeling and imag-
ing stem cells used with specialized hardware and experimental MRI systems to a more
clinically relevant setting. Specifically, a population of rat marrow derived mesenchy-
mal stromal cells (rMSCs) were effectively labeled with micron sized iron oxide particles
(MPIOs) and detected in-vitro with a 3 Tesla clinical MRI system with standard sur-
67

Chapter 4. Thesis Summary and Conclusion 68
face coils and conventional imaging sequences. Therefore, this goal has been effectively
achieved and in-vitro detection of single cells has been confirmed.
The results of in-vivo studies have demonstrated that detection of iron containing
cells accumulating within the stroke lesion and periphery is possible using our current
methodology but remains ambiguous. While the majority of iron containing cells are
CD68 positive suggesting these cells may be macrophages/microglia, the recent findings
that CD68 may not be entirely specific to macrophages/microglia in the post-stroke
environment [118] further complicates identification of these cells. Therefore, despite our
best efforts we cannot claim the identity of these iron containing cells with certainty.
Clearly, there is a need for more specific detection methods such as the use of reporter
genes [52].
The first conclusion to be drawn is one of caution when interpreting signal voids on
MRI when using an iron based cellular contrast in the treatment of damaged tissues where
confounding factors such as immune cells are active and hemorrhage could be present.
The same consideration needs to be taken toward histological analysis of the correspond-
ing tissue specimens of interest where endogenous iron deposits, autofluorescence and
transfer of fluorescent labels to host cells need to be accounted for.
The agreement between the pattern of signal voids on MRI and histological staining
for iron demonstrate that it is possible to obtain information regarding the evolving
gross distribution of iron labelled cells within the context of the surrounding anatomy
providing insight into cell behaviour and migration. However, further studies addressing
the limitations of these methods is necessary prior to investigation of potential clinical
applications.

Bibliography
[1] E. H. Javazon, D. C. Colter, E. J. Schwarz, and D. J. Prockop. Rat marrow stromal
cells are more sensitive to plating density and expand more rapidly from single-
cell-derived colonies than human marrow stromal cells. Stem cells, 19:219–225,
2001.
[2] E. Hathout, L. Sowers, R. Wang, A. Tan, J. Mace, R. Peverini, R. Chinnock,
and A. Obenaus. In vivo magnetic resonance imaging of vascularization in islet
transplantation. Transplant International, 20:1059–1065, 2007.
[3] Jonathan M Hill, Alexander J Dick, Venkatesh K Raman, Richard B Thompson,
Zu-Xi Yu, K. Allison Hinds, Breno S S Pessanha, Michael A Guttman, Timothy R
Varney, Bradley J Martin, Cynthia E Dunbar, Elliot R McVeigh, and Robert J
Lederman. Serial cardiac magnetic resonance imaging of injected mesenchymal
stem cells. Circulation, 108(8):1009–1014, Aug 2003.
[4] Nathan Himes, Jian-Yong Min, Rebecca Lee, Courtney Brown, Jessica Shea, Xuling
Huang, Yong-Fu Xiao, James P. Morgan, Deborah Burstein, and Peter Oettgen.
In vivo mri of embryonic stem cells in a mouse model of myocardial infarction.
Magnetic Resonance in Medicine, 52(5):1214–1219, 11 2004.
[5] Rike Zietlow, Emma L Lane, Stephen B Dunnett, and Anne E Rosser. Human
stem cells for cns repair. Cell Tissue Res, 331(1):301–322, Jan 2008.
69

Bibliography 70
[6] A. M. Parr, C. H. Tator, and A. Keating. Bone marrow-derived mesenchymal
stromal cells for the repair of central nervous system injury. Bone marrow trans-
plantation, 40:609–619, 2007.
[7] L. S. Politi. Mr-based imaging of neural stem cells. Neuroradiology, 49:523–534,
2007.
[8] E. Sykova and P. Jendelova. Migration, fate and in vivo imaging of adult stem cells
in the cns. Cell death and differentiation, 14:1336–1342, 2007.
[9] A. Farahvar, B. Blits, H. M. Bramlett, E. J. Green, P. Tsoulfas, and W. D. Dietrich.
Transplantation of embryonic neuronal stem cells transfected by lentiviral vector
to express novel multineurotrophin protein after traumatic brain injury injury in
rats. Journal of neurotrauma, 21:1309–1309, 2004.
[10] Pierre-Marie Lledo and Gilles Gheusi. Adult neurogenesis: from basic research to
clinical applications. Bulletin de l’Academie nationale de medecine, 190(2):385–400,
Feb 2006.
[11] R. M. Richardson, H. L. Fillmore, K. L. Holloway, and W. C. Broaddus. Progress in
cerebral transplantation of expanded neuronal stem cells. Journal of neurosurgery,
100(4):659–671, 2004.
[12] Tokuhisa Shindo, Yoshihito Matsumoto, Qinghua Wang, Nobuyuki Kawai, Takashi
Tamiya, and Seigo Nagao. Differences in the neuronal stem cells survival, neuronal
differentiation and neurological improvement after transplantation of neural stem
cells between mild and severe experimental traumatic brain injury. Journal of
Medical Investigation, 53(1-2):42–51, Feb 2006.
[13] D. Joshi and M. Behari. Neuronal stem cells. Neurology India, 51(3):323–328, 2003.

Bibliography 71
[14] Bryan Kolb, Cindi Morshead, Claudia Gonzalez, Mina Kim, Christopher Gregg,
Tetsuro Shingo, and Samuel Weiss. Growth factor-stimulated generation of new
cortical tissue and functional recovery after stroke damage to the motor cortex of
rats. J Cereb Blood Flow Metab, 27(5):983–997, May 2007.
[15] M. Chopp, Y. Li, and J. Zhang. Plasticity and remodeling of brain. Journal of the
neurological sciences, 265(1-2):97–101, 2008.
[16] A. I. Caplan. Adult mesenchymal stem cells for tissue engineering versus regener-
ative medicine. Journal of cellular physiology, 213(2):341–347, 2007.
[17] Zhao Lei, Lin Yongda, Ma Jun, Sun Yingyu, Zeng Shaoju, Zhang Xinwen, and
Zuo Mingxue. Culture and neural differentiation of rat bone marrow mesenchymal
stem cells in vitro. Cell.biology international, 31(9):916–923, Sep 2007.
[18] K. Ozawa, K. Sato, I. Oh, K. Ozaki, R. Uchibori, Y. Obara, Y. Kikuchi, T. Ito,
T. Okada, M. Urabe, H. Mizukami, and A. Kume. Cell and gene therapy using
mesenchymal stem cells (mscs). Journal of Autoimmunity, 30(3):121–127, May
2008.
[19] B. B. Chin, Y. Nakamoto, J. W. M. Bulte, M. F. Pittenger, R. Wahl, and
D. L. Kraitchman. 111in oxine labelled mesenchymal stem cell spect after intra-
venous administration in myocardial infarction. Nuclear medicine communications,
24(11):1149–1154, Nov 2003.
[20] Feng Cao, Shuan Lin, Xiaoyan Xie, Pritha Ray, Manishkumar Patel, Xianzhong
Zhang, Micha Drukker, Scott J. Dylla, Andrew J. Connolly, Xiaoyuan Chen, Irv-
ing L. Weissman, Sanjiv S. Gambhir, and Joseph C. Wu. In vivo visualization of
embryonic stem cell survival, proliferation, and migration after cardiac delivery.
Circulation, 113(7):1005–1014, Feb 21 2006.

Bibliography 72
[21] D. L. Kraitchman and J. W. M. Bulte. Imaging of stem cells using mri. Basic
research in cardiology, 103(2):105–113, 2008.
[22] Ali S. Arbab and Joseph A. Frank. Cellular mri and its role in stem cell therapy.
Regenerative medicine, 3(2):199–215, Mar 2008.
[23] C. Heyn, J. A. Ronald, S. S. Ramadan, J. A. Snir, A. M. Barry, L. T. MacKenzie,
D. J. Mikulis, D. Palmieri, J. L. Bronder, P. S. Steeg, T. Yoneda, I. C. MacDonald,
A. F. Chambers, B. K. Rutt, and P. J. Foster. In vivo mri of cancer cell fate at the
single-cell level in a mouse model of breast cancer metastasis to the brain. Magnetic
Resonance in Medicine, 56(5):1001–1010, 2006.
[24] Erik M. Shapiro, Kathryn Sharer, Stanko Skrtic, and Alan P. Koretsky. In vivo
detection of single cells by mri. Magnetic Resonance in Medicine, 55(2):242–249,
Feb 2006.
[25] R. C. Addis, J. W. M. Bulte, and J. D. Gearhart. Special cells, special considera-
tions: The challenges of bringing embryonic stem cells from the laboratory to the
clinic. Clinical Pharmacology & Therapeutics, 83(3):386–389, 2008.
[26] J. V. Frangioni and R. J. Hajjar. In vivo tracking of stem cells for clinical trials in
cardiovascular disease. Circulation, 110(21):3378–3383, 2004.
[27] D. L. Kraitchman and J. W. M. Bulte. Imaging of stem cells using mri. Basic
research in cardiology, 103(2):105–113, 2008.
[28] Daniel L. J. Thorek, Antony K. Chen, Julie Czupryna, and Andrew Tsourkas.
Superparamagnetic iron oxide nanoparticle probes for molecular imaging. Annals
of Biomedical Engineering, 34(1):23–38, January 2006 2006.
[29] Kathleen A. Hinds, Jonathan M. Hill, Erik M. Shapiro, Mikko O. Laukkanen,
Alfonso C. Silva, Christian A. Combs, Timothy R. Varney, Robert S. Balaban,

Bibliography 73
Alan P. Koretsky, and Cynthia E. Dunbar. Highly efficient endosomal labeling of
progenitor and stem cells with large magnetic particles allows magnetic resonance
imaging of single cells. Blood, 102(3):867–872, Aug 1 2003.
[30] Erik M. Shapiro, Stanko Skrtic, and Alan P. Koretsky. Sizing it up: Cellular mri us-
ing micron-sized iron oxide particles. Magnetic Resonance in Medicine, 53(2):329–
338, 2 2005.
[31] Lisa M. Bernas, Paula J. Foster, and Brian K. Rutt. Magnetic resonance imaging
of in vitro glioma cell invasion. Journal of neurosurgery, 106(2):306–313, Feb 2007.
[32] Zhi-Pei Liang. Principles of magnetic resonance imaging : a signal processing
perspective. IEEE Press, New York, 2000.
[33] E. Mark Haacke, Robert F. Brown, Michael Thompson, and Ramesh Venkatesan.
Magnetic resonance imaging: physical principles and sequence design. New York ;
J. Wiley & Sons, c1999., 1999.
[34] Catherine Westbrook, Carolyn Roth, and John Michael Talbot. MRI In Practice.
Blackwell Publishers, 2005.
[35] Ray H. Hashemi and William Bradley. MRI: the basics. Baltimore : Williams &
Wilkins, 1997.
[36] Matt A. Bernstein, Ziaohong Joe Zhou, Kevin King, and Xiaohong Joe Zhou.
Handbook of MRI pulse sequences. Burlington, MA : Elsevier Academic Press,
2004.
[37] Y. Jamin, S. Reynolds, L. Smyth, C. Gabellieri, S. Robinson, C. Springer, M. Leach,
G. Payne, and T. Eykyn. Imaging cancer gene therapy using 13c hyperpolarised
mr technology. In Proceedings 16th Scientific Meeting, International Society for
Magnetic Resonance in Medicine, Toronto, page 893, 2008.

Bibliography 74
[38] F. Gallagher, M. Kettunen, S. Day, D. Hu, R. in t Zandt, P. Jensen, M. Karlsson,
K. Golman, M. Lerche, and K. Brindle. Imaging ph in vivo using hyperpolar-
ized 13c-labeled bicarbonate. In Proceedings 16th Scientific Meeting, International
Society for Magnetic Resonance in Medicine, Toronto, page 889, 2008.
[39] P. van Eijsden, J. van der Zijden, R. de Graaf, and R. Dijkhuizen. in vivo 1h/13c
mrsi of changes in neurotransmitter metabolism in rats recovering from stroke. In
Proceedings 16th Scientific Meeting, International Society for Magnetic Resonance
in Medicine, Toronto, page 3292, 2008.
[40] J. Wijnen, D. Klomp, A. Idema, B. Galan, and A. Heerschap. Lactate production
in human brain tumor; detection by 13c mrs at 3t. In Proceedings 16th Scientific
Meeting, International Society for Magnetic Resonance in Medicine, Toronto, page
2815, 2008.
[41] S. Mulla-Osman, H. Goetze, U. Bommerich, and J. Bernarding. 19f nmr molecular
imaging: Cell labeling with emulsified perfluoro-15-crown-5-ether. In Proceedings
16th Scientific Meeting, International Society for Magnetic Resonance in Medicine,
Toronto, page 3237, 2008.
[42] R. Southworth, J. Chen, L. Zhang, M. Kaneda, H. Zhang, and S. Wickline. 19f mag-
netic resonance imaging of increased vcam-1 expression in the kidneys of apoe-null
mice using targeted perfluorocarbon nanoparticles. In Proceedings 16th Scientific
Meeting, International Society for Magnetic Resonance in Medicine, Toronto, page
3203, 2008.
[43] B. Jordan, G. Cron, and B. Gallez. Rapid monitoring of oxygenation by 19f mag-
netic resonance imaging : simultaneous comparison with fluorescence quenching. In
Proceedings 16th Scientific Meeting, International Society for Magnetic Resonance
in Medicine, Toronto, page 2809, 2008.

Bibliography 75
[44] D. von Elverfeldt, P. Emerich, J. Weigel, D. Paul, D. Steinmann, M. Schneider,
H. Runck, C. Stahl, J. Guttmann, and J. Leupold. Ssfp based high resolution 19f
imaging of the rat lung ex vivo with fc84. In Proceedings 16th Scientific Meeting,
International Society for Magnetic Resonance in Medicine, Toronto, page 2642,
2008.
[45] J. Keupp, J. Rahmer, E. Waters, S. Caruthers, G. Lanza, and S. Wickline. In
vivo quantification of 19f molecluar imaging agents with improved accuracy and
sensitivity using motion correcting, simultaneous 19f/1h radial mri. In Proceedings
16th Scientific Meeting, International Society for Magnetic Resonance in Medicine,
Toronto, page 17, 2008.
[46] G. Madelin, N. Oesingmann, G. Johnson, S. Nielles-Vallespin, B. Stoeckel, E. Bar-
beri, R. Pinkerton, D. Sodickson, R. Grossman, and M. Inglese. 7 tesla sodium mri
of patients with multiple sclerosis: A preliminary study. In Proceedings 16th Scien-
tific Meeting, International Society for Magnetic Resonance in Medicine, Toronto,
page 511, 2008.
[47] P. Hopewell and N. Bansal. Evaluation of acute hepatic ischemia in rats using 23na
and 1h diffusion-weighted mri. In Proceedings 16th Scientific Meeting, International
Society for Magnetic Resonance in Medicine, Toronto, page 499, 2008.
[48] A. Babsky, S. Topper, S. Ju, S. Bennett, G. McLennan, and N. Bansal. Moni-
toring of the hepatocellular carcinoma growth by 1h and 23na mri. In Proceedings
16th Scientific Meeting, International Society for Magnetic Resonance in Medicine,
Toronto, page 3817, 2008.
[49] Y. Qian, Y. Hue, T. Zhao, T. Ibrahim, and F. Boada. Sodium imaging on a
whole-body 7t scanner: Snr and resolution benefits. In Proceedings 16th Scientific

Bibliography 76
Meeting, International Society for Magnetic Resonance in Medicine, Toronto, page
3255, 2008.
[50] P. Prasad, A. Ivanishev, R. Greenman, L. Li, Y. Wu, J. Carbray, J. Stainsby,
A. Carrillo, and R. Lenkinski. 23na mri of in vivo rat kidneys at 3.0 t: Prelimi-
nary experience. In Proceedings 16th Scientific Meeting, International Society for
Magnetic Resonance in Medicine, Toronto, page 2607, 2008.
[51] S. Wood, B. Rutt, J. Piel, D. Whitt, K. Fish, W. Dixon, and I. Hancu. Hyper-
polarized 13c mri with a triple-frequency rf coil. In Proceedings 16th Scientific
Meeting, International Society for Magnetic Resonance in Medicine, Toronto, page
1753, 2008.
[52] Assaf A. Gilad, Paul T. Winnard, Peter C. M. van Zijl, and Jeff W. M. Bulte. De-
veloping mr reporter genes: promises and pitfalls. NMR in biomedicine, 20(3):275–
290, May 2007.
[53] Michel Modo, Diana Cash, Karen Mellodew, Steven C. R. Williams, Scott E. Fraser,
Thomas J. Meade, Jack Price, and Helen Hodges. Tracking transplanted stem cell
migration using bifunctional, contrast agent-enhanced, magnetic resonance imag-
ing. NeuroImage, 17(2):803, January 2002.
[54] Cecilie Brekke, Sarah C. Morgan, Andrew S. Lowe, Thomas J. Meade, Jack Price,
Steve C. R. Williams, and Michel Modo. The in vitro effects of a bimodal contrast
agent on cellular functions and relaxometry. NMR in Biomedicine, 20(2):77–89,
Apr 2007.
[55] Martina Rudelius, Heike E. Daldrup-Link, Ulrich Heinzmann, Guido Piontek, Mar-
cus Settles, Thomas M. Link, and Jargen Schlegel. Highly efficient paramagnetic la-
belling of embryonic and neuronal stem cells. European Journal of Nuclear Medicine
and Molecular Imaging, 30(7):1038–1044, 7 2003.

Bibliography 77
[56] Michel Modo, Karen Mellodew, Diana Cash, Scott E. Fraser, Thomas J. Meade,
Jack Price, and Steven C. R. Williams. Mapping transplanted stem cell migration
after a stroke: a serial, in vivo magnetic resonance imaging study. NeuroImage,
21(1):311–317, 1 2004.
[57] W. C. Shyu, C. P. Chen, S. Z. Lin, Y. J. Lee, and H. Li. Efficient tracking of non-
iron-labeled mesenchymal stem cells with serial mri in chronic stroke rats. Stroke,
38(2):367–374, 2007.
[58] Michel Modo, Mathias Hoehn, and Jeff W. M. Bulte. Cellular mr imaging. Molec-
ular imaging, 4(3):143–164, Jul-Sep 2005.
[59] H. Y. Carr. Steady-state free precession in nuclear magnetic resonance. Physical
Review, 112:1693, 12/01 1958.
[60] P. Foster-Gareau, C. Heyn, A. Alejski, and B. K. Rutt. Imaging single mammalian
cells with a 1.5 t clinical mri scanner. Magnetic Resonance in Medicine, 49(5):968–
971, May 2003.
[61] Klaus Scheffler and Stefan Lehnhardt. Principles and applications of balanced ssfp
techniques. European radiology, 13(11):2409, November 2003.
[62] Klaus Scheffler. A pictorial description of steady-states in rapid magnetic resonance
imaging. Concepts in Magnetic Resonance, 11(5):291–304, 00 1999.
[63] Y. Wang, Y. Yu, D. Li, K. T. Bae, J. J. Brown, W. Lin, and E. M. Haacke. Artery
and vein separation using susceptibility-dependent phase in contrast-enhanced mra.
Journal of Magnetic Resonance Imaging, 12(5):661, November 2000.
[64] Iris-Melanie Noebauer-Huhmann, Katja Pinker, Markus Barth, Vladimir Mly-
narik, Ahmed Ba-Ssalamah, Walter F. Saringer, Michael Weber, Thomas Benesch,
Stephan Witoszynskyj, Alexander Rauscher, Jrgen R. Reichenbach, and Siegfried

Bibliography 78
Trattnig. Contrast-enhanced, high-resolution, susceptibility-weighted magnetic res-
onance imaging of the brain: dose-dependent optimization at 3 tesla and 1.5 tesla
in healthy volunteers. Investigative radiology, 41(3):249–255, Mar 2006.
[65] C. Heyn. Detection and Tracking of Single SPIO Labeled Cells Using MRI. PhD
thesis, 2006.
[66] Takayasu Arai, Theo Kofidis, Jeff W M Bulte, Jorg de Bruin, Ross D Venook,
Gerald J Berry, Michael V Mcconnell, Thomas Quertermous, Robert C Robbins,
and Phillip C Yang. Dual in vivo magnetic resonance evaluation of magnetically
labeled mouse embryonic stem cells and cardiac function at 1.5 t. Magn Reson
Med, 55(1):203–209, Jan 2006.
[67] J. W. M. Bulte and D. L. Kraitchman. Monitoring cell therapy using iron oxide
mr contrast agents. Current Pharmaceutical Biotechnology, 5(6):567–584, 2004.
[68] Uwe Himmelreich and Mathias Hoehn. Stem cell labeling for magnetic resonance
imaging. Minim Invasive Ther Allied Technol, 17(2):132–142, 2008.
[69] Mathias Hoehn, Dirk Wiedermann, and Carles Justicia. Cell tracking using mag-
netic resonance imaging. The Journal of physiology, 584(1):25–491, October 1 2007.
[70] J. Chen, Y. Li, L. Wang, Z. Zhang, D. Lu, M. Lu, and M. Chopp. Therapeutic
benefit of intravenous administration of bone marrow stromal cells after cerebral
ischemia in rats. Stroke; a journal of cerebral circulation, 32(4):1005–1011, Apr
2001.
[71] J. Chen, Y. Li, M. Katakowski, X. Chen, L. Wang, D. Lu, M. Lu, S. C. Gautam,
and M. Chopp. Intravenous bone marrow stromal cell therapy reduces apoptosis
and promotes endogenous cell proliferation after stroke in female rat. Journal of
neuroscience research, 73(6):778–786, Sep 15 2003.

Bibliography 79
[72] L. H. Shen, Y. Li, J. Chen, A. Zacharek, Q. Gao, A. Kapke, M. Lu, K. Ragin-
ski, P. Vanguri, A. Smith, and M. Chopp. Therapeutic benefit of bone marrow
stromal cells administered 1 month after stroke. Journal of cerebral blood flow and
metabolism, 27(1):6–13, Jan 2007.
[73] L. H. Shen, Y. Li, J. Chen, J. Zhang, P. Vanguri, J. Borneman, and M. Chopp.
Intracarotid transplantation of bone marrow stromal cells increases axon-myelin
remodeling after stroke. Neuroscience, 137(2):393–399, 2006.
[74] A. Mahmood, D. Lu, and M. Chopp. Marrow stromal cell transplantation after
traumatic brain injury promotes cellular proliferation within the brain. Neuro-
surgery, 55(5):1185–1193, Nov 2004.
[75] Y. Li, K. McIntosh, J. Chen, C. Zhang, Q. Gao, J. Borneman, K. Raginski,
J. Mitchell, L. Shen, J. Zhang, D. Lu, and M. Chopp. Allogeneic bone marrow
stromal cells promote glial-axonal remodeling without immunologic sensitization
after stroke in rats. Experimental neurology, 198(2):313–325, Apr 2006.
[76] Y. Li, J. Chen, C. L. Zhang, L. Wang, D. Lu, M. Katakowski, Q. Gao, L. H. Shen,
J. Zhang, M. Lu, and M. Chopp. Gliosis and brain remodeling after treatment of
stroke in rats with marrow stromal cells. Glia, 49(3):407–417, Feb 2005.
[77] Y. Li, J. Chen, L. Wang, M. Lu, and M. Chopp. Treatment of stroke in rat with
intracarotid administration of marrow stromal cells. Neurology, 56(12):1666–1672,
Jun 26 2001.
[78] Piotr Walczak, Jian Zhang, Assaf A. Gilad, Dorota A. Kedziorek, Jesus Ruiz-
Cabello, Randell G. Young, Mark F. Pittenger, Peter C. M. van Zijl, Judy Huang,
and Jeff W. M. Bulte. Dual-modality monitoring of targeted intraarterial delivery
of mesenchymal stem cells after transient ischemia. Stroke, 39(5):1569–1574, May
2008.

Bibliography 80
[79] Jeff W. M. Bulte, Lisa Kostura, Alistair Mackay, Parag V. Karmarkar, Izlem Izbu-
dak, Ergin Atalar, Danielle Fritzges, E. Rene Rodriguez, Randy G. Young, Michelle
Marcelino, Mark F. Pittenger, and Dara L. Kraitchman. Feridex-labeled mesenchy-
mal stem cells: cellular differentiation and mr assessment in a canine myocardial
infarction model. Academic Radiology, 12 Suppl 1:S2–6, May 2005.
[80] D. Choi, J. H. Kim, M. Lim, K. W. Song, S. S. Paik, S. J. Kim, H. J. Cheong, J. S.
Jeon, H. S. Park, Y. S. Song, H. Khang, and J. H. Won. Hepatocyte-like cells from
human mesenchymal stem cells engrafted in regenerating rat liver tracked with in
vivo magnetic resonance imaging. Tissue Engineering, 14(1):15–23, 2008.
[81] Clemens Bos, Yahsou Delmas, Alexis Desmoulire, Anne Solanilla, Olivier Hauger,
Christophe Grosset, Isabelle Dubus, Zoran Ivanovic, Jean Rosenbaum, Pierre Char-
bord, Christian Combe, Jeff W M Bulte, Chrit T W Moonen, Jean Ripoche, and
Nicolas Grenier. In vivo mr imaging of intravascularly injected magnetically la-
beled mesenchymal stem cells in rat kidney and liver. Radiology, 233(3):781–789,
Dec 2004.
[82] I. K. Ko, H. T. Song, E. J. Cho, E. S. Lee, Y. M. Huh, and J. S. Suh. In vivo mr
imaging of tissue-engineered human mesenchymal stem cells transplanted to mouse:
A preliminary study. Annals of Biomedical Engineering, 35(1):101–108, 2007.
[83] Jong-Kai Hsiao, Ming-Fong Tai, Hung-Hao Chu, Shin-Tai Chen, Hung Li, Dar-
Ming Lai, Sung-Tsang Hsieh, Jaw-Lin Wang, and Hon-Man Liu. Magnetic nanopar-
ticle labeling of mesenchymal stem cells without transfection agent: cellular behav-
ior and capability of detection with clinical 1.5 t magnetic resonance at the single
cell level. Magn Reson Med, 58(4):717–724, Oct 2007.
[84] John V. Terrovitis, Jeff W. M. Bulte, Sajiram Sarvananthan, Lindsey A. Crowe,
Padmini Sarathchandra, Puspa Batten, Eleftherios Sachlos, Adrian H. Chester,

Bibliography 81
Jan T. Czernuszka, David N. Firmin, Patricia M. Taylor, and Magdi H. Ya-
coub. Magnetic resonance imaging of ferumoxide-labeled mesenchymal stem cells
seeded on collagen scaffolds-relevance to tissue engineering. Tissue engineering,
12(10):2765–2775, Oct 2006.
[85] F. B. Gao, S. Kar, J. Y. Zhang, B. S. Qiu, P. Walczak, M. Larabi, R. Xue, E. Frost,
Z. P. Qian, J. W. M. Bulte, and X. M. Yang. Mri of intravenously injected bone
marrow cells homing to the site of injured arteries. NMR in biomedicine, 20(7):673–
681, 2007.
[86] Chun mei Qi, Gen shan Ma, Nai feng Liu, Cheng xing Shen, Zhong Chen, Xiao jun
Liu, Yao peng Hu, Xiao li Zhang, Gao jun Teng, Sheng hong Ju, Ming Ma, and
Yao liang Tang. Transplantation of magnetically labeled mesenchymal stem cells
improves cardiac function in a swine myocardial infarction model. Chinese medical
journal, 121(6):544–550, Mar 20 2008.
[87] Tim Mosmann. Rapid colorimetric assay for cellular growth and survival: Appli-
cation to proliferation and cytotoxicity assays. Journal of immunological methods,
65(1-2):55–63, December 1983.
[88] E. M. Shapiro, L. N. Medford-Davis, T. M. Fahmy, C. E. Dunbar, and A. P.
Koretsky. Antibody-mediated cell labeling of peripheral t cells with micron-sized
iron oxide particles (mpios) allows single cell detection by mri. Contrast media &
molecular imaging, 2(3):147–153, 2007.
[89] S. Valable, E. L. Barbier, M. Bernaudin, S. Roussel, C. Segebarth, E. Petit, and
C. Remy. In vivo mri tracking of exogenous monocytes/macrophages targeting
brain tumors in a rat model of glioma. Neuroimage, 37:S47–S58, 2007 2007.

Bibliography 82
[90] John B. Williams, Qing Ye, T. Kevin Hitchens, Christina L. Kaufman, and Chien
Ho. Mri detection of macrophages labeled using micrometer-sized iron oxide par-
ticles. Journal of Magnetic Resonance Imaging, 25(6):1210–1218, Jun 2007.
[91] S. J. Dodd, M. Williams, J. P. Suhan, D. S. Williams, A. P. Koretsky, and C. Ho.
Detection of single mammalian cells by high-resolution magnetic resonance imaging.
Biophys J, 76(1 Pt 1):103–109, Jan 1999.
[92] Erik M. Shapiro, Stanko Skrtic, Kathryn Sharer, Jonathan M. Hill, Cynthia E.
Dunbar, and Alan P. Koretsky. Mri detection of single particles for cellular imaging.
Proceedings of the National Academy of Sciences, 101(30):10901–10906, 27 Jul 2004.
[93] Erik M. Shapiro, Laura N. Medford-Davis, Tarek M. Fahmy, Cynthia E. Dunbar,
and Alan P. Koretsky. Antibody-mediated cell labeling of peripheral t cells with
micron-sized iron oxide particles (mpios) allows single cell detection by mri. Con-
trast media & molecular imaging, 2(3):147–153, May 2007.
[94] Samuel Valable, Emmanuel L. Barbier, Myriam Bernaudin, Simon Roussel,
Christoph Segebarth, Edwige Petit, and Chantal Rmy. In vivo mri tracking of ex-
ogenous monocytes/macrophages targeting brain tumors in a rat model of glioma.
NeuroImage, 37 Suppl 1:S47–58, 2007.
[95] J. K. Hsiao, M. F. Tai, C. Y. Yang, S. T. Chen, J. L. Wang, H. C. Ku, and H. M.
Liu. Comparison of micrometer and nanometer sized magnetic particles for cell
labeling. IEEE Transactions on Magnetics, 43(6):2421–2423, 2007.
[96] Ulrich Dirnagl. Bench to bedside: the quest for quality in experimental stroke
research. J Cereb Blood Flow Metab, 26(12):1465–1478, Dec 2006.
[97] E. Juttler, J. B. Fiebach, and P. D Schellinger. Diagnostic imaging for acute
ischemic stroke management. Exper Review of Medical Devices, 3(1):113–126, 2006.

Bibliography 83
[98] Victoria E. O’Collins, Malcolm R. Macleod, Geoffrey A. Donnan, Laura L. Horky,
Bart H. van der Worp, and David W. Howells. 1,026 experimental treatments in
acute stroke. Annals of Neurology, 59(3):467–477, Mar 2006.
[99] W-R. Schbitz and M. Fisher. Perspectives on neuroprotective stroke therapy.
Biochem Soc Trans, 34(Pt 6):1271–1276, Dec 2006.
[100] M. Fisher, D. F. Hanley, G. Howard, E. C. Jauch, S. Warach, and STAIR Grp.
Recommendations for clinical trial evaluation of acute stroke therapies - stroke
therapy academic industry roundtable ii (stair-ii). Stroke, 32(7):1598–1606, 2001.
[101] Marc Fisher, Gregory W. Albers, Geoffrey A. Donnan, Anthony J. Furlan, James C.
Grotta, Chelsea S. Kidwell, Ralph L. Sacco, Lawrence R. Wechsler, and Stroke
Therapy Academic Industry Roundtable IV. Enhancing the development and ap-
proval of acute stroke therapies: Stroke therapy academic industry roundtable.
Stroke, 36(8):1808–1813, Aug 2005.
[102] M. Fisher, D. F. Hanley, G. Howard, E. C. Jauch, S. Warach, and STAIR Grp.
Recommendations from the stair v meeting on acute stroke trials, technology and
outcomes. 2007.
[103] Y. Li, J. Chen, X. G. Chen, L. Wang, S. C. Gautam, Y. X. Xu, M. Katakowski,
L. J. Zhang, M. Lu, N. Janakiraman, and M. Chopp. Human marrow stromal
cell therapy for stroke in rat: neurotrophins and functional recovery. Neurology,
59(4):514–523, Aug 27 2002.
[104] Oh Young Bang, Jin Soo Lee, Phil Hyu Lee, and Gwang Lee. Autologous mes-
enchymal stem cell transplantation in stroke patients. Ann Neurol, 57(6):874–882,
Jun 2005.
[105] Mathias Hoehn, Ekkehard Kustermann, and James Blunk. Monitoring of implanted
stem cell migration in vivo: A highly resolved in vivo magnetic resonance imaging

Bibliography 84
investigation of experimental stroke in rat. Proceedings of the National Academy
of Sciences, 99(25):16267–16272, December 10 2002.
[106] Thomas M Coyne, Akiva J Marcus, Dale Woodbury, and Ira B Black. Marrow stro-
mal cells transplanted to the adult brain are rejected by an inflammatory response
and transfer donor labels to host neurons and glia. Stem Cells, 24(11):2483–2492,
Nov 2006.
[107] Ewout J van den Bos, Timo Baks, Amber D Moelker, Wendy Kerver, Robert-Jan
van Geuns, Willem J van der Giessen, Dirk J Duncker, and Piotr A Wielopol-
ski. Magnetic resonance imaging of haemorrhage within reperfused myocardial
infarcts: possible interference with iron oxide-labelled cell tracking? Eur Heart J,
27(13):1620–1626, Jul 2006.
[108] Martin Rausch, Andre Sauter, Johannes Frahlich, Ute Neubacher, Ernst W. Rada,
and Markus Rudin. Dynamic patterns of uspio enhancement can be observed
in macrophages after ischemic brain damage. Magnetic Resonance in Medicine,
46(5):1018, November 2001.
[109] Michael (1) Schroeter, Andreas (2) Saleh, Dirk (3) Wiedermann, Mathias (4)
Hoehn, and Sebastian (5) Jander. Histochemical detection of ultrasmall super-
paramagnetic iron oxide (uspio) contrast medium uptake in experimental brain
ischemia. Magnetic Resonance in Medicine, 52(2):403–406, 8 2004.
[110] J. B. Williams, Q. Ye, T. K. Hitchens, C. L. Kaufman, and C. Ho. Mri detection
of macrophages labeled using micrometer-sized iron oxide particles. Journal of
Magnetic Resonance Imaging, 25(6):1210–1218, 2007.
[111] C. L R Gonzalez and B. Kolb. A comparison of different models of stroke on
behaviour and brain morphology. Eur J Neurosci, 18(7):1950–1962, Oct 2003.

Bibliography 85
[112] Carles Justicia, Pedro Ramos-Cabrer, and Mathias Hoehn. Mri detection of sec-
ondary damage after stroke: chronic iron accumulation in the thalamus of the rat
brain. Stroke, 39(5):1541–1547, May 2008.
[113] Tonya Bliss, Raphael Guzman, Marcel Daadi, and Gary K Steinberg. Cell trans-
plantation therapy for stroke. Stroke, 38(2 Suppl):817–826, Feb 2007.
[114] C. Kleinschnitz, T. Bendszus, M. Frank, T. Solymosi, K. V. Toyka, and G. Stoll. In
vivo monitoring of macrophage infiltration in experimental ischemic brain lesions
by magnetic resonance imaging. Journal of Cerebral Blood Flow and Metabolism,
23(11):1356–1361, 2003.
[115] Ralph Weber, Susanne Wegener, Pedro Ramos-Cabrer, Dirk Wiedermann, and
Mathias Hoehn. Mri detection of macrophage activity after experimental stroke
in rats: New indicators for late appearance of vascular degradation? Magnetic
Resonance in Medicine, 54(1):59–66, Jul 2005.
[116] Marina L. Zelivyanskaya, Jay A. Nelson, Larissa Poluektova, Mariano Uberti,
Melissa Mellon, Howard E. Gendelman, and Michael D. Boska. Tracking superpara-
magnetic iron oxide labeled monocytes in brain by high field magnetic resonance
imaging. Journal of Neuroscience Research, 73:284–295, 2003.
[117] A. Brown, I. Tracey, D. Anthony, S. Serres, Y. Jiang, and N. Sibson. Uspio-
enhanced mr imaging of macrophage recruitment into the rat brain following mcp-
1 microinjection. In Proceedings 16th Scientific Meeting, International Society for
Magnetic Resonance in Medicine, Toronto, page 1685, 2008.
[118] Hiroaki Matsumoto, Yoshiaki Kumon, Hideaki Watanabe, Takanori Ohnishi,
Masachika Shudou, Chisato Ii, Hisaaki Takahashi, Yoshinori Imai, and Junya
Tanaka. Antibodies to cd11b, cd68, and lectin label neutrophils rather than mi-

Bibliography 86
croglia in traumatic and ischemic brain lesions. J Neurosci Res, 85(5):994–1009,
Apr 2007.