Biochemical and Biophysical Analyses of Tissue-Engineered Bone Obtained from Three-Dimensional...
12
Biochemical and Biophysical Analyses of Tissue-Engineered Bone Obtained from Three-Dimensional Culture of a Subset of Bone Marrow Mesenchymal Stem Cells Federico Ferro, Ph.D., 1 Giuseppe Falini, Ph.D., 2 Renza Spelat, M.BioTech., 1 Federica D’Aurizio, M.D., Ph.D., 3 Elisa Puppato, 3 Maura Pandolfi, 3 Antonio Paolo Beltrami, Ph.D., 3 Daniela Cesselli, Ph.D., 3 Carlo Alberto Beltrami, M.D., 3 Francesco Saverio Ambesi Impiombato, M.D., 1 and Francesco Curcio, M.D. 1 Grafts of tissue-engineered bone represent a promising alternative in the treatment of large and small bone defects. Current approaches are often badly tolerated by patients because of invasiveness, ethical problems, culture, and possibility of infection. Autologous grafts have been indicated as a solution to such problems. Because of tissue availability, many have proposed the use of cultured cells derived from bone marrow expanded in culture and induced to differentiate in bone tissue. Data reported in the literature show that it is possible to produce tissue substitutes in vitro indeed, but results are not always concordant regarding the in vitro produced bone quality. In the present work, we investigated bone formation in aggregates of human bone marrow–derived mesenchymal stem cells induced to differentiate in bone. After osteoinduction we characterized the mineral matrix produced using Fourier transform infrared spectroscopy, scanning electron microscopy, transmission electron microscopy, and X-ray powder diffraction. Cells were obtained from bone marrow, subjected to im- munodepletion for CD3, CD11b, CD14, CD16, CD19, CD56, CD66b, and glycophorin A using RosetteSep and cultured in a new formulation of medium for four passages and then were allowed to form spontaneous aggre- gates. At the end of proliferation before aggregation, cells were analyzed by fluorescent activated cell sorting (FACS) for markers routinely used to characterize expanded mesenchymal stem cells and were found to be remarkably homogeneous for CD29 (99% 1%), CD73 (99% 1%), CD90 (95% 4%), CD105 (96% 4%), and CD133 (0% 1%) expression. Our results show that not only aggregated cells express the major markers of osteogenic differentiation, such as osteocalcin, osteonectin, osteopontin, and bone sialoprotein, but also the inor- ganic matrix is made of an apatite structurally and morphologically similar to native bone even without a scaffold. Introduction B one defects induced by trauma, loss of large bone areas after cancer surgery, or bone loss through meta- bolic and degenerative diseases as well as weakening of the whole bone structure and the intrinsic regeneration mecha- nism have a limited capacity for self-repair. Therefore, these bone defects could benefit from the development of novel treatments such as the autologous and/or allogenic osteo- chondral grafts, which have been used for several decades. Patients with large defects have especially benefited from these grafts. However, the risk of donor site morbidity, infections, ethical problems related to the origin of bone fragments, the unwillingness of some people to accept animal-derived materials, the possibility of zoonosis, or the sheer size of the implant are important limitations in recon- structive medicine and necessitate development of novel and innovative approaches. 1–3 Such efforts have resulted in the development of new strategies to provide bone substitutes from tissue-engineered bone constructs using mesenchymal stem cells (MSCs). MSCs are known to be multipotent and exhibit the po- tential for differentiation into different cells/tissue lineages. 4 In particular, the osteogenic potential of human MSCs (hMSCs) seems to be more pronounced when compared with the adipogenic or chondrogenic potential. 5 This would sug- gest that such multipotent mesenchymal progenitor cells could provide a suitable source of cells for bone tissue 1 Dipartimento di Patologia e Medicina Sperimentale e Clinica, University of Udine, Udine, Italy. 2 Dipartimento di chimica ‘‘Giacomo Ciamican,’’ University of Bologna, Bologna, Italy. 3 Centro Interdipartimentale Medicina Rigenerativa (CIME), University of Udine, Udine, Italy. TISSUE ENGINEERING: Part A Volume 16, Number 12, 2010 ª Mary Ann Liebert, Inc. DOI: 10.1089/ten.tea.2009.0750 3657
Transcript of Biochemical and Biophysical Analyses of Tissue-Engineered Bone Obtained from Three-Dimensional...

Biochemical and Biophysical Analysesof Tissue-Engineered Bone Obtained
from Three-Dimensional Culture of a Subsetof Bone Marrow Mesenchymal Stem Cells
Federico Ferro, Ph.D.,1 Giuseppe Falini, Ph.D.,2 Renza Spelat, M.BioTech.,1 Federica D’Aurizio, M.D., Ph.D.,3
Elisa Puppato,3 Maura Pandolfi,3 Antonio Paolo Beltrami, Ph.D.,3 Daniela Cesselli, Ph.D.,3
Carlo Alberto Beltrami, M.D.,3 Francesco Saverio Ambesi Impiombato, M.D.,1 and Francesco Curcio, M.D.1
Grafts of tissue-engineered bone represent a promising alternative in the treatment of large and small bonedefects. Current approaches are often badly tolerated by patients because of invasiveness, ethical problems,culture, and possibility of infection. Autologous grafts have been indicated as a solution to such problems. Becauseof tissue availability, many have proposed the use of cultured cells derived from bone marrow expanded inculture and induced to differentiate in bone tissue. Data reported in the literature show that it is possible toproduce tissue substitutes in vitro indeed, but results are not always concordant regarding the in vitro producedbone quality. In the present work, we investigated bone formation in aggregates of human bone marrow–derivedmesenchymal stem cells induced to differentiate in bone. After osteoinduction we characterized the mineralmatrix produced using Fourier transform infrared spectroscopy, scanning electron microscopy, transmissionelectron microscopy, and X-ray powder diffraction. Cells were obtained from bone marrow, subjected to im-munodepletion for CD3, CD11b, CD14, CD16, CD19, CD56, CD66b, and glycophorin A using RosetteSep andcultured in a new formulation of medium for four passages and then were allowed to form spontaneous aggre-gates. At the end of proliferation before aggregation, cells were analyzed by fluorescent activated cell sorting(FACS) for markers routinely used to characterize expanded mesenchymal stem cells and were found to beremarkably homogeneous for CD29 (99%� 1%), CD73 (99%� 1%), CD90 (95%� 4%), CD105 (96%� 4%), andCD133 (0%� 1%) expression. Our results show that not only aggregated cells express the major markers ofosteogenic differentiation, such as osteocalcin, osteonectin, osteopontin, and bone sialoprotein, but also the inor-ganic matrix is made of an apatite structurally and morphologically similar to native bone even without a scaffold.
Introduction
Bone defects induced by trauma, loss of large boneareas after cancer surgery, or bone loss through meta-
bolic and degenerative diseases as well as weakening of thewhole bone structure and the intrinsic regeneration mecha-nism have a limited capacity for self-repair. Therefore, thesebone defects could benefit from the development of noveltreatments such as the autologous and/or allogenic osteo-chondral grafts, which have been used for several decades.Patients with large defects have especially benefited fromthese grafts. However, the risk of donor site morbidity,infections, ethical problems related to the origin of bonefragments, the unwillingness of some people to accept
animal-derived materials, the possibility of zoonosis, or thesheer size of the implant are important limitations in recon-structive medicine and necessitate development of novel andinnovative approaches.1–3 Such efforts have resulted in thedevelopment of new strategies to provide bone substitutesfrom tissue-engineered bone constructs using mesenchymalstem cells (MSCs).
MSCs are known to be multipotent and exhibit the po-tential for differentiation into different cells/tissue lineages.4
In particular, the osteogenic potential of human MSCs (hMSCs)seems to be more pronounced when compared with theadipogenic or chondrogenic potential.5 This would sug-gest that such multipotent mesenchymal progenitor cellscould provide a suitable source of cells for bone tissue
1Dipartimento di Patologia e Medicina Sperimentale e Clinica, University of Udine, Udine, Italy.2Dipartimento di chimica ‘‘Giacomo Ciamican,’’ University of Bologna, Bologna, Italy.3Centro Interdipartimentale Medicina Rigenerativa (CIME), University of Udine, Udine, Italy.
TISSUE ENGINEERING: Part AVolume 16, Number 12, 2010ª Mary Ann Liebert, Inc.DOI: 10.1089/ten.tea.2009.0750
3657

engineering. In addition, the use of adult hMSCs providesan alternative and ethically acceptable source of multi-potent cells as opposed to embryonic stem cells.
On the other hand, even if hMSCs are suitable for use incell-based bone tissue engineering, it remains a considerablechallenge to induce hMSCs to form solely bone while pre-venting them from differentiating into others tissues (i.e.,cartilage), and one major hurdle in using adult hMSCs fortherapeutic purposes is the need of animal serum in theculture medium. Moreover, despite extensive research inthe field, very little is known about the matrix structure ofthe tissue-engineered bone.
Our aims were to differentiate adult hMSCs in bone usingmedia in which only autologous human serum was used and toanalyze by Fourier transform infrared spectroscopy (FTIR),scanning electron microscopy (SEM), transmission electron mi-croscopy (TEM), and X-ray powder diffraction (XRD) the min-eral matrix production after long-term osteoblastic induction.6–9
Materials and Methods
Cell cultures
Bone marrow was collected either from the discarded fe-mur head of patients who underwent hip replacement or fromhealthy donors with permission. Adult hMSCs were obtainedby flushing the femur head content through a 26G needle.Flushed cells were diluted in Hank’s balanced salt solu-tion (Sigma-Aldrich), layered on top of Ficoll (AmershamBioscience), and centrifuged. Finally, buffy coat was washedtwice with Hank’s balanced salt solution and subjectedto immunodepletion for CD3, CD11b, CD14, CD16, CD19,CD56, CD66b, and glycophorin A using RosetteSep10,11
(Stemcells Technologies). Then, 1.5�106 freshly isolated cells,derived from the immunodepleted population, were plated in100 mm dishes (Falcon/BD-Biosciences) with prolifera-tion medium composed of F-12 Coon’s modified/Ambesi’smodified medium (Gibco-Invitrogen)/medium 199 (Sigma)/CMRL 1066 (Sigma) supplemented with 2% type-0 humanserum (HS), 25 ng/mL platelet-derived growth factor-bb (Im-munotools), 25 ng/mL epidermal growth factor (Immuno-tools), 25 ng/mL insulin-like growth factor-I (Immunotools),25 ng/mL fibroblast growth factor-b (Immunotools), 10�9 Mdexamethasone (MP-Biomedicals), 25 mg/L ascorbic acid(Sigma), and 25 mg/L gentamycin (Gibco). When the hMSCcolonies developed in primary culture reached confluence, inabout 2–3 weeks, cells were detached using collagenasetrypsin chicken serum (CTC) solution containing 0.5 U/mLtrypsin (Sigma), 22 U/mL collagenase II (Wortington), and2% chicken serum (Gibco) and subcultured onto 100 mmdishes in proliferation medium. The culture was maintainedsemiconfluent to prevent cell differentiation, and the cellswere split every 3 days at a density of 2�103 cells/cm2, usingCTC. To obtain enough cells, cultures were carried on forfour passages. Human osteoblast-like (hOB) cells were cul-tured as described12 and used as positive control. Humanprimary thyroid cells were cultured as described13 and usedas negative control. As a further control, we used hMSCscultured in the same thyroid medium.13
Fluorescent activated cell sorting analysis
Fluorescent activated cell sorting (FACS) analysis wasperformed on P4 undifferentiated hMSCs and P4 hMSCs
cultured in thyroid medium. Cells were detached by ashort incubation in CTC. Staining was performed usingconjugated primary antibodies against CD29 (556049; BD-Biosciences), CD34 (345801; BD-Biosciences), CD45 (BD-Biosciences), CD73 (BD-Biosciences), CD90 (BD-Biosciences),CD105 (Serotec), and CD133 (Miltenyi Biotec), each used at aconcentration of 0.1 mg/106 cells. Intracellular staining wasperformed after a permeabilization step using the IntrastainFixation and Permeabilization Kit (Dako), following manu-facturer’s instructions.
Osteoblastic differentiation
Aggregates were obtained by detaching and centrifugating5�106 P4 hMSCs at 1�103 rpm. Loose aggregates were thentransferred to 100 mm dishes, to which a layer of 2% agarosediluted 1:1 in differentiation medium had been previouslyadded. In such condition, cells aggregated and formed athree-dimensional (3D) structure. Cultures were maintainedin a 100% humidified atmosphere of 95% air and 5% CO2 at378C. Differentiation medium was F-12 Coon’s modified/Ambesi’s modified medium supplemented with 100 nMdexamethasone (MP-Biomedicals), 1 mM b-glycerophosphate(Sigma), 1.2 mM Ca2þ (Sigma), 0.6 mM Mg2þ (Sigma), 2 g/Lglucose (Sigma), 0.5% type-0 HS, 250 nM retinoic acid (MP-Biomedicals), 1mM 17-b-estrogen (MP-Biomedicals), 1mMvitamin K2 (Sigma), 5 nM vitamin D3 (Sigma), 1 nM calcito-nin (MP-Biomedicals), and 15 ng/mL bone morphogeneticprotein-2 (BMP-2; Immunotools). Osteoblastic medium waschanged twice a week for up to 6 months and differentiationwas checked periodically.
Aggregate fixation, processing,and histological staining
Two and 3 months after osteoinduction, aggregates wererinsed in phosphate-buffered saline, fixed in buffered forma-lin for 2 h, embedded in paraffin, and sectioned (5 mm sec-tions). Deparaffinized and hydrated sections of 2- and3-month osteoinduced aggregates were stained by hematox-ylin and eosin and treated with 2% silver nitrate (Sigma) in acoplin jar placed directly in front of a 60 W lamp for 1 h. Slideswere rinsed in distilled water (dH2O), fixed with 2.5% sodiumthiosulfate (Sigma) for 5 min, and washed in dH2O. Cells werecounterstained with neutral red (Sigma) for 3 min, rinsed intap H2O, dehydrated, and mounted with mounting medium(Electron Microscopy Sciences). Deparaffinized and hydratedsections of 3-month osteoinduced aggregates were treatedwith Alcian blue at pH 2.5 for 20 min. Slides were rinsed in tapH2O and counterstained with neutral red (Sigma) for 3 min,rinsed in tap H2O, dehydrated, and mounted with mountingmedium (Electron Microscopy Sciences).
Reverse transcription–polymerasechain reaction analysis
Total RNA was prepared from undifferentiated P4hMSCs, P4 hMSC aggregates after 3 months of osteoinduc-tion, and positive controls using TRIzol Reagent (Gibco), asrecommended by the manufacturer. After treatment withDNase I (Ambion Applied-Biosystems), first-strand cDNAsynthesis was performed with 2 mg total RNA using ran-dom hexanucleotides and Moloney murine leukemia virus
3658 FERRO ET AL.

(MMLV) reverse transcriptase (Invitrogen). Polymerasechain reaction (PCR) amplification was carried out in a finalvolume of 50 mL, using 150 ng of cDNA, 10 mM Tris-HCl (pH9.0), 1.5 mM MgCl2, 0.2 mM dNTPs, 25 pmol of each primer,and 2 U/mL Taq I polymerase (Amersham Bioscience).
Osteoblastic lineage–specific primer sequences, PCR prod-uct sizes, annealing temperatures, and references are reportedin Table 1.
The reaction products were visualized on an ethidiumbromide–stained 1%–2% agarose gels. Images were collectedusing Gel-Doc 2000 (Bio-Rad), and semiquantitative analysiswas performed using Quantity One (Bio-Rad).
Immunoblot
Lysates for immunoblots were obtained from undifferen-tiated P4 hMSCs, 3-month osteoinduced P4 hMSC aggre-gates, positive controls, and negative controls using TRIzolReagent (Gibco), as recommended by the manufacturer.Protein concentration was measured by BCA Protein AssayReagent Kit (Pierce) and the program Labsystems genesisV2.16. Aliquots of 20mg of cell protein extracts were electro-phoresed on polyacrylamide gel and transferred onto nitro-cellulose membranes. The membranes were then washed inTris-buffered saline (TBS) with 5% bovine serum albumin(BSA) and 0.3% Tween-20 and then incubated overnight withprimary antibodies against osteocalcin (OSC) (ab13418; Ab-cam) or osteopontin (OSP) (Sc21742; Santa Cruz), diluted 1/300 and 1/2500, respectively, in TBS with 5% BSA and 0.3%Tween-20. a-Tubulin staining (T9026; Sigma) was used tonormalize protein amount. Antibody/antigen complexeswere detected using ECL reagent (Amersham Bioscience).
Immunohistochemistry
Three-month osteoinduced aggregates after fixation inbuffered formalin for 2 h were decalcified for 5 min in Os-teodec (BioOptica), rinsed in dH2O, and sectioned (5 mm
thickness). Antigenic uncovering was carried out in citratebuffer (pH 6) for 40 min at 988C.
Deparaffinized 5 mm slices were exposed to a 4% solutionof hydrogen peroxide in methanol (1/1, v/v), blocked inTBS with 5% BSA and 0.3% Tween-20 (Sigma) for 25 min,and incubated overnight at 48C with primary antibodiesto OSC (Abcam) and OSP (Santa Cruz), diluted 1/100 and1/200, respectively. The antibodies were diluted in TBScontaining 1.5% BSA and 0.3% Tween-20. Proteins weredetected by incubation with LSAB System-HRP (Dako-Cytomation). After hematoxylin counterstaining, sectionswere dehydrated and mounted with mounting medium. Incontrol sections, the primary antibodies were either omit-ted. Images were acquired using the Olympus IX50 photo-microscope (Olympus).
Preparation for biochemical and biophysical analyses
Biochemical and biophysical analyses were made on 4-, 5-,and 6-month osteoinduced aggregates, washed in Milli-Qwater for 5 min, and dehydrated in heater for 1 day at 378C.
X-ray powder diffraction
XRD patterns were collected using a PanAnalytical X’PertPro equipped with X’Celerator detector powder diffractom-eter (PANalytical) using Cu Ka radiation (l¼ 1.5418 A)generated at 40 kV and 40 mA. The instrument was config-ured with a 1/48 divergence and 1/48 antiscattering slits. Astandard quartz sample holder 1 mm deep, 20 mm high, and15 mm wide was used. The diffraction patterns were col-lected within the 2y range from 108 to 858, with a step size(D 2y) of 0.028 and a counting time of 60 s.
Fourier transform infrared spectroscopy
In the FTIR analysis, each powdered sample (*0.1 mg)was mixed with about 10 mg of anhydrous KBr. The
Table 1. Osteoblastic Lineage–Specific Primer Sequences, Polymerase Chain Reaction
Product Sizes, Annealing Temperatures, and References Are Reported
Marker Forward Reverse Length Temperature Reference
b-Actin 50-gcactcttccagccttccttcctg-30 50-ggagtacttgcgctcaggaggagc-30 253 bp 558C XR_018969ALP 50-gcaggcaggcagcttcac-30 50-tcagaacaggacgctcagg-30 496 bp 60.58C NM_000478Agg 50-tgaggagggctggaacaagtacc-30 50-ggaggtggtaattgcagggaaca-30 350 bp 60.58C NM_001135BMP-2 50-gtgtccccgcgtgcttcttag-30 50-actcctccgtggggatagaac-30 479 bp 61.58C NM_001200BMP-4 50-gcctagcaagagtgccgtc-30 50-gcatggttggttgagttgag-30 849 bp 588C NM_130850BMP-7 50-ctacaaggccgtcttcagtac-30 50-catgaagggctgcttgttctg-30 514 bp 588C NM_001719BMPr-Ia 50-ttgctgcattgctgacctgg-30 50-caatgctgtgagtctggaggc-30 421 bp 588C NM_004329BMPr-Ib 50-tgcagatatcaaagggacagg-30 50-tgcaggattgtgagccca g-30 649 bp 588C NM_001203BMPr-II 50-ctgctatggcctttgggag-30 50-agcagtgcctccttctgcaag-30 455 bp 588C NM_001204BSP 50-tcagcattttgggaatggcc-30 50-gaggttgttgtcttcgaggt-30 667 bp 56.58C NM_004967Coll-I 50-taaagggtcaccgtggct-30 50-cgaaccacattggcatca-30 355 bp 60.58C NM_000088Dlx-5 50-ccagtatcagtatcacggcg-30 50-ggatgcagagttctccaggt-30 556 bp 598C NM_005221Msx-2 50-cagaggatggagcggcgtgg-30 50-gctggtactgccttcgtggag-30 558 bp 598C NM_002449OSC 50-tcacactcctcgccctattg-30 50-ctagaccgggccgtagaag-30 293 bp 588C NM_000711OSN 50-cacaagctccacctggacta-30 50-gaatccggtactgtggaagg-30 525 bp 588C NM_003118OSP 50-cctcctaggcatcacctgtg-30 50-ccacactatcacctcggcc-30 422 bp 588C NM_000582
ALP, alkaline phosphatase; Agg, aggrecan; BMP, bone morphogenetic protein; BMPr-Ia, bone morphogenetic protein receptor type Ia; BSP,bone sialo proteins; Coll-I, collagen type I; Dlx-5, distal-less homeobox-5; Msx-2, muscle segmental homeobox-2; OSC, osteocalcin; OSN,osteonectin; OSP, osteopontin.
FROM BONE MARROW TO HYDROXYAPATITE 3659
mixtures were pressed into 7-mm-diameter discs. PureKBr discs were used as background. The analysis wasperformed at 4 cm�1 resolution using a Nicolet 380 FTIRspectrometer (Thermo Fisher Scientific) in the range 4000–400 cm�1.
Scanning electron microscopy
The SEM observation on the microribbon samples wereperformed in a Philips XL20 (Philips) operating at 15 kV. ThehMSC aggregates were mounted on a mica surface after
extensive washing with Milli-Q water. Then the mica surfacewas glued on an aluminium stub and gold sputtered.
Transmission electron microscopy
TEM observations were carried out using a Philips CM 100instrument (80 kV). The powdered samples were dispersed inwater and then few droplets of the slurry were deposited onholey-carbon foils supported on conventional copper micro-grids. The images were recorded using a charge coupleddevice (CCD) digital camera.
FIG. 1. (a) Isolated adult humanmesenchymal stem cells (hMSCs)showed a uniform fibroblastoid mor-phology (magnification, 10�). (b)fluorescent activated cell sorting(FACS) analysis: Isotype control im-munoglobulin G staining profile (red)versus specific antibody stainingprofile (green) showed a high andhomogeneous expression of commonmesenchymal markers CD29(99%� 1%), CD73 (99%� 1%), CD90(95%� 4%), and CD105 (96%� 3%)and low expression of CD34 (1� 1%),CD45 (1� 1%), and CD133 (0� 1%).Color images available online atwww.liebertonline.com/ten.
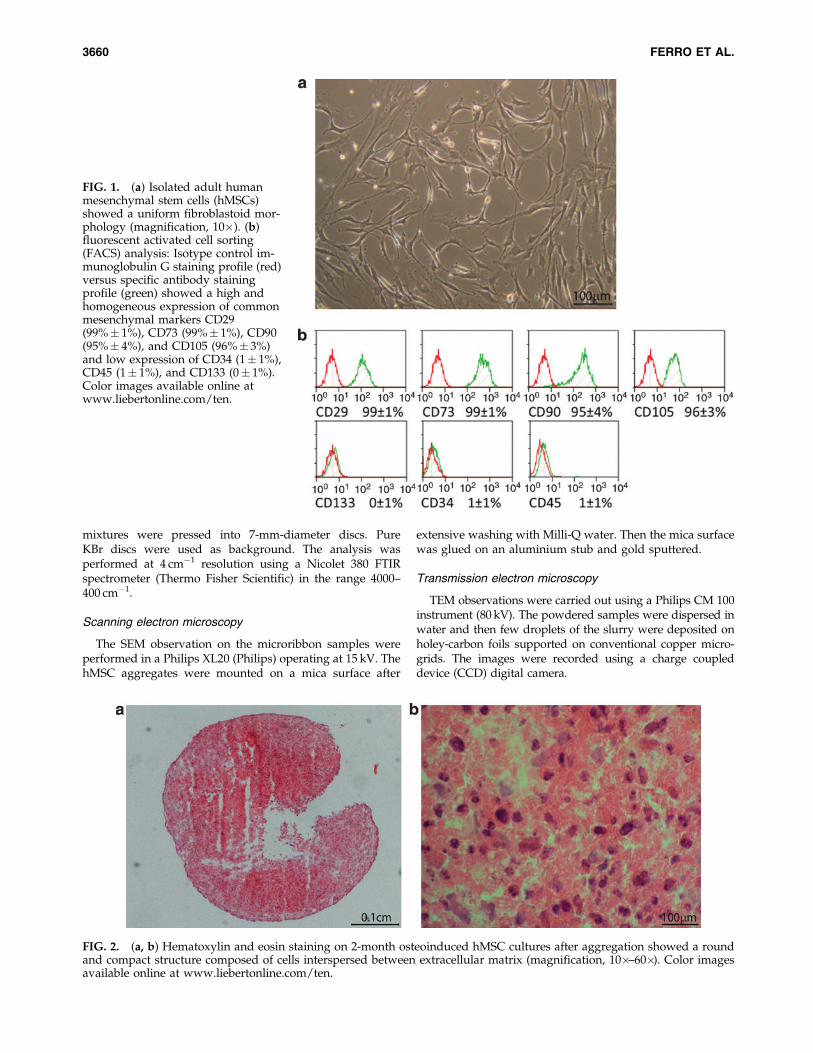
FIG. 2. (a, b) Hematoxylin and eosin staining on 2-month osteoinduced hMSC cultures after aggregation showed a roundand compact structure composed of cells interspersed between extracellular matrix (magnification, 10�–60�). Color imagesavailable online at www.liebertonline.com/ten.
3660 FERRO ET AL.

Statistical analysis
Statistical analysis was performed by Student’s t-test. Ex-perimental data are expressed as mean� standard deviationof three independent experiments.
Results
Cultured adult hMSCs attached and grew with fibroblasticmorphology and developed into visible symmetric colonies in
about 7–15 days after initial plating. Nonadherent cells wereremoved by medium changes. FACS analysis for the indi-cated CD markers showed that, at P4, cultured hMSCs had avery homogeneous phenotype (Fig. 1a). It has been alreadyshown that RosetteSep preselection method in associationwith human serum permits to obtain a homogeneous culturefrom the third passage onward.10,11 Our hMSCs were positivefor CD29 (99%� 1%), CD73 (99%� 1%), CD90 (95%� 4%),CD105 (96%� 4%), and CD133 (0%� 1%) (Fig. 1b). Such
FIG. 3. (a, b) von Kossa staining showed a central mineralized zone, evidenced by black silver deposits, whereas theexternal zone comprises undifferentiated or less-differentiated cells (magnification, 10�–60�). (c, d) Two months after osteo-induction, aggregates were negative or faintly stained by von Kossa (magnification, 10�–40�). (e, f) Alcian blue (pH 2.5) showsa central zone, evidenced by blue stain, rich in mucopolisaccarides, whereas the external zone comprises undifferentiated orless-differentiated cells (magnification, 4�–40�). Color images available online at www.liebertonline.com/ten.
FROM BONE MARROW TO HYDROXYAPATITE 3661

markers are routinely used to characterize the expanded mes-enchymal cell population.10,11,14,15 On the contrary, cells wereweakly positive for the hematopoietic marker CD34 (1%� 1%)and the leukocyte common antigen CD45 (1%� 1%), suggest-ing that contamination by hematopoietic precursors (Fig. 1b)was very low.16 Our low HS medium selection capability wasshown by the less homogeneous phenotype expressed by P4hMSCs cultured in thyroid medium13: CD29 (43%� 3%), CD73(58%� 1%), CD90 (59%� 4%), CD105 (64%� 4%), CD133(0.12%� 1%), CD34 (1%� 1%), CD45 (21%� 3%).
Our adult hMSCs were aggregated and cultured in dif-ferentiation conditions for a minimum of 2 months and amaximum of 6 months to induce their differentiation intoosteoblasts.
During differentiation, about 5 mm aggregates becamemore compact, because of cellular rearrangements and ex-tracellular matrix production, reducing their dimensions.Figure 2a, b shows a round, compact 2-month aggregates,stained with hematoxylin and eosin, with viable cells in thecenter, suggesting that shrinkage in size was not due tocentral necrosis.
Two and 3 months after osteoinduction, aggregates weresectioned and subjected to von Kossa staining. The 3-monthosteoinducted hMSC aggregates exhibited a very dark stain-ing, an indication of calcium accumulation. Stain was partic-ularly intense in the central region and decreased graduallyfrom the central region to the external region (Fig. 3a, b).On the contrary, the 2-month osteoinduced aggregates were
negative or faintly stained by the von Kossa assay (Fig.3c, d). Alcian blue (pH 2.5) stain revealed extracellularhyaluronic acid, hyaluronosulfate, chondroitin sulfates andother acid mucins accumulation in the central region, whichdecreased gradually from the central region to the externalregion (Fig. 3e, f).
Undifferentiated and 3-month osteoinduced hMSCs wereanalyzed by reverse transcription (RT)-PCR for the expressionof osteoblastic lineage–specific markers such as aggrecan(Agg), a proteoglycan expressed during osteochondral ossifi-cation17; alkaline phosphatase (ALP), important for minerali-zation of osteoblastic cells18; and BMPs, which play importantroles in skeletal development and bone formation by bindingto BMP type Ia (BMPr-I) and II transmembrane receptors.19
We also analyzed collagen type I (Coll-I), the major collagenprotein in mineralized tissues, BSP, OSC, osteonectin (OSN),OSP, osteo-specific noncollagen extracellular matrix proteins,and distal-less homeobox-5 (Dlx-5) and muscle segmental ho-meobox-2 (Msx-2), transcription factors involved in osteo-blastic differentiation.20 RT-PCR of undifferentiated hMSCsshowed the expression of Agg, ALP, BMP-2, BMP-4, BMPr-Ia,Ib, Coll-I, BSP, Msx-2, OSC, OSN, and OSP with no or lowexpression of BMP-7, BMPr-II, and Dlx-5 mRNAs. After 3months of differentiation, hMSCs showed increased expres-sion of BMP-2 (3.38� 0.06-folds), BMP-4 (3.16� 0.003-folds),BSP (2.87� 0.13-folds), OSC (2.21� 0.005-folds), BMPr-Ib(1.89�0.006-folds), Dlx-5 (1.18� 0.008-folds), and BMPr-Ia(1.17�0.04-folds) and decreased expression of OSN (0.95�
FIG. 4. (a, b) Comparison be-tween reverse transcription (RT)–polymerase chain reactions fromsamples of adult hMSCs in pro-liferation (hMSC prol) and after 3months of osteoblastic induction(hMSC diff), compared with pos-itive controls (Ctrþ), showed anincreased expression of bonemorphogenetic protein-2 (BMP-2)(3.38� 0.06-folds), BMP-4(3.16� 0.003-folds), bone sialoproteins (BSP) (2.87�0.13-folds), osteocalcin (OSC)(2.21� 0.005-folds), BMP receptortype Ib (BMPr-Ib) (1.89� 0.006-folds), distal-less homeobox-5(Dlx-5) (1.18� 0.008-folds), andBMPr-Ia (1.17� 0.04-folds) and adecreased expression of osteo-nectin (OSN) (0.95� 0.036-folds),muscle segmental homeobox-2(Msx-2) (0.83� 0.002-folds), ag-grecan (Agg) (0.66� 0.001-folds),osteopontin (OSP) (0.64� 0.026-folds), alkaline phosphatase (ALP)(0.43� 0.005-folds), and collagentype I (Coll-I) (0.29� 0.009-folds)after differentiation. (c) Twentymicrograms of total protein extracts was loaded in each lane and was electrophoresed. Results confirmed the expression ofOSC and OSP after 3 months of differentiation (compared with positive and negative controls). Color images available onlineat www.liebertonline.com/ten.
3662 FERRO ET AL.

FIG. 5. (a, b) OSP was highly expressed in hMSC aggregates after 3 months of osteoinduction (magnification, 4�–20�). (c, d)Immunohistochemistry for OSC in hMSC aggregates at 3 months after osteoinduction showed the absence of heavilymineralized central region, lost after sectioning, and presence of OSC expression (magnification, 4�–20�). Color imagesavailable online at www.liebertonline.com/ten.
FIG. 6. X-ray powder dif-fraction patterns from hMSCaggregates. (a) hMSCs 6months, (b) hMSCs 5 months,and (c) hMSCs 4 months. (d)The diffraction pattern of asynthetic highly crystallinehydroxyapatite sample is re-ported as comparison. Thediffraction peaks of hydroxy-apatite are marked with the(211,112,300) indexes. Thevertical axis indicates intensityin arbitrary units.
FROM BONE MARROW TO HYDROXYAPATITE 3663

0.036-folds), Msx-2 (0.83� 0.002-folds), Agg (0.66� 0.001-folds), OSP (0.64� 0.026-folds), ALP (0.43� 0.005-folds), andColl-I (0.29� 0.009-folds) mRNAs (Fig. 4a, b). hMSC mRNAexpression was compared with hOB-positive control cells. Insome instances, different expression levels were found becausehOB cells, although representing a highly mature phenotype,cannot be considered fully differentiated.21 The early dif-ferentiation marker OSP and the late differentiation markerOSC22 were also investigated by immunoblotting and immu-nohistochemistry.
Immunoblots showed no expression of OSC and OSPproteins during proliferation, whereas both were expressedafter 3 months of osteoblastic induction. hOB cells andhuman primary thyroid cells were used as positive andnegative controls, respectively. Results were normalizedwith b-actin (Fig. 4c).
Immunohistochemical analysis for OSP (Fig. 5a, b) showedstrong positivity over the entire section, whereas OSCstaining was weaker and seemed absent in the external zone(Fig. 5c, d).
Routinely after osteogenic differentiation, the onset ofmineral deposition was assessed with von Kossa assay, al-though this staining technique alone is not sufficient toconfirm that in vitro mineralization represents bone forma-tion.23 To confirm bone formation and characterize themineral matrix structure, 4-, 5-, and 6-month osteoinducedhMSC aggregates were subjected to XRD and FTIR spec-troscopy to evaluate the presence and structure of carbonatehydroxyapatite, the bone principal constituent.6–9
In Figure 6, powder X-ray diffraction patterns of hMSC ag-gregates obtained after 4, 5, and 6 months of induction areshown. The samples were ground before the analyses. Thediffraction patterns show the diagnostic reflections of hydroxyapatite (HA) at 25.88 and around 328 of 2y, plus other weakreflections typical of this mineral phase.7,8 No additional re-flections due to other phases or hydroxyapatite precursors,such as octacalcium phosphate, were observed. In general, in-creasing the osteoinduction time, diffraction patterns showedmore evident reflections, although their definition was alwaysvery low when compared with that of synthetic HA (Fig. 6).The intensity of the reflection at 25.88, the one corresponding to
the diffraction of the (002) plane, clearly increases its intensitygoing from the 4- to the 6-month sample. In the diffractionpattern of the hMSC 6 sample, a weak reflection (004) is alsovisible.
The FTIR spectra of the 4-, 5-, and 6-month hMSC samplesare reported in Figure 7. They show absorption bands asso-ciated to organic material and apatite. The absorption bandsdue to organic material were assigned according to Fa-bian and Mantele.24 Absorption bands at 2959 cm�1 (nCH),2925 cm�1 (nCH2), 2855 cm�1 (nCH3), 1745 cm�1 (nCO, amide I,b-turn), 1654 cm�1 (nCO, amide I, a-helix or random coil), and1495 cm�1 (dCH2) are present on all spectra. The absorptionbands at 1032, 604, and 564 cm�1 were assigned to the phos-phate groups, whereas the bands at 870 and 1420 cm�1 wereassigned to the carbonate groups, according to Le Geros25 andBoskey et al.9 The relative intensity of the absorption bandsdue to organic material is greater in hMSC 4 than hMSC 5 andin hMSC 5 than hMSC 6.
The morphology of the hMSC aggregates was evaluatedby electron microscopy. A SEM image of an hMSC aggregateis shown in Figure 8a. The mineral phase appears completelyembedded in the organic matrix. The mineral phase is notclearly visible and the typical features of mineral phases,such as defined angles, are not observable. TEM images of afragment of the mineralized regions of hMSC 4, hMSC 5, andhMSC 6 aggregates are shown in Figure 8b, c, and d, re-spectively. The mineral phase in hMSC 4 did not show anyclear edges and the shape of crystal units forming the ag-gregate was not clear (Fig. 8b). Aggregates formed by elon-gated plate-like crystals are present in the hMSC 5 sample(Fig. 8c). These crystals have nanometer sizes and arestrongly associated. Moreover, the plate-like crystals are thinand do not have well-defined edges. Nanocrystals fromhMSC 6 sample are shown in Figure 8d, f. In some regionsthese plate-like crystals are randomly oriented (Fig. 8d),whereas in other localized regions the crystals appear tohave a preferential direction of orientation (Fig. 8e, f). Theelectron diffraction pattern obtained from one of these ag-gregates is reported in the inset in Figure 8f. The aggregateshowed several diffraction spots, indicating the polycrystal-line nature of the mineral matrix.
FIG. 7. Fourier transforminfrared spectra obtained fromdry samples. (a) Four-monthhMSCs, (b) 5-month hMSCs,and (c) 6-month hMSCs. Theintensity of the absorptionpeaks is reported in arbitraryunits (a.u.).
3664 FERRO ET AL.

Discussion
Results demonstrated that our culture methods allowed usto select a homogeneous population with respect to the as-sayed CD markers, reducing contamination by CD34- andCD45-positive precursors.
We showed that 3D conditions contributed to osteogenicdifferentiation of adult hMSCs as demonstrated by the ex-pression of many standard osteoblastic markers by PCR. Wealso characterized production and distribution of the earlydifferentiation marker OSP and the late differentiation markerOSC by immunoblot and immunohistochemistry. The distri-bution of osteoblastic matrix proteins demonstrated a repro-
ducible strong labeling of these proteins in the mineralizedtissue, whereas faint or absent labeling was found in the oste-oid and in the cellular compartment. Most in vivo studies havereported similar localization of these osteoblastic matrix pro-teins, with inconstant labeling of the mineralization front.26–32
von Kossa staining showed a specific calcium accumula-tion in the central area of the aggregate and absence in theexternal zone. Alcian blue staining supports the possibilitythat cells in the central zone produce more mucopolisaccar-ides compared with those in the external zone. This patternof protein expression, mucopolysaccaride synthesis, andcalcium deposition suggests that not all the entire aggregatehad reached the same level of differentiation. In fact, the
FIG. 8. (a) Scanning electron microscopy images of the 6-, 4-, and 5-month hMSC sample surfaces showing similarmorphologies. Transmission electron microscopy images of 4-month (b), 5-month (c) and 6-month (d–f) sample fragments.The inset in (f) shows the electron diffraction pattern of the fragment.
FROM BONE MARROW TO HYDROXYAPATITE 3665

central part underwent mineralization, whereas peripheralzone did not. We suppose that this differential calcium ac-cumulation and protein expression happened because thecentral region underwent osteoid maturation generating ahigh degree of calcium accumulation, whereas the externalzone was composed of undifferentiated or less-differentiatedcells. A possible explanation for the difference between theinner and outer regions is the presence of a hypoxic state inthe center of the aggregates, and recent studies have shownthat the proportion of osteogenesis in cells under hypoxicconditions was greater than under normoxic conditions.33
Future research on the mechanism underlying this pheno-menon may lead to a better understanding of the role ofhypoxia in differentiation.
Analysis of inorganic matrix showed very interesting re-sults. Natural bone mineral has an apatite-like structure withhexagonal symmetry and small-size crystals, as it has beenreported by many authors.6–9 The bioapatite crystal size andshape were measured in many experiments by direct meth-ods using electron microscopy and by indirect methods us-ing diffraction peak broadening analysis.34,35 The crystalliteswere reported to be rod-shaped or elongated platelets with20–30 A thickness and 200–400 A length along the c-axisperpendicular to the basal plane of the hexagonal cell. Thec-axis in a compact or cortical bone is generally parallel tothe bone axis. Natural bioapatite texture is responsible forthe increased intensity of the (002) and (004) lines for planar-oriented specimens with the analyzed surface perpendicularto the longer bone axis. Thus, a simultaneous analysis of the(002) and (004) lines is feasible because the c-axis of bioa-patite crystals has a strongly preferred orientation parallel tothe bone axis.36,37
The mineral phase in our hMSC aggregates has beenstudied by XRD, FTIR, and TEM. The powder diffractionpatterns from hMSC 4, hMSC 5, or hMSC 6 showed broadreflections typical of HA with low crystallinity. These dif-fraction patterns are similar to those of HA in bone.6–9 In-terestingly, when osteoinduction time was increased, theintensity of the (002) and (004) reflections was also increased,indicating the formation of elongated crystals with a pref-erential orientation.
FTIR spectra indicated that the precipitated mineral is acarbonate apatite, as in the natural bone. Moreover, thespectra indicated a relative increase in mineral content withrespect to organic material when osteoinduction time wasincreased, as confirmed also by the observed crystallinityincrease associated with the osteoinduction time.
The morphological analysis at the microscale level (SEM)showed that the aggregate surface did not have crystallinefeatures and was completely covered by organic material.The nanoscale observation (TEM) of fragments of mineral-ized aggregates showed how HA crystals were packed indense clusters. The crystals have plate-like and needle-likeshapes with sizes of the same order of magnitude of thoseobserved in natural bones.6–9 Longer osteoinduction time notonly increased the HA crystallinity (XRD data) but alsovaried the morphological features and the local orientationof HA nanocrystals. Indeed, in hMSC aggregates after 6months of osteoinduction, nanocrystals of HA locally ori-ented, or with a preferential orientation, are visible. Thistime-dependent ripening concept of HA crystals could bevery important for understanding natural bone formation.9,38
In conclusion, our results showed that not only in ourculture conditions the adult hMSC-derived cells are able toproduce proteins typical of bone differentiation, but also in3D culture conditions they can produce an inorganic struc-ture similar to what has been seen in vivo without the need ofa scaffold.
We believe that the inorganic matrix should be analyzedroutinely when using tissue-engineered bone in therapeuticapplications. Further studies using scaffolds and physicalstimuli may be needed to understand how these could in-fluence hMSC osteoblastic differentiation.
Acknowledgments
The authors thank the Foundation for Transplant Researchfor the generous support. The work has been partially sup-ported by Agenzia Spaziale Italiana through the MoMaProject.
Disclosure Statement
No competing financial interests exist.
References
1. Eloit, M. Risks of virus transmission associated with animalsera or substitutes and methods of control. Dev Biol Stand99, 9, 1999.
2. Shah, G. Why do we still use serum in the production ofbiopharmaceuticals? Dev Biol Stand 99, 17, 1999.
3. Wessman, S.J., and Levings, R.L. Benefits and risks due toanimal serum used in cell culture production. Dev BiolStand 99, 3, 1999.
4. Pittenger, M.F. Mesenchymal stem cells from adult bonemarrow. In: Prockop, D.J., Bunnell, B.A., and Phinney, D.G.,eds. Methods in Molecular Biology. Totowa, HJ: HumanaPress, 2008, pp. 27–44.
5. Muraglia, A., Cancedda, R., and Quarto, R. Clonal mesen-chymal progenitors from human bone marrow differentiatein vitro according to a hierarchical model. J Cell Sci 113, 1161,2000.
6. Vallet-Regi, M., and Gonzalez-Calbet, J.M. Calcium phos-phates as substitution of bone tissues. Prog Solid State Chem32, 1, 2004.
7. Rey, C. Calcium phosphate and bone mineral. Difference incomposition, structure and properties. Biomaterials 11, 13, 1990.
8. Currey, J.D. Bones: Structure and Mechanics. Princeton:Princeton University Press, 2002.
9. Boskey, A.L., Spevak, L., Paschalis, E., Doty, S.B., andMcKee, M.D. Osteopontin deficiency increases mineralcontent and mineral crystallinity in mouse bone. Calcif Tis-sue Int 71, 145, 2002.
10. Bieback, K., Hecker, A., Kocaomer, A., Lannert, H., Schall-moser, K., Strunk, D., and Kluter, H. Human alternatives tofetal bovine serum for the expansion of mesenchymal stro-mal cells from bone marrow. Stem Cells 27, 23, 2009.
11. Tondreau, T., Lagneaux, L., Dejeneffe, M., Delforge, A.,Massy, M., Mortier, C., and Bron, D. Isolation of BM mes-enchymal stem cells by plastic adhesion or negative selec-tion: phenotype, proliferation kinetics and differentiationpotential. Cytotherapy 6, 372, 2004.
12. Robey, P.G., and Termine, J.D. Human bone cells in vitro.Calcif Tissue Int 37, 453, 1985.
13. Curcio, F., Ambesi-Impiombato, F.S., Perrella, G., and Coon,H.G. Long-term culture and functional characterization of
3666 FERRO ET AL.
follicular cells from adult normal human thyroids. Proc NatlAcad Sci 13, 9004, 1994.
14. Sakaguchi, Y., Sekiya, I., Yagishita, K., Ichinose, S., Shino-miya, K., and Muneta, T. Suspended cells from trabecularbone by collagenase digestion become virtually identical tomesenchymal stem cells obtained from marrow aspirates.Blood 104, 2728, 2004.
15. Lee, R.H., Kim, B.C., Choi, I.S., Kim, H., Choi, H.S., and Suh,K.T. Characterization and expression analysis of mesen-chymal stem cells from human bone marrow and adiposetissue. Cell Physiol Biochem 14, 311, 2004.
16. Pittenger, M.F., Mackay, A.M., Beck, S.C., Jaiswal, R.K.,Douglas, R., and Mosca, J.D. Multilineage potential of adulthuman mesenchymal stem cells. Science 284, 143, 1999.
17. Barry, F., Boynton, R.E., Liu, B., and Murphy, J.M. Chon-drogenic differentiation of mesenchymal stem cells frombone marrow: differentiation-dependent gene expression ofmatrix components. Exp Cell Res 268, 189, 2001.
18. Sugawara, Y., Suzuki, K., Koshikawa, M., Ando, M., andIida, J. Necessity of enzymatic activity of alkaline phospha-tase for mineralization of osteoblastic cells. Jpn J Pharmacol88, 262, 2002.
19. Cheng, B.H., Jiang, W., Phillips, F.M., Haydon, R.C., Peng,Y., Zhou, L., Luu, H.H., An, N., Breyer, B., Vanichakarn, P.,Szatkowski, J.P., Park, J.Y., and He, T.C. Osteogenic activityof the fourteen types of human bone morphogenetic proteins(BMPs). J Bone Joint Surg 85, 1544, 2003.
20. Young, M.F. Bone matrix proteins: their function, regulation,and relationship to osteoporosis. Osteoporos Int 14, 35, 2003.
21. Keeting, P.E., Scott, R.E., Colvard, D.S., Anderson, M.A.,Oursler, M.J., Spelsberg, T.C., and Riggs, B.L. Developmentand characterization of a rapidly proliferating, well-differ-entiated cell line derived from normal adult human osteo-blast-like cells transfected with SV40 large T antigen. J BoneMiner Res 7, 127, 1992.
22. Nefussi, J.R., Brami, G., Modrowski, D., Oboeuf, M., andForest, N. Sequential expression of bone matrix proteinsduring rat calvaria osteoblast differentiation and bone nod-ule formation in vitro. J Histochem Cytochem 45, 493, 1997.
23. Bonewald, L.F., Harris, S.E., Rosser, J., Dallas, M.R., Dallas, S.L.,Camacho, N.P., Boyan, B., and Boskey, A. von Kossa stainingalone is not sufficient to confirm that mineralization in vitrorepresents bone formation. Calcif Tissue Int 72, 537, 2003.
24. Fabian, H., and Mantele, W. Infrared spectroscopy of pro-teins. In: Chalmers, J.M., and Griffiths P.R., eds. Handbookof Vibrational Spectroscopy. Chichester: John Wiley & SonsLtd., 2002, pp. 3399–3426.
25. Le Geros, R.Z. Calcium Phosphates in Oral Biology andMedicine. Basel: Karger Press, 1991.
26. Sodek, J., Chen, J., Kasugai, S., Nagata, T., Zhang, Q., McKee,M.D., and Nanci, A. Elucidating the functions of bone sialo-protein and osteopontin in bone formation. In: Slavkin, H.,and Price, P., eds. Chemistry and Biology of MineralizedTissues. Amsterdam: Excerpta Medica, 1992, pp. 297–306.
27. Chen, J., Shapiro, H.S., Wrana, J.L., Reimers, S., Heersche,J.N.M., and Sodek, J. Localization of bone sialoprotein (BSP)expression to sites of mineralized tissue formation in fetal rattissues by in situ hybridization. Matrix 11, 133, 1991.
28. Chen, J., Zhang, Q., McCulloch, C.A.G., and Sodek, J.Immunohistochemical localization of bone sialoprotein infoetal porcine tissues: comparison with secreted phospho-protein 1 (SPP-1, osteopontin) and SPARC (osteonectin).Histochem J 23, 281, 1991.
29. Boivin, G., Morel, G., Lian, J.B., Anthione-Terrier, C., Du-bois, P.M., and Meunier, P.J. Localization of endogenousosteocalcin in neonatal rat bone and its absence in articularcartilage: effect of warfarin treatment. Virchows Arch APathol Pathol Anat 417, 505, 1990.
30. Bianco, P., Fisher, L.W., and Young, M.F. Expression of bonesialoprotein in human developing bone as revealed by im-munostaining and in situ hybridization. J Bone Miner Res 4,
246, 1989.31. Bronckers, A.L., Gay, S., Frinkelman, R.D., and Butler, W.T.
Developmental appearance of Gla proteins (osteocalcin) andalkaline phosphatase in tooth germs and bones of the rat.Bone Miner 2, 361, 1987.
32. Camarda, A.J., Butler, W.T., Finkelman, R.D., and Nanci, A.Immunocytochemical localization of g-carboxyglutamicacid-containing proteins (osteocalcin) in rat bone and dentin.Calcif Tissue Int 40, 349, 1987.
33. Ren, H., Cao, Y., Zhao, Q., Li, J., Zhou, C., Liao, L., Jia, M.,Zhao, Q., Cai, H., Han, Z.C., Yang, Y., Chen, G., and Zhao,R.C. Proliferation and differentiation of bone marrow stro-mal cells under hypoxic conditions. Biochem Biophys ResCommun 347, 12, 2006.
34. Arsenault, A.L., and Grynpas, M.D. Crystals in epiphysealcartilage and cortical bone of the rat. Calcif Tissue Int 43,
219, 1988.35. Bunell, J.M., Teubner, E.J., and Miller, A.G. Normal matu-
rational changes in bone matrix, mineral, and crystal size inthe rat. Calcif Tissue Int 31, 13, 1980.
36. Danilchenko, S.N., Kukharenko, O.G., Moseke, C., Protsen-ko, Y.I., Sukhodub, L.F., and Sulkio-Cleff, B. Determinationof the bone mineral crystallite size and lattice strain fromdiffraction line broadening. Cryst Res Technol 37, 1234,2002.
37. Sasaki, N., and Sudoh, Y. X-ray pole figure analysis of ap-atite crystals and collagen molecules in bone. Calcif TissueInt 60, 361, 1997.
38. Mao, J.J. Stem-cell-driven regeneration of synovial joints.Biol Cell 97, 289, 2005.
Address correspondence to:Francesco Curcio, M.D.
Dipartimento di Patologia e Medicina Sperimentale e ClinicaUniversity of Udine
P.le S. Maria della MisericordiaUdine 33100
Italy
E-mail: [email protected]
Received: November 19, 2009Accepted: July 9, 2010
Online Publication Date: August 23, 2010
FROM BONE MARROW TO HYDROXYAPATITE 3667