Human Activity Recognition Using Inertial Sensors in a ...
28
sensors Article Human Activity Recognition Using Inertial Sensors in a Smartphone: An Overview Wesllen Sousa Lima 1, * , Eduardo Souto 1 , Khalil El-Khatib 2 , Roozbeh Jalali 2 and Joao Gama 3 1 Universidade Federal do Amazonas, Manaus 69080-900, Brazil 2 University of Ontario Institute of Technology, Oshawa ON L1H 7K4, Canada 3 Institute for Systems and Computer Engineering, Technology and Science—INESCTEC, Porto 4200-465, Portugal * Correspondence: [email protected] Received: 27 April 2019; Accepted: 17 July 2019; Published: 21 July 2019 Abstract: The ubiquity of smartphones and the growth of computing resources, such as connectivity, processing, portability, and power of sensing, have greatly changed people’s lives. Today, many smartphones contain a variety of powerful sensors, including motion, location, network, and direction sensors. Motion or inertial sensors (e.g., accelerometer), specifically, have been widely used to recognize users’ physical activities. This has opened doors for many different and interesting applications in several areas, such as health and transportation. In this perspective, this work provides a comprehensive, state of the art review of the current situation of human activity recognition (HAR) solutions in the context of inertial sensors in smartphones. This article begins by discussing the concepts of human activities along with the complete historical events, focused on smartphones, which shows the evolution of the area in the last two decades. Next, we present a detailed description of the HAR methodology, focusing on the presentation of the steps of HAR solutions in the context of inertial sensors. For each step, we cite the main references that use the best implementation practices suggested by the scientific community. Finally, we present the main results about HAR solutions from the perspective of the inertial sensors embedded in smartphones. Keywords: human activity recognition; smartphones; inertial sensors; features extraction 1. Introduction Human activities have been commonly used to define human behavioral patterns. The availability of sensors in mobile platforms has enabled the development of a variety of practical applications for several areas of knowledge [1,2] such as: • Health—through fall detection systems [3], elderly monitoring [4], and disease prevention [5]. • Internet of Things and Smart Cities—through solutions used to recognize and monitor domestic activities [6] and electrical energy saving [7]. • Security—through individual activity monitoring solutions [8], crowd anomaly detection [9], and object tracking [10]. • Transportation—through solutions related to vehicle [11,12] and pedestrian [13] navigation. For this reason, the development of solutions that recognize human activities (HAR) through computational technologies and methods has been explored in recent years [11,14–16]. In this sense, the HAR problem has previously been treated as a typical pattern recognition problem, and more specifically, a classification problem, that is, to identify the activity being performed by an individual at a given moment. For this reason, most HAR solutions have been developed using artificial intelligence methods through various machine learning techniques, including shallow (e.g., Sensors 2019, 19, 3213; doi:10.3390/s19143213 www.mdpi.com/journal/sensors
-
Upload
khangminh22 -
Category
Documents
-
view
3 -
download
0
Transcript of Human Activity Recognition Using Inertial Sensors in a ...
sensors
Article
Human Activity Recognition Using Inertial Sensorsin a Smartphone: An Overview
Wesllen Sousa Lima 1,* , Eduardo Souto 1, Khalil El-Khatib 2, Roozbeh Jalali 2 and Joao Gama 3
1 Universidade Federal do Amazonas, Manaus 69080-900, Brazil2 University of Ontario Institute of Technology, Oshawa ON L1H 7K4, Canada3 Institute for Systems and Computer Engineering, Technology and Science—INESCTEC,
Porto 4200-465, Portugal* Correspondence: [email protected]
Received: 27 April 2019; Accepted: 17 July 2019; Published: 21 July 2019�����������������
Abstract: The ubiquity of smartphones and the growth of computing resources, such as connectivity,processing, portability, and power of sensing, have greatly changed people’s lives. Today, manysmartphones contain a variety of powerful sensors, including motion, location, network, and directionsensors. Motion or inertial sensors (e.g., accelerometer), specifically, have been widely used torecognize users’ physical activities. This has opened doors for many different and interestingapplications in several areas, such as health and transportation. In this perspective, this work providesa comprehensive, state of the art review of the current situation of human activity recognition (HAR)solutions in the context of inertial sensors in smartphones. This article begins by discussing theconcepts of human activities along with the complete historical events, focused on smartphones,which shows the evolution of the area in the last two decades. Next, we present a detailed descriptionof the HAR methodology, focusing on the presentation of the steps of HAR solutions in the context ofinertial sensors. For each step, we cite the main references that use the best implementation practicessuggested by the scientific community. Finally, we present the main results about HAR solutionsfrom the perspective of the inertial sensors embedded in smartphones.
Keywords: human activity recognition; smartphones; inertial sensors; features extraction
1. Introduction
Human activities have been commonly used to define human behavioral patterns. The availabilityof sensors in mobile platforms has enabled the development of a variety of practical applications forseveral areas of knowledge [1,2] such as:
• Health—through fall detection systems [3], elderly monitoring [4], and disease prevention [5].• Internet of Things and Smart Cities—through solutions used to recognize and monitor domestic
activities [6] and electrical energy saving [7].• Security—through individual activity monitoring solutions [8], crowd anomaly detection [9], and
object tracking [10].• Transportation—through solutions related to vehicle [11,12] and pedestrian [13] navigation.
For this reason, the development of solutions that recognize human activities (HAR) throughcomputational technologies and methods has been explored in recent years [11,14–16]. In thissense, the HAR problem has previously been treated as a typical pattern recognition problem, andmore specifically, a classification problem, that is, to identify the activity being performed by anindividual at a given moment. For this reason, most HAR solutions have been developed usingartificial intelligence methods through various machine learning techniques, including shallow (e.g.,
Sensors 2019, 19, 3213; doi:10.3390/s19143213 www.mdpi.com/journal/sensors

Sensors 2019, 19, 3213 2 of 28
Support Vector Machine (SVM), Decision Tree, Naive Bayes, and KNN) and deep algorithms (e.g.,Convolutional Neural Network (CNN), Recurrent Neural Network (RNN), Restricted BoltzmannMachine (RBM), Stacked Autoencoder (SAE), Deeply-Connected Network (DFN), and Deep BeliefNetwork (DBN)) [16–19].
The development of efficient solutions for HAR depends on understanding the concepts,limitations, and challenges. Human activities are defined as a set of actions that can be repeated overtime in a given environment [20]. When these actions become noticeable and frequent, this set can beconsidered an activity, such as walking and cooking. However, the problem with the existing solutionsthat recognize human activities is related to the predictive capacity of the classification models adopted,since each individual tends to perform activities in different ways due to habits, personal preferences,and health. In addition, the number of activities performed by a human is much greater than currentsolutions are able to recognize. Even with such limitations, solutions developed in this area havepresented interesting results in specific applications related to well-being through the recognition ofusers’ physical activities [19,21,22].
Smartphones have been commonly employed to develop HAR solutions because of the ubiquitouscapability and diversity of sensors embedded in such devices. Smartphones are included in the scopeof wearable computing [23,24], and these devices are considered part of mobile computing-based HARsystems. The advantage of smartphones over other wearable devices is associated with their abilityto (a) capture and process data, (b) transmit and receive data, and (c) connect with other devices orsensors available in the physical environment. Inertial sensors such as the accelerometer and gyroscopeare most commonly used to capture information related to acceleration and direction of movement ofthe human body, respectively. These sensors have allowed for the extraction of diverse informationabout the user that can be used to recognize individual physical activities [25].
HAR solutions based on smartphones with inertial sensors have evolved and followed adevelopmental methodology with well-defined steps such as data collection, segmentation andfusion, extraction and selection of features, and generation of classification models through machinelearning algorithms [16,17]. Recently, the HAR area has converged to use new deep learning techniquesthat have changed the procedures commonly used for extraction and feature selection steps oftraditional methodology [19]. These procedures refer to the way the features are extracted since thedeep learning algorithms can automatically generate the features during training of the classificationmodels, whereas in the traditional procedure, the features are defined manually.
This article analyzes the variations in HAR methodologies based on the recognition ofusers’ physical activities (e.g., walking and running) through smartphones equipped with inertialsensors. The article was motivated by the need for a comprehensive discussion about the maindifferences between the traditional methodology based on shallow machine learning algorithmsand the methodology based on deep learning algorithms. Prior surveys approach the traditionalmethodology [11,14,16,18,22,26–28] and methodology based on deep learning [19,29] separately. In thissense, this article has three main contributions. The first contribution is an impact analysis of theextraction process for manual and automatic features using shallow and deep machine learningalgorithms. The second contribution is the increment of the previous surveys along with thepresentation of more complete information with topics related to the inertial sensors data fusion,impact of solutions on the battery power consumption in smartphones, and a variety of techniques toreduce data dimensionality.
The third contribution consists of a better presentation of the HAR area in the context ofsmartphones with inertial sensors. This presentation includes the description of users’ activitiesconcepts, applications, and challenges. Furthermore, the following stages are described: (1) dataunderstanding, (2) data preparation, (3) data modeling and inference, and (4) evaluation of HARsolutions. All of these steps are part of a well-defined methodology commonly used to develop HARsolutions. For each step of the methodology, we present a detailed description including a list of papersgrouped by different forms of data processing. Besides, we highlight the best practice recommendations
Sensors 2019, 19, 3213 3 of 28
for implementing each step in future implementations. In addition, we present historical events todemonstrate the evolution of solutions, identifying the opportunities and motivating the developmentof new solutions for future research.
2. Understanding Human Activities
Human activities, such as bathing, cooking, working, and driving, can be defined as a set ofactions performed by the user over a period in a given environment [20]. Formally, an instance oroccurrence of an activity is defined by a sequence of sensor events. Events are defined as sequences ofdata formed by consecutive sensor readings in a given period. Each event, e, has the form e = (t, s, m)
where t represents the time, s the sensor, and m the sensor message. In this way, a set of activities canbe defined as A = (a1, a2, . . . , an), where an = (e1, e2, . . . , ek) represents n-nth activity and ek the k-nthevent [19].
Human activities can be categorized by the complexity level of the recognition process.Dernbach et al. [30] and Shoaib et al. [21], for example, categorize activities as simple and complex, whileKhan et al. [31] and Reiss [32] categorize the activities as low-level and high-level. Both categorizationshave the same meanings. Briefly, simple or low-level activities are those activities that can only berecognized by analyzing data from one or more sensors in a short period of time (e.g., walking andrunning). While complex or high-level activities can be seen as a set of low-level activities that can berecognized over a long period of time (e.g., work and shopping).
Most studies of HAR in smartphones focus on the use of inertial, acoustic, radio, and localizationsensors. Based on this, activities on this scale can be divided into two groups [11,16]. The firstdeals with activities related to an individual’s movement (e.g., walking and running) and the seconddeals with activities related to an individual’s location (e.g., work and shopping). Studies related tomovement activities focus on the analysis of users’ physical activities [25], while studies related tolocation activities focus on tracking users’ positions [13,33,34].
In this context, this survey focuses on detecting physical activities that are performed by usersusing inertial sensors (e.g., accelerometer and gyroscope) embedded in smartphones. The physicalactivities of the users are directly related to the movement and resting of the human body. Therefore,the activities detected in this context and those addressed by the solutions presented in this workinclude walking, running, lying down, standing, biking, driving, and climbing stairs.
3. Research Method
To identify the papers presented in this article, we have used some systematic review techniquesto maximize the amount of works in the HAR area for smartphones. For this, we get papers from themain digital libraries as IEEE Explorer, ACM, Springer, and Google Scholar. The query used to recoverthe works was based on the following research questions:
1. What are the methodologies used in HAR focused in smartphones instrumented with theinertial sensors?
2. What are the best practices, in terms of methods and techniques, for developing anefficient solution?
3. Which sensors can capture representative data capable of improving the assertiveness of theactivity’s classification?
The query was composed for the combination of the keywords “recognition of human activity”,“smartphones”, “inertial sensors”, “machine learning”, and synonyms. For instance:
(“human activity recognition” OR “activity recognition”) AND (smartphones OR “mobilephones”) AND (“inertial sensors” OR “accelerometer” OR “gyroscope”) AND (“machine learning” OR“classification algorithms” OR “deep learning”)
Sensors 2019, 19, 3213 4 of 28
In addition to the automated search in the digital libraries, we also used the snowballingtechnique [35] give us more security in capturing relevant articles. Basically, we have analyzed the mostimportant references cited by the retrieved works. The results are organized in the following sections.
4. General Motivation for the Smartphone-Based HAR Area
Why are smartphones one of the main tools used for recognizing human activities? This questioncan be answered by the fact that smartphones are portable and since they have computationalpower, communication capability, in addition to a variety of embedded sensors. These features havemade smartphones a key ubiquitous platform for HAR due to their ability to extract and combinecontext information from different types of real-world environments. Lane et al. [15] cite four factorsthat demonstrate how a smartphone is an ideal platform for recognizing human activities. First,the smartphone is an inexpensive device that brings together various hardware and software sensorsin one device. Second, smartphones are open and programmable devices. Third, smartphones havea high power of mass reach by distributing content and applications via virtual stores (e.g., appstore). Finally, cloud computing allows developers to have extra features that serve as support andinformation sharing for these devices. In addition, data on users’ activities, preferences, and socialinteractions can be used to recognize, monitor, and react to virtually any phenomenon, be it physical,psychological or social.
To reinforce the motivation to use smartphone device in the HAR area, the main historical eventsthat marked the evolution of the HAR area from the perspective of smartphones are as follows.
One of the first historical milestone was in 2006, when the first HAR solutions appeared thatexplicitly used smartphones [36,37]. At that time, the first studies were performed using data analysisextracted from the GSM sensors and accelerometer for monitoring users’ mobility. During this period,all data processing was performed on a computer (offline processing) because smartphones had limitedcomputational resources.
As of 2007, the literature has advanced to the development of the first collaborative solutions [38–40].The communication and processing model adopted by these solutions adheres to the following flow:smartphone data was collected, sent to a server on the Internet, where the users’ information was shared.In general, such information was used to improve the accuracy of the classification models of machinelearning algorithms. Only until 2008, with the evolution of processing and storage technologies insmartphones, did solutions begin to appear in which the data collection and processing were executedin the smartphone itself [41].
As of 2009, smartphones were equipped with an even greater number of sensors, allowing usersto recognize new activities, such as human voice recognition. The works of SoundSense [42] representthis scenario very well with recognition of activities based on the ambient sound, such as groupconversations. Around the same time, more studies focused on the development of applications in thehealthcare area, as chronic diseases detection based on the locomotion problems of the users [4,43,44].
As of 2010, researchers focused on improving the specificities of the HAR recognition process,such as (i) efficient data collection through continuous sensing to improve the energy efficiency ofbatteries [45], (ii) improvement of classification models using a set of classifiers [46], and (iii) detectionof transition intervals between activities [47]. In addition, Berchtold et al. [39] proposed the creationof a HAR cloud service that allows for constant updating of the classification models embedded insmartphones through feedback from users.
Starting in 2011, more specific solutions emerged, such as the first discussions related to theeffects of location and orientation of the smartphones on the users’ body [25,48]. For example,Henpraserttae et al. [48] showed that the smartphone located in the hand and on the waist of anindividual produces different signals and, consequently, require different analyzes to recognize the sameactivity. During the same time, the first public database was published, as the WISDM database [49].Public databases assist in the validation and comparison of new HAR methods over existing ones.
Sensors 2019, 19, 3213 5 of 28
In 2012, the first studies related to the recognition of more complex activities using smartphoneswere published. Dernbach et al. [30] and Khan et al. [31], for example, combined data from the inertialsensors to recognize daily (e.g. cooking) and physical activities. Das et al. [50] combined sensor datafrom smartphones and smart environment sensors to recognize users’ daily activities. Other worksfocused on improving online solutions so that the entire data process occurs in the mobile device [46,47].
From 2013, data fusion techniques for multiple sensors were applied in the feature extractionstep [51]. In addition, more detailed studies for discovering accurate lightweight features wereperformed [52]. In 2014, some research focused on the data segmentation step with the objectiveof measuring the impact of time window size on the accuracy of classification models [53]. From2015, the HAR area began to converge with the application of deep learning classification algorithms,with the first work developed by Alsheikh et al. [54]. From there, the classification models generatedby the deep learning methods became the state of the art of classifying activities.
In 2016, new HAR researchers emerged focusing on the data streaming area [55]. At this point,such problem has been treated as an online learning problem in order to minimize the need to storea historically required training of the classification models. In addition, this method is based on thenovel detection with the objective of mapping new activities that, by chance, are not represented inthe classification models. The method also includes continuous interaction with the user throughactive learning. In addition, new studies [56] related to transition-between-activity recognition(e.g., sit-to-stand) emerged in an attempt to eliminate classification errors of the models, since the datareferring to transitions are considered noise in the database.
In 2017, several studies [31,57–60] performed comparative analyzes among the various HARsolutions available in the literature. Most of the analyzes tried to discover the effectiveness of thefeatures in the classification models generated by machine learning algorithms. Recently, in 2018,frameworks have emerged to encapsulate all the previously studied steps and methods into a genericarchitecture [61]. From there, new implementations of HAR in API’s (Application ProgrammingInterface) format could arise to facilitate the development of HAR applications.
5. Human Activity Recognition Process
The process of human activities recognition is very similar to a general-purpose pattern recognitionsystem and corresponds to a set of steps ranging from data collection to activities classification.This process involves a set of transformations of the raw data extracted from sensors to generateefficient classification models of human activities. The HAR methodology for smartphones equippedwith inertial sensors can be divided into two approaches based on machine learning techniques asshallow algorithms (e.g., SVM, KNN, and decision tree) and deep algorithms (e.g., CNN, RNN, RBM,SAE, DFN, and DBM). The main difference between these approaches is the way in which the featuresare extracted, that is, whether it is manually or automatically extracted [19].
This difference is highlighted mainly because the conventional process of feature extraction islimited by human knowledge [62]. In the case of data collected from inertial sensors, the features arecommonly extracted based on two main domain features: time domain and frequency domain [63].The disadvantage of this conventional approach is that, in some cases, human expertise may notalways be able to select the best set of features for different scenarios. Another disadvantage is thatthis approach can generate irrelevant features, making it necessary to apply methods that reducethe dimensionality of the data, such as feature selection, since unnecessary features can affect theperformance of classification algorithms.
In order to overcome these disadvantages, deep learning algorithms provide a benefit to thefeature extraction step due to their ability to automatically generate features. These algorithms arecapable of generating complex and high-level features that represent the data well and generate efficientclassification models for different scenarios. For this reason, deep learning methods are considered thestate of the art in areas such as computational vision and natural language processing [64].

Sensors 2019, 19, 3213 6 of 28
To illustrate the difference between the two approaches, Figure 1 shows the steps commonly usedin conventional approaches, highlighting the segmentation and features extraction steps. Figure 2shows the steps commonly used in the deep learning approach, where the features are implicitlygenerated in the hidden layers of the neural networks, during the training and construction phase ofthe classification models. The other steps are shared between the two approaches. Section 5.3 containsmore details of the feature extraction step for both approaches.
Sensors 2018, 18, x FOR PEER REVIEW 6 of 27
the classification models. The other steps are shared between the two approaches. Section 5.3 contains more details of the feature extraction step for both approaches.
Figure 1. Set of steps based on the manual features’ extraction used by shallow learning algorithms.
The segmentation step is part of the data preparation process, in which data is divided into segments known as time windows. Time windows are used in the process of extracting features in the conventional approach. The deep learning approach does not need to use time windows because the data processing occurs directly in raw data. On the other hand, some works [25,46,65] add an earlier step regarding the pre-processing of raw data in order to minimize noise caused by anomalies related to environmental conditions, movements, and changes in user behavior during data collection. The most commonly used noise elimination techniques are Lowpass filters [65], moving average filter [25] and Kalman [46]. In this case, both approaches can use this strategy.
Figure 2. Set of steps based on the automatic features’ extraction used by deep learning algorithms.
The initial step in data collection studies is as follows: raw data is collected from smartphone sensors, such as accelerometer and gyroscope. For this, a set of parameters such as type, time, and frequency of data collection, as well as, the position and orientation of the smartphone on the user's body should be taken into consideration. Smartphones commonly used in data collection have embedded operating systems like Android, IOS, and Symbian. The last step concerns the construction of classification models to infer human activities. Classification models are generated based on shallow or deep machine learning algorithms.
The data fusion step is a cross-process used to combine data from multiple sources. This cross-sectional aspect occurs because the data can be combined in any of the steps described above. For example, i) in the data collection and segmentation steps where signal fusion techniques such as Magnitude can be applied, ii) in the feature extraction step where the strategy of concatenating vectors of features can be applied, and finally ii) in the classification step where an ensemble of classifiers can be used to aid in the inference decision. All these strategies aim to enhance the accuracy of activities classification. Section 5.3 contains more details about data fusion strategies.
Figure 1. Set of steps based on the manual features’ extraction used by shallow learning algorithms.
Sensors 2018, 18, x FOR PEER REVIEW 6 of 27
the classification models. The other steps are shared between the two approaches. Section 5.3 contains more details of the feature extraction step for both approaches.
Figure 1. Set of steps based on the manual features’ extraction used by shallow learning algorithms.
The segmentation step is part of the data preparation process, in which data is divided into segments known as time windows. Time windows are used in the process of extracting features in the conventional approach. The deep learning approach does not need to use time windows because the data processing occurs directly in raw data. On the other hand, some works [25,46,65] add an earlier step regarding the pre-processing of raw data in order to minimize noise caused by anomalies related to environmental conditions, movements, and changes in user behavior during data collection. The most commonly used noise elimination techniques are Lowpass filters [65], moving average filter [25] and Kalman [46]. In this case, both approaches can use this strategy.
Figure 2. Set of steps based on the automatic features’ extraction used by deep learning algorithms.
The initial step in data collection studies is as follows: raw data is collected from smartphone sensors, such as accelerometer and gyroscope. For this, a set of parameters such as type, time, and frequency of data collection, as well as, the position and orientation of the smartphone on the user's body should be taken into consideration. Smartphones commonly used in data collection have embedded operating systems like Android, IOS, and Symbian. The last step concerns the construction of classification models to infer human activities. Classification models are generated based on shallow or deep machine learning algorithms.
The data fusion step is a cross-process used to combine data from multiple sources. This cross-sectional aspect occurs because the data can be combined in any of the steps described above. For example, i) in the data collection and segmentation steps where signal fusion techniques such as Magnitude can be applied, ii) in the feature extraction step where the strategy of concatenating vectors of features can be applied, and finally ii) in the classification step where an ensemble of classifiers can be used to aid in the inference decision. All these strategies aim to enhance the accuracy of activities classification. Section 5.3 contains more details about data fusion strategies.
Figure 2. Set of steps based on the automatic features’ extraction used by deep learning algorithms.
The segmentation step is part of the data preparation process, in which data is divided intosegments known as time windows. Time windows are used in the process of extracting features in theconventional approach. The deep learning approach does not need to use time windows because thedata processing occurs directly in raw data. On the other hand, some works [25,46,65] add an earlierstep regarding the pre-processing of raw data in order to minimize noise caused by anomalies related toenvironmental conditions, movements, and changes in user behavior during data collection. The mostcommonly used noise elimination techniques are Lowpass filters [65], moving average filter [25] andKalman [46]. In this case, both approaches can use this strategy.
The initial step in data collection studies is as follows: raw data is collected from smartphonesensors, such as accelerometer and gyroscope. For this, a set of parameters such as type, time, andfrequency of data collection, as well as, the position and orientation of the smartphone on the user’sbody should be taken into consideration. Smartphones commonly used in data collection haveembedded operating systems like Android, IOS, and Symbian. The last step concerns the constructionof classification models to infer human activities. Classification models are generated based on shallowor deep machine learning algorithms.
The data fusion step is a cross-process used to combine data from multiple sources.This cross-sectional aspect occurs because the data can be combined in any of the steps described above.
Sensors 2019, 19, 3213 7 of 28
For example, (i) in the data collection and segmentation steps where signal fusion techniques such asMagnitude can be applied, (ii) in the feature extraction step where the strategy of concatenating vectorsof features can be applied, and finally (iii) in the classification step where an ensemble of classifiers canbe used to aid in the inference decision. All these strategies aim to enhance the accuracy of activitiesclassification. Section 5.3 contains more details about data fusion strategies.
5.1. Data Collection
In general, data collected from smartphone inertial sensors are arranged chronologically in theform of a time series. Accelerometer data, for example, are represented by a set of three vectorsacci = (xi, yi, zi), where i = (1, 2, 3, . . . , n). The accelerometer is the most commonly used sensor in theHAR for smartphones because it thoroughly represents the movement activities of users.
In order to generate good classification models, the following elements must be considered: type,time, frequency, position, and orientation of the smartphone with the user’s body. Lockhart andWeiss [66] proposed two types of data collection based on the level of naturalness with which the datais collected:
1. Natural: Users perform their daily activities normally without intervention in their behavior bythe application.
2. Semi-natural: Users perform their daily activities normally, but the user is required to performthe activities from the experiments at least once, that is, the user must ensure that all activitiesrelated to the study have been performed.
3. Laboratory: Users perform activities systematically in a controlled environment with previouslydefined steps.
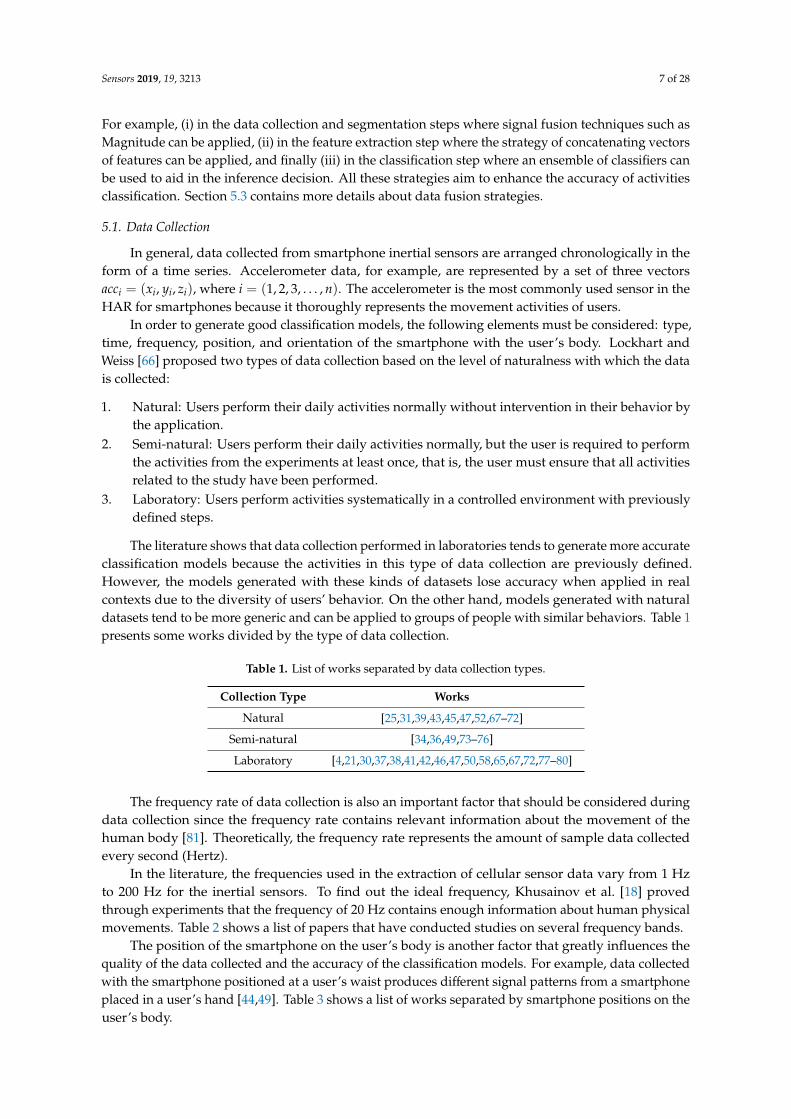
The literature shows that data collection performed in laboratories tends to generate more accurateclassification models because the activities in this type of data collection are previously defined.However, the models generated with these kinds of datasets lose accuracy when applied in realcontexts due to the diversity of users’ behavior. On the other hand, models generated with naturaldatasets tend to be more generic and can be applied to groups of people with similar behaviors. Table 1presents some works divided by the type of data collection.
Table 1. List of works separated by data collection types.
Collection Type Works
Natural [25,31,39,43,45,47,52,67–72]
Semi-natural [34,36,49,73–76]
Laboratory [4,21,30,37,38,41,42,46,47,50,58,65,67,72,77–80]
The frequency rate of data collection is also an important factor that should be considered duringdata collection since the frequency rate contains relevant information about the movement of thehuman body [81]. Theoretically, the frequency rate represents the amount of sample data collectedevery second (Hertz).
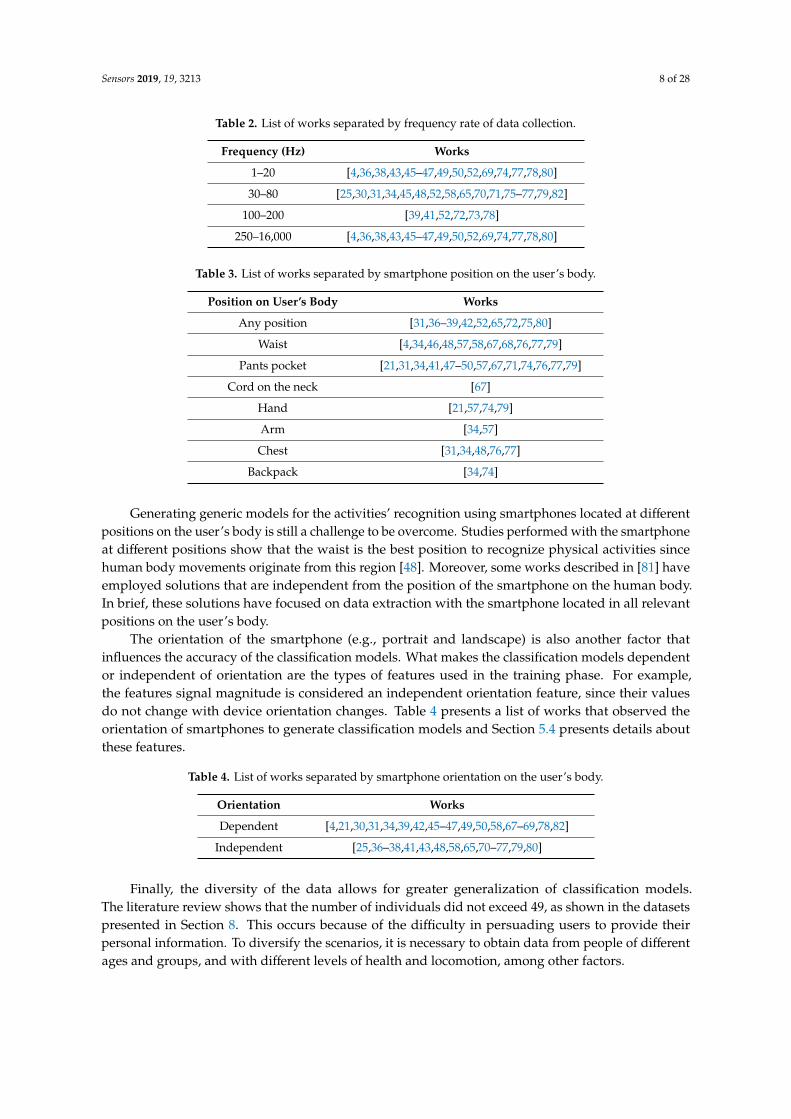
In the literature, the frequencies used in the extraction of cellular sensor data vary from 1 Hzto 200 Hz for the inertial sensors. To find out the ideal frequency, Khusainov et al. [18] provedthrough experiments that the frequency of 20 Hz contains enough information about human physicalmovements. Table 2 shows a list of papers that have conducted studies on several frequency bands.
The position of the smartphone on the user’s body is another factor that greatly influences thequality of the data collected and the accuracy of the classification models. For example, data collectedwith the smartphone positioned at a user’s waist produces different signal patterns from a smartphoneplaced in a user’s hand [44,49]. Table 3 shows a list of works separated by smartphone positions on theuser’s body.
Sensors 2019, 19, 3213 8 of 28
Table 2. List of works separated by frequency rate of data collection.
Frequency (Hz) Works
1–20 [4,36,38,43,45–47,49,50,52,69,74,77,78,80]
30–80 [25,30,31,34,45,48,52,58,65,70,71,75–77,79,82]
100–200 [39,41,52,72,73,78]
250–16,000 [4,36,38,43,45–47,49,50,52,69,74,77,78,80]
Table 3. List of works separated by smartphone position on the user’s body.
Position on User’s Body Works
Any position [31,36–39,42,52,65,72,75,80]
Waist [4,34,46,48,57,58,67,68,76,77,79]
Pants pocket [21,31,34,41,47–50,57,67,71,74,76,77,79]
Cord on the neck [67]
Hand [21,57,74,79]
Arm [34,57]
Chest [31,34,48,76,77]
Backpack [34,74]
Generating generic models for the activities’ recognition using smartphones located at differentpositions on the user’s body is still a challenge to be overcome. Studies performed with the smartphoneat different positions show that the waist is the best position to recognize physical activities sincehuman body movements originate from this region [48]. Moreover, some works described in [81] haveemployed solutions that are independent from the position of the smartphone on the human body.In brief, these solutions have focused on data extraction with the smartphone located in all relevantpositions on the user’s body.
The orientation of the smartphone (e.g., portrait and landscape) is also another factor thatinfluences the accuracy of the classification models. What makes the classification models dependentor independent of orientation are the types of features used in the training phase. For example,the features signal magnitude is considered an independent orientation feature, since their valuesdo not change with device orientation changes. Table 4 presents a list of works that observed theorientation of smartphones to generate classification models and Section 5.4 presents details aboutthese features.
Table 4. List of works separated by smartphone orientation on the user’s body.
Orientation Works
Dependent [4,21,30,31,34,39,42,45–47,49,50,58,67–69,78,82]
Independent [25,36–38,41,43,48,58,65,70–77,79,80]
Finally, the diversity of the data allows for greater generalization of classification models.The literature review shows that the number of individuals did not exceed 49, as shown in the datasetspresented in Section 8. This occurs because of the difficulty in persuading users to provide theirpersonal information. To diversify the scenarios, it is necessary to obtain data from people of differentages and groups, and with different levels of health and locomotion, among other factors.
Sensors 2019, 19, 3213 9 of 28
5.2. Segmentation
Segmentation is intended to separate data into meaningful sub-groups that share the samecharacteristics. In the context of the inertial sensors, the data subgroups are represented by signalsegments in a given time interval. The objective is for each segment to contain sufficient characteristicsthat allow the recognition of a human activity at a given moment, that is, the data analysis must bedone exactly during an execution time interval of each activity.
To achieve this goal, the data is divided into consecutive segments so that each of them isanalyzed separately and sequentially. This process is known as time windows (or sliding windows).Sliding window-based segmentation is often used to manipulate data from inertial and audio sensorsbecause events are represented by continuous values. This approach divides sensor events intoorganized subsequences over time.
Cook and Krishnan [20] define a sliding window as derived from a sequence of eventsX = {x1, x2, . . . , xn}, where x represents the value and n nth value of the sequence. The time windowis represented by a subsequence X′ =
{xp, xp+1, . . . , xp+w−1
}, where w represents the size of the time
window and p represents an arbitrary position, such as 1 ≤ p ≤ n−w + 1, where n represents the sizeof the sequence. In the case of inertial sensors, the data is represented in a three-dimensional planealong the axes xi, yi, zi, where i = (1, 2, 3, . . . , n).
Time-window based segmentation can be manipulated in two ways [18]: Overlapping andnon-overlapping windows. Non-overlapping windows are segments in which their values do notintersect with the values of other windows, i.e., X1 ∩X2 = ∅. Overlapped windows are segmentsrepresented by a percentage that defines how many samples from the previous window intersect thesamples from the next window, i.e., X1 ∩X2 , ∅. For example, given a time window with 100 samples,50% overlap means that 50 samples from the previous window will be part of the sample set from thenext window.
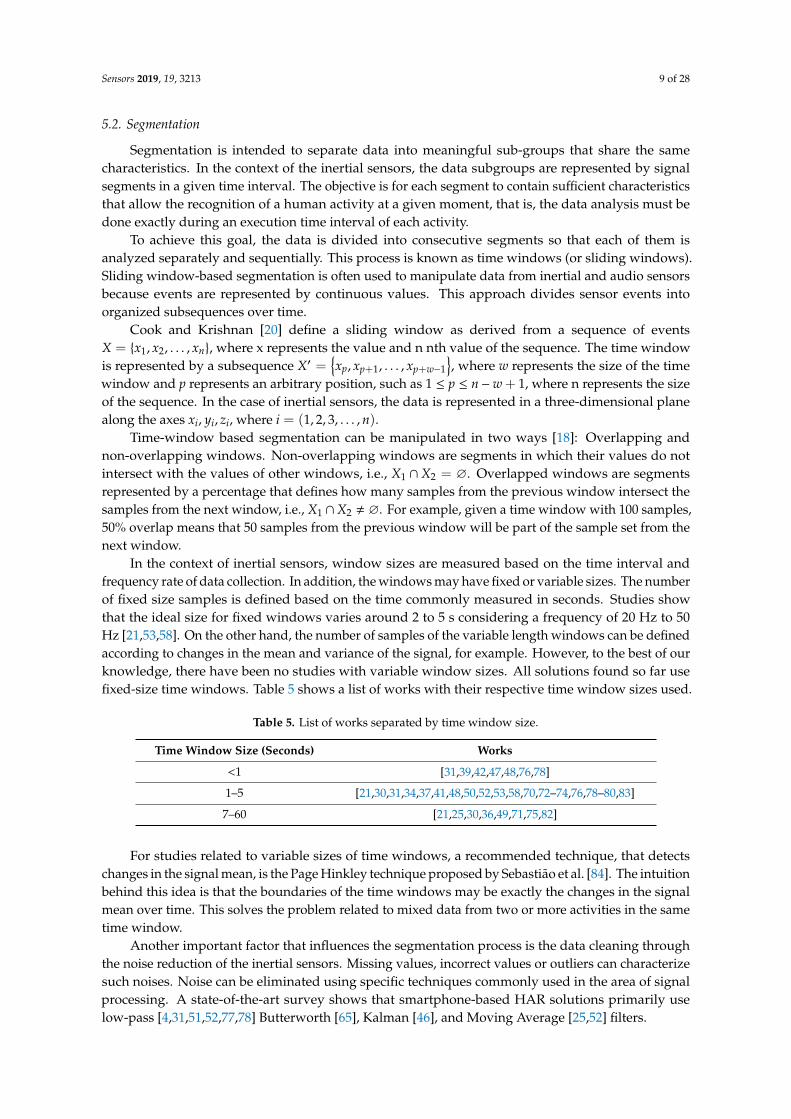
In the context of inertial sensors, window sizes are measured based on the time interval andfrequency rate of data collection. In addition, the windows may have fixed or variable sizes. The numberof fixed size samples is defined based on the time commonly measured in seconds. Studies showthat the ideal size for fixed windows varies around 2 to 5 s considering a frequency of 20 Hz to 50Hz [21,53,58]. On the other hand, the number of samples of the variable length windows can be definedaccording to changes in the mean and variance of the signal, for example. However, to the best of ourknowledge, there have been no studies with variable window sizes. All solutions found so far usefixed-size time windows. Table 5 shows a list of works with their respective time window sizes used.
Table 5. List of works separated by time window size.
Time Window Size (Seconds) Works
<1 [31,39,42,47,48,76,78]
1–5 [21,30,31,34,37,41,48,50,52,53,58,70,72–74,76,78–80,83]
7–60 [21,25,30,36,49,71,75,82]
For studies related to variable sizes of time windows, a recommended technique, that detectschanges in the signal mean, is the Page Hinkley technique proposed by Sebastião et al. [84]. The intuitionbehind this idea is that the boundaries of the time windows may be exactly the changes in the signalmean over time. This solves the problem related to mixed data from two or more activities in the sametime window.
Another important factor that influences the segmentation process is the data cleaning throughthe noise reduction of the inertial sensors. Missing values, incorrect values or outliers can characterizesuch noises. Noise can be eliminated using specific techniques commonly used in the area of signalprocessing. A state-of-the-art survey shows that smartphone-based HAR solutions primarily uselow-pass [4,31,51,52,77,78] Butterworth [65], Kalman [46], and Moving Average [25,52] filters.

Sensors 2019, 19, 3213 10 of 28
5.3. What Are Features?
Intuitively, a feature can be defined as an element endowed with some useful information aboutthe data which it represents. In the context of HAR, this concept can be used to represent the differentmovement patterns of users’ physical activities. For example, the “run” activity requires greater effortfrom the human body to generate movement compared to “walking” activity. Therefore, the intensityof the effort of each one of them is transferred to the inertial sensors, directly influencing the datadistribution collected from these sensors. Consequently, we can find ways to highlight the differencebetween “walking” and “running” activity using, for example, statistical data information. Thus,the mean and variance of the data may be useful to highlight the difference between these two activities.
In this context, the literature classifies the features in different domains of representation.Each domain has a set of specific formulas that extract different useful information from the inertialsensors signals. The classification groups of feature domains defined in the literature are [63]: timedomain, frequency domain, and discrete domain. The time domain has mathematical functions used toextract statistical information from the signals. The frequency domain has mathematical functions thatcapture repetitive patterns of signals and are often related to the natural periodicity of the activities.The discrete domain uses symbolic representation techniques to represent signal patterns throughdiscrete information. The discrete domain features are rarely exploited in the HAR area. In fact,Siirtola et al. [71] and Figo et al. [63] use the SAX discretization technique for extraction of features.Therefore, such domain is not the focus of this research.
5.3.1. Time Domain
This section presents details about the most commonly used time-domain-based characteristics inthe context of smartphone inertial sensors. These features can be divided into two types of functions:statistical functions and non-statistical functions. The statistical functions involve calculations suchas minimum, maximum, average, standard deviation, among other formulas. The non-statisticalfunctions involve several calculations such as areas, and calculation of Bins Distribution, among others.Table 6 shows the set of time domain features as found in the literature. All of them are applied to thex, y, and z axes of the inertial sensors.
Table 6. Time domain features used in the literature.
Domain Features
Time
min, max, amplitude, amplitude peak, sum, absolute sum, Euclidian norm, mean, absolutemean, mean square, mean absolute deviation, sum square error, variance, standard
deviation, Pearson coefficient, zero crossing rate, correlation, cross-correlation,auto-correlation, skewness, kurtosis, area, absolute area, signal magnitude mean, absolute
signal magnitude mean, magnitude difference function.
Among the features mentioned above, some special features can generate other new featuresthrough a process of chaining mathematical functions. For example, the signal magnitude feature canbe combined with other features, such as mean and variance, and generate new features from thiscombination [73]. The same happens with the features based on the vertical and horizontal componentsof the signals [48,79]. In addition, the signals generated by these special features present sizes equal tothe size of the original signals, while the other normal features generate compressed signals with sizesequal to the number of time windows defined in the segmentation step. In other words, these featureswork as data fusion techniques, since the coordinates x, y and z are transformed into only one axe.For these reasons, we classify the features with this type of behavior as low-level features, where theextraction process is performed in the raw data.
Signal magnitude is an orientation independent feature extracted from multiple-dimensionalsensor data. According to Khusainov et al. [18], the purpose of magnitude is to assess the degree ofmovement intensity based on thresholds derived from acceleration peaks. This is possible because

Sensors 2019, 19, 3213 11 of 28
the magnitude highlights the variation of signals caused by the merging of values between differentcoordinates of the inertial sensors. (1) Shows how to calculate the signal magnitude in data extractedfrom inertial sensors whose coordinates are x, y and z:
M(X) =√
x2i + y2i + z2i (1)
Likewise, the features based on the vertical and horizontal components are also consideredindependent orientation features [25,72]. These features also fuse the x, y and z coordinate values ofthe inertial sensors. Formally, (2) presents the formula for the calculation of the vertical component:
vi =⇀ai . g (2)
where⇀ai = (xi, yi, zi), 1 ≤ i ≤ m, i represents the values of the samples in a window of size m. The value
of g is a unit vector representing the gravity contained in the signal. The gravity g can be extractedaccording to (3):
g =(x, y, z)‖(x, y, z)‖
‖ (3)
where x, y, z represents the average of the values of each coordinate contained in a time windowand ‖(x, y, z)‖ represents the vector norm of coordinate values. The features based on the horizontalcomponents (hi) are derived from features based on the vertical components (vi). Thus, the horizontalcomponent is calculated by the formula in (4):
hi = ‖⇀ai − vproj
k‖ (4)
where, vprojk means a vertical component projection calculated by the scalar product of the vertical
component and signal gravity (5).
vprojk = vi g (5)
In addition, the magnitude features and vertical and horizontal components are consideredindependent of smartphone orientation on the user’s body
5.3.2. Frequency Domain
This section presents details about the most frequently used frequency domain features in thecontext of smartphone inertial sensors. These features present an alternative to signal analysis based onthe frequency spectrum of the values of a certain time window. The features of Table 7 are calculatedbased on the low-level fast Fourier transform (FFT) or Wavelet features. Table 7 shows the set offrequency features found in the literature. All of them are applied to the x, y, and z axes of theinertial sensors.
Table 7. Frequency domain features used in the literature.
Domain Features
Frequency Energy, energy normalized, power, centroid, entropy,DC component, peak, coefficient sum.
The frequency domain features described in Table 7 depend strictly on the low-level Fourier andWavelet transformed features. Both transformations consist of a mathematical tool that transitionsbetween variables over time for frequency variables, that is, the signal is decomposed into a set of realand imaginary values that represent components of waves called frequencies.

Sensors 2019, 19, 3213 12 of 28
In the context of HAR, the transformations are useful for representing repetitive patterns of signalsin terms of frequency. In order to calculate the Fourier transformation, an efficient algorithm is used tocalculate the discrete Fourier transform (DFT), called fast Fourier transform (FFT), whose formula isrepresented by (6):
FFT(X) =∑n−1
k=0xke−2πi j k
n (6)
where xk is a sequence of size n which represents a contiguous signal and e−2πi j kn represents the
nth primitive root of each unit of xk. More details about the primitive root can be found in [84].The calculation of the Wavelet transformation is similar to the calculation of the Fourier transform,the difference being that the values of a range are represented in terms of orthogonal bases. Thereare several ways to calculate the Wavelet transform by observing continuous and discrete values.However, in the context of HAR, the literature uses a simplified form called Haar Wavelet. This form isrepresented by the basic Wavelets calculation formula presented by Strang [85].
In addition, some features belonging to the time domain can be adapted to the frequency domain,such as peak frequency amplitude of coefficients, coefficient mean, coefficient area, among others, sincereal and imaginary coefficients also form value vectors. You can then extract statistical informationabout them. The features derived from the Fourier and Wavelet transformations are dependent on theorientation of the smartphone on the user’s body.
5.4. Feature Extraction
In general, the feature extraction corresponds to a process of data transformation performed onthe segmented data. In the context of inertial sensors, this process is necessary because the raw data,represented by the signal, are not suitable for use by conventional machine learning algorithms [20,86].This section presents details about how the features of time and frequency domains are extracted fromthe signal. In addition, this section addresses aspects related to data dimensionality reduction in thedatasets generated after the feature extraction step.
5.4.1. Time and Frequency Domain
Time and frequency domain features are extracted in the same manner, i.e., both are derived fromprocesses performed on the time windows defined in the segmentation step. For this reason, the sizeand overlap rate of time windows directly implies the quality of the features. The feature extractionprocess generates a new dataset used in for training and the generation of activities classificationmodels. Table 8 shows the studies distribution separated by the feature domains.
Table 8. List of works separated by domain features.
Feature Domain Works
Time [4,25,30,31,34,36,38,39,41,43,45,47,49,50,52,65,67–80,82]
Frequency [25,34,37,41,45,68,70,72,74,79,80,82]
Some important data indicates that most HAR-based work on smartphones with inertial sensorsuses the time-domain-based features [52,66]. The reason for the wide use of this approach is that,in general, the time domain features have a lower computational cost when compared to the frequencydomain features [74,81]. In contrast, the features of the frequency domain can better represent contextinformation in terms of signal patterns.
Low-level features described in Section 5.3 can be divided based on the smartphone orientationon the user’s body (landscape and portrait), that is, the features can be dependent or independentfrom the device orientation on the user’s body. The magnitude feature, for example, is considered anindependent orientation, whereas the FFT and Wavelet features are considered orientation dependent.As a result, all new features derived from any low-level feature inherit the dependency or independency

Sensors 2019, 19, 3213 13 of 28
orientation. On the other hand, when applied in isolation, the time and frequency domain features areall orientation dependent.
5.4.2. Data Dimensionality Reduction
Dimensionality is attributed to the number of features contained in a dataset, where each featurerepresents a dimension in space. In this way, a large space of features evidences two problems. The firstis related to the cost of data processing and the second to the accuracy of the classification modelsgenerated in the learning phase. In addition, there is the problem of dimensionality curse that canprovide high error rates in a classifier [87]. In this sense, the process for data dimensionality reductioninvolves removing irrelevant features to improve the accuracy of classification models. For this reason,Khusainov et al. [18] affirm that the choice of features is more important than the choice of classificationalgorithms since the poor quality of the features can negatively impact the accuracy of any modelgenerated by the conventional machine learning algorithms.
The literature about data dimensionality reduction is quite extensive [87], however, few studieshave used such techniques in the context of smartphone-based HAR. Even so, it is possible to identifytwo types of techniques used in this context. The first deals with techniques that act after the featureextraction step and the second deals with techniques that act during the feature extraction step.
The first type is characterized by feature selection techniques. These sets of techniques selectthe most representative features from all features available in the dataset. In the context of HAR, wecan mention some examples used in the solutions proposed by Khusainov et al. [18] and Khan (2011).These methods were used based on the analysis of the information gain of the features (Info-gainmethod) and how each one is correlated with one another (Correlation-based Feature Selection method).Both methods analyze the impact that each feature has on the performance of the classification models,a feature that does not have information gain or is highly correlated with each other can be discardedfrom the dataset.
While the features selection techniques define the subset of features that best discriminate humanactivities, the methods that operate during the feature extraction step combine the features to reduce thedata dimensionality. Besides, new features that have lower intra-class variance and higher inter-classvariance are generated to increase the separability of activities before feeding the classifier [88]. In thiscontext, the techniques most used in the context of HAR are Principal Component Analysis (PCA),Linear Discriminant Analysis (LDA), and Kernel Discriminant Analysis (KDA).
Khan et al. [31] present the results of a series of experiments related to the data dimensionalityreduction in the context of the inertial sensors. The results show that the methods that work duringthe feature extraction process are more efficient compared to the features selection methods. Amongthem, the feature generated by the KDA obtained the best classification models. In another paper,Khan et al. [52] combined the KDA with several sets of features, including time and frequency domain.Thus, the combination of the KDA and time domain features obtained better results in the accuracy ofthe classification models.
Recently, new dimensionality reduction methods have been employed in the context of HAR.For example, Hassan et al. (2017) use the Kernel PCA (KPCA) method with a statistical kernel thatimproves PCA performance. Siddiqi et al. (2014) use the nonlinear method called Stepwise LinearDiscriminant Analysis (SWLDA) that selects discriminant features using regression methods combinedwith statistical technique F-test. Finally, Guo and Wang (2018) used a modification of the LDA methodcalled Robust Linear Discriminant Analysis (RLDA).
5.4.3. Feature Extraction based on Deep Learning
Features extraction methods based on deep learning techniques act differently from conventionalfeature extraction methods. The main difference between the two approaches is that the deep learningalgorithms are able to generate the features automatically during the training process of the classificationmodels. Such models are trained with more complex features and, in some cases, belong to unknown
Sensors 2019, 19, 3213 14 of 28
domains. In addition, features may change from one database to another, even if users perform thesame activities. This is because neural networks can adapt to the distribution of data. For this reason,features extracted through deep learning methods have generated the best classification models inthe HAR context, since, unlike traditional methods, deep learning methods are capable of designingsignificant and high-level features tailored to each scenario and data type [19].
To better understand the feature extraction process based on deep learning, it is important toknow the basic structure of deep learning algorithms. In summary, the deep learning methods arebased on neural networks with multiple layers that depend each other [89]. Each layer represents alevel of the problem abstraction, i.e., the greater the number of layers, more details of the problemare mapped to the classification models. For example, in the context of image processing, the firstlayer may contain features that represent the image texture, while the second layer may contain otherfeatures that represent the lines and edges of the image. The same analogy can be made in the contextof smartphone-based HARs. In this way, the first layer can represent the intensity of the movementsof each activity and the second layer can represent the correlation between the movements. Thus,each layer of a deep neural network can represent a set of features referring to a level of detail of agiven problem.
There are several deep learning methods described in [89]. However, in the context of HAR forsmartphones only five methods were identified, of which they are: Deeply-connected network (DFN),Convolutional Neural Network (CNN), Recurrent Neural Network (RNN), Long Short-Term Memory(LSTM), Stacked Autoencoder (SAE), and Restricted Boltzmann Machine (RBM). If we only analyzefrom the perspective of feature extraction, all these methods are similar, with differences in the numberof layers and in the way the layers are connected to each other.
A CNN is represented by successive convolutions and poolings between the layers.The convolution is a mathematical tool used to treat a matrix by means of another kernel matrix.The result is a linear transformation of all elements of the original matrix. In practice, this transformationcauses effects such as enhancing the edges of an image or the type of motion of an activity.
The role of pooling in this context is to resize the matrix so that spatial size is reduced to reducethe number of parameters and operations in the network. In practice, this means that a 5 × 5 sizematrix can be reduced to 2 × 2. In the context of a CNN, the features are represented by the neurons ofthe subsequent successive layers represented by convolutions and poolings. The overview of the othermethods is simpler and limited to the number of neurons and hidden layers of neural networks.
In terms of data input, each coordinate represents an input channel for the neural network. In thisway, the processing is done by successive 1D convolutions. Otherwise, Wang et al. (2017) presented adata pre-processing where the three-dimensional signal is transformed into an image and, thus, theprocessing in the neural network is done through 2D convolutions.
The DFN method is characterized by a denser traditional Artificial Neural Network (ANN), i.e.,the DFN contains many hidden layers (deep) in contrast to the traditional ANN that only has a fewshallow layers. The SAE method is characterized by the use of a stack of autoencoders. Autoencodersare neural networks where hidden layers learn the features in an unsupervised way (pre-training)through a process of encoding and decoding data entry. The RNN method is characterized by arecurrent neural network that uses temporal dependencies between the neurons. Likewise, the LSTMacts in the temporal context based on memory units, where it is possible to “forget” or “update” someinformation from the hidden layers when necessary. Finally, the RBM method is characterized by abipartite neural network, without direction and with the neurons of the layers completely connected toeach other. A stack of RBMs is called the Deep Belief Network (DBN).
In addition, some papers use a combination of deep models. For example, Ordónez andRoggen [90] and Yao et al. [91] present examples of how to combine CNN and RNN. More details oneach of these methods can be found in [89]. The number of features generated by any of the methodsmentioned above depends on the definition of training hyperparameters of the neural networks.

Sensors 2019, 19, 3213 15 of 28
The main parameters used in the configuration of a neural network are a number of layers,number of neurons for each layer, number of times, learning rate, regularization weight, and activationfunction [60].
Although deep neural networks are able to generate the features automatically, Hassan et al. (2017)verified how these networks behave with the conventional features of time and frequency domains.In this case, the experiments were performed with 561 features using a DBN method architecture.The results presented better accuracy compared to conventional methods with an average differenceof around 2%. Furthermore, prior to targeting the HAR area for deep learning, Khan (2011) realized,through experiments, that a hidden neural network with several hidden layers was able to generateuseful features without resorting to the features of time and frequency domain.
5.5. Training and Classification
After the data processing in the segmentation and features extraction steps, the next step is touse classification algorithms that are responsible for generating classification models to infer humanactivities. In this context, the classification algorithms are divided into two groups. The first dealswith conventional machine learning algorithms and the second deals with deep learning algorithms.In this way, the inference (or classification) models are generated through a training process of theclassification algorithms. These models are generated from a training dataset where the activitysamples must be properly labeled with the activities. Formally, the training process of these models isdefined as follows [20]:
Given a random variable X belonging to an n-dimensional plane, this variable corresponds toattributes, or features, extracted from the sequences of sensor events. Thus, X =
⟨x1, x2, . . . , xn
⟩, where
x represents a feature and n the number of features. The variable X has an associated y variablethat represents the target attribute or class of the variable X. Thus, y =
⟨y1, y2, . . . , yn
⟩,where y
represents the class and n the number of classes. Therefore, the set of training L consists of pairs{(x1, y1
),(x2, y2
), . . . , (xn, yn)
}, where (xn, yn) represents an instance formed by a set of attributes xn
and a class yn. The classification models are categorized as follows [22,92]:
1. Impersonal or generic: Models are trained with data from one user group and tested on anothergroup of different users.
2. Personal or specific: Models are trained with data from only one user and tested with thesame user.
3. Mixed: models are trained using the entire database without distinction between users.
In addition, classification models can be generated based on three strategies:
1. Cross-validation: the database is randomly divided into 10 equal parts, where the models aregenerated with 9 parts and tested with the remaining part. This is repeated until all parts areindividually used as training. The final accuracy consists of the average of the 10 classificationmodels generated in 10 training rounds.
2. Leave-one-subject-out: This strategy is similar to cross-validation, but instead of being randomlydivided into equal parts, the data is divided by the user. The data of each user is used as a test.
3. Leave-30%-out: This strategy consists of dividing the data into 70% for training and 30% for testing.
In general, previous studies have sought to develop impersonal models with high accuracy rates;however, generating recognizers of human activities that consider factors such as age and health of theuser is still a challenge. One solution to this problem would be to generate classification models foreach user profile, such as children, adults, people with locomotion difficulties, among others.
The shallow machine learning algorithms commonly used to recognize users’ physical activitiesare represented by Naïve Bayes, Support Vector Machine (SVM), neural networks, KNN, and thedecision tree family algorithms, for example. These algorithms use the time and frequency domainsfeature in the training process of the classification models. Table 9 presents a list of papers that use
Sensors 2019, 19, 3213 16 of 28
these methods. This article does not attempt to provide theoretical information about how each ofthese algorithms work, more details about each of them can be found in [20].
Table 9. List of works separated by shallow machine learning algorithms.
Methods Works
Naïve Bayes [25,30,36,37,41,45,50,69,74,78,80]
Decision Tree [25,30,34,42,43,45,49,50,67,70,74,75,79,80]
Support Vector Machine (SVM) [25,31,36,45,46,50,72,74,82]
KNN [25,42,48,50,71,73,74,76,78]
Neural Networks [30,38,49,52]
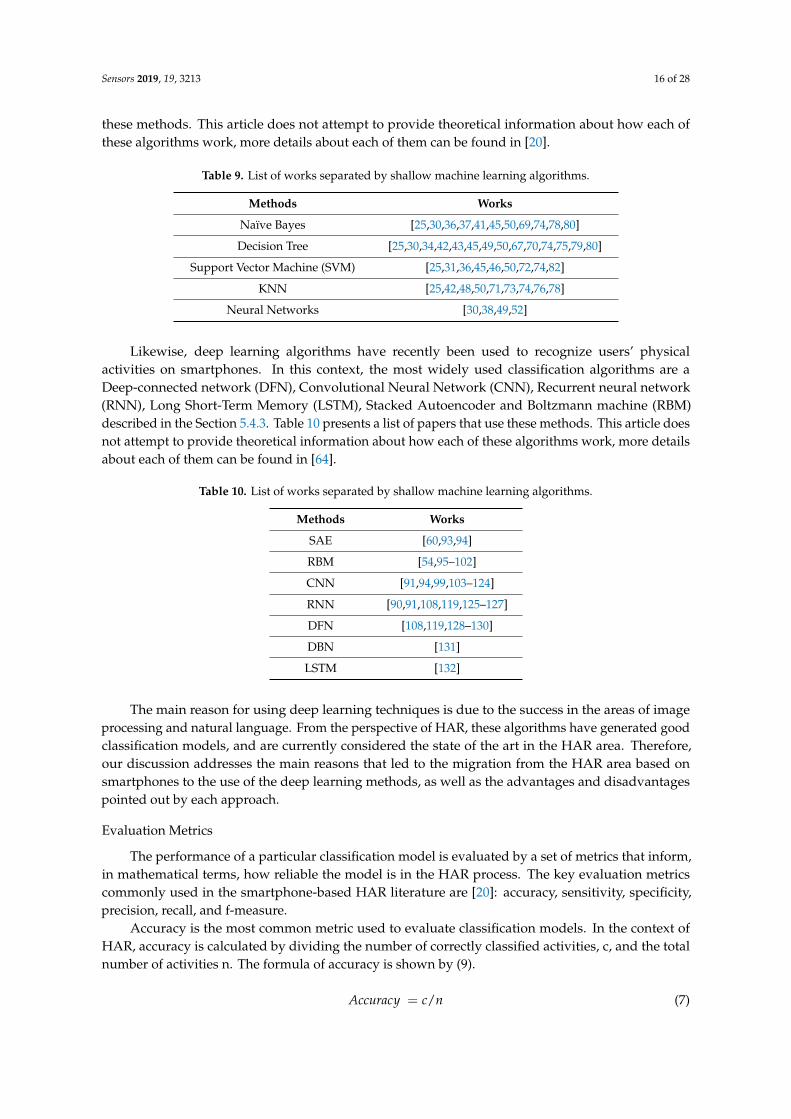
Likewise, deep learning algorithms have recently been used to recognize users’ physicalactivities on smartphones. In this context, the most widely used classification algorithms are aDeep-connected network (DFN), Convolutional Neural Network (CNN), Recurrent neural network(RNN), Long Short-Term Memory (LSTM), Stacked Autoencoder and Boltzmann machine (RBM)described in the Section 5.4.3. Table 10 presents a list of papers that use these methods. This article doesnot attempt to provide theoretical information about how each of these algorithms work, more detailsabout each of them can be found in [64].
Table 10. List of works separated by shallow machine learning algorithms.
Methods Works
SAE [60,93,94]
RBM [54,95–102]
CNN [91,94,99,103–124]
RNN [90,91,108,119,125–127]
DFN [108,119,128–130]
DBN [131]
LSTM [132]
The main reason for using deep learning techniques is due to the success in the areas of imageprocessing and natural language. From the perspective of HAR, these algorithms have generated goodclassification models, and are currently considered the state of the art in the HAR area. Therefore,our discussion addresses the main reasons that led to the migration from the HAR area based onsmartphones to the use of the deep learning methods, as well as the advantages and disadvantagespointed out by each approach.
Evaluation Metrics
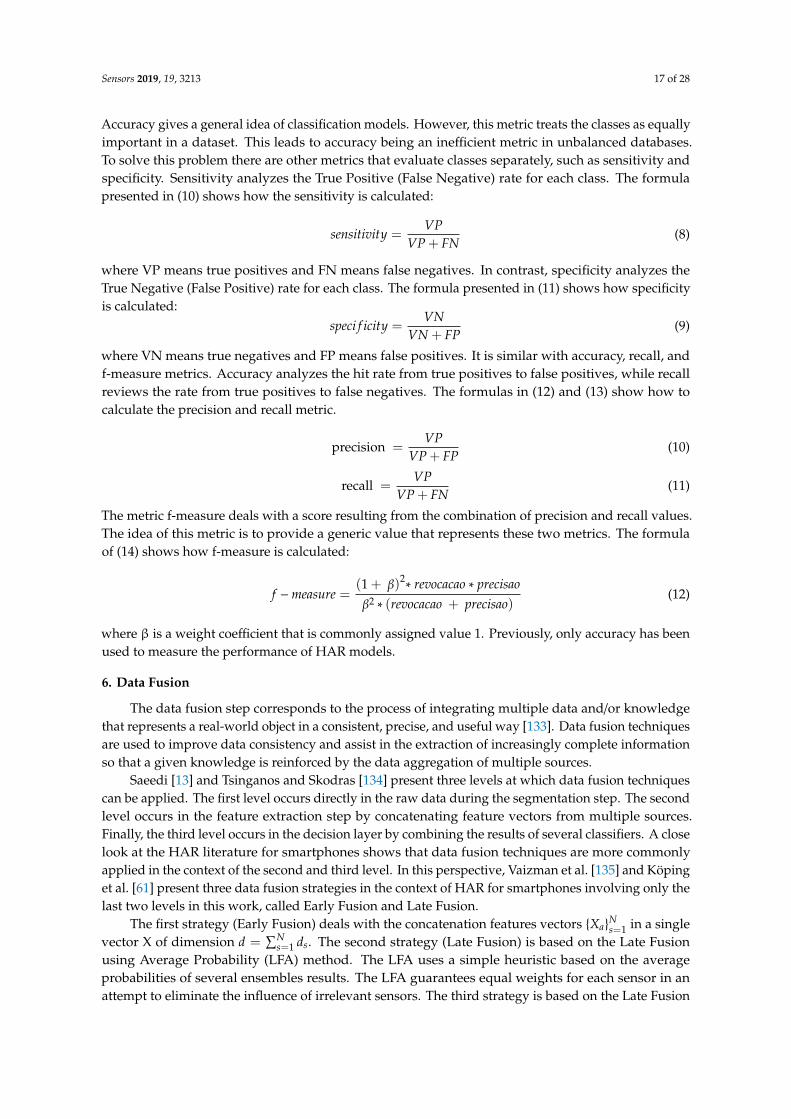
The performance of a particular classification model is evaluated by a set of metrics that inform,in mathematical terms, how reliable the model is in the HAR process. The key evaluation metricscommonly used in the smartphone-based HAR literature are [20]: accuracy, sensitivity, specificity,precision, recall, and f-measure.
Accuracy is the most common metric used to evaluate classification models. In the context ofHAR, accuracy is calculated by dividing the number of correctly classified activities, c, and the totalnumber of activities n. The formula of accuracy is shown by (9).
Accuracy = c/n (7)
Sensors 2019, 19, 3213 17 of 28
Accuracy gives a general idea of classification models. However, this metric treats the classes as equallyimportant in a dataset. This leads to accuracy being an inefficient metric in unbalanced databases.To solve this problem there are other metrics that evaluate classes separately, such as sensitivity andspecificity. Sensitivity analyzes the True Positive (False Negative) rate for each class. The formulapresented in (10) shows how the sensitivity is calculated:
sensitivity =VP
VP + FN(8)
where VP means true positives and FN means false negatives. In contrast, specificity analyzes theTrue Negative (False Positive) rate for each class. The formula presented in (11) shows how specificityis calculated:
speci f icity =VN
VN + FP(9)
where VN means true negatives and FP means false positives. It is similar with accuracy, recall, andf-measure metrics. Accuracy analyzes the hit rate from true positives to false positives, while recallreviews the rate from true positives to false negatives. The formulas in (12) and (13) show how tocalculate the precision and recall metric.
precision =VP
VP + FP(10)
recall =VP
VP + FN(11)
The metric f-measure deals with a score resulting from the combination of precision and recall values.The idea of this metric is to provide a generic value that represents these two metrics. The formulaof (14) shows how f-measure is calculated:
f −measure =(1 + β)2
∗ revocacao ∗ precisaoβ2 ∗ (revocacao + precisao)
(12)
where β is a weight coefficient that is commonly assigned value 1. Previously, only accuracy has beenused to measure the performance of HAR models.
6. Data Fusion
The data fusion step corresponds to the process of integrating multiple data and/or knowledgethat represents a real-world object in a consistent, precise, and useful way [133]. Data fusion techniquesare used to improve data consistency and assist in the extraction of increasingly complete informationso that a given knowledge is reinforced by the data aggregation of multiple sources.
Saeedi [13] and Tsinganos and Skodras [134] present three levels at which data fusion techniquescan be applied. The first level occurs directly in the raw data during the segmentation step. The secondlevel occurs in the feature extraction step by concatenating feature vectors from multiple sources.Finally, the third level occurs in the decision layer by combining the results of several classifiers. A closelook at the HAR literature for smartphones shows that data fusion techniques are more commonlyapplied in the context of the second and third level. In this perspective, Vaizman et al. [135] and Köpinget al. [61] present three data fusion strategies in the context of HAR for smartphones involving only thelast two levels in this work, called Early Fusion and Late Fusion.
The first strategy (Early Fusion) deals with the concatenation features vectors {Xa}Ns=1 in a single
vector X of dimension d =∑N
s=1 ds. The second strategy (Late Fusion) is based on the Late Fusionusing Average Probability (LFA) method. The LFA uses a simple heuristic based on the averageprobabilities of several ensembles results. The LFA guarantees equal weights for each sensor in anattempt to eliminate the influence of irrelevant sensors. The third strategy is based on the Late Fusion
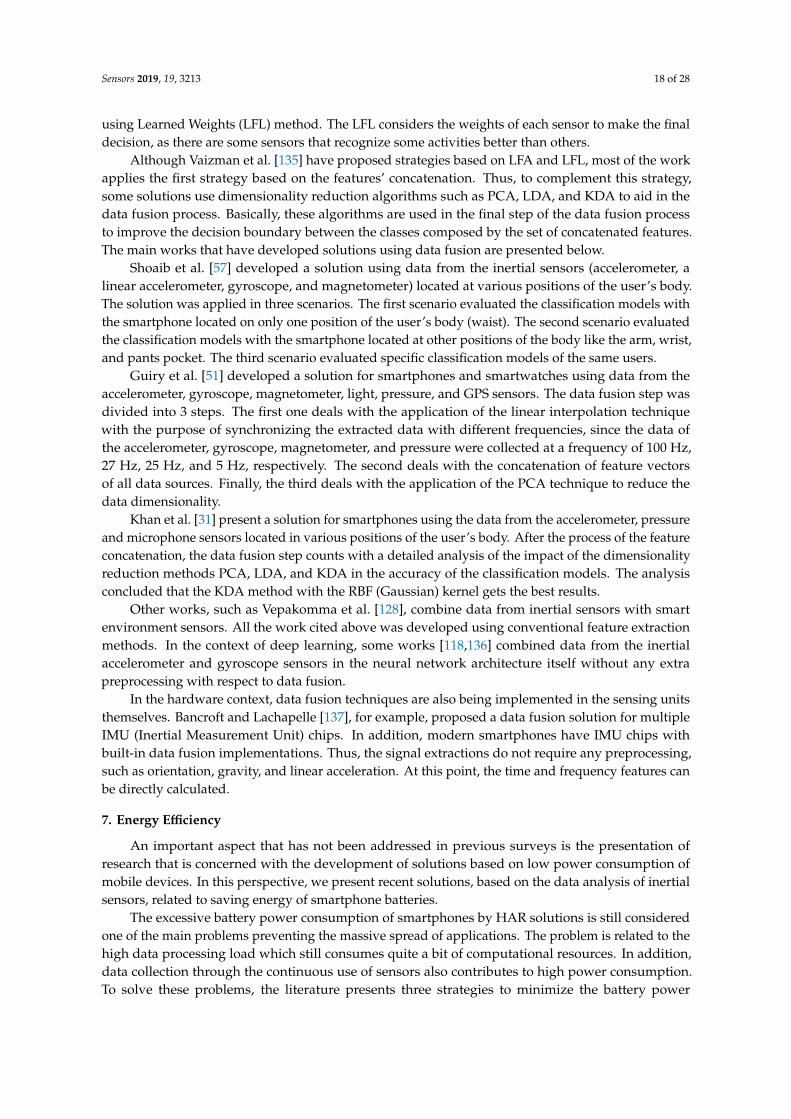
Sensors 2019, 19, 3213 18 of 28
using Learned Weights (LFL) method. The LFL considers the weights of each sensor to make the finaldecision, as there are some sensors that recognize some activities better than others.
Although Vaizman et al. [135] have proposed strategies based on LFA and LFL, most of the workapplies the first strategy based on the features’ concatenation. Thus, to complement this strategy,some solutions use dimensionality reduction algorithms such as PCA, LDA, and KDA to aid in thedata fusion process. Basically, these algorithms are used in the final step of the data fusion processto improve the decision boundary between the classes composed by the set of concatenated features.The main works that have developed solutions using data fusion are presented below.
Shoaib et al. [57] developed a solution using data from the inertial sensors (accelerometer, alinear accelerometer, gyroscope, and magnetometer) located at various positions of the user’s body.The solution was applied in three scenarios. The first scenario evaluated the classification models withthe smartphone located on only one position of the user’s body (waist). The second scenario evaluatedthe classification models with the smartphone located at other positions of the body like the arm, wrist,and pants pocket. The third scenario evaluated specific classification models of the same users.
Guiry et al. [51] developed a solution for smartphones and smartwatches using data from theaccelerometer, gyroscope, magnetometer, light, pressure, and GPS sensors. The data fusion step wasdivided into 3 steps. The first one deals with the application of the linear interpolation techniquewith the purpose of synchronizing the extracted data with different frequencies, since the data ofthe accelerometer, gyroscope, magnetometer, and pressure were collected at a frequency of 100 Hz,27 Hz, 25 Hz, and 5 Hz, respectively. The second deals with the concatenation of feature vectorsof all data sources. Finally, the third deals with the application of the PCA technique to reduce thedata dimensionality.
Khan et al. [31] present a solution for smartphones using the data from the accelerometer, pressureand microphone sensors located in various positions of the user’s body. After the process of the featureconcatenation, the data fusion step counts with a detailed analysis of the impact of the dimensionalityreduction methods PCA, LDA, and KDA in the accuracy of the classification models. The analysisconcluded that the KDA method with the RBF (Gaussian) kernel gets the best results.
Other works, such as Vepakomma et al. [128], combine data from inertial sensors with smartenvironment sensors. All the work cited above was developed using conventional feature extractionmethods. In the context of deep learning, some works [118,136] combined data from the inertialaccelerometer and gyroscope sensors in the neural network architecture itself without any extrapreprocessing with respect to data fusion.
In the hardware context, data fusion techniques are also being implemented in the sensing unitsthemselves. Bancroft and Lachapelle [137], for example, proposed a data fusion solution for multipleIMU (Inertial Measurement Unit) chips. In addition, modern smartphones have IMU chips withbuilt-in data fusion implementations. Thus, the signal extractions do not require any preprocessing,such as orientation, gravity, and linear acceleration. At this point, the time and frequency features canbe directly calculated.
7. Energy Efficiency
An important aspect that has not been addressed in previous surveys is the presentation ofresearch that is concerned with the development of solutions based on low power consumption ofmobile devices. In this perspective, we present recent solutions, based on the data analysis of inertialsensors, related to saving energy of smartphone batteries.
The excessive battery power consumption of smartphones by HAR solutions is still consideredone of the main problems preventing the massive spread of applications. The problem is related to thehigh data processing load which still consumes quite a bit of computational resources. In addition,data collection through the continuous use of sensors also contributes to high power consumption.To solve these problems, the literature presents three strategies to minimize the battery power
Sensors 2019, 19, 3213 19 of 28
consumption of smartphones. All of them make a tradeoff between energy consumption and theaccuracy of classification models.
The first strategy is related to the selection and activation of on demand sensors, i.e., each sensoris only used when the data is needed to recognize a certain activity [15,45,138]. From the perspectiveof inertial sensors, the intelligent use of sensors extends to select only a few coordinates of the axesx, y, and z. For example, Viet et al. [139] only use the data of the coordinates y and z. The secondstrategy deals with the use of lightweight features only to reduce the data processing load [139–142].For example, Khan et al. [2] concluded that time domain features have lower computational costs andconsume less energy when compared to frequency domain features.
The third strategy deals with the dynamic regulation of the data collection frequency of the inertialsensors for different activities. The higher the frequency of data collection, the more energy that isexpended by the inertial sensors. Yan et al. [141] performed an extensive study for each activity wheredata collection frequencies ranged from 5 Hz to 100 Hz. The results showed that the frequency of5 Hz is enough to represent static activities such as standing and sitting. On the other hand, the moreagitated activities, such as walking and running, need data extracted at a higher frequency, and thefrequency of 50 Hz is enough to represent these activities.
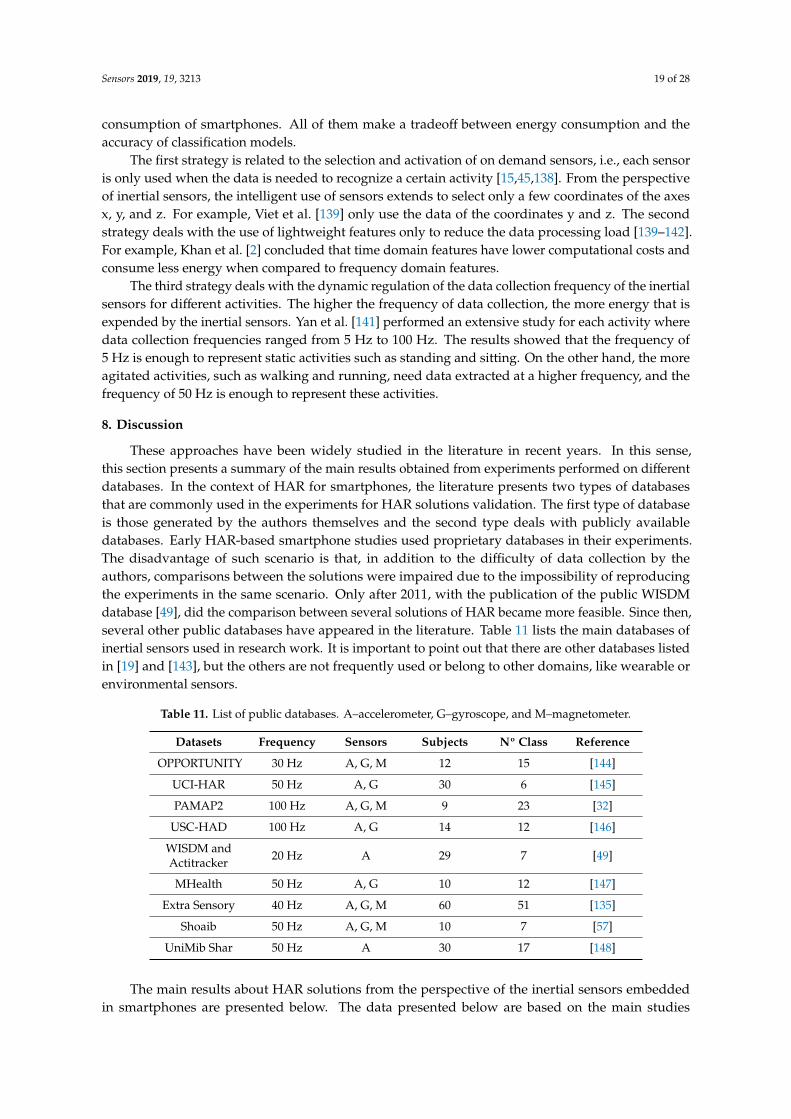
8. Discussion
These approaches have been widely studied in the literature in recent years. In this sense,this section presents a summary of the main results obtained from experiments performed on differentdatabases. In the context of HAR for smartphones, the literature presents two types of databasesthat are commonly used in the experiments for HAR solutions validation. The first type of databaseis those generated by the authors themselves and the second type deals with publicly availabledatabases. Early HAR-based smartphone studies used proprietary databases in their experiments.The disadvantage of such scenario is that, in addition to the difficulty of data collection by theauthors, comparisons between the solutions were impaired due to the impossibility of reproducingthe experiments in the same scenario. Only after 2011, with the publication of the public WISDMdatabase [49], did the comparison between several solutions of HAR became more feasible. Since then,several other public databases have appeared in the literature. Table 11 lists the main databases ofinertial sensors used in research work. It is important to point out that there are other databases listedin [19] and [143], but the others are not frequently used or belong to other domains, like wearable orenvironmental sensors.
Table 11. List of public databases. A–accelerometer, G–gyroscope, and M–magnetometer.
Datasets Frequency Sensors Subjects Nº Class Reference
OPPORTUNITY 30 Hz A, G, M 12 15 [144]
UCI-HAR 50 Hz A, G 30 6 [145]
PAMAP2 100 Hz A, G, M 9 23 [32]
USC-HAD 100 Hz A, G 14 12 [146]
WISDM andActitracker 20 Hz A 29 7 [49]
MHealth 50 Hz A, G 10 12 [147]
Extra Sensory 40 Hz A, G, M 60 51 [135]
Shoaib 50 Hz A, G, M 10 7 [57]
UniMib Shar 50 Hz A 30 17 [148]
The main results about HAR solutions from the perspective of the inertial sensors embeddedin smartphones are presented below. The data presented below are based on the main studies
Sensors 2019, 19, 3213 20 of 28
that performed comparative experiments between the different methods and strategies presented inthis research.
1. In general, the accelerometer is the predominant sensor in the process of recognizing users’physical activities, except for some isolated activities like ascending and descending stairs wherethe gyroscope predominates [57].
2. The data extracted from the gyroscope complements the accelerometer data and both generatebetter classification models with an average increase of 2% in accuracy [21,22,57]. Wang et al. [59]observed that such fusion is most accurate for the recognition of static activities (e.g., standingand sitting) than for dynamic activities (e.g., walking and running).
3. Accelerometer data without gravity information (linear accelerometer) generates models withless accuracy compared to the accelerometer data with gravity information [58].
4. The magnetometer sensor, when used alone, generates classification models with low accuracycompared to the accelerometer and gyroscope sensors [57].
5. The ideal size for the fixed time windows varies around 2 to 5 s considering a frequency of 20 Hzto 50 Hz [21,53,58].
6. The waist and trouser pocket is the best position to recognize simple physical activities, such aswalking and running, since human body movements originate in these regions [44].
7. Time domain features, especially the mean, variance, standard deviation, Root Mean Square,minimum, maximum, amplitude, and correlation, generate models with higher accuracy comparedto the characteristics of the frequency domain. In addition, the time features are cheaper andconsume less battery power in relation to frequency domain features [49].
8. Wavelet derived features are better than FFT derived features [58].9. Independent orientation features derived from the magnitude and vertical and horizontal
components do not sufficiently represent physical activities [58].10. KDA is the best dimensionality reduction method when compared to PCA, LDA, and conventional
methods of feature selection [31].11. The RNN method is recommended to recognize activities of short duration and the CNN method
is recommended to recognize repetitive activities and long duration [20]. In contrast, the LSTMmethods can recognize long-lived activities due to their ability to manipulate multiple memoryunits [132].
12. Almaslukh et al. [60] proposed an architecture based on the SAE method that generated the bestclassification model known so far with an accuracy of 97.5%. Such a model overcame the state ofthe art of conventional methods generated by One-Vs-One Multiclass linear SVM [149] with a96.4% accuracy.
9. Conclusions
This article presents an overview of the HAR area, focusing on smartphones with inertial sensors.We first discussed the concept of human activities followed by a complete history of the HAR areabased on smartphones. In this history, the main historical landmarks, representing the evolution ofthe HAR area over time, have been described. The aim of the history is to help situate the scientificcommunity in the state of the art for the HAR area in the context of smartphones and to present amotivation for the planning and execution of the next steps that will help define the future evolutionarymilestones of the area.
In addition, this article presented a detailed description of each step of the methodology commonlyused to recognize human activities with smartphones equipped with inertial sensors. In the descriptionsof the steps, the main works from the literature, along with tips for the best practices, are presented.In particular, issues related to the features used in classification models were highlighted. In thisperspective, we present two approaches to extraction of features based on the way the features areextracted, that is, whether they are manually or automatically extracted.
Sensors 2019, 19, 3213 21 of 28
Such approaches are based on the use of shallow and deep machine learning algorithms. In addition,this paper presented some topics that were not covered in a comprehensive way by the main surveys ofthe area, as the data fusion, energy efficiency and reduction of data dimensionality topics. Furthermore,we addressed the key findings inherent in the best methods and implementation of HAR basedsmartphones with inertial sensors.
We presented a set of challenges and future research opportunities in the area of smartphone-basedHAR. Additionally, we presented a list of practical applications where HAR solutions can be used in realenvironments. Therefore, we hope that the information in this article will help the scientific communityto create more robust solutions that can increasingly and efficiently recognize users’ physical activities.
Funding: This work was partially funded by FAPEAM through the Posgrad and PROTI Amazonia research project.
Conflicts of Interest: The authors declare no conflict of interest.
References
1. Lockhart, J.W.; Pulickal, T.; Weiss, G.M. Applications of mobile activity recognition. In Proceedings of the2012 ACM Conference on Ubiquitous Computing–UbiComp, Pittsburgh, PA, USA, 5–8 September 2012.
2. Khan, W.Z.; Xiang, Y.; Aalsalem, M.Y.; Arshad, Q. Mobile phone sensing systems: A survey. IEEE Commun.Surv. Tutor. 2013, 15, 402–427. [CrossRef]
3. Dai, J.; Bai, X.; Yang, Z.; Shen, Z.; Xuan, D. PerFallD: A pervasive fall detection system using mobile phones.In Proceedings of the 8th IEEE International Conference on Pervasive Computing and CommunicationsWorkshops (PERCOM Workshops), Mannheim, Germany, 29 March–2 April 2010; pp. 292–297.
4. Fontecha, J.; Navarro, F.J.; Hervás, R.; Bravo, J. Elderly frailty detection by using accelerometer-enabledsmartphones and clinical information records. Pers. Ubiquitous Comput. 2013, 7, 1073–1083. [CrossRef]
5. Preuveneers, D.; Berbers, Y. Mobile phones assisting with health self-care: A diabetes case study.In Proceedings of the 10th International Conference on Human Computer Interaction with Mobile Devicesand Services, Amsterdam, The Netherlands, 2–5 September 2008; pp. 177–186.
6. Tapia, E.M.; Intille, S.S.; Larson, K. Activity recognition in the home using simple and ubiquitous sensors.In International Conference on Pervasive Computing; Springer: Berlin/Heidelberg, Gremany, 2004; pp. 158–175.
7. Lima, W.S.; Souto, E.; Rocha, T.; Pazzi, R.W.; Pramudianto, F. User activity recognition for energy savingin smart home environment. In Proceedings of the IEEE Symposium on Computers and Communication(ISCC), Larnaca, Cyprus, 6–9 July 2015; pp. 751–828.
8. Niu, W.; Long, J.; Han, D.; Wang, Y.F. Human activity detection and recognition for video surveillance.In Proceedings of the IEEE International Conference on Multimedia and Exp (ICME), Taipei, Taiwan, 27–30June 2004; Volumes 1–3, pp. 719–722.
9. Mehran, R.; Oyama, A.; Shah, M. Abnormal crowd behavior detection using social force model. In Proceedingsof the 2009 IEEE Conference on Computer Vision and Pattern Recognition, Miami, FL, USA, 20–25 June 2009;pp. 935–994.
10. Viola, P.; Jones, M. Rapid object detection using a boosted cascade of simple features. In Proceedings of theIEEE Computer Society Conference on Computer Vision and Pattern Recognition (CVPR), Kauai, HI, USA,8–14 December 2001; pp. 511–518.
11. Choujaa, D.; Dulay, N. Activity Recognition from Mobile Phone Data: State of the Art, Prospects and OpenProblems. Imp. Coll. Lond. 2009, 5, 32.
12. Liao, L.; Patterson, D.J.; Fox, D.; Kautz, H. Learning and inferring transportation routines. Artif. Intell. 2007,6, 171311–171331. [CrossRef]
13. Saeedi, S. Context-Aware Personal Navigation Services Using Multi-Level Sensor Fusion Algorithms.Ph.D. Thesis, University of Calgary, Calgary, AB, Canada, 2013.
14. Chen, L.; Hoey, J.; Nugent, C.D.; Cook, D.J.; Yu, Z.; Member, S. Sensor-Based Activity Recognition. Syst. ManCybern. Part C Appl. Rev. 2012, 42, 790–808. [CrossRef]
15. Lane, N.D.; Miluzzo, E.; Lu, H.; Peebles, D.; Choudhury, T.; Campbell, A.T. A survey of mobile phone sensing.IEEE Commun. Mag. 2010, 48, 140–150. [CrossRef]
16. Incel, O.D.; Kose, M.; Ersoy, C. A Review and Taxonomy of Activity Recognition on Mobile Phones.BioNanoScience 2013, 3, 145–171. [CrossRef]
Sensors 2019, 19, 3213 22 of 28
17. bin Abdullah, M.F.A.; Ali, F.P.N.; Sayeed, M.S.; Choi, D.J.; Muthu, K.S. Classification algorithms in humanactivity recognition using smartphones. Int. J. Med Health Biomed. Bioeng. Pharm. Eng. 2012, 6, 106.
18. Khusainov, R.; Azzi, D.; Achumba, I.E.; Bersch, S.D. Real-time human ambulation, activity, and physiologicalmonitoring: Taxonomy of issues, techniques, applications, challenges and limitations. Sensors 2013, 13,12852–12902. [CrossRef]
19. Wang, J.; Chen, Y.; Hao, S.; Peng, X.; Hu, L. Deep Learning for Sensor-based Activity Recognition: A Survey.Comput. Vis. Pattern Recognit. 2017, 119, 3–11. [CrossRef]
20. Cook, D.J.; Krishnan, C.N. Activity Learning: Discovering, Recognizing, and Predicting Human Behavior fromSensor Data; John Wiley & Sons: Hoboken, NJ, USA, 2015.
21. Shoaib, M.; Bosch, S.; Incel, O.D.; Scholten, H.; Havinga, P.J. Complex human activity recognition usingsmartphone and wrist-worn motion sensors. Sensors 2016, 16, 426. [CrossRef] [PubMed]
22. Chen, Y.; Shen, C. Performance Analysis of Smartphone-Sensor Behavior for Human Activity Recognition.IEEE Access 2017, 5, 3095–3110. [CrossRef]
23. Lara, O.D.; Labrador, M.A. A Survey on Human Activity Recognition using Wearable Sensors. IEEE Commun.Surv. Tutor. 2013, 15, 1192–1209. [CrossRef]
24. Bulling, A.; Blanke, U.; Schiele, B. A tutorial on human activity recognition using body-worn inertial sensors.ACM Comput. Surv. 2014, 46, 33. [CrossRef]
25. Yang, J. Toward Physical Activity Diary: Motion Recognition Using Simple Acceleration Features withMobile Phones. In Proceedings of the 1st International Workshop on Interactive Multimedia for ConsumerElectronics, Beijing, China, 23 October 2009; pp. 1–9.
26. Avci, A.; Bosch, S. Activity recognition using inertial sensing for healthcare, wellbeing and sports applications:A survey. In Proceedings of the 23th International conference on architecture of computing systems (ARCS),Hannover, Germany, 22–23 February 2010; pp. 1–10.
27. Su, X.; Tong, H.; Ji, P. Activity recognition with smartphone sensors. Sci. Technol. 2014, 19, 235–249.28. Bort-Roig, J.; Gilson, N.D.; Puig-Ribera, A.; Contreras, R.S.; Trost, S.G. Measuring and influencing physical
activity with smartphone technology: A systematic review. Sports Med. 2014, 44, 671–686. [CrossRef][PubMed]
29. Li, F.; Shirahama, K.; Nisar, M.; Köping, L.; Grzegorzek, M. Comparison of Feature Learning Methods forHuman Activity Recognition Using Wearable Sensors. Sensors 2018, 18, 679. [CrossRef]
30. Dernbach, S.; Das, B.; Krishnan, N.C.; Thomas, B.L.; Cook, D.J. Simple and Complex Activity Recognitionthrough Smart Phones. In Proceedings of the 2012 Eighth International Conference on IntelligentEnvironments, Guanajuato, Mexico, 26–29 June 2012; pp. 214–221.
31. Khan, A.M.; Tufail, A.; Khattak, A.M.; Khattak, A.M.; Laine, T.H. Activity recognition on smartphones viasensor-fusion and KDA-based SVMs. Int. J. Distrib. Sens. Netw. 2014, 10, 503291. [CrossRef]
32. Reiss, A.; Weber, M.; Stricker, D. Exploring and extending the boundaries of physical activity recognition.In Proceedings of the 2011 IEEE International Conference on Systems, Man, and Cybernetics, Anchorage,AK, USA, 9–12 October 2011; pp. 46–50.
33. Li, M.; Zhou, P.; Zheng, Y.; Li, Z.; Shen, G. IODetector: A Generic Service for Indoor/Outdoor Detection.ACM Trans. Sens. Netw. 2014, 11, 28. [CrossRef]
34. Reddy, S.; Mun, M.; Burke, J.; Estrin, D.; Hansen, M.; Srivastava, M. Using mobile phones to determinetransportation modes. ACM Trans. Sens. Netw. 2010, 6, 13. [CrossRef]
35. Wohlin, C. Guidelines for snowballing in systematic literature studies and a replication in software engineering.In Proceedings of the 18th International Conference on Evaluation and Assessment in Software Engineering,London, UK, 13–14 May 2014; p. 38.
36. Sohn, T.; Varshavsky, A.; Lamarca, A.; Chen, M.Y.; Choudhury, T.; Smith, I.; Consolvo, S.; Hightower, J.;Griswold, W.G.; Lara, E.D. Mobility Detection Using Everyday GSM Traces. In International Conference onUbiquitous Computing; Springer: Berlin/Heidelberg, Germany, 2006; pp. 212–224.
37. Iso, T.; Yamazaki, K. Gait analyzer based on a cell phone with a single three-axis accelerometer. In Proceedingsof the 8th Conference on Human-Computer Interaction with Mobile Devices and Services, Helsinki, Finland,12–15 September 2006; p. 141.
38. Anderson, I.; Maitland, J.; Sherwood, S.; Barkhuus, L.; Chalmers, M.; Hall, M.; Brown, B.; Muller, H.Shakra: Tracking and sharing daily activity levels with unaugmented mobile phones. Mob. Netw. Appl. 2007,12, 185–199. [CrossRef]
Sensors 2019, 19, 3213 23 of 28
39. Berchtold, M.; Budde, M.; Gordon, D.; Schmidtke, H.; Beigl, M. ActiServ: Activity Recognition Service formobile phones. In Proceedings of the International Symposium on Wearable Computers (ISWC), Seoul,Korea, 10–13 October 2010; pp. 1–8.
40. Miluzzo, E.; Cornelius, C.T.; Ramaswamy, A.; Choudhury, T.; Liu, Z.; Campbell, A.T. Darwin Phones:The Evolution of Sensing and Inference on Mobile Phones. In Proceedings of the 8th International Conferenceon Mobile Systems, Applications, and Services, San Francisco, CA, USA, 15–18 June 2010; pp. 5–20.
41. Saponas, T.; Lester, J.; Froehlich, J.; Fogarty, J.; Landay, J. iLearn on the iPhone: Real-Time Human ActivityClassification on Commodity Mobile Phones; University of Washington CSE Tech Report UWCSE080402;University of Washington: Washington, DC, USA, 2008.
42. Lu, H.; Pan, W.; Lane, N.; Choudhury, T.; Campbell, A. SoundSense: Scalable sound sensing for people-centricapplications on mobile phones. In Proceedings of the 7th International Conference on Mobile Systems,Applications, and Services, Kraków, Poland, 22–25 June 2009; pp. 165–178.
43. Ryder, J.; Longstaff, B.; Reddy, S.; Estrin, D. Ambulation: A Tool for Monitoring Mobility Patterns overTime Using Mobile Phones. In Proceedings of the International Conference on Computational Science andEngineering, Vancouver, BC, Canada, 29–31 August 2009; Volume 4, pp. 927–931.
44. Purpura, S.; Schwanda, V.; Williams, K.; Stubler, W.; Sengers, P. Fit4life: The design of a persuasive technologypromoting healthy behavior and ideal weight. In Proceedings of the 2011 Annual Conference on HumanFactors in Computing Systems–CHI, Vancouver, BC, Canada, 7–12 May 2011.
45. Lu, H.; Yang, J.; Liu, Z.; Lane, N.D.; Choudhury, T.; Campbell, A.T. The Jigsaw Continuous Sensing Enginefor Mobile Phone Applications. In Proceedings of the 8th Conference on Embedded Networked SensorSystems (SenSys’10), Zürich, Switzerland, 3–5 November 2010; pp. 71–84.
46. Zhang, S.; McCullagh, P.; Nugent, C.; Zheng, H. Activity Monitoring Using a Smart Phone’s Accelerometerwith Hierarchical Classification. In Proceedings of the 2010 Sixth International Conference on IntelligentEnvironments, Kuala Lumpur, Malaysia, 19–21 July 2010; pp. 158–163.
47. Bieber, G.; Koldrack, P.; Sablowski, C.; Peter, C.; Urban, B. Mobile physical activity recognition of stand-upand sit-down transitions for user behavior analysis. In Proceedings of the 3rd International Conference onPErvasive Technologies Related to Assistive Environments, Samos, Greece, 23–25 June 2010.
48. Henpraserttae, A.; Thiemjarus, S.; Marukatat, S. Accurate activity recognition using a mobile phone regardlessof device orientation and location. In Proceedings of the 2011 International Conference on Body SensorNetworks BSN, Dallas, TX, USA, 23–25 May 2011.
49. Kwapisz, J.R.; Weiss, G.M.; Moore, S.A. Activity Recognition using Cell Phone Accelerometers. ACM SIGKDDExplor. Newsl. 2011, 12, 74–82. [CrossRef]
50. Das, B.; Seelye, A.M.; Thomas, B.L.; Cook, D.J.; Holder, L.B.; Schmitter-Edgecombe, M. Using smart phonesfor context-aware prompting in smart environments. In Proceedings of the IEEE Consumer Communicationsand Networking Conference, CCNC, Las Vegas, NV, USA, 14–17 January 2012; pp. 399–403.
51. Guiry, J.J.; van de Ven, P.; Nelson, J. Multi-sensor fusion for enhanced contextual awareness of everydayactivities with ubiquitous devices. Sensors 2014, 14, 5687–5701. [CrossRef] [PubMed]
52. Khan, A.M.; Siddiqi, M.H.; Lee, S.W. Exploratory data analysis of acceleration signals to select light-weightand accurate features for real-time activity recognition on smartphones. Sensors 2013, 13, 13099–13122.[CrossRef] [PubMed]
53. Banos, O.; Galvez, J.M.; Damas, M.; Pomares, H.; Rojas, I. Window Size Impact in Human Activity Recognition.Sensors 2014, 14, 6474–6499. [CrossRef] [PubMed]
54. Wang, J.; Chen, Y.; Hao, S.; Peng, X.; Hu, L. Deep Activity Recognition Models with Triaxial Accelerometers.In Proceedings of the Computer Vision and Pattern Recognition, Honolulu, HI, USA, 21–26 July 2017.
55. Abdallah, Z.S.; Gaber, M.M.; Srinivasan, B.; Krishnaswamy, S. AnyNovel: Detection of novel concepts inevolving data streams. Evol. Syst. 2016, 7, 73–93. [CrossRef]
56. Reyes-Ortiz, J.L.; Oneto, L.; Samà, A.; Parra, X.; Anguita, D. Transition-Aware Human Activity RecognitionUsing Smartphones. Neurocomputing 2016, 171, 754–767. [CrossRef]
57. Shoaib, M.; Bosch, S.; Incel, O.D.; Scholten, H.; Havinga, P.J. Fusion of smartphone motion sensors forphysical activity recognition. Sensors 2014, 14, 10146–10176. [CrossRef]
58. Sousa, W.; Souto, E.; Rodrigres, J.; Sadarc, P.; Jalali, R.; El-khatib, K. A Comparative Analysis of the Impact ofFeatures on Human Activity Recognition with Smartphone Sensors. In Proceedings of the 23rd BrazillianSymposium on Multimedia and the Web, Gramado, RS, Brazil, 17–20 October 2017; pp. 397–404.

Sensors 2019, 19, 3213 24 of 28
59. Wang, A.; Chen, G.; Yang, J.; Zhao, S.; Chang, C.Y. A Comparative study on Human activity recognitionusing inertial sensors in a smartphone. IEEE Sens. J. 2016, 16, 4566–4578. [CrossRef]
60. Almaslukh, B.; Almuhtadi, J.; Artoli, A. An Effective Deep Autoencoder Approach for OnlineSmartphone-Based Human Activity Recognition. Int. J. Comput. Sci. Netw. Secur. 2017, 17, 160–165.
61. Köping, L.; Shirahama, K.; Grzegorzek, M. A General Framework for Sensor-based Human ActivityRecognition. Comput. Biol. Med. 2018, 95, 248–260. [CrossRef]
62. Bengio, Y. Deep learning of representations: Looking forward. In International Conference on StatisticalLanguage and Speech Processing; Springer: Berlin/Heidelberg, Germany, 2013; pp. 1–37.
63. Figo, D.; Diniz, P.C.; Ferreira, D.R.; Cardoso, J.M.P. Preprocessing techniques for context recognition fromaccelerometer data. Pers. Ubiquitous Comput. 2010, 14, 645–662. [CrossRef]
64. LeCun, Y.; Bengio, Y.; Hinton, G. Deep learning. Nature 2015, 521, 436–444. [CrossRef]65. Mladenov, M.; Mock, M. A step counter service for Java-enabled devices using a built-in accelerometer.
In Proceedings of the 1st International Workshop on Context-Aware Middleware and Services affiliated withthe 4th International Conference on Communication System Software and Middleware (COMSWARE 2009),Dublin, Ireland, 16 June 2009.
66. Lockhart, J.W.; Weiss, G.M. Limitations with Activity Recognition Methodology & Data Sets. In Proceedings ofthe 2014 ACM International Joint Conference on Pervasive and Ubiquitous Computing: Adjunct Publication,Washington, DC, USA, 13–17 September 2014; pp. 747–756.
67. Miluzzo, E.; Lane, N.D.; Fodor, K.; Peterson, R.; Lu, H.; Musolesi, M.; Eisenman, S.B.; Zheng, X.; Campbell, A.T.Sensing Meets Mobile Social Networks: The Design, Implementation and Evaluation of the CenceMeApplication. In Proceedings of the 6th ACM Conference on Embedded Network Sensor Systems, Raleigh,NC, USA, 5–7 November 2008; pp. 337–350.
68. Lane, N.; Mohammod, M.; Lin, M.; Yang, X.; Lu, H.; Ali, S.; Doryab, A.; Berke, E.; Choudhury, T.; Campbell, A.BeWell: A Smartphone Application to Monitor, Model and Promote Wellbeing. In Proceedings of the 5thInternational ICST Conference on Pervasive Computing Technologies for Healthcare, Dublin, Ireland; 2011;p. 8.
69. Gomes, J.B.; Krishnaswamy, S.; Gaber, M.M.; Sousa, P.A.; Menasalvas, E. MARS: A personalised mobileactivity recognition system. In Proceedings of the 2012 IEEE 13th International Conference on Mobile DataManagement MDM, Bengaluru, Karnataka, India, 23–26 July 2012; pp. 316–319.
70. Lara, O.D.; Labrador, M.A. A mobile platform for real-time human activity recognition. In Proceedings ofthe Consumer Communications and Networking Conference (CCNC), Las Vegas, NV, USA, 14–17 January2012; pp. 667–671.
71. Siirtola, P.; Röning, J. Recognizing Human Activities User-independently on Smartphones Based onAccelerometer Data. Int. J. Interact. Multimed. Artif. Intell. 2012, 1, 38. [CrossRef]
72. Park, J.G.; Patel, A.; Curtis, D.; Teller, S.; Ledlie, J. Online pose classification and walking speed estimationusing handheld devices. In Proceedings of the 2012 ACM Conference on Ubiquitous Computing–UbiComp,Pittsburgh, PA, USA, 5–8 September 2012.
73. Ustev, Y.; Incel, O.D.; Ersoy, C. User, device and orientation independent human activity recognition onmobile phones: Challenges and a proposal. In Proceedings of the ACM Conference on Pervasive andUbiquitous Computing Adjunct Publication, Zurich, Switzerland, 8–12 September 2013.
74. Anjum, A.; Ilyas, M.U. Activity recognition using smartphone sensors. In Proceedings of the IEEE 10thConsumer Communications and Networking Conference, CCNC, Las Vegas, NV, USA, 11–14 January 2013;pp. 914–919.
75. Siirtola, P.; Roning, J. Ready to use activity recognition for smartphones. In Proceedings of the IEEESymposium on Computational Intelligence and Data Mining, CIDM, Singapore, 16–19 April 2013; pp. 59–64.
76. Thiemjarus, S.; Henpraserttae, A.; Marukatat, S. A study on instance-based learning with reduced trainingprototypes for device-context-independent activity recognition on a mobile phone. In Proceedings of the2013 IEEE International Conference on Body Sensor Networks, BSN, Cambridge, MA, USA, 6–9 May 2013.
77. Hynes, M.; Wang, H.; McCarrick, E.; Kilmartin, L. Accurate monitoring of human physical activity levels formedical diagnosis and monitoring using off-the-shelf cellular handsets. Pers. Ubiquitous Comput. 2011, 15,667–678. [CrossRef]
Sensors 2019, 19, 3213 25 of 28
78. Kose, M.; Incel, O.D.; Ersoy, C. Online Human Activity Recognition on Smart Phones. In Proceedings ofthe 2nd International Workshop on Mobile Sensing: From Smartphones and Wearables to Big Data, Beijing,China, 16 April 2012.
79. Schindhelm, C.K. Activity recognition and step detection with smartphones: Towards terminal based indoorpositioning system. In Proceedings of the IEEE International Symposium on Personal, Indoor and MobileRadio Communications, PIMRC, Sydney, NSW, Australia, 9–12 September 2012; pp. 2454–2459.
80. Martín, H.; Bernardos, A.M.; Iglesias, J.; Casar, J.R. Activity logging using lightweight classification techniquesin mobile devices. Pers. Ubiquitous Comput. 2013, 17, 675–695. [CrossRef]
81. Shoaib, M.; Bosch, S.; Incel, O.; Scholten, H.; Havinga, P. A Survey of Online Activity Recognition UsingMobile Phones. Sensors 2015, 15, 2059–2085. [CrossRef]
82. Vo, Q.V.; Hoang, M.T.; Choi, D. Personalization in mobile activity recognition system using-medoidsclustering algorithm. Int. J. Distrib. Sens. Netw. 2013, 9, 315841. [CrossRef]
83. Yan, Z.; Misra, A.; Chakraborty, D.; Aberer, K.; Jeung, H. Semantic Activity Classification Using LocomotiveSignatures from Mobile Phones; Technical Reports; I&C—School of Computer and CommunicationSciences—EPFL, 2012; pp. 1–9.
84. Sebastião, R.; Silva, M.M.; Rabiço, R.; Gama, J.; Mendonça, T. Evolving Systems. Real-time algorithm forchanges detection in depth of anesthesia signals. Evolving Syst. 2013. [CrossRef]
85. Strang, G. Wavelets. Sigma Xi. Sci. Res. Soc. 1994, 82, 250–255.86. Chu, D.; Lane, N.D.; Lai, T.T.T.; Pang, C.; Meng, X.; Guo, Q.; Li, F.; Zhao, F. Balancing energy, latency and
accuracy for mobile sensor data classification. In Proceedings of the 9th ACM Conference on EmbeddedNetworked Sensor Systems–SenSys, Washington, DC, USA, 1–4 November 2011; p. 54.
87. Lee, J.; Verleysen, M. Nonlinear Dimensionality Reduction; Springer Science & Business Media: Berlin,Germany, 2007.
88. Khan, A.M. Human Activity Recognition Using A Single Tri-axial Accelerometer. Ph.D. Thesis, Kyung HeeUniversity, Seoul, Korea, 2011; pp. 1379–1383.
89. Goodfellow, I.; Bengio, Y.; Courville, A. Deep Learning; MIT Press: Cambridge, MA, USA, 2016.90. Ordónez, F.; Roggen, D. Deep convolutional and LSTM recurrent neural networks for multimodal wearable
activity recognition. Sensors 2016, 16, 115. [CrossRef] [PubMed]91. Yao, S.; Hu, S.; Zhao, Y.; Zhang, A.; Abdelzaher, T. Deepsense: A unified deep learning framework for
time-series mobile sensing data processing. In Proceedings of the 26th International Conference on WorldWide Web, International WWW Conferences Steering Committee, Perth, Australia, 3–April 2017; pp. 351–360.
92. Garcia, C.E.; Brena, R.F. Activity recognition using community data to complement small amounts of labeledinstances. Sensors 2016, 16, 877. [CrossRef] [PubMed]
93. Li, Y.; Shi, D.; Ding, B.; Liu, D. Unsupervised feature learning for human activity recognition using smartphonesensors. In Mining Intelligence and Knowledge Exploration; Springer: Cham, Switzerland, 2014; pp. 99–107.
94. Zheng, Y.; Liu, Q.; Chen, E.; Ge, Y.; Zhao, J. Time series classification using multi-channels deep convolutionalneural networks. In Conference on Web-Age Information Management; Springer: Cham, Switzerland, 2014;pp. 298–310.
95. Bhattacharya, S.; Lane, N. From smart to deep: Robust activity recognition on smartwatches usingdeep learning. In Proceedings of the 2016 IEEE International Conference on Pervasive Computing andCommunication Workshops, Sydney, NSW, Australia, 14–18 March 2016; pp. 1–6.
96. Hammerla, N.; Fisher, J.; Andras, P.; Rochester, L.; Walker, R. Pd disease state assessment in naturalisticenvironments using deep learning. In Proceedings of the Twenty-Ninth AAAI Conference on ArtificialIntelligence, Austin, TX, USA, 25–30 January 2015.
97. Hayashi, T.; Nishida, M.; Kitaoka, N.; Takeda, K. Daily activity recognition based on dnn using environmentalsound and acceleration signals. In Proceedings of the 2015 23rd European Signal Processing Conference(EUSIPCO), Nice, France, 31 August–4 September 2015; pp. 2306–2310.
98. Lane, N.; Georgiev, P. Can deep learning revolutionize mobile sensing? In Proceedings of the 16th InternationalWorkshop on Mobile Computing Systems and Applications. Santa Fe, NM, USA, 12–13 February 2015;pp. 117–122.
99. Liu, C.; Zhang, L.; Liu, Z.; Liu, K.; Li, X.; Liu, Y. Lasagna: Towards deep hierarchical understanding andsearching over mobile sensing data. In Proceedings of the 22nd Annual International Conference on MobileComputing and Networking, New York, NY, USA, 3–7 October 2016; pp. 334–347.

Sensors 2019, 19, 3213 26 of 28
100. Plötz, T.; Hammerla, N.Y.; Olivier, P.L. Feature learning for activity recognition in ubiquitous computing. InProceedings of the International Joint Conference on Artificial Intelligence, Barcelona, Spain, 16–22 July 2011;p. 1729.
101. Radu, V.; Lane, N.; Bhattacharya, S.; Mascolo, C.; Marina, M.; Kawsar, F. Towards multimodal deep learningfor activity recognition on mobile devices. In Proceedings of the 2016 ACM International Joint Conference onPervasive and Ubiquitous Computing: Adjunct, Heidelberg, Germany, 12–16 September 2016; pp. 185–188.
102. Zhang, L.; Wu, X.; Luo, D. Real-time activity recognition on smart-phones using deep neural networks.In Proceedings of the 2015 IEEE 12th Intl Conference on Ubiquitous Intelligence and Computing and 2015IEEE 12th Intl Conference on Autonomic and Trusted Computing and 2015 IEEE 15th Intl Conference onScalable Computing and Communications and Its Associated Workshops (UIC-ATC-ScalCom), Beijing,China, 10–14 August 2015; pp. 1236–1242.
103. Chen, Y.; Xue, Y. A deep learning approach to human activity recognition based on single accelerometer.In Proceedings of the 2015 IEEE International Conference on Systems, Man, and Cybernetics, Kowloon,China, 9–12 October 2015; pp. 1488–1492.
104. Chen, Y.; Zhong, K.; Zhang, J.; Sun, Q.; Zhao, X. LSTM networks for mobile human activity recognition.In Proceedings of the 2016 International Conference on Artificial Intelligence: Technologies and Applications,Bangkok, Thailand, 24–25 January 2016.
105. Gjoreski, H.; Bizjak, J.; Gjoreski, M.; Gams, M. Comparing deep and classical machine learning methods forhuman activity recognition using wrist accelerometer. In Proceedings of the IJCAI 2016 Workshop on DeepLearning for Artificial Intelligence, New York, NY, USA, 10 July 2016.
106. Ha, S.; Yun, J.; Choi, S. Multi-modal convolutional neural networks for activity recognition. In Proceedingsof the 2015 IEEE International Conference on Systems, Man, and Cybernetics, Hong Kong, China, 9–12October 2015; pp. 3017–3022.
107. Ha, S.; Choi, S. Convolutional Neural Networks for human activity recognition using multiple accelerometerand gyroscope sensors. In Proceedings of the 2016 International Joint Conference on Neural Networks(IJCNN), Vancouver, BC, Canada, 24–29 July 2016; pp. 381–388.
108. Hammerla, N.; Halloran, S.; Ploetz, T. Deep, convolutional, and recurrent models for human activityrecognition using wearables. arXiv, 2016; arXiv:1604.08880.
109. Hannink, J.; Kautz, T.; Pasluosta, C.; Gabmann, K.; Klucken, J.; Eskofier, B. Sensor-based gait parameterextraction with deep convolutional neural networks. IEEE J. Biomed. Health Inform. 2017, 21, 85–93. [CrossRef][PubMed]
110. Jiang, W.; Yin, Z. Human activity recognition using wearable sensors by deep convolutional neural networks.In Proceedings of the 23rd ACM international conference on Multimedia, Brisbane, Australia, 26–30 October2015; pp. 1307–1310.
111. Kim, Y.; Li, Y. Human activity classification with transmission and reflection coefficients of on-body antennasthrough deep convolutional neural networks. IEEE Trans. Antennas Propag. 2017, 65, 2764–2768. [CrossRef]
112. Lee, S.; Yoon, S.; Cho, H. Human activity recognition from accelerometer data using convolutional neuralnetwork. In Proceedings of the 2017 IEEE International Conference on Big Data and Smart Computing(BigComp), Jeju, Korea, 13–16 February 2017; pp. 131–134.
113. Mohammed, S.; Tashev, I. Unsupervised deep representation learning to remove motion artifacts in free-modebody sensor networks. In Proceedings of the 2017 IEEE 14th International Conference on Wearable andImplantable Body Sensor Networks (BSN), Eindhoven, The Netherlands, 9–12 May 2017; pp. 183–188.
114. Morales, F.; Roggen, D. Deep convolutional feature transfer across mobile activity recognition domains,sensor modalities and locations. In Proceedings of the 2016 ACM International Symposium on WearableComputers, Heidelberg, Germany, 12–16 September 2016; pp. 92–99.
115. Pourbabaee, B.; Roshtkhari, M.; Khorasani, K. Deep convolution neural networks and learning ecg featuresfor screening paroxysmal atrial fibrillatio patients. IEEE Trans. Syst. Man Cybern Syst. 2017, 48, 2095–2104.[CrossRef]
116. Ravi, D.; Wong, C.; Lo, B.; Yang, G. Deep learning for human activity recognition: A resource efficientimplementation on low-power devices. In Proceedings of the 2016 IEEE 13th International Conference onWearable and Implantable Body Sensor Networks (BSN), San Francisco, CA, USA, 14–17 June 2016; pp. 71–76.
117. Ravı, D.; Wong, C.; Lo, B.; Yang, G. A deep learning approach to on-node sensor data analytics for mobile orwearable devices. IEEE J. Biomed. Health Inform. 2017, 21, 56–64. [CrossRef] [PubMed]
Sensors 2019, 19, 3213 27 of 28
118. Ronao, C.; Cho, S. 2015 Deep convolutional neural networks for human activity recognition with smartphonesensors. In International Conference on Neural Information Processing; Springer: Cham, Switzerland, 2015;pp. 46–53.
119. Sathyanarayana, A.; Joty, S.; Fernandez-Luque, L.; Ofli, F.; Srivastava, J.; Elmagarmid, A.; Taheri, S.; Arora, T.Impact of physical activity on sleep: A deep learning based exploration. arXiv, 2016; arXiv:1607.07034.
120. Wang, J.; Zhang, X.; Gao, Q.; Yue, H.; Wang, H. Device-free wireless localization and activity recognition:A deep learning approach. IEEE Trans. Veh. Technol. 2016, 66, 6258–6267. [CrossRef]
121. Yang, J.; Nguyen, M.; San, P.; Li, X.; Krishnaswamy, S. Deep convolutional neural networks on multichanneltime series for human activity recognition. In Proceedings of the 24th International Joint Conference onArtificial Intelligence (IJCAI), Buenos Aires, Argentina, 25–31 July 2015; pp. 25–31.
122. Zebin, T.; Scully, P.; Ozanyan, K. Human activity recognition with inertial sensors using a deep learningapproach. In Proceedings of the 2016 IEEE SENSORS, Orlando, FL, USA, 30 October–3 November 2016;pp. 1–3.
123. Zeng, M.; Nguyen, L.; Yu, B.; Mengshoel, O.; Zhu, J.; Wu, P.; Zhang, J. Convolutional Neural Networks forhuman activity recognition using mobile sensors. In Proceedings of the 6th International Conference onMobile Computing, Applications and Services, Austin, TX, USA, 6–7 November 2014; pp. 197–205.
124. Zheng, Y.; Liu, Q.; Chen, E.; Ge, Y.; Zhao, J. Exploiting multi-channels deep convolutional neural networksfor multivariate time series classification. Front. Comput. Sci. 2016, 10, 96–112. [CrossRef]
125. Edel, M. Koppe Binarized-blstm-rnn based human activity recognition. In Proceedings of the 2016International Conference on Indoor Positioning and Indoor Navigation (IPIN), Alcala de Henares, Spain, 4–7October 2016; pp. 1–7.
126. Guan, Y.; Ploetz, T. Ensembles of deep LSTM learners for activity recognition using wearables. arXiv 2017,arXiv:1703.09370. [CrossRef]
127. Inoue, M.; Inoue, S.; Nishida, T. Deep recurrent neural network for mobile human activity recognition withhigh throughput. arXiv 2016, arXiv:1611.03607. [CrossRef]
128. Vepakomma, P.; De, D.; Das, S.; Bhansali, S. A-wristocracy: Deep learning on wrist-worn sensing forrecognition of user complex activities. In Proceedings of the 2015 IEEE 12th International Conference onWearable and Implantable Body Sensor Networks (BSN), Cambridge, MA, USA, 9–12 June 2015; pp. 1–6.
129. Walse, K.; Dharaskar, R.; Thakare, V. PCA based optimal ann classifiers for human ACTI Ensembles ofdeep ITY recognition using mobile sensors data. In Proceedings of the First International Conference onInformation and Communication Technology for Intelligent Systems; Springer: Cham, Switzerland, 2016;pp. 429–436.
130. Zhang, L.; Wu, X.; Luo, D. Human activity recognition with hmm-dnn model. In Proceedings of the 2015IEEE 14th International Conference on Cognitive Informatics & Cognitive Computing (ICCI* CC), Beijing,China, 6–8 July 2015; pp. 192–197.
131. Zhang, L.; Wu, X.; Luo, D. Recognizing human activities from raw accelerometer data using deep neuralnetworks. In Proceedings of the 2015 IEEE 14th International Conference on Machine Learning andApplications (ICMLA), Miami, FL, USA, 9–11 December 2015; pp. 865–870.
132. Chen, Z.; Zhang, L.; Cao, Z.; Guo, J. Distilling the Knowledge from Handcrafted Features for Human ActivityRecognition. IEEE Trans. Ind. Inform. 2018, 3203, 1–9. [CrossRef]
133. Klein, L.A. Sensor and Data Fusion: A Tool for Information Assessment and Decision Making; SPIE Press:Bellingham, WA, USA, 2004.
134. Tsinganos, P.; Skodras, A. On the Comparison of Wearable Sensor Data Fusion to a Single Sensor MachineLearning Technique in Fall Detection. Sensors 2018, 18, 592. [CrossRef] [PubMed]
135. Vaizman, Y.; Ellis, K.; Lanckriet, G. Recognizing Detailed Human Context In-the-Wild from Smartphonesand Smartwatches. IEEE Pervasive Comput. 2017, 16, 62–74. [CrossRef]
136. Hassan, M.M.; Uddin, M.Z.; Mohamed, A.; Almogren, A. A robust human activity recognition system usingsmartphone sensors and deep learning. Future Gener. Comput. Syst. 2017, 81, 307–313. [CrossRef]
137. Bancroft, J.B.; Lachapelle, G. Data fusion algorithms for multiple inertial measurement units. Sensors 2011,11, 6771–6798. [CrossRef] [PubMed]
138. Wang, Y.; Lin, J.; Annavaram, M.; Jacobson, Q.A.; Hong, J.; Krishnamachari, B. A Framework of energyefficient mobile sensing for automatic user state recognition. In Proceedings of the 7th InternationalConference on Mobile Systems, Applications, and Services, Kraków, Poland, 22–25 June 2009; pp. 179–192.

Sensors 2019, 19, 3213 28 of 28
139. Viet, V.Q.; Thang, H.M.; Choi, D. Balancing precision and battery drain in activity recognition on mobilephone. In Proceedings of the 18th International Conference on Parallel and Distributed Systems–ICPADS,Singapore, 17–19 December 2012; pp. 712–713.
140. Liang, Y.; Zhou, X.; Yu, Z.; Guo, B. Energy-efficient motion related activity recognition on mobile devices forpervasive healthcare. Mob. Netw. Appl. 2014, 19, 303–317. [CrossRef]
141. Yan, Z.; Subbaraju, V.; Chakraborty, D.; Misra, A.; Aberer, K. Energy-efficient continuous activity recognitionon mobile phones: An activity-adaptive approach. In Proceedings of the 2012 16th International Symposiumon Wearable Computers, Newcastle, UK, 18–22 June 2012; pp. 17–24.
142. Viet, V.Q.; Thang, H.M.; Choi, D. Adaptive energy-saving strategy for activity recognition on mobile phone.In Proceedings of the 2012 IEEE International Symposium on Signal Processing and Information Technology(ISSPIT), Ho Chi Minh City, Vietnam, 2–15 December 2012; pp. 95–100.
143. Ramamurthy, S.; Roy, N. Recent trends in machine learning for human activity recognition—A survey.Wiley Interdiscip. Rev. Data Min. Knowl. Discovery 2018, 8, e1254. [CrossRef]
144. Chavarriaga, R.; Sagha, H.; Calatroni, A.; Digumarti, S.T.; Tröster, G.; Millán, J.D.R.; Roggen, D.The Opportunity challenge: A benchmark database for on-body sensor-based activity recognition.Pattern Recognit. Lett. 2013, 34, 2033–2042. [CrossRef]
145. Anguita, D.; Ghio, A.; Oneto, L.; Parra, X.; Reyes-Ortiz, J.L. A Public Domain Dataset for Human ActivityRecognition Using Smartphones. In Proceedings of the European Symposium on Artificial Neural Networks,Computational Intelligence and Machine Learning, Bruges, Belgium, 24–26 April 2013; pp. 24–26.
146. Zhang, M.; Sawchuk, A.A. USC-HAD: A Daily Activity Dataset for Ubiquitous Activity Recognition UsingWearable Sensors. In Proceedings of the 2012 ACM Conference on Ubiquitous Computing, Pittsburgh, PA,USA, 5–8 September 2012; p. 1036.
147. Banos, O.; Garcia, R.; Holgado, J.A.; Damas, M.; Pomares, H.; Rojas, I.; Saez, A.; Villalonga, C. mHealthDroid:A novel framework for agile development of mobile health applications. In Proceedings of the 6thInternational Work-Conference on Ambient Assisted Living an Active Ageing (IWAAL 2014), Belfast, UK,2–5 December 2014.
148. Micucci, D.; Mobilio, M.; Napoletano, P. UniMiB SHAR: A new dataset for human activity recognition usingacceleration data from smartphones. Appl. Sci. 2017, 7, 1101. [CrossRef]
149. Romera, P.B.; Aung, M.S.; Bianchi-Berthouze, N. A one-vs-one classifier ensemble with majority votingfor activity recognition. In Proceedings of the European Symposium on Artificial Neural Networks,Computational Intelligence and Machine Learning, Bruges, Belgium, 24–26 April 2013; pp. 443–448.
© 2019 by the authors. Licensee MDPI, Basel, Switzerland. This article is an open accessarticle distributed under the terms and conditions of the Creative Commons Attribution(CC BY) license (http://creativecommons.org/licenses/by/4.0/).