Utilizing Motion Sensors for Gesture Recognition - MDPI
26
applied sciences Article Smart Rings vs. Smartwatches: Utilizing Motion Sensors for Gesture Recognition Marc Kurz * , Robert Gstoettner and Erik Sonnleitner Citation: Kurz, M.; Gstoettner, R.; Sonnleitner, E. Smart Rings vs. Smartwatches: Utilizing Motion Sensors for Gesture Recognition. Appl. Sci. 2021, 11, 2015. https:// doi.org/10.3390/app11052015 Academic Editor: Jiro Tanaka Received: 24 November 2020 Accepted: 19 February 2021 Published: 25 February 2021 Publisher’s Note: MDPI stays neutral with regard to jurisdictional claims in published maps and institutional affil- iations. Copyright: © 2021 by the authors. Licensee MDPI, Basel, Switzerland. This article is an open access article distributed under the terms and conditions of the Creative Commons Attribution (CC BY) license (https:// creativecommons.org/licenses/by/ 4.0/). Department of Mobility and Energy, University of Applied Sciences Upper Austria, 4232 Hagenberg, Austria; [email protected] (R.G.); [email protected] (E.S.) * Correspondence: [email protected]; Tel.: +43-(0)50-8042-2827 Abstract: Since electronic components are constantly getting smaller and smaller, sensors and logic boards can be fitted into smaller enclosures. This miniaturization lead to the development of smart rings containing motion sensors. These sensors of smart rings can be used to recognize hand/finger gestures enabling natural interaction. Unlike vision-based systems, wearable systems do not require a special infrastructure to operate in. Smart rings are highly mobile and are able to communicate wirelessly with various devices. They could potentially be used as a touchless user interface for countless applications, possibly leading to new developments in many areas of computer science and human–computer interaction. Specifically, the accelerometer and gyroscope sensors of a custom-built smart ring and of a smartwatch are used to train multiple machine learning models. The accuracy of the models is compared to evaluate whether smart rings or smartwatches are better suited for gesture recognition tasks. All the real-time data processing to predict 12 different gesture classes is done on a smartphone, which communicates wirelessly with the smart ring and the smartwatch. The system achieves accuracy scores of up to 98.8%, utilizing different machine learning models. Each machine learning model is trained with multiple different feature vectors in order to find optimal features for the gesture recognition task. A minimum accuracy threshold of 92% was derived from related research, to prove that the proposed system is able to compete with state-of-the-art solutions. Keywords: wearable computing; gesture recognition; human–computer interaction; machine learning 1. Introduction 1.1. Overview The most profound technologies are those that disappear. They weave themselves into the fabric of everyday life until they are indistinguishable from it. Mark Weiser [1] already predicted back in the year 1991 the modern age of smart devices we currently live in. About 15 years later, Steve Jobs revolutionized the smart phone [2] by replacing the user interface of styluses and hardware keyboards with multiple-finger gestures that allow even more natural computer interaction. However, these gestures require a surface to be performed against. This paper examines the process of gesture recognition, using gestures performed with the finger and/or the hand. Motion sensors of a smartwatch and a smart ring are used to record data, which are then used to train machine learning models in order to recognize gestures in real-time. In the course of this paper a custom prototype of a smart ring is built to mirror the sensors that are already built into modern smartwatches. Both devices record data from accelerometer and gyroscope sensors [3] and send them wirelessly to a smartphone, which interprets the data and classifies the gesture. Additionally, different gesture recognition and machine learning aspects have to be considered. First, a common gesture catalogue is being established which feels intuitive for the users. The recorded data need to be analysed and preprocessed so that patterns can be found. Multiple models need to be trained and parameters need to be adjusted in order to select a model that is able to reliably classify gestures. Appl. Sci. 2021, 11, 2015. https://doi.org/10.3390/app11052015 https://www.mdpi.com/journal/applsci
-
Upload
khangminh22 -
Category
Documents
-
view
3 -
download
0
Transcript of Utilizing Motion Sensors for Gesture Recognition - MDPI
applied sciences
Article
Smart Rings vs. Smartwatches: Utilizing Motion Sensors forGesture Recognition
Marc Kurz * , Robert Gstoettner and Erik Sonnleitner
�����������������
Citation: Kurz, M.; Gstoettner, R.;
Sonnleitner, E. Smart Rings vs.
Smartwatches: Utilizing Motion
Sensors for Gesture Recognition.
Appl. Sci. 2021, 11, 2015. https://
doi.org/10.3390/app11052015
Academic Editor: Jiro Tanaka
Received: 24 November 2020
Accepted: 19 February 2021
Published: 25 February 2021
Publisher’s Note: MDPI stays neutral
with regard to jurisdictional claims in
published maps and institutional affil-
iations.
Copyright: © 2021 by the authors.
Licensee MDPI, Basel, Switzerland.
This article is an open access article
distributed under the terms and
conditions of the Creative Commons
Attribution (CC BY) license (https://
creativecommons.org/licenses/by/
4.0/).
Department of Mobility and Energy, University of Applied Sciences Upper Austria, 4232 Hagenberg, Austria;[email protected] (R.G.); [email protected] (E.S.)* Correspondence: [email protected]; Tel.: +43-(0)50-8042-2827
Abstract: Since electronic components are constantly getting smaller and smaller, sensors and logicboards can be fitted into smaller enclosures. This miniaturization lead to the development of smartrings containing motion sensors. These sensors of smart rings can be used to recognize hand/fingergestures enabling natural interaction. Unlike vision-based systems, wearable systems do not requirea special infrastructure to operate in. Smart rings are highly mobile and are able to communicatewirelessly with various devices. They could potentially be used as a touchless user interface forcountless applications, possibly leading to new developments in many areas of computer science andhuman–computer interaction. Specifically, the accelerometer and gyroscope sensors of a custom-builtsmart ring and of a smartwatch are used to train multiple machine learning models. The accuracyof the models is compared to evaluate whether smart rings or smartwatches are better suited forgesture recognition tasks. All the real-time data processing to predict 12 different gesture classes isdone on a smartphone, which communicates wirelessly with the smart ring and the smartwatch. Thesystem achieves accuracy scores of up to 98.8%, utilizing different machine learning models. Eachmachine learning model is trained with multiple different feature vectors in order to find optimalfeatures for the gesture recognition task. A minimum accuracy threshold of 92% was derived fromrelated research, to prove that the proposed system is able to compete with state-of-the-art solutions.
Keywords: wearable computing; gesture recognition; human–computer interaction; machine learning
1. Introduction1.1. Overview
The most profound technologies are those that disappear. They weave themselves into the fabricof everyday life until they are indistinguishable from it. Mark Weiser [1] already predicted backin the year 1991 the modern age of smart devices we currently live in. About 15 years later,Steve Jobs revolutionized the smart phone [2] by replacing the user interface of styluses andhardware keyboards with multiple-finger gestures that allow even more natural computerinteraction. However, these gestures require a surface to be performed against. This paperexamines the process of gesture recognition, using gestures performed with the fingerand/or the hand. Motion sensors of a smartwatch and a smart ring are used to recorddata, which are then used to train machine learning models in order to recognize gesturesin real-time.
In the course of this paper a custom prototype of a smart ring is built to mirror thesensors that are already built into modern smartwatches. Both devices record data fromaccelerometer and gyroscope sensors [3] and send them wirelessly to a smartphone, whichinterprets the data and classifies the gesture. Additionally, different gesture recognitionand machine learning aspects have to be considered. First, a common gesture catalogueis being established which feels intuitive for the users. The recorded data need to beanalysed and preprocessed so that patterns can be found. Multiple models need to betrained and parameters need to be adjusted in order to select a model that is able to reliablyclassify gestures.
Appl. Sci. 2021, 11, 2015. https://doi.org/10.3390/app11052015 https://www.mdpi.com/journal/applsci
Appl. Sci. 2021, 11, 2015 2 of 26
1.2. Motivation
The smart home [4,5] could be a major application domain for gesture recognitionsystems, because simple gestures could be used to control an entire home full of smartappliances, making the life of many people easier. However, this is only possible assumingthe right infrastructure is established with compatibility between the gesture controlsystem and the targeted smart appliance. Especially in a smart home a one-handedgesture recognition system is desirable. A smartwatch cannot provide one-handednessreliably, because it is impossible to interact with the watch using the hand it is mountedon. With a smart ring it would be possible since adjacent fingers can reach the ring.However, this depends on whether an interaction is necessary at all to activate the gesturerecognition process.
Smartwatches and smart rings are ubiquitous [1] and blend into the environmentlike regular accessories, which makes them socially acceptable and therefore accessible inmany environments. For example, they could be used as replacement for presenters tochange slides during a talk, or more generally for performing actions depending on thecontext of the environment and available devices. Gesture controlled systems could alsobe combined with other classic input devices like keyboards to increase productivity or tocreate completely new interaction models. Virtual reality controllers are rather bulky andcould be completely replaced [6] by multiple smart rings or a combination of watch andring. Medical doctors could use gestures to control music playback or to switch screens insterile environments. Speech impaired people could use a system that is as easy to use asvoice control. Beyond the gesture catalogue, gestures are language independent and can beused for sign language [7] or for character recognition [8]. Elderly people having troublewith remote controls could benefit from gesture-controlled systems as well as visuallyimpaired people [9].
Beyond, many more applications could benefit from gesture recognition systems.Especially, one-handed ubiquitous systems could replace or extend existing user interfacesand lead to completely new ways for computer interaction.
1.3. Scope and Focus
The scope of this paper encompasses gesture recognition, which is the process ofdetecting a specific gesture in an arbitrary sequence of datum points. Recognition isdifferent from detection, which essentially is the process of detecting whether the datapoints represent a gesture or other arbitrary movements.
Data are recorded with motion sensors such as accelerometer, gyroscope and magne-tometer. The gestures are performed with the hand, while sensor devices are mounted onthe wrist and/or finger. The focus of the paper is on examining whether there is a differencebetween wrist-mounted and finger-mounted sensors when recognizing hand gestures withrespect to different machine learning models. This difference is at first evaluated with equalconditions for both devices to establish a common ground. Later on, the finger device usesa different activation method to start and stop the data sampling. This different method hasseveral advantages in terms of usability. Although the focus is on the technical approach,the different activation methods and the resulting differences in usability can influence theoverall performance of the system. Therefore, the activation method should be taken intoconsideration as well.
The most important part of a gesture recognition system is the gestures it supports.These gestures should be universally accepted between different users and feel as intuitiveas possible for specific tasks. Since the scope of the paper does not encompass specificapplications for the gestures, a dictionary of gestures needs to be established, which isacceptable without respective applications in mind.
The entire machine learning process of the system is at the core of this paper and en-compasses multiple steps from data recording to model training and gesture classification.

Appl. Sci. 2021, 11, 2015 3 of 26
1.4. Goals and Research Focus
Card et al. [10] measured information rates of fingers and wrists, performing anempirical study on the design space of input devices. They conclude that fingers havean information rate of 40 bits/s and wrists have 25 bits/s. Although this study does notexamine air-gestures, it can be concluded that in general fingers provide more informationthan wrists. Thus, it could be inferred that finger-mounted devices might produce betterresults than wrist-mounted devices for a gesture recognition task. This aspect encompassesthe main research focus within this paper. Therefore, the definition of better in the gesturerecognition context has to be defined. Based on the assumption that the amount of infor-mation correlates with the accuracy measure of a machine learning model, two systemscan be ranked by comparing the accuracy of their models. However, the data recording ofboth sensor devices needs to be performed identically and at the same time with the samesampling rate.
The smartwatch has a display which can be used to start or stop the data sampling ofthe sensors. Since the smart ring has no display, the smartwatch needs to control the smartring sensor activation in order to establish an identical recording setup. The sensors of thering could be activated with a press of adjacent fingers, which could affect the recordeddata. Assuming that the easier access to the activation of the ring sensors leads to almostperfectly segmented signals, the question arises whether the activation mechanism of thesmart ring increases the accuracy—this aspect is part of future investigations.
This aspect can be evaluated by re-recording the data with a different activationmethod and then comparing the results with the previous recording. The goal of this paperwas to create a system, which is capable of recording and recognizing gestures, aimed atevaluating the two research aspects.
2. Related Work
Starting with the first iPhone in 2007, accelerometers were considered a standard com-ponent of smartphones, with the intent to automatically rotate the screen when switchingfrom portrait to landscape mode [2]. Today, most smart devices are equipped with sensorsthat make them capable of measuring movements. However, the primary goal of recentsmartwatches, fitness trackers and smart rings is to recognize activity patterns and measurefitness related properties. Most market-ready products do not provide an API for accessingthe built-in sensors with third-party software, which makes it difficult to acquire wearablesensors for research purposes.
Generally, for the scope of this paper, related work has to be discussed whereas it hasto be differentiated between finger-mounted systems and wrist-mounted systems.
2.1. Finger-Mounted Systems
Roshandel et al. [11] present a gesture recognition system that uses a smart ring torecord data. The ring consists of a 9-axis sensor, a battery and a proximity sensor to senseadjacent fingers. It transmits data via Bluetooth and does not have any mechanism to startor stop the transmission, which indicates that they performed the segmentation manuallyby hand. The results were evaluated by comparing four different machine learning models(multi-layer perceptron, decision tree, naive Bayes and support vector machine), usingcross-validation, whereas the data were collected with 24 participants, each performing9 different gestures. It is notable, that air-gestures perform better than gestures performedagainst a fixed surface—this supports the approach of this paper using air-gestures.
Xie et al. [12] propose a rule-based extensible gesture recognition system. This systemis based on a smart ring with a 3-axis accelerometer that also contains a vibrator for tactilefeedback. Data are transmitted via Bluetooth Low Energy with a sensor sampling rate of50 Hz. The accelerometer records data within a range of −8 g to +8 g, which should sufficefor the gesture catalog they propose. Since all gestures are defined as 2D gestures and thering coordinate system is always aligned with the gestures, one axis is ignored, resulting ina 2D space. The gesture catalog encompasses eight basic gestures and 12 complex gestures
Appl. Sci. 2021, 11, 2015 4 of 26
composed of a combination of two to three basic gestures. The hamming distance is usedas a measure for the similarity between two gestures. In contrast to machine learning-based approaches, the recorded data are only used to test the accuracy by counting thenumber of correct matches. The basic gesture matching resulted in an accuracy of 98.9%and the complex matching in 97.2%. However, some of the gestures were not detectedby the segmentation algorithm, because some participants could not reach the minimumacceleration that is required for the thresholds. The advantage of this approach overmachine learning approaches is that it is not necessary to train a model beforehand, whichleads to an extensible system. However, it is not robust against different users and hasstrict constraints on the orientation of the ring and how the gestures have to be performed.
The magic ring [13] is a wired sensor that is mounted on the middle segment of theindex finger. The mounting location was chosen, because the middle segment is the mostflexible and should therefore deliver better results. The ring contains a 3-axis accelerometerwhich provides values in a range from −1.5 g to +1.5 g. This range is very small comparedto most other systems, but the gesture catalog contains only very fine grained gestures.The gesture catalog consists of 12 simple gestures. Six of the gestures are targeted at fingermovement while the hand is fixed and four are targeted at hand movements. The remainingtwo gestures represent bending and unbending movements of the finger. The data wererecorded with 20 participants, each repeating every gesture five times, thus resulting in100 samples per gesture and 1200 samples in total. Since there is no mechanism to activateor deactivate the recording between gestures, the data were segmented by using a fixedwindow with an empirically estimated size of one second. The results were evaluated bythree different machine learning algorithms (C4.5, KNN and NB) using cross-validation.Instead of using all features, different groups of features were evaluated with every modelto determine the feature quality. It is interesting that fewer features can produce betterresults. Therefore, a feature elimination strategy may be required for other systems aswell. Relative features could be further improved and their impact on accuracy impliesthat experimentation may be necessary in that regard. The recognition accuracy could befurther improved by using more complex models.
Zhu et al. [14] propose a system to control robots with gestures. A sensor is clippedonto the finger and connected to a PDA via a cable. The sensor provides data froman accelerometer and gyroscope with a sampling rate of 150 Hz. The five gestures areperformed with the hand and resemble actions, which would be used to command dogs.Each gesture was repeated 15 times in 10 recording sessions, thus resulting in 150 samplesper gesture. All of the data are recorded without any mechanism to identify the startor the end of the gesture. Therefore, segmentation is needed after the recording. Thesegmentation is realized with a 3-layer neural network (NN) to distinguish gestures andarbitrary movements. The NN is trained with simple statistical features, such as meanand variance. The same features are used for the gesture recognition, which is realizedwith a hierarchical hidden Markov model. The automatic segmentation approach usingan NN seems to work very well, but it remains unclear how it performs on its own orhow it affects the overall performance of the system. On a wireless real-time system, thesegmentation would need to be performed directly on the sensor device, which could beproblematic due to the low computing power of the device.
2.2. Wrist-Mounted Systems
Mace et al. [15] propose a gesture recognition system that utilizes a smartwatch. Thewatch contains a 3-axis accelerometer, which provides values in a range from −2 g to+2 g. This is a relatively small range compared to other systems. The data are sampledwith 100 Hz and sent to a tablet for processing via a wireless RF-transmitter. The datawere recorded from five people, each performing four different gestures. Each gesturewas repeated five times, which results in 25 samples per gesture. This is a relatively smallsample size compared to other systems. Nevertheless, the goal is to examine algorithmsthat require a small training data set. Twenty statistical features are derived from the
Appl. Sci. 2021, 11, 2015 5 of 26
data and evaluated with a feature weighted Naive Bayes and a Dynamic Time Warpingalgorithm. The results show that the NB algorithm performs best with 97% accuracy. TheDTW performance is very similar with 95%.
Porzi et al. [9] propose a gesture-controlled user interface for visually impaired people.The system uses a smartwatch to recognize gestures, which instructs a smartphone tocarry out various tasks. The watch contains a 3-axis accelerometer with a sampling rateof 10 Hz. This sampling rate originates from API restrictions of the smartwatch and isvery low compared to other systems. The data are sent to the smartphone via Bluetoothto recognize the gestures. Eight different gestures were recorded by 15 different users,each repeating every gesture for 15 times, thus resulting in 225 samples per gesture andtotaling 1800 samples. The data transmission starts when the user presses the display ofthe watch. The data are directly used as input for two support vector machine approachesand a dynamic time warping approach. The proposed kernel for the SVM approach is anapproximated version of the global alignment kernel and has lower computational costthan the standard version. The optimal parameters for the kernels were estimated withgrid search and cross-validation. The results show that the faster kernel approach deliversa slightly lower accuracy than the standard approach. The former results in an averageaccuracy of 91.08% and the latter in 92.33%. The DTW approach performed worse thanboth SVM approaches with 54.89%. The low accuracy of the DTW approach suggests thatit is not suitable for a gesture recognition task without feature engineering.
Xu et al. propose a system, which is able to recognize multi-finger and hand gestureswith a wrist-mounted sensor [16]. The sensor contains an accelerometer and gyroscope,which measure hand movements as well as tendon movements to recognize hand andfinger gestures, respectively. The data are sampled with 128 Hz and are transmitted toa smartphone using Bluetooth. The gesture catalog consists of 37 gestures, where 13 arefinger gestures, 14 are hand gestures and 10 are arm gestures. Only 10 samples wererecorded per gesture, totaling in a data set with 370 gestures. During the recording, thefinger, hand and arm were fixed to a chair depending on the gesture. Feature extraction isperformed for various feature categories, such as motion energy, posture, motion shapeand motion variation. The 10 best performing features are selected by determining theinformation gain. Three different classifiers (naive Bayes, linear regression and decisiontree) are evaluated based on the selected features. The algorithms are only tested with avery small sample size of 10 samples per gesture and in a very controlled environment.To test the system’s robustness, a much larger sample size, recorded with different users,would be necessary.
Serendipity [17] is a system to recognize fine finger gestures with a smartwatch. Thesmartwatch contains an accelerometer and a gyroscope and is capable of sensing rotationand gravity due to the sensor fusion between these two. The sensors are sampled with50 Hz and the data are sent via Wi-Fi to a server for processing. Five fine-grained multi-finger gestures were recorded with 10 participants. Each participant performed eachgesture 40 times. The same experiment was repeated for three different orientations andthe whole experiment was repeated again, which results in 800 samples per gesture andorientation. The gesture segmentation is realized with a dynamic time warping algorithmand empirically estimated thresholds. The signal is split into windows with a width ofone second. Each window is then compared to a template using DTW. Four differentmachine learning classifiers (support vector machine, naive Bayes, k-nearest neighbor andlogistic regression) are used for validation. The results show that the average accuracy is87%. However, data from half of the participants performed better with the SVM classifierand the other half performed better with the LR classifier. The false positive rate for thegesture segmentation is 25%, which means that every fourth time, noise is detected as agesture. With an activation gesture instead of the automatic segmentation algorithm, therate decreased to 8%.
Appl. Sci. 2021, 11, 2015 6 of 26
2.3. Discussion
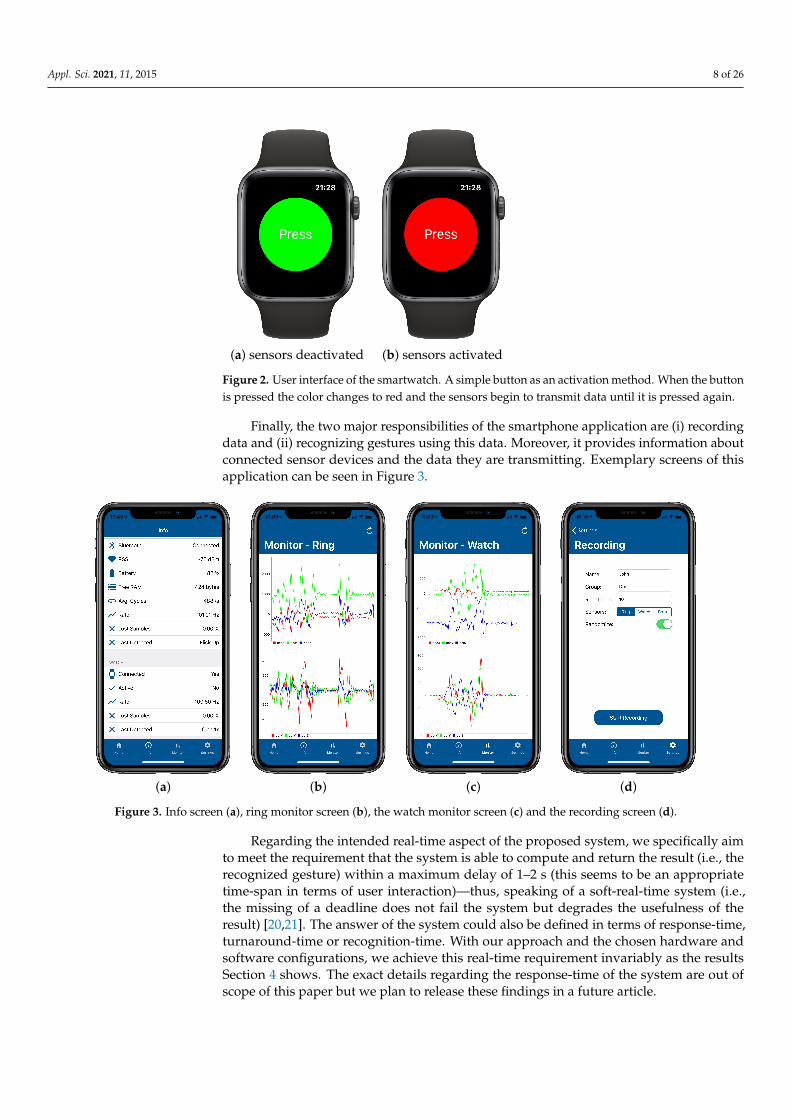
Table 1 shows an overview of the compared systems. Half of the systems use wrist-mounted sensors or smartwatches, while the other half uses finger-mounted sensors orsmart rings. Every sensor device includes at least an accelerometer. Half of all systemsadditionally measure data with a gyroscope. However, the gesture catalog of some systemsdoes not require a gyroscope because none of the gestures contain rotation movements.Nevertheless, some systems could benefit from an additional gyroscope.
Table 1. Overview of the compared systems.
Publication Mounting Location Nr. of Gestures Nr. of Samples Sensors Model Accuracy
Roshandel et al. [11] Finger 9 120 A,G MLP 97.80%Xie et al. [12] Finger 8 70 A SM 98.90%Jing et al. [13] Finger 12 100 A DT 86.90%Zhu et al. [14] Finger 5 150 A,G HMM 82.30%Mace et al. [15] Wrist 4 25 A DTW 95.00%Porzi et al. [9] Wrist 8 225 A SVM 93.33%Xu et al. [16] Wrist 14 10 A,G NB 98.57%Wen et al. [17] Wrist 5 800 A,G KNN 87.00%
Generally, the accuracy ranges from 82.3% to 98.57% and leads to an average accuracyof about 92%. It is not clear from the comparison whether wrist- or finger-mounted sensorsproduce better results. Moreover, this cannot be directly compared because differentsystems use different recognition techniques and gesture catalogs. Furthermore, somesystems base the performance of the models on user-independent and some base it onuser-dependent experiments and facilitate different feature sets or no features at all. Tocompare two mounting positions, the experiments need to be identical in every possibleway, so that unknown influences do not disturb the results.
All the findings of this section directly influence the methodology of this paper. Inorder to compare the mounting points, the experimental setup needs to be identical.Therefore, the data for both locations will be recorded in parallel, using a button-basedmechanism to start and stop the gesture. The same gesture set will be used for both devices,containing only hand gestures. In order to examine all aspects of gestures, the catalog willcontain gestures that are performed in a 3D space, utilizing all axes of the sensors. Bothdevices will use 9-axis sensors, containing an accelerometer, gyroscope and magnetometer.The latter will be ignored to prevent interference with other smart devices. To supportthe design aspects of a real-time system, both devices will transmit the data wirelesslyto a smartphone for processing. A sampling rate of 100 Hz will be used, which shouldbe low enough to be transmitted in real-time and high enough to capture most of themovement patterns.
For the data acquisition, 10 participants will provide 10 repetitions of 12 gestures,which results in 100 samples per gesture for each mounting location and is consistent withthe gesture and sample size that is used in the proposed systems. The feature derivationprocess will produce different features, which will be ranked by importance and theunimportant ones will be removed. Only some models in the proposed systems, willbe used for the evaluation, since the models depend on the compatibility with machinelearning frameworks.
Since all systems achieved an average accuracy of 92%, the desired minimum for thispaper matches this number. To examine alternative manual segmentation techniques, thewhole recognition process is repeated with a different button-based mechanism.
Appl. Sci. 2021, 11, 2015 7 of 26
3. Approach and Methodology3.1. System Overview
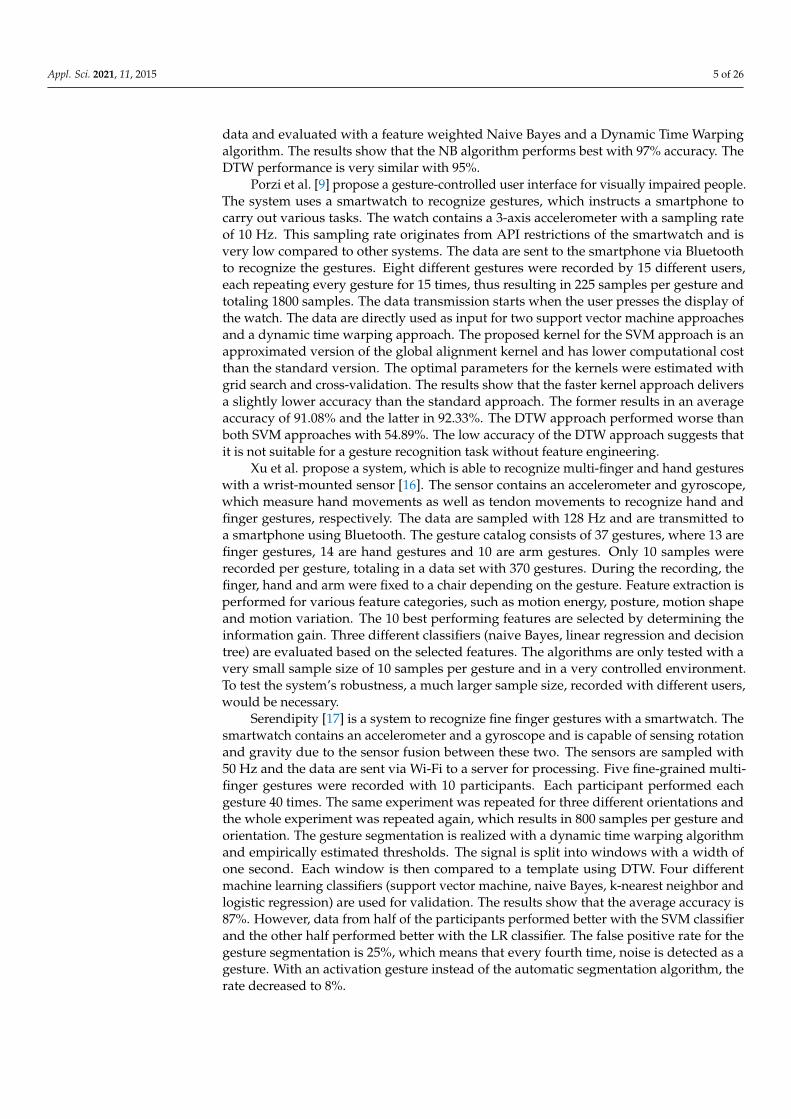
In the course of this paper, a custom smart ring has been developed (see Figure 1)taking into account well-known challenges and aspects for wearable systems [18]. Thering consists of different modules, which can be stacked onto each other, adding certaincapabilities to a microcontroller. The stacking point between modules also serves as aconnector between them. All modules were bought from the company TinyCircuits [19]and are designed as extensions for the TinyDuino [19] microcontroller. Each modulemeasures about 20 × 20 mm and all required modules stack in height to about 17 mm. Thebattery has the same form factor as the modules and increases the height to about 20 mmwhen stacked on top of the modules. The accelerometer board is as close to the bottom aspossible to minimize the distance between the finger and the actual sensor. For attachingthe stack of modules to the finger, a comfortable elastic ring is used.
(a) front (b) side (c) back
Figure 1. Custom built smart ring with an elastic mounting and a force sensitive resistor on theside of the ring. From bottom to top the modules are the processor board, the sensor module, theBluetooth module, the USB shield, the prototyping board and the battery.
In addition to the custom hardware developments, software had to be implementedfor both, the smart ring as well as the smartwatch. The purpose of both implementationsis mainly to read the sensor data and send it to the smartphone. However, other taskshave to be considered too, such as timing the sensor readings, enabling/disabling thesensors, locking/unlocking the activation mechanism and managing power consumption.Regarding the smart ring, an attached force sensitive resistor enables/disables the sensors,but in order to compare different activation methods, the sensors must be able to betriggered externally. Therefore, the smart ring supports remote activation of the sensorsvia Bluetooth. Additionally, the manual activation mechanism can be locked remotely toprevent false activations while being controlled remotely. Furthermore, the ring periodicallysends status updates to the smartphone, which inform its user about the condition ofthe ring.
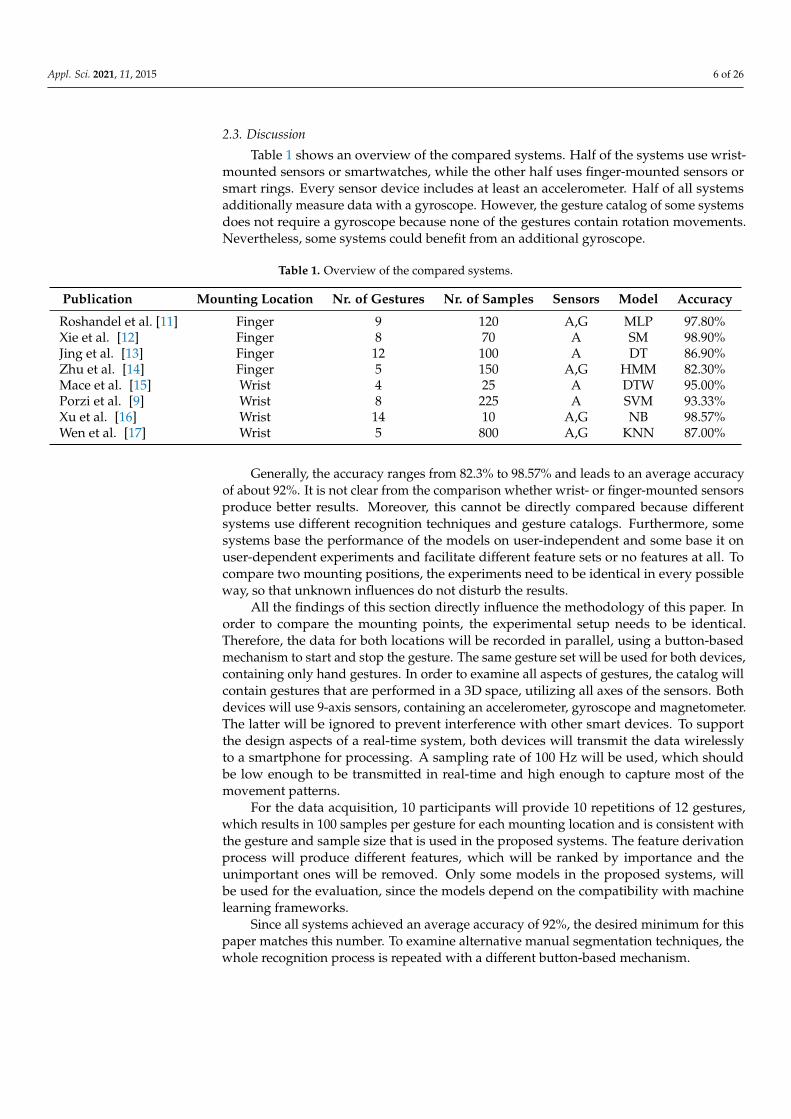
The purpose of the smartwatch application is similar to the smart ring’s: read sensordata and then send them to the smartphone application. The user interface consists of onlya single screen. This screen provides a software button as activation mechanism. Figure 2shows the user interface of the smartwatch application. In contrast to the activationmechanism of the ring, it is not required to keep pressing the button after the initial press.Instead, the button changes its color to the color red, which informs the user that thesensors are enabled.
Appl. Sci. 2021, 11, 2015 8 of 26
(a) sensors deactivated (b) sensors activated
Figure 2. User interface of the smartwatch. A simple button as an activation method. When the buttonis pressed the color changes to red and the sensors begin to transmit data until it is pressed again.
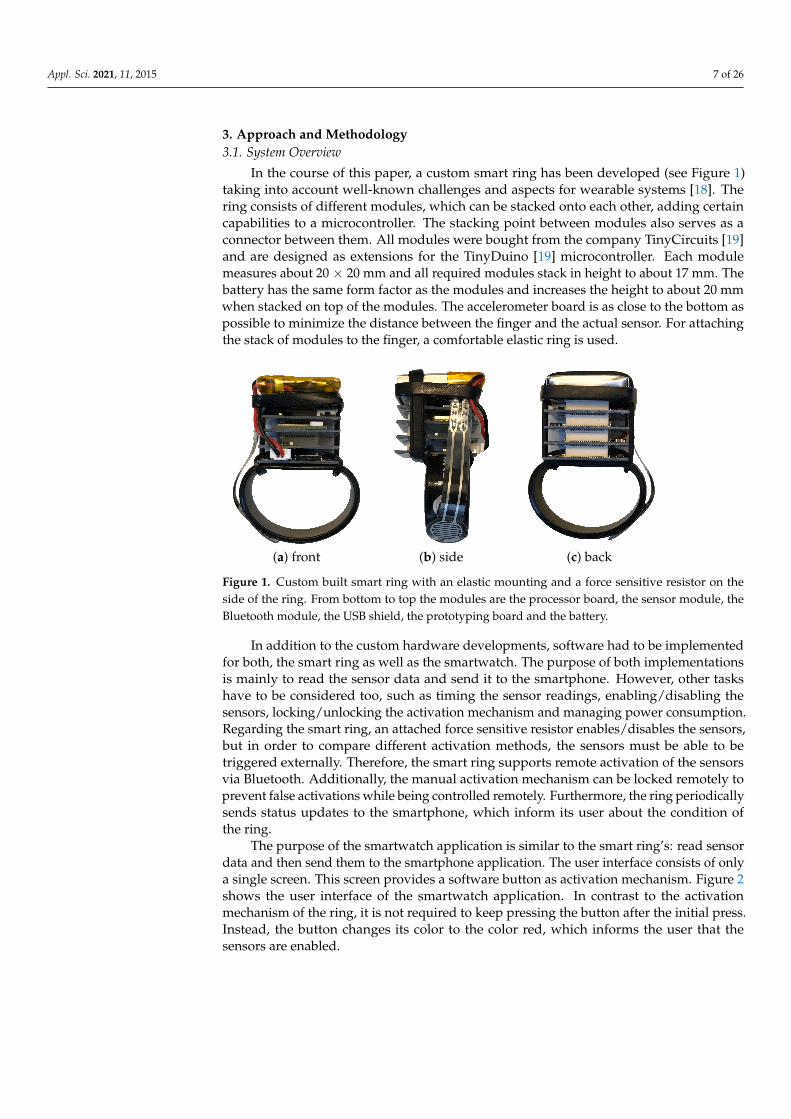
Finally, the two major responsibilities of the smartphone application are (i) recordingdata and (ii) recognizing gestures using this data. Moreover, it provides information aboutconnected sensor devices and the data they are transmitting. Exemplary screens of thisapplication can be seen in Figure 3.
(a) (b) (c) (d)
Figure 3. Info screen (a), ring monitor screen (b), the watch monitor screen (c) and the recording screen (d).
Regarding the intended real-time aspect of the proposed system, we specifically aimto meet the requirement that the system is able to compute and return the result (i.e., therecognized gesture) within a maximum delay of 1–2 s (this seems to be an appropriatetime-span in terms of user interaction)—thus, speaking of a soft-real-time system (i.e.,the missing of a deadline does not fail the system but degrades the usefulness of theresult) [20,21]. The answer of the system could also be defined in terms of response-time,turnaround-time or recognition-time. With our approach and the chosen hardware andsoftware configurations, we achieve this real-time requirement invariably as the resultsSection 4 shows. The exact details regarding the response-time of the system are out ofscope of this paper but we plan to release these findings in a future article.
Appl. Sci. 2021, 11, 2015 9 of 26
3.2. Relevant Gestures
Since there is no gesture catalog that is universally applicable and intuitive for differentusers, a set of 12 different gestures is proposed, inspired by Gheran et al. [22,23]. Allconsidered gestures based on direction information implicitly introduce a gesture in theopposite direction. Some gestures are based on rotation movements and others combinerotation information with direction information. Moreover, the gesture catalog containsgestures that produce low as well as high acceleration values and gestures that utilizedifferent dimensions of the sensor reference coordinate system. In order to be able tocompare finger-mounted and wrist-mounted sensors, all gestures are performed usingthe whole hand. Since most users are right-handed and the smartwatch is (usually) wornon the left hand, the smart ring is also worn on the left hand. Therefore, all gestures areperformed with the left hand.
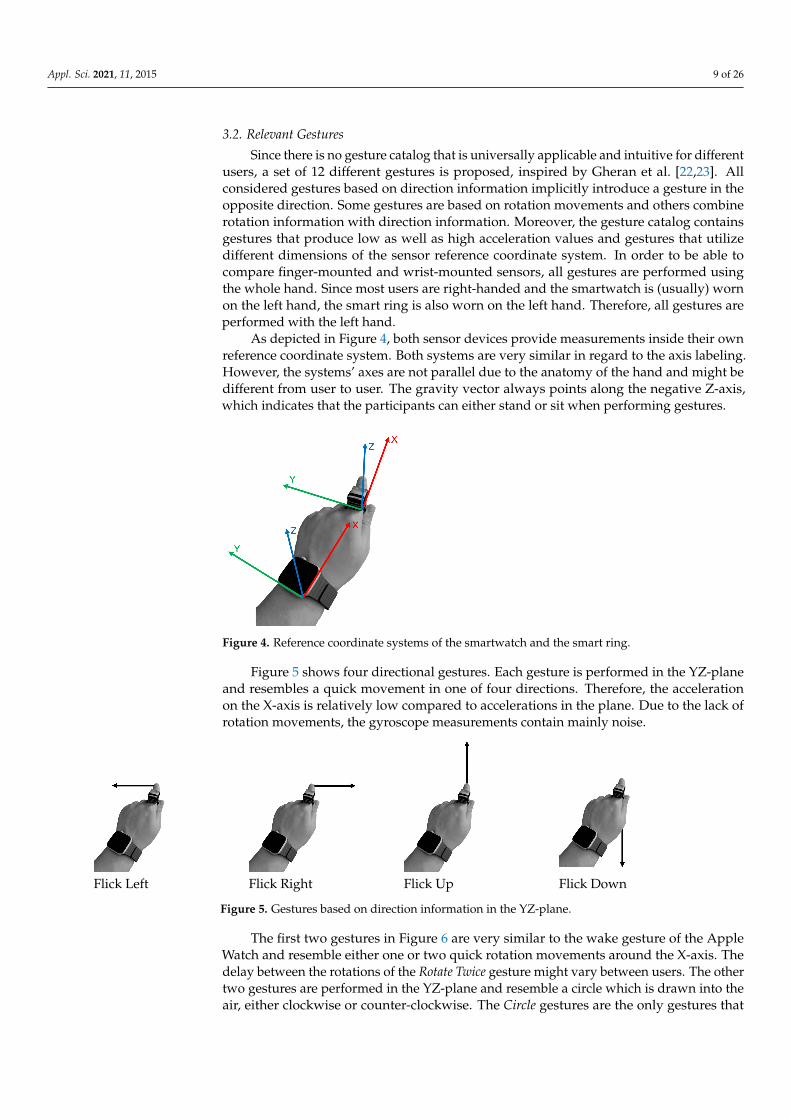
As depicted in Figure 4, both sensor devices provide measurements inside their ownreference coordinate system. Both systems are very similar in regard to the axis labeling.However, the systems’ axes are not parallel due to the anatomy of the hand and might bedifferent from user to user. The gravity vector always points along the negative Z-axis,which indicates that the participants can either stand or sit when performing gestures.
Figure 4. Reference coordinate systems of the smartwatch and the smart ring.
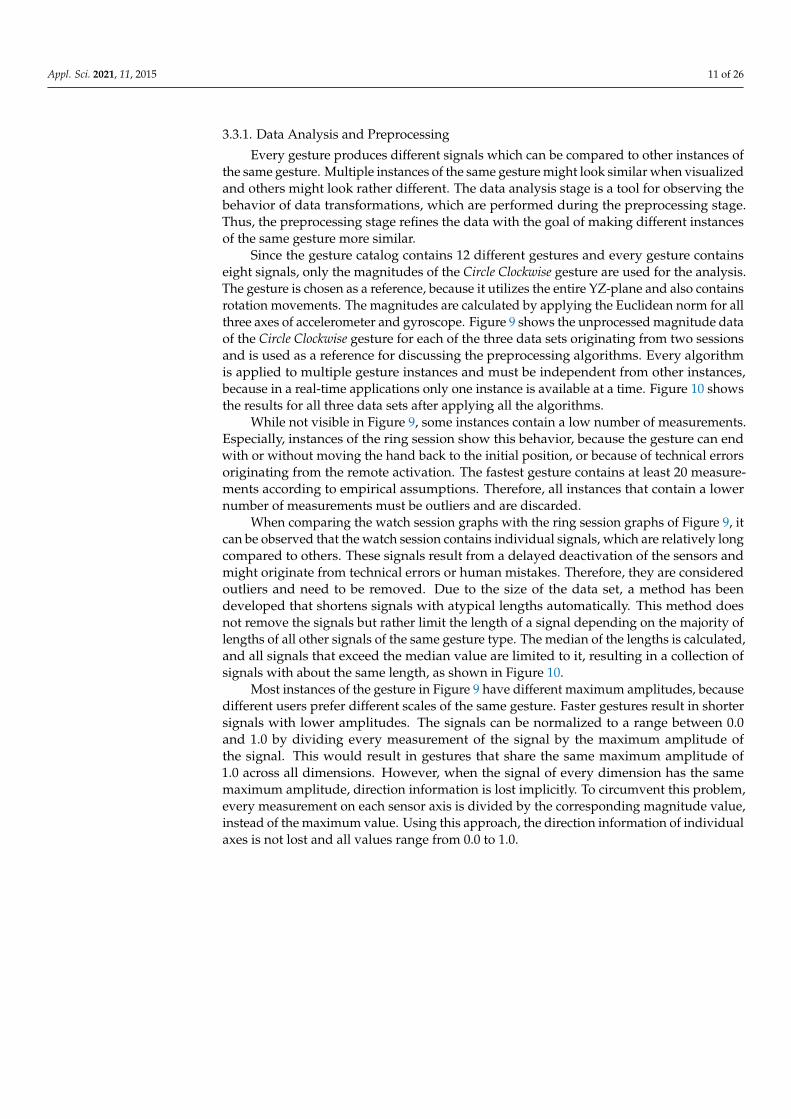
Figure 5 shows four directional gestures. Each gesture is performed in the YZ-planeand resembles a quick movement in one of four directions. Therefore, the accelerationon the X-axis is relatively low compared to accelerations in the plane. Due to the lack ofrotation movements, the gyroscope measurements contain mainly noise.
Flick Left Flick Right Flick Up Flick Down
Figure 5. Gestures based on direction information in the YZ-plane.
The first two gestures in Figure 6 are very similar to the wake gesture of the AppleWatch and resemble either one or two quick rotation movements around the X-axis. Thedelay between the rotations of the Rotate Twice gesture might vary between users. The othertwo gestures are performed in the YZ-plane and resemble a circle which is drawn into theair, either clockwise or counter-clockwise. The Circle gestures are the only gestures that

Appl. Sci. 2021, 11, 2015 10 of 26
smoothly transition between acceleration axes. The measurements of the former gesturesare mainly visible on the gyroscope and the latter gestures mainly affect the accelerometer.
Rotate Once Rotate Twice Circle Clockwise Circle Counter-Cw.
Figure 6. Gestures based on rotation information around the X-axis or inside the YZ-plane.
The first two gestures of Figure 7 resemble clap movements, which lead to relativelyhigh accelerations on the Z-axis compared to other gestures. Similar to the Rotate Twicegesture, the time delay between claps might be different from user to user. Furthermore,the initial rotation of the hand, which is necessary to get into a clapping position, affectsthe gyroscope. The Checkmark gesture contains movements in multiple directions insidethe YZ-plane and is the only gesture that abruptly changes acceleration axes. The ImaginaryButton resembles a gesture pressing an imaginary button in front of the user. It is the onlygesture performed along the X-axis and therefore, transitions the gesture catalog from a 2Dto a 3D space.
Clap Once Clap Twice Checkmark Imaginary Button
Figure 7. Gestures based on high acceleration values along the Z-axis, multiple directions in the YZ-plane or directioninformation along the X-axis.
It is notable to mention that all persons have performed the gestures with the wholeleft hand and that the devices have not been worn reversed or generally wrong for theexperiments. Since the gestures are performed with the whole hand, the finger on whichthe ring is worn does not significantly influence the performance of the system (i.e., thecoordinate system and thus the movement patterns do not change).
3.3. Algorithmic Methodology
In the following Sections 3.3.1–3.3.4, the algorithmic methodologies applied in ourapproach are presented. Figure 8 provides an overview about the sub-sequential stepsstarting from the gathering of the gesture data, to data preprocessing, feature extractionand gesture recognition.
Figure 8. An overview of the different algorithmic steps applied in our approach.
Appl. Sci. 2021, 11, 2015 11 of 26
3.3.1. Data Analysis and Preprocessing
Every gesture produces different signals which can be compared to other instances ofthe same gesture. Multiple instances of the same gesture might look similar when visualizedand others might look rather different. The data analysis stage is a tool for observing thebehavior of data transformations, which are performed during the preprocessing stage.Thus, the preprocessing stage refines the data with the goal of making different instancesof the same gesture more similar.
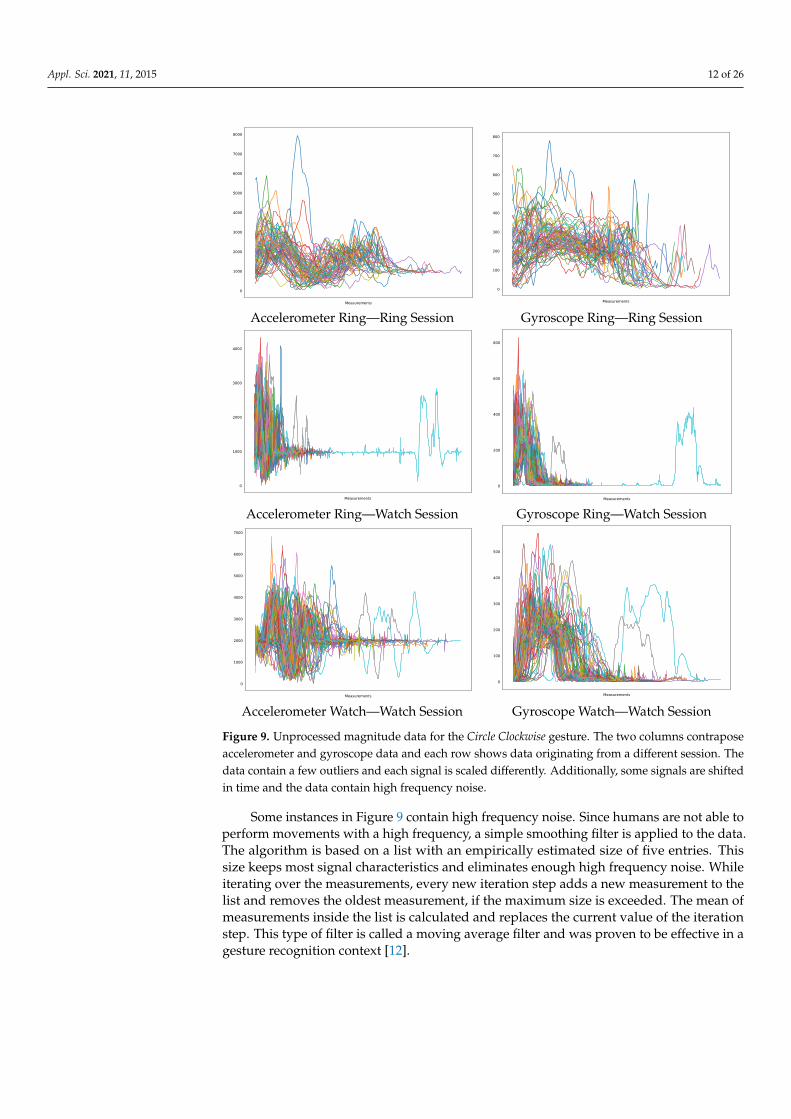
Since the gesture catalog contains 12 different gestures and every gesture containseight signals, only the magnitudes of the Circle Clockwise gesture are used for the analysis.The gesture is chosen as a reference, because it utilizes the entire YZ-plane and also containsrotation movements. The magnitudes are calculated by applying the Euclidean norm for allthree axes of accelerometer and gyroscope. Figure 9 shows the unprocessed magnitude dataof the Circle Clockwise gesture for each of the three data sets originating from two sessionsand is used as a reference for discussing the preprocessing algorithms. Every algorithmis applied to multiple gesture instances and must be independent from other instances,because in a real-time applications only one instance is available at a time. Figure 10 showsthe results for all three data sets after applying all the algorithms.
While not visible in Figure 9, some instances contain a low number of measurements.Especially, instances of the ring session show this behavior, because the gesture can endwith or without moving the hand back to the initial position, or because of technical errorsoriginating from the remote activation. The fastest gesture contains at least 20 measure-ments according to empirical assumptions. Therefore, all instances that contain a lowernumber of measurements must be outliers and are discarded.
When comparing the watch session graphs with the ring session graphs of Figure 9, itcan be observed that the watch session contains individual signals, which are relatively longcompared to others. These signals result from a delayed deactivation of the sensors andmight originate from technical errors or human mistakes. Therefore, they are consideredoutliers and need to be removed. Due to the size of the data set, a method has beendeveloped that shortens signals with atypical lengths automatically. This method doesnot remove the signals but rather limit the length of a signal depending on the majority oflengths of all other signals of the same gesture type. The median of the lengths is calculated,and all signals that exceed the median value are limited to it, resulting in a collection ofsignals with about the same length, as shown in Figure 10.
Most instances of the gesture in Figure 9 have different maximum amplitudes, becausedifferent users prefer different scales of the same gesture. Faster gestures result in shortersignals with lower amplitudes. The signals can be normalized to a range between 0.0and 1.0 by dividing every measurement of the signal by the maximum amplitude ofthe signal. This would result in gestures that share the same maximum amplitude of1.0 across all dimensions. However, when the signal of every dimension has the samemaximum amplitude, direction information is lost implicitly. To circumvent this problem,every measurement on each sensor axis is divided by the corresponding magnitude value,instead of the maximum value. Using this approach, the direction information of individualaxes is not lost and all values range from 0.0 to 1.0.
Appl. Sci. 2021, 11, 2015 12 of 26
Measurements
0
1000
2000
3000
4000
5000
6000
7000
8000
Measurements
0
100
200
300
400
500
600
700
800
Accelerometer Ring—Ring Session Gyroscope Ring—Ring Session
Measurements
0
1000
2000
3000
4000
Measurements
0
200
400
600
800
Accelerometer Ring—Watch Session Gyroscope Ring—Watch Session
Measurements
0
1000
2000
3000
4000
5000
6000
7000
Measurements
0
100
200
300
400
500
Accelerometer Watch—Watch Session Gyroscope Watch—Watch Session
Figure 9. Unprocessed magnitude data for the Circle Clockwise gesture. The two columns contraposeaccelerometer and gyroscope data and each row shows data originating from a different session. Thedata contain a few outliers and each signal is scaled differently. Additionally, some signals are shiftedin time and the data contain high frequency noise.
Some instances in Figure 9 contain high frequency noise. Since humans are not able toperform movements with a high frequency, a simple smoothing filter is applied to the data.The algorithm is based on a list with an empirically estimated size of five entries. Thissize keeps most signal characteristics and eliminates enough high frequency noise. Whileiterating over the measurements, every new iteration step adds a new measurement to thelist and removes the oldest measurement, if the maximum size is exceeded. The mean ofmeasurements inside the list is calculated and replaces the current value of the iterationstep. This type of filter is called a moving average filter and was proven to be effective in agesture recognition context [12].

Appl. Sci. 2021, 11, 2015 13 of 26
0 25 50 75 100 125 150 175
0.2
0.4
0.6
0.8
1.0
0 25 50 75 100 125 150 175 200
0.2
0.4
0.6
0.8
1.0
Accelerometer Ring—Ring Session Gyroscope Ring—Ring Session
0 50 100 150 200 250 300
0.2
0.4
0.6
0.8
1.0
0 50 100 150 200 250 300
0.0
0.2
0.4
0.6
0.8
1.0
Accelerometer Ring—Watch Session Gyroscope Ring—Watch Session
0 50 100 150 200 250
0.2
0.4
0.6
0.8
1.0
0 50 100 150 200 250
0.0
0.2
0.4
0.6
0.8
1.0
Accelerometer Watch—Watch Session Gyroscope Watch—Watch Session
Figure 10. Preprocessed magnitude data for the Circle Clockwise gesture. The two columns contraposeaccelerometer and gyroscope data and each row shows data originating from a different session.Every signal is scaled equally, and the outliers are removed. Additionally, the time shift is corrected,and the high frequency noise is filtered.
Since every gesture is recorded with an activation mechanism and since the user isfree to perform the gesture at any time between the start and the stop event, some instancesare shifted in time. This effect is visible in all sessions of Figure 9. In order to correctthe shift, a characteristic which defines the location of the gesture in the signal must befound. Additionally, the characteristic must be independent from other instances. Differentcharacteristics, such as the maximum value, the minimum value or one of both dependingon the smaller index, were empirically evaluated. The best performing characteristic wasthe position of the maximum value. Thus, every instance is shifted by the index of themaximum value of the signal, leading to aligned instances as shown in Figure 10.
3.3.2. Feature Derivation and Selection
The goal of the feature derivation stage is to extract multiple characteristics from thedata in order to differentiate gesture types. The best feature is one that uniquely identifiesa gesture type and is identical on every gesture instance. However, this is not possible for
Appl. Sci. 2021, 11, 2015 14 of 26
the gesture catalog, since different gestures share similar characteristics. Thus, multiplefeatures are extracted for each gesture instance and then combined with the assumptionthat a collection of features describes a gesture better than a single feature. Each gestureinstance provides eight different signals, and each signal can be used to calculate multiplefeatures. Therefore, the total number of features depends on the dimensionality of thepreprocessed data.
Figure 10 shows that different instances of the same gesture contain a different numberof measurements, even after being preprocessed. Since most machine learning models canonly handle feature vectors with a fixed size, the feature derivation stage must transformsignals with different lengths into feature vectors with fixed lengths. Therefore, each featurederivation algorithm must be able to handle signals with variable input sizes.
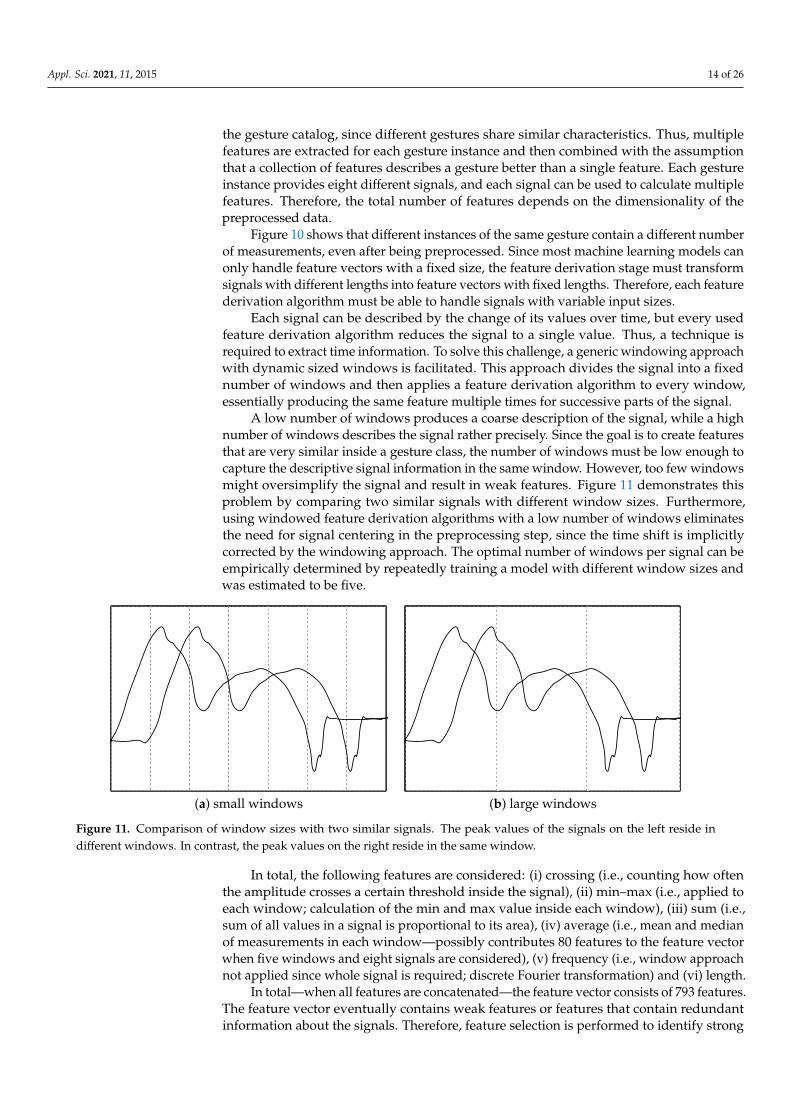
Each signal can be described by the change of its values over time, but every usedfeature derivation algorithm reduces the signal to a single value. Thus, a technique isrequired to extract time information. To solve this challenge, a generic windowing approachwith dynamic sized windows is facilitated. This approach divides the signal into a fixednumber of windows and then applies a feature derivation algorithm to every window,essentially producing the same feature multiple times for successive parts of the signal.
A low number of windows produces a coarse description of the signal, while a highnumber of windows describes the signal rather precisely. Since the goal is to create featuresthat are very similar inside a gesture class, the number of windows must be low enough tocapture the descriptive signal information in the same window. However, too few windowsmight oversimplify the signal and result in weak features. Figure 11 demonstrates thisproblem by comparing two similar signals with different window sizes. Furthermore,using windowed feature derivation algorithms with a low number of windows eliminatesthe need for signal centering in the preprocessing step, since the time shift is implicitlycorrected by the windowing approach. The optimal number of windows per signal can beempirically determined by repeatedly training a model with different window sizes andwas estimated to be five.
(a) small windows (b) large windows
Figure 11. Comparison of window sizes with two similar signals. The peak values of the signals on the left reside indifferent windows. In contrast, the peak values on the right reside in the same window.
In total, the following features are considered: (i) crossing (i.e., counting how oftenthe amplitude crosses a certain threshold inside the signal), (ii) min–max (i.e., applied toeach window; calculation of the min and max value inside each window), (iii) sum (i.e.,sum of all values in a signal is proportional to its area), (iv) average (i.e., mean and medianof measurements in each window—possibly contributes 80 features to the feature vectorwhen five windows and eight signals are considered), (v) frequency (i.e., window approachnot applied since whole signal is required; discrete Fourier transformation) and (vi) length.
In total—when all features are concatenated—the feature vector consists of 793 features.The feature vector eventually contains weak features or features that contain redundantinformation about the signals. Therefore, feature selection is performed to identify strong
Appl. Sci. 2021, 11, 2015 15 of 26
features, remove redundant features and reduce the size of the feature vector. Largefeature vectors produce complex models and, depending on the algorithm, might lead tooverfitting [24]. Essentially, overfitted models achieve very high prediction accuracies aslong as the input data for the prediction was already used to train the model. The MutualInformation (MI) score is used to measure the relatedness and the dependency betweena feature and the gesture class by quantifying the amount of information that a featureprovides when observing the gesture class. The chosen MI-score algorithm is based onentropy estimation from k-nearest neighbor distances [25]. Features with a score of zeroare independent from the target gesture and therefore, contribute no useful information.Whereas, a high score indicates a strong relationship with the target variable. Therefore, allfeatures are ranked by the MI-score and only the highest ranked features are selected forthe model training stage.
3.3.3. Machine Learning Models
In the course of this paper, four different machine learning models (i.e., classifiers)are considered. The selection of those specific models is grounded on the criteria that (i)the models should be rather easy to train (e.g., Kim et al. [26] show that deep learningmethods need to be profoundly adapted to support real-time processing), (ii) be executableon a common smart-phone in real-time and (iii) promising for our specific task as stated byrelated work—the differences in the recognition performance/accuracy with respect to ourresearch interests are also an interesting aspect and will be tackled in the results Section 4.
Each classifier can be refined with hyperparameters, which depend on the data set.Since three different data sets are compared and each data set is reduced to three categoriesof feature vectors, the model parameters must be estimated nine times per model type.Using four different model types, this totals in 36 iterations. However, each iterationfollows the same process and is independent from other iterations. The accuracy score forevaluation of the classifiers is done by a 10-fold cross-validation (see Section 4). In detail,the following four algorithm are considered:
• Random forest (RF) [27]: based on multiple decision trees; can be tuned with varioushyperparameters (e.g., number of trees, depth of the trees, no. of samples per leaf, etc.).
• Radial support vector machine (SVM) [28]: based on multi-dimensional lines (i.e.,hyperplanes), which separate different classes in a multi-dimensional feature-space.
• k-nearest neighbor (KNN) [29]: based on a distance measure between a feature vectorand the k nearest feature vectors (i.e., the neighbors).
• Gaussian naive Bayes (NB) [30]: based on the Bayes theorem for predicting probabilities.
3.3.4. Experiment and Data Recording
In order to gather a data set consisting of our relevant gestures with respect to avariance in the subjects performing the gestures in multiple sessions, various variables hadto be considered. The experiment facilitated the established gesture catalog consisting of12 gestures. The gestures have been performed by 10 participants, each being between21 and 53 years old and having a technical or non–technical educational background. Allparticipants were familiar with touch controlled smart devices.
Each gesture was performed 10 times by every participant. The resulting 120 gestureswere performed sequentially by repeating the whole gesture catalog. The gestures were notrandomized and therefore, the same gesture never repeated twice in succession. Half ofthe participants performed the gestures in a sitting posture and the other half in a standingposture. The sitting participants were not allowed to rest their elbow on a surface. Thus,all gestures were performed without restricting the movements in any way.
All gestures had to be performed with the whole hand, even if it was possible toperform the gesture with the finger while the hand was fixed. This constraint is importantto be able to compare the mounting positions of the sensor devices. The duration andthe scale of the gesture were not restricted, but every gesture had to be performed with achanging velocity in order to support the accelerometer readings. Every gesture had been

Appl. Sci. 2021, 11, 2015 16 of 26
presented to every participant before the experiment started to prevent confusion duringthe recording session.
The data recording was performed during two sessions. Both sessions recorded atotal number of 1200 gesture instances for each targeted sensor device. The sessions wereperformed in succession on the same day. In total, each participant contributed a totalnumber of 360 gesture instances to the gesture recognition system.
4. Evaluation and Results
For evaluation, three different data sets are utilized to cross-validate four differentmachine learning model types (random forest, support vector machine, k-nearest neighbor,naive Bayes), each with three different feature vector sizes (small, medium, large). Two ofthese data sets were recorded during the watch session, utilizing the data from the smartring and the smartwatch, while sharing a common activation mechanism. The third data setwas recorded during the ring session. The ring data set of the watch session is reused, andboth data sets are compared, whereas both sets utilize a different activation mechanism.
4.1. Watch Session Results
The idea of the watch session is to establish a baseline for comparing the smart ringwith the smartwatch. The data for both devices was recorded simultaneously, while theactivation mechanism of the watch controlled both devices. Therefore, both data setscontain measurements of the exact same gestures and should differ only in terms of themounting locations of sensor devices.
4.1.1. Smartwatch Observations
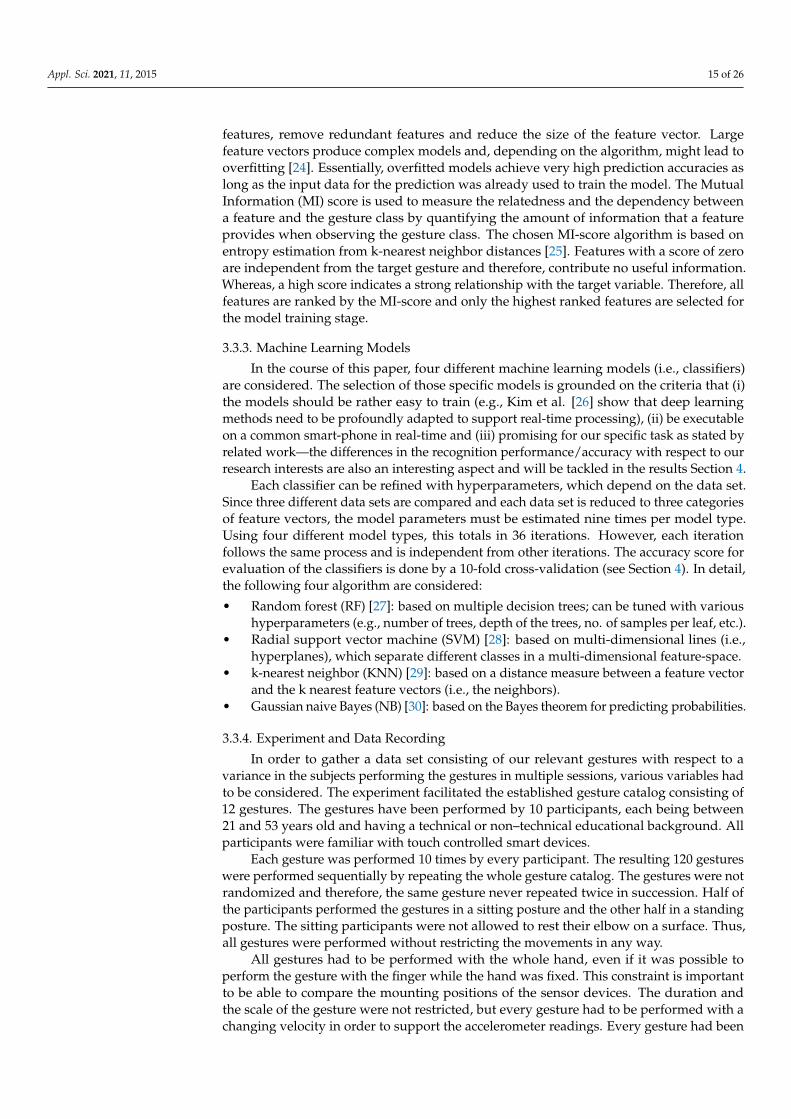
Figure 12 shows the results for 12 different models. Each model was trained with datafrom the smartwatch using cross-validation and compared against the held-back test setto estimate realistic accuracy scores. The held-back test was split apart from the data setin advance to the model training stage. Therefore, testing against this test set provides arealistic estimate for the model performance on unseen data. The training process wasrepeated for each of the three feature vector sizes, where the small feature vector containsonly the most important features and the large vector misses only the weakest features.The different vectors contain 10%, 50% and 90% of the best features, respectively. For eachtype of model, a model representative is selected by comparing the scores originating fromthe three different feature vector configurations. From the four resulting representatives,the best and worst models are further inspected in detail.
The random forest (RF) representative performed best with 98.8% accuracy, while thek-nearest neighbor (KNN) representative performed the worst with 94.6% accuracy. Thedifference between the best and the worst representatives is only 4.4%.
The naive Bayes (NB) and the RF classifier seem to be able to handle different featurevectors about equally well considering that the maximum difference in accuracy betweenfeature vectors sizes is only 1.1% for the RF and 2.0% for the NB. In contrast, the differencefor the support vector machine (SVM) and the k-nearest neighbor (KNN) classifiers is9.6% and 8.4%, respectively. Generally, the results show that feature vectors containingmore than 10% of the best features lead to better results and that feature vectors with morethan 50% of the best features lead to worse results. This suggests, that the models couldbe optimized further by introducing additional feature vector sizes around the mediumsized category.
Appl. Sci. 2021, 11, 2015 17 of 26
RF SVM KNN NB70
75
80
85
90
95
100Ac
cura
cy [%
]
97.1
88.386.2
94.2
98.8 97.9
94.696.2
97.9 97.5
94.295.4
small feature vector(10%)medium feature vector(50%)large feataure vector(90%)
Figure 12. Accuracy scores of all 16 models trained by the watch data set of the watch session. Each model type was trainedwith three different feature vector sizes and tested against the held-back test data set.
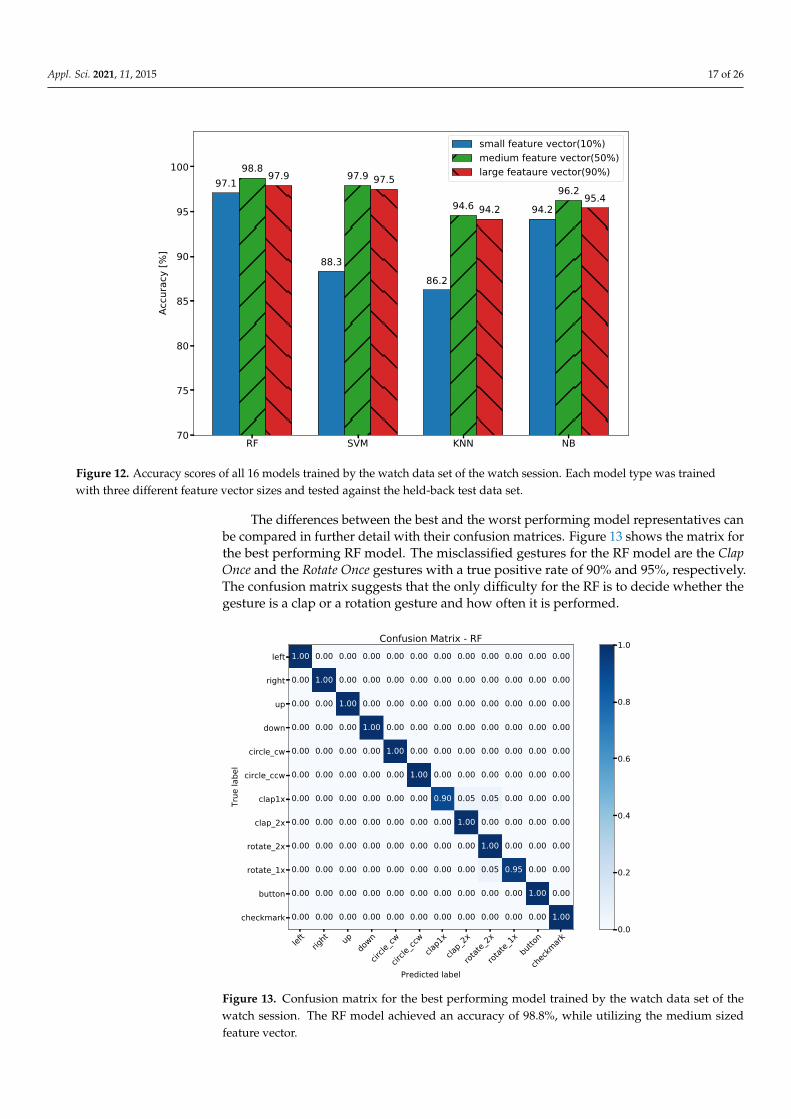
The differences between the best and the worst performing model representatives canbe compared in further detail with their confusion matrices. Figure 13 shows the matrix forthe best performing RF model. The misclassified gestures for the RF model are the ClapOnce and the Rotate Once gestures with a true positive rate of 90% and 95%, respectively.The confusion matrix suggests that the only difficulty for the RF is to decide whether thegesture is a clap or a rotation gesture and how often it is performed.
left
right up
down
circle
_cw
circle
_ccw
clap1
x
clap_2
x
rotate
_2x
rotate
_1xbu
tton
checkm
ark
Predicted label
left
right
up
down
circle_cw
circle_ccw
clap1x
clap_2x
rotate_2x
rotate_1x
button
checkmark
True
labe
l
1.00 0.00 0.00 0.00 0.00 0.00 0.00 0.00 0.00 0.00 0.00 0.00
0.00 1.00 0.00 0.00 0.00 0.00 0.00 0.00 0.00 0.00 0.00 0.00
0.00 0.00 1.00 0.00 0.00 0.00 0.00 0.00 0.00 0.00 0.00 0.00
0.00 0.00 0.00 1.00 0.00 0.00 0.00 0.00 0.00 0.00 0.00 0.00
0.00 0.00 0.00 0.00 1.00 0.00 0.00 0.00 0.00 0.00 0.00 0.00
0.00 0.00 0.00 0.00 0.00 1.00 0.00 0.00 0.00 0.00 0.00 0.00
0.00 0.00 0.00 0.00 0.00 0.00 0.90 0.05 0.05 0.00 0.00 0.00
0.00 0.00 0.00 0.00 0.00 0.00 0.00 1.00 0.00 0.00 0.00 0.00
0.00 0.00 0.00 0.00 0.00 0.00 0.00 0.00 1.00 0.00 0.00 0.00
0.00 0.00 0.00 0.00 0.00 0.00 0.00 0.00 0.05 0.95 0.00 0.00
0.00 0.00 0.00 0.00 0.00 0.00 0.00 0.00 0.00 0.00 1.00 0.00
0.00 0.00 0.00 0.00 0.00 0.00 0.00 0.00 0.00 0.00 0.00 1.00
Confusion Matrix - RF
0.0
0.2
0.4
0.6
0.8
1.0
Figure 13. Confusion matrix for the best performing model trained by the watch data set of thewatch session. The RF model achieved an accuracy of 98.8%, while utilizing the medium sizedfeature vector.
Appl. Sci. 2021, 11, 2015 18 of 26
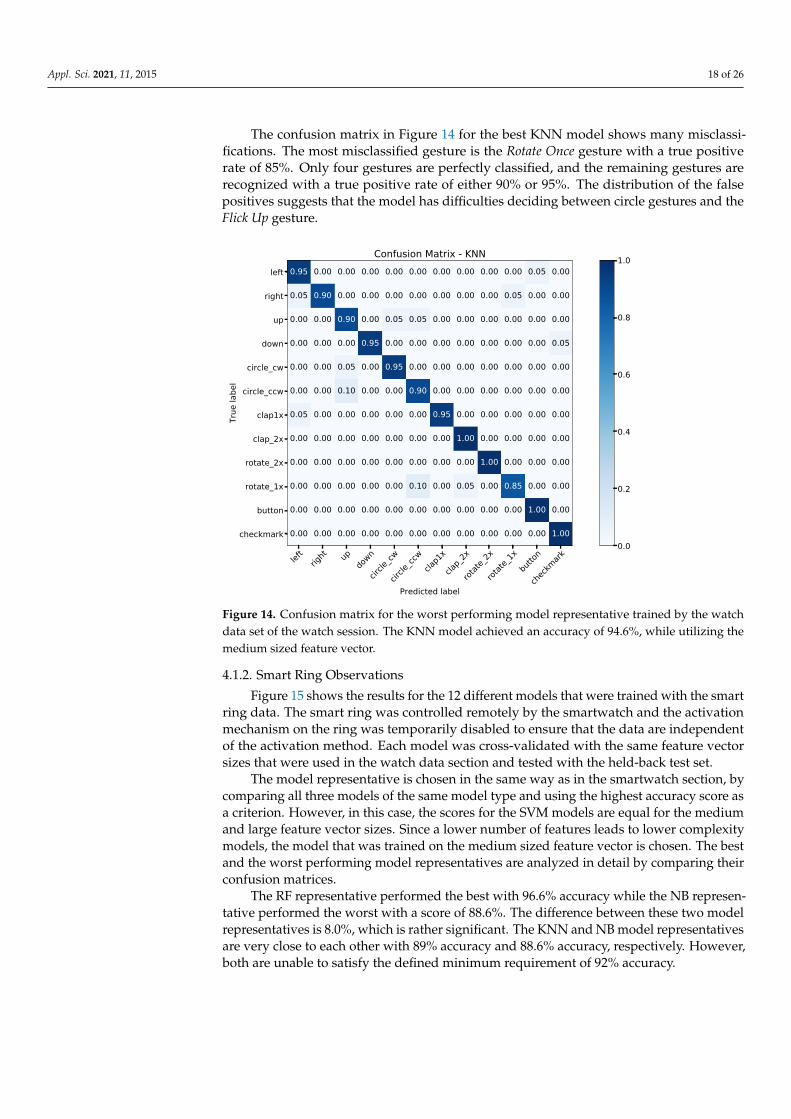
The confusion matrix in Figure 14 for the best KNN model shows many misclassi-fications. The most misclassified gesture is the Rotate Once gesture with a true positiverate of 85%. Only four gestures are perfectly classified, and the remaining gestures arerecognized with a true positive rate of either 90% or 95%. The distribution of the falsepositives suggests that the model has difficulties deciding between circle gestures and theFlick Up gesture.
left
right up
down
circle
_cw
circle
_ccw
clap1
x
clap_2
x
rotate
_2x
rotate
_1xbu
tton
checkm
ark
Predicted label
left
right
up
down
circle_cw
circle_ccw
clap1x
clap_2x
rotate_2x
rotate_1x
button
checkmark
True
labe
l
0.95 0.00 0.00 0.00 0.00 0.00 0.00 0.00 0.00 0.00 0.05 0.00
0.05 0.90 0.00 0.00 0.00 0.00 0.00 0.00 0.00 0.05 0.00 0.00
0.00 0.00 0.90 0.00 0.05 0.05 0.00 0.00 0.00 0.00 0.00 0.00
0.00 0.00 0.00 0.95 0.00 0.00 0.00 0.00 0.00 0.00 0.00 0.05
0.00 0.00 0.05 0.00 0.95 0.00 0.00 0.00 0.00 0.00 0.00 0.00
0.00 0.00 0.10 0.00 0.00 0.90 0.00 0.00 0.00 0.00 0.00 0.00
0.05 0.00 0.00 0.00 0.00 0.00 0.95 0.00 0.00 0.00 0.00 0.00
0.00 0.00 0.00 0.00 0.00 0.00 0.00 1.00 0.00 0.00 0.00 0.00
0.00 0.00 0.00 0.00 0.00 0.00 0.00 0.00 1.00 0.00 0.00 0.00
0.00 0.00 0.00 0.00 0.00 0.10 0.00 0.05 0.00 0.85 0.00 0.00
0.00 0.00 0.00 0.00 0.00 0.00 0.00 0.00 0.00 0.00 1.00 0.00
0.00 0.00 0.00 0.00 0.00 0.00 0.00 0.00 0.00 0.00 0.00 1.00
Confusion Matrix - KNN
0.0
0.2
0.4
0.6
0.8
1.0
Figure 14. Confusion matrix for the worst performing model representative trained by the watchdata set of the watch session. The KNN model achieved an accuracy of 94.6%, while utilizing themedium sized feature vector.
4.1.2. Smart Ring Observations
Figure 15 shows the results for the 12 different models that were trained with the smartring data. The smart ring was controlled remotely by the smartwatch and the activationmechanism on the ring was temporarily disabled to ensure that the data are independentof the activation method. Each model was cross-validated with the same feature vectorsizes that were used in the watch data section and tested with the held-back test set.
The model representative is chosen in the same way as in the smartwatch section, bycomparing all three models of the same model type and using the highest accuracy score asa criterion. However, in this case, the scores for the SVM models are equal for the mediumand large feature vector sizes. Since a lower number of features leads to lower complexitymodels, the model that was trained on the medium sized feature vector is chosen. The bestand the worst performing model representatives are analyzed in detail by comparing theirconfusion matrices.
The RF representative performed the best with 96.6% accuracy while the NB represen-tative performed the worst with a score of 88.6%. The difference between these two modelrepresentatives is 8.0%, which is rather significant. The KNN and NB model representativesare very close to each other with 89% accuracy and 88.6% accuracy, respectively. However,both are unable to satisfy the defined minimum requirement of 92% accuracy.

Appl. Sci. 2021, 11, 2015 19 of 26
RF SVM KNN NB70
75
80
85
90
95
100
Accu
racy
[%]
95.4
78.5
71.7
85.2
96.6
92.8
88.6 88.6
96.2
92.8
89.087.3
small feature vector(10%)medium feature vector(50%)large feataure vector(90%)
Figure 15. Accuracy scores of all 16 models trained by the ring data set of the watch session. Each model type was trainedwith three different feature vector sizes and tested against the held-back test data set.
The RF and the NB classifiers seem to be able to handle different feature vector sizeswell compared to the SVM and KNN classifiers. The difference between the worst modeland the best model for different feature vector sizes is 1.2% for the RF classifier and 3.5%for the NB classifier. In contrast, the difference for the KNN and SVM classifiers is 17.3%and 14.3% respectively. However, these differences originate from the low score for thesmall feature vector while the scores for larger vectors are almost identical. This suggests,that these classifiers require at least a certain number of features in order to perform goodon the data set. The KNN model representative is the only model that gains an advantageby using the large feature vector over the medium vector.
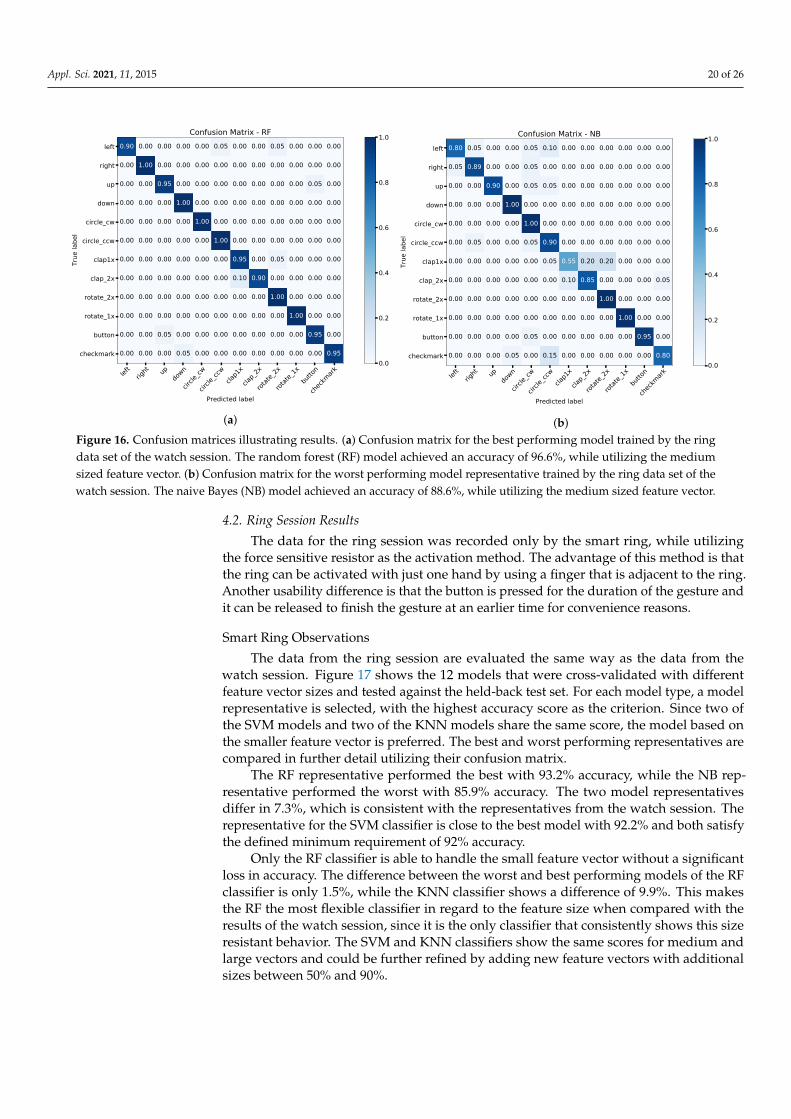
The confusion matrix in Figure 16a shows the individual classifications for the bestperforming model. Most of the gestures are perfectly classified, hence, the high accuracy ofthe model. The worst performing gestures are the Clap Twice and the Flick Left gestures witha true positive rate of 90%. The Clap Twice gesture is confused with the Clap Once gesturewith a false positive rate of 10% which is reconcilable due to the similarity between them.
Figure 16b shows the confusion matrix for the worst performing model representative.Similar to the RF model, the worst performing gesture for the NB model is the Clap Oncegesture with a true positive rate of 55%. It is frequently confused with the Clap Twice andthe Rotate Twice gesture. Due to the low overall accuracy, several gestures are misclassifiedwith true positive rates ranging from 80% to 95%. The distribution in the matrix suggeststhat the NB model has problems differentiating directional gestures from circle gestures.
Appl. Sci. 2021, 11, 2015 20 of 26
left
right up
down
circle
_cw
circle
_ccw
clap1
x
clap_2
x
rotate
_2x
rotate
_1xbu
tton
checkm
ark
Predicted label
left
right
up
down
circle_cw
circle_ccw
clap1x
clap_2x
rotate_2x
rotate_1x
button
checkmark
True
labe
l
0.90 0.00 0.00 0.00 0.00 0.05 0.00 0.00 0.05 0.00 0.00 0.00
0.00 1.00 0.00 0.00 0.00 0.00 0.00 0.00 0.00 0.00 0.00 0.00
0.00 0.00 0.95 0.00 0.00 0.00 0.00 0.00 0.00 0.00 0.05 0.00
0.00 0.00 0.00 1.00 0.00 0.00 0.00 0.00 0.00 0.00 0.00 0.00
0.00 0.00 0.00 0.00 1.00 0.00 0.00 0.00 0.00 0.00 0.00 0.00
0.00 0.00 0.00 0.00 0.00 1.00 0.00 0.00 0.00 0.00 0.00 0.00
0.00 0.00 0.00 0.00 0.00 0.00 0.95 0.00 0.05 0.00 0.00 0.00
0.00 0.00 0.00 0.00 0.00 0.00 0.10 0.90 0.00 0.00 0.00 0.00
0.00 0.00 0.00 0.00 0.00 0.00 0.00 0.00 1.00 0.00 0.00 0.00
0.00 0.00 0.00 0.00 0.00 0.00 0.00 0.00 0.00 1.00 0.00 0.00
0.00 0.00 0.05 0.00 0.00 0.00 0.00 0.00 0.00 0.00 0.95 0.00
0.00 0.00 0.00 0.05 0.00 0.00 0.00 0.00 0.00 0.00 0.00 0.95
Confusion Matrix - RF
0.0
0.2
0.4
0.6
0.8
1.0
(a)
left
right up
down
circle
_cw
circle
_ccw
clap1
x
clap_2
x
rotate
_2x
rotate
_1xbu
tton
checkm
ark
Predicted label
left
right
up
down
circle_cw
circle_ccw
clap1x
clap_2x
rotate_2x
rotate_1x
button
checkmark
True
labe
l
0.80 0.05 0.00 0.00 0.05 0.10 0.00 0.00 0.00 0.00 0.00 0.00
0.05 0.89 0.00 0.00 0.05 0.00 0.00 0.00 0.00 0.00 0.00 0.00
0.00 0.00 0.90 0.00 0.05 0.05 0.00 0.00 0.00 0.00 0.00 0.00
0.00 0.00 0.00 1.00 0.00 0.00 0.00 0.00 0.00 0.00 0.00 0.00
0.00 0.00 0.00 0.00 1.00 0.00 0.00 0.00 0.00 0.00 0.00 0.00
0.00 0.05 0.00 0.00 0.05 0.90 0.00 0.00 0.00 0.00 0.00 0.00
0.00 0.00 0.00 0.00 0.00 0.05 0.55 0.20 0.20 0.00 0.00 0.00
0.00 0.00 0.00 0.00 0.00 0.00 0.10 0.85 0.00 0.00 0.00 0.05
0.00 0.00 0.00 0.00 0.00 0.00 0.00 0.00 1.00 0.00 0.00 0.00
0.00 0.00 0.00 0.00 0.00 0.00 0.00 0.00 0.00 1.00 0.00 0.00
0.00 0.00 0.00 0.00 0.05 0.00 0.00 0.00 0.00 0.00 0.95 0.00
0.00 0.00 0.00 0.05 0.00 0.15 0.00 0.00 0.00 0.00 0.00 0.80
Confusion Matrix - NB
0.0
0.2
0.4
0.6
0.8
1.0
(b)Figure 16. Confusion matrices illustrating results. (a) Confusion matrix for the best performing model trained by the ringdata set of the watch session. The random forest (RF) model achieved an accuracy of 96.6%, while utilizing the mediumsized feature vector. (b) Confusion matrix for the worst performing model representative trained by the ring data set of thewatch session. The naive Bayes (NB) model achieved an accuracy of 88.6%, while utilizing the medium sized feature vector.
4.2. Ring Session Results
The data for the ring session was recorded only by the smart ring, while utilizingthe force sensitive resistor as the activation method. The advantage of this method is thatthe ring can be activated with just one hand by using a finger that is adjacent to the ring.Another usability difference is that the button is pressed for the duration of the gesture andit can be released to finish the gesture at an earlier time for convenience reasons.
Smart Ring Observations
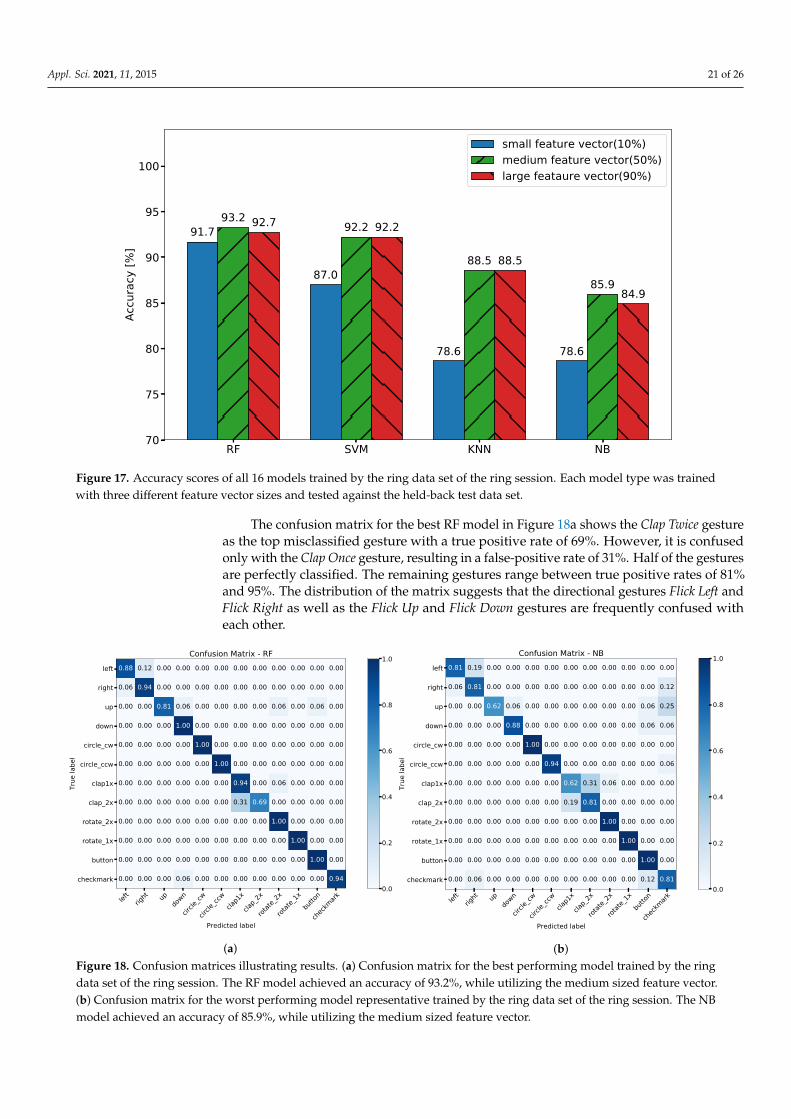
The data from the ring session are evaluated the same way as the data from thewatch session. Figure 17 shows the 12 models that were cross-validated with differentfeature vector sizes and tested against the held-back test set. For each model type, a modelrepresentative is selected, with the highest accuracy score as the criterion. Since two ofthe SVM models and two of the KNN models share the same score, the model based onthe smaller feature vector is preferred. The best and worst performing representatives arecompared in further detail utilizing their confusion matrix.
The RF representative performed the best with 93.2% accuracy, while the NB rep-resentative performed the worst with 85.9% accuracy. The two model representativesdiffer in 7.3%, which is consistent with the representatives from the watch session. Therepresentative for the SVM classifier is close to the best model with 92.2% and both satisfythe defined minimum requirement of 92% accuracy.
Only the RF classifier is able to handle the small feature vector without a significantloss in accuracy. The difference between the worst and best performing models of the RFclassifier is only 1.5%, while the KNN classifier shows a difference of 9.9%. This makesthe RF the most flexible classifier in regard to the feature size when compared with theresults of the watch session, since it is the only classifier that consistently shows this sizeresistant behavior. The SVM and KNN classifiers show the same scores for medium andlarge vectors and could be further refined by adding new feature vectors with additionalsizes between 50% and 90%.
Appl. Sci. 2021, 11, 2015 21 of 26
RF SVM KNN NB70
75
80
85
90
95
100
Accu
racy
[%]
91.7
87.0
78.6 78.6
93.292.2
88.5
85.9
92.7 92.2
88.5
84.9
small feature vector(10%)medium feature vector(50%)large feataure vector(90%)
Figure 17. Accuracy scores of all 16 models trained by the ring data set of the ring session. Each model type was trainedwith three different feature vector sizes and tested against the held-back test data set.
The confusion matrix for the best RF model in Figure 18a shows the Clap Twice gestureas the top misclassified gesture with a true positive rate of 69%. However, it is confusedonly with the Clap Once gesture, resulting in a false-positive rate of 31%. Half of the gesturesare perfectly classified. The remaining gestures range between true positive rates of 81%and 95%. The distribution of the matrix suggests that the directional gestures Flick Left andFlick Right as well as the Flick Up and Flick Down gestures are frequently confused witheach other.
left
right up
down
circle
_cw
circle
_ccw
clap1
x
clap_2
x
rotate
_2x
rotate
_1xbu
tton
checkm
ark
Predicted label
left
right
up
down
circle_cw
circle_ccw
clap1x
clap_2x
rotate_2x
rotate_1x
button
checkmark
True
labe
l
0.88 0.12 0.00 0.00 0.00 0.00 0.00 0.00 0.00 0.00 0.00 0.00
0.06 0.94 0.00 0.00 0.00 0.00 0.00 0.00 0.00 0.00 0.00 0.00
0.00 0.00 0.81 0.06 0.00 0.00 0.00 0.00 0.06 0.00 0.06 0.00
0.00 0.00 0.00 1.00 0.00 0.00 0.00 0.00 0.00 0.00 0.00 0.00
0.00 0.00 0.00 0.00 1.00 0.00 0.00 0.00 0.00 0.00 0.00 0.00
0.00 0.00 0.00 0.00 0.00 1.00 0.00 0.00 0.00 0.00 0.00 0.00
0.00 0.00 0.00 0.00 0.00 0.00 0.94 0.00 0.06 0.00 0.00 0.00
0.00 0.00 0.00 0.00 0.00 0.00 0.31 0.69 0.00 0.00 0.00 0.00
0.00 0.00 0.00 0.00 0.00 0.00 0.00 0.00 1.00 0.00 0.00 0.00
0.00 0.00 0.00 0.00 0.00 0.00 0.00 0.00 0.00 1.00 0.00 0.00
0.00 0.00 0.00 0.00 0.00 0.00 0.00 0.00 0.00 0.00 1.00 0.00
0.00 0.00 0.00 0.06 0.00 0.00 0.00 0.00 0.00 0.00 0.00 0.94
Confusion Matrix - RF
0.0
0.2
0.4
0.6
0.8
1.0
(a)
left
right up
down
circle
_cw
circle
_ccw
clap1
x
clap_2
x
rotate
_2x
rotate
_1xbu
tton
checkm
ark
Predicted label
left
right
up
down
circle_cw
circle_ccw
clap1x
clap_2x
rotate_2x
rotate_1x
button
checkmark
True
labe
l
0.81 0.19 0.00 0.00 0.00 0.00 0.00 0.00 0.00 0.00 0.00 0.00
0.06 0.81 0.00 0.00 0.00 0.00 0.00 0.00 0.00 0.00 0.00 0.12
0.00 0.00 0.62 0.06 0.00 0.00 0.00 0.00 0.00 0.00 0.06 0.25
0.00 0.00 0.00 0.88 0.00 0.00 0.00 0.00 0.00 0.00 0.06 0.06
0.00 0.00 0.00 0.00 1.00 0.00 0.00 0.00 0.00 0.00 0.00 0.00
0.00 0.00 0.00 0.00 0.00 0.94 0.00 0.00 0.00 0.00 0.00 0.06
0.00 0.00 0.00 0.00 0.00 0.00 0.62 0.31 0.06 0.00 0.00 0.00
0.00 0.00 0.00 0.00 0.00 0.00 0.19 0.81 0.00 0.00 0.00 0.00
0.00 0.00 0.00 0.00 0.00 0.00 0.00 0.00 1.00 0.00 0.00 0.00
0.00 0.00 0.00 0.00 0.00 0.00 0.00 0.00 0.00 1.00 0.00 0.00
0.00 0.00 0.00 0.00 0.00 0.00 0.00 0.00 0.00 0.00 1.00 0.00
0.00 0.06 0.00 0.00 0.00 0.00 0.00 0.00 0.00 0.00 0.12 0.81
Confusion Matrix - NB
0.0
0.2
0.4
0.6
0.8
1.0
(b)Figure 18. Confusion matrices illustrating results. (a) Confusion matrix for the best performing model trained by the ringdata set of the ring session. The RF model achieved an accuracy of 93.2%, while utilizing the medium sized feature vector.(b) Confusion matrix for the worst performing model representative trained by the ring data set of the ring session. The NBmodel achieved an accuracy of 85.9%, while utilizing the medium sized feature vector.

Appl. Sci. 2021, 11, 2015 22 of 26
Figure 18b shows the confusion matrix for the model representative of the NB classifier.More than half of all gestures do not reach a true positive rate higher than 88%, hence, thelow overall score. One of the worst performing gestures is the Clap Once gesture with atrue positive rate of 62%, which is mostly confused with the Clap Twice gesture. It sharesthe same true positive rate with the Flick Up gesture, which is mostly confused with theCheckmark gesture, which in turn is commonly confused with other directional gestures aswell. The Flick Left and Flick Right gestures are also confused with each other.
4.3. Evaluation
In this section, results are evaluated by comparing the observations from two differentdata sets. The activation mechanism–independent evaluation targets the data sets of thewatch session and the activation mechanism–dependent evaluation compares both ringdata sets originating from different sessions.
4.3.1. Activation Mechanism–Independent
Both data sets of the watch session achieve a relatively high accuracy with 98.8% forthe watch data set and 96.6% for the ring data set. Overall, the watch data set producesmodels with higher accuracies. This suggests that finger movements produce data withmore variance, which is reasonable, because finger movements are more flexible than handmovements. The finger can be moved relative to the wrist when performing a gesture,adding varying information to the data. Since the same gestures are used, the varyinginformation of the finger data is distributed inside the gesture class, ultimately leading tomore variance inside the class. Additionally, during the observation of the data acquisition,it was evident that the finger position changed slightly over time when participants focusedsolely on the display of the watch. This changes the reference frame of the gestures, whichadds even more variance to the data. On the contrary, the position of the watch neverchanged, because it was always corrected implicitly by pressing the button on the display.
Another explanation could be that the data originating from the Apple watch arepreprocessed internally, which is likely, because the separation of the gravity and thelinear acceleration vectors needed to be reversed in order to mirror the data of the ring.To separate the data in the first place, Apple’s algorithm needs to preprocess the data,which could affect the data set. However, since the data are preprocessed again by acoarse smoothing filter and most of the features are windowed, it is unlikely that Apple’spreprocessing algorithm has a significant impact on the quality of the data set.
When comparing the confusion matrices of the RF models for both data sets, the onlysimilarity is the confusion of the Clap Once and Clap Twice gestures. However, labeling errorscan be ruled out completely, because the gestures were recorded and labeled simultaneously.Generally, it is evident that the clap gestures are more difficult to distinguish across allmodels. The explanation for this observation could be that the time between the clapsis variable, however, this does not affect the rotation gestures, which are also based ona varying time interval. A more reasonable explanation emerges when examining thepreprocessed data manually. The moving average smoothing filter distorts the data becausethe claps create high frequency signals with high amplitudes, which the primitive filtercannot handle very well.
4.3.2. Activation Mechanism–Dependent
The data set of the watch session achieves an accuracy of 96.6%, while the ring sessionresults show a maximum accuracy of 93.2%. Generally, all models of the ring session areslightly weaker compared to the watch session results. This suggests that the activationmechanism introduces additional variance to the data set.
Since the participants were allowed to choose an ending point for the directionalgestures, some gestures of the same type might contain a different amount of information.The ring session results clearly show confusion between the directional gestures Flick Leftand Flick Right as well as for the gesture Flick Up. These gestures implicitly contain gestures
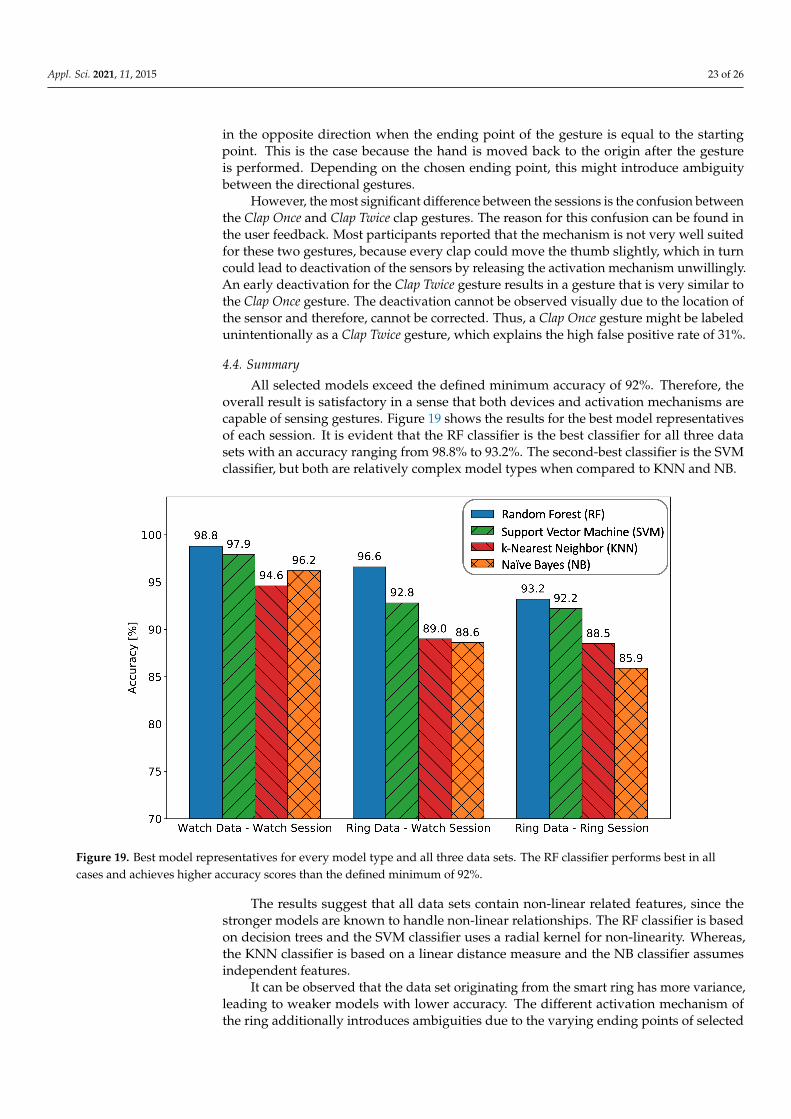
Appl. Sci. 2021, 11, 2015 23 of 26
in the opposite direction when the ending point of the gesture is equal to the startingpoint. This is the case because the hand is moved back to the origin after the gestureis performed. Depending on the chosen ending point, this might introduce ambiguitybetween the directional gestures.
However, the most significant difference between the sessions is the confusion betweenthe Clap Once and Clap Twice clap gestures. The reason for this confusion can be found inthe user feedback. Most participants reported that the mechanism is not very well suitedfor these two gestures, because every clap could move the thumb slightly, which in turncould lead to deactivation of the sensors by releasing the activation mechanism unwillingly.An early deactivation for the Clap Twice gesture results in a gesture that is very similar tothe Clap Once gesture. The deactivation cannot be observed visually due to the location ofthe sensor and therefore, cannot be corrected. Thus, a Clap Once gesture might be labeledunintentionally as a Clap Twice gesture, which explains the high false positive rate of 31%.
4.4. Summary
All selected models exceed the defined minimum accuracy of 92%. Therefore, theoverall result is satisfactory in a sense that both devices and activation mechanisms arecapable of sensing gestures. Figure 19 shows the results for the best model representativesof each session. It is evident that the RF classifier is the best classifier for all three datasets with an accuracy ranging from 98.8% to 93.2%. The second-best classifier is the SVMclassifier, but both are relatively complex model types when compared to KNN and NB.
Figure 19. Best model representatives for every model type and all three data sets. The RF classifier performs best in allcases and achieves higher accuracy scores than the defined minimum of 92%.
The results suggest that all data sets contain non-linear related features, since thestronger models are known to handle non-linear relationships. The RF classifier is basedon decision trees and the SVM classifier uses a radial kernel for non-linearity. Whereas,the KNN classifier is based on a linear distance measure and the NB classifier assumesindependent features.
It can be observed that the data set originating from the smart ring has more variance,leading to weaker models with lower accuracy. The different activation mechanism ofthe ring additionally introduces ambiguities due to the varying ending points of selected

Appl. Sci. 2021, 11, 2015 24 of 26
gestures, resulting in even lower results. A common problem across all data sets is the clapgestures, which are confused frequently with other gestures due to the applied primitivepreprocessing filter or an unintended deactivation of the sensors.
5. Summary and Outlook5.1. Conclusions
In this article, a real-time gesture recognition system based on wearable motion sensorswas built. The system is compatible with a custom-built smart ring as well as a smartwatch,both sending motion data to a smartphone, which is able to predict gestures with anaccuracy of up to 98.8%. The foundations for building such a system and the associatedchallenges were examined. Related research covering similar challenges was organizedand the relevant solutions were incorporated into the design of the system. Specifically, aminimum accuracy score of 92% was derived as a requirement for the machine learningprocess, various algorithms for processing the data were incorporated and the combinationof accelerometer and gyroscope was selected to capture hand movements. The resultsshow that the finger produces more information, which is consistent with the observationsof Card et al. [10]. The information influences the data set by introducing more varianceinside gesture classes, leading to machine models with lower accuracy. Additionally, theresults clearly show that the activation mechanism affects the accuracy of the models. Sincethe mechanism allows for more freedom with respect to the ending point of the gesture,some gestures contain highly variant information, which decreases the model accuracyfurther. Additionally, the mechanism is not suited well for clap gestures, because the thumbis moved unwillingly when performing claps. This leads to an early deactivation of thesensors and thus, the Clap Once and Clap Twice gestures are confused frequently.
The system considers 12 different gestures, which are performed with the hand.They were recorded beforehand with the support of 10 participants. Each participantrecorded three differently data sets during two sessions. Two data sets have been recordedsimultaneously, utilizing the sensors of the smart ring and the smartwatch, while sharingthe smartwatch display as an activation mechanism to start and stop the sensors. Thethird data set has been recorded solely with the smart ring while utilizing a force sensitiveresistor as an activation mechanism.
Multiple features describing the signal were derived from each data set and sortedby importance using the Mutual Information score. Three different sized feature vectorswere generated using this score and facilitated to train four different types of machinelearning models. After an exhaustive parameter search, the best model for each data setwas selected.
Nonetheless, every data set resulted in a model that exceeds the defined minimumscore of 92% accuracy. Therefore, the proposed system is able to compete with the resultsof related research.
5.2. Outlook
The paper shows that an energy efficient gesture recognition system can be built intomarket-ready wearable devices. The activation mechanism is necessary to achieve energyefficiency but does not affect the gesture recognition accuracy significantly. This inspires toimprove the system by optimizing the mechanism or by enhancing the data processingstages. The usability could be further improved by recording more data for rotationindependence and posture independence, so that users are able to perform gestures whenthey are lying on a couch or sitting at a desk. In addition, the smartwatch as a sensor devicecould be improved by automatically starting the sensors when the device is woken up. Thiswould eliminate the need to press the button, resulting in a fully one-handed experience.
The system could also be trained to recognize gestures performed with both hands,utilizing a second smart ring or a combination of smart rings and a smartwatch. This couldreplace controllers in virtual and augmented reality applications and lead to completelynew ways for ubiquitous computer interaction.

Appl. Sci. 2021, 11, 2015 25 of 26
Additionally, some supplementary research aspects are worth following in futurework: (i) examining whether a significant variation of inter- and intra-person gesturerecognition can be determined, and (ii) evaluation of the usability of the activation methodsused within this paper. Furthermore, the authors plan to release the gathered data setincluding gesture labels for the scientific community in the near future.
Author Contributions: Conceptualization, R.G., M.K.; software, R.G.; project administration, M.K.;supervision, M.K.; writing—original draft preparation, R.G.; writing—review and editing, M.K., E.S.All authors have read and agreed to the published version of the manuscript.
Funding: This research received no external funding.
Institutional Review Board Statement: Not applicable.
Informed Consent Statement: Not applicable.
Acknowledgments: This paper and all corresponding results, developments and achievements are aresult of the Research Group for Secure and Intelligent Mobile Systems (SIMS).
Conflicts of Interest: The authors declare no conflict of interest.
References1. Weiser, M. The computer for the 21st Century. IEEE Pervasive Comput. 2002, 1, 19–25. [CrossRef]2. Honan, M. Apple Unveils iPhone. Macworld, 9 January 2007.3. Kurz, M.; Hölzl, G.; Ferscha, A. Dynamic adaptation of opportunistic sensor configurations for continuous and accurate activity
recognition. In Proceedings of the The Fourth International Conference on Adaptive and Self-Adaptive Systems and Applications(ADAPTIVE2012), Nice, France, 22–27 July 2012.
4. Roggen, D.; Calatroni, A.; Rossi, M.; Holleczek, T.; Förster, K.; Tröster, G.; Lukowicz, P.; Bannach, D.; Pirkl, G.; Wagner, F.;et al. Walk-through the OPPORTUNITY dataset for activity recognition in sensor rich environments. In Proceedings of the 8thInternational Conference on Pervasive Computing (Pervasive 2010), Helsinki, Finland, 17–20 May 2010.
5. Roggen, D.; Calatroni, A.; Rossi, M.; Holleczek, T.; Förster, K.; Tröster, G.; Lukowicz, P.; Bannach, D.; Pirkl, G.; Ferscha, A.;et al. Collecting complex activity datasets in highly rich networked sensor environments. In Proceedings of the 2010 SeventhInternational Conference on Networked Sensing Systems (INSS), Kassel, Germany, 15–18 June 2010; pp. 233–240.
6. Rupprecht, F.A.; Ebert, A.; Schneider, A.; Hamann, B. Virtual Reality Meets Smartwatch: Intuitive, Natural, and Multi-ModalInteraction. In Proceedings of the 2017 CHI Conference Extended Abstracts on Human Factors in Computing Systems; ACM: New York,NY, USA, 2017; pp. 2884–2890. [CrossRef]
7. Bui, T.D.; Nguyen, L.T. Recognizing postures in vietnamese sign language with MEMS accelerometers. IEEE Sens. J. 2007,7, 707–712. [CrossRef]
8. Zhou, S.; Dong, Z.; Li, W.J.; Kwong, C.P. Hand-written character recognition using MEMS motion sensing technology. InIEEE/ASME International Conference on Advanced Intelligent Mechatronics; AIM: Hong Kong, China, 2008; pp. 1418–1423. [CrossRef]
9. Porzi, L.; Messelodi, S.; Modena, C.M.; Ricci, E. A smart watch-based gesture recognition system for assisting people with visualimpairments. In Proceedings of the 3rd ACM International Workshop on Interactive Multimedia on Mobile & Portable Devices; ACM:New York, NY, USA, 2013; pp. 19–24. [CrossRef]
10. Card, S.K.; Mackinlay, J.D.; Robertson, G.G. A morphological analysis of the design space of input devices. ACM Trans. Inf. Syst.2002, 9, 99–122. [CrossRef]
11. Roshandel, M.; Munjal, A.; Moghadam, P.; Tajik, S.; Ketabdar, H. Multi-sensor based gestures recognition with a smart finger ring.In Lecture Notes in Computer Science (Including Subseries Lecture Notes in Artificial Intelligence and Lecture Notes in Bioinformatics);Kurosu, M., Ed.; Springer International Publishing: Cham, Switzerland, 2014; Volume 8511, pp. 316–324. [CrossRef]
12. Xie, R.; Sun, X.; Xia, X.; Cao, J. Similarity matching-based extensible hand gesture recognition. IEEE Sens. J. 2015, 15, 3475–3483.[CrossRef]
13. Jing, L.; Zhou, Y.; Cheng, Z.; Wang, J. A recognition method for one-stroke finger gestures using a MEMS 3d accelerometer. IEICETrans. Inf. Syst. 2011, E94-D, 1062–1072. [CrossRef]
14. Zhu, C.; Sheng, W. Wearable sensor-based hand gesture and daily activity recognition for robot-assisted living. IEEE Trans. Syst.Man Cybernet. Part A Syst. Hum. 2011, 41, 569–573. [CrossRef]
15. Mace, D.; Gao, W.; Coskun, A. Accelerometer-based hand gesture recognition using feature weighted naïve bayesian classifiersand dynamic time warping. In Proceedings of the Companion Publication of the 2013 International Conference on Intelligent UserInterfaces Companion; ACM: New York, NY, USA, 2013; p. 83. [CrossRef]
16. Xu, C.; Pathak, P.H.; Mohapatra, P. Finger-writing with Smartwatch. In Proceedings of the 16th International Workshop on MobileComputing Systems and Applications—HotMobile ’15; ACM: New York, NY, USA, 2015; pp. 9–14.

Appl. Sci. 2021, 11, 2015 26 of 26
17. Wen, H.; Ramos Rojas, J.; Dey, A.K. Serendipity: Finger Gesture Recognition Using an Off-the-Shelf Smartwatch. In Proceedingsof the 2016 CHI Conference on Human Factors in Computing Systems, San Jose, CA, USA, 7–12 May 2016; pp. 3847–3851.[CrossRef]
18. Seneviratne, S.; Hu, Y.; Nguyen, T.; Lan, G.; Khalifa, S.; Thilakarathna, K.; Hassan, M.; Seneviratne, A. A survey of wearabledevices and challenges. IEEE Commun. Surv. Tutor. 2017, 19, 2573–2620. [CrossRef]
19. TinyCircuits. Product Page. Available online: https://tinycircuits.com (accessed on 24 February 2021).20. Kopetz, H. Real-Time Systems: Design Principles for Distributed Embedded Applications; Springer Science & Business Media:
Berlin/Heidelberg, Germany, 2011.21. Shin, K.G.; Ramanathan, P. Real-time computing: a new discipline of computer science and engineering. Proc. IEEE 1994, 82, 6–24.
[CrossRef]22. Gheran, B.F.; Vanderdonckt, J.; Vatavu, R.D. Gestures for Smart Rings: Empirical Results, Insights, and Design Implications. In
Proceedings of the 2018 Designing Interactive Systems Conference; ACM: New York, NY, USA, 2018; pp. 623–635. [CrossRef]23. Gheran, B.F.; Vatavu, R.D.; Vanderdonckt, J. Ring x2: Designing Gestures for Smart Rings Using Temporal Calculus. In Proceedings
of the 2018 ACM Conference Companion Publication on Designing Interactive Systems; ACM: New York, NY, USA, 2018; pp. 117–122.[CrossRef]
24. Kodratoff, Y. Introduction to Machine Learning; Elsevier: Amsterdam, The Netherlands, 2014.25. Kozachenko, L.F.; Leonenko, N.N. Sample estimate of the entropy of a random vector. Probl. Peredachi Inf. 1987, 23, 9–16.26. Kim, M.; Cho, J.; Lee, S.; Jung, Y. IMU sensor-based hand gesture recognition for human-machine interfaces. Sensors 2019,
19, 3827. [CrossRef] [PubMed]27. Liaw, A.; Wiener, M. Classification and Regression by randomForest. R News 2002, 2, 18–22. [CrossRef]28. Burges, C.J. A Tutorial on Support Vector Machines for Pattern Recognition. Data Min. Knowl. Discov. 1998, 167, 121–167.
[CrossRef]29. Cunningham, P.; Delany, S.J. k-Nearest Neighbour Classifiers. Mul. Classif. Syst. 2007, 34, 1–17. [CrossRef]30. Rish, I. An empirical study of the naive Bayes classifier. In Proceedings of the International Joint Conferences on Artificial
Intelligence 2001 Workshop on Empirical Methods in Artificial Intelligence, Seattle, WA, USA, 4–10 August 2001; Volume 3,pp. 41–46.