
HDAC3 impacts multiple oncogenic pathways in colon cancer cells with effects on Wnt and vitamin D...
22
HDAC3 impacts multiple oncogenic pathways in colon cancer cells with effects on Wnt and vitamin D signaling Cassandra A. Godman 1 , Rashmi Joshi 1 , Brendan R. Tierney 1 , Emily Greenspan 2 , Theodore P. Rasmussen 1,3,4 , Hsin-wei Wang 5 , Dong-Guk Shin 5 , Daniel W. Rosenberg 2 , and Charles Giardina 1,* 1Department of Molecular & Cell Biology, University of Connecticut, Storrs, Connecticut 2Center for Molecular Medicine, University of Connecticut Health Center, Farmington Connecticut 3Center for Regenerative Biology, University of Connecticut, Storrs, Connecticut 4Department of Animal Science, University of Connecticut, Storrs, Connecticut 5Department of Computer Science, University of Connecticut, Storrs, Connecticut Abstract Histone deacetylase 3 (HDAC3) is over-expressed in approximately half of all colon adenocarcinomas. We took an RNAi approach to determine how HDAC3 influenced chromatin modifications and the expression of growth regulatory genes in colon cancer cells. A survey of histone modifications revealed that HDAC3 knockdown in SW480 cells significantly increased histone H4- K12 acetylation, a modification present during chromatin assembly that has been implicated in imprinting. This modification was found to be most prominent in proliferating cells in the intestinal crypt and in APC Min tumors, but was less pronounced in the tumors that over-express HDAC3. Gene expression profiling of SW480 revealed that HDAC3 shRNA impacted the expression of genes in the Wnt and vitamin D signaling pathways. The impact of HDAC3 on Wnt signaling was complex, with both positive and negative effects observed. However, long-term knockdown of HDAC3 suppressed β-catenin translocation from the plasma membrane to the nucleus, and increased expression of Wnt inhibitors TLE1, TLE4 and SMO. HDAC3 knockdown also enhanced expression of the TLE1 and TLE4 repressors in HT-29 and HCT116 cells. HDAC3 shRNA enhanced expression of the vitamin D receptor in SW480 and HCT116 cells, and rendered SW480 cells sensitive to 1,25- dihydroxyvitamin D3. We propose that HDAC3 over-expression alters the epigenetic programming of colon cancer cells to impact intracellular Wnt signaling and their sensitivity to external growth regulation by vitamin D. Keywords HDAC3; Wnt signaling; β-catenin; VDR; TLE; c-MYC; colon cancer; butyrate; Acetyl histone H4K12; APC Min Introduction Carcinogenesis involves the mutation of key tumor suppressor genes and oncogenes, which impact cell proliferation, differentiation and death 1 . It is becoming increasingly clear that epigenetic changes also alter the gene expression patterns of cells to promote their carcinogenic * Corresponding author NIH Public Access Author Manuscript Cancer Biol Ther. Author manuscript; available in PMC 2009 January 7. Published in final edited form as: Cancer Biol Ther. 2008 October ; 7(10): 1570–1580. NIH-PA Author Manuscript NIH-PA Author Manuscript NIH-PA Author Manuscript
-
Upload
independent -
Category
Documents
-
view
2 -
download
0
Transcript of HDAC3 impacts multiple oncogenic pathways in colon cancer cells with effects on Wnt and vitamin D...

HDAC3 impacts multiple oncogenic pathways in colon cancercells with effects on Wnt and vitamin D signaling
Cassandra A. Godman1, Rashmi Joshi1, Brendan R. Tierney1, Emily Greenspan2, TheodoreP. Rasmussen1,3,4, Hsin-wei Wang5, Dong-Guk Shin5, Daniel W. Rosenberg2, and CharlesGiardina1,*
1Department of Molecular & Cell Biology, University of Connecticut, Storrs, Connecticut
2Center for Molecular Medicine, University of Connecticut Health Center, Farmington Connecticut
3Center for Regenerative Biology, University of Connecticut, Storrs, Connecticut
4Department of Animal Science, University of Connecticut, Storrs, Connecticut
5Department of Computer Science, University of Connecticut, Storrs, Connecticut
AbstractHistone deacetylase 3 (HDAC3) is over-expressed in approximately half of all colonadenocarcinomas. We took an RNAi approach to determine how HDAC3 influenced chromatinmodifications and the expression of growth regulatory genes in colon cancer cells. A survey of histonemodifications revealed that HDAC3 knockdown in SW480 cells significantly increased histone H4-K12 acetylation, a modification present during chromatin assembly that has been implicated inimprinting. This modification was found to be most prominent in proliferating cells in the intestinalcrypt and in APCMin tumors, but was less pronounced in the tumors that over-express HDAC3. Geneexpression profiling of SW480 revealed that HDAC3 shRNA impacted the expression of genes inthe Wnt and vitamin D signaling pathways. The impact of HDAC3 on Wnt signaling was complex,with both positive and negative effects observed. However, long-term knockdown of HDAC3suppressed β-catenin translocation from the plasma membrane to the nucleus, and increasedexpression of Wnt inhibitors TLE1, TLE4 and SMO. HDAC3 knockdown also enhanced expressionof the TLE1 and TLE4 repressors in HT-29 and HCT116 cells. HDAC3 shRNA enhanced expressionof the vitamin D receptor in SW480 and HCT116 cells, and rendered SW480 cells sensitive to 1,25-dihydroxyvitamin D3. We propose that HDAC3 over-expression alters the epigenetic programmingof colon cancer cells to impact intracellular Wnt signaling and their sensitivity to external growthregulation by vitamin D.
KeywordsHDAC3; Wnt signaling; β-catenin; VDR; TLE; c-MYC; colon cancer; butyrate; Acetyl histoneH4K12; APCMin
IntroductionCarcinogenesis involves the mutation of key tumor suppressor genes and oncogenes, whichimpact cell proliferation, differentiation and death 1. It is becoming increasingly clear thatepigenetic changes also alter the gene expression patterns of cells to promote their carcinogenic
*Corresponding author
NIH Public AccessAuthor ManuscriptCancer Biol Ther. Author manuscript; available in PMC 2009 January 7.
Published in final edited form as:Cancer Biol Ther. 2008 October ; 7(10): 1570–1580.
NIH
-PA Author Manuscript
NIH
-PA Author Manuscript
NIH
-PA Author Manuscript

potential 2-6. Epigenetic modifications are manifested by inheritable alterations in chromatinstructure that enforce the expression of specific genes in cell progeny. Present data indicatethat epigenetic alterations can occur early in the carcinogenic sequence 7-10; a number ofgrowth-regulatory genes have been found to be epigenetically silenced in colonic mucosa inolder individuals, and this silencing may contribute to the increased risk of carcinogenesisassociated with aging 11, 12. Understanding the protein complexes involved in regulating theepigenetic changes associated with aging and cancer could provide mechanistic insight intothe carcinogenic process and potentially identify new targets for cancer treatment andprevention.
Inheritable changes in chromatin structure are frequently directed by DNA methylation.Methylated cytosines in CpG dinucleotides serve to recruit histone deacetylases (HDACs) andother transcription-repressing proteins through a family of methyl-cytosine binding proteins13, 14. Epigenetic regulation may also occur in a manner that is independent of DNAmethylation. In this case, specific chromatin markings (including histone acetylation) facilitatethe inheritance of an “open” or “closed” chromatin structure 15. Oncogenic fusion proteinsfound in leukemia cells have been indentified that perform this function. Fusion of the AML1/RUNX protein with the transcriptional co-repressors TEL or ETO facilitates the recruitmentof HDAC-containing co-repressors to specific genetic loci in acute lymphoblastic leukemia16-19. Likewise, the fusion of RARα to the PML protein in acute myeloid leukemias suppressesthe expression of RAR target genes 20-22. In addition to the formation of fusion proteins, theover-expression of chromatin-silencing proteins is another means of subverting the epigeneticprogram of a cell. The SNAIL repressor protein, for example, is frequently over-expressed innumerous cancer types where it can silence a number of growth regulatory genes 23-25.Interestingly, the expression of cellular HDACs themselves can be increased during cellulartransformation 26. In colon cancer, evidence for increased expression of HDACs 1, 2 and 3has been reported 27-30. The mechanism that controls HDAC expression in colon cancers isnot entirely clear, but it may be linked to APC status and c-myc activation 29.
We have been studying the impact of HDAC3 on colon cancer cells. This HDAC is of particularinterest since it is one of the most frequently up-regulated genes in human cancers 31. We andothers have previously reported that reducing HDAC3 expression levels in colon cancer cellsslows their proliferation and alters the expression of cell cycle regulatory proteins, includingan increase in p21 expression 28, 30. In addition, we observed a change in the expression ofcellular differentiation markers, with a notable decrease in the expression of the secretoryproteins mucin 2 and intestinal trefoil factor 30. These findings suggested that reducingHDAC3 expression may generate a range of epigenetic changes that reprogram cell geneexpression in colon cancer cells. To determine the extent and nature of the reprogrammingevents directed by HDAC3 over-expression, gene expression profiling was performed on acolon cancer cell line that expresses high levels of HDAC3 before and after HDAC3knockdown with shRNA. Here we report that high HDAC3 expression alters the geneticprogramming of colon cancer cells, with both increases and decreases in gene expressionobserved. Interestingly, HDAC3 expression regulates genes in the Wnt, TGF-β, vitamin D andInterferon signaling pathways. A more detailed analysis indicates that HDAC3 expressionlevels can indeed impact the function of the Wnt and vitamin D signaling. These findingsindicate that HDAC3 over-expression may play a critical role in colon carcinogenesis byinfluencing both endogenous oncogenic pathways (such as Wnt/β-catenin signaling) and theresponsiveness of cells to exogenous growth-regulatory signals, such as 1,25-dihydroxyvitamin D3.
Godman et al. Page 2
Cancer Biol Ther. Author manuscript; available in PMC 2009 January 7.
NIH
-PA Author Manuscript
NIH
-PA Author Manuscript
NIH
-PA Author Manuscript

Materials and MethodsCell culture and treatments
The SW480 cancer cell line was originally obtained from the American Type CultureCollection (Manassas, VA). They were transfected with a vector expressing shRNA targetingHDAC3 or a non-targeting control vector, as previously described 30. Two clones with reducedHDAC3 expression were utilized for the present studies. All cells were maintained at 37°C,5% CO2 in McCoy's 5A media supplemented with 10% fetal bovine serum, 100 μm non-essential amino acids (Invitrogen) and antibiotic-antimycotic (Invitrogen). Butyrate (BA) waspurchased from Sigma-Aldrich (St. Louis, MO) and used at a final concentration of 4 mM.Butyrate treatments were performed overnight (16 to 18 hours) unless otherwise indicated.1,25 dihydroxyvitamin D3 was likewise obtained from Sigma-Aldrich, and used at theconcentrations indicated in the text. Vitamin D3 treatments were performed for 48 hours, afterwhich cells were trypsinized and counted by hemocytometer.
Cell cycle synchronization experiments were performed using the Lovastatin method, aspreviously described 32. Briefly, cells were grown in three 60 mm plates and treated with 60μM Lovastatin (Mevinolin) for approximately 33 hours. One plate was taken for cells in G1arrest, and the remaining two were passed at a 1:4 dilution into medium containing 5 mMmevalonic acid to release the G1 block. Protein was extracted from cells at various time pointsfollowing release, and entrance into S phase was determined by immunoblotting for PCNA.
siRNA transient transfectionTransient transfection was performed as previously described 30. Briefly, cells were grown toconfluency, trypsinized and resuspended in OptiMEM. Non-targeting control or HDAC3siRNA (Dharmacon, Lafayette, CO) was combined with Lipofectamine 2000 reagent inOptiMEM at a 100 nM final concentration. Seventy-two hours post-transfection RNA wasisolated and subjected to reverse-transcription and quantitative real-time PCR.
ImmunoblottingProteins were extracted from cells as previously described by Spurling et al. 30. Cytosolic andnuclear extracts were denatured under reducing conditions, separated on a 12.5% or 15% SDS-polyacrylamide gel and then transferred in Tris-glycine buffer to a nitrocellulose membraneby voltage gradient transfer overnight. The blots were then dried and blocked with 5% non-fatdry milk in PBS + 1% Tween-20 and probed with primary antibodies at 1:500 to 1:1000dilutions. Antibodies used in these studies were obtained from Santa Cruz Biotechnology:HDAC1 (H51), HDAC2 (H54), HDAC3 (H99), HDAC4 (H92), VDR (H81), β-catenin (C18),E-cadherin (G10) and actin (I19). HRP-conjugated secondary antibodies and enhancedchemiluminescence was used for detection as recommended by the manufacturer (Santa CruzBiotechnology). Nucleosomes were extracted from cells as previously described 33, andtransferred to 0.2 μm nitrocellulose in Tris-glycine buffer with 20% methanol and 0.1% SDS.Histone modifications were detected using modification-specific primary antibodies obtainedfrom Upstate, and the chemiluminescent detection method.
Indirect immunofluorescenceCells were treated as described in the text, and processed as previously described 34. Briefly,cells were washed with cold phosphate-buffered saline and fixed with 100% methanol for 30min at −20 °C. Donkey serum (10% in phosphate-buffered saline) was used to blocknonspecific binding for 30 min. After blocking, the cells were incubated with a goat anti-β-catenin antibody (H81, Santa Cruz Biotechnology) at a 1:75 dilution followed by incubation
Godman et al. Page 3
Cancer Biol Ther. Author manuscript; available in PMC 2009 January 7.
NIH
-PA Author Manuscript
NIH
-PA Author Manuscript
NIH
-PA Author Manuscript

with a Cy3-conjugated anti-goat immunoglobulin (Jackson ImmunoResearch Laboratories,Inc.). Images were captured on an Olympus epifluorescent microscope.
RNA isolation and microarray data analysisTotal RNA was prepared using the Trizol reagent (Invitrogen, Carlsbad, CA). A microarraywas run on a Sentrix ref-6 human beadchip (Illumina, San Diego, CA). The array was processedat the Molecular Genetics Core Facility at Children's Hospital Boston. Data were normalizedusing the “rank invariant” method in Illumina's BeadStudio software. This method normalizeswith respect to a common reference sample based on a linear scale. To reduce the size of thegene list, only annotated genes (18,267 genes) were selected for further analysis. Pathwayanalysis was performed using Ingenuity Pathways Analysis software (Ingenuity Systems,Redwood City, CA).
Reverse-transcription PCR and quantitative real-time PCRTo synthesize cDNA, 2 μg aliquots of RNA were diluted in water and combined according tomanufacturer's instructions with the High Capacity cDNA Reverse Transcription kit (AppliedBiosystems, Foster City, CA) reaction components. cDNA was stored at −20°C. Real-TimePCR was performed using an Applied Biosystem's 7500 Fast Real-Time PCR system andsoftware. Reactions were run for 40 cycles with the TaqMan 2x PCR Master Mix in 10 μlvolumes with cDNA corresponding to 2 μg RNA. TaqMan gene expression assays for TLE1,TLE4, c-MYC, VDR, and β-actin were purchased from Applied Biosystems (Foster City, CA).
ResultsHDAC3 inhibition and global histone acetylation
To determine the impact of HDAC3 expression levels on gene expression patterns in coloncancer cells, we selected the SW480 colon cancer cell line that expresses relatively high levelsof this HDAC 30. This cell line was then stably transfected with an shRNA expression vectorto target HDAC3, or a non-targeting control vector (as previously described) 30. To validatethe specific reduction in HDAC3, a western blot analysis was performed on both the control(shCNTL) and HDAC3 knockdown (shHD3) cell lines. Figure 1A shows the expression levelsof HDACs 1, 2, 3 and 4 in these cell lines. A large reduction in HDAC3 is observed, whereascomparable levels of HDACs 1, 2, and 4 are present in both cell lines. The mRNA levels ofother class I and class II HDACs were also determined (by microarray analysis), and werelikewise found to be unaffected (although an increase in an HDAC7 transcript variant wasobserved). These findings indicate the shRNA is specific for HDAC3, and that compensatoryincreases in the expression of other HDACs are minimal.
HDACs have been reported to have a degree of enzymatic specificity for specific histone acetyl-lysine residues 35-38, and a previous report has described preferred substrates for HDAC3complexes39. We determined the impact of HDAC3 knockdown on several different histonemodifications by performing a western blot analysis (see figure in Ref. 30) and optical densityscanning on nucleosomes extracted from SW480 cells expressing control or HDAC3 targetingshRNA (shCNTL and shHD3 cells, respectively; Figure 1B). HDAC3 inhibition resulted inspecific alterations in acetylation, with the largest increase occurring on histone H4,particularly the H4-K12Ac modification. Analysis of additional samples indicates that this 2-fold increase is significant (p < 0.01).
To determine whether acetylation of histone H4 at lysine 12 is regulated in the intestine, weexamined normal and cancerous intestinal tissue in APCMin mice for this modification. Tumorsformed in APCMin mice are useful for this analysis since they express elevated levels of HDAC3(Figure 2A)28. In the normal small intestine, positive staining for histone H4-K12 acetylation
Godman et al. Page 4
Cancer Biol Ther. Author manuscript; available in PMC 2009 January 7.
NIH
-PA Author Manuscript
NIH
-PA Author Manuscript
NIH
-PA Author Manuscript
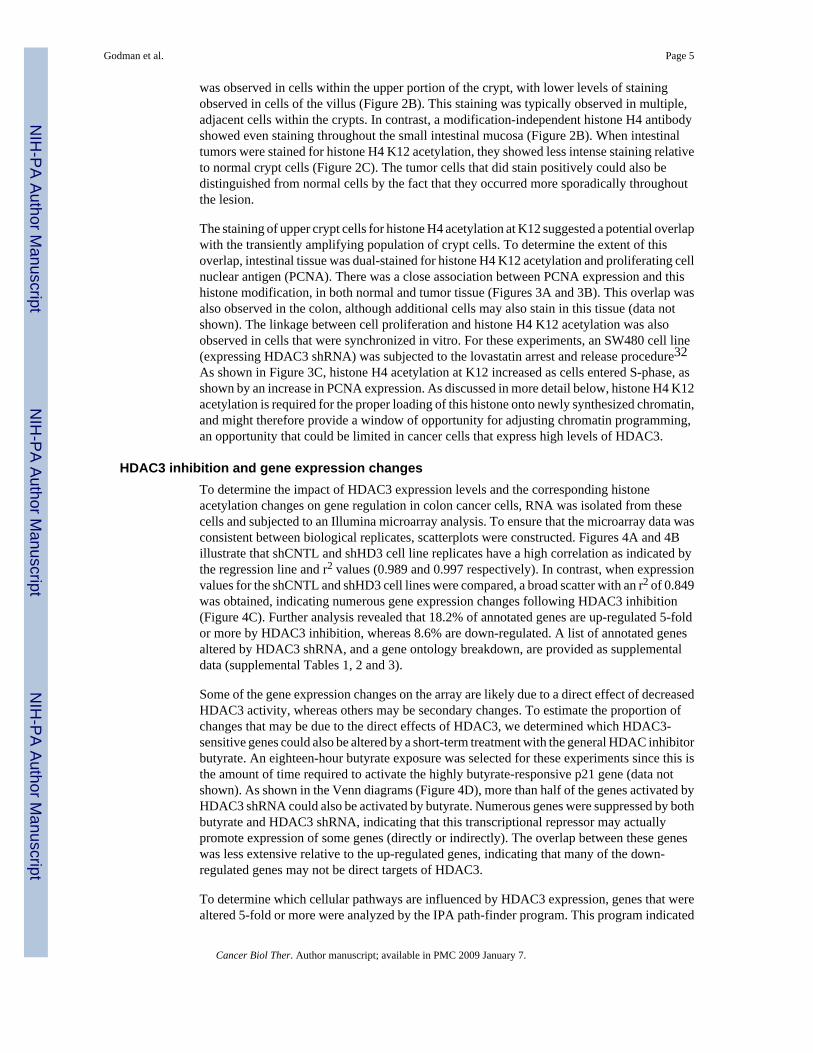
was observed in cells within the upper portion of the crypt, with lower levels of stainingobserved in cells of the villus (Figure 2B). This staining was typically observed in multiple,adjacent cells within the crypts. In contrast, a modification-independent histone H4 antibodyshowed even staining throughout the small intestinal mucosa (Figure 2B). When intestinaltumors were stained for histone H4 K12 acetylation, they showed less intense staining relativeto normal crypt cells (Figure 2C). The tumor cells that did stain positively could also bedistinguished from normal cells by the fact that they occurred more sporadically throughoutthe lesion.
The staining of upper crypt cells for histone H4 acetylation at K12 suggested a potential overlapwith the transiently amplifying population of crypt cells. To determine the extent of thisoverlap, intestinal tissue was dual-stained for histone H4 K12 acetylation and proliferating cellnuclear antigen (PCNA). There was a close association between PCNA expression and thishistone modification, in both normal and tumor tissue (Figures 3A and 3B). This overlap wasalso observed in the colon, although additional cells may also stain in this tissue (data notshown). The linkage between cell proliferation and histone H4 K12 acetylation was alsoobserved in cells that were synchronized in vitro. For these experiments, an SW480 cell line(expressing HDAC3 shRNA) was subjected to the lovastatin arrest and release procedure32As shown in Figure 3C, histone H4 acetylation at K12 increased as cells entered S-phase, asshown by an increase in PCNA expression. As discussed in more detail below, histone H4 K12acetylation is required for the proper loading of this histone onto newly synthesized chromatin,and might therefore provide a window of opportunity for adjusting chromatin programming,an opportunity that could be limited in cancer cells that express high levels of HDAC3.
HDAC3 inhibition and gene expression changesTo determine the impact of HDAC3 expression levels and the corresponding histoneacetylation changes on gene regulation in colon cancer cells, RNA was isolated from thesecells and subjected to an Illumina microarray analysis. To ensure that the microarray data wasconsistent between biological replicates, scatterplots were constructed. Figures 4A and 4Billustrate that shCNTL and shHD3 cell line replicates have a high correlation as indicated bythe regression line and r2 values (0.989 and 0.997 respectively). In contrast, when expressionvalues for the shCNTL and shHD3 cell lines were compared, a broad scatter with an r2 of 0.849was obtained, indicating numerous gene expression changes following HDAC3 inhibition(Figure 4C). Further analysis revealed that 18.2% of annotated genes are up-regulated 5-foldor more by HDAC3 inhibition, whereas 8.6% are down-regulated. A list of annotated genesaltered by HDAC3 shRNA, and a gene ontology breakdown, are provided as supplementaldata (supplemental Tables 1, 2 and 3).
Some of the gene expression changes on the array are likely due to a direct effect of decreasedHDAC3 activity, whereas others may be secondary changes. To estimate the proportion ofchanges that may be due to the direct effects of HDAC3, we determined which HDAC3-sensitive genes could also be altered by a short-term treatment with the general HDAC inhibitorbutyrate. An eighteen-hour butyrate exposure was selected for these experiments since this isthe amount of time required to activate the highly butyrate-responsive p21 gene (data notshown). As shown in the Venn diagrams (Figure 4D), more than half of the genes activated byHDAC3 shRNA could also be activated by butyrate. Numerous genes were suppressed by bothbutyrate and HDAC3 shRNA, indicating that this transcriptional repressor may actuallypromote expression of some genes (directly or indirectly). The overlap between these geneswas less extensive relative to the up-regulated genes, indicating that many of the down-regulated genes may not be direct targets of HDAC3.
To determine which cellular pathways are influenced by HDAC3 expression, genes that werealtered 5-fold or more were analyzed by the IPA path-finder program. This program indicated
Godman et al. Page 5
Cancer Biol Ther. Author manuscript; available in PMC 2009 January 7.
NIH
-PA Author Manuscript
NIH
-PA Author Manuscript
NIH
-PA Author Manuscript

potential effects on the TGF-β, Interferon and Wnt signaling pathways (Table 1). Semi-quantitative RT-PCR confirmed large changes in a subset of the genes shown in the table (datanot shown). The effect of HDAC3 shRNA on the interferon and TGF-β signaling pathwayswas generally positive, with increased expression of both IFN and TGF-β target genesobserved. In the case of the TGF-β pathway, this included an up-regulation of the vitamin-Dreceptor (VDR) and the VDR-target gene TGF-β2 40, 41. The influence on the Wnt pathwaywas complex, with both positive and negative effects observed.
Of the pathways identified, we decided to examine the HDAC3 shRNA-induced changes inWnt and VDR signaling in more detail, since these pathways are critical for regulating theendogenous growth potential of colon cancer cells, and their responsiveness to exogenousvitamin D.
HDAC3 regulation of the Wnt pathwayThe profile of genes in the Wnt pathway regulated by HDAC3 can both enhance and suppressWnt signaling. For example, the FZD17 receptor is up-regulated whereas expression of theFZD10 receptor is reduced. Overall, however, the majority of changes are predicted to suppressWnt signaling (as indicated in Table 1). One critical outcome of the Wnt pathway is thetranslocation of β-catenin from the cell membrane to the nucleus. We thus chose to analyzehow HDAC3 suppression affected this step of the Wnt pathway. As shown in Figure 5A, theproportion of β-catenin in the nuclear fraction is lower in two clones expressing the HDAC3shRNA than control cells. An indirect immuno-fluorescent analysis of β-catenin showed thatcells expressing HDAC3 shRNA had more extensive plasma membrane localization relativeto control cells (Figure 5B). Membrane association of β-catenin could also be stimulated bybutyrate treatment of control cells, supporting a role for HDACs in regulating this localization(Figure 5B). These findings indicate that HDAC3 shRNA generally increases β-cateninmobility away from the nucleus and towards the plasma membrane of colon cancer cells.
The expression of three genes in the Wnt signaling pathway was also examined by quantitativeRT-PCR. Specifically, we quantified the expression of two inhibitors of the Wnt pathway,TLE1 and TLE4, which compete for β-catenin binding to TCF complexes in the nucleus. Inaddition, the expression level of the β-catenin target gene, c-MYC, was determined. As shownin Figure 6A, HDAC3 shRNA expression increases expression of both of the TLE genes, anddecreases expression of c-MYC. These results are consistent with those found on themicroarray. To determine the generality of this response, three colon cancer cell lines weretransiently transfected with HDAC3 siRNA. In SW480, HCT116 and HT-29 cells, transfectionwith HDAC3 siRNA either increased the expression of a TLE, or potentiated the activation bybutyrate treatment (Figure 6B, C and D; TLE4 was not expressed in HCT116 cells).Interestingly, although c-MYC expression was suppressed by butyrate, the HDAC3 siRNAenhanced its expression in each cell line (Figure 6B, C and D). This latter finding suggests acomplex interaction between HDAC3 expression and Wnt signaling, as observed on the genearray. As discussed below, the impact of HDAC3 expression on Wnt signaling is thereforelikely to depend on the relative expression of positive and negative Wnt effectors in individualcancers.
HDAC3 expression and vitamin D responsivenessOne gene of interest within the TGF-β pathway was the vitamin D receptor (VDR). Thisreceptor is important for mediating cellular differentiation and growth control by vitamin Dmetabolites, and may therefore play an important role in cancer prevention by vitamin D. Asshown in Figure 7A, VDR mRNA levels were increased in SW480 cells either upon treatmentwith butyrate or following HDAC3 suppression with shRNA. HDAC3 inhibition bytransfection of HCT116 cells with siRNA likewise stimulated VDR expression (Figure 7B).
Godman et al. Page 6
Cancer Biol Ther. Author manuscript; available in PMC 2009 January 7.
NIH
-PA Author Manuscript
NIH
-PA Author Manuscript
NIH
-PA Author Manuscript

The increase in mRNA expression induced by HDAC3 shRNA was accompanied by anincrease in VDR protein expression (Figure 7C). We also determined the impact of HDAC3shRNA on the gene activation and growth control by the active vitamin D metabolite 1,25-dihydroxyvitamin D3. Cells expressing HDAC3 shRNA were able to activate E-cadherinfollowing vitamin D3 treatment, and were more sensitive to growth inhibition by vitamin D3(Figure 7D and 8). These findings indicate that HDAC3 can play an important role in mediatingthe sensitivity of cells to growth regulation by vitamin D.
DiscussionThe frequent over-expression of HDAC3 in human cancers suggests that this enzyme plays animportant role in carcinogenesis. We took a gene array approach to further explore the potentialrole of HDAC3 in colon carcinogenesis. We found that the elevated expression of HDAC3impacts three signaling pathways that are intimately involved in colon carcinogenesis: Wnt,TGF-β and Interferon. Our findings support a model in which HDAC3 expression plays apivotal role in the epigenetic reprogramming of cancer cells to significantly enhance theirgrowth potential and carcinogenicity. It is surprising that over-expression of a single HDACimpacts multiple cancer-related pathways, since there are other HDACs expressed in cancercells. Interestingly, HDAC3 is also expressed at high levels in primordial gut tissues, raisingthe possibility that its expression in colon cancers serves to de-differentiate cells 42. In general,our findings indicate that increased HDAC3 expression may target this transcriptionalregulatory protein to additional promoters and substrate proteins to alter the cell's phenotype.These findings suggest that HDAC3 may be a good target for highly-specific agents that treator prevent colon cancer.
The Wnt signaling pathway is targeted for mutation in the majority of colorectal cancers 43,44. The most frequent alteration is a truncating mutation in the APC gene, a negative regulatorof the Wnt pathway 45. The truncated APC protein is no longer able to direct the degradationof cytosolic β-catenin, allowing β-catenin levels to increase and eventually enter the nucleusto activate transcription by associating with TCF proteins bound to target gene promoters 43.We found that HDAC3 had a complex effect on components of the Wnt pathway. However,the majority of gene expression changes induced by a stable shRNA knockdown indicated thatHDAC3 expression generally enhances the Wnt pathway. The enhancement of Wnt signalingby HDAC3 was further supported by the finding that the stable HDAC3 knockdown enhancedthe plasma membrane localization of β-catenin and reduced its nuclear accumulation. It shouldbe noted that this alteration in nuclear β-catenin localization occurred even though the cellsanalyzed are APC mutants. The changes in β-catenin cellular localization may result from anumber of gene expression changes induced by HDAC3 shRNA. For example, the HDAC3shRNA reduced the expression of the TCF1 transcription factor in the colon cancer cells. SinceTCF1 binds β-catenin in the nucleus 46 reducing its expression may eliminate an importantnuclear “anchor” for β-catenin. A similar mechanism may also come into play with regard tothe HDAC3 shRNA-induced increase in TLE1 and TLE4 expression. TLEs compete with β-catenin for TCF binding47, so increased TLE1 and TLE4 expression may also reduce thenuclear binding sites for β-catenin. In addition to these potential nuclear anchor effects,activation of the competitive hedgehog pathway may also contribute to β-catenin inhibition;HDAC3 shRNA increased SMO expression, which has been shown to inhibit TCF4-β-catenincomplex formation by the hedgehog pathway 48.
Although the stable reduction in HDAC3 expression by shRNA increased expression of theTCF co-repressors TLE1 and TLE4, and decreased expression of the Wnt target gene c-MYC,the influence of a transient decrease in HDAC3 expression by siRNA was more complex.Although HDAC3 siRNA increased TLE expression (either alone or in combination withbutyrate), an increase in c-MYC expression was also observed. It has been reported that the
Godman et al. Page 7
Cancer Biol Ther. Author manuscript; available in PMC 2009 January 7.
NIH
-PA Author Manuscript
NIH
-PA Author Manuscript
NIH
-PA Author Manuscript
HDAC inhibition by butyrate can activate the Wnt pathway, and that hyper-activation of thispathway can lead to cell death49, 50. We propose that HDAC3 inhibition has a similar effecton Wnt signaling. In the short term, HDAC3 shRNA may promote Wnt signaling. However,only cells with a robust negative feedback response, resulting for example from a strong TLEactivation, survive51. This model predicts that the expression of HDAC3 in colon cancers maydepend on their ability to modulate Wnt signaling through the altered expression of Wntinhibitory proteins.
Other pathways found to be affected by HDAC3 include the interferon-regulated genes andgenes in the TGF-β signaling pathway. Although the interferon response may be initiated non-specifically through double stranded siRNA molecules, it is unlikely that this is why we seeactivation of these genes: we do not observe increases in interferon expression or apoptosis incells expressing HDAC3 shRNA30 (and data not shown). In addition, most of the classicaldsRNA response genes are not activated in cells expressing HDAC3 shRNA52, 53. Interferon(IFN) signaling can influence carcinogenesis through a number of mechanisms 54, 55,including a direct influence on cell proliferation 56 and by enhancing the immunogenicity ofcancer cells 57. We found genes in both of these categories activated by HDAC3 shRNA. Themechanism by which HDAC3 inhibition activates expression of these IFN-regulated genes isnot presently clear, but it is unlikely to occur through the STAT1 transcription factor, sinceactivation of this transcription factor is inhibited by HDAC inhibitors58. With regard to TGF-β signaling, activation of this pathway may result in part from increased TGFβ2 expression.TGFβ2 is one of several members of a superfamily of cytokines that play a critical role incontrolling cellular growth, differentiation and development 59. In early colon tumorigenesis,TGFβ signaling is thought to block tumor development by inducing cell cycle arrest andapoptosis and cancer cells may become resistant to TGFβ by carrying a mutation of the typeII receptor (TGFβ-RII)60, or through SMAD4 mutation 60, 61. However, TGFβ signaling isa double-edged sword as it can also promote cancer growth and metastasis 62. In fact, a numberof genes in the TGFβ pathway enhanced by HDAC3 shRNA are associated with tumorprogression (AXL, EGFR, and SERPINE1).
One interesting gene in the TGFβ pathway that was activated by HDAC3 shRNA was the VDRgene. HDAC3 knockdown not only restored VDR expression, but also restored theresponsiveness of the cells to growth inhibition by 1,25-dihydroxyvitamin D3. HDAC3expression has also been found to regulate the cellular response to another dietary factor;previous work indicated that growth regulation by butyrate (derived from dietary fiber) is alsosensitive to HDAC3 expression levels 30. Since butyrate has been reported to increase VDRexpression 63, a picture emerges of a web of interactions between HDAC3 expression andmultiple dietary agents. Understanding these interactions could ultimately enhance ourunderstanding of how dietary agents interact with each other and specific cellular genotypesto prevent cancer development.
The changes in gene expression induced by HDAC3 knockdown are likely to be mediated inpart by the changes in histone acetylation. Acetylation of histone H4 at lysine 12 (H4K12Ac)appears to be particularly sensitive to HDAC3 expression. Although purified HDAC3 candeacetylate both histone H3 and histone H4 64-66, HDAC3 complexes isolated from cellsdisplay a higher degree of specificity 38. HDAC3 complexes have been found to completelydeacetylate H2A, H4K5 and H4K12, while only partially deacetylating other residues 39.Acetylated histone H4K12 may therefore be a preferred substrate for HDAC3 complexes 39.Although the “histone code” involves multiple modifications functioning in concert, histoneH4K12 acetylation may play a particularly important role in regulating chromatin structure.Evidence has been obtained that acetylation of histone H4K12 plays a critical role inpropagating chromatin structure following DNA replication. For example, the ability of yeastto maintain newly synthesized chromatin in an “open” state is dramatically reduced when
Godman et al. Page 8
Cancer Biol Ther. Author manuscript; available in PMC 2009 January 7.
NIH
-PA Author Manuscript
NIH
-PA Author Manuscript
NIH
-PA Author Manuscript

histone H4 is mutated to suppress K12 acetylation 67. It should also be noted that newchromatin assembled following DNA replication utilizes histone H4 acetylated at lysine 12.Our finding that histone H4K12 acetylation is highest in proliferating cells is consistent withthe usage of H4K12Ac in new chromatin assembly. We propose that the loading of acetylatedhistone H4K12 on the DNA following replication provides a window of opportunity to openthe chromatin on repressed genes, with the ultimate chromatin status determined by thepresence of specific trans-acting factors. This window of open chromatin may be significantlylimited in tumor cells that over-express HDAC3. In APCMin mice, we find that histone H4K12acetylation is generally lower in tumors relative to normal mucosa. Additional experimentationwill be required to determine whether this modification relates to different patterns of geneexpression within the tumor, and whether the frequency of this modification relates to thedifferentiation and invasiveness of the cancers.
Supplementary MaterialRefer to Web version on PubMed Central for supplementary material.
AcknowledgementsThis work was supported in part by NIH grant R01 CA81428 and by the University of Connecticut ResearchFoundation. We extend our gratitude to Advanced Turbine Services for the donation of equipment used in these studies.
AbbreviationsHDAC, Histone deacetylase; VDR, vitamin D receptor; TGFβ, transforming growth factorbeta; IFN, interferon; siRNA, short interfering RNA; SDS, sodium dodecyl sulfate; shRNA,short hairpin RNA; DAPI, 4′,6-diamidino-2-phenylindole.
References1. Spandidos DA. Oncogenes and tumor suppressor genes as paradigms in oncogenesis. J Buon 2007;12
(Suppl 1):S9–12. [PubMed: 17935284]2. Clark SJ. Action at a distance: epigenetic silencing of large chromosomal regions in carcinogenesis.
Hum Mol Genet 2007;16(Spec No 1):R88–95. [PubMed: 17613553]3. Herranz M, Esteller M. DNA methylation and histone modifications in patients with cancer: potential
prognostic and therapeutic targets. Methods Mol Biol 2007;361:25–62. [PubMed: 17172706]4. Kondo Y, Issa JP. Epigenetic changes in colorectal cancer. Cancer Metastasis Rev 2004;23:29–39.
[PubMed: 15000147]5. Stebbing J, Bower M, Syed N, Smith P, Yu V, Crook T. Epigenetics: an emerging technology in the
diagnosis and treatment of cancer. Pharmacogenomics 2006;7:747–57. [PubMed: 16886899]6. Ting AH, McGarvey KM, Baylin SB. The cancer epigenome--components and functional correlates.
Genes Dev 2006;20:3215–31. [PubMed: 17158741]7. Baylin SB, Ohm JE. Epigenetic gene silencing in cancer - a mechanism for early oncogenic pathway
addiction? Nat Rev Cancer 2006;6:107–16. [PubMed: 16491070]8. Herman JG. Epigenetic changes in cancer and preneoplasia. Cold Spring Harb Symp Quant Biol
2005;70:329–33. [PubMed: 16869769]9. Balch C, Nephew KP, Huang TH, Bapat SA. Epigenetic “bivalently marked” process of cancer stem
cell-driven tumorigenesis. Bioessays 2007;29:842–5. [PubMed: 17688287]10. Hake SB, Xiao A, Allis CD. Linking the epigenetic ‘language’ of covalent histone modifications to
cancer. Br J Cancer 2004;90:761–9. [PubMed: 14970850]11. Ahuja N, Li Q, Mohan AL, Baylin SB, Issa JP. Aging and DNA methylation in colorectal mucosa
and cancer. Cancer Res 1998;58:5489–94. [PubMed: 9850084]12. Ahuja N, Issa JP. Aging, methylation and cancer. Histol Histopathol 2000;15:835–42. [PubMed:
10963127]
Godman et al. Page 9
Cancer Biol Ther. Author manuscript; available in PMC 2009 January 7.
NIH
-PA Author Manuscript
NIH
-PA Author Manuscript
NIH
-PA Author Manuscript

13. Rountree MR, Bachman KE, Herman JG, Baylin SB. DNA methylation, chromatin inheritance, andcancer. Oncogene 2001;20:3156–65. [PubMed: 11420732]
14. Ballestar E, Esteller M. Methyl-CpG-binding proteins in cancer: blaming the DNA methylationmessenger. Biochem Cell Biol 2005;83:374–84. [PubMed: 15959563]
15. Berger SL. The complex language of chromatin regulation during transcription. Nature2007;447:407–12. [PubMed: 17522673]
16. Karagianni P, Wong J. HDAC3: taking the SMRT-N-CoRrect road to repression. Oncogene2007;26:5439–49. [PubMed: 17694085]
17. Chakrabarti SR, Nucifora G. The leukemia-associated gene TEL encodes a transcription repressorwhich associates with SMRT and mSin3A. Biochem Biophys Res Commun 1999;264:871–7.[PubMed: 10544023]
18. Fenrick R, Amann JM, Lutterbach B, Wang L, Westendorf JJ, Downing JR, Hiebert SW. Both TELand AML-1 contribute repression domains to the t(12;21) fusion protein. Mol Cell Biol1999;19:6566–74. [PubMed: 10490596]
19. Guidez F, Petrie K, Ford AM, Lu H, Bennett CA, MacGregor A, Hannemann J, Ito Y, Ghysdael J,Greaves M, Wiedemann LM, Zelent A. Recruitment of the nuclear receptor corepressor N-CoR bythe TEL moiety of the childhood leukemia-associated TEL-AML1 oncoprotein. Blood2000;96:2557–61. [PubMed: 11001911]
20. Park DJ, Vuong PT, de Vos S, Douer D, Koeffler HP. Comparative analysis of genes regulated byPML/RAR alpha and PLZF/RAR alpha in response to retinoic acid using oligonucleotide arrays.Blood 2003;102:3727–36. [PubMed: 12893766]
21. Atsumi A, Tomita A, Kiyoi H, Naoe T. Histone deacetylase 3 (HDAC3) is recruited to targetpromoters by PML-RARalpha as a component of the N-CoR co-repressor complex to represstranscription in vivo. Biochem Biophys Res Commun 2006;345:1471–80. [PubMed: 16730330]
22. Villa R, Morey L, Raker VA, Buschbeck M, Gutierrez A, De Santis F, Corsaro M, Varas F, Bossi D,Minucci S, Pelicci PG, Di Croce L. The methyl-CpG binding protein MBD1 is required for PML-RARalpha function. Proc Natl Acad Sci U S A 2006;103:1400–5. [PubMed: 16432238]
23. Olmeda D, Jorda M, Peinado H, Fabra A, Cano A. Snail silencing effectively suppresses tumourgrowth and invasiveness. Oncogene 2007;26:1862–74. [PubMed: 17043660]
24. Blechschmidt K, Sassen S, Schmalfeldt B, Schuster T, Hofler H, Becker KF. The E-cadherin repressorSnail is associated with lower overall survival of ovarian cancer patients. Br J Cancer 2007;16:222–8.
25. Larriba MJ, Munoz A. SNAIL vs vitamin D receptor expression in colon cancer: therapeuticsimplications. Br J Cancer 2005;92:985–9. [PubMed: 15770204]
26. Patra SK, Patra A, Dahiya R. Histone deacetylase and DNA methyltransferase in human prostatecancer. Biochem Biophys Res Commun 2001;287:705–13. [PubMed: 11563853]
27. Huang BH, Laban M, Leung CH, Lee L, Lee CK, Salto-Tellez M, Raju GC, Hooi SC. Inhibition ofhistone deacetylase 2 increases apoptosis and p21Cip1/WAF1 expression, independent of histonedeacetylase 1. Cell Death Differ 2005;12:395–404. [PubMed: 15665816]
28. Wilson AJ, Byun DS, Popova N, Murray LB, L'Italien K, Sowa Y, Arango D, Velcich A, AugenlichtLH, Mariadason JM. Histone deacetylase 3 (HDAC3) and other class I HDACs regulate colon cellmaturation and p21 expression and are deregulated in human colon cancer. J Biol Chem2006;281:13548–58. [PubMed: 16533812]
29. Zhu P, Martin E, Mengwasser J, Schlag P, Janssen KP, Gottlicher M. Induction of HDAC2 expressionupon loss of APC in colorectal tumorigenesis. Cancer Cell 2004;5:455–63. [PubMed: 15144953]
30. Spurling CC, Godman CA, Noonan EJ, Rasmussen TP, Rosenberg DW, Giardina C. HDAC3overexpression and colon cancer cell proliferation and differentiation. Mol Carcinog 2007;47:137–47. [PubMed: 17849419]
31. Pilarsky C, Wenzig M, Specht T, Saeger HD, Grutzmann R. Identification and validation of commonlyoverexpressed genes in solid tumors by comparison of microarray data. Neoplasia 2004;6:744–50.[PubMed: 15720800]
32. Keyomarsi K, Sandoval L, Band V, Pardee AB. Synchronization of tumor and normal cells from G1to multiple cell cycles by lovastatin. Cancer Res 1991;51:3602–9. [PubMed: 1711413]
Godman et al. Page 10
Cancer Biol Ther. Author manuscript; available in PMC 2009 January 7.
NIH
-PA Author Manuscript
NIH
-PA Author Manuscript
NIH
-PA Author Manuscript

33. Dai B, Rasmussen TP. Global epiproteomic signatures distinguish embryonic stem cells fromdifferentiated cells. Stem Cells 2007;25:2567–74. [PubMed: 17641388]
34. Yin L, Laevsky G, Giardina C. Butyrate suppression of colonocyte NF-kappa B activation and cellularproteasome activity. J Biol Chem 2001;276:44641–6. [PubMed: 11572859]
35. Bjerling P, Silverstein RA, Thon G, Caudy A, Grewal S, Ekwall K. Functional divergence betweenhistone deacetylases in fission yeast by distinct cellular localization and in vivo specificity. Mol CellBiol 2002;22:2170–81. [PubMed: 11884604]
36. Imai S, Armstrong CM, Kaeberlein M, Guarente L. Transcriptional silencing and longevity proteinSir2 is an NAD-dependent histone deacetylase. Nature 2000;403:795–800. [PubMed: 10693811]
37. Suka N, Luo K, Grunstein M. Sir2p and Sas2p opposingly regulate acetylation of yeast histone H4lysine16 and spreading of heterochromatin. Nat Genet 2002;32:378–83. [PubMed: 12379856]
38. Hartman HB, Yu J, Alenghat T, Ishizuka T, Lazar MA. The histone-binding code of nuclear receptorco-repressors matches the substrate specificity of histone deacetylase 3. EMBO Rep 2005;6:445–51.[PubMed: 15832170]
39. Johnson CA, White DA, Lavender JS, O'Neill LP, Turner BM. Human class I histone deacetylasecomplexes show enhanced catalytic activity in the presence of ATP and co-immunoprecipitate withthe ATP-dependent chaperone protein Hsp70. J Biol Chem 2002;277:9590–7. [PubMed: 11777905]
40. Towsend K, Trevino V, Falciani F, Stewart PM, Hewison M, Campbell MJ. Identification of VDR-responsive gene signatures in breast cancer cells. Oncology 2006;71:111–23. [PubMed: 17377416]
41. Wu Y, Craig TA, Lutz WH, Kumar R. Identification of 1 alpha,25-dihydroxyvitamin D3 responseelements in the human transforming growth factor beta 2 gene. Biochemistry 1999;38:2654–60.[PubMed: 10052935]
42. Tou L, Liu Q, Shivdasani RA. Regulation of mammalian epithelial differentiation and intestinedevelopment by class I histone deacetylases. Mol Cell Biol 2004;24:3132–9. [PubMed: 15060137]
43. Schneikert J, Behrens J. The canonical Wnt signalling pathway and its APC partner in colon cancerdevelopment. Gut 2007;56:417–25. [PubMed: 16840506]
44. Gmeiner WH, Hellmann GM, Shen P. Tissue-dependent and -independent gene expression changesin metastatic colon cancer. Oncol Rep 2008;19:245–51. [PubMed: 18097602]
45. Segditsas S, Tomlinson I. Colorectal cancer and genetic alterations in the Wnt pathway. Oncogene2006;25:7531–7. [PubMed: 17143297]
46. Roose J, Clevers H. TCF transcription factors: molecular switches in carcinogenesis. BiochimBiophys Acta 1999;1424:M23–37. [PubMed: 10528152]
47. Daniels DL, Weis WI. Beta-catenin directly displaces Groucho/TLE repressors from Tcf/Lef in Wnt-mediated transcription activation. Nat Struct Mol Biol 2005;12:364–71. [PubMed: 15768032]
48. van den Brink GR, Bleuming SA, Hardwick JC, Schepman BL, Offerhaus GJ, Keller JJ, Nielsen C,Gaffield W, van Deventer SJ, Roberts DJ, Peppelenbosch MP. Indian Hedgehog is an antagonist ofWnt signaling in colonic epithelial cell differentiation. Nat Genet 2004;36:277–82. [PubMed:14770182]
49. Bordonaro M, Lazarova DL, Sartorelli AC. Butyrate and Wnt signaling: a possible solution to thepuzzle of dietary fiber and colon cancer risk? Cell Cycle 2008;7:1178–83. [PubMed: 18418037]
50. Lazarova DL, Bordonaro M, Carbone R, Sartorelli AC. Linear relationship between Wnt activitylevels and apoptosis in colorectal carcinoma cells exposed to butyrate. Int J Cancer 2004;110:523–31. [PubMed: 15122584]
51. Willert J, Epping M, Pollack JR, Brown PO, Nusse R. A transcriptional response to Wnt protein inhuman embryonic carcinoma cells. BMC Dev Biol 2002;2:8. [PubMed: 12095419]
52. Scacheri PC, Rozenblatt-Rosen O, Caplen NJ, Wolfsberg TG, Umayam L, Lee JC, Hughes CM,Shanmugam KS, Bhattacharjee A, Meyerson M, Collins FS. Short interfering RNAs can induceunexpected and divergent changes in the levels of untargeted proteins in mammalian cells. Proc NatlAcad Sci U S A 2004;101:1892–7. [PubMed: 14769924]
53. Sledz CA, Williams BR. RNA interference and double-stranded-RNA-activated pathways. BiochemSoc Trans 2004;32:952–6. [PubMed: 15506933]
54. Dighe AS, Richards E, Old LJ, Schreiber RD. Enhanced in vivo growth and resistance to rejectionof tumor cells expressing dominant negative IFN gamma receptors. Immunity 1994;1:447–56.[PubMed: 7895156]
Godman et al. Page 11
Cancer Biol Ther. Author manuscript; available in PMC 2009 January 7.
NIH
-PA Author Manuscript
NIH
-PA Author Manuscript
NIH
-PA Author Manuscript

55. Kaplan DH, Shankaran V, Dighe AS, Stockert E, Aguet M, Old LJ, Schreiber RD. Demonstration ofan interferon gamma-dependent tumor surveillance system in immunocompetent mice. Proc NatlAcad Sci U S A 1998;95:7556–61. [PubMed: 9636188]
56. Yang G, Xu Y, Chen X, Hu G. IFITM1 plays an essential role in the antiproliferative action ofinterferon-gamma. Oncogene 2007;26:594–603. [PubMed: 16847454]
57. Dunn GP, Old LJ, Schreiber RD. The immunobiology of cancer immunosurveillance andimmunoediting. Immunity 2004;21:137–48. [PubMed: 15308095]
58. Klampfer L, Huang J, Swaby LA, Augenlicht L. Requirement of histone deacetylase activity forsignaling by STAT1. J Biol Chem 2004;279:30358–68. [PubMed: 15123634]
59. Jakowlew SB. Transforming growth factor-beta in cancer and metastasis. Cancer Metastasis Rev2006;25:435–57. [PubMed: 16951986]
60. Lynch JP, Hoops TC. The genetic pathogenesis of colorectal cancer. Hematol Oncol Clin North Am2002;16:775–810. [PubMed: 12418049]
61. Thiagalingam S, Lengauer C, Leach FS, Schutte M, Hahn SA, Overhauser J, Willson JK, MarkowitzS, Hamilton SR, Kern SE, Kinzler KW, Vogelstein B. Evaluation of candidate tumour suppressorgenes on chromosome 18 in colorectal cancers. Nat Genet 1996;13:343–6. [PubMed: 8673134]
62. Reiss M. TGF-beta and cancer. Microbes Infect 1999;1:1327–47. [PubMed: 10611761]63. Gaschott T, Stein J. Short-chain fatty acids and colon cancer cells: the vitamin D receptor--butyrate
connection. Recent Results Cancer Res 2003;164:247–57. [PubMed: 12899527]64. Dangond F, Hafler DA, Tong JK, Randall J, Kojima R, Utku N, Gullans SR. Differential display
cloning of a novel human histone deacetylase (HDAC3) cDNA from PHA-activated immune cells.Biochem Biophys Res Commun 1998;242:648–52. [PubMed: 9464271]
65. Emiliani S, Fischle W, Van Lint C, Al-Abed Y, Verdin E. Characterization of a human RPD3 ortholog,HDAC3. Proc Natl Acad Sci U S A 1998;95:2795–800. [PubMed: 9501169]
66. Yang WM, Yao YL, Sun JM, Davie JR, Seto E. Isolation and characterization of cDNAscorresponding to an additional member of the human histone deacetylase gene family. J Biol Chem1997;272:28001–7. [PubMed: 9346952]
67. Smith CM, Haimberger ZW, Johnson CO, Wolf AJ, Gafken PR, Zhang Z, Parthun MR, GottschlingDE. Heritable chromatin structure: mapping “memory” in histones H3 and H4. Proc Natl Acad SciU S A 2002;99(Suppl 4):16454–61. [PubMed: 12196632]
Godman et al. Page 12
Cancer Biol Ther. Author manuscript; available in PMC 2009 January 7.
NIH
-PA Author Manuscript
NIH
-PA Author Manuscript
NIH
-PA Author Manuscript

Figure 1. HDAC3 expression is specifically reduced by HDAC3 shRNA[A] Western blotting of proteins from SW480 cells stably transfected with either a controlvector (shCNTL) or a vector containing shRNA against HDAC3 (shHD3). Results from twoindependent cell lines are shown. Note the specific decrease in HDAC3 protein levels incomparison to HDACs 1, 2, and 4. [B] Effect of HDAC3 shRNA on histone modification.Chromatin was prepared from shCNTL and shHD3 cells, and analyzed for histone modificationusing specific antibodies (in duplicate). Optical density was determined using ImageJ software(NIH) and normalized to shCNTL levels. The bars shown are the average relative intensitiesof modifications from shCNTL cells (white bars) and shHD3 cells (gray bars).
Godman et al. Page 13
Cancer Biol Ther. Author manuscript; available in PMC 2009 January 7.
NIH
-PA Author Manuscript
NIH
-PA Author Manuscript
NIH
-PA Author Manuscript
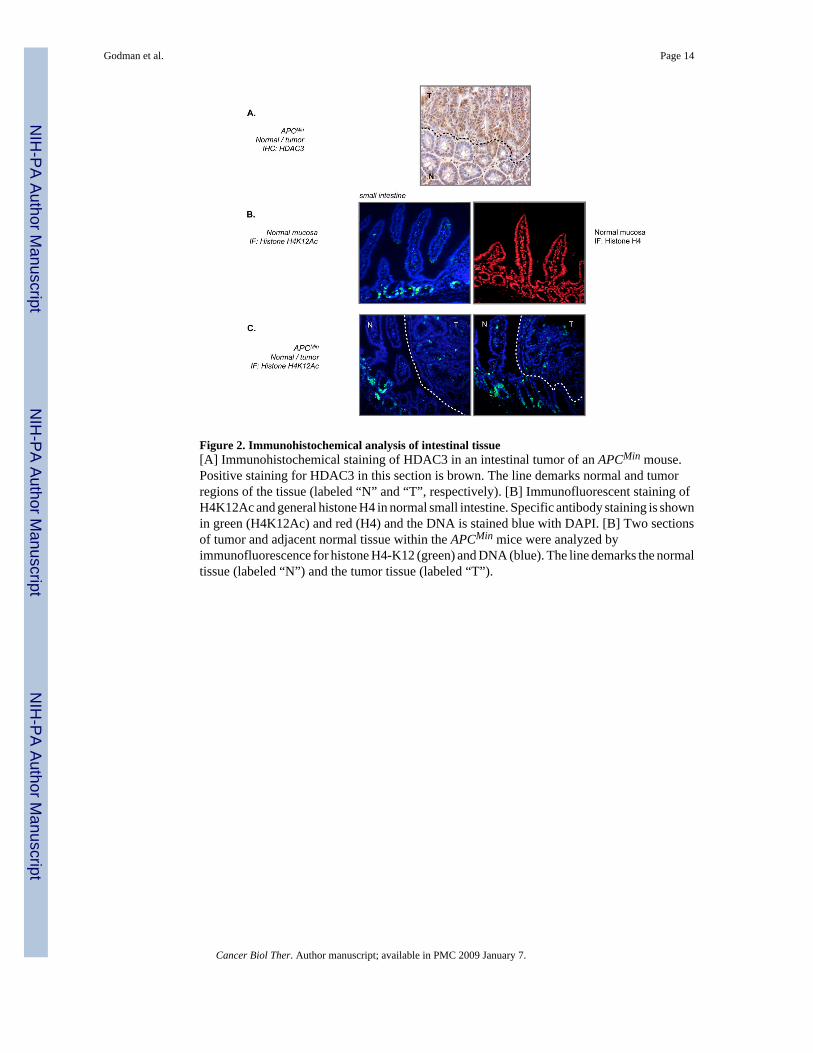
Figure 2. Immunohistochemical analysis of intestinal tissue[A] Immunohistochemical staining of HDAC3 in an intestinal tumor of an APCMin mouse.Positive staining for HDAC3 in this section is brown. The line demarks normal and tumorregions of the tissue (labeled “N” and “T”, respectively). [B] Immunofluorescent staining ofH4K12Ac and general histone H4 in normal small intestine. Specific antibody staining is shownin green (H4K12Ac) and red (H4) and the DNA is stained blue with DAPI. [B] Two sectionsof tumor and adjacent normal tissue within the APCMin mice were analyzed byimmunofluorescence for histone H4-K12 (green) and DNA (blue). The line demarks the normaltissue (labeled “N”) and the tumor tissue (labeled “T”).
Godman et al. Page 14
Cancer Biol Ther. Author manuscript; available in PMC 2009 January 7.
NIH
-PA Author Manuscript
NIH
-PA Author Manuscript
NIH
-PA Author Manuscript

Figure 3. H4K12Ac co-localizes with proliferating cells[A] APCMin small intestine normal tissue was co-stained for H4K12Ac (green), PCNA (red)and DAPI (blue). Note the high degree of overlap as shown in the merge panel. [B]Microadenomas (T) from APCMin mice show a similar pattern of overlap but a lower amountof cells staining positive for H4K12Ac compared to normal tissue (N). [C] Western blotanalysis of synchronized SW480 cells show a co-ordinate increase in H4K12Ac and PCNAafter release from G1 whereas histone H3K9Me does not change.
Godman et al. Page 15
Cancer Biol Ther. Author manuscript; available in PMC 2009 January 7.
NIH
-PA Author Manuscript
NIH
-PA Author Manuscript
NIH
-PA Author Manuscript
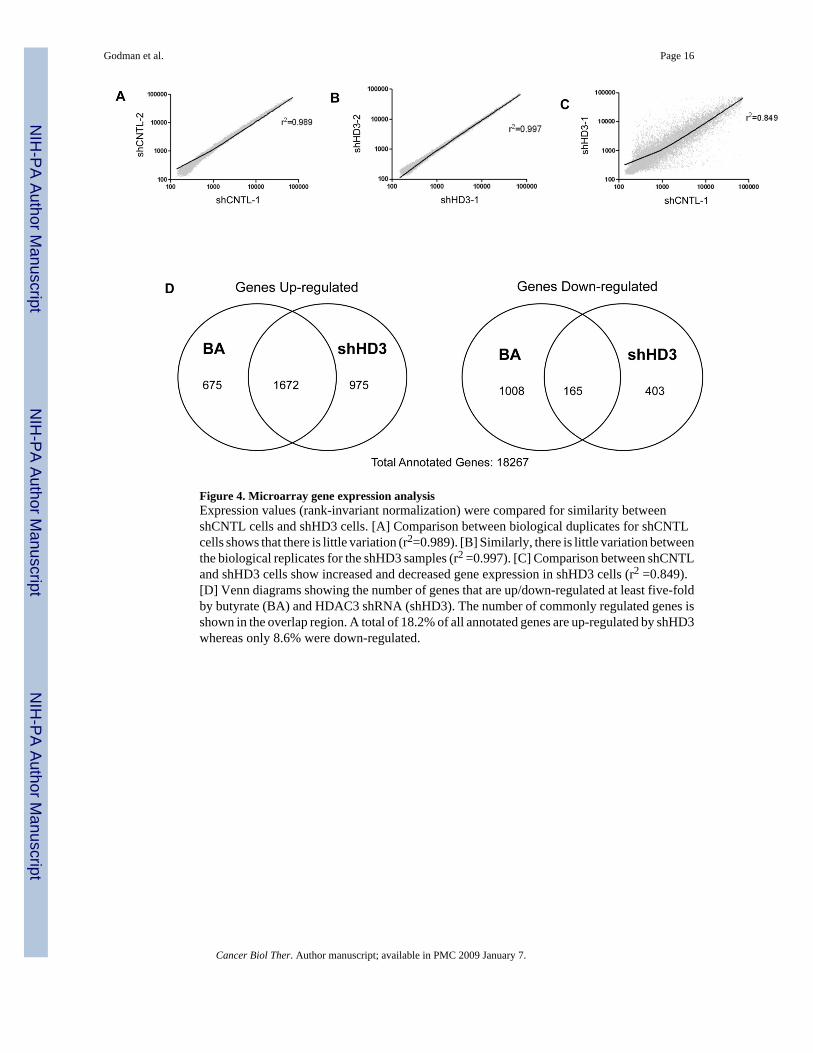
Figure 4. Microarray gene expression analysisExpression values (rank-invariant normalization) were compared for similarity betweenshCNTL cells and shHD3 cells. [A] Comparison between biological duplicates for shCNTLcells shows that there is little variation (r2=0.989). [B] Similarly, there is little variation betweenthe biological replicates for the shHD3 samples (r2 =0.997). [C] Comparison between shCNTLand shHD3 cells show increased and decreased gene expression in shHD3 cells (r2 =0.849).[D] Venn diagrams showing the number of genes that are up/down-regulated at least five-foldby butyrate (BA) and HDAC3 shRNA (shHD3). The number of commonly regulated genes isshown in the overlap region. A total of 18.2% of all annotated genes are up-regulated by shHD3whereas only 8.6% were down-regulated.
Godman et al. Page 16
Cancer Biol Ther. Author manuscript; available in PMC 2009 January 7.
NIH
-PA Author Manuscript
NIH
-PA Author Manuscript
NIH
-PA Author Manuscript
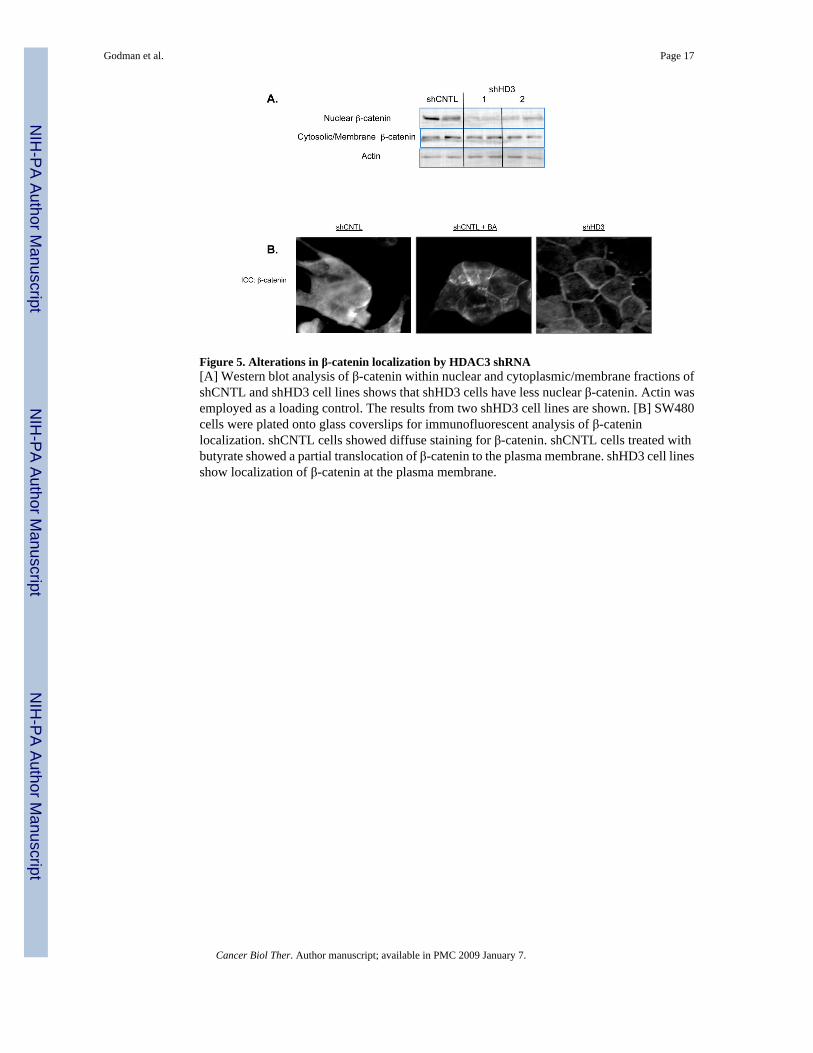
Figure 5. Alterations in β-catenin localization by HDAC3 shRNA[A] Western blot analysis of β-catenin within nuclear and cytoplasmic/membrane fractions ofshCNTL and shHD3 cell lines shows that shHD3 cells have less nuclear β-catenin. Actin wasemployed as a loading control. The results from two shHD3 cell lines are shown. [B] SW480cells were plated onto glass coverslips for immunofluorescent analysis of β-cateninlocalization. shCNTL cells showed diffuse staining for β-catenin. shCNTL cells treated withbutyrate showed a partial translocation of β-catenin to the plasma membrane. shHD3 cell linesshow localization of β-catenin at the plasma membrane.
Godman et al. Page 17
Cancer Biol Ther. Author manuscript; available in PMC 2009 January 7.
NIH
-PA Author Manuscript
NIH
-PA Author Manuscript
NIH
-PA Author Manuscript

Godman et al. Page 18
Cancer Biol Ther. Author manuscript; available in PMC 2009 January 7.
NIH
-PA Author Manuscript
NIH
-PA Author Manuscript
NIH
-PA Author Manuscript

Figure 6. Real-time PCR in stable and transient HDAC3 knockdown cells for Wnt pathwaycomponents[A] RNA isolated from SW480 cells expressing control (shCNTL) or HDAC3 (shHD3) shRNAwas used to synthesize cDNA and was analyzed for the expression of TLE1, TLE4 and c-MYCusing quantitative real-time PCR. Real-time data is consistent with results from the microarrayanalysis. [B-D] TLE1, TLE4 and c-MYC mRNA expression following the transientknockdown of HDAC3 in SW480 [B], HT-29 [C] or HCT116 [D] cells. Cells were also treatedwith butyrate, as indicated. An ANOVA analysis was performed to determine significantdifferences; * indicates a significant difference between the indicated treatment and the controlcells (p < 0.05).
Godman et al. Page 19
Cancer Biol Ther. Author manuscript; available in PMC 2009 January 7.
NIH
-PA Author Manuscript
NIH
-PA Author Manuscript
NIH
-PA Author Manuscript

Figure 7. HDAC3 regulation of VDR and vitamin D responses[A] VDR mRNA quantified by real-time PCR in shCNTL and siHD3 cells, treated with orwithout butyrate, as indicated. [B] VDR expression was also analyzed in the HCT116 cell linetransiently transfected with control or HDAC3-targeting siRNA (siHD3), that were treatedwith or without butyrate (BA) as indicated. [C] VDR expression in shCNTL and shHD3 cellsdetermined by immunoblotting. Two independent shHD3 cell lines were analyzed in duplicate.[D] shCNTL and shHD3 cells were treated with 1, 25 dihydroxyvitamin D3 for 24 hours andsubjected to immunoblot analysis for the cell adhesion protein E-cadherin. Actin was employedas a loading control.
Godman et al. Page 20
Cancer Biol Ther. Author manuscript; available in PMC 2009 January 7.
NIH
-PA Author Manuscript
NIH
-PA Author Manuscript
NIH
-PA Author Manuscript

Figure 8. 1, 25 dihydroxyvitamin D3 decreases growth of cells with stable HDAC3 knockdownTreatment of cells with increasing amounts of 1, 25-dihydroxyvitamin D3 over a period of 2days showed a dose dependent drop in cell number only in the cell line expressing loweramounts of HDAC3 (* indicates p < 0.05). Cells were treated at the indicated concentrationsof 1,25 dihydroxyvitamin D3 in quadruplicate.
Godman et al. Page 21
Cancer Biol Ther. Author manuscript; available in PMC 2009 January 7.
NIH
-PA Author Manuscript
NIH
-PA Author Manuscript
NIH
-PA Author Manuscript

NIH
-PA Author Manuscript
NIH
-PA Author Manuscript
NIH
-PA Author Manuscript
Godman et al. Page 22
Table 1IPA pathway analysisAverage gene expression levels for shHD3 cells were compared with the averages for shCNTL cells, and data wereprocessed through the IPA pathway analyzer. Results show three major pathways affected by HDAC3 knockdown,including genes in the Wnt pathway [A], the Interferon pathway [B], and the TGFβ pathway [C].
A Gene Symbol Role in Pathway
DKK3 Wnt antagonist *FZD17 Wnt receptor
Up-regulated SMO Component of the competing hedgehog pathway *TLE1 TCF co-repressor *TLE4 TCF co-repressor *WNT6 LigandWNT5A Ligand
DKK4 Wnt antagonistFZD10 Wnt receptor *
Down-regulated GJA1 Wnt suppressed in development *PPP2R2C Wnt pathway enhancer *SOX8 Wnt target gene *TCF1 Binds beta-catenin *MYC Wnt target gene *
B Gene Symbol Role in Pathway
IFI35 Interferon target geneIFITM1 Interferon target gene
Up-regulated MX1 Interferon-inducible proteinPSMB8 Gamma-interferon induces expressionSOCS1 Gamma-interferon induces expression
C Gene Symbol Role in Pathway
AXL Receptor tyrosine kinaseEGFR Capable of binding TGF-betaHOXC8 Binds SMAD proteins/transcription regulatorINHA Ligand
Up-regulated ROR2 Receptor tyrosine kinaseROR1 Receptor tyrosine kinaseSERPINE1 Target geneTGFB2 LigandTGIF1 Co-repressorVDR Target gene
INHBB LigandDown-regulated NKX2-5 Target gene
Cancer Biol Ther. Author manuscript; available in PMC 2009 January 7.