Groundwater Contaminats' Investigation at Aarada Waste Disposal Site Using Geophysical and...
10
IOSR Journal Of Environmental Science, Toxicology And Food Technology (IOSR-JESTFT) ISSN: 2319-2402, ISBN: 2319-2399. Volume 2, Issue 4 (Jan. - Feb. 2013), PP 01-10 www.Iosrjournals.Org www.iosrjournals.org 1 | Page Groundwater Contaminats’ Investigation at Aarada Waste Disposal Site Using Geophysical and Hydro-Physicochemical Approach. 1 E.R. Olafisoye, 1 L.A. Sunmonu, 1 T.A. Adagunodo, And 2 O.P. Oladejo. 1 Department of Pure and Applied Physics, Ladoke Akintola University of Technology, P.M.B. 4000, Ogbomoso, Oyo State, Nigeria 2 Departments of Physics, Emmanuel Alayande College of Education, Oyo, Oyo State, Nigeria. Abstract: A research on the impact of waste disposal site on groundwater resources was conducted around Aarada area, Ogbomosho, Oyo State, Nigeria using electrical resistivity (vertical electrical sounding) and hydro-physicochemical methods. This study was carried out to map the contamination patches at the subsurface and investigate the contamination level of the various hand dug wells situated in the area. A total of seven VES were carried out with length ranging between 80 to 130m. The hydro-physicochemical analysis was conducted at the peak of the wet season on nine water samples taken from nine different hand-dug wells in the research area. The result obtained from the interpreted VES data revealed leachate plumes at the subsurface in the study area. The outcome of the hydro-physicochemical method revealed hazardously high values of Fe 2+ , Pb 2+ , Zn 2+ , Cu 2+ and NO 3 - to further support the findings from the VES survey. Keywords: Contaminants, Groundwater, Health Hazard, Hydro-Physicochemical Analysis, Leachate Plume, Vertical Electrical Sounding. I. Introduction Groundwater is very essential for domestic, industrial and agricultural applications. The health and productive life of the people in any society depend solely on potable and safe drinking water. However, maintaining a good quality groundwater supply that is free from microbial and chemical pollution is far from reality in most of our cities and towns due to poor waste disposal and management practices. The major causes of waste generation are industrial development and increased urbanization in the municipality. The problem of inadequate trained waste disposal personnel and equipment, poor waste collection, inadequate solid waste disposing method, improper functioning septic tank systems and indiscriminate sitting of disposal sites without regards to the local geology and hydrogeology of the area contribute significantly in the contamination of soil and groundwater. Polluted groundwater has elevated microbial, ionic and volatile organic content, resulting to hazardous effects on public health and poor groundwater quality. As a result of the imminent dangerous impact of solid waste disposal site, it has become necessary to investigate the subsurface contaminant level of soil and groundwater around a municipal solid waste dumping site. The refuse dump site is located in Ogbomoso, southwestern Nigeria. It was delineated between latitude 8˚06΄70˝ and 8˚06΄98.7 north and between longitude 4˚14΄28.2˝E and 4˚14΄56.9˝ east (Figure 1, 2 and 3). The waste disposal site receives municipal wastes, mainly domestic garbage, with hazardous and non hazardous constituents. These release large amount of leachate into the surrounding soil and groundwater. Generally, electrical resistivity method provides economical and reliable means to identify and delineate leachate contaminant plumes from waste disposal site because there is elevation in the electrical conductivity of leachate to that of natural groundwater. The use of resistivity method as applied to waste dumping site studies are well documented by numerous researchers in the study of leachate contamination of soil and groundwater (Porsani et al., 2004; Karlik et al., 2001; Mukhtar et al., 2000;). The objective of this research work is to apply the electrical resistivity technique to detect and delineate leachate plume from uncontrolled solid waste dumpsite in Ogbomoso, Southwestern Nigeria. The hydro-physicochemical analysis of sampled water is to complement the results of the geophysical data and measure the degree of contaminants’ accumulation. II. Geology And Hydrogeology The study area is located in Ogbomoso, southwestern Nigeria between latitude 8˚06΄70˝ and 8˚06΄98.7 north and between longitude 4˚14΄28.2˝E and 4˚14΄56.9˝ east . The geology of this area consists of Precambrian rocks that are typical for the basement complex of Nigeria (Rahaman, 1976). The major rock associated with Ogbomoso area form part of the Proterozoic schist belts of Nigeria, which are predominantly, developed in the western half of the country. In terms of structural features, lithology and mineralization, the schist belts show
-
Upload
covenantuniversity -
Category
Documents
-
view
1 -
download
0
Transcript of Groundwater Contaminats' Investigation at Aarada Waste Disposal Site Using Geophysical and...
IOSR Journal Of Environmental Science, Toxicology And Food Technology (IOSR-JESTFT)
ISSN: 2319-2402, ISBN: 2319-2399. Volume 2, Issue 4 (Jan. - Feb. 2013), PP 01-10 www.Iosrjournals.Org
www.iosrjournals.org 1 | Page
Groundwater Contaminats’ Investigation at Aarada Waste
Disposal Site Using Geophysical and Hydro-Physicochemical
Approach.
1 E.R. Olafisoye,
1 L.A. Sunmonu,
1 T.A. Adagunodo, And
2 O.P. Oladejo.
1 Department of Pure and Applied Physics, Ladoke Akintola University of Technology, P.M.B. 4000, Ogbomoso,
Oyo State, Nigeria 2 Departments of Physics, Emmanuel Alayande College of Education, Oyo, Oyo State, Nigeria.
Abstract: A research on the impact of waste disposal site on groundwater resources was conducted around
Aarada area, Ogbomosho, Oyo State, Nigeria using electrical resistivity (vertical electrical sounding) and
hydro-physicochemical methods. This study was carried out to map the contamination patches at the subsurface
and investigate the contamination level of the various hand dug wells situated in the area. A total of seven VES
were carried out with length ranging between 80 to 130m. The hydro-physicochemical analysis was conducted
at the peak of the wet season on nine water samples taken from nine different hand-dug wells in the research area. The result obtained from the interpreted VES data revealed leachate plumes at the subsurface in the study
area. The outcome of the hydro-physicochemical method revealed hazardously high values of Fe2+, Pb2+, Zn2+,
Cu2+ and NO3- to further support the findings from the VES survey.
Keywords: Contaminants, Groundwater, Health Hazard, Hydro-Physicochemical Analysis, Leachate Plume,
Vertical Electrical Sounding.
I. Introduction Groundwater is very essential for domestic, industrial and agricultural applications. The health and
productive life of the people in any society depend solely on potable and safe drinking water. However,
maintaining a good quality groundwater supply that is free from microbial and chemical pollution is far from
reality in most of our cities and towns due to poor waste disposal and management practices. The major causes
of waste generation are industrial development and increased urbanization in the municipality. The problem of inadequate trained waste disposal personnel and equipment, poor waste collection, inadequate solid waste
disposing method, improper functioning septic tank systems and indiscriminate sitting of disposal sites without
regards to the local geology and hydrogeology of the area contribute significantly in the contamination of soil
and groundwater. Polluted groundwater has elevated microbial, ionic and volatile organic content, resulting to
hazardous effects on public health and poor groundwater quality. As a result of the imminent dangerous impact
of solid waste disposal site, it has become necessary to investigate the subsurface contaminant level of soil and
groundwater around a municipal solid waste dumping site. The refuse dump site is located in Ogbomoso,
southwestern Nigeria. It was delineated between latitude 8˚06΄70˝ and 8˚06΄98.7 north and between longitude
4˚14΄28.2˝E and 4˚14΄56.9˝ east (Figure 1, 2 and 3). The waste disposal site receives municipal wastes, mainly
domestic garbage, with hazardous and non hazardous constituents. These release large amount of leachate into
the surrounding soil and groundwater.
Generally, electrical resistivity method provides economical and reliable means to identify and delineate leachate contaminant plumes from waste disposal site because there is elevation in the electrical
conductivity of leachate to that of natural groundwater. The use of resistivity method as applied to waste
dumping site studies are well documented by numerous researchers in the study of leachate contamination of
soil and groundwater (Porsani et al., 2004; Karlik et al., 2001; Mukhtar et al., 2000;). The objective of this
research work is to apply the electrical resistivity technique to detect and delineate leachate plume from
uncontrolled solid waste dumpsite in Ogbomoso, Southwestern Nigeria. The hydro-physicochemical analysis of
sampled water is to complement the results of the geophysical data and measure the degree of contaminants’
accumulation.
II. Geology And Hydrogeology The study area is located in Ogbomoso, southwestern Nigeria between latitude 8˚06΄70˝ and 8˚06΄98.7
north and between longitude 4˚14΄28.2˝E and 4˚14΄56.9˝ east. The geology of this area consists of Precambrian
rocks that are typical for the basement complex of Nigeria (Rahaman, 1976). The major rock associated with
Ogbomoso area form part of the Proterozoic schist belts of Nigeria, which are predominantly, developed in the
western half of the country. In terms of structural features, lithology and mineralization, the schist belts show

Groundwater Contaminats’ Investigation At Aarada Waste Disposal Site Using Geophysical And
www.iosrjournals.org 2 | Page
considerable similarities to the Achaean Green Stone belts. However, the latter usually contain much larger
proportions of mafic and ultra mafic bodies and assemblages of lower metamorphic grade (Ajayi, 1988;
Rahaman, 1976). The gneiss complex which underlies the northern and southern part of the Ogbomoso district comprises a considerable broader area of outcrops. Locally, the rock sequence composes of basically weathered
quartzite and older granites. The minerals found in this area constitute mostly amphibolites, amphibole schist,
meta ultra mafites and meta pelites. Extensive psammitic units with minor meta pelite can also be found. These
consist of quartzites and quartz schist. All these assemblages are associated with migmatitic gneisses and are cut
by a variety of granitic bodies (Rahaman, 1976).
The rocks of the Ogbomoso district may be broadly grouped into gneiss-migmatite complex, mafic-
ultra mafic suite (or amphibolite complex), meta sedimentary assemblages and intrusive suite of granitic rocks.
A variety of minor rock types are also related to these units. The gneiss-migmatite complex comprises migmatic
and granitic, calcareous and granulitic rocks. The mafic-ultramafic suite is composed mainly of amphibolites,
amphibole schist and minor meta ultramafites, made up of anthophillite-tremolite-chlorite and talc schist. The
meta sedimentary assemblages, chiefly meta pelites and psammitic units are found as quartzites and quartz schist. The intrusive suite consists essentially of Pan African (c.600Ma) Granitic units. The minor rocks include
garnet-quartz-chlorite bodies, biotites-garnet rock, syenitic bodies, and dolerites (Rahaman, 1976: Folami,
1992).
The study area overlies the western upland region of the Nigeria highland plateaux with average
altitude between 1000m and 1500m above mean sea level (Akinloye, et al. 2002). The drainage type is
intrinsically dendrites. Locally, Ogbomoso area experiences tropical rainfall which dominates most of
southwestern part of Nigeria and the area has two distinct seasons, the wet season usually between March and
October, and the dry season which falls between November and February every year. The annual rainfall for the
study area is 1247mm, but the amount varies from 1016mm to 1524mm, and is almost entirely concentrated in
the wet season. The study area falls within the guinea savannah belt of Nigeria but human activities such as
exploitation are gradually changing the vegetation to that of Sudan savannah.
Figure 1: Geological Map of Nigeria Showing the Location of Ogbomosho

Groundwater Contaminats’ Investigation At Aarada Waste Disposal Site Using Geophysical And
www.iosrjournals.org 3 | Page
Figure 2: Map of Ogbomoso Showing the Location of the Study Area
III. Materials And Method The VES was carried out using Schlumberger electrical array (Zohdy et al., 1974). The Campus Tiger
resistivity meter was employed for resistance measurements. A total of seven electrical soundings were
established, with maximum half current electrode spacing (AB/2) of 65m. The field data was interpreted by
applying partial curve matching technique (Koefoed, 1979) with the help of master curves (Orellana and Mooney, 1966) and sets of auxiliary charts (Zohdy, 1965; Keller and Frischnecht, 1966). From the preliminary
interpretation, initial estimates of the resistivity and thickness of the various geoelectric layers at each VES
locations were determined. These geoelectric parameters were then employed as starting models for the
computer-aided iteration using Resist software (Vander Velpen, 1988). The partial curve matching technique
carried out on the seven VES revealed a 3 layered model with H type curve (resistive-conductive-resistive).
Figure 3: Base Map of the Study Area

Groundwater Contaminats’ Investigation At Aarada Waste Disposal Site Using Geophysical And
www.iosrjournals.org 4 | Page
IV. Result And Discussion 4.1 Geoelectric Parameters
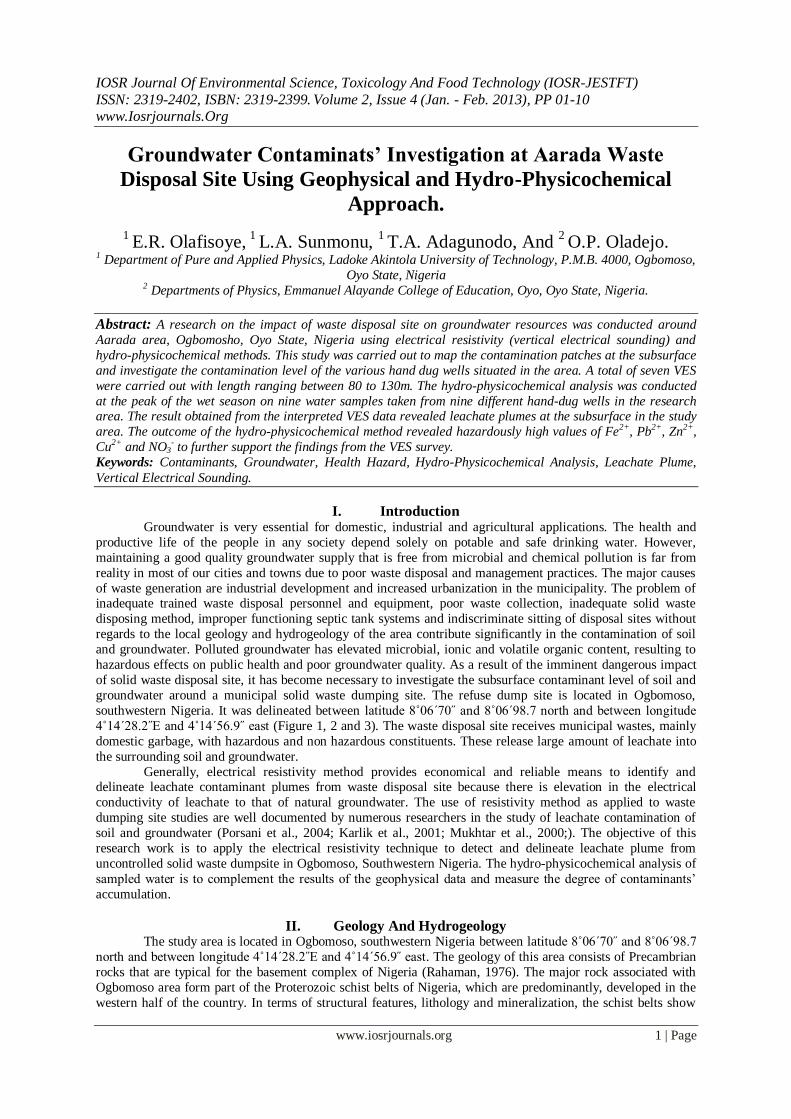
The processed raw data presented as resist graphs (Fig. 4, 5, 6, 7, 8, 9 and 10) were employed to
generate the geoelectric sections in Fig. 11 and Fig. 12 as used by Adagunodo and Sunmonu (2012). The surface
topographic map depicted in Fig. 13 revealed the terrain of the waste disposal area. The partial curve matching
technique carried out on the field data revealed a 3 layered model with H type curve (ρ1>ρ2<ρ3) for all the
soundings. Electrical method primarily reflects variations in ground resistivity (Omosuyi et al., 2007). The
electrical resistivity contrasts between lithological sequences (Dodds and Ivic, 1998; Lashkaripour, 2003) in the
subsurface are often adequate to enable the delineation of geoelectric layers and identification of aquiferous or
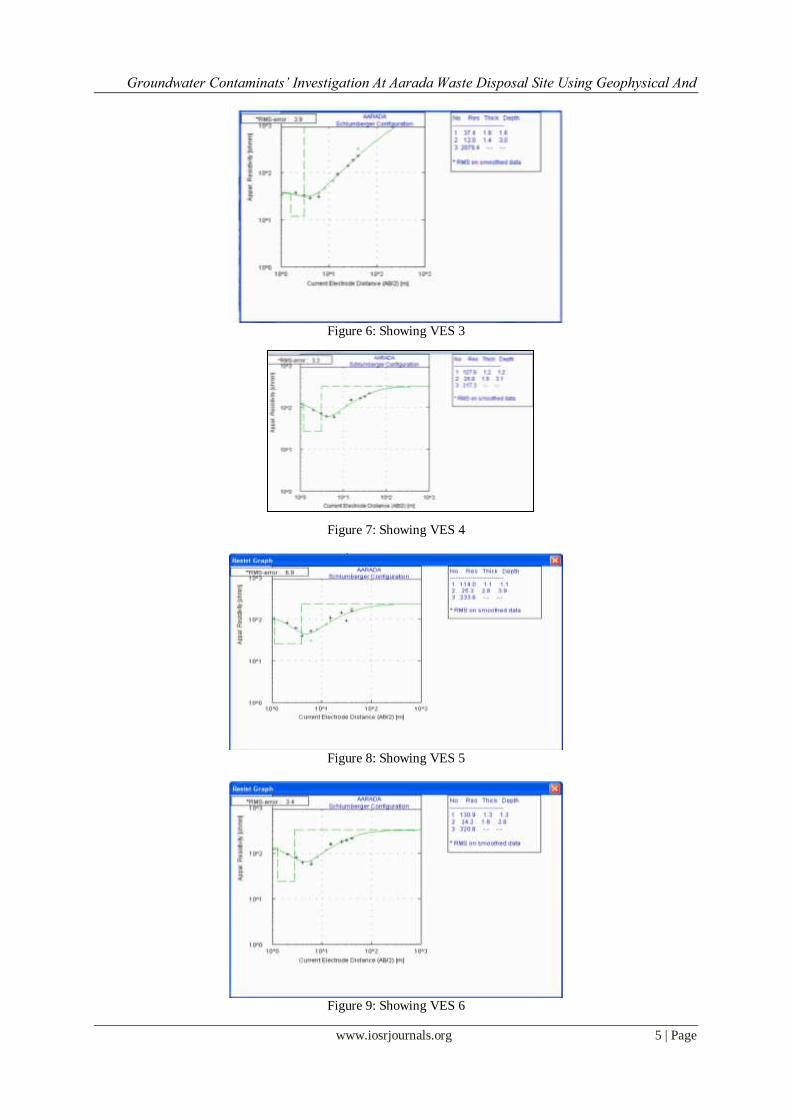
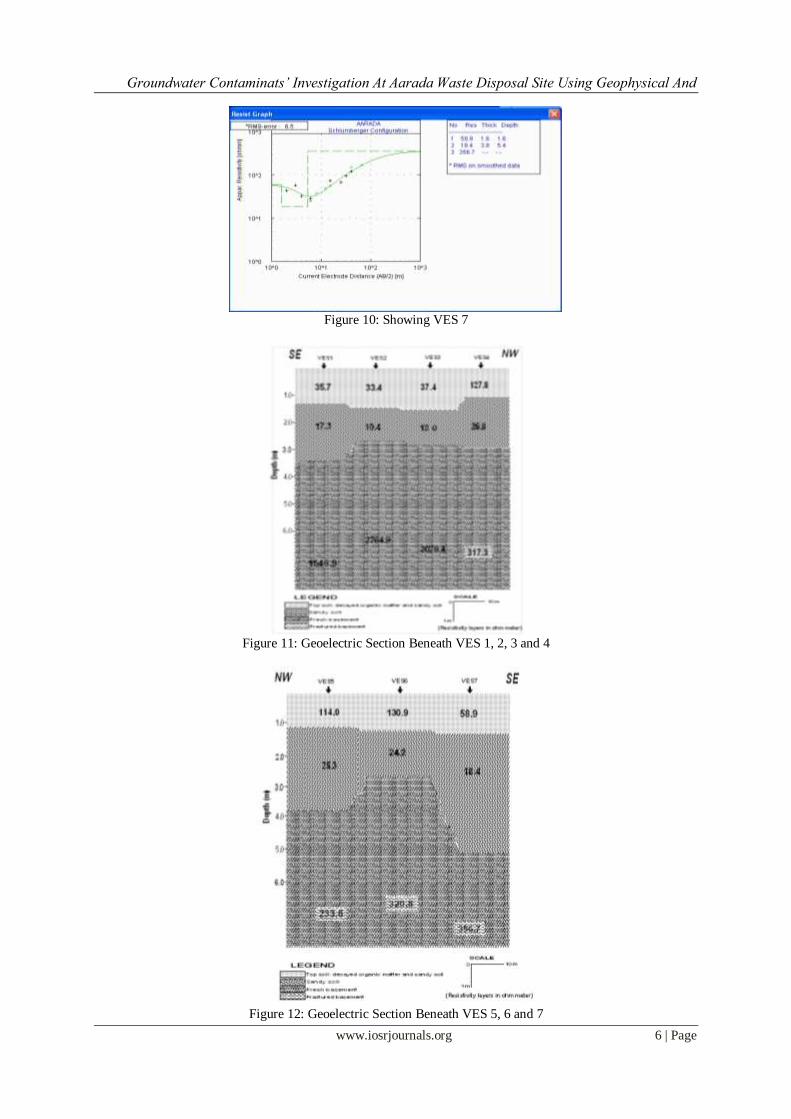
non-aquiferous layers (Schwarz, 1988). The VES interpretation reveals three geoelectric layers across the
research area: the topsoil consisting of sand and decomposed organic matters; the weathered layer which is
made up of sandy soil and the bedrock constituting the fractured or fresh basement. The geoelectric sections show subsurface variation in electrical resistivity along the profiles and attempt to correlate the geoelectric
sequence across the profiles. In the first layer, the resistivity values ranged from 33.4 to 130.9Ωm with a relative
thickness of 1.1 to 1.6m. The second layer has resistivity values varying from 10.4 to 26.8Ωm with relative
thickness of 1.3 to 3.8m. However, the low resistivity values depicted in this layer is due to pollution which
resulted from the high porosity and permeability characteristics of the sandy soil encouraging the seepages of
the leachate plumes to a maximum depth of 5.4m at the subsurface. The region of this layer beneath VES 2
conducted on the waste disposal site where there is older wastes deposit depicted low resistivity value of
10.4Ωm. It also reveals an elevation in the resistivity values in the order VES 1, 3, 4 5, 6 and 7 which revealed
that the leachate emanated from the region where there is older deposit of wastes and spreading out in all
direction polluting the hand dug wells nearby in the process. This geoelectric layer also served as the first
aquifer on the research site from which virtually all the hand dug wells in the area obtained their water. The third layer has resistivity values ranging from 233.6 to 356.7Ωm which indicated the presence of fractured zones
and resistivity values between 1649.9 and 2764.9Ωm; reflective of fresh basement. The thickness of this
geoelectric layer is to an infinite depth.
Figure 4: Showing VES 1
Figure 5: Showing VES 2
Groundwater Contaminats’ Investigation At Aarada Waste Disposal Site Using Geophysical And
www.iosrjournals.org 5 | Page
Figure 6: Showing VES 3
Figure 7: Showing VES 4
Figure 8: Showing VES 5
Figure 9: Showing VES 6
Groundwater Contaminats’ Investigation At Aarada Waste Disposal Site Using Geophysical And
www.iosrjournals.org 6 | Page
Figure 10: Showing VES 7
Figure 11: Geoelectric Section Beneath VES 1, 2, 3 and 4
Figure 12: Geoelectric Section Beneath VES 5, 6 and 7

Groundwater Contaminats’ Investigation At Aarada Waste Disposal Site Using Geophysical And
www.iosrjournals.org 7 | Page
Figure 13: Surface Topographic Map of the Study Area
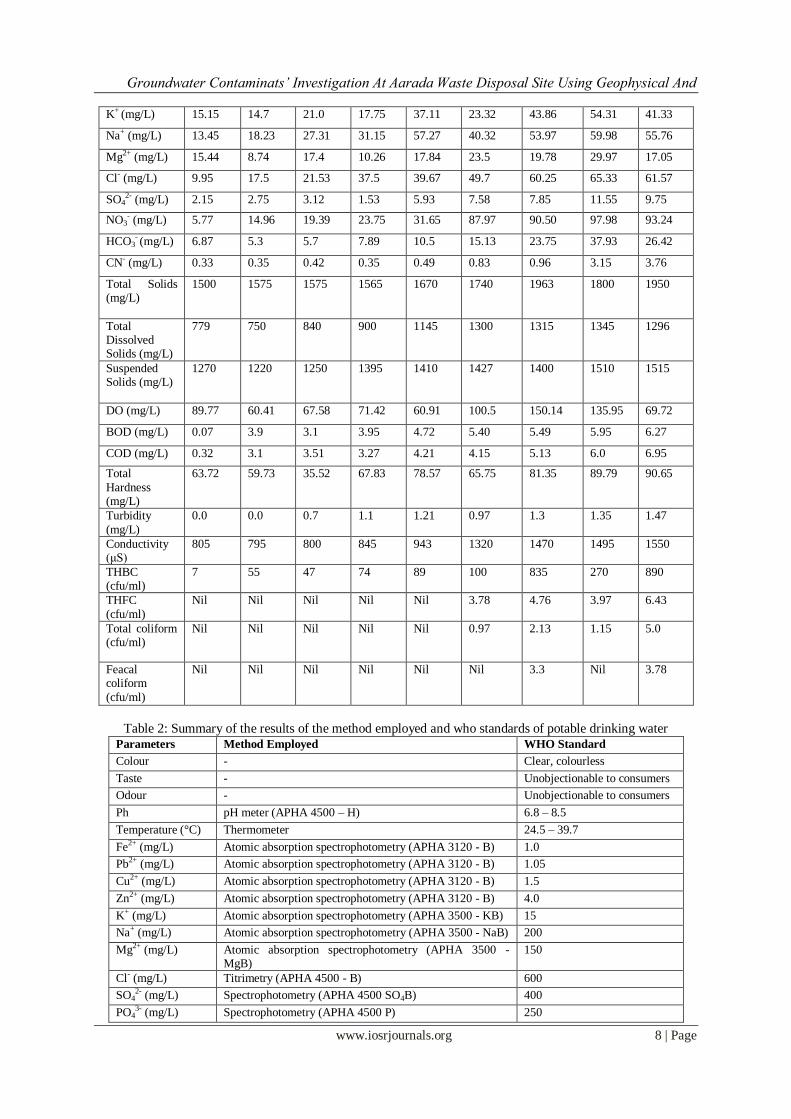
4.2 Hydro-Physicochemical Analysis
The various parameters tested for in the sampled wells show different concentration: from mild to
highly hazardous level as presented in Table 1. The World Health Organization (WHO) guidelines were used for
assessing the groundwater quality in the research area. The result of the assessment revealed that most of the
hand dug wells (especially those close to the refuse dump) in Aarada area are fairly acidic, shows anomalously
high concentration of TDS, NO3-, Cl- and coliform counts which simply indicates that their usage for domestic
purposes without administering necessary treatment in advance will provoke serious health hazard. The depths
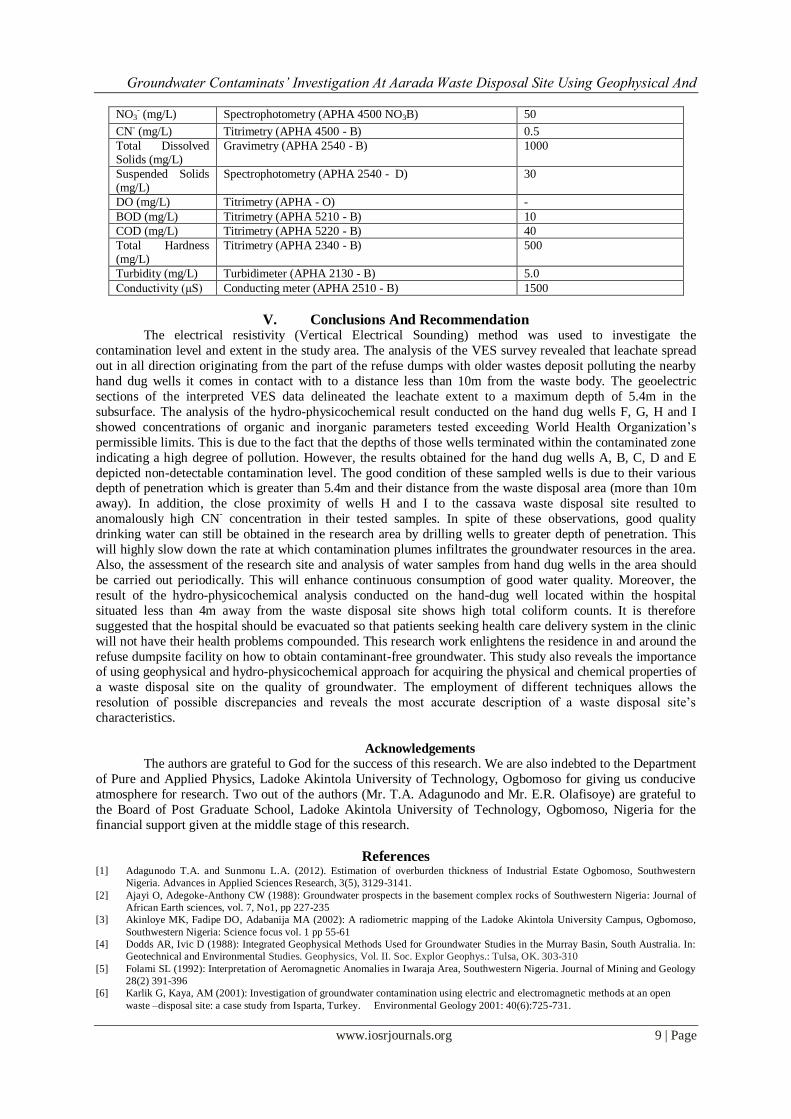
of the sampled wells and their various distances from the waste disposal site are also presented in Table 1 while summary of the results of the method employed for the hydro-physicochemical analysis and who standards for
potable drinking water are presented in Table 2. The hydro-physicochemical analysis conducted showed that
wells A, B, C, D and E are in good conditions; the concentration of various parameters tested are within the
WHO standard while wells F, G, H and I have high concentration of NO3- and total bacteria counts which are
attributed to anthropogenic activities. The high concentration of total dissolved solids in most of the samples
may be an indication of gradual weathering of the basement rocks.
Waterborne diseases are the most predominant in the study area. 55% of the patients on admission list
suffer from typhoid fever; cholera about 25%; gastroenteritis 15% while other disease type 5%. This analysis
was made after personal communication with the medical doctors from the health clinic situated within the
refuse dumpsite facility. Polluted water is a favourable environment where Coliform group of bacteria
(pathogens of most waterborne diseases) breed. The elevated concentration in coliform counts of wells H and I
indicates that they are highly polluted with feacal wastes and the domestic usage of these contaminated hand dug wells expose the local community to high risk of infection. However, wells A, B, C, D and E show non-
detectable coliform counts which is a reflection of more hygienic environment.
Table 1: Result of the hydro-physicochemical analysis of hand dug well samples carried out at the peak of the
raining season.
Parameters Well A Well B Well C Well D Well E Well F Well G Well H Well I
Distance of wells from the dumpsite (m)
25 19 15 13 11 7 6 5 3
Depth of wells (m)
6 5.5 6.1 6.5 6.5 4.5 5.4 5.3 4.1
Colour Clear, colourless
Clear, colourless
Clear, colourless
Clear, colourless
Clear, colourless
Clear, colourless
Light brown
Clear, colourless
Light brown
Taste Tasteless
Tasteless
Tasteless
Tasteless
Salty taste
Salty taste
Salty taste
Salty taste
Salty taste
Odour Odourless
Odourless
Odourless
Odourless
Odourless
Undesirable odour
Undesirable odour
Odourless
Odourless
pH 6.9 6.9 7.3 7.5 7.5 7.7 7.9 8.3 8.0
Temperature (°C)
26.5 26.0 26.4 27.8 27.1 26.5 27..2 28.5 26.9
Fe2+ (mg/L) 0.75 1.5 1.85 1.65 2.1 3.1 2.81 3.51 2.72
Pb2+ (mg/L) 0.001 0.005 0.006 0.009 0.01 0.015 0.42 1.0 0.95
Cu2+ (mg/L) 0.65 0.5 1.57 1.57 2.89 2.05 0.31 2.15 0.98
Zn2+ (mg/L) 3.45 2.33 3.4 2.91 4.20 4.1 3.57 4.0 3.63
Groundwater Contaminats’ Investigation At Aarada Waste Disposal Site Using Geophysical And
www.iosrjournals.org 8 | Page
K+ (mg/L) 15.15 14.7 21.0 17.75 37.11 23.32 43.86 54.31 41.33
Na+ (mg/L) 13.45 18.23 27.31 31.15 57.27 40.32 53.97 59.98 55.76
Mg2+ (mg/L) 15.44 8.74 17.4 10.26 17.84 23.5 19.78 29.97 17.05
Cl- (mg/L) 9.95 17.5 21.53 37.5 39.67 49.7 60.25 65.33 61.57
SO42- (mg/L) 2.15 2.75 3.12 1.53 5.93 7.58 7.85 11.55 9.75
NO3- (mg/L) 5.77 14.96 19.39 23.75 31.65 87.97 90.50 97.98 93.24
HCO3- (mg/L) 6.87 5.3 5.7 7.89 10.5 15.13 23.75 37.93 26.42
CN- (mg/L) 0.33 0.35 0.42 0.35 0.49 0.83 0.96 3.15 3.76
Total Solids (mg/L)
1500 1575 1575 1565 1670 1740 1963 1800 1950
Total Dissolved Solids (mg/L)
779 750 840 900 1145 1300 1315 1345 1296
Suspended Solids (mg/L)
1270 1220 1250 1395 1410 1427 1400 1510 1515
DO (mg/L) 89.77 60.41 67.58 71.42 60.91 100.5 150.14 135.95 69.72
BOD (mg/L) 0.07 3.9 3.1 3.95 4.72 5.40 5.49 5.95 6.27
COD (mg/L) 0.32 3.1 3.51 3.27 4.21 4.15 5.13 6.0 6.95
Total
Hardness (mg/L)
63.72 59.73 35.52 67.83 78.57 65.75 81.35 89.79 90.65
Turbidity
(mg/L)
0.0 0.0 0.7 1.1 1.21 0.97 1.3 1.35 1.47
Conductivity (μS)
805 795 800 845 943 1320 1470 1495 1550
THBC (cfu/ml)
7 55 47 74 89 100 835 270 890
THFC
(cfu/ml)
Nil Nil Nil Nil Nil 3.78 4.76 3.97 6.43
Total coliform (cfu/ml)
Nil Nil Nil Nil Nil 0.97 2.13 1.15 5.0
Feacal coliform
(cfu/ml)
Nil Nil Nil Nil Nil Nil 3.3 Nil 3.78
Table 2: Summary of the results of the method employed and who standards of potable drinking water
Parameters Method Employed WHO Standard
Colour - Clear, colourless
Taste - Unobjectionable to consumers
Odour - Unobjectionable to consumers
Ph pH meter (APHA 4500 – H) 6.8 – 8.5
Temperature (°C) Thermometer 24.5 – 39.7
Fe2+ (mg/L) Atomic absorption spectrophotometry (APHA 3120 - B) 1.0
Pb2+ (mg/L) Atomic absorption spectrophotometry (APHA 3120 - B) 1.05
Cu2+ (mg/L) Atomic absorption spectrophotometry (APHA 3120 - B) 1.5
Zn2+ (mg/L) Atomic absorption spectrophotometry (APHA 3120 - B) 4.0
K+ (mg/L) Atomic absorption spectrophotometry (APHA 3500 - KB) 15
Na+ (mg/L) Atomic absorption spectrophotometry (APHA 3500 - NaB) 200
Mg2+ (mg/L) Atomic absorption spectrophotometry (APHA 3500 - MgB)
150
Cl- (mg/L) Titrimetry (APHA 4500 - B) 600
SO42- (mg/L) Spectrophotometry (APHA 4500 SO4B) 400
PO43- (mg/L) Spectrophotometry (APHA 4500 P) 250
Groundwater Contaminats’ Investigation At Aarada Waste Disposal Site Using Geophysical And
www.iosrjournals.org 9 | Page
NO3- (mg/L) Spectrophotometry (APHA 4500 NO3B) 50
CN- (mg/L) Titrimetry (APHA 4500 - B) 0.5
Total Dissolved Solids (mg/L)
Gravimetry (APHA 2540 - B) 1000
Suspended Solids (mg/L)
Spectrophotometry (APHA 2540 - D) 30
DO (mg/L) Titrimetry (APHA - O) -
BOD (mg/L) Titrimetry (APHA 5210 - B) 10
COD (mg/L) Titrimetry (APHA 5220 - B) 40
Total Hardness (mg/L)
Titrimetry (APHA 2340 - B) 500
Turbidity (mg/L) Turbidimeter (APHA 2130 - B) 5.0
Conductivity (μS) Conducting meter (APHA 2510 - B) 1500
V. Conclusions And Recommendation The electrical resistivity (Vertical Electrical Sounding) method was used to investigate the
contamination level and extent in the study area. The analysis of the VES survey revealed that leachate spread
out in all direction originating from the part of the refuse dumps with older wastes deposit polluting the nearby
hand dug wells it comes in contact with to a distance less than 10m from the waste body. The geoelectric
sections of the interpreted VES data delineated the leachate extent to a maximum depth of 5.4m in the
subsurface. The analysis of the hydro-physicochemical result conducted on the hand dug wells F, G, H and I
showed concentrations of organic and inorganic parameters tested exceeding World Health Organization’s
permissible limits. This is due to the fact that the depths of those wells terminated within the contaminated zone
indicating a high degree of pollution. However, the results obtained for the hand dug wells A, B, C, D and E
depicted non-detectable contamination level. The good condition of these sampled wells is due to their various depth of penetration which is greater than 5.4m and their distance from the waste disposal area (more than 10m
away). In addition, the close proximity of wells H and I to the cassava waste disposal site resulted to
anomalously high CN- concentration in their tested samples. In spite of these observations, good quality
drinking water can still be obtained in the research area by drilling wells to greater depth of penetration. This
will highly slow down the rate at which contamination plumes infiltrates the groundwater resources in the area.
Also, the assessment of the research site and analysis of water samples from hand dug wells in the area should
be carried out periodically. This will enhance continuous consumption of good water quality. Moreover, the
result of the hydro-physicochemical analysis conducted on the hand-dug well located within the hospital
situated less than 4m away from the waste disposal site shows high total coliform counts. It is therefore
suggested that the hospital should be evacuated so that patients seeking health care delivery system in the clinic
will not have their health problems compounded. This research work enlightens the residence in and around the
refuse dumpsite facility on how to obtain contaminant-free groundwater. This study also reveals the importance of using geophysical and hydro-physicochemical approach for acquiring the physical and chemical properties of
a waste disposal site on the quality of groundwater. The employment of different techniques allows the
resolution of possible discrepancies and reveals the most accurate description of a waste disposal site’s
characteristics.
Acknowledgements
The authors are grateful to God for the success of this research. We are also indebted to the Department
of Pure and Applied Physics, Ladoke Akintola University of Technology, Ogbomoso for giving us conducive
atmosphere for research. Two out of the authors (Mr. T.A. Adagunodo and Mr. E.R. Olafisoye) are grateful to
the Board of Post Graduate School, Ladoke Akintola University of Technology, Ogbomoso, Nigeria for the
financial support given at the middle stage of this research.
References [1] Adagunodo T.A. and Sunmonu L.A. (2012). Estimation of overburden thickness of Industrial Estate Ogbomoso, Southwestern
Nigeria. Advances in Applied Sciences Research, 3(5), 3129-3141.
[2] Ajayi O, Adegoke-Anthony CW (1988): Groundwater prospects in the basement complex rocks of Southwestern Nigeria: Journal of
African Earth sciences, vol. 7, No1, pp 227-235
[3] Akinloye MK, Fadipe DO, Adabanija MA (2002): A radiometric mapping of the Ladoke Akintola University Campus, Ogbomoso,
Southwestern Nigeria: Science focus vol. 1 pp 55-61
[4] Dodds AR, Ivic D (1988): Integrated Geophysical Methods Used for Groundwater Studies in the Murray Basin, South Australia. In:
Geotechnical and Environmental Studies. Geophysics, Vol. II. Soc. Explor Geophys.: Tulsa, OK. 303-310
[5] Folami SL (1992): Interpretation of Aeromagnetic Anomalies in Iwaraja Area, Southwestern Nigeria. Journal of Mining and Geology
28(2) 391-396
[6] Karlik G, Kaya, AM (2001): Investigation of groundwater contamination using electric and electromagnetic methods at an open
waste –disposal site: a case study from Isparta, Turkey. Environmental Geology 2001: 40(6):725-731.

Groundwater Contaminats’ Investigation At Aarada Waste Disposal Site Using Geophysical And
www.iosrjournals.org 10 | Page
[7] Keller GV, Frishchncht FC (1966): Electrical Methods in Geophysical Prospecting. Pergamon Press: New York, NY. 96.
[8] Koefoed O (1979): Geosounding Principles, 1. Resistivity Sounding Measurements. Elsevier Scientific Publishing: Amsterdam,
Netherlands. 275.
[9] Lashkarripour GR (2003): An investigation of Groundwater Condition by Geoelectrical Resistivity Method: A Case study in Korin
Aquifer, Southeast, Iran. Journal of Spacial Hydrology. 3(1): 1-5
[10] Mukhtar IS, Abdullatif P, Hanafi M (2000): Detection of groundwater pollution using Resistivity imaging at Seri Petang landfill,
Malaysia. Journal of Environmental Hydrology 2000: 8: 1-8
[11] Omosuyi GO, Adeyemo A, Adegoke AO (2007): Investigation of Groundwater Prospect using Electromagnetic and Geoelectric
Sounding at Afunbiowo, near Akure, Southwestern Nigeria
[12] Orellana E, Mooney HM (1966): "Master Tables and Curves for Vertical Electrical Sounding over layered Structures". Interciencis,
Madrib.
[13] Porsani L, Filho WM, Ellis VR, Shimlis JD, Moura HP (2004):The use of GRR & VES in delineating a contamination plume in a
landfill site. A case study in SE Brazil. Journal of Applied Geophysics 2004: l55: 199 – 209
[14] Rahaman MA (1976): Review of Basement Geology of Southwestern Nigeria, Elizaberthan Publishing Company, Nigeria pp 41 -58
[15] Schwarz SD (1988): Application of Geophysical Methods to Groundwater exploration in the Tolt River Basin, Washington State. In:
Geotechnical and Environmental Studies. Geophysics, Vol. II. Soc. Explor Geophys.: Tulsa, OK. 213-217
[16] Vander Velpen BPA (1988): "Resist Version 1.0" M.Sc. Research Project. ITC: Delft, Netherlands.
[17] World Health Organization (1992): Guidelines for drinking water quality (WHO Geneva 1992)
[18] Zohdy AAR (1965): "The Auxilliary Point Method of Electrical sounding Interpretation and its Relationship to Dar Zorrouk
Parameters". Geophysics. 30: 644-650
[19] Zohdy AAR, Eaton GP, Mabey DR (1974): Application of Surface Geophysics to Groundwater Investigations. Techniques of Water
Resources Investigations of U.S. Geol. Survey: Book 2, Chapter DI. U.S. Government Printing Office: Washington, D.C. 66