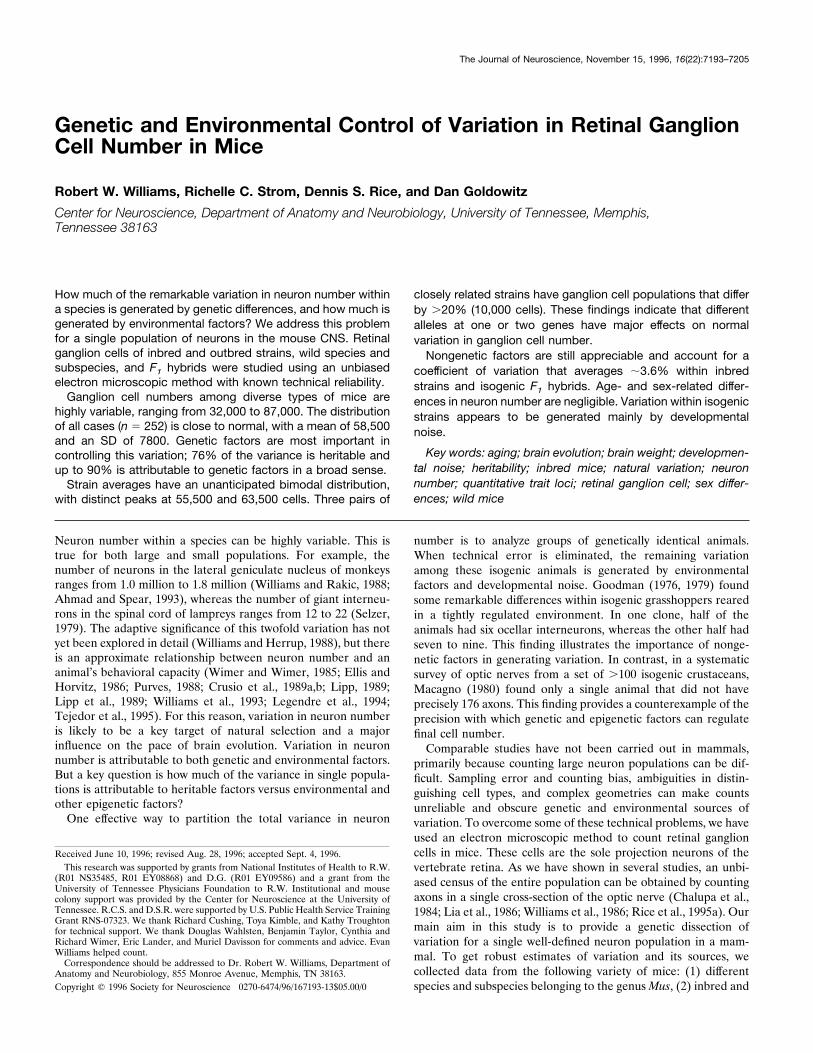
Genetic and Environmental Control of Variation in Retinal Ganglion Cell Number in Mice
13
Genetic and Environmental Control of Variation in Retinal Ganglion Cell Number in Mice Robert W. Williams, Richelle C. Strom, Dennis S. Rice, and Dan Goldowitz Center for Neuroscience, Department of Anatomy and Neurobiology, University of Tennessee, Memphis, Tennessee 38163 How much of the remarkable variation in neuron number within a species is generated by genetic differences, and how much is generated by environmental factors? We address this problem for a single population of neurons in the mouse CNS. Retinal ganglion cells of inbred and outbred strains, wild species and subspecies, and F 1 hybrids were studied using an unbiased electron microscopic method with known technical reliability. Ganglion cell numbers among diverse types of mice are highly variable, ranging from 32,000 to 87,000. The distribution of all cases (n 5 252) is close to normal, with a mean of 58,500 and an SD of 7800. Genetic factors are most important in controlling this variation; 76% of the variance is heritable and up to 90% is attributable to genetic factors in a broad sense. Strain averages have an unanticipated bimodal distribution, with distinct peaks at 55,500 and 63,500 cells. Three pairs of closely related strains have ganglion cell populations that differ by .20% (10,000 cells). These findings indicate that different alleles at one or two genes have major effects on normal variation in ganglion cell number. Nongenetic factors are still appreciable and account for a coefficient of variation that averages ;3.6% within inbred strains and isogenic F 1 hybrids. Age- and sex-related differ- ences in neuron number are negligible. Variation within isogenic strains appears to be generated mainly by developmental noise. Key words: aging; brain evolution; brain weight; developmen- tal noise; heritability; inbred mice; natural variation; neuron number; quantitative trait loci; retinal ganglion cell; sex differ- ences; wild mice Neuron number within a species can be highly variable. This is true for both large and small populations. For example, the number of neurons in the lateral geniculate nucleus of monkeys ranges from 1.0 million to 1.8 million (Williams and Rakic, 1988; Ahmad and Spear, 1993), whereas the number of giant interneu- rons in the spinal cord of lampreys ranges from 12 to 22 (Selzer, 1979). The adaptive significance of this twofold variation has not yet been explored in detail (Williams and Herrup, 1988), but there is an approximate relationship between neuron number and an animal’s behavioral capacity (Wimer and Wimer, 1985; Ellis and Horvitz, 1986; Purves, 1988; Crusio et al., 1989a,b; Lipp, 1989; Lipp et al., 1989; Williams et al., 1993; Legendre et al., 1994; Tejedor et al., 1995). For this reason, variation in neuron number is likely to be a key target of natural selection and a major influence on the pace of brain evolution. Variation in neuron number is attributable to both genetic and environmental factors. But a key question is how much of the variance in single popula- tions is attributable to heritable factors versus environmental and other epigenetic factors? One effective way to partition the total variance in neuron number is to analyze groups of genetically identical animals. When technical error is eliminated, the remaining variation among these isogenic animals is generated by environmental factors and developmental noise. Goodman (1976, 1979) found some remarkable differences within isogenic grasshoppers reared in a tightly regulated environment. In one clone, half of the animals had six ocellar interneurons, whereas the other half had seven to nine. This finding illustrates the importance of nonge- netic factors in generating variation. In contrast, in a systematic survey of optic nerves from a set of .100 isogenic crustaceans, Macagno (1980) found only a single animal that did not have precisely 176 axons. This finding provides a counterexample of the precision with which genetic and epigenetic factors can regulate final cell number. Comparable studies have not been carried out in mammals, primarily because counting large neuron populations can be dif- ficult. Sampling error and counting bias, ambiguities in distin- guishing cell types, and complex geometries can make counts unreliable and obscure genetic and environmental sources of variation. To overcome some of these technical problems, we have used an electron microscopic method to count retinal ganglion cells in mice. These cells are the sole projection neurons of the vertebrate retina. As we have shown in several studies, an unbi- ased census of the entire population can be obtained by counting axons in a single cross-section of the optic nerve (Chalupa et al., 1984; Lia et al., 1986; Williams et al., 1986; Rice et al., 1995a). Our main aim in this study is to provide a genetic dissection of variation for a single well-defined neuron population in a mam- mal. To get robust estimates of variation and its sources, we collected data from the following variety of mice: (1) different species and subspecies belonging to the genus Mus, (2) inbred and Received June 10, 1996; revised Aug. 28, 1996; accepted Sept. 4, 1996. This research was supported by grants from National Institutes of Health to R.W. (R01 NS35485, R01 EY08868) and D.G. (R01 EY09586) and a grant from the University of Tennessee Physicians Foundation to R.W. Institutional and mouse colony support was provided by the Center for Neuroscience at the University of Tennessee. R.C.S. and D.S.R. were supported by U.S. Public Health Service Training Grant RNS-07323. We thank Richard Cushing, Toya Kimble, and Kathy Troughton for technical support. We thank Douglas Wahlsten, Benjamin Taylor, Cynthia and Richard Wimer, Eric Lander, and Muriel Davisson for comments and advice. Evan Williams helped count. Correspondence should be addressed to Dr. Robert W. Williams, Department of Anatomy and Neurobiology, 855 Monroe Avenue, Memphis, TN 38163. Copyright q 1996 Society for Neuroscience 0270-6474/96/167193-13$05.00/0 The Journal of Neuroscience, November 15, 1996, 16(22):7193–7205
Transcript of Genetic and Environmental Control of Variation in Retinal Ganglion Cell Number in Mice
Genetic and Environmental Control of Variation in Retinal GanglionCell Number in Mice
Robert W. Williams, Richelle C. Strom, Dennis S. Rice, and Dan Goldowitz
Center for Neuroscience, Department of Anatomy and Neurobiology, University of Tennessee, Memphis,Tennessee 38163
How much of the remarkable variation in neuron number withina species is generated by genetic differences, and how much isgenerated by environmental factors? We address this problemfor a single population of neurons in the mouse CNS. Retinalganglion cells of inbred and outbred strains, wild species andsubspecies, and F1 hybrids were studied using an unbiasedelectron microscopic method with known technical reliability.Ganglion cell numbers among diverse types of mice are
highly variable, ranging from 32,000 to 87,000. The distributionof all cases (n 5 252) is close to normal, with a mean of 58,500and an SD of 7800. Genetic factors are most important incontrolling this variation; 76% of the variance is heritable andup to 90% is attributable to genetic factors in a broad sense.Strain averages have an unanticipated bimodal distribution,
with distinct peaks at 55,500 and 63,500 cells. Three pairs of
closely related strains have ganglion cell populations that differby .20% (10,000 cells). These findings indicate that differentalleles at one or two genes have major effects on normalvariation in ganglion cell number.Nongenetic factors are still appreciable and account for a
coefficient of variation that averages ;3.6% within inbredstrains and isogenic F1 hybrids. Age- and sex-related differ-ences in neuron number are negligible. Variation within isogenicstrains appears to be generated mainly by developmentalnoise.
Key words: aging; brain evolution; brain weight; developmen-tal noise; heritability; inbred mice; natural variation; neuronnumber; quantitative trait loci; retinal ganglion cell; sex differ-ences; wild mice
Neuron number within a species can be highly variable. This istrue for both large and small populations. For example, thenumber of neurons in the lateral geniculate nucleus of monkeysranges from 1.0 million to 1.8 million (Williams and Rakic, 1988;Ahmad and Spear, 1993), whereas the number of giant interneu-rons in the spinal cord of lampreys ranges from 12 to 22 (Selzer,1979). The adaptive significance of this twofold variation has notyet been explored in detail (Williams and Herrup, 1988), but thereis an approximate relationship between neuron number and ananimal’s behavioral capacity (Wimer and Wimer, 1985; Ellis andHorvitz, 1986; Purves, 1988; Crusio et al., 1989a,b; Lipp, 1989;Lipp et al., 1989; Williams et al., 1993; Legendre et al., 1994;Tejedor et al., 1995). For this reason, variation in neuron numberis likely to be a key target of natural selection and a majorinfluence on the pace of brain evolution. Variation in neuronnumber is attributable to both genetic and environmental factors.But a key question is how much of the variance in single popula-tions is attributable to heritable factors versus environmental andother epigenetic factors?One effective way to partition the total variance in neuron
number is to analyze groups of genetically identical animals.When technical error is eliminated, the remaining variationamong these isogenic animals is generated by environmentalfactors and developmental noise. Goodman (1976, 1979) foundsome remarkable differences within isogenic grasshoppers rearedin a tightly regulated environment. In one clone, half of theanimals had six ocellar interneurons, whereas the other half hadseven to nine. This finding illustrates the importance of nonge-netic factors in generating variation. In contrast, in a systematicsurvey of optic nerves from a set of .100 isogenic crustaceans,Macagno (1980) found only a single animal that did not haveprecisely 176 axons. This finding provides a counterexample of theprecision with which genetic and epigenetic factors can regulatefinal cell number.Comparable studies have not been carried out in mammals,
primarily because counting large neuron populations can be dif-ficult. Sampling error and counting bias, ambiguities in distin-guishing cell types, and complex geometries can make countsunreliable and obscure genetic and environmental sources ofvariation. To overcome some of these technical problems, we haveused an electron microscopic method to count retinal ganglioncells in mice. These cells are the sole projection neurons of thevertebrate retina. As we have shown in several studies, an unbi-ased census of the entire population can be obtained by countingaxons in a single cross-section of the optic nerve (Chalupa et al.,1984; Lia et al., 1986; Williams et al., 1986; Rice et al., 1995a). Ourmain aim in this study is to provide a genetic dissection ofvariation for a single well-defined neuron population in a mam-mal. To get robust estimates of variation and its sources, wecollected data from the following variety of mice: (1) differentspecies and subspecies belonging to the genusMus, (2) inbred and
Received June 10, 1996; revised Aug. 28, 1996; accepted Sept. 4, 1996.This research was supported by grants from National Institutes of Health to R.W.
(R01 NS35485, R01 EY08868) and D.G. (R01 EY09586) and a grant from theUniversity of Tennessee Physicians Foundation to R.W. Institutional and mousecolony support was provided by the Center for Neuroscience at the University ofTennessee. R.C.S. and D.S.R. were supported by U.S. Public Health Service TrainingGrant RNS-07323. We thank Richard Cushing, Toya Kimble, and Kathy Troughtonfor technical support. We thank Douglas Wahlsten, Benjamin Taylor, Cynthia andRichard Wimer, Eric Lander, and Muriel Davisson for comments and advice. EvanWilliams helped count.Correspondence should be addressed to Dr. Robert W. Williams, Department of
Anatomy and Neurobiology, 855 Monroe Avenue, Memphis, TN 38163.Copyright q 1996 Society for Neuroscience 0270-6474/96/167193-13$05.00/0
The Journal of Neuroscience, November 15, 1996, 16(22):7193–7205

isogenic laboratory mice, (3) isogenic but heterozygous F1 prog-eny generated by crossing inbred strains, and (4) groups of genet-ically heterogeneous mice that have a level of genetic variabilitycloser to that found in natural populations.
MATERIALS AND METHODSTissue was taken from 252 mice belonging to 31 different strains (Fig. 1).Most animals were shipped directly from the Jackson Laboratory (BarHarbor, ME). The male:female ratio of all cases was 0.9 but variedconsiderably among strains, from 1:5 in strain AKR/J to 5:1 in PLSJF1.The age of mice ranged from 21 to 329 d. Animals were fed a 6% fatNational Institutes of Health 31 diet at the Jackson Laboratory and a 5%fat Agway Prolab 3000 rat and mouse chow at the University of Tennes-see. Colonies were maintained at 20–248C on a 14:10 hr light/dark cyclein a pathogen-free environment.Standard inbred strains. Standard inbred laboratory strains of mice (Fig.
1, yellow group) are derived from domesticated hybrids generated fromcrosses between Mus musculus domesticus (also known as M. domesticus)and M. musculus molossinus (Bonhomme, 1992). The standard strains westudied have been inbred by successive sibling matings for .80 genera-tions (Festing, 1993). Animals are therefore homozygous at essentially allloci. C57BL/6JAx1 is a provisional, nonstandard nomenclature we haveintroduced (see Results) to designate animals obtained from the JacksonLaboratory Annex 1 colony between 1994 and 1995.Wild strains (Fig. 1, bottom panel). We studied the following four
species of mice: (1) M. musculus, the common house mouse, a wide-ranging and highly adaptable commensal species from which laboratorymice are derived (Bronson, 1984); (2) M. spretus (SPRET/Ei), a short-tailed field mouse distributed around the western Mediterranean; (3) M.spicilegus (PANCEVO/Ei), a colonial mound-building species from theBalkans and Ukraine; and (4) M. caroli (CARL/ChGo), a small tropicalEast Asian species (Fig. 1, bottom group) (see Table 2). We also studiedthe following four subspecies of M. musculus: (1) M. m. castaneus(CAST/Ei and CASA/Rk), a South East Asian subspecies; (2) M. m.musculus (CZECHII/Ei), the commensal Eastern European and Asiaticmouse; (3) M. m. molossinus (MOLD/Rk), a Japanese hybrid subspecies;and (4) M. m. domesticus (WSB/Ei), the commensal and very widelydispersed subspecies of Western Europe and the Americas (Fig. 1, bottomgroup) (see Table 2). Seven of these wild strains have been inbred for.16generations at the Jackson Laboratory. The exception is CARL/ChGo, anoutbred wild sample of Mus caroli maintained since the mid-1970s as acolony of 5 to 10 breeding pairs with specific avoidance of sibling mating(V. Chapman, personal communication). The evolutionary relations andecological characteristics of these species are reviewed in Bonhomme andGuenet (1989), Nowak (1991), and Bonhomme (1992).Genetically heterogeneous mice. Two types of mice included in this study
are genetically heterogeneous. One is referred to as CD-1 or ICR(Hsp:ICR). This strain has been bred for high fecundity and fitness(Eaton, 1980) and is maintained by random nonsibling matings at HarlanSprague Dawley (Indianapolis, IN). The other is CARL/ChGo, describedabove in Wild strains.Isogenic F1 hybrids. We studied six sets of isogenic F1 hybrids (Fig. 1,
light green). Four of these were hybrids between a BALB/cJ parent andeither an A/J, C57BL/6J, C57BL/6JAx1, or CAST/Ei parent. They arereferred to as CB6F1/J (a BALB/cJ female crossed to a C57BL/6J male),B6AxCF1 (the cross between a C57BL/6JAx1 female and a BALB/cJmale), CAF1 (BALB/cJ female by A/J male), and BCF1 (BALB/cJ femaleby CAST/Ei male). We also examined the PLSJF1, the progeny of a crossbetween PL/J and SJL/J. The final F1 is called 32CASF1 and is from across between a female BXD32 and a male CAST/Ei. BXD32 wasselected for this cross, because it has an extremely high ganglion cellnumber (75,700 6 2200) (Williams et al., 1995). The CAF1, CB6F1, andPLSJF1 were obtained from the Jackson Laboratory. The B6AxCF1,BCF1, and 32CASF1 progeny were generated in our colony. In this paper,we treat all of the F1 hybrids and the fully inbred strains as isogenic.Mutants. Several strains carry mutations that affect the retina. Five
strains that we studied (C3H/HeJ, CD-1, PL/J, SJL/J, and MOLD/Rk)carry the retinal degeneration allele, rd, at the b-phosphodiesterase locus.These strains lose virtually all photoreceptors by 2 months of age. Withthe exception of MOLD/Rk, all rd strains have normal nerves, and severalhave high ganglion cell populations. Eight of the strains we used arealbinos and have a reduced proportion of retinal ganglion cells withuncrossed projections (A/J, AKR/J, BALB/cBy, BALB/cJ, CD-1, 129/J,
NZW/LacJ, SJL/J) (see Rice et al., 1995a). We have not found anycorrelation between pigmentation and total ganglion cell number.Fixation and processing of tissue. Mice were anesthetized with Avertin
(0.5–0.8 ml, i.p.) and were perfused transcardially with 0.9% salinefollowed by fixative. Approximately 15 ml of 1.25% glutaraldehyde and1.0% paraformaldehyde in 0.1 M phosphate buffer was injected for 2–4min. An additional 10 ml of double-strength fixative (2.5% glutaralde-hyde and 2.0% paraformaldehyde in the same buffer) was injected for 1–2min at an increased flow rate. The head was removed and put in fixativeovernight and in 0.1 M phosphate buffer the following morning. Opticnerves were dissected and were subsequently osmicated and embedded inSpurr’s resin. For most cases, the brains, including olfactory bulb, weredissected free, trimmed just behind the cerebellum, and weighed. Thinsections of either or both nerves were placed on Formvar-coated slotgrids and stained with uranyl acetate and lead citrate. The nerves wereexamined and photographed on a JEOL EX2000II microscope using asystematic sampling protocol (Fig. 2A) (Deming, 1950).Magnification was calibrated by photographing a grid replica (# 80051,
2160 lines/mm, EMS, Fort Washington, PA) at the conclusion of everyphotography session. The procedure was performed in the followingsequence. (1) A set of 20 or more high-magnification micrographs wereusually taken at 12,0003 magnification (Fig. 2C) in a square latticepattern. No adjustments in position were made with respect to bloodvessels or glial cells. (2) The calibration grid was photographed at thesame high magnification (Fig. 2D). (3) The calibration grid was repho-tographed at a low magnification, usually 200 or 2503 (Fig. 2B). (4) Thethin section of the entire nerve was photographed at the same low power(Fig. 2A).Counting. A counting frame (63 3 86 mm) was traced on the 75 3 100
mm negatives with a fine marker pen, and all axons within the frame andintersecting the upper and right edges were marked and counted on thenegative using standard unbiased counting rules (Fig. 2C) (Gundersen,1977). The typical sample area gave a count of 25 axons, and the typicalset of samples from one session gave a total count of 500 axons. From 2to 50% of axons in the adult mouse optic nerve are unmyelinated (higherpercentages are found only in sections cut close to the lamina cribrosa).All negatives were counted on a light box with the aid of magnifyingglasses (2.53 Optivisor, Donegan Optical). The effective magnificationwas therefore above 25,0003. All counts were double-checked. To esti-mate the total axon population, the average density of axons was multi-plied by the area of the nerve cross-section. The SE of each estimate wascomputed from the variance of the set of micrograph counts. When twoor more independent samples were obtained from adjacent sections, theyoften had surprisingly different sampling errors. These independent sam-ples were weighted by the inverse of their variance; samples with lowvariance were given more weight (Bevington and Robinson, 1992). Thiswas done using the equations:
x 5
Oi51
n
~xi/si2 !
Oi51
n
~1/si2 !
and s2 51
Oi51
n
~1/si2 !
,
where x# is the best estimate of the average, and s2 is the cumulativeestimate of the variance based on n independent samples, each with anaverage xi and variance si
2.Quantitative genetics. The variation of a complex trait such as neuron
number is the sum of genetic and environmental variation (Roderick andSchlager, 1966; Falconer, 1989; Kearsey and Pooni, 1996). The geneticcomponent Vg can be split into three parts: (1) additive gene effects (Va,the heritable component); (2) dominance effects among alleles at singleloci (Vd); and (3) epistatic interactions between alleles at unlinked loci(Vi). The environmental variance Ve can be divided into a componentassociated with external environmental factors (nutrition, temperature,health, etc.) and a component associated with internal differences in thecellular environment that is often called developmental noise (Wadding-ton, 1957; Gavrilets and Hastings, 1994). There are also effects that arisefrom interactions between genetic and environmental factors (Wahlsten,1989). These are especially important in natural populations that occupya wide range of habitats (Bronson, 1984). But in a tightly controlledlaboratory environment, interaction effects and covariances between ge-netic and nongenetic variables can be minimized and are usually ignored.Finally, much of the variation may be caused by technical and sampling
7194 J. Neurosci., November 15, 1996, 16(22):7193–7205 Williams et al. • Genetic Control of Neuron Number

Figure1.
Lineagechartofstrains,species,andsubspeciesofmiceinrelationtovariationinretinalganglioncellnumber.Majorcategoriesofmiceareindicatedontheleftandaredescribed
brieflyinMaterialsandMethods.Numbersassociatedwitheachstrainaretheaverage,SEM,andnumberofcases.ForotherfeaturesrefertotheKey.
Williams et al. • Genetic Control of Neuron Number J. Neurosci., November 15, 1996, 16(22):7193–7205 7195

Figure 2. A set of four marked contact prints (1:1 reproduction) of negatives used to generate estimates of ganglion cell number. A and B are matchedlow-power electron micrographs of the ultrathin section (A) and the calibration grid (B). C and D are matched high-power micrographs of a sample site(see asterisk in A) and a high-magnification calibration. The series of white spots in A are regions bleached during the high-magnification sampling. Theoutline of the nerve was traced on the negative (A) under a dissecting microscope. The boundary was drawn across the outer rank of axons, even if thatinvolved an occasional intrusion into the nerve. The area of the nerve was computed by tracing this boundary using a calibrated digitizing tablet two ormore times (see faint numbers, top left in A). The asterisk in A marks the site illustrated at higher magnification in C. Two sites marked by arrows on thecalibration negative (B) have been measured. The top site (inset in B) is illustrated at higher magnification. A series of 41 marks, spanning 80 grid units,were made with a small scalpel. The separation between endpoints was measured under a dissecting microscope with a digital caliper accurate to 10 mm.Distances on all calibration negatives were measured two or four times in the two orthogonal axes of the grid. C is one of the sample negatives thatillustrates the counting frame ( faint white rectangle) in which 45 myelinated and 3 unmyleinated fibers were counted. D is the calibration micrograph usedto compute the sample area counted in C. The grid dimensions in D are 0.463 3 0.463 mm.
7196 J. Neurosci., November 15, 1996, 16(22):7193–7205 Williams et al. • Genetic Control of Neuron Number

errors (Vt). In sum, the total phenotypic variance in neuron number, Vp,can be expressed as Vp 5 Va 1 Vd 1 Vi 1 Ve 1 Vt.In this study, we have generated estimates of Vp, Va, Ve, Vt, and Vg (the
sum of Va, Vd, and Vi). Calculation of variance estimates follows methodsoutlined in Falconer (1989) and Stansfield (1991). Vp for the 17 inbredstrains is the variance of the 136 cases listed in Table 3. The environ-mental variance, Ve, is equal to the average variance within isogenic andinbred strains, Vw, minus the technical variance, Vt. The variance terms inthe equation, Ve 5 Vw2Vt, can be calculated directly, or they can becalculated as the squares of coefficients of variation. The latter method isoften preferred, because it is insensitive to large differences in absolutecell number. Vg is equal to Vp minus all nongenetic variance (Ve 1 Vt). Tocalculate Va, we first estimate the variance of the 17 strain averages, Vb.Va equals Vb 2 (Ve 1 Vt)/n, where n is the harmonic average of cases perstrain. Vt was estimated by replicating counts. Gene dominance, heterosis,and inbreeding depression were estimated from the F1 heterozygotes andby comparing inbred and outbred populations (Falconer, 1989).Heritability. We have used a method advanced by Hegmann and Pos-
sidente (1981) in which heritability in the narrow sense, h2, is computedfrom data collected from a randomly selected set of inbred strains. The 17inbred strains included in this study were chosen without reference to anypreexisting information on ganglion cell population size, brain weight, oreven body size. To compute heritability, we solved the equation h2 51/2(Va)/[1/2(Va) 1 Ve], in which Va is the variance between inbred strainsand Ve is the average environmental variance within isogenic stains. Va isdivided by 2, because the heterozygotes are eliminated during the processof inbreeding. This loss of the intermediate heterozygotes leads to atwofold increase in the additive genetic variance compared with thefounder population. The variance and SD of the estimate of h2 wascomputed using a jackknife procedure (Mosteller and Tukey, 1977). Thisinvolved calculating heritabilities for 17 subsets of data, each missing datafrom one strain (h(2i)). The jackknife variance is
VJK ~h2 ! 5n 2 1n O
i51
n
~h~2i! 2 h~z! !2 ,
where h# (z) is the mean heritability of the 17 subsets.An estimate of broad-sense heritability was computed by taking the
ratio of the average variance within the two outbred groups of mice(CD-1 and CARL/ChGo) to the average variance, Ve, within all isogeniclaboratory strains (Vogel and Motulsky, 1986; Crusio, 1992). As ex-plained in Results, coefficients of variation were used to compute thisvalue. Total genetic determination, v2, was also estimated using theformula:
v2 5F 2 1
F 1 ~dfw 1 1!/dfb,
where F is the F ratio and dfw and dfb are the degrees of freedom withinand between inbred strains (Wahlsten, 1992).Heritability estimates are based on ratios between genetic and nonge-
netic variance. Consequently, minimizing environmental variance in-creases measured heritability. In this study, all mice were reared in apathogen-free laboratory environment, a situation that eliminates manyenvironmental differences and almost certainly increases estimates ofgenetic control compared with dispersed populations of mice in the wild.We did include mice having a wide range of ages and both sexes andtaken from different litters and different mothers within strains. There-fore, the samples of mice we studied will be representative of mostlaboratory colonies.Reliability and accuracy of estimates. A set of 69 nerves were counted
two to four times to estimate the cumulative error of our estimates ofganglion cell number. All of these replicate counts are listed in Table 1within parentheses. Usually, an adjacent thin section was photographedand counted months to several years after the original sample, often bydifferent personnel. The average of all first counts was 58,967 6 1145,whereas that of second counts was 58,667 6 1361. The test–retest reli-ability coefficient, rTX, was 0.83. The mean difference between pairs ofestimates was 4080, and the average SD of sets of replicates was 3116.SDs based on samples of two or three replicates underestimate popula-tion SDs by 25 and 13%, respectively (Sokal and Rohlf, 1981). Thecorrected technical SD is 3780. The technical coefficient of variation forindividual samples of ;25 micrographs averaged 6.3 6 0.5% SE. Weestimate that 60–70% of all technical variance is associated with sampling
error and the relatively small number of micrographs used to determineaverage axon density, whereas most of the remaining technical variancewas attributable to calibration and measurement error.Independent confirmation of count accuracy. Counts of peroxidase-
labeled ganglion cells in 17 cases (for methods, see Rice et al., 1995a)confirm the accuracy of the electron microscopic method for estimatingganglion cell number. The average axon count for these cases was57,474 6 1766 SE; the estimates based on counting peroxidase-labeledganglion cell bodies in these same cases averaged 55,850 6 2007, aninsignificant difference.
RESULTSNeuron number, age, sex, and brain and body weightDistribution of individual valuesThe ganglion cell population of mice averages 58,500 6 500 SE(n 5 252). The distribution is unimodal and has an SD of 7800(Fig. 3). We have included a wide diversity of types of mice (Fig.1) and for this reason, the distribution might have been expectedto have extended tails. However, near normality extends over arange of ;4 SDs. There is a small but significant deficit in theexpected number of cases with populations close to the average(Fig. 3, asterisk) that gives the distribution a slightly flattenedshape compared with the expected Gaussian distribution. Thisdeviation has a straightforward explanation; we sampled manyhomozygous mice (Table 1) that tend to have extreme pheno-types.
Age and the ganglion cell populationThe average longevity of mice from different strains ranges from300 to 850 d (Green and Witham, 1992). Our estimates weretaken from mice averaging 85 d old but with a range extendingfrom 21 to 329 d. The 82 youngest mice (,48 d old) had anaverage population of 59,124 6 686 (SE), whereas the 84 oldestanimals (.180 d old) had an average population of 58,5456 1027(SE). Both of these groups contained a wide mix of strains. Asexpected from the insignificant difference between young and oldgroups, the correlation coefficient across all cases between neuronnumber and age was close to zero (r 5 20.08, n 5 234, the 95%confidence interval of r extends from 20.21 to 10.05).
Sex and the ganglion cell populationThere are no detectible sex differences in retinal ganglion cellnumber. The average population for 133 females is 58,522 6 674SE (average age, 87 6 6 d; body weight, 18 6 1 gm; brain weight,427 6 6 mg), whereas that for 119 males is 58,503 6 714 SE(average age, 82 6 6 d; body weight, 20.7 6 1 gm; brain weight,431 6 5 mg).
Brain and body weight and the ganglion cell populationAre differences in ganglion cell numbers among mice associatedwith differences in brain weight? The correlation between neuronnumber and brain weight across all individual cases for which bothparameters were measured is 0.34 (n 5 176, 95% confidenceinterval of r extends from 0.20 to 0.46). The corresponding cor-relation between neuron number and body weight is only 0.17(range of r from 10.02 to 10.31). Correlations between brainweight and ganglion cell number are somewhat higher when strainaverages are analyzed. The correlation is 10.56 for the group of 7species and subspecies in Table 2 and 10.59 for the group of 17standard inbred strains in Table 3. Correlations between neuronnumber and body weight are 10.25 (wild strains) and 10.45(standard strains). An important conclusion from this analysis isthat ;30% of the variance in ganglion cell number may beassociated, directly or indirectly, with differences in brain weight.
Williams et al. • Genetic Control of Neuron Number J. Neurosci., November 15, 1996, 16(22):7193–7205 7197
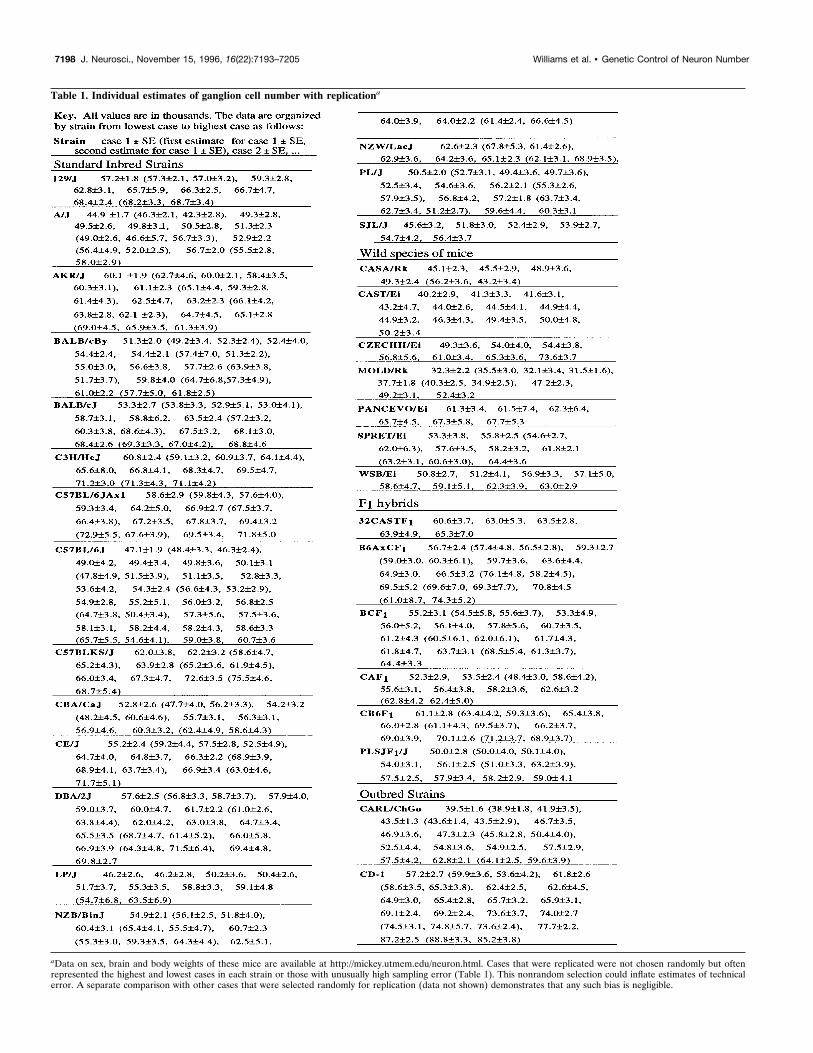
Table 1. Individual estimates of ganglion cell number with replicationa
aData on sex, brain and body weights of these mice are available at http://mickey.utmem.edu/neuron.html. Cases that were replicated were not chosen randomly but oftenrepresented the highest and lowest cases in each strain or those with unusually high sampling error (Table 1). This nonrandom selection could inflate estimates of technicalerror. A separate comparison with other cases that were selected randomly for replication (data not shown) demonstrates that any such bias is negligible.
7198 J. Neurosci., November 15, 1996, 16(22):7193–7205 Williams et al. • Genetic Control of Neuron Number
Relationship between brain weight and neuron number withinisogenic strainsThe correlations calculated above are strongly affected by thegenetic differences among mice. This genetic component can beeliminated by examining correlations within isogenic strains.Differences in environmental factors, particularly differences inthe quality of maternal care, might be expected to producecommon effects on brain weight and neuron number evenwithin a single inbred strain. To perform this analysis across allisogenic cases, we computed individual z scores for brainweight and cell number using strain averages and SDs. Thiseffectively eliminates genetic sources of correlation betweenthese variables, leaving only the environmental factors to pro-duce a correlation. The resulting correlation between normal-
ized scores of brain weight and neuron number is very close tozero (r 5 0.017, n 5 178). This demonstrates convincingly thatthe environmental factors to which laboratory-reared mice areexposed do not have common effects on retinal ganglion cellnumber and brain weight. The moderate positive correlationbetween brain weight and neuron number noted above whenstrains are compared is therefore attributable to genetic factorsthat affect both parameters.
Survey of differences among species, subspecies, andstrains of miceVariation among species and subspeciesWe examined animals belonging to four different species of thesubgenus Mus (Nowak, 1991; Bonhomme, 1992). The ganglion
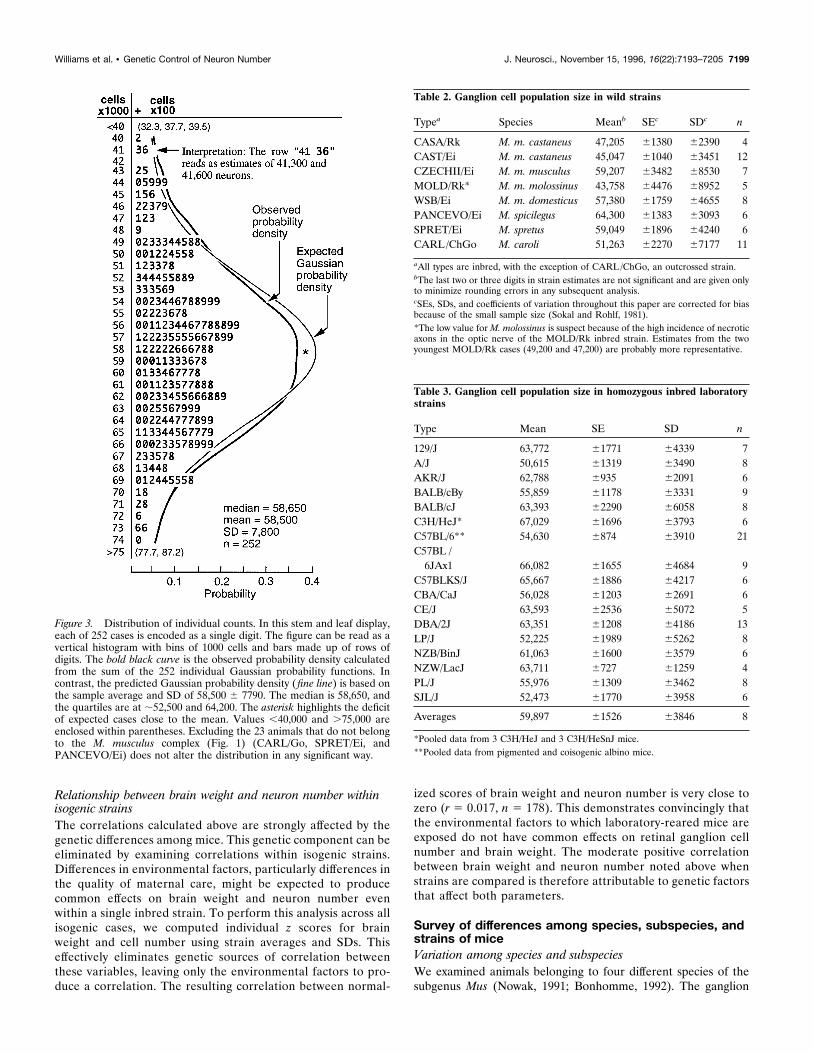
Figure 3. Distribution of individual counts. In this stem and leaf display,each of 252 cases is encoded as a single digit. The figure can be read as avertical histogram with bins of 1000 cells and bars made up of rows ofdigits. The bold black curve is the observed probability density calculatedfrom the sum of the 252 individual Gaussian probability functions. Incontrast, the predicted Gaussian probability density (fine line) is based onthe sample average and SD of 58,500 6 7790. The median is 58,650, andthe quartiles are at ;52,500 and 64,200. The asterisk highlights the deficitof expected cases close to the mean. Values ,40,000 and .75,000 areenclosed within parentheses. Excluding the 23 animals that do not belongto the M. musculus complex (Fig. 1) (CARL/Go, SPRET/Ei, andPANCEVO/Ei) does not alter the distribution in any significant way.
Table 2. Ganglion cell population size in wild strains
Typea Species Meanb SEc SDc n
CASA/Rk M. m. castaneus 47,205 61380 62390 4CAST/Ei M. m. castaneus 45,047 61040 63451 12CZECHII/Ei M. m. musculus 59,207 63482 68530 7MOLD/Rk* M. m. molossinus 43,758 64476 68952 5WSB/Ei M. m. domesticus 57,380 61759 64655 8PANCEVO/Ei M. spicilegus 64,300 61383 63093 6SPRET/Ei M. spretus 59,049 61896 64240 6CARL/ChGo M. caroli 51,263 62270 67177 11
aAll types are inbred, with the exception of CARL /ChGo, an outcrossed strain.bThe last two or three digits in strain estimates are not significant and are given onlyto minimize rounding errors in any subsequent analysis.cSEs, SDs, and coefficients of variation throughout this paper are corrected for biasbecause of the small sample size (Sokal and Rohlf, 1981).*The low value forM. molossinus is suspect because of the high incidence of necroticaxons in the optic nerve of the MOLD/Rk inbred strain. Estimates from the twoyoungest MOLD/Rk cases (49,200 and 47,200) are probably more representative.
Table 3. Ganglion cell population size in homozygous inbred laboratorystrains
Type Mean SE SD n
129/J 63,772 61771 64339 7A/J 50,615 61319 63490 8AKR/J 62,788 6935 62091 6BALB/cBy 55,859 61178 63331 9BALB/cJ 63,393 62290 66058 8C3H/HeJ* 67,029 61696 63793 6C57BL/6** 54,630 6874 63910 21C57BL /6JAx1 66,082 61655 64684 9
C57BLKS/J 65,667 61886 64217 6CBA/CaJ 56,028 61203 62691 6CE/J 63,593 62536 65072 5DBA/2J 63,351 61208 64186 13LP/J 52,225 61989 65262 8NZB/BinJ 61,063 61600 63579 6NZW/LacJ 63,711 6727 61259 4PL/J 55,976 61309 63462 8SJL/J 52,473 61770 63958 6
Averages 59,897 61526 63846 8
*Pooled data from 3 C3H/HeJ and 3 C3H/HeSnJ mice.**Pooled data from pigmented and coisogenic albino mice.
Williams et al. • Genetic Control of Neuron Number J. Neurosci., November 15, 1996, 16(22):7193–7205 7199
cell population across this diverse group has a range from 45,000to 65,000 (Tables 1, 2, Fig. 1, bottom group). We also examinedseveral subspecies of M. musculus that are known to have con-tributed to the genome of the common laboratory mouse (Fig. 1,Tables 1, 2). These wild inbred M. musculus strains have averagesthat range between 45,000 and 60,000 cells. An ANOVA demon-strates a highly significant difference among species and subspe-cies (F(6,41) 5 16.9, p , 0.0001). With the exception of CARL/ChGo, all of the animals we have studied are fully inbred.Consequently, the differences in cell numbers among these inbredstrains are probably greater than that among heterozygous sam-ples taken from wild populations.
Variation among standard laboratory strainsEstimates of ganglion cell number in the standard inbred strainsrange from 50,600 in A/J to 67,000 in C3H/HeJ (Tables 1, 3, Fig.1). The variance among strains is much greater than that withinstrains (F(16,119) 5 15.0, p , 0.0001). The inbred strains are inmany cases closely related by descent. Yet we find that evenclosely related strains can have large differences in ganglion cellnumber (Fig. 1, Table 3). For example, strains 129/J and LP/Joriginated from a common ancestor in the mid-1920s, but theirmean populations now differ by 11,500 cells or;20% (Scheffe t54.75, p , 0.05 two-tailed for six comparisons). A nearly equaldifference of 11,000 cells exists between the closely related strainsC3H/HeJ and CBA/CaJ (Scheffe t 5 6.22, p , 0.05).We also discovered a remarkable difference of ;11,000 cells
between groups of C57BL/6 mice (Table 3). The initial 10 animalsreceived from the Jackson Laboratory before the summer of 1994included 6 standard pigmented C57BL/6J animals (4 females, 2males) and 4 coisogenic c2 J albinos (2 females, 2 males). Thesetwo subsets gave averages of 53,800 6 2000 and 52,800 6 2600,
respectively (see Rice et al., 1995a and Table 1), that are close tothe previous estimate of 56,700 6 3200 obtained by Williams andcolleagues (1990) using similar methods. However, C57BL/6Jmice obtained from the Annex 1 production colony of the JacksonLaboratory in three separate shipments in the second half of 1994gave estimates averaging 66,100 6 1600 (five females, four males)(Table 1). This is far above the average for the first 10 cases (t 56.29, p , 0.05). More recent estimates of C57BL/6J animalsobtained from several different Jackson Laboratory coloniesmatch the initial low number phenotype (56,026 6 2928, n 5 6).Brain weights in the high and low groups do not differ appreciably,459 6 5.3 mg for Annex 1 cases versus 471 6 4.6 mg for the otherC57BL/6J mice. We have not identified any nongenetic factorsthat could have caused this difference. The difference is possiblyattributable to the fixation of a mutation or reversion in the Annex1 colony.
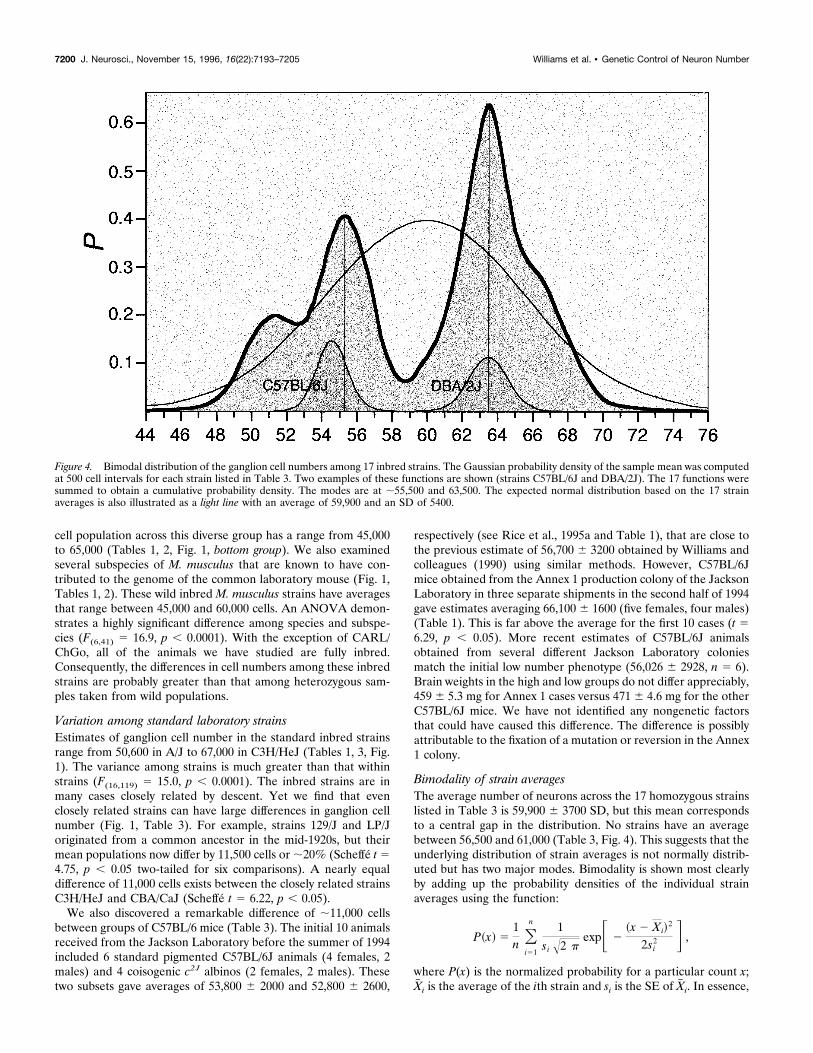
Bimodality of strain averagesThe average number of neurons across the 17 homozygous strainslisted in Table 3 is 59,900 6 3700 SD, but this mean correspondsto a central gap in the distribution. No strains have an averagebetween 56,500 and 61,000 (Table 3, Fig. 4). This suggests that theunderlying distribution of strain averages is not normally distrib-uted but has two major modes. Bimodality is shown most clearlyby adding up the probability densities of the individual strainaverages using the function:
P~x! 51n Oi51
n 1
si Î2 pexpF 2
~x 2 Xi!2
2si2 G ,
where P(x) is the normalized probability for a particular count x;X# i is the average of the ith strain and si is the SE of X# i. In essence,
Figure 4. Bimodal distribution of the ganglion cell numbers among 17 inbred strains. The Gaussian probability density of the sample mean was computedat 500 cell intervals for each strain listed in Table 3. Two examples of these functions are shown (strains C57BL/6J and DBA/2J). The 17 functions weresummed to obtain a cumulative probability density. The modes are at ;55,500 and 63,500. The expected normal distribution based on the 17 strainaverages is also illustrated as a light line with an average of 59,900 and an SD of 5400.
7200 J. Neurosci., November 15, 1996, 16(22):7193–7205 Williams et al. • Genetic Control of Neuron Number

the resulting cumulative probability density from x 5 44,000–76,000 illustrated in Figure 4 is a histogram in which Gaussianfunctions rather than single values have been summed. Seven ofthe 17 inbred strains have populations that range between 50,500and 56,500. They make up a low-phenotype group that has a modejust above 55,000. Among these low strains, the 95% confidenceinterval extends up to a maximum of 58,900. A second sharplyresolved group is made up of 10 strains, all of which have meansbetween 61,000 and 67,500. In none of these high strains does thelower limit of the 95% confidence interval extend below 57,000.Inflections and shoulders on the two major peaks are probablyattributable to sampling error. A Kolmogorov–Smirnov goodness-of-fit test confirms that it is highly unlikely that the population ofinbred strains is normally distributed (D 5 0.245, p , 0.01).
Environmental and developmental variation inneuron numberIn this section, we show that approximately half of the recordedvariation in neuron number within isogenic strains has genuinebiological causes. The other half is attributable to technical errors.To estimate technical error, we replicated 69 counts and deter-mined that the SD of counts from single nerves averaged 3780. Ifwe had sampled six adjacent sections from a single nerve, thevariation between estimates would still have amounted to ;6.3%.Variation within isogenic strains before replication was 7.2%. Toget a realistic estimate of nongenetic environmental effects on theganglion cell population, we subtracted the technical variancefrom the total variance before replication. For the inbred strainslisted in Table 3, the average corrected environmental coefficientof variation is ;3.6 6 0.4%.Coefficients of variation for isogenic strains range from ;2.0%
in NZB/LacJ to ;10% in BALB/cJ and LP/J. With an averagesample of 8 cases per strain, much of this variation in coefficientsis attributable to sampling error, and despite the wide range incoefficients, we have not been able to prove that there is signifi-cant nonuniformity of variance across inbred strains (Bartlett’s x2
(16) 5 15.3, p 5 0.5).
Heritability and gene dominanceEstimates of additive genetic control, h2
A comparison of the level of variance within and between groupsof inbred strains can provide an estimate of the strength ofadditive genetic control. This parameter is also known as herita-bility in the narrow sense. The average variance within isogeniclaboratory strains, Vw, is 13.7 (variance units are 3 106 cells2).When the average technical error, Vt, is subtracted, the averageenvironmental variance, Ve, is reduced to 4.65. In comparison, theadditive genetic variance, Va, computed across strains is 27.9.From these values, we estimate that narrow-sense heritability, h2,is ;0.76. The jackknife subsamples of h2 range from 0.73 to 0.77with an average of 0.76 and an SE of 0.04.
Estimate of broad-sense heritabilityThe average coefficient of variation in isogenic laboratory mice,CVi, averages 6.3% (n 5 23, F1 and standard inbred strains only);a value that includes both environmental and technical variance.In comparison, the corresponding coefficient, CVh, in the twogroups of genetically heterogeneous mice is much higher,;12.8%(Table 4). The pronounced difference between isogenic and out-bred mice is attributable to genetic factors in a broad sense,including not only the additive component, but also dominanceinteractions between alleles and epistatic interactions between
different genes. Squaring the coefficients of variation of the iso-genic and the outbred mice provides values that can be used toestimate the cumulative importance of genetic sources of varianceCVg
2 5 CVo2 2 CVi
2, where CVg is the coefficient of variationassociated with all genetic factors included, and CVo and CVi arethe coefficients for outbred and isogenic strains, respectively.Heritability in the broad sense is defined as the ratio Vg/Vp(Materials and Methods). This is equivalent to CVg
2/CVh2. From
this ratio, we estimate that the fraction of variation that is attrib-utable to genetic factors is ;0.76 (124/163). When the correctionis made for technical variance, this estimate increases to ;0.88.The v2 estimate of total genetic determination is 0.64. Thisestimate is generic in the sense that it does not depend on anyspecific genetic models or assumptions (Wahlsten, 1992). How-ever, the calculation of v2 does not account for technical errorand therefore underestimates total genetic determination.
F1 heterosis and inbreeding depressionTo assess the effects of inbreeding and the magnitude of genedominance effects on neuron number, we compared the popula-tion size and its variation between inbred strains and six sets of F1hybrids. Each set of hybrids is isogenic (Falconer, 1989), butbecause these F1s are generated by crossing very different strains,they have an especially high level of heterozygosity. This oftenresults in quantitative increases in fitness traits compared with theinbred parental strains (Wright, 1978). The crosses listed in Table5 include low–low, low–high, and high–high parental strain pairs.The ganglion cell population in F1 hybrids was on average higher(12600 cells) than the midpoint between parental strains. Largedeviations from the midpoints (17300 and 15200) were noted intwo crosses (Table 5). Maternal effects may contribute to some ofthis apparent dominance. In general, the F1 results are consistentwith a largely additive model of gene action with moderate genedominance. The level of within-group variation seen in the inbredmice and the isogenic F1s does not differ significantly (Table 3 vsTable 5) (6.46 6 0.49% vs 5.77 6 0.78%). An interesting conclu-sion from this analysis is that unlike many major fitness traits (cfWaddington, 1957; Leamy, 1982; Wayne et al., 1986), there is noevidence that neuron number in homozygous mice is more easilydisturbed by developmental or environmental factors than it is inF1 heterozygotes.Traits that are important in fitness tend to have low heritabil-
ities and high levels of directional dominance (Hahn and Haber,1978; Wright, 1978; Barton and Turelli, 1989). In contrast, traitsthat are only weakly selected display greater additive geneticvariation and comparatively high heritability (Mousseau and Roff,1987; Roff and Mousseau, 1987). From this perspective, the rel-atively high heritability of variation in ganglion cell number andthe modest directional dominance suggest that the population sizedoes not materially affect the fitness of mice and that polymor-phisms having large phenotypic effects have been allowed toaccumulate in the population. Given the high variance even in thewild noninbred group of M. caroli mice (Table 4), this character-istic is probably not attributable to relaxed selection associated
Table 4. Ganglion cell population size in genetically heterogeneousgroups of mice
Type Mean SE SD CV% n
CARL/ChGo 51,263 62270 67177 14.0 11CD-1 68,338 62183 67869 11.5 14
Williams et al. • Genetic Control of Neuron Number J. Neurosci., November 15, 1996, 16(22):7193–7205 7201

with 400 or more generations of laboratory breeding. Although itwould be useful to confirm this by additional analysis of wildpopulations, this idea is also consistent with the seminocturnalniche of most mice and the reliance that they presumably place onnonvisual sensory modalities (Fuller and Wimer, 1966).
DISCUSSIONEnvironmental variation and the precision of geneticcontrol in isogenic mammalsAn analysis of isogenic animals makes it possible to assess theconstancy with which the genome can guide the generation oftraits such as neuron number. We find that the coefficient ofvariation in ganglion cell numbers within inbred strains of miceaverages ;3.6%. In a strain with an average of 60,000 cells, 10animals would typically have a range from 56,600 to 63,400 if alltechnical error could be eliminated. The level of variation innormal outbred mice is substantially higher with a coefficient ofvariation close to 12.5%. Ten of these animals will generally havea range that is three to four times greater than that of isogenicstrains. This comparatively high coefficient of variation is in therange of many other quantitative traits in noninbred mammalianpopulations (Yablokov, 1974). For example, the coefficients ofvariation for brain volume in humans is;9%. Variation for singlecytoarchitectonic areas can be much higher, reaching 20–40% inhuman striate and extrastriate cortex (Gilissen and Zilles, 1996).The level of variation we have measured is not a reliable
estimate for other populations of neurons in mice or other mam-mals. There are unpredictable differences in the range of pheno-types that single genotypes can generate. For example, the inbredstrains BALB/cJ and LP/J have levels of nongenetic variation thatreach 10%, even in a very stable environment. An even moreconvincing example is the belly spot and tail (Bst) mutation inmice (Rice et al., 1995b), in which the entire ganglion cell popu-lation is often eliminated on just one side. This asymmetry illus-trates how important epigenetic developmental factors can be indetermining neuron number. The following two conclusions canbe drawn: (1) variation itself is variable, and (2) the magnitude ofnongenetic variation is under partial genetic control (Scheinerand Lyman, 1989).
Developmental noiseTo what extent is the variation noted among isogenic mice attrib-utable to developmental noise in cell production and cell death,and to what extent is this variation attributable to environmentalfactors such as litter size, maternal care, food, climate, and dis-ease? We favor the idea that this variation is primarily attributableto developmental noise. First, many major sources of environmen-
tal variance have been eliminated by rearing mice in a uniformpathogen-free environment. Second, two major residual factorsthat we allowed to vary, age and sex, do not have any detectibleeffects on ganglion cell number. Third, the lack of a correlationbetween neuron number and brain weight within isogenic cases(r 5 0.017) rules out nutritive or maternal factors that would beexpected to have widespread effects. The term developmental noisehas a negative connotation, and it may be just as valid to considervariation within isogenic mice an adaptive trait that enables singlegenotypes to exploit a wider range of habitats (Williams, 1992;Scheiner, 1993). With the baseline counts we have generated fornumerous inbred strains, it might now be worthwhile to determinejust how much change can be evoked by altering the maternal andearly postnatal environment.
The significance of genetic variationThe only previous estimate of heritability for neuron number isthat for granule cells in the mouse dentate gyrus. Wimer andWimer (1989) used a sophisticated test cross between two inbredstrains and found that ;80% of the variance in this populationwas generated by autosomal genetic differences. Our estimate oftotal genetic determination for the ganglion cell population of;88% is quite close. However, given the vastly different roles thatdifferent neuron populations play in generating behavior, there isno reason to suppose that heritability estimates will necessarilycluster close to the 80–90% level. A good analogy is the widerange of heritability (50–90%) for size differences among incisors,premolars, and molars in humans (Altman and Dittmer, 1962).High estimates of genetic determination and of additive genetic
control are of interest for several reasons. The pace of brainevolution is critically dependent on a reservoir of normal allelicvariants that modulate brain development (Romer, 1969; Kruska,1987; Lipp, 1989; Finlay, 1992; Williams et al., 1993). The fact thatthe size of the ganglion cell population is strongly influenced byadditive gene factors indicates that selection could produce rapidchange in the mean population (Barton and Turelli, 1989; Fal-coner, 1989). An interesting question is whether selection for highor low ganglion cell number would be matched by correlatedresponses in body size, brain weight, or eye size (Lande, 1979;Purves, 1988). Such correlated responses would be consistent withthe idea that common gene mechanisms tightly link the prolifer-ation and survival of neurons in different parts of the brain (Finlayand Darlington, 1995). In an analysis of evolutionary change inthe cat’s visual system, we found that several cell populations werereduced neatly in proportion to the reduction in total brain weight(Williams et al., 1993). However, two other important cell popu-lations, rod photoreceptors and a ganglion cells, did not scale with
Table 5. Ganglion cell population size in F1 hybrids and their maternal and paternal strains
F1 type Mean SE SD n Maternal strains Paternal strains Mid D
BCF1 59,454 61117 63532 11 BALB/cJ 63,393 CAST/Ei 45,047 54,439 523432CASF1 63,253 6916 61832 5 BXD32 75,727 CAST/Ei 45,047 60,387 2866CAF1/J 56,426 61736 63882 6 BALB/cJ 63,393 A/J 50,615 57,004 2578B6AxCF1/J 63,731 61944 65143 8 C57BL/6JAx1 66,082 BALB/cJ 63,393 64,738 21007CB6F1/J* 66,293 61487 63326 6 BALB/cJ 63,393 C57BL/6J 54,630 59,011 7281*PLSJF1/J 56,096 61333 63266 7 PL/J 55,976 SJL/J 52,473 54,225 1871
Averages 60,875 61422 63497 7 Averages 64,661 Averages 51,868 58,264 2611
Mid is the midpoint between maternal and paternal strain averages. D is the mean deviation between the midpoint and the F1 hybrid average.*The C57BL /6J animals used to generate these F1s at the Jackson Laboratory may actually have been C57BL /6JAx1 animals. If so, then the dominance deviation in this crosswill be much lower than the value given here.
7202 J. Neurosci., November 15, 1996, 16(22):7193–7205 Williams et al. • Genetic Control of Neuron Number
brain size. This independence is consistent with the idea thatregional and cell-specific differences in gene expression (Lipp,1989; Rubinstein et al., 1994; Usui et al., 1994) control the size ofspecific neuron populations.
Implications of a bimodal distributionAll inbred strains that we have studied can be characterized asbelonging to either a high- or low-cell-number phenotype. Thereis no appreciable overlap. This bimodality is surprising, becauseboth cumulative distributions (Fig. 2) and distributions withinisogenic strains are close to normal. The bimodality becomesevident only when strain means are compared, because samplingand technical errors are reduced so much when averaging eightcases per strain. Given the constant environment in which allthese inbred mice were reared, we can be confident that thebimodality has a genetic rather than an environmental origin, butuntil developmental studies are complete, we will not know where,when, or how the differences are produced. It will be of interest todetermine whether these consistent quantitative differences havedetectible effects on visual function.Candidate mechanisms that generate the bimodality include
factors that affect the original number of progenitor cells (Herrupet al., 1984; Herrup, 1986; Williams and Goldowitz, 1992a; Gold-owitz et al., 1996), interactions that alter patterns of cell commit-ment and the kinetics of the cell proliferation (Reh and Kljavin,1989; Lillien and Cepko, 1992; Williams and Goldowitz, 1992b;Sicinski et al., 1995; Cepko et al., 1996, Gan et al., 1996), andfactors that control the loss of 60–70% of the original ganglioncell population that normally occurs shortly after birth (Lindenand Pinto, 1985; Williams et al., 1990). In an ongoing analysis ofneonatal mice, we have found that some differences between highand low strains are evident at birth, before significant cell loss(Strom et al., 1995) and just after all ganglion cells have beengenerated (Drager, 1985).Whatever molecular and cellular mechanisms are behind the
bimodality, it is reasonably safe to conclude that one or moregenes controlling ganglion cell number have allelic variants withlarge effects. The large differences that we noted between pairs ofclosely related strains of mice (Fig. 1) also support this idea. Wehave recently mapped a major effect locus that is responsible foras much as 40% of the variance in retinal ganglion cell numberamong the BXD recombinant inbred strains (Williams et al.,1995). Alleles at this locus may also account for much of thevariation we have discovered among standard inbred strains.Strain variation in neuron number is widespread among ro-
dents. Differences ranging from 25 to 100% have been docu-mented in hippocampus (Wimer et al., 1976, 1978, 1988; Wimerand Wimer, 1989), neocortex (Wimer et al., 1969), forebraincholinergic regions (Albanese et al., 1985), olfactory bulb (Smith,1928), substantia nigra (Ross et al., 1976), locus coerulus (Bergeret al., 1979), and cerebellum (Wetts and Herrup, 1982). In severalcases, the numerical differences have clear biochemical and func-tional correlates (Berger et al., 1979; Albanese et al., 1985). Thereare good reasons for renewed interest in these robust quantitativedifferences in CNS structure. The foremost reason is that is it nowpractical to map genes associated with complex quantitative traits(Lander and Botstein, 1989; Belknap, 1992; Johnson et al., 1992;Belknap et al., 1993; Plomin and McClearn, 1993; Crabbe et al.,1994; Dietrich et al., 1994; Lai et al., 1994; Lander and Schork,1994; Takahashi et al., 1994; Kearsey and Pooni, 1996). Given theextraordinarily large numbers of genes expressed in the vertebratenervous system, no fewer than 30,000 (Sutcliffe, 1988; Adams et
al., 1993a,b), it is encouraging that an important subset of genesthat have well-defined quantitative effects on the structure of themammalian CNS can now be identified using this directedapproach.
REFERENCESAdams MD, Kerlavage AR, Fields C, Venter JC (1993a) 3,400 newexpressed sequence tags identify a diversity of transcripts in humanbrain. Nat Genet 4:256–267.
Adams MD, Soares MB, Kerlavage AR, Fields C, Venter JC (1993b)Rapid cDNA sequencing (expressed sequence tags) from a directionallycloned human infant brain cDNA library. Nat Genet 4:373–380.
Ahmad A, Spear PD (1993) Effects of aging on the size, density, andnumber of rhesus monkey lateral geniculate neurons. J Comp Neurol334:631–643.
Albanese A, Gozzo S, Iacopino C, Altavista MC (1985) Strain-dependentvariations in the number of cholinergic neurons. Brain Res334:380–384.
Altman PL, Dittmer DS (1962) Growth including reproduction and mor-phological development. Washington, DC: Fed Am Soc Exp Biol.
Barton NH, Turelli M (1989) Evolutionary quantitative genetics: howlittle do we know? Annu Rev Genet 23:337–370.
Belknap JK (1992) Quantitative trait loci associated with brain weight inthe BXD/Ty recombinant inbred mouse strains. Brain Res Bull29:337–344.
Belknap JK, Metten P, Helms ML, O’Toole LA, Angeli-Gade S, CrabbeJC, Phillips TJ (1993) Quantitative trait loci (QTL) applications tosubstances of abuse: physical dependence studies with nitrous oxide andethanol in BXD mice. Behav Genet 23:213–222.
Berger B, Herve D, Dolphin A, Barthelemy C, Gay M, Tassin JP (1979)Genetically determined differences in noradrenergic input to the cortex.Histochemical and biochemical study in two inbred strains of mice.Neuroscience 4:877–888.
Bevington PR, Robinson DK (1992) Data reduction and error analysisfor the physical sciences, 2nd Ed. New York: McGraw-Hill.
Bonhomme F (1992) Genetic diversity and evolution in the genus Mus.In: Techniques for the genetic analysis of brain and behavior (Goldow-itz D, Wahlsten D, Wimer RE, eds), pp 41–56. Amsterdam: Elsevier.
Bonhomme F, Guenet JL (1989) The wild house mouse and its relatives.In: Genetic variants and strains of the laboratory mouse, 2nd Ed (LyonMF, Searle AG, eds), pp 649–662. Oxford: Oxford UP.
Bronson F (1984) The adaptability of the house mouse. Sci Am250:90–97.
Cepko CL, Austin CP, Yang X, Alexiades M, Ezzeddine D (1996) Cellfate determination in the vertebrate retina. Proc Natl Acad Sci USA93:589–595.
Chalupa LM, Williams RW, Henderson Z (1984) Binocular interactionin the fetal cat regulates the size of the ganglion cell population.Neuroscience 12:1139–1146.
Crabbe JC, Belknap JK, Buck KJ (1994) Genetic animal models ofalcohol and drug abuse. Science 264:1715–1723.
Crusio WE (1992) Quantitative genetics. In: Techniques for the geneticanalysis of brain and behavior (Goldowitz D, Wahlsten D, Wimer RE,eds), pp 231–250. Amsterdam: Elsevier.
Crusio WE, Schwegler H, van Abeelen JHF (1989a) Behavioral re-sponses to novelty and structural variation of hippocampus in mice. I.Quantitative-genetic analysis of behavior in the open field. Behav BrainRes 32:75–80.
Crusio WE, Schwegler H, van Abeelen JHF (1989b) Behavioral re-sponses to novelty and structural variation of hippocampus in mice. II.Multivariate genetic analysis. Behav Brain Res 32:81–88.
Deming WE (1950) Some theory of sampling. New York: Dover.Dietrich WF, Miller JC, Steen RG, Merchant M, Damron D, Nahf R,Gross A, Joyce DC, Wessel M, Dredge RD, Marquis A, Stein LD,Goodman N, Page DC, Lander ES (1994) A genetic map of the mousewith 4,006 simple sequence length polymorphisms. Nat Genet7:220–245.
Drager UC (1985) Birth dates of retinal ganglion cells giving rise to theuncrossed and crossed optic projections in the mouse. Proc R Soc Lond[B] 224:57–77.
Eaton GJ (1980) The Icr:Ha(ICR) mouse: a current account of breeding,mutations, diseases, and mortality. Lab Anim 14:17.
Ellis HM, Horvitz M (1986) Genetic control of programmed cell death inthe nematode C. elegans. Cell 44:817–829.
Williams et al. • Genetic Control of Neuron Number J. Neurosci., November 15, 1996, 16(22):7193–7205 7203

Falconer DS (1989) Introduction to quantitative genetics, 3rd Ed. BurntMill, England: Longman.
Festing MFW (1993) Origins and characteristics of inbred strains ofmice. Mouse Genome 91:393–509.
Finlay BL (1992) Cell death and the creation of regional differences inneuronal numbers. J Neurobiol 23:1159–1171.
Finlay BL, Darlington RB (1995) Linked regularities in the developmentand evolution of mammalian brains. Science 268:1578–1584.
Fuller JL, Wimer RE (1966) Neural, sensory, and motor functions. In:Biology of the laboratory mouse, 2nd Ed (Green EL, ed). New York:Dover.
Gan L, Xiang M, Zhou L, Wagner DS, Klein WH, Nathans J (1996)POU domain factor Brn-3b is required for the development of a largeset of retinal ganglion cells. Proc Natl Acad Sci USA 93:3920–3925.
Gavrilets S, Hastings A (1994) A quantitative-genetic model for selectionon developmental noise. Evolution 48:1478–1486.
Gilissen E, Zilles K (1996) The calcarine sulcus as an estimate of thetotal volume of the human striate cortex: a morphometric study ofreliability and intersubject variability. J Brain Res 37:57–66.
Goldowitz D, Rice DS, Williams RW (1996) The clonal architecture ofthe mouse retina. Prog Brain Res, in press.
Goodman CS (1976) Constancy and uniqueness in a large population ofsmall interneurons. Science 193:502–504.
Goodman CS (1979) Isogenic grasshoppers: genetic variability and de-velopment of identified neurons. In: Neurogenetics: genetics ap-proaches to the nervous system (Breakefield XO, ed), pp 102–151. NewYork: Elsevier.
Green MC, Witham BA (1992) Handbook on genetically standardizedJAX mice. 4th ed. Bar Harbor, ME: Jackson Laboratory.
Gundersen HJG (1977) Notes on the estimation of numerical density ofarbitrary profiles. The edge effect. J Microsc 111:219–223.
Hahn ME, Haber SB (1978) A diallel analysis of brain and body weightin male inbred laboratory mice (Mus musculus). Behav Genet8:251–260.
Hegmann JP, Possidente B (1981) Estimating genetic correlations frominbred strains. Behav Genet 11:103–114.
Herrup K (1986) Cell lineage relationships in the development of themammalian CNS: role of cell lineage in control of cerebellar Purkinjecell number. Dev Biol 115:148–54.
Herrup K, Letsou A, Diglio TJ (1984) Cell lineage relationships in thedevelopment of the mammalian CNS: the facial nerve nucleus. Dev Biol103:329–336.
Johnson TE, DeFries JC, Markel PD (1992) Mapping quantitative traitloci for behavioral traits in the mouse. Behav Genet 22:635–653.
Kearsey MJ, Pooni HS (1996) The genetical analysis of quantitativetraits. New York: Chapman and Hall.
Kruska D (1987) How fast can total brain size change in mammals?J Hirnforsch 28:59–70.
Lai C, Lyman RF, Long AD, Langley CH, Mackay TFC (1994) Naturallyoccurring variation in bristle number and DNA polymorphisms at thescabrous locus of Drosophila melanogaster. Science 266:1697–1702.
Lande R (1979) Quantitative genetic analysis of multivariate evolution,applied to brain: body size allometry. Evolution 33:234–251.
Lander ES, Botstein D (1989) Mapping Mendelian factors underlyingquantitative traits using RFLP linkage maps. Genetics 121:185–199.
Lander ES, Schork NJ (1994) Genetic dissection of complex traits. Sci-ence 265:2037–2048.
Legendre P, Lapointe FJ, Casgrain P (1994) Modeling brain evolutionfrom behavior: a permutational regression approach. Evolution48:1487–1499.
Leamy L (1982) Morphometric studies in inbred and hybrid house mice.J Hered 73:267–272.
Lia B, Williams RW, Chalupa LM (1986) Does axonal branching con-tribute to the overproduction of optic nerve fibers during early devel-opment of the cat’s visual system? Dev Brain Res 25:296–301.
Lillien L, Cepko C (1992) Control of proliferation in the retina: temporalchanges in responsiveness of FGF and TGFa. Development115:253–266.
Linden R, Pinto LH (1985) Developmental genetics of the retina: evi-dence that the pearl mutation in the mouse affects the time course ofnatural cell death in the ganglion cell layer. Exp Brain Res 60:79–86.
Lipp HP (1989) Non-mental aspects of encephalization: the forebrain asa playground of mammalian evolution. Hum Evol 4:45–53.
Lipp HP, Schwegler H, Crusio WE, Wolfer DP, Leisinger-Trigona MC,Heimrich B, Driscoll P (1989) Using genetically-defined rodent strains
for the identification of hippocampal traits relevant for two-way avoid-ance behavior: a non-invasive approach. Experientia 45:845–859.
Macagno ER (1980) Genetic approach to invertebrate neurogenesis.Curr Top Dev Biol 15:319–345.
Mosteller F, Tukey JW (1977) Data analysis and regression: a secondcourse in statistics. Reading, MA: Addison-Wesley.
Mousseau TA, Roff DA (1987) Natural selection and the heritability offitness components. Heredity 69:181–197.
Nowak RM (1991) Walker’s mammals of the world, 5th Ed, Vol 2, pp858–862. Baltimore: Johns Hopkins UP.
Plomin R, McClearn GE (1993) Quantitative trait loci (QTL) analysesand alcohol-related behaviors. Behav Genet 23:197–211.
Purves D (1988) Body and brain. A trophic theory of neural connections.Cambridge: Harvard UP.
Reh TA, Kljavin IJ (1989) Age of differentiation determines rat retinalgerminal cell phenotype: induction of differentiation by dissociation.J Neurosci 9:4179–4189.
Rice DS, Williams RW, Goldowitz D (1995a) Genetic control of retinalprojections in inbred strains of albino mice. J Comp Neurol354:459–469.
Rice DS, Williams RW, Harris B, Bailey PW, Davisson MT, Goldowitz D(1995b) Mapping the Bst mutation on mouse chromosome 16: a modelfor human optic atrophy. Mamm Genome 6:546–548.
Roderick TH, Schlager G (1966) Multiple factor inheritance. In: Biologyof the laboratory mouse, 2nd Ed, pp 151–164. New York: Dover.
Roff DA, Mousseau TA (1987) Quantitative genetics and fitness: lessonsfrom Drosophila. Heredity 58:103–118.
Romer AS (1969) Vertebrate history with special reference to factorsrelated to cerebellar evolution. In: Neurobiology of cerebellar evolutionand development (Llinas R, ed), pp 1–18. Chicago: American MedicalAssociation.
Ross RA, Judd AB, Pickel VM, Joh TH, Reis DJ (1976) Strain-dependent variation in number of midbrain dopaminergic neurones.Nature 264:654–656.
Rubenstein JLR, Martinez S, Shimamura K, Puelles L (1994) The em-bryonic vertebrate forebrain: the prosomeric model. Science266:578–580.
Scheiner SM (1993) Genetics and evolution of phenotypic plasticity.Annu Rev Ecol Syst 24:35–68.
Scheiner SM, Lyman RF (1989) The genetics of phenotypic plasticity. I.Heritability. J Evol Biol 2:95–107.
Selzer ME (1979) Variability in maps of identified neurons in the sealamprey spinal cord examined by a wholemount technique. Brain Res163:181–193.
Sokal RR, Rohlf FJ (1981) Biometry. The principles and practice ofstatistics in biological research, 2nd Ed. New York: WH Freeman.
Sicinski P, Donaher JL, Parker SB, Li T, Fazeli A, Gardner H, Haslam SZ,Bronson RT, Elledge SJ, Weinberg RA (1995) Cyclin D1 provides alink between development and oncogenesis in the retina and breast.Cell 82:621–630.
Smith LA (1928) A comparison of the number of nerve cells in theolfactory bulbs of domesticated albino and wild Norway rats. J CompNeurol 45:483–499.
Stansfield WD (1991) Theory and problems of genetics, 3rd Ed. NewYork: McGraw Hill.
Strom RC, Williams RW, Goldowitz D (1995) Developmental mecha-nisms responsible for strain differences in the retinal ganglion cellpopulation. Soc Neurosci Abstr 21:1523.
Sutcliffe JG (1988) mRNA in the mammalian central nervous system.Annu Rev Neurosci 11:157–198.
Takahashi JS, Pinto LH, Vitaterna MH (1994) Forward and reversegenetic approaches to behavior in the mouse. Science 1724:1724–1733.
Tejedor F, Zhu XR, Kaltenbach E, Ackermann A, Baumann A, Canal I,Heissenberg M, Fischbach KF, Pongs O (1995) Minibrain: a new pro-tein kinase family involved in postembryonic neurogenesis in Drosoph-ila. Neuron 14:287–301.
Usui H, Falk JD, Dopazo A, de Lecea L, Erlander MG, Sutcliffe JG(1994) Isolation of clones of rat striatum-specific mRNAs by direc-tional tag PCR subtraction. J Neurosci 14:4915–4926.
Vogel F, Motulsky AG (1986) Human genetics, problems and ap-proaches, 2nd Ed. Berlin: Springer.
Waddington CH (1957) The strategy of the genes. London: Allen andUnwin.
Wahlsten D (1989) Insensitivity of the analysis of variance to heredity-environment interaction. Behav Brain Sci 13:109–161.
7204 J. Neurosci., November 15, 1996, 16(22):7193–7205 Williams et al. • Genetic Control of Neuron Number
Wahlsten D (1992) The problem of test reliability in genetic studies ofbrain-behavior correlation. In: Techniques for the genetic analysis ofbrain and behavior: focus on the mouse (Goldowitz D, Wahlsten D,Wimer RE, eds), pp 407–422. Amsterdam: Elsevier.
Wayne RK, Modi WS, O’Brien SJ (1986) Morphological variability andasymmetry in the cheetah (Acinonyx jubatus), a genetically uniformspecies. Evolution 40:78–85.
Wetts R, Herrup K (1982) Cerebellar Purkinje cells are descended froma small number of progenitors committed during early development.Quantitative analysis of lurcher chimeric mice. J Neurosci 2:1494–1498.
Williams GC (1992) Natural selection. Domains, levels, and challenges.New York: Oxford UP.
Williams MA, Pinon LGP, Linden R, Pinto LH (1990) The pearl muta-tion accelerates the schedule of natural cell death in the early postnatalretina. Exp Brain Res 82:393–400.
Williams RW, Goldowitz D (1992a) Structure of clonal and polyclonalcell arrays in chimeric mouse retina. Proc Natl Acad Sci USA89:1184–1188.
Williams RW, Goldowitz D (1992b) Lineage versus environment in em-bryonic retina: a revisionist perspective. Trends Neurosci 15:368–373.
Williams RW, Herrup K (1988) The control of neuron number. AnnuRev Neurosci 11:423–453.
Williams RW, Rakic P (1988) Elimination of neurons from the rhesusmonkey’s lateral geniculate nucleus during development. J Comp Neu-rol 272:424–436.
Williams RW, Bastiani MJ, Lia B, Chalupa LM (1986) Growth cones,dying axons, and developmental fluctuations in the fiber population ofthe cat’s optic nerve. J Comp Neurol 246:32–69.
Williams RW, Cavada C, Reinoso-Suarez F (1993) Rapid evolution ofthe visual system: a cellular assay of the retina and dorsal lateralgeniculate nucleus of the Spanish wildcat and the domestic cat. J Neu-rosci 13:208–228.
Williams RW, Strom RC, Goldowitz D (1995) RCN1: a locus on mousechromosome 11 that controls natural variation in neuron number. SocNeurosci Abstr 21:780.
Wimer RE, Wimer CC (1985) Animal behavior genetics: a search for thebiological foundation of behavior. Annu Rev Psychol 36:171–218.
Wimer RE, Wimer CC (1989) On the sources of strain and sex differ-ences in granule cell number in the dentate area of house mice. DevBrain Res 48:167–176.
Wimer RE, Wimer CC, Roderick TH (1969) Genetic variability in fore-brain structures between inbred strains of mice. Brain Res 16:257–264.
Wimer RE, Wimer CC, Vaughn JE, Barber RP, Balvanz BZ, Chernow CR(1976) The genetic organization of neuron number in Ammon’s hornsof house mice. Brain Res 118:219–243.
Wimer RE, Wimer CC, Vaughn JE, Barber RP, Balvanz BZ, Chernow CR(1978) The genetic organization of neuron number in the area dentataof house mice. Brain Res 157:105–122.
Wimer RE, Wimer CC, Alameddine L (1988) On the development ofstrain and sex differences in granule cell number in the area dentata ofhouse mice. Dev Brain Res 42:191–197.
Wright S (1978) Evolution and the genetics of populations, Vol 4. Vari-ability within and among natural populations. Chicago: University ofChicago.
Yablokov AV (1974) Variability of mammals. New Delphi: Amerind.
Williams et al. • Genetic Control of Neuron Number J. Neurosci., November 15, 1996, 16(22):7193–7205 7205