Restoration of retinal ganglion cell function in early glaucoma after intraocular pressure...
15
Restoration of Retinal Ganglion Cell Function in Early Glaucoma after Intraocular Pressure Reduction: A Pilot Study Lori M. Ventura, MD and Vittorio Porciatti, DSc From Bascom Palmer Eye Institute, Miami, Florida Abstract Purpose—To investigate the changes of pattern electroretinogram (PERG) after intraocular pressure lowering in glaucoma patients and normal controls. Design—Interventional retrospective cross-sectional study. Participants—Twenty-five patients (49 eyes) with ocular hypertension or glaucoma undergoing topical treatment to lower IOP served as a study group; 22 patients (44 eyes) with ocular hypertension or glaucoma observed without treatment served as a control group for treated glaucoma patients; 9 normal subjects (18 eyes) receiving a 250-mg acetazolamide tablet served as a second study group; and 17 normal subjects (34 eyes) from a previous study served as a second control group for treated normal subjects. Method—Pattern electroretinograms were recorded simultaneously from both eyes using skin electrodes and automated analysis. Visual field (VF) analyses were performed with white-on-white standard automated perimetry (SAP). Intraocular pressure was measured with Goldmann applanation tonometry; central corneal thickness was measured with pachymetry. Main Outcome Measures—Pattern electroretinogram amplitude (microvolts), phase (π rads), and test–retest variability (test 2–to–test 1 ratio, in decibels), SAP mean deviation (decibels), and IOP (millimeters of mercury). Results—In 56% of right eyes and 21% of left eyes of the treated glaucoma subgroup, the PERG amplitude and/or phase improved beyond the 95% confidence intervals of the test–retest variability of the untreated glaucoma control group. Pattern electroretinogram improvement with IOP lowering occurred in both high- and low-tension glaucoma eyes. Eyes with severely impaired VFs showed little improvement in PERG; however, eyes of normal subjects treated with acetazolamide did not show significant PERG changes relative to the test–retest variability of normal controls. Conclusions—Retinal ganglion cell function can be at least partially restored after IOP reduction in glaucomatous eyes with early VF impairment. Glaucoma is an optic neuropathy characterized by degeneration of retinal ganglion cells (RGCs) resulting in progressive loss of vision. The current opinion is that structural changes of the optic nerve fiber layer precede the appearance of visual dysfunction, as measured by standard automated perimetry (SAP). 1,2 Alternative hypotheses cannot be excluded, however. 3 An appealing alternative hypothesis is that, before irreversible cell death occurs, RGCs undergo a stage of reversible dysfunction due to intraocular pressure (IOP) elevation and, Reprint requests to Lori M. Ventura, MD, Bascom Palmer Eye Institute, 900 NW 17th Street, Miami, FL 33136. Presented at: American Academy of Ophthalmology Annual Meeting, November, 2003; Anaheim, California. Dr Porciatti has a patent pending application (no. PCT/US03/03155) on the algorithm to record the pattern electroretinogram. NIH Public Access Author Manuscript Ophthalmology. Author manuscript; available in PMC 2009 October 3. Published in final edited form as: Ophthalmology. 2005 January ; 112(1): 20–27. doi:10.1016/j.ophtha.2004.09.002. NIH-PA Author Manuscript NIH-PA Author Manuscript NIH-PA Author Manuscript
-
Upload
independent -
Category
Documents
-
view
2 -
download
0
Transcript of Restoration of retinal ganglion cell function in early glaucoma after intraocular pressure...

Restoration of Retinal Ganglion Cell Function in Early Glaucomaafter Intraocular Pressure Reduction:A Pilot Study
Lori M. Ventura, MD and Vittorio Porciatti, DScFrom Bascom Palmer Eye Institute, Miami, Florida
AbstractPurpose—To investigate the changes of pattern electroretinogram (PERG) after intraocularpressure lowering in glaucoma patients and normal controls.
Design—Interventional retrospective cross-sectional study.
Participants—Twenty-five patients (49 eyes) with ocular hypertension or glaucoma undergoingtopical treatment to lower IOP served as a study group; 22 patients (44 eyes) with ocular hypertensionor glaucoma observed without treatment served as a control group for treated glaucoma patients; 9normal subjects (18 eyes) receiving a 250-mg acetazolamide tablet served as a second study group;and 17 normal subjects (34 eyes) from a previous study served as a second control group for treatednormal subjects.
Method—Pattern electroretinograms were recorded simultaneously from both eyes using skinelectrodes and automated analysis. Visual field (VF) analyses were performed with white-on-whitestandard automated perimetry (SAP). Intraocular pressure was measured with Goldmann applanationtonometry; central corneal thickness was measured with pachymetry.
Main Outcome Measures—Pattern electroretinogram amplitude (microvolts), phase (π rads),and test–retest variability (test 2–to–test 1 ratio, in decibels), SAP mean deviation (decibels), andIOP (millimeters of mercury).
Results—In 56% of right eyes and 21% of left eyes of the treated glaucoma subgroup, the PERGamplitude and/or phase improved beyond the 95% confidence intervals of the test–retest variabilityof the untreated glaucoma control group. Pattern electroretinogram improvement with IOP loweringoccurred in both high- and low-tension glaucoma eyes. Eyes with severely impaired VFs showedlittle improvement in PERG; however, eyes of normal subjects treated with acetazolamide did notshow significant PERG changes relative to the test–retest variability of normal controls.
Conclusions—Retinal ganglion cell function can be at least partially restored after IOP reductionin glaucomatous eyes with early VF impairment.
Glaucoma is an optic neuropathy characterized by degeneration of retinal ganglion cells(RGCs) resulting in progressive loss of vision. The current opinion is that structural changesof the optic nerve fiber layer precede the appearance of visual dysfunction, as measured bystandard automated perimetry (SAP).1,2 Alternative hypotheses cannot be excluded, however.3 An appealing alternative hypothesis is that, before irreversible cell death occurs, RGCsundergo a stage of reversible dysfunction due to intraocular pressure (IOP) elevation and,
Reprint requests to Lori M. Ventura, MD, Bascom Palmer Eye Institute, 900 NW 17th Street, Miami, FL 33136.Presented at: American Academy of Ophthalmology Annual Meeting, November, 2003; Anaheim, California.Dr Porciatti has a patent pending application (no. PCT/US03/03155) on the algorithm to record the pattern electroretinogram.
NIH Public AccessAuthor ManuscriptOphthalmology. Author manuscript; available in PMC 2009 October 3.
Published in final edited form as:Ophthalmology. 2005 January ; 112(1): 20–27. doi:10.1016/j.ophtha.2004.09.002.
NIH
-PA Author Manuscript
NIH
-PA Author Manuscript
NIH
-PA Author Manuscript

possibly, other factors that remain unknown. If IOP is a major cause of dysfunction, thenlowering it should result in an improvement of RGC function.
Retinal ganglion cell function can be evaluated objectively by means of the patternelectroretinogram (PERG). The PERG is a special kind of electroretinogram that uses astimulus of contrast-reversal gratings rather than uniform flashes of light. Retinal ganglion celldeath and/or RGC dysfunction can alter the waveform of the PERG. Several studies in differentexperimental mammals with optic nerve lesions causing retrograde RGC degeneration4–7 andseveral case reports of human patients with corresponding clinical conditions8–10 havedemonstrated a strong correlation between the PERG losses and RGC losses. A linearcorrelation between the PERG loss and RGC loss has also been reported in monkeys withexperimental glaucoma.11 An important characteristic of the PERG is that it requiresphysiologic integrity of viable RGCs to be generated. The PERG amplitude is much reducedduring a transient blockade of RGC spiking activity induced by intravitreal injections oftetrodotoxin in cats and monkeys.12,13 The PERG amplitude also may be reduced reversiblyin human subjects by a transient increase of the IOP to ≥30 mmHg14–16 with a suction cup orwith body inversion. Thus, a reduction in PERG amplitude may represent the cumulativeeffects of RGC death and dysfunction of viable RGCs. Assuming that RGC dysfunction is duein part to IOP elevation, a reduction of IOP should improve RGC function, resulting inaugmented PERG amplitude and/or shortening of PERG latency (advancement of PERGphase).
This is a retrospective study of patients with ocular hypertension or glaucoma followed up inthe previous 2 years. We selected patients who had been candidates for treatment and hadprevious baseline PERG measurements. We were able to identify a subgroup of patients whoreceived topical treatment to reduce IOP and another subgroup of patients with approximatelythe same mean age and clinical breakdown of the treated subgroup and who were still underobservation before treatment. To facilitate the PERG technique, we utilized a recentlydeveloped user-friendly paradigm for PERG recording.17 In approximately 40% of eyes of thetreated subgroup, the PERG amplitude increased and/or phase advanced beyond the test–retestvariability of the nontreated glaucoma subgroup. This result suggests that, in some eyes withocular hypertension or glaucoma, a population of viable RGCs has abnormal function and thatRGC function may be restored, at least in part, by lowering the IOP.
Materials and MethodsSubjects
Patients were selected from a larger group of glaucomatous patients (n>300) observed withPERG.18 Candidates for treatment with pressure lowering who had 2 baseline PERGs and whowere still under observation were used as a control group for test–retest variability withouttreatment. Patients who had one baseline PERG and another PERG after treatment were usedas a study group (test–retest with treatment).
Study Group—Forty-nine eyes of 25 patients (mean age, 65±12 years) received topicaltreatment for glaucoma based on standard clinical considerations. Five had ocularhypertension, defined by IOP of >21 mmHg without glaucomatous changes of SAP and theoptic disc; 8 had chronic open-angle glaucoma (COAG), defined by progressive glaucomatousabnormalities of the optic disc (vertical cup-to-disc [C/D] ratio > 0.5, C/D asymmetry ≥ 0.2,localized thinning of the disc, splinter disc hemorrhages) and/or glaucomatous changes of theSAP with IOP of >21 mmHg; 11 had normal-tension glaucoma (NTG), defined by progressiveglaucomatous abnormalities of the optic disc and/or glaucomatous changes of SAP with IOPof <21 mmHg; and 1 had primary closed-angle glaucoma (IOP of >21 mmHg with no SAP oroptic disc abnormalities) and also received bilateral iridotomy. Clinical follow-up included
Ventura and Porciatti Page 2
Ophthalmology. Author manuscript; available in PMC 2009 October 3.
NIH
-PA Author Manuscript
NIH
-PA Author Manuscript
NIH
-PA Author Manuscript
stereo disc photography, white-on-white SAP (Humphrey), IOP measured with Goldmannapplanation tonometry, central corneal thickness measured with pachymetry, and PERG.Patients were tested before treatment and 1 to 3 months after.
Control Group—Forty-four eyes of 22 patients (mean age, 57±12 years) were candidatesfor treatment based on standard clinical considerations, but were still under observation beforetreatment. Two patients had ocular hypertension, 10 had NTG, 2 had COAG, and 7 wereglaucoma suspects based on a glaucomatous appearance of the optic disc associated with ≥1risk factors for glaucoma (IOP of >21 mmHg, black race, positive family history) but normalSAP.
Normal Subjects—To understand whether substantial IOP lowering might cause PERGchanges in nonglaucomatous subjects, 18 eyes of 9 normal subjects (mean age, 38±15 years)were also included. Normal subjects were tested on the same day before and 2 to 3 hours afterreceiving 1 tablet of 250-mg acetazolamide (Diamox, Lederle Laboratories, Pearl River, NY),which is known to induce IOP reductions by approximately 30% in 2 to 3 hours.19 Test–retestchanges in acetazolamide-treated normal subjects were compared with previously publishedtest–retest changes of 17 untreated normal subjects of comparable mean age (43±12 years).17
Overall, 4 groups of subjects were studied: untreated controls (n = 17, 34 eyes), treated controls(n = 9, 18 eyes), untreated glaucoma (n = 22, 44 eyes), and treated glaucoma (n = 25, 49 eyes).
The research followed the tenets of the Declaration of Helsinki. The study was approved bythe institutional review board of the University of Miami. Informed written consent wasobtained from all subjects after the nature of the study and possible risks were explained indetail.
Pattern Electroretinogram TechniquePattern electroretinograms were recorded simultaneously from both eyes according to a user-friendly paradigm recently described using skin electrodes.17 This paradigm overcomes somelimitations of current standard PERG techniques with corneal electrodes,20 whosereproducibility depends on both operator skill and patient compliance (e.g., Jacobi et al21). Inaddition, with this new paradigm, the PERG waveforms recorded in individual eyes are notcontaminated by the responses originating from the contralateral eyes, as has been shown tooccur with some corneal electrodes.22,23 In summary, flat-cup electrodes were taped on thelower eyelids, whereas reference and ground electrodes were taped on ipsilateral temples andthe central forehead, respectively. The pattern stimulus consisted of horizontal gratings (1.7cup-to-disc ratio, 25° circular field, 95% contrast, 40 candelas per square meter of meanluminance), reversed in counterphase at 8.14 Hz (16.28 reversals per second). Signals wereband pass filtered (1–30 Hz), amplified (100 000 fold), and averaged (600 sweeps). Subjectswith undilated pupils were refracted for the viewing distance (30 cm) and were asked to fixateon a target at the center of the stimulus. Subjects were allowed to blink freely. The recordingtime was approximately 3 minutes. Sweeps contaminated by eye blinks or gross eye movementswere automatically rejected over a threshold voltage of 25 microvolts.
An example of PERG waveforms recorded from the right eye of a normal subject in 2 differentsessions (tests 1 and 2) is shown in Figure 1. For fast (16.28 Hz) contrast-reversing patterns,PERG waveforms (black tracings) have an approximately sinusoidal shape, and their frequencycorresponds to the reversal rate. Pattern electroretinogram waveforms are automaticallyanalyzed by discrete Fourier transform to isolate the sinusoidal component (gray tracings) atthe reversal frequency and measure its amplitude in microvolts and phase lag in π rads. ThePERG amplitude is evaluated as half of the peak-to-trough amplitude, and the PERG phase is
Ventura and Porciatti Page 3
Ophthalmology. Author manuscript; available in PMC 2009 October 3.
NIH
-PA Author Manuscript
NIH
-PA Author Manuscript
NIH
-PA Author Manuscript

evaluated relative to the reversal period (vertical grid, 61.4 milliseconds = 2 π rads). Isolationof the contrast-reversal component is a fundamental process to distinguish the relevant signalfrom the additive noise, and to eliminate the ambiguity of choosing a particular peak or troughof the waveform, thereby increasing the reliability of the measurements. This is particularlyimportant for evaluating responses of small amplitude. In the example of Figure 1, a smalldifference in amplitude and phase between the PERGs recorded from the right eye of a normalsubject in 2 different sessions is noted. The amplitudes and phases of the PERG of test 1 andtest 2 were, respectively, 0.93 microvolts, 1.74 π rads, and 1.08 microvolts, 1.72 π rads.
StatisticsTo provide a measure of repeatability of PERG amplitude and phase in 2 different sessions,test–retest changes in individual eyes have been calculated as test 2–to–test 1 ratios. Valueswere log transformed to obtain equivalent numbers independently of whether test 1 or test 2was larger, and multiplied by 10 to convert them to decibel (dB) units [R = 10*log (T2/T1)].24 Signed ratios have the advantage of (1) minimizing the problem of large inter-subject PERGamplitude differences due to different ages and pathologic conditions and (2) providing anormalized index of test–retest variability (standard deviation [SD]) to be compared withcorresponding PERG measures obtained under different experimental conditions as well aswith different visual tests like multifocal visual evoked potentials or SAP. In normal subjectsand untreated glaucoma patients, the test–retest variability is expected to originate from randomchanges. Therefore, mean log PERG amplitude and phase ratios should not differ significantlyfrom zero. By contrast, a treatment-induced PERG change should result in a biased meansignificantly different from zero. The SDs of log PERG amplitude and phase ratios in normalcontrols and untreated glaucoma patients represent corresponding test–retest variabilities. Inboth treated glaucoma patients and treated normal controls, eyes with PERG amplitude andphase ratios exceeding +2 SDs of the test–retest variability of the corresponding control group(untreated glaucoma patients and untreated normal controls, respectively) have beenconsidered significantly improved. We performed an analysis of the associations betweenPERG changes and visual field (VF) and IOP for right and left eyes separately or using all eyesafter adjusting the variance for the correlation between the two eyes.25
ResultsThe amplitude and phase of PERGs recorded in individual eyes at test 1 have been comparedwith corresponding measures recorded at test 2 in a test–retest scatterplot (Fig 2). In alldiagrams, the diagonal has a slope of 1, which corresponds to identical test–retest measures.It can be noted in Figure 2 that amplitude and phase measures of untreated normal controls(Fig 2A, B), treated normal controls (Fig 2C, D), and untreated glaucoma patients (Fig 2E, F)are distributed rather symmetrically on both sides of the diagonal. This would suggest that test–retest changes are due to random variability. By contrast, as shown in Figure 2G, amplitudesof treated glaucoma patients tend to be more frequent on the left side of the diagonal, indicatingthat in some eyes PERG amplitudes recorded at test 2 are greater (improvement) relative tobaseline test 1 values. The comparison (paired t test) between tests 2 and 1 is highly significantfor PERG amplitude (right eye, P<0.001; left eye, P = 0.006) but not for PERG phase (righteye, P = 0.07; left eye, P = 0.5).
Test–retest ratios [10*log (T2/T1)] for amplitude and phase of individual eyes have beencalculated and displayed as amplitude/phase scatterplots (Fig 3; circles, right eyes; squares,left eyes). Average ratios and corresponding SDs are summarized in Table 1. It can be notedin Figure 3A and C that ratios cluster around zero in both untreated controls and untreatedglaucoma. The spread of data points, however, is larger in untreated glaucoma eyes (SD ofamplitude, 0.7–0.9 dB) than in untreated control eyes (SD of amplitude, ~0.5 dB). For both
Ventura and Porciatti Page 4
Ophthalmology. Author manuscript; available in PMC 2009 October 3.
NIH
-PA Author Manuscript
NIH
-PA Author Manuscript
NIH
-PA Author Manuscript

right and left eyes of untreated controls and untreated glaucoma patients, mean amplitude andphase ratios did not differ significantly from zero (Table 1). Data points of treated control eyes(Fig 3B) also cluster around zero, and their variability is similar to that of untreated controleyes. Mean amplitude and phase ratios do not significantly differ from zero. This indicates thatacetazolamide-induced IOP reduction in normal subjects has no significant effect on the PERG.
By contrast, in treated glaucoma (Fig 3D) the distribution of ratios appears skewed towardspositive changes of both amplitude and phase. For both right and left eyes, the mean amplituderatio significantly differed from zero (right eyes, P<0.001; left eyes, P<0.05). Mean phaseratios did not differ significantly from zero. Several eyes had positive changes exceeding therange of variability of corresponding untreated glaucoma eyes (+2 SDs of mean amplitude andphase ratios: dotted and dashed boxes in Fig 3D). Twelve right eyes of 25 (48%) improved inamplitude, 5/25 (20%) in phase, and 3/25 (12%) in both amplitude and phase. Overall, 14 of25 (56%) right eyes showed PERG improvement in either amplitude or phase. Three left eyesof 24 (13%) improved in amplitude, 3/24 (12%) in phase, and 1/24 (4%) in both amplitude andphase. Overall, 5/24 (21%) left eyes showed PERG improvement in either amplitude or phase.
Association between Pattern Electroretinogram Changes and Baseline Mean Deviation andIntraocular Pressure
To understand the relationship between PERG changes in treated glaucoma patients and someof the relevant baseline factors, PERG amplitude before treatment was compared with PERGamplitude after treatment across different levels of baseline IOP and baseline VFs. Standardautomated perimetry mean deviation (MD) was chosen among different SAP indices because,like the PERG, it is an integrated measure of visual function.
Figure 4 displays PERG amplitude changes as a function of 2 different categories of baselineVFs. The first category represents no or minor VF loss (MD, −1±1.3 dB, n = 31). The secondcategory represents severe VF loss (MD, −10±9 dB, n = 18). Figure 4 illustrates 3 points.Compared with treated normal controls, the PERG amplitude of glaucoma patients is smallerand progressively decreases with increasing VF defect. In addition, treated glaucoma patients,but not treated normal controls, show some improvement in PERG amplitude after IOPreduction. Finally, PERG improvement after treatment in glaucoma patients is substantial forlittle or no VF defects (paired t test, P<0.01), whereas for severe defects the improvement isof borderline significance (paired t test, P = 0.07).
Figure 5 displays PERG amplitude changes as a function of 2 different categories of baselineIOP (<21 mmHg, average of 15±3, n = 27; ≥21 mmHg, average of 29±12, n = 22). It can benoted that substantial PERG improvements can be found in eyes with baseline IOPs eitherlower than or higher than 21 mmHg. This would suggest that RGCs with reversible dysfunctioncan be found in both NTG and COAG. We did not find, however, a significant linear correlationbetween PERG amplitude and IOP reduction expressed either as Δ IOP (Pearson productmoment correlation, P = 0.57) or as percent IOP change (Pearson product moment correlation,P = 0.7). This would suggest that the relationship between PERG improvement and IOPreduction is complex, and probably depends on other variables and terms not envisioned here.
DiscussionThis study shows that reducing the IOP in patients with ocular hypertension or glaucoma mayresult in a significant improvement of PERG amplitude and/or phase. Because the PERGreflects both RGC death and dysfunction of viable RGCs, our results imply that in our particulargroup of patients a population of RGCs was dysfunctional, at least in part as a consequence ofincreased IOP. Retinal ganglion cell function could be restored to some degree by reducing
Ventura and Porciatti Page 5
Ophthalmology. Author manuscript; available in PMC 2009 October 3.
NIH
-PA Author Manuscript
NIH
-PA Author Manuscript
NIH
-PA Author Manuscript

the IOP. We cannot exclude, however, that the PERG effects also may be due to changesoccurring in the inner retina that do not directly involve RGCs.
Improvement due to IOP lowering may occur not only in ocular hypertension and COAG eyes,but also in NTG eyes. To the best of our knowledge, this is the first report of IOP-dependentPERG improvement in NTG. Pattern electroretinogram improvements in NTG, compared withCOAG eyes, are associated with smaller IOP reductions. These results might be explained byassuming that RGCs of NTG eyes are more susceptible to IOP insult than those of COAG eyes.Consequently, RGC dysfunction occurs at lower IOP levels in NTG as compared with COAG,and PERG improvement occurs with smaller IOP reductions.
In addition to IOP lowering, PERG improvement seems to depend on other factors. To have asubstantial improvement, the PERG must be abnormal. No significant changes occured inacetazolamide-treated normal subjects, despite an IOP reduction of approximately 30%. Thisfinding may explain why previous studies of ocular hypertension eyes with normal or slightlyabnormal baseline PERG and treated with timolol showed slight PERG amplitude increasesof 10% to 20% (i.e., in the range of test–retest variability).26–28 In these studies, PERG changesdisplayed a weak negative correlation with IOP changes, indicating that the PERG wassomehow sensitive to IOP reduction in ocular hypertension. In another study by Papst et al,29 7 patients with protracted elevation of IOP (range, 32–56 mmHg) and severe PERG reductionbut normal VF and optic discs had substantial PERG improvements (range, 30%–200%) aftertreatment with acetazolamide.
Our results indicate that greater PERG improvement is associated with normal or early alteredVFs. Less PERG improvement occurs in eyes with severe VF defects. This may explain whyprevious PERG studies in patients with advanced glaucoma did not show significant PERGimprovement after glaucoma surgery.30,31 A possible explanation for the interaction betweenPERG improvement and the extent of VF loss is that, in eyes with preserved VFs, a largerpopulation of RGCs is still viable, as compared with advanced disease states. A fraction ofthese RGCs have an IOP-dependent dysfunction causing PERG reduction that is reversiblewith IOP-lowering treatment. This implies that, in the early stages of glaucoma, reversibleRGC dysfunction may precede RGC death. This conclusion is in apparent contradiction to thecurrent opinion that structural changes of the optic nerve fiber layer precede the appearance ofvisual dysfunction, as measured by SAP.1,2 It is important to consider that PERG and VFtechniques probe different retinal regions and different aspects of visual function. Quigley etal32 reported that, within 30° eccentricity, a 5-dB sensitivity loss corresponds to a 20% RGCloss. Within the central 12° (the region subserving the PERG response), a 5-dB sensitivity losscorresponds to a 50% RGC loss. Thus, the SAP is relatively insensitive to RGC death in thecentral area, where there are high RGC density and redundancy. In contrast, the PERG, as asuprathreshold mass response of central RGCs, may be able to signal early dysfunction ofviable RGCs.
We realize that this retrospective study has several limitations. The first is that the control groupdoes not accurately match the study group in terms of mean age and clinical breakdown. Asmentioned above, the control group represented an approximation to the ideal based on ethics,because treatment cannot be denied to patients who need it. The sensitivity of detection ofPERG improvement in the study group was limited by the confidence intervals of test–retestvariability of the external control group. The test–retest variability of amplitude is larger inuntreated glaucoma patients (SD, 0.7–0.9 dB) than in untreated controls (SD, ~0.5 dB). Thesevariabilities are somewhat smaller than those reported for either multifocal visual evokedpotentials24 or SAP.33 The limitations of the external control group can be overcome in aprospective study with an internal control, in which the test–retest variability in individual eyesmay be determined in a series of pretreatment measures. The second limitation is that the study
Ventura and Porciatti Page 6
Ophthalmology. Author manuscript; available in PMC 2009 October 3.
NIH
-PA Author Manuscript
NIH
-PA Author Manuscript
NIH
-PA Author Manuscript

group included 4 different manifestations of glaucoma with a varied spectrum of diseaseseverity. Due to the relatively small sample of patients, we were unable to perform amultivariate statistical analysis to separate the effects of possible variables such as type andseverity of disease and the effects of different pharmacological agents. In future prospectivestudies on a larger sample of patients, we will also seek to model the relationship betweenPERG improvement and IOP reduction, considering the interaction of factors includingbaseline IOP, baseline VF, and baseline optic disc cupping.
In conclusion, this pilot study suggests that lowering the IOP in patients with early glaucomamay restore, at least partially, the activity of dysfunctional RGCs. Without treatment, thesedysfunctional RGCs may be destined to a premature death. Our results provide aneurophysiological explanation for several multicenter studies indicating that IOP reductiondelays the onset or the progression of VF deterioration in ocular hypertension,34 early manifestglaucoma,35 advanced glaucoma,36 and NTG.37 In addition, the present results suggest thatthe PERG could be used as a tool to target the neuroprotective effects of IOP-lowering drugsbased on RGC function.
AcknowledgmentsThe authors thank William J. Feuer, MS, for providing statistical assistance and for reviewing and discussing themanuscript.
Supported by National Institutes of Health, Bethesda, Maryland (center grant no.: P30-EY14801); an unrestrictedgrant to the University of Miami from Research to Prevent Blindness, Inc., New York, New York; The GlaucomaFoundation, New York, New York; Fight for Sight, New York, New York; and Rotary International, Miami, Florida.
References1. Sommer A, Katz J, Quigley HA, et al. Clinically detectable nerve fiber atrophy precedes the onset of
glaucomatous field loss. Arch Ophthalmol 1991;109:77–83. [PubMed: 1987954]2. Tuulonen A, Lehtola J, Airaksinen PJ. Nerve fiber layer defects with normal visual fields. Do normal
optic disc and normal visual field indicate absence of glaucomatous abnormality? Ophthalmology1993;100:587–97. [PubMed: 8493001]discussion 597–8
3. Harwerth RS, Crawford ML, Frishman LJ, et al. Visual field defects and neural losses fromexperimental glaucoma. Prog Retin Eye Res 2002;21:91–125. [PubMed: 11906813]
4. Maffei L, Fiorentini A. Electroretinographic responses to alternating gratings before and after sectionof the optic nerve. Science 1981;211:953–5. [PubMed: 7466369]
5. Maffei L, Fiorentini A, Bisti S, Hollander H. Pattern ERG in the monkey after section of the opticnerve. Exp Brain Res 1985;59:423–5. [PubMed: 4029317]
6. Berardi N, Domenici L, Gravina A, Maffei L. Pattern ERG in rats following section of the optic nerve.Exp Brain Res 1990;79:539–46. [PubMed: 2340873]
7. Porciatti V, Pizzorusso T, Cenni MC, Maffei L. The visual response of retinal ganglion cells is notaltered by optic nerve transection in transgenic mice overexpressing Bcl-2. Proc Natl Acad Sci U S A1996;93:14955–9. [PubMed: 8962163]
8. Fiorentini A, Maffei L, Pirchio M, et al. The ERG in response to alternating gratings in patients withdiseases of the peripheral visual pathway. Invest Ophthalmol Vis Sci 1981;21:490–3. [PubMed:7275535]
9. Dawson WW, Maida TM, Rubin ML. Human pattern-evoked retinal responses are altered by opticatrophy. Invest Ophthalmol Vis Sci 1982;22:796–803. [PubMed: 7076425]
10. Harrison JM, O’Connor PS, Young RS, et al. The pattern ERG in man following surgical resectionof the optic nerve. Invest Ophthalmol Vis Sci 1987;28:492–9. [PubMed: 3557862]
11. Johnson MA, Drum BA, Quigley HA, et al. Pattern-evoked potentials and optic nerve fiber loss inmonocular laser-induced glaucoma. Invest Ophthalmol Vis Sci 1989;30:897–907. [PubMed:2722446]
Ventura and Porciatti Page 7
Ophthalmology. Author manuscript; available in PMC 2009 October 3.
NIH
-PA Author Manuscript
NIH
-PA Author Manuscript
NIH
-PA Author Manuscript

12. Trimarchi C, Biral G, Domenici L, et al. The flash- and pattern-electroretinogram generators in thecat: a pharmacological approach. Clin Vis Sci 1990;6:19–24.
13. Viswanathan S, Frishman LJ, Robson JG, et al. The photopic negative response of the macaqueelectroretinogram: reduction by experimental glaucoma. Invest Ophthalmol Vis Sci 1999;40:1124–36. [PubMed: 10235545]
14. Colotto A, Falsini B, Salgarello T, et al. Transiently raised intraocular pressure reveals patternelectroretinogram losses in ocular hypertension. Invest Ophthalmol Vis Sci 1996;37:2663–70.[PubMed: 8977480]
15. Kothe AC, Lovasik JV. A parametric evaluation of retinal vascular perfusion pressure and visualneural function in man. Electroencephalogr Clin Neurophysiol 1990;75:185–99. [PubMed: 1689642]
16. Kremmer S, Tolksdorf-Kremmer A, Stodtmeister R. Simultaneous registration of VECP and patternERG during artificially raised intraocular pressure [in German]. Ophthalmologica 1995;209:233–41.[PubMed: 8570144]
17. Porciatti V, Ventura LM. Normative data for a user-friendly paradigm for pattern electroretinogramrecording. Ophthalmology 2004;111:161–8. [PubMed: 14711729]
18. Ventura LM, Porciatti V, Ishida K, et al. PERG abnormality and glaucoma. Ophthalmology. In press19. Friedland BR, Mallonee J, Anderson DR. Short-term dose response characteristics of acetazolamide
in man. Arch Ophthalmol 1977;95:1809–12. [PubMed: 334132]20. Bach M, Hawlina M, Holder GE, et al. Standard for pattern electroretinography. Doc Ophthalmol
2000;101:11–8. [PubMed: 11128964]21. Jacobi PC, Walter P, Brunner R, Krieglstein GK. Reproducibility and intraindividual variability of
the pattern electroretinogram. Ger J Ophthalmol 1994;3:216–9. [PubMed: 7804106]22. Peachey NS, Sokol S, Moskowitz A. Recording the contralateral PERG: effect of different electrodes.
Invest Ophthalmol Vis Sci 1983;24:1514–6. [PubMed: 6642930]23. Seiple WH, Siegel IM. Recording the pattern electroretinogram: a cautionary note. Invest Ophthalmol
Vis Sci 1983;24:796–8. [PubMed: 6853110]24. Chen CS, Hood DC, Zhang X, et al. Repeat reliability of the multifocal visual evoked potential in
normal and glaucomatous eyes. J Glaucoma 2003;12:399–408. [PubMed: 14520148]25. Katz J. Two eyes or one? The data analyst’s dilemma. Ophthalmic Surg 1988;19:585–9. [PubMed:
3173980]26. Nesher R, Trick GL, Kass MA, Gordon MO. Steady-state pattern electroretinogram following long
term unilateral administration of timolol to ocular hypertensive subjects. Doc Ophthalmol1990;75:101–9. [PubMed: 2276311]
27. Falsini B, Colotto A, Porciatti V, Porrello G. Follow-up study with pattern ERG in ocular hypertensionand glaucoma patients under timolol maleate treatment. Clin Vis Sci 1992;7:341–7.
28. Colotto A, Salgarello T, Giudiceandrea A, et al. Pattern electroretinogram in treated ocularhypertension: a cross-sectional study after timolol maleate therapy. Ophthalmic Res 1995;27:168–77. [PubMed: 8538995]
29. Papst N, Bopp M, Schnaudigel OE. The pattern evoked electroretinogram associated with elevatedintraocular pressure. Graefes Arch Clin Exp Ophthalmol 1984;222:34–7. [PubMed: 6510723]
30. Spadea L, D’Andrea D, Blasi MA, Balestrazzi E. Evaluation of electrofunctional data followingargon-laser trabeculoplasty in primary open-angle glaucoma. Graefes Arch Clin Exp Ophthalmol1991;229:414–7. [PubMed: 1937073]
31. Spadea L, Giuffre I, Bianco G, Balestrazzi E. PERG and P-VEP after surgical trabeculectomy inprimary open-angle glaucoma. Eur J Ophthalmol 1995;5:92–5. [PubMed: 7549449]
32. Quigley HA, Dunkelberger GR, Green WR. Retinal ganglion cell atrophy correlated with automatedperimetry in human eyes with glaucoma. Am J Ophthalmol 1989;107:453–64. [PubMed: 2712129]
33. Heijl A, Lindgren G, Olsson J. Normal variability of static perimetric threshold values across thecentral visual field. Arch Ophthalmol 1987;105:1544–9. [PubMed: 3675288]
34. Kass MA, Heuer DK, Higginbotham EJ, et al. Ocular Hypertension Treatment Study Group. TheOcular Hypertension Treatment Study: a randomized trial determines that topical ocular hypotensivemedication delays or prevents the onset of primary open-angle glaucoma. Arch Ophthalmol2002;120:701–13. [PubMed: 12049574]discussion 829–30
Ventura and Porciatti Page 8
Ophthalmology. Author manuscript; available in PMC 2009 October 3.
NIH
-PA Author Manuscript
NIH
-PA Author Manuscript
NIH
-PA Author Manuscript

35. Heijl A, Leske MC, Bengtsson B, et al. Early Manifest Glaucoma Trial Group. Reduction ofintraocular pressure and glaucoma progression: results from the Early Manifest Glaucoma Trial. ArchOphthalmol 2002;120:1268–79. [PubMed: 12365904]
36. AGIS Investigators. The Advanced Glaucoma Intervention Study (AGIS): 7. The relationshipbetween control of intraocular pressure and visual field deterioration. Am J Ophthalmol2000;130:429–40. [PubMed: 11024415]
37. Collaborative Normal-Tension Glaucoma Study Group. Comparison of glaucomatous progressionbetween untreated patients with normal-tension glaucoma and patients with therapeutically reducedintraocular pressures. Am J Ophthalmol 1998;126:487–97. [PubMed: 9780093]
Ventura and Porciatti Page 9
Ophthalmology. Author manuscript; available in PMC 2009 October 3.
NIH
-PA Author Manuscript
NIH
-PA Author Manuscript
NIH
-PA Author Manuscript

Figure 1.Example of pattern electroretinogram (PERG) waveforms and response analysis. A, B, Patternelectroretinogram waveforms (black tracings) recorded for the right eye of a normal subject in2 different sessions. Gray sinusoidal tracings superimposed on the PERG waveforms representthe response component at the contrast-reversal frequency isolated by means of digital Fouriertransform analysis. ms = milliseconds; div = division.
Ventura and Porciatti Page 10
Ophthalmology. Author manuscript; available in PMC 2009 October 3.
NIH
-PA Author Manuscript
NIH
-PA Author Manuscript
NIH
-PA Author Manuscript

Figure 2.Scatterplots of test versus retest PERG amplitude (microvolts; left panels) and phase (π rads;right panels). Circles represent right eyes, and squares, left eyes.
Ventura and Porciatti Page 11
Ophthalmology. Author manuscript; available in PMC 2009 October 3.
NIH
-PA Author Manuscript
NIH
-PA Author Manuscript
NIH
-PA Author Manuscript

Figure 3.Scatterplots of amplitude ratio versus phase ratio. Amplitude and phase ratios were evaluatedas 10*log (test 2/test 1). Circles represent right eyes, and squares, left eyes. Dotted and dashedboxes represent the 95% tolerance intervals for right and left eyes, respectively, derived fromdata displayed in C. dB = decibels.
Ventura and Porciatti Page 12
Ophthalmology. Author manuscript; available in PMC 2009 October 3.
NIH
-PA Author Manuscript
NIH
-PA Author Manuscript
NIH
-PA Author Manuscript

Figure 4.Pattern electroretinogram (PERG) amplitude (microvolts) before and after intraocular pressure(IOP)–lowering treatment in normal controls and glaucoma patients with 2 different levels ofseverity of visual field (VF) defects. Note that PERG amplitude improvements are larger ineyes with little or no VF defects than in eyes with severe defects.
Ventura and Porciatti Page 13
Ophthalmology. Author manuscript; available in PMC 2009 October 3.
NIH
-PA Author Manuscript
NIH
-PA Author Manuscript
NIH
-PA Author Manuscript
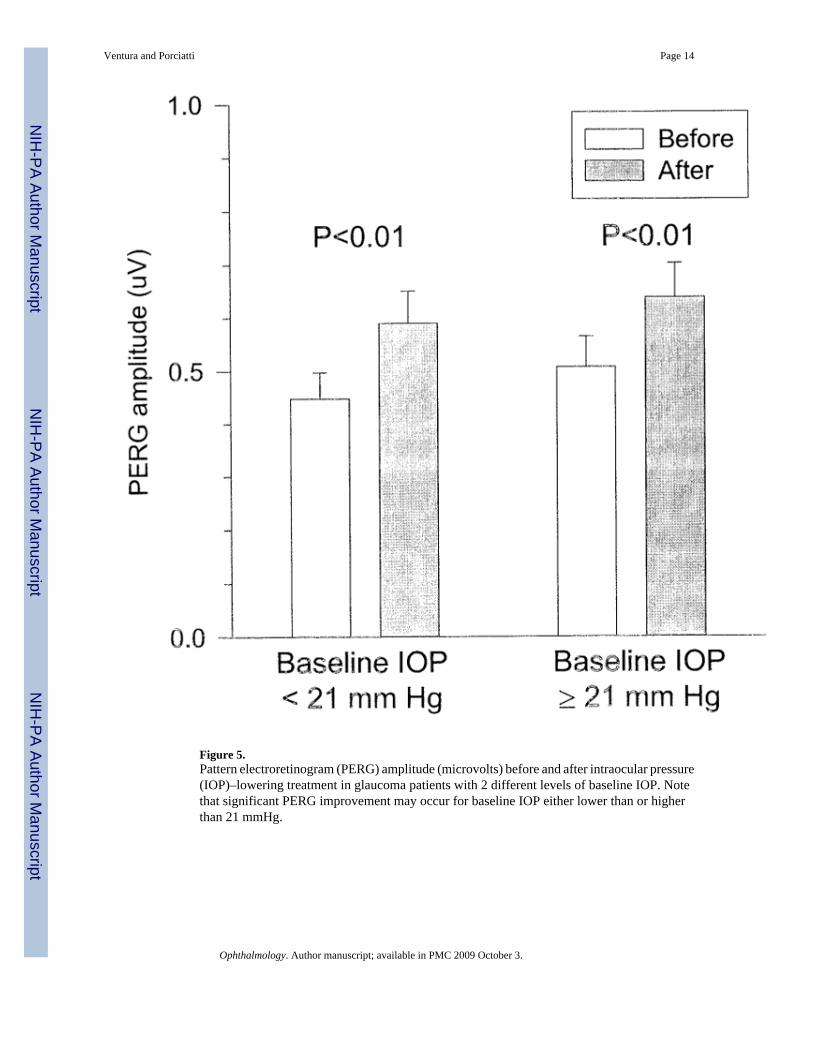
Figure 5.Pattern electroretinogram (PERG) amplitude (microvolts) before and after intraocular pressure(IOP)–lowering treatment in glaucoma patients with 2 different levels of baseline IOP. Notethat significant PERG improvement may occur for baseline IOP either lower than or higherthan 21 mmHg.
Ventura and Porciatti Page 14
Ophthalmology. Author manuscript; available in PMC 2009 October 3.
NIH
-PA Author Manuscript
NIH
-PA Author Manuscript
NIH
-PA Author Manuscript

NIH
-PA Author Manuscript
NIH
-PA Author Manuscript
NIH
-PA Author Manuscript
Ventura and Porciatti Page 15
Table 1Summary of Amplitude and Phase Ratios in Different Groups of Subjects
Mean SD n H0
UC
RE amplitude −0.27 0.54 17 NS
LE amplitude −0.15 0.47 17 NS
RE phase −0.048 0.15 17 NS
LE phase −0.028 0.07 17 NS
TC
RE amplitude 0.087 0.63 9 NS
LE amplitude −0.177 0.48 9 NS
RE phase 0.048 0.091 9 NS
LE phase −0.044 0.11 9 NS
UG
RE amplitude 0.014 0.89 22 NS
LE amplitude 0.24 0.74 22 NS
RE phase 0.032 0.15 22 NS
LE phase −0.007 0.15 22 NS
TG
RE amplitude 1.7 1.3 25 P<0.001
LE amplitude 0.74 1.54 24 P<0.05
RE phase 0.092 0.25 25 NS
LE phase 0.046 .27 24 NS
H0 = hypothesis that the mean ratio does not differ from zero; LE = left eye; NS = nonsignificant; RE = right eye; TC = treated normal controls; TG =treated glaucoma patients; UC = untreated normal controls; UG = untreated glaucoma patients.
Ophthalmology. Author manuscript; available in PMC 2009 October 3.