An Efficient Deep Learning Approach to Automatic Glaucoma ...
18
Citation: Nawaz, M.; Nazir, T.; Javed, A.; Tariq, U.; Yong, H.-S.; Khan, M.A.; Cha, J. An Efficient Deep Learning Approach to Automatic Glaucoma Detection Using Optic Disc and Optic Cup Localization. Sensors 2022, 22, 434. https://doi.org/10.3390/ s22020434 Academic Editor: Steve Ling Received: 22 October 2021 Accepted: 5 January 2022 Published: 7 January 2022 Publisher’s Note: MDPI stays neutral with regard to jurisdictional claims in published maps and institutional affil- iations. Copyright: © 2022 by the authors. Licensee MDPI, Basel, Switzerland. This article is an open access article distributed under the terms and conditions of the Creative Commons Attribution (CC BY) license (https:// creativecommons.org/licenses/by/ 4.0/). sensors Article An Efficient Deep Learning Approach to Automatic Glaucoma Detection Using Optic Disc and Optic Cup Localization Marriam Nawaz 1 , Tahira Nazir 1 , Ali Javed 1 , Usman Tariq 2 , Hwan-Seung Yong 3 , Muhammad Attique Khan 4, * and Jaehyuk Cha 5 1 Department of Computer Science, University of Engineering and Technology Taxila, Rawalpindi 47050, Pakistan; [email protected] (M.N.); [email protected] (T.N.); [email protected] (A.J.) 2 Information Systems Department, College of Computer Engineering and Sciences, Prince Sattam Bin Abdulaziz University, Al Khraj 11942, Saudi Arabia; [email protected] 3 Department of Computer Science and Engineering, Ewha Womans University, Seoul 03760, Korea; [email protected] 4 Department of Computer Science, HITEC University, Rawalpindi 47080, Pakistan 5 Department of Computer Science, Hanyang University, Seoul 04763, Korea; [email protected] * Correspondence: [email protected] Abstract: Glaucoma is an eye disease initiated due to excessive intraocular pressure inside it and caused complete sightlessness at its progressed stage. Whereas timely glaucoma screening-based treatment can save the patient from complete vision loss. Accurate screening procedures are depen- dent on the availability of human experts who performs the manual analysis of retinal samples to identify the glaucomatous-affected regions. However, due to complex glaucoma screening procedures and shortage of human resources, we often face delays which can increase the vision loss ratio around the globe. To cope with the challenges of manual systems, there is an urgent demand for designing an effective automated framework that can accurately identify the Optic Disc (OD) and Optic Cup (OC) lesions at the earliest stage. Efficient and effective identification and classification of glaucomatous regions is a complicated job due to the wide variations in the mass, shade, orientation, and shapes of lesions. Furthermore, the extensive similarity between the lesion and eye color further complicates the classification process. To overcome the aforementioned challenges, we have presented a Deep Learning (DL)-based approach namely EfficientDet-D0 with EfficientNet-B0 as the backbone. The presented framework comprises three steps for glaucoma localization and classification. Initially, the deep features from the suspected samples are computed with the EfficientNet-B0 feature extractor. Then, the Bi-directional Feature Pyramid Network (BiFPN) module of EfficientDet-D0 takes the computed features from the EfficientNet-B0 and performs the top-down and bottom-up keypoints fusion several times. In the last step, the resultant localized area containing glaucoma lesion with associated class is predicted. We have confirmed the robustness of our work by evaluating it on a challenging dataset namely an online retinal fundus image database for glaucoma analysis (ORIGA). Furthermore, we have performed cross-dataset validation on the High-Resolution Fundus (HRF), and Retinal Image database for Optic Nerve Evaluation (RIM ONE DL) datasets to show the general- ization ability of our work. Both the numeric and visual evaluations confirm that EfficientDet-D0 outperforms the newest frameworks and is more proficient in glaucoma classification. Keywords: fundus images; glaucoma; EfficientDet; EfficientNet 1. Introduction Glaucoma is a malicious eye disease that harms the eye’s optic nerve because of the usual intraocular pressure (IOP) in it [1]. The difference in the produced and drained range of intraocular fluid (IOF) of the eye results in IOP which in turn affects the nerve fibers (NF). The damaged NF disturbs the retinal nerve fiber layer (RNFL) and causes Sensors 2022, 22, 434. https://doi.org/10.3390/s22020434 https://www.mdpi.com/journal/sensors
-
Upload
khangminh22 -
Category
Documents
-
view
3 -
download
0
Transcript of An Efficient Deep Learning Approach to Automatic Glaucoma ...
�����������������
Citation: Nawaz, M.; Nazir, T.; Javed,
A.; Tariq, U.; Yong, H.-S.; Khan, M.A.;
Cha, J. An Efficient Deep Learning
Approach to Automatic Glaucoma
Detection Using Optic Disc and Optic
Cup Localization. Sensors 2022, 22,
434. https://doi.org/10.3390/
s22020434
Academic Editor: Steve Ling
Received: 22 October 2021
Accepted: 5 January 2022
Published: 7 January 2022
Publisher’s Note: MDPI stays neutral
with regard to jurisdictional claims in
published maps and institutional affil-
iations.
Copyright: © 2022 by the authors.
Licensee MDPI, Basel, Switzerland.
This article is an open access article
distributed under the terms and
conditions of the Creative Commons
Attribution (CC BY) license (https://
creativecommons.org/licenses/by/
4.0/).
sensors
Article
An Efficient Deep Learning Approach to Automatic GlaucomaDetection Using Optic Disc and Optic Cup LocalizationMarriam Nawaz 1, Tahira Nazir 1 , Ali Javed 1 , Usman Tariq 2 , Hwan-Seung Yong 3,Muhammad Attique Khan 4,* and Jaehyuk Cha 5
1 Department of Computer Science, University of Engineering and Technology Taxila,Rawalpindi 47050, Pakistan; [email protected] (M.N.); [email protected] (T.N.);[email protected] (A.J.)
2 Information Systems Department, College of Computer Engineering and Sciences, Prince Sattam BinAbdulaziz University, Al Khraj 11942, Saudi Arabia; [email protected]
3 Department of Computer Science and Engineering, Ewha Womans University, Seoul 03760, Korea;[email protected]
4 Department of Computer Science, HITEC University, Rawalpindi 47080, Pakistan5 Department of Computer Science, Hanyang University, Seoul 04763, Korea; [email protected]* Correspondence: [email protected]
Abstract: Glaucoma is an eye disease initiated due to excessive intraocular pressure inside it andcaused complete sightlessness at its progressed stage. Whereas timely glaucoma screening-basedtreatment can save the patient from complete vision loss. Accurate screening procedures are depen-dent on the availability of human experts who performs the manual analysis of retinal samples toidentify the glaucomatous-affected regions. However, due to complex glaucoma screening proceduresand shortage of human resources, we often face delays which can increase the vision loss ratio aroundthe globe. To cope with the challenges of manual systems, there is an urgent demand for designing aneffective automated framework that can accurately identify the Optic Disc (OD) and Optic Cup (OC)lesions at the earliest stage. Efficient and effective identification and classification of glaucomatousregions is a complicated job due to the wide variations in the mass, shade, orientation, and shapes oflesions. Furthermore, the extensive similarity between the lesion and eye color further complicatesthe classification process. To overcome the aforementioned challenges, we have presented a DeepLearning (DL)-based approach namely EfficientDet-D0 with EfficientNet-B0 as the backbone. Thepresented framework comprises three steps for glaucoma localization and classification. Initially, thedeep features from the suspected samples are computed with the EfficientNet-B0 feature extractor.Then, the Bi-directional Feature Pyramid Network (BiFPN) module of EfficientDet-D0 takes thecomputed features from the EfficientNet-B0 and performs the top-down and bottom-up keypointsfusion several times. In the last step, the resultant localized area containing glaucoma lesion withassociated class is predicted. We have confirmed the robustness of our work by evaluating it on achallenging dataset namely an online retinal fundus image database for glaucoma analysis (ORIGA).Furthermore, we have performed cross-dataset validation on the High-Resolution Fundus (HRF),and Retinal Image database for Optic Nerve Evaluation (RIM ONE DL) datasets to show the general-ization ability of our work. Both the numeric and visual evaluations confirm that EfficientDet-D0outperforms the newest frameworks and is more proficient in glaucoma classification.
Keywords: fundus images; glaucoma; EfficientDet; EfficientNet
1. Introduction
Glaucoma is a malicious eye disease that harms the eye’s optic nerve because of theusual intraocular pressure (IOP) in it [1]. The difference in the produced and drainedrange of intraocular fluid (IOF) of the eye results in IOP which in turn affects the nervefibers (NF). The damaged NF disturbs the retinal nerve fiber layer (RNFL) and causes
Sensors 2022, 22, 434. https://doi.org/10.3390/s22020434 https://www.mdpi.com/journal/sensors

Sensors 2022, 22, 434 2 of 18
to increase in the cup-to-disc ratio (CDR) (or “cupping”) and optic disc (OD) or opticnerve head (ONH) [2]. Furthermore, the IOP also causes to weaken the retinal pigmentepithelium namely peripapillary atrophy (PPA). Existing research work has confirmed thata rise in the growth of PPA results in generating acceleration in glaucoma [3]. A sampleof glaucomatous eyes is presented in Figure 1, from where it can be visualized that theblockage in IOF damages the optic nerve. Furthermore, it can be seen that the OD volumefor the glaucoma-affected eye is larger in comparison to a normal human eye.
Sensors 2022, 22, x FOR PEER REVIEW 2 of 19
1. Introduction Glaucoma is a malicious eye disease that harms the eye’s optic nerve because of the
usual intraocular pressure (IOP) in it [1]. The difference in the produced and drained range of intraocular fluid (IOF) of the eye results in IOP which in turn affects the nerve fibers (NF). The damaged NF disturbs the retinal nerve fiber layer (RNFL) and causes to increase in the cup-to-disc ratio (CDR) (or “cupping”) and optic disc (OD) or optic nerve head (ONH) [2]. Furthermore, the IOP also causes to weaken the retinal pigment epithelium namely peripapillary atrophy (PPA). Existing research work has confirmed that a rise in the growth of PPA results in generating acceleration in glaucoma [3]. A sample of glaucomatous eyes is presented in Figure 1, from where it can be visualized that the blockage in IOF damages the optic nerve. Furthermore, it can be seen that the OD volume for the glaucoma-affected eye is larger in comparison to a normal human eye.
Figure 1. Optic Nerve Head images (a) Normal eye (b) Glaucomatous eye image.
In a recent report, it is stated that glaucoma is the main cause of blindness in people and its growth rate is increasing exponentially which tends to affect 80 million humans by 2021 all around the world [4]. The advanced stage of glaucoma can cause the complete vision loss of the victim and it is usually identified at its severe level. Because of such reasons, glaucoma is given the name of “silent thief of sight” [5]. Even though extensive advancements have been introduced in the area of medical image analysis [6–9]. However, the accurate localization and treatment of glaucoma-affected areas are incurable. Whereas timely detection of this drastic disease can save the victims from complete sightlessness. In another study conducted in [10], it is forecasted that by 2040, the number of glaucomatous victims will rise to 111.8 million. The extensive increase in the growth rate of glaucoma will introduce a social and financial load on the world economy and have an impact on the comfort of victims [1].
At the start, manual eye grading systems were used by the ophthalmologists through visually examining the CDR and OD area to locate the irregularities of border areas. However, the increase in the number of victims and dependency on the availability of experts often delayed the diagnostic process which in turn increased the cases of complete vision loss [10]. To tackle the needs of a large population, the research community initiated the step of introducing fully automated glaucoma recognition approaches. Usually, the IOP measurement is used to identify the various eye-related diseases where the previous health history of victims is used, and eye field loss tests are
Figure 1. Optic Nerve Head images (a) Normal eye (b) Glaucomatous eye image.
In a recent report, it is stated that glaucoma is the main cause of blindness in peopleand its growth rate is increasing exponentially which tends to affect 80 million humans by2021 all around the world [4]. The advanced stage of glaucoma can cause the completevision loss of the victim and it is usually identified at its severe level. Because of suchreasons, glaucoma is given the name of “silent thief of sight” [5]. Even though extensiveadvancements have been introduced in the area of medical image analysis [6–9]. However,the accurate localization and treatment of glaucoma-affected areas are incurable. Whereastimely detection of this drastic disease can save the victims from complete sightlessness. Inanother study conducted in [10], it is forecasted that by 2040, the number of glaucomatousvictims will rise to 111.8 million. The extensive increase in the growth rate of glaucomawill introduce a social and financial load on the world economy and have an impact on thecomfort of victims [1].
At the start, manual eye grading systems were used by the ophthalmologists throughvisually examining the CDR and OD area to locate the irregularities of border areas.However, the increase in the number of victims and dependency on the availability ofexperts often delayed the diagnostic process which in turn increased the cases of completevision loss [10]. To tackle the needs of a large population, the research community initiatedthe step of introducing fully automated glaucoma recognition approaches. Usually, the IOPmeasurement is used to identify the various eye-related diseases where the previous healthhistory of victims is used, and eye field loss tests are conducted by ophthalmologists tovisually examine the structure, size, and color of the optic nerve. For that reason, accuratelocalization and segmentation of the glaucomatous area is not only necessary for better

Sensors 2022, 22, 434 3 of 18
eyes medical examinations by ophthalmologists but also required for designing a fullyautomated system for effective disease classification which is prone to less error rate [9].Initially, the hardcoded feature-based approaches have been employed by the researchersto discriminate the healthy and affected regions of human eyes [11,12]. However, theseapproaches work by first locating the region of interest (ROI), which in turn increases theeconomic cost of CAD systems and is not much effective in glaucoma recognition dueto extensive changes in the attributes of lesions [13]. Now, the effectiveness of DL-basedmethods has grabbed the attention of researchers to employ them in the area of medicalimage analysis [14–16]. The DL-based approaches are capable of automatically extractingthe representative set of image features without requiring the assistance of experts andobtaining better performance with small preprocessing and computation power. Moreover,DL-based methods are robust to localize the lesions of varying sizes by examining thetopological features of suspected samples and are more reliable to deal with the variousimage distortions like size, rotation, and scale variations of glaucoma-affected regions.
Even though a huge amount of work has been presented for the automated localizationand classification of glaucoma lesions, however, there is a need for performance enhance-ment. Although, the power of ML approaches to better tackle tough real-life scenariosis significant in comparison to the humans’ intelligence. However, these techniques maynot perform well for the samples post-processing attacks and show high computationcomplexity as these methods generate long codes that rise the processing time. To tackle theproblems of ML approaches, the DL-based frameworks are utilized, however, they increasethe code complexity. Furthermore, these methods are not well-suited to everyday problemsbecause of the changing attributes of the glaucoma-affected areas. Therefore, there is aneed to both improve the detection accuracy and processing time for glaucoma-affectedregions identification and classification.
The challenging nature of glaucoma lesions like the intense variations in their size,color, and structure has made them challenging to be diagnosed at the earliest stage. Todeal with the aforementioned challenges, a DL-based technique named EfficientDet [17,18]is introduced with Efficient-B0 as a backbone architecture. In the first step, the Efficient-B0feature computation unit of EfficientDet-D0 is utilized to calculate the deep key points.Then, the computed keypoints are identified and categorized through the one-stage detectorof EfficientDet-D0. For performance analysis, we have used two standard datasets namelyORIGA and HRF, and validated through the obtained results that the presented frameworkprovides an effective and efficient solution to glaucoma lesion classification under theoccurrence of extreme alterations in volume, color, and texture of lesions. Moreover, theEfficientDet-D0 is also robust to glaucomatous region recognition under the occurrence ofintensity changes, noise, and blurring in the suspected samples. Following are the maincontributions of our work:
• We present a robust model namely EfficientDet-D0 with EfficientNet-B0 for keypointsextraction to enhance the glaucoma recognition performance while decreasing themodel training and execution time.
• The presented technique can accurately identify the glaucomatous regions from thehuman eyes because of the robustness of the EfficientDet framework.
• Accurate detection and classification of glaucoma-affected images due to the ability ofthe EfficientDet model to tackle the over-trained model data.
• The model is computationally robust as EfficientDet uses a one-stage object identifica-tion procedure.
• Huge performance evaluations have been performed over the two datasets namelyORIGA and HRF which are diverse in terms of varying lesion color, size, and positionsand contain samples with several distortions to show the robustness of the proposedsolution.
The remaining manuscript follows the given distribution: Section 2 contains the relatedwork, whereas the presented approach is explained in-depth in Section 3. Section 4 contains

Sensors 2022, 22, 434 4 of 18
the obtained results together with the details of the employed database and evaluationmetrics while the conclusion is drawn in Section 5.
2. Related Work
In this work, we have discussed the work from the history employed for the detectionand classification of glaucoma lesions from the fundus samples. The methods used forglaucoma recognition are classified either as ML-based approaches or DL-based techniques.
Shoba et al. [19] introduced an ML-based method for glaucomatous region detection.After performing the preprocessing step, the Canny Edge Detection (CED) approach wasapplied to perform the blood vessels segmentation. Then the morphological operation wasperformed for segmenting the blood vessels from the suspected sample. In the next step,the Finite Element Modeling (FEM) analysis was conducted for final feature computation.The computed features were used for the support vector machine (SVM) training to per-form the classification task. The work [19] is robust to noisy samples, however, the modelneeds to be evaluated on a challenging dataset. In [20] a method namely the GlowwormSwarm Optimization algorithm was introduced for the automated identification of opticcups from retinal fundus samples. The framework [20] is robust to glaucoma detection,however, unable to compute the cup-to-disc ratio. Kirar et al. [21] presented an approachfor glaucoma identification employing second-stage quasi-bivariate variational mode de-composition (SS-QB-VMD)-based fine sub-band images (SBIs) from suspected samples. Thecomputed features from the SS-QB-VMD framework were used to train the least-squaresSVM (LS-SVM) classifier. The work [21] performs well for glaucoma detection, however,classification accuracy needs further improvements. Qureshi et al. [22] presented a frame-work to recognize the glaucomatous lesions. After performing the image preprocessingtask, the OD and OC were segmented by employing the using pixel-based threshold andwatershed transformation approaches. Finally, the CDR was computed by distributing thenumber of cup pixels by the number of disc pixels. The work [22] performs well for theglaucomatous region recognition, however, may not perform well for the scale and rotationvariations in the suspected samples. In [23] an ML-based automated framework was pre-sented to calculate the vertical cup-to-disk ratio (VCDR) to identify the glaucomatous areasfrom the fundus images. Initially, the vasculature and disk selective COSFIRE filters wereemployed for OD localization. After this, a generalized matrix learning vector quantization(GMLVQ) classifier was utilized for classifying the OD and OC regions. The work showsbetter glaucoma detection accuracy, however, not robust to noisy samples.
Martins et al. [24] presented an approach by introducing a lightweight CNN frame-work for glaucoma recognition. After performing the preprocessing step, the MobileNetV2approach was used to compute the deep features from the input images which were laterclassified as healthy, and glaucoma affected. The work is computationally better, how-ever requires extensive data for model training. In [25] another DL-based approach wasintroduced for the automated classification of glaucoma-affected samples from the healthyimages. A framework namely evolutionary convolutional network (ECNet) was intro-duced for reliable keypoints extraction from the input images. After this, the extractedkey points were employed for training the several ML-based classifiers i.e., K-nearestneighbor (KNN), SVM, backpropagation neural network (BPNN), and extreme learningmachine (ELM) to perform the classification task. The work obtains the best results withthe SVM classifier, however, at the charge of the enhanced processing burden. Shindeet al. [26] introduced a DL-based framework for the automatic detection and categoriza-tion of glaucoma from the input samples. Initially, the Le-Net architecture was used toidentify the Region of Interest (RoI) from the input images. Then the U-Net frameworkwas used to execute the OD and OC segmentation. Finally, the classification task wasperformed by employing the SVM, NN, and Adaboost classifiers. The work [26] attainsbetter accuracy by combing the SVM, NN, and Adaboost classifiers results, which in turnincrease the computational cost. Song et al. [27] presented a CNN-based framework inwhich the Design of experiments (DOE) analysis was performed for attaining robust hyper-

Sensors 2022, 22, 434 5 of 18
parameters. The work [27] shows better glaucoma classification performance, however, theframework needs evaluation on some standard datasets. In [28], another approach namelyResNet-50 was used to identify and recognize the glaucomatous regions from the fundusimages. The work presented in [28] demonstrates improved glaucoma detection results,however, may not be robust to the noisy and blurred images. Similarly, in [29] anotherDL-based framework namely DenseNet-201 was presented for the automated recognitionof glaucoma. The approach [29] is computationally better, however, performance needsfurther improvements. Serte et al. [30] introduced an ensemble technique for OD andOC recognition. The deep features from three models namely AlexNet, ResNet-50, andResNet-152 were fused to predict the healthy and glaucoma affected regions. The work [30]shows better glaucoma classification performance, however, this framework is computa-tionally expensive. Nazir et al. [31] introduced a methodology namely Mask-RCNN tocluster OD and OC lesions from the fundus samples. Initially, DenseNet-77 was appliedas a backbone in the Mask-RCNN to extract the deep key points from the input imagewhich were later segmented by the Mask-RCNN framework. The method [31] performedwell to glaucoma segmentation, however, segmentation results need more improvements.Similarly, in [32] another DL-based approach namely Fast Region-based ConvolutionalNeural Network (FRCNN) algorithm with fuzzy k-means (FKM) clustering was intro-duced. The approach [32] exhibits better glaucoma segmentation performance, however,at the expense of large economic costs. Yu et al. [33] introduced a DL-based technique todetect glaucoma by changing the U-net framework by replacing the down-sampling en-coding layers with the ResNet-34 framework. This work [33] exhibits better glaucomatousrecognition accuracy, however, detection accuracy is dependent on the quality of fundussamples. In [34] a VGG19 framework by using the concept of transfer learning was appliedto detect glaucoma from the suspected images. This technique works well for glaucomadetection, however, needs extensive data for model training. Bajwa et al. [35] introduced atwo-stage network to identify and classify the glaucomatous areas from the input images.Initially, the Faster-RCNN model was used to localize the ROI (optic disc) which were laterclassified by the CNN classifier. This work performs well in comparison to the heuristiclocalization approaches, however, not robust to extensive color variations in the inputimages. Moreover, in [36] a weakly supervised multi-task learning (WSMTL) approachwas presented for the automated identification and classification of glaucoma. The CNNfeature extractor containing skip connections was used to calculate the deep key pointsfrom the input images which were later classified to healthy and glaucoma-affected images.The approach [36] is computationally robust, however, classification performance needsfurther improvements. Another similar approach was introduced in [37] where the ResNetframework with multi-layers average pooling was used to perform the mapping among theglobal semantic information and precise localization. The approach shows better glaucomadetection accuracy; however, the model may not perform well for blur images.
An analysis of existing techniques used for glaucoma recognition is provided in Table 1.From Table 1, it can be seen that still, there exists a demand for a more robust frameworkthat can present both effective and efficient results for glaucomatous region classification.

Sensors 2022, 22, 434 6 of 18
Table 1. Comparative analysis of existing approaches.
Reference Technique Accuracy Limitation
ML-based
[19] CED, FEM along with the SVM classifier. 93.22% The model is tested on a small dataset.[20] Glowworm Swarm Optimization algorithm 94.86% The work is unable to compute the cup-to-disc ratio.[21] SS-QB-VMD along with the LS-SVM classifier. 92.67% The classification accuracy requires further improvements.
[22] Pixel-based threshold along with the watershedtransformation 96.1% The approach is not robust to scale and rotation alterations
in the input image.
[23] The disk selective COSFIRE filters along with theGMLVQ classifier. 97.78% The work is not robust to noisy samples.
DL-based
[24] MobileNetV2 with CNN classifier. 88% The work requires extensive data for model training.
[25] ECNet along with the KNN, SVM, BPNN, andELM classifiers. 96.37% The technique is economically expensive.
[27] CNN 98% The approach needs evaluation on a standard dataset.
[28] ResNet-50 NA The work is not robust to noise and blurring in thesuspected images.
[29] DenseNet-201 97% This approach requires further performance improvements.[30] AlexNet, ResNet-50, and ResNet-152 88% The work requires extensive processing power.[31] Mask-RCNN 96.5% The work needs further performance improvements.[32] FRCNN along with the FKM 95% The work is computationally inefficient.
[33] UNET 96.44% Detection accuracy is dependent on the quality of fundussamples.
[34] VGG-16 83.03% The model needs extensive training data.
[35] Faster-RCNN 96.14% The work is not robust to color variations of the inputimages.
[36] WSMTL NA The classification performance requires improvements.[37] ResNet 88% The method is not robust to blurry images.
3. Proposed Methodology
The presented approach comprises two steps: (i) data preparation (ii) glaucomadetection and categorization step. The main flow of the presented solution is exhibited inFigure 2. In the data preparation step, we develop annotations by drawing a bounding box(Bbox) to exactly locate the RoIs. Secondly, the EfficientDet framework is trained over theannotated images to recognize glaucoma-affected regions. We used EfficientDet-D0 withEfficientNet-B0 as its base network for features extraction. The EfficientDet-D0 followsthree steps to localize and classify glaucoma-affected regions. In the first step, the keypointscalculator of the EfficientDet-D0 network namely EfficientNet-B0 takes two types of input(suspected image and annotations). In the next step, the BiFPN module performs thetop-down and bottom-up keypoints fusion several times for the resultant features of Level3–7 in EfficientNet. In the third step, the final localized region with the associated class ispredicted and results are computed for all modules as per evaluation parameters beingused in the area of computer vision. Algorithm 1 specifies the in-depth explanation of theintroduced technique.
Sensors 2022, 22, x FOR PEER REVIEW 7 of 19
Figure 2. Flow diagram of Proposed Technique.
Algorithm 1: Steps for the presented method. INPUT: TrD, Ann OUTPUT: Localized RoI, EfficientDet, Classified glaucoma diseased portion TrD—training data. Ann—Position of the glaucomatous region in suspected images. Localized RoI—Glaucomatous area in output. EfficientDet—EfficientNet-B0 based EfficientDet network. Classified glaucoma diseases portion—Class of identified suspected region. imageSize ← [x y] Bbox calculation µ ← AnchorsCalculation(TrD, Ann) EfficientDet—Model EfficientDet ← EfficientNet-B0-Based EfficientDet (imageSize, µ) [dr dt] ← Splitting database in the training and testing set The training module of glaucoma recognition For each sample s in → dr Extract EfficientNet-B0-keypoints →ds Perform features Fusion (ds) →Fs End Training EfficientDet on Fs, and compute processing time t_Edet η_ Edet ← DetermineDiseasedPortion(Fs) Ap_ Edet ← Evaluate_AP (EfficientNet-B0, η_ Edet) For each image S in → dt (a) Calculate key points via trained network €→βI (b) [Bbox, localization_ score, class] ←Predict (βI) (c) Output sample together with Bbox, class (d) η← [η Bbox] End For Ap_€ ← Evaluate model € employing η Output_class ← EfficientDet (Ap_€).
3.1. Annotations For an accurate and correct training procedure, it is essential to precisely
demonstrate the position of the glaucoma-affected areas from the suspected samples. To accomplish this task, we have employed the LabelImg [26] software to generate the annotations of affected image areas to exactly specify the RoIs. Figure 3 presents some of
Figure 2. Flow diagram of Proposed Technique.

Sensors 2022, 22, 434 7 of 18
Algorithm 1: Steps for the presented method.
INPUT:TrD, AnnOUTPUT:Localized RoI, EfficientDet, Classified glaucoma diseased portionTrD—training data.Ann—Position of the glaucomatous region in suspected images.Localized RoI—Glaucomatous area in output.EfficientDet—EfficientNet-B0 based EfficientDet network.Classified glaucoma diseases portion—Class of identified suspected region.imageSize← [x y]Bbox calculation
µ← AnchorsCalculation (TrD, Ann)EfficientDet—Model
EfficientDet← EfficientNet-B0-Based EfficientDet (imageSize, µ)[dr dt]← Splitting database in the training and testing set
The training module of glaucoma recognitionFor each sample s in→ drExtract EfficientNet-B0-keypoints→ dsPerform features Fusion (ds)→ FsEndTraining EfficientDet on Fs, and compute processing time t_Edetη_Edet← DetermineDiseasedPortion(Fs)Ap_ Edet← Evaluate_AP (EfficientNet-B0, η_ Edet)For each image S in→ dt(a) Calculate key points via trained network €→ βI
(b) [Bbox, localization_score, class]← Predict (βI)(c) Output sample together with Bbox, class
(d) η← [η Bbox]End ForAp_€← Evaluate model € employing ηOutput_class← EfficientDet (Ap_€).
3.1. Annotations
For an accurate and correct training procedure, it is essential to precisely demonstratethe position of the glaucoma-affected areas from the suspected samples. To accomplishthis task, we have employed the LabelImg [26] software to generate the annotations ofaffected image areas to exactly specify the RoIs. Figure 3 presents some of the generatedannotations. The developed annotations are saved in an XML file which carries two typesof information: (i) coordinate values of generated Bbox on the glaucomatous area (ii) classassociated with each detected region. Then, the training file is generated from the XML filewhich is further employed for network training.
Sensors 2022, 22, x FOR PEER REVIEW 8 of 19
the generated annotations. The developed annotations are saved in an XML file which carries two types of information: (i) coordinate values of generated Bbox on the glaucomatous area (ii) class associated with each detected region. Then, the training file is generated from the XML file which is further employed for network training.
Figure 3. Annotation samples.
3.2. EfficientDet Efficient and effective feature extraction is necessary to correctly classify the
suspected samples as glaucoma-affected or healthy images. At the same time, obtaining a more representative set of image features is a complex job because of the following causes: (i) the computation of a larger-sized feature vector can cause the framework to result in a model over-fitting problem and (ii) whereas, a small-sized feature vector can cause the framework to miss to learn some essential sample aspects like color and texture changes which make diseased parts of an image indistinguishable from the healthy areas. To have a more representative set of image keypoints, it is essential to use an automatic keypoints calculation approach without employing hand-coded features computation method. The frameworks utilize hand-coded features which are not effective in precisely locating and classifying glaucomatous regions due to huge variations in the size, structure, chrominance, position, and subtle border of glaucoma lesions. To tackle the aforementioned issues, we utilized a DL-based approach namely EfficientDet [17,18] due to its power to automatically extract the robust key points from the samples under investigation. The convolution filters of EfficientDet calculate the features of the input sample by investigating its structure. Several object detection methods have been presented by the researchers for the localization and recognition of medical diseases. These detectors are classified either as one-stage (YOLO, SSD, RetinaNet, CornerNet, CeneterNet) or two-stage (RCNN [38], Fast-RCNN [39], Faster-RCNN [40], Mask-RCNN) object detectors. The motivation of selecting EffieicntDet in comparison to other one-stage detectors is that these methods compromise the classification accuracy by showing a minimum time to perform the classification task. While the two-stage detectors exhibit better lesion detection accuracy, however, at the charge of enlarged processing complexity as these techniques perform two steps to locate and classify the ROIs and which makes them unsuitable for real-world scenarios. Therefore, there is a need to represent such an approach that will give a vigorous and effective solution to glaucoma lesion recognition and categorization.
To overcome the above-mentioned issues, we have used the EfficientDet approach which was presented by the Google brain team. By enhancing the multi-directed keypoints fusion architecture of FPN and by deriving the idea from the EfficientNet framework scaling approach for reference, the EfficientDet model is a scalable and robust object identification algorithm. The EffificientDet approach comprises three main modules, the first part is EfficientNet which is the feature extractor module. In our work, we have used EfficientNet-B0 as the base network to calculate the reliable keypoints from
Figure 3. Annotation samples.
3.2. EfficientDet
Efficient and effective feature extraction is necessary to correctly classify the suspectedsamples as glaucoma-affected or healthy images. At the same time, obtaining a more

Sensors 2022, 22, 434 8 of 18
representative set of image features is a complex job because of the following causes:(i) the computation of a larger-sized feature vector can cause the framework to result ina model over-fitting problem and (ii) whereas, a small-sized feature vector can cause theframework to miss to learn some essential sample aspects like color and texture changeswhich make diseased parts of an image indistinguishable from the healthy areas. Tohave a more representative set of image keypoints, it is essential to use an automatickeypoints calculation approach without employing hand-coded features computationmethod. The frameworks utilize hand-coded features which are not effective in preciselylocating and classifying glaucomatous regions due to huge variations in the size, structure,chrominance, position, and subtle border of glaucoma lesions. To tackle the aforementionedissues, we utilized a DL-based approach namely EfficientDet [17,18] due to its power toautomatically extract the robust key points from the samples under investigation. Theconvolution filters of EfficientDet calculate the features of the input sample by investigatingits structure. Several object detection methods have been presented by the researchers forthe localization and recognition of medical diseases. These detectors are classified either asone-stage (YOLO, SSD, RetinaNet, CornerNet, CeneterNet) or two-stage (RCNN [38], Fast-RCNN [39], Faster-RCNN [40], Mask-RCNN) object detectors. The motivation of selectingEffieicntDet in comparison to other one-stage detectors is that these methods compromisethe classification accuracy by showing a minimum time to perform the classification task.While the two-stage detectors exhibit better lesion detection accuracy, however, at thecharge of enlarged processing complexity as these techniques perform two steps to locateand classify the ROIs and which makes them unsuitable for real-world scenarios. Therefore,there is a need to represent such an approach that will give a vigorous and effective solutionto glaucoma lesion recognition and categorization.
To overcome the above-mentioned issues, we have used the EfficientDet approachwhich was presented by the Google brain team. By enhancing the multi-directed keypointsfusion architecture of FPN and by deriving the idea from the EfficientNet framework scalingapproach for reference, the EfficientDet model is a scalable and robust object identificationalgorithm. The EffificientDet approach comprises three main modules, the first part isEfficientNet which is the feature extractor module. In our work, we have used EfficientNet-B0 as the base network to calculate the reliable keypoints from the input images. Thesecond module is named BiFPN, which performs both top-down and bottom-up keypointsfusion several times for the resultant feature vector of Level 3–7 in EfficientNet. And thelast module is used to localize and classify the detected region as glaucomatous affected orhealthy. The detailed description of training parameters used by the EfficientDet is givenin Table 2.
Table 2. Training parameters of the proposed solution.
Model Parameters Value
No. of epochs 60Learning rate 0.01
Selected batch size 90Confidence score value 0.5Unmatched Score value 0.5
The detailed description of all three modules is given as:
3.2.1. Feature Extraction through EfficientNet-B0
We have used EfficientNet-B0 as a base network for extracting the deep features fromthe suspected samples. In comparison to traditional methods that randomly scale networkdimensions, i.e., width, depth, and resolution, the EfficientNet method consistently scaleseach dimension with a fixed set of scaling coefficients. The EfficientNet-B0 is capable ofcomputing the more representative set of image features with a small number of parameterswhich in turn improves the detection accuracy by minimizing the computation time as
Sensors 2022, 22, 434 9 of 18
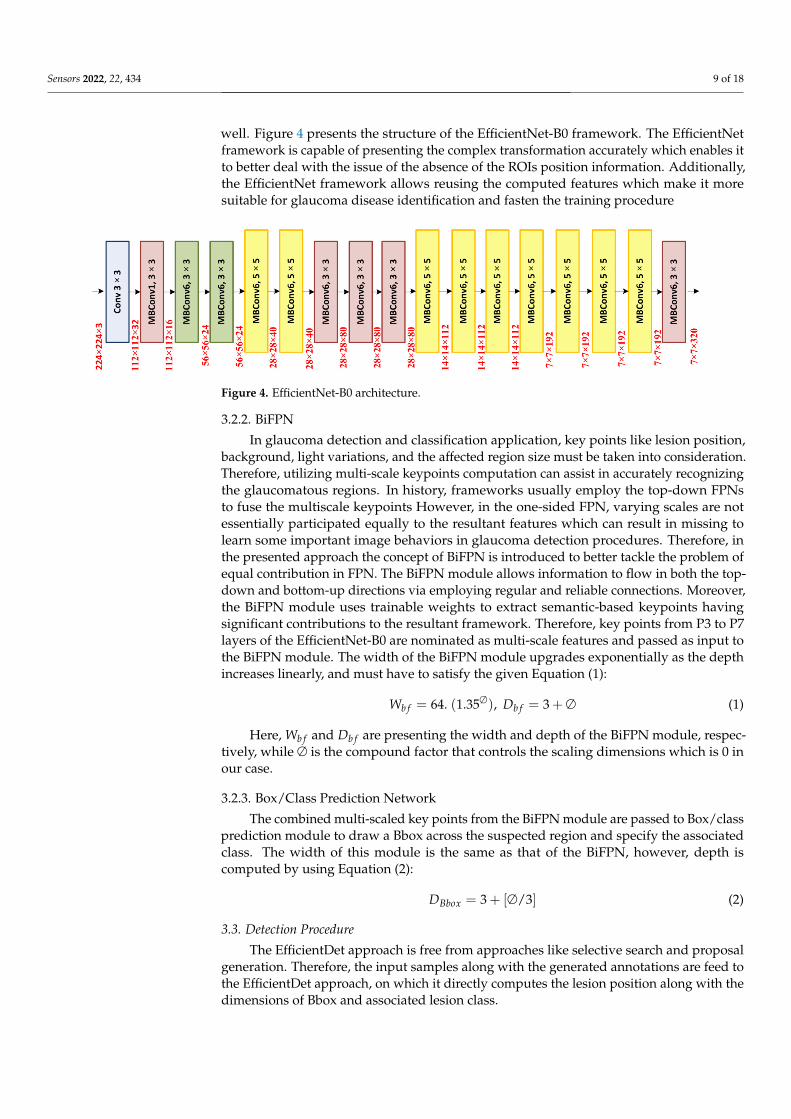
well. Figure 4 presents the structure of the EfficientNet-B0 framework. The EfficientNetframework is capable of presenting the complex transformation accurately which enables itto better deal with the issue of the absence of the ROIs position information. Additionally,the EfficientNet framework allows reusing the computed features which make it moresuitable for glaucoma disease identification and fasten the training procedure
Sensors 2022, 22, x FOR PEER REVIEW 9 of 19
the input images. The second module is named BiFPN, which performs both top-down and bottom-up keypoints fusion several times for the resultant feature vector of Level 3–7 in EfficientNet. And the last module is used to localize and classify the detected region as glaucomatous affected or healthy. The detailed description of training parameters used by the EfficientDet is given in Table 2.
Table 2. Training parameters of the proposed solution.
Model Parameters Value No. of epochs 60 Learning rate 0.01
Selected batch size 90 Confidence score value 0.5 Unmatched Score value 0.5
The detailed description of all three modules is given as:
3.2.1. Feature Extraction through EfficientNet-B0 We have used EfficientNet-B0 as a base network for extracting the deep features
from the suspected samples. In comparison to traditional methods that randomly scale network dimensions, i.e., width, depth, and resolution, the EfficientNet method consistently scales each dimension with a fixed set of scaling coefficients. The EfficientNet-B0 is capable of computing the more representative set of image features with a small number of parameters which in turn improves the detection accuracy by minimizing the computation time as well. Figure 4 presents the structure of the EfficientNet-B0 framework. The EfficientNet framework is capable of presenting the complex transformation accurately which enables it to better deal with the issue of the absence of the ROIs position information. Additionally, the EfficientNet framework allows reusing the computed features which make it more suitable for glaucoma disease identification and fasten the training procedure
Figure 4. EfficientNet-B0 architecture.
Figure 4. EfficientNet-B0 architecture.
3.2.2. BiFPN
In glaucoma detection and classification application, key points like lesion position,background, light variations, and the affected region size must be taken into consideration.Therefore, utilizing multi-scale keypoints computation can assist in accurately recognizingthe glaucomatous regions. In history, frameworks usually employ the top-down FPNsto fuse the multiscale keypoints However, in the one-sided FPN, varying scales are notessentially participated equally to the resultant features which can result in missing tolearn some important image behaviors in glaucoma detection procedures. Therefore, inthe presented approach the concept of BiFPN is introduced to better tackle the problem ofequal contribution in FPN. The BiFPN module allows information to flow in both the top-down and bottom-up directions via employing regular and reliable connections. Moreover,the BiFPN module uses trainable weights to extract semantic-based keypoints havingsignificant contributions to the resultant framework. Therefore, key points from P3 to P7layers of the EfficientNet-B0 are nominated as multi-scale features and passed as input tothe BiFPN module. The width of the BiFPN module upgrades exponentially as the depthincreases linearly, and must have to satisfy the given Equation (1):
Wb f = 64. (1.35∅), Db f = 3 + ∅ (1)
Here, Wb f and Db f are presenting the width and depth of the BiFPN module, respec-tively, while ∅ is the compound factor that controls the scaling dimensions which is 0 inour case.
3.2.3. Box/Class Prediction Network
The combined multi-scaled key points from the BiFPN module are passed to Box/classprediction module to draw a Bbox across the suspected region and specify the associatedclass. The width of this module is the same as that of the BiFPN, however, depth iscomputed by using Equation (2):
DBbox = 3 + [∅/3] (2)
3.3. Detection Procedure
The EfficientDet approach is free from approaches like selective search and proposalgeneration. Therefore, the input samples along with the generated annotations are feed tothe EfficientDet approach, on which it directly computes the lesion position along with thedimensions of Bbox and associated lesion class.
Sensors 2022, 22, 434 10 of 18
4. Experimental Results
In this section, we have discussed the detailed analysis of acquired results afterconducting several experiments to compute the glaucoma identification and categorizationpower of the introduced framework. Moreover, we have discussed the details of employeddatabases and evaluation metrics as well.
4.1. Dataset
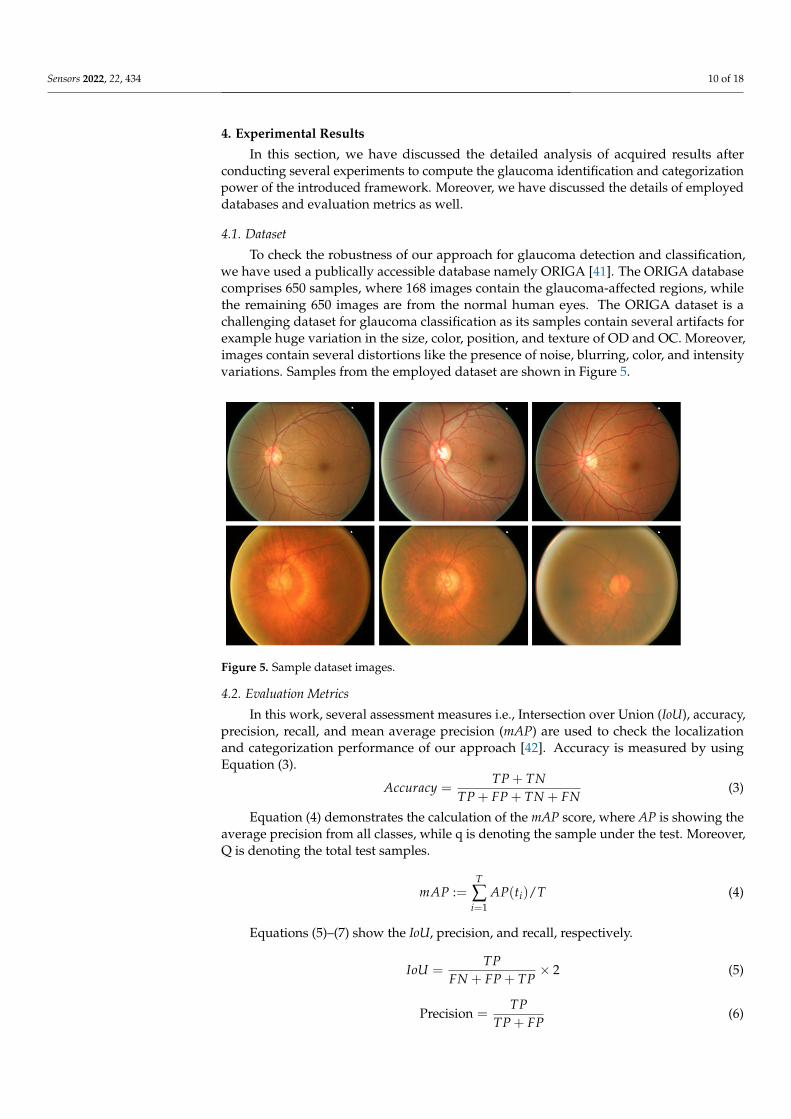
To check the robustness of our approach for glaucoma detection and classification,we have used a publically accessible database namely ORIGA [41]. The ORIGA databasecomprises 650 samples, where 168 images contain the glaucoma-affected regions, whilethe remaining 650 images are from the normal human eyes. The ORIGA dataset is achallenging dataset for glaucoma classification as its samples contain several artifacts forexample huge variation in the size, color, position, and texture of OD and OC. Moreover,images contain several distortions like the presence of noise, blurring, color, and intensityvariations. Samples from the employed dataset are shown in Figure 5.
Sensors 2022, 22, x FOR PEER REVIEW 11 of 19
Figure 5. Sample dataset images.
4.2. Evaluation Metrics In this work, several assessment measures i.e., Intersection over Union (IoU),
accuracy, precision, recall, and mean average precision (mAP) are used to check the localization and categorization performance of our approach [42]. Accuracy is measured by using Equation (3).
TP TNAccuracyTP FP TN FN
+=+ + +
(3)
Equation (4) demonstrates the calculation of the mAP score, where AP is showing the average precision from all classes, while q is denoting the sample under the test. Moreover, Q is denoting the total test samples.
1: ( ) /
T
ii
mAP AP t T=
=
(4)
Equations (5)–(7) show the IoU, precision, and recall, respectively.
2TPIoUFN FP TP
= ×+ +
(5)
Precision TPTP FP
=+
(6)
Recall TPTP FN
=+
(7)
4.3. Proposed Technique Evaluation Timely and precise identification of the OD and OC lesions is mandatory for
designing an effective computer-aided approach for glaucoma-affected regions identification and classification. For this reason, we have designed an experiment to assess the localization ability of EfficientDet by checking its recognition power on all test samples from the ORIGA database, and obtained outputs are shown in Figure 6. It is clearly visible from the reported results that the proposed solution namely EfficientDet is capable of diagnosing the OD and OC lesions of varying sizes and positions. Moreover, our work is capable of dealing with numerous samples distortions like blurring, color, and brightness variations.
Figure 5. Sample dataset images.
4.2. Evaluation Metrics
In this work, several assessment measures i.e., Intersection over Union (IoU), accuracy,precision, recall, and mean average precision (mAP) are used to check the localizationand categorization performance of our approach [42]. Accuracy is measured by usingEquation (3).
Accuracy =TP + TN
TP + FP + TN + FN(3)
Equation (4) demonstrates the calculation of the mAP score, where AP is showing theaverage precision from all classes, while q is denoting the sample under the test. Moreover,Q is denoting the total test samples.
mAP :=T
∑i=1
AP(ti)/T (4)
Equations (5)–(7) show the IoU, precision, and recall, respectively.
IoU =TP
FN + FP + TP× 2 (5)
Precision =TP
TP + FP(6)

Sensors 2022, 22, 434 11 of 18
Recall =TP
TP + FN(7)
4.3. Proposed Technique Evaluation
Timely and precise identification of the OD and OC lesions is mandatory for designingan effective computer-aided approach for glaucoma-affected regions identification andclassification. For this reason, we have designed an experiment to assess the localizationability of EfficientDet by checking its recognition power on all test samples from the ORIGAdatabase, and obtained outputs are shown in Figure 6. It is clearly visible from the reportedresults that the proposed solution namely EfficientDet is capable of diagnosing the OD andOC lesions of varying sizes and positions. Moreover, our work is capable of dealing withnumerous samples distortions like blurring, color, and brightness variations.
The localization ability of the EfficientDet approach permits it to precisely recognize thelesions exhibiting fewer signs. Furthermore, for the quantitative estimation of our approach,we have utilized two evaluation measures namely mAP and IoU, as these measures are themost widely employed by the researchers and assist in better evaluating the localizationpower of a system. Our approach obtains an average mAP and means IoU values of 0.971and 0.981, respectively. It can be seen from both the visual and numerical results that ourframework is reliable to localize and categorize the glaucoma-affected regions.
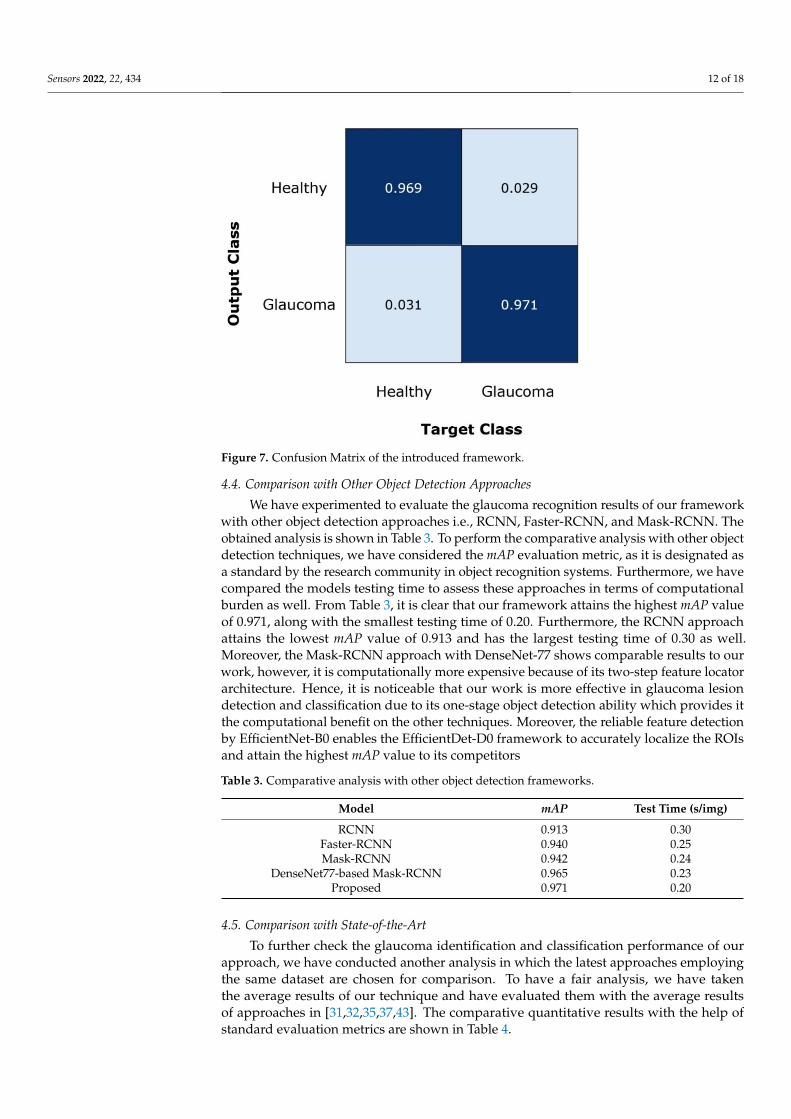
Moreover, for robust glaucoma detection and classification framework, it must becapable of differentiating the glaucomatous samples from the healthy images. For thisreason, we have plotted the confusion matrix as it can better demonstrate the classificationresults by showing the true positive rate (TPR). The obtained results are shown in Figure 7,from where it can be witnessed that for glaucoma-affected images, the EfficientDet ap-proach shows a TPR of 0.970 which is clearly showing the effectiveness of our approach.Furthermore, our technique acquires an average glaucoma classification accuracy of 97.2%on the ORIGA dataset. The main reason for the robust classification accuracy of our methodis that EfficientDet with EfficientNet-B0 as the base network is capable of computing the moreaccurate set of image features which better assist in diagnosing the diseased image areas.Sensors 2022, 22, x FOR PEER REVIEW 12 of 19
Figure 6. Localization results of EfficientDet-D0 for glaucoma localization.
The localization ability of the EfficientDet approach permits it to precisely recognize the lesions exhibiting fewer signs. Furthermore, for the quantitative estimation of our approach, we have utilized two evaluation measures namely mAP and IOU, as these measures are the most widely employed by the researchers and assist in better evaluating the localization power of a system. Our approach obtains an average mAP and means IOU values of 0.971 and 0.981, respectively. It can be seen from both the visual and numerical results that our framework is reliable to localize and categorize the glaucoma-affected regions.
Moreover, for robust glaucoma detection and classification framework, it must be capable of differentiating the glaucomatous samples from the healthy images. For this reason, we have plotted the confusion matrix as it can better demonstrate the classification results by showing the true positive rate (TPR). The obtained results are shown in Figure 7, from where it can be witnessed that for glaucoma-affected images, the EfficientDet approach shows a TPR of 0.970 which is clearly showing the effectiveness of our approach. Furthermore, our technique acquires an average glaucoma classification accuracy of 97.2% on the ORIGA dataset. The main reason for the robust classification accuracy of our method is that EfficientDet with EfficientNet-B0 as the base network is capable of computing the more accurate set of image features which better assist in diagnosing the diseased image areas.
Figure 6. Localization results of EfficientDet-D0 for glaucoma localization.
Sensors 2022, 22, 434 12 of 18
Sensors 2022, 22, x FOR PEER REVIEW 13 of 19
Figure 7. Confusion Matrix of the introduced framework.
4.4. Comparison with Other Object Detection Approaches We have experimented to evaluate the glaucoma recognition results of our
framework with other object detection approaches i.e., RCNN, Faster-RCNN, and Mask-RCNN. The obtained analysis is shown in Table 3. To perform the comparative analysis with other object detection techniques, we have considered the mAP evaluation metric, as it is designated as a standard by the research community in object recognition systems. Furthermore, we have compared the models testing time to assess these approaches in terms of computational burden as well. From Table 3, it is clear that our framework attains the highest mAP value of 0.971, along with the smallest testing time of 0.20. Furthermore, the RCNN approach attains the lowest mAP value of 0.913 and has the largest testing time of 0.30 as well. Moreover, the Mask-RCNN approach with DenseNet-77 shows comparable results to our work, however, it is computationally more expensive because of its two-step feature locator architecture. Hence, it is noticeable that our work is more effective in glaucoma lesion detection and classification due to its one-stage object detection ability which provides it the computational benefit on the other techniques. Moreover, the reliable feature detection by EfficientNet-B0 enables the EfficientDet-D0 framework to accurately localize the ROIs and attain the highest mAP value to its competitors
Table 3. Comparative analysis with other object detection frameworks.
Model mAP Test Time (s/img) RCNN 0.913 0.30
Faster-RCNN 0.940 0.25 Mask-RCNN 0.942 0.24
DenseNet77-based Mask-RCNN 0.965 0.23 Proposed 0.971 0.20
4.5. Comparison with State-of-the-Art To further check the glaucoma identification and classification performance of our
approach, we have conducted another analysis in which the latest approaches employing the same dataset are chosen for comparison. To have a fair analysis, we have taken the average results of our technique and have evaluated them with the average results of approaches in [31,32,35,37,43]. The comparative quantitative results with the help of standard evaluation metrics are shown in Table 4.
Figure 7. Confusion Matrix of the introduced framework.
4.4. Comparison with Other Object Detection Approaches
We have experimented to evaluate the glaucoma recognition results of our frameworkwith other object detection approaches i.e., RCNN, Faster-RCNN, and Mask-RCNN. Theobtained analysis is shown in Table 3. To perform the comparative analysis with other objectdetection techniques, we have considered the mAP evaluation metric, as it is designated asa standard by the research community in object recognition systems. Furthermore, we havecompared the models testing time to assess these approaches in terms of computationalburden as well. From Table 3, it is clear that our framework attains the highest mAP valueof 0.971, along with the smallest testing time of 0.20. Furthermore, the RCNN approachattains the lowest mAP value of 0.913 and has the largest testing time of 0.30 as well.Moreover, the Mask-RCNN approach with DenseNet-77 shows comparable results to ourwork, however, it is computationally more expensive because of its two-step feature locatorarchitecture. Hence, it is noticeable that our work is more effective in glaucoma lesiondetection and classification due to its one-stage object detection ability which provides itthe computational benefit on the other techniques. Moreover, the reliable feature detectionby EfficientNet-B0 enables the EfficientDet-D0 framework to accurately localize the ROIsand attain the highest mAP value to its competitors
Table 3. Comparative analysis with other object detection frameworks.
Model mAP Test Time (s/img)
RCNN 0.913 0.30Faster-RCNN 0.940 0.25Mask-RCNN 0.942 0.24
DenseNet77-based Mask-RCNN 0.965 0.23Proposed 0.971 0.20
4.5. Comparison with State-of-the-Art
To further check the glaucoma identification and classification performance of ourapproach, we have conducted another analysis in which the latest approaches employingthe same dataset are chosen for comparison. To have a fair analysis, we have takenthe average results of our technique and have evaluated them with the average resultsof approaches in [31,32,35,37,43]. The comparative quantitative results with the help ofstandard evaluation metrics are shown in Table 4.
Sensors 2022, 22, 434 13 of 18
Table 4. Performance comparison with latest approaches.
Approach AUC Recall Time (s)
Liao et al. [37] 0.880 - -Fu et al. [43] 0.910 0.920 -
Bajwa et al. [35] 0.868 0.710 -Nazir et al. [32] 0.941 0.945 0.90Nazir et al. [31] 0.970 0.963 0.55
Proposed 0.979 0.970 0.20
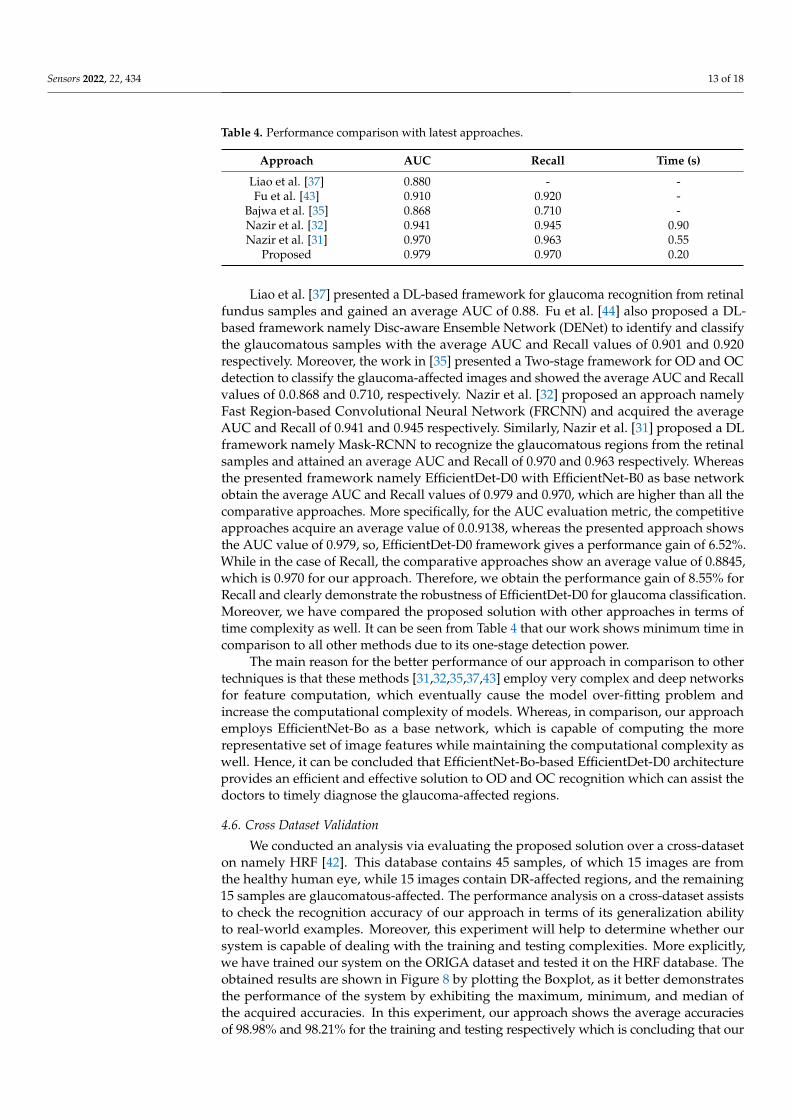
Liao et al. [37] presented a DL-based framework for glaucoma recognition from retinalfundus samples and gained an average AUC of 0.88. Fu et al. [44] also proposed a DL-based framework namely Disc-aware Ensemble Network (DENet) to identify and classifythe glaucomatous samples with the average AUC and Recall values of 0.901 and 0.920respectively. Moreover, the work in [35] presented a Two-stage framework for OD and OCdetection to classify the glaucoma-affected images and showed the average AUC and Recallvalues of 0.0.868 and 0.710, respectively. Nazir et al. [32] proposed an approach namelyFast Region-based Convolutional Neural Network (FRCNN) and acquired the averageAUC and Recall of 0.941 and 0.945 respectively. Similarly, Nazir et al. [31] proposed a DLframework namely Mask-RCNN to recognize the glaucomatous regions from the retinalsamples and attained an average AUC and Recall of 0.970 and 0.963 respectively. Whereasthe presented framework namely EfficientDet-D0 with EfficientNet-B0 as base networkobtain the average AUC and Recall values of 0.979 and 0.970, which are higher than all thecomparative approaches. More specifically, for the AUC evaluation metric, the competitiveapproaches acquire an average value of 0.0.9138, whereas the presented approach showsthe AUC value of 0.979, so, EfficientDet-D0 framework gives a performance gain of 6.52%.While in the case of Recall, the comparative approaches show an average value of 0.8845,which is 0.970 for our approach. Therefore, we obtain the performance gain of 8.55% forRecall and clearly demonstrate the robustness of EfficientDet-D0 for glaucoma classification.Moreover, we have compared the proposed solution with other approaches in terms oftime complexity as well. It can be seen from Table 4 that our work shows minimum time incomparison to all other methods due to its one-stage detection power.
The main reason for the better performance of our approach in comparison to othertechniques is that these methods [31,32,35,37,43] employ very complex and deep networksfor feature computation, which eventually cause the model over-fitting problem andincrease the computational complexity of models. Whereas, in comparison, our approachemploys EfficientNet-Bo as a base network, which is capable of computing the morerepresentative set of image features while maintaining the computational complexity aswell. Hence, it can be concluded that EfficientNet-Bo-based EfficientDet-D0 architectureprovides an efficient and effective solution to OD and OC recognition which can assist thedoctors to timely diagnose the glaucoma-affected regions.
4.6. Cross Dataset Validation
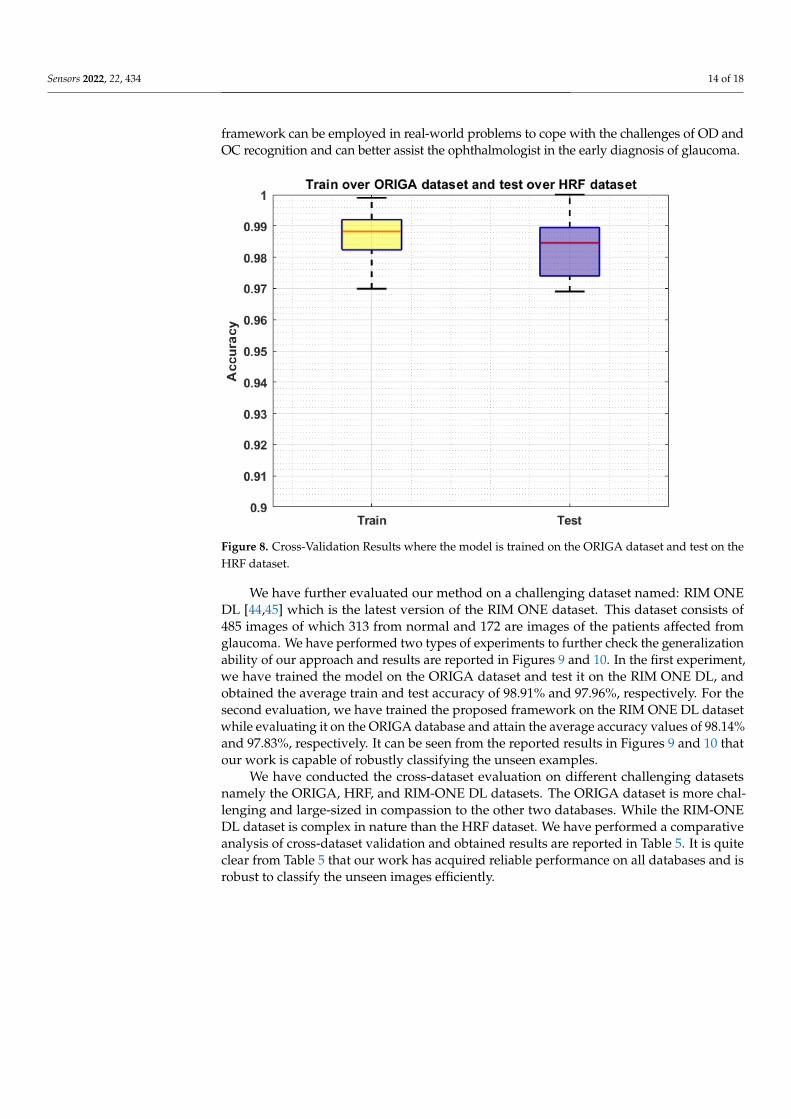
We conducted an analysis via evaluating the proposed solution over a cross-dataseton namely HRF [42]. This database contains 45 samples, of which 15 images are fromthe healthy human eye, while 15 images contain DR-affected regions, and the remaining15 samples are glaucomatous-affected. The performance analysis on a cross-dataset assiststo check the recognition accuracy of our approach in terms of its generalization abilityto real-world examples. Moreover, this experiment will help to determine whether oursystem is capable of dealing with the training and testing complexities. More explicitly,we have trained our system on the ORIGA dataset and tested it on the HRF database. Theobtained results are shown in Figure 8 by plotting the Boxplot, as it better demonstratesthe performance of the system by exhibiting the maximum, minimum, and median ofthe acquired accuracies. In this experiment, our approach shows the average accuraciesof 98.98% and 98.21% for the training and testing respectively which is concluding that our
Sensors 2022, 22, 434 14 of 18
framework can be employed in real-world problems to cope with the challenges of OD andOC recognition and can better assist the ophthalmologist in the early diagnosis of glaucoma.
Sensors 2022, 22, x FOR PEER REVIEW 15 of 19
obtained results are shown in Figure 8 by plotting the Boxplot, as it better demonstrates the performance of the system by exhibiting the maximum, minimum, and median of the acquired accuracies. In this experiment, our approach shows the average accuracies of 98.98% and 98.21% for the training and testing respectively which is concluding that our framework can be employed in real-world problems to cope with the challenges of OD and OC recognition and can better assist the ophthalmologist in the early diagnosis of glaucoma.
Figure 8. Cross-Validation Results where the model is trained on the ORIGA dataset and test on the HRF dataset.
We have further evaluated our method on a challenging dataset named: RIM ONE DL [44,45] which is the latest version of the RIM ONE dataset. This dataset consists of 485 images of which 313 from normal and 172 are images of the patients affected from glaucoma. We have performed two types of experiments to further check the generalization ability of our approach and results are reported in Figures 9 and 10. In the first experiment, we have trained the model on the ORIGA dataset and test it on the RIM ONE DL, and obtained the average train and test accuracy of 98.91% and 97.96%, respectively. For the second evaluation, we have trained the proposed framework on the RIM ONE DL dataset while evaluating it on the ORIGA database and attain the average accuracy values of 98.14% and 97.83%, respectively. It can be seen from the reported results in Figures 9 and 10 that our work is capable of robustly classifying the unseen examples.
Figure 8. Cross-Validation Results where the model is trained on the ORIGA dataset and test on theHRF dataset.
We have further evaluated our method on a challenging dataset named: RIM ONEDL [44,45] which is the latest version of the RIM ONE dataset. This dataset consists of485 images of which 313 from normal and 172 are images of the patients affected fromglaucoma. We have performed two types of experiments to further check the generalizationability of our approach and results are reported in Figures 9 and 10. In the first experiment,we have trained the model on the ORIGA dataset and test it on the RIM ONE DL, andobtained the average train and test accuracy of 98.91% and 97.96%, respectively. For thesecond evaluation, we have trained the proposed framework on the RIM ONE DL datasetwhile evaluating it on the ORIGA database and attain the average accuracy values of 98.14%and 97.83%, respectively. It can be seen from the reported results in Figures 9 and 10 thatour work is capable of robustly classifying the unseen examples.
We have conducted the cross-dataset evaluation on different challenging datasetsnamely the ORIGA, HRF, and RIM-ONE DL datasets. The ORIGA dataset is more chal-lenging and large-sized in compassion to the other two databases. While the RIM-ONEDL dataset is complex in nature than the HRF dataset. We have performed a comparativeanalysis of cross-dataset validation and obtained results are reported in Table 5. It is quiteclear from Table 5 that our work has acquired reliable performance on all databases and isrobust to classify the unseen images efficiently.

Sensors 2022, 22, 434 15 of 18Sensors 2022, 22, x FOR PEER REVIEW 16 of 19
Figure 9. Cross-Validation Results where the model is trained on the ORIGA dataset and test on the RIM ONE DL dataset.
Figure 10. Cross-Validation Results where the model is trained on the RIM ONE DL dataset and test on the ORIGA dataset.
We have conducted the cross-dataset evaluation on different challenging datasets namely the ORIGA, HRF, and RIM-ONE DL datasets. The ORIGA dataset is more challenging and large-sized in compassion to the other two databases. While the RIM-ONE DL dataset is complex in nature than the HRF dataset. We have performed a comparative analysis of cross-dataset validation and obtained results are reported in Table 5. It is quite clear from Table 5 that our work has acquired reliable performance on all databases and is robust to classify the unseen images efficiently.
Figure 9. Cross-Validation Results where the model is trained on the ORIGA dataset and test on theRIM ONE DL dataset.
Sensors 2022, 22, x FOR PEER REVIEW 16 of 19
Figure 9. Cross-Validation Results where the model is trained on the ORIGA dataset and test on the RIM ONE DL dataset.
Figure 10. Cross-Validation Results where the model is trained on the RIM ONE DL dataset and test on the ORIGA dataset.
We have conducted the cross-dataset evaluation on different challenging datasets namely the ORIGA, HRF, and RIM-ONE DL datasets. The ORIGA dataset is more challenging and large-sized in compassion to the other two databases. While the RIM-ONE DL dataset is complex in nature than the HRF dataset. We have performed a comparative analysis of cross-dataset validation and obtained results are reported in Table 5. It is quite clear from Table 5 that our work has acquired reliable performance on all databases and is robust to classify the unseen images efficiently.
Figure 10. Cross-Validation Results where the model is trained on the RIM ONE DL dataset and teston the ORIGA dataset.
Table 5. Performance comparison of cross-dataset validation.
Dataset ORIGA (Test) HRF (Test) RIM-ONE DL (Test)
ORIGA (trained) 97.20% 98.21% 97.96%RIM-ONE DL (trained) 97.83% 98.19% 97.85%
Sensors 2022, 22, 434 16 of 18
5. Conclusions
The manual recognition of the glaucomatous-affected regions from fundus samplesrequires trained human experts who can identify the small visible details and categorize theimages into relevant classes. However, because of the complex structure of the glaucoma-tous regions and the unreachability of domain experts, there is a need for a fully automatedsystem. In the introduced technique, we have presented a DL-based approach namedEfficientDet-D0 with EfficientNet-B0 as the base network for the automated localizationand categorization of glaucoma lesions from the retinal fundus images. We have tested ourapproach over the ORIGA database which is challenging in terms of variations of glaucomalesion size, color, position, and shapes. Moreover, to assess the generalization ability ofour framework to real-world problems, we perform cross-dataset validation on the HRFand RIM ONE DL datasets. For the ORIGA database, we obtain the average accuracyvalues of 97.2%, while for the HRF and RIM ONE DL databases, we obtain an averageaccuracy of 98.21% and 97.96% respectively. Both the visual and numeric comparisonconfirms that the used framework is more robust to glaucoma classification as comparedto other latest approaches and can certainly identify the lesions of variable masses fromthe samples with several image distortions. Therefore, this work can play a vital role inthe automated recognition and classification of the glaucomatous-affected regions. In thefuture, we plan to implement some feature section techniques and employed on deeplearning models [3,46–50]. Also our plan is to evaluate the work on other eye diseases.
Author Contributions: Conceptualization, M.N. and T.N.; Data curation, M.N. and A.J.; Formalanalysis, M.N., T.N. and A.J.; Funding acquisition, H.-S.Y. and J.C.; Investigation, A.J.; Methodology,T.N., A.J. and M.A.K.; Project administration, U.T., H.-S.Y. and M.A.K.; Resources, U.T.; Software,H.-S.Y. and J.C.; Supervision, T.N. and M.A.K.; Validation, U.T., M.A.K. and J.C.; Visualization, J.C.;Writing—review & editing, U.T., H.-S.Y., M.A.K. and J.C. All authors have read and agreed to thepublished version of the manuscript.
Funding: This work was supported by the National Research Foundation of Korea (NRF) grant fundedby the Korean government (Ministry of Science and ICT; MSIT) under Grant RF-2018R1A5A7059549.
Institutional Review Board Statement: Not Applicable.
Informed Consent Statement: Not Applicable.
Data Availability Statement: Not Applicable.
Conflicts of Interest: The authors declare no conflict of interest.
References1. Moreno, M.V.; Houriet, C.; Grounauer, P.A. Ocular Phantom-Based Feasibility Study of an Early Diagnosis Device for Glaucoma.
Sensors 2021, 21, 579. [CrossRef] [PubMed]2. Xu, Y.L.; Lu, S.; Li, H.X.; Li, R.R. Mixed maximum loss design for optic disc and optic cup segmentation with deep learning from
imbalanced samples. Sensors 2019, 19, 4401. [CrossRef]3. Syed, H.H.; Tariq, U.; Armghan, A.; Alenezi, F.; Khan, J.A.; Rho, S.; Kadry, S.; Rajinikanth, V. A Rapid Artificial Intelligence-Based
Computer-Aided Diagnosis System for COVID-19 Classification from CT Images. Behav. Neurol. 2021, 2021, 2560388. [CrossRef][PubMed]
4. Quigley, H.A.; Broman, A.T. The number of people with glaucoma worldwide in 2010 and 2020. Br. J. Ophthalmol. 2006, 90,262–267. [CrossRef]
5. Marsden, J. Glaucoma: The silent thief of sight. Nurs. Times 2014, 110, 20–22.6. Khan, M.A.; Akram, T.; Zhang, Y.-D.; Sharif, M. Attributes based skin lesion detection and recognition: A mask RCNN and
transfer learning-based deep learning framework. Pattern Recognit. Lett. 2021, 143, 58–66. [CrossRef]7. Razzak, M.I.; Naz, S.; Zaib, A. Deep learning for medical image processing: Overview, challenges and the future. Classif. BioApps
2018, 2, 323–350.8. Rehman, A.; Naz, S.; Razzak, M.I.; Akram, F.; Imran, M. A deep learning-based framework for automatic brain tumors
classification using transfer learning. Circuits Syst. Signal Process. 2020, 39, 757–775. [CrossRef]9. Akram, T.; Attique, M.; Gul, S.; Shahzad, A.; Altaf, M.; Naqvi, S.S.R.; Damaševicius, R.; Maskeliunas, R. A novel framework for
rapid diagnosis of COVID-19 on computed tomography scans. Pattern Anal. Appl. 2021, 24, 951–964. [CrossRef] [PubMed]

Sensors 2022, 22, 434 17 of 18
10. Tham, Y.-C.; Li, X.; Wong, T.Y.; Quigley, H.A.; Aung, T.; Cheng, C.Y. Global prevalence of glaucoma and projections of glaucomaburden through 2040: A systematic review and meta-analysis. Ophthalmology 2014, 121, 2081–2090. [CrossRef]
11. Nawaz, M.; Mehmood, Z.; Nazir, T.; Naqvi, R.A.; Rehman, A.; Iqbal, M.; Saba, T. Skin cancer detection from dermoscopic imagesusing deep learning and fuzzy k-means clustering. Microsc. Res. Tech. 2021, 85, 339–351. [CrossRef] [PubMed]
12. Khan, T.M.; Khan, M.A.; Rehman, N.U.; Naveed, K.; Afridi, I.U.; Naqvi, S.S.; Raazak, I. Width-wise vessel bifurcation forimproved retinal vessel segmentation. Biomed. Signal Process. Control 2022, 71, 103169. [CrossRef]
13. Dromain, C.; Boyer, B.; Ferré, R.; Canale, S.; Delaloge, S.; Balleyguier, C. Computed-aided diagnosis (CAD) in the detection ofbreast cancer. Eur. J. Radiol. 2013, 82, 417–423. [CrossRef]
14. Mehmood, A.; Iqbal, M.; Mehmood, Z.; Irtaza, A.; Nawaz, M.; Nazir, T.; Masood, M. Prediction of Heart Disease Using DeepConvolutional Neural Networks. Arab. J. Sci. Eng. 2021, 46, 3409–3422. [CrossRef]
15. Arshad, M.; Khan, M.A.; Tariq, U.; Armghan, A.; Alenezi, F.; Younus Javed, M.; Aslam, S.M.; Kadry, S. A Computer-AidedDiagnosis System Using Deep Learning for Multiclass Skin Lesion Classification. Comput. Intell. Neurosci. 2021, 2021, 9619079.[CrossRef] [PubMed]
16. Khan, I.A.; Moustafa, N.; Razzak, I.; Tanveer, M.; Pi, D.; Pan, Y.; Ali, B.S. XSRU-IoMT: Explainable simple recurrent units forthreat detection in Internet of Medical Things networks. Future Gener. Comput. Syst. 2022, 127, 181–193. [CrossRef]
17. Tan, M.; Pang, R.; Le, Q.V. Efficientdet: Scalable and efficient object detection. In Proceedings of the IEEE/CVF Conference onComputer Vision and Pattern Recognition, Seattle, WA, USA, 13–19 June 2020; pp. 10781–10790.
18. EfficientDet. Available online: https://github.com/xuannianz/EfficientDet (accessed on 5 September 2021).19. Shoba, S.G.; Therese, A.B. Detection of glaucoma disease in fundus images based on morphological operation and finite element
method. Biomed. Signal Process. Control. 2020, 62, 101986. [CrossRef]20. Pruthi, J.; Khanna, K.; Arora, S. Optic Cup segmentation from retinal fundus images using Glowworm Swarm Optimization for
glaucoma detection. Biomed. Signal Process. Control 2020, 60, 102004. [CrossRef]21. Kirar, B.S.; Reddy, G.R.S.; Agrawal, D.K. Glaucoma Detection Using SS-QB-VMD-Based Fine Sub-Band Images from Fundus
Images. IETE J. Res. 2021, 1–12. [CrossRef]22. Qureshi, I.; Khan, M.A.; Sharif, M.; Saba, T.; Ma, J. Detection of glaucoma based on cup-to-disc ratio using fundus images.
Int. J. Intell. Syst. Technol. Appl. 2020, 19, 1–16. [CrossRef]23. Guo, J.; Azzopardi, G.; Shi, C.; Jansonius, N.M.; Petkov, N. Automatic Determination of Vertical Cup-to-Disc Ratio in Retinal
Fundus Images for Glaucoma Screening. IEEE Access 2019, 7, 8527–8541. [CrossRef]24. Martins, J.; Cardoso, J.; Soares, F. Offline computer-aided diagnosis for Glaucoma detection using fundus images targeted at
mobile devices. Comput. Methods Programs Biomed. 2020, 192, 105341. [CrossRef]25. Nayak, D.R.; Das, D.; Majhi, B.; Bhandary, S.V.; Acharya, U.R. ECNet: An evolutionary convolutional network for automated
glaucoma detection using fundus images. Biomed. Signal Process. Control 2021, 67, 102559. [CrossRef]26. Shinde, R. Glaucoma detection in retinal fundus images using U-Net and supervised machine learning algorithms. Intell. Med.
2021, 5, 100038. [CrossRef]27. Song, W.T.; Lai, I.-C.; Su, Y.-Z. A Statistical Robust Glaucoma Detection Framework Combining Retinex, CNN, and DOE Using
Fundus Images. IEEE Access 2021, 9, 103772–103783. [CrossRef]28. Hemelings, R.; Elen, B.; Barbosa-Breda, J.; Lemmens, S.; Meire, M.; Pourjavan, S.; Vandewalle, E.; Van De Veire, S.; Blaschko, M.B.;
De Boever, P.; et al. Accurate prediction of glaucoma from colour fundus images with a convolutional neural network that relieson active and transfer learning. Acta Ophthalmol. 2019, 98, e94–e100. [CrossRef] [PubMed]
29. Ovreiu, S.; Paraschiv, E.-A.; Ovreiu, E. Deep Learning & Digital Fundus Images: Glaucoma Detection using DenseNet. InProceedings of the 2021 13th International Conference on Electronics, Computers and Artificial Intelligence (ECAI), Pitesti,Romania, 1–3 July 2021.
30. Serte, S.; Serener, A. Graph-based saliency and ensembles of convolutional neural networks for glaucoma detection.IET Image Process. 2020, 15, 797–804. [CrossRef]
31. Nazir, T.; Irtaza, A.; Starovoitov, V. Optic Disc and Optic Cup Segmentation for Glaucoma Detection from Blur Retinal ImagesUsing Improved Mask-RCNN. Int. J. Opt. 2021, 2021, 6641980. [CrossRef]
32. Nazir, T.; Irtaza, A.; Javed, A.; Malik, H.; Hussain, D.; Naqvi, R.A. Retinal Image Analysis for Diabetes-Based Eye DiseaseDetection Using Deep Learning. Appl. Sci. 2020, 10, 6185. [CrossRef]
33. Yu, S.; Xiao, D.; Frost, S.; Kanagasingam, Y. Robust optic disc and cup segmentation with deep learning for glaucoma detection.Comput. Med. Imaging Graph. 2019, 74, 61–71. [CrossRef]
34. Gómez-Valverde, J.J.; Antón, A.; Fatti, G.; Liefers, B.; Herranz, A.; Santos, A.; Sánchez, C.I.; Ledesma-Carbayo, M.J. Au-tomatic glaucoma classification using color fundus images based on convolutional neural networks and transfer learning.Biomed. Opt. Express 2019, 10, 892–913. [CrossRef]
35. Bajwa, M.N.; Malik, M.I.; Siddiqui, S.A.; Dengel, A.; Shafait, F.; Neumeier, W.; Ahmed, S. Two-stage framework for optic disclocalization and glaucoma classification in retinal fundus images using deep learning. BMC Med. Inform. Decis. Mak. 2019, 19, 136.
36. Zhao, R.; Liao, W.; Zou, B.; Chen, Z.; Li, S. Weakly-Supervised Simultaneous Evidence Identification and Segmentation forAutomated Glaucoma Diagnosis. Proc. Conf AAAI Artif. Intell. 2019, 33, 809–816. [CrossRef]
37. Liao, W.; Zou, B.; Zhao, R.; Chen, Y.; He, Z.; Zhou, M. Clinical Interpretable Deep Learning Model for Glaucoma Diagnosis.IEEE J. Biomed. Health Inform. 2019, 24, 1405–1412. [CrossRef] [PubMed]

Sensors 2022, 22, 434 18 of 18
38. Aceto, G.; Ciuonzo, D.; Montieri, A.; Pescapé, A. Toward effective mobile encrypted traffic classification through deep learning.Neurocomputing 2020, 409, 306–315. [CrossRef]
39. Hinton, G.E.; Osindero, S.; Teh, Y.-W. A Fast Learning Algorithm for Deep Belief Nets. Neural Comput. 2006, 18, 1527–1554.[CrossRef] [PubMed]
40. Aceto, G.; Ciuonzo, D.; Montieri, A.; Pescapé, A. MIMETIC: Mobile encrypted traffic classification using multimodal deeplearning. Comput. Netw. 2019, 165, 106944. [CrossRef]
41. Alsajri, M.; Ismail, M.A.; Abdul-Baqi, S. A review on the recent application of Jaya optimization algorithm. In Proceedings of the2018 1st Annual International Conference on Information and Sciences (AiCIS), Fallujah, Iraq, 20–21 November 2018.
42. Ibraheem, H.R.; Hussain, Z.F.; Ali, S.M.; Aljanabi, M.; Mohammed, M.A.; Sutikno, T. A new model for large dataset dimensionality re-duction based on teaching learning-based optimization and logistic regression. TELKOMNIKA Telecommun. Comput. Electron. Control.2020, 18, 1688–1694. [CrossRef]
43. Fu, H.; Cheng, J.; Xu, Y.; Zhang, C.; Wong, D.W.K.; Liu, J.; Cao, X. Disc-Aware Ensemble Network for Glaucoma Screening FromFundus Image. IEEE Trans. Med. Imaging 2018, 37, 2493–2501. [CrossRef]
44. Fumero, F.; Alayón, S.; Sigut, J.; Sánchez, J.L.; SÁnchez, J.; González, M.; Gonzalez-Hern, M. RIM-ONE: An open retinal imagedatabase for optic nerve evaluation. In Proceedings of the 2011 24th International Symposium on Computer-Based MedicalSystems (CBMS), Bristol, UK, 27–30 June 2011.
45. Batista, F.J.F.; Diaz-Aleman, T.; Sigut, J.; Alayon, S.; Arnay, R.; Angel-Pereira, D. RIM-ONE DL: A Unified Retinal Image Databasefor Assessing Glaucoma Using Deep Learning. Image Anal. Ster. 2020, 39, 161–167. [CrossRef]
46. Muhammad, K.; Sharif, M.; Akram, T.; Kadry, S. Intelligent fusion-assisted skin lesion localization and classification for smarthealthcare. Neural Comput. Appl. 2021, 31, 1–16.
47. Rashid, M.; Sharif, M.; Javed, K.; Akram, T. Classification of gastrointestinal diseases of stomach from WCE using improvedsaliency-based method and discriminant features selection. Multimed. Tools Appl. 2019, 78, 27743–27770.
48. Sharif, M.; Akram, T.; Kadry, S.; Hsu, C.H. A two-stream deep neural network-based intelligent system for complex skin cancertypes classification. Int. J. Intell. Syst. 2021, 2, 1–26.
49. Imran, T.; Sharif, M.; Tariq, U.; Zhang, Y.-D.; Nam, Y.; Nam, Y.; Kang, B.-G. Malaria Blood Smear Classification Using DeepLearning and Best Features Selection. Comput. Mater. Contin. 2021, 71, 1–15. [CrossRef]
50. Zia, F.; Irum, I.; Qadri, N.N.; Nam, Y.; Khurshid, K.; Ali, M.; Ashraf, I. A Multilevel Deep Feature Selection Framework forDiabetic Retinopathy Image Classification. Comput. Mater. Contin. 2022, 70, 2261–2276. [CrossRef]