Scotopic Threshold Response and Scotopic PII in Glaucoma
7
Scotopic Threshold Response and Scotopic PII in Glaucoma Matthias Korth,* Nhung X. Nguyen,* Folkert Horn* and Peter Martusf Purpose. The value of the ERG scotopic threshold response (STR), which is known to originate in the proximal retina and of the near-threshold scotopic PII (B-wave), was studied in glaucoma. Methods. Full-field single flashes were presented under scotopic conditions in two subject groups, a glaucoma group (n = 30) and a normal control group (n = 35). The intensity level for evoking STR was where the maximum response occurs, whereas the intensity level for evoking scotopic PII was where the response begins to appear. Results. The STR is only slightly reduced in glaucoma (P = 0.046), but scotopic PII is signifi- cantly diminished (P < 0.0001). Conclusions. The relatively intact STR in glaucoma suggests that structures responsible for its generation are less damaged in glaucoma than those responsible for scotopic PII. Invest Oph- thalmol Vis Sci. 1994;35:619-625. J. he conventional human single-flash electroretino- gram (ERG) has long been regarded as of low value in the diagnosis of chronic simple glaucoma, 1 " 5 whereas in acute cases supernormal as well as subnormal re- sponses have been noted. 235 ' 6 After the observation that ERGs evoked by pat- tern-reversal stimuli (PERG) can be abolished in cats 7 or monkeys 8 with complete optic atrophy after sec- tioning the optic nerve while the conventional lumi- nance ERG remains normal, it has been concluded that the retinal ganglion cells play an important role in the generation of the PERG. Current-source-density analyses in the monkey showed that the PERG origi- nates in proximal retinal layers, and the flash-evoked B-wave is generated in distal parts. 9 In humans, it has been shown that in optic atrophy the PERG can be either missing 10 or strongly altered. 11 Because gan- glion cell losses make glaucoma an optic nerve disease, the PERG has been applied successfully in many centers as an adjunct in glaucoma diagnosis. 12 " 16 However, recent studies on the flash-ERG re- ported contradictory results. Thus, because Alvis 17 From the *Deparlments of Ophthalmology and f Medical Statistics and Documentation, University of Erlangen-Niirnberg, Erlangen, Germany. Supported by the Alexander von Humboldt Foundation, the J. and F. Marohn Foundation, and the Deutsche Forschungsgemeinschaft (Bonn, Germany, N9 55/ 6-1). Submitted for publication April 22, 1993; revised July 12, 1993; accepted July 21, 1993. Proprietary interest category: P, C38. Reprint requests: Dr. Matthias Korth, Department of Ophthalmology, University of Erlangen-Niirnberg, Schwabachanlage 6, 91054 Erlangen, Germany. and Lowitzsch and Welt 18 found the photopic A-wave to be reduced, a disorder of the cones was assumed in glaucoma. Bartl 19 observed that in an interocular com- parison of patients with glaucoma, the amplitudes of the scotopic and photopic A- and B-waves tended to be smaller in the eye with the larger visual field defect. Similar results were observed with the scotopic B-wave by Vass et al. 20 Fazio et al, 21 using the standard ERG protocol, 22 found in patients with glaucoma signifi- cantly reduced A-waves and delayed implicit times of the A-wave and of the scotopic B-wave. No significant reductions of the B-wave were found. Another ERG component that has recently re- ceived attention in glaucoma diagnosis is the oscilla- tory potential (OP) which, like the PERG, seems to originate in the proximal retina. 23 Gur et al, 24 Vass et al, 20 and Vaegan et al 25 found OP reductions in glau- coma that were correlated with the severity of the glaucomatous field defects. 20 ' 24 A further flash-evoked ERG component originat- ing in the proximal retina is the scotopic threshold response (STR), a potential wave that has the lowest threshold of all components and, thus, depends on the rods. Because of its cornea-negative polarity, it has been mistaken for a long time as a receptor potential. 26 However, Sieving et al 27 and Wakabayashi et al 28 were able to show in cat and monkey that the STR originates in the proximal retina. Similar properties of this re- sponse component have been shown to exist also in humans. 29 The STR has been shown to be reduced or Investigative Ophthalmology & Visual Science, February 1994, Vol. 35, No. 2 Copyright © Association for Research in Vision and Ophthalmology 619
-
Upload
independent -
Category
Documents
-
view
3 -
download
0
Transcript of Scotopic Threshold Response and Scotopic PII in Glaucoma

Scotopic Threshold Response and Scotopic PIIin Glaucoma
Matthias Korth,* Nhung X. Nguyen,* Folkert Horn* and Peter Martusf
Purpose. The value of the ERG scotopic threshold response (STR), which is known to originatein the proximal retina and of the near-threshold scotopic PII (B-wave), was studied in glaucoma.
Methods. Full-field single flashes were presented under scotopic conditions in two subjectgroups, a glaucoma group (n = 30) and a normal control group (n = 35). The intensity level forevoking STR was where the maximum response occurs, whereas the intensity level for evokingscotopic PII was where the response begins to appear.
Results. The STR is only slightly reduced in glaucoma (P = 0.046), but scotopic PII is signifi-cantly diminished (P < 0.0001).
Conclusions. The relatively intact STR in glaucoma suggests that structures responsible for itsgeneration are less damaged in glaucoma than those responsible for scotopic PII. Invest Oph-thalmol Vis Sci. 1994;35:619-625.
J. he conventional human single-flash electroretino-gram (ERG) has long been regarded as of low value inthe diagnosis of chronic simple glaucoma,1"5 whereasin acute cases supernormal as well as subnormal re-sponses have been noted.235'6
After the observation that ERGs evoked by pat-tern-reversal stimuli (PERG) can be abolished in cats7
or monkeys8 with complete optic atrophy after sec-tioning the optic nerve while the conventional lumi-nance ERG remains normal, it has been concludedthat the retinal ganglion cells play an important role inthe generation of the PERG. Current-source-densityanalyses in the monkey showed that the PERG origi-nates in proximal retinal layers, and the flash-evokedB-wave is generated in distal parts.9 In humans, it hasbeen shown that in optic atrophy the PERG can beeither missing10 or strongly altered.11 Because gan-glion cell losses make glaucoma an optic nerve disease,the PERG has been applied successfully in manycenters as an adjunct in glaucoma diagnosis.12"16
However, recent studies on the flash-ERG re-ported contradictory results. Thus, because Alvis17
From the *Deparlments of Ophthalmology and f Medical Statistics andDocumentation, University of Erlangen-Niirnberg, Erlangen, Germany.Supported by the Alexander von Humboldt Foundation, the J. and F. MarohnFoundation, and the Deutsche Forschungsgemeinschaft (Bonn, Germany, N9 55/6-1).Submitted for publication April 22, 1993; revised July 12, 1993; accepted July 21,1993.Proprietary interest category: P, C38.Reprint requests: Dr. Matthias Korth, Department of Ophthalmology, University ofErlangen-Niirnberg, Schwabachanlage 6, 91054 Erlangen, Germany.
and Lowitzsch and Welt18 found the photopic A-waveto be reduced, a disorder of the cones was assumed inglaucoma. Bartl19 observed that in an interocular com-parison of patients with glaucoma, the amplitudes ofthe scotopic and photopic A- and B-waves tended to besmaller in the eye with the larger visual field defect.Similar results were observed with the scotopic B-waveby Vass et al.20 Fazio et al,21 using the standard ERGprotocol,22 found in patients with glaucoma signifi-cantly reduced A-waves and delayed implicit times ofthe A-wave and of the scotopic B-wave. No significantreductions of the B-wave were found.
Another ERG component that has recently re-ceived attention in glaucoma diagnosis is the oscilla-tory potential (OP) which, like the PERG, seems tooriginate in the proximal retina.23 Gur et al,24 Vass etal,20 and Vaegan et al25 found OP reductions in glau-coma that were correlated with the severity of theglaucomatous field defects.20'24
A further flash-evoked ERG component originat-ing in the proximal retina is the scotopic thresholdresponse (STR), a potential wave that has the lowestthreshold of all components and, thus, depends on therods. Because of its cornea-negative polarity, it hasbeen mistaken for a long time as a receptor potential.26
However, Sieving et al27 and Wakabayashi et al28 wereable to show in cat and monkey that the STR originatesin the proximal retina. Similar properties of this re-sponse component have been shown to exist also inhumans.29 The STR has been shown to be reduced or
Investigative Ophthalmology & Visual Science, February 1994, Vol. 35, No. 2Copyright © Association for Research in Vision and Ophthalmology 619
620 Investigative Ophthalmology & Visual Science, February 1994, Vol. 35, No. 2
absent in different retinal diseases, such as retinal dys-trophic diseases,30 diabetes mellitus,31 and X-linkedretinoschisis.32 The fact that the STR originates in in-ner retinal layers suggests that this response might beaffected also in glaucoma. On the other hand, Siev-ing33 has demonstrated that in complete optic atrophyin the cat and in humans, the STR is still recordablewhile its time course looks altered, which led to theconclusion that ganglion cells are not involved in itsgeneration. The STR has been shown to be closelycorrelated with the psychophysical absolute thresholdin various eye diseases, including glaucoma.30
The present investigation addresses the questionof whether and to what extent the STR is affected inglaucoma. In addition, stimuli were employed to exam-ine small scotopic PII responses. The ERG responsewith the next higher threshold is Granit's34 positivecomponent PII, which is probably composed of twoparts, the direct current component and the B-wave.35
Because it could not be decided in the present studywhether the response was a DC component or a B-wave, the term "PII" is used throughout this investi-gation.
MATERIALS AND METHODS
Stimulus
The light of a 150W Xenon arc lamp (Cermax, Sunny-vale, CA) was transmitted via glass fiberoptics into a 58cm diameter hemisphere to provide homogeneous,white, full-field stimuli. The hemisphere and the lightsource were in different rooms to protect the.subjectfrom ambient light. Each flash had a length of 8 msdelivered by activating an electromagnetic shutter(Schwarzer) located between the lamp and the lightguide. It was driven by a digital function generator(NF Electronics [Yokohama, Japan] DF-194A) via apower amplifier (Schwarzer, Miinchen, Germany).Rise and fall times of the flash were <1 ms.
The stimulus intensity was varied by neutral den-sity filters (Schott, Mainz, Germany). The maximumstimulus luminance available was 20 cd/m2 (digitalphotometer Tektronix [Beaverton, OR] J16, NITsprobe J6603). By taking into account the individualpupil width (see below), the retinal illuminance for re-cording the STR was adjusted to 0.184 scotopic Td(1.472 X 10"3 Td sec) in all subjects, and the intensityfor eliciting scotopic PII was 1 log unit higher.
Recording
The ERG was recorded monocularly with a Henkes-type electrode, the reference electrode was on the ipsi-lateral canthus, and the linked earlobes served asground. After appropriate amplification (HP 8875A,3 dB points at 0.01 and 100 Hz), all responses werestored separately in a digital computer (IBM-AT[Miinchen, Germany] PC) equipped with a 16 single-
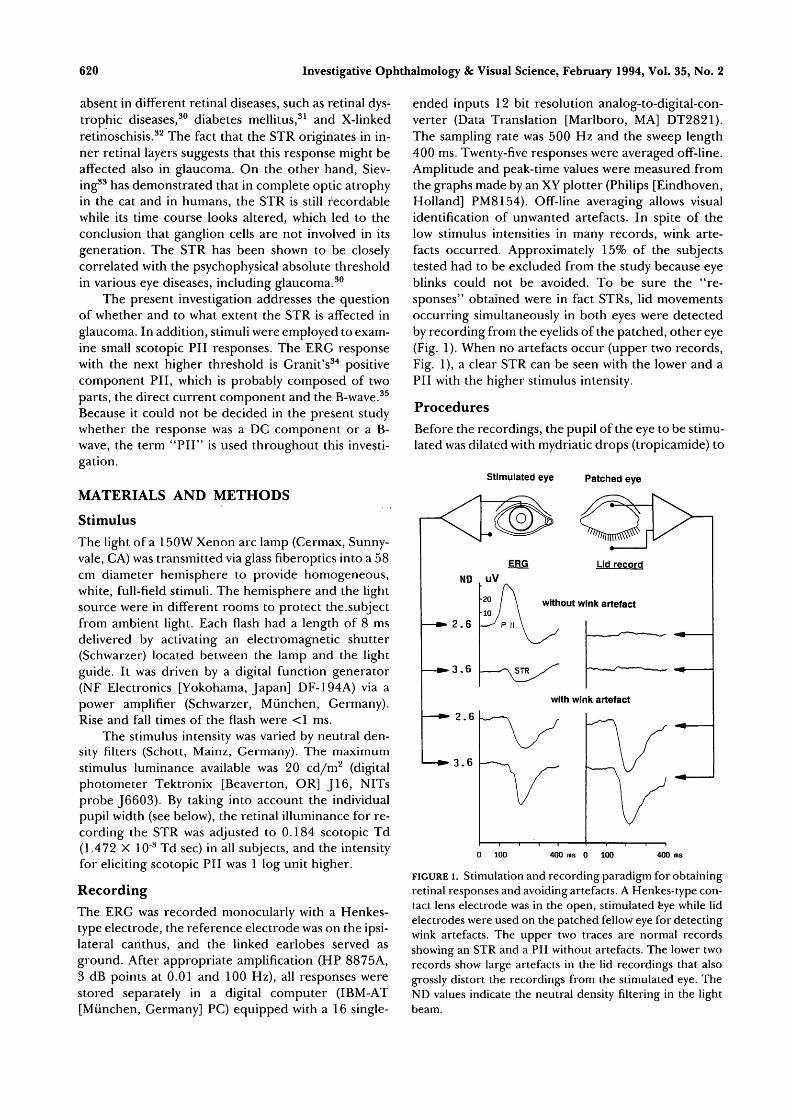
ended inputs 12 bit resolution analog-to-digital-con-verter (Data Translation [Marlboro, MA] DT2821).The sampling rate was 500 Hz and the sweep length400 ms. Twenty-five responses were averaged off-line.Amplitude and peak-time values were measured fromthe graphs made by an XY plotter (Philips [Eindhoven,Holland] PM8154). Off-line averaging allows visualidentification of unwanted artefacts. In spite of thelow stimulus intensities in many records, wink arte-facts occurred. Approximately 15% of the subjectstested had to be excluded from the study because eyeblinks could not be avoided. To be sure the "re-sponses" obtained were in fact STRs, lid movementsoccurring simultaneously in both eyes were detectedby recording from the eyelids of the patched, other eye(Fig. 1). When no artefacts occur (upper two records,Fig. 1), a clear STR can be seen with the lower and aPII with the higher stimulus intensity.
ProceduresBefore the recordings, the pupil of the eye to be stimu-lated was dilated with mydriatic drops (tropicamide) to
Stimulated eye Patched eye
ERG
ND
2 . 6
3 . 6
2 . 6
3 . 6
without wink artefact
with wink artefact
400 ms 0 100 400 ms
FIGURE 1. Stimulation and recording paradigm for obtainingretinal responses and avoiding artefacts. A Henkes-type con-tact lens electrode was in the open, stimulated eye while lidelectrodes were used on the patched fellow eye for detectingwink artefacts. The upper two traces are normal recordsshowing an STR and a PII without artefacts. The lower tworecords show large artefacts in the lid recordings that alsogrossly distort the recordings from the stimulated eye. TheND values indicate the neutral density filtering in the lightbeam.
STR and PII in Glaucoma 621
widths of 6 to 9 mm. To ensure constant retinal illumi-nation, the neutral density filters were adjusted ac-cording to the different pupil areas. All subjects werefirst dark adapted for 20 minutes with skin electrodesin place. Then the contact lens electrode was insertedunder dim red light, and another 10 minutes of darkadaptation ensued before the recordings began. Thelight flashes were presented at intervals of about 6seconds.
SUBJECTS AND PATIENTS
Normal Subjects
Thirty-five normal subjects (age, 50.3 ± 14.3 years,mean ± SD) entered the study. They were recruitedfrom among the hospital staff and from among pa-tients being treated for various reasons on only oneeye who had a normal fellow eye. Thorough ophthal-mologic examination determined that all normal eyeswere free of abnormality. Intraocular pressures were< 21 mm Hg, optic discs were normal, optic mediawere clear, visual fields were normal, and visual acui-ties were normal (1.03 ± 0.15, mean ± SD). If therewere two normal eyes, one was chosen at random.
Patients With GlaucomaThirty eyes of 30 patients with glaucoma (age 58.1 ±16.4 years, mean ± SD) were evaluated for the study.The mean age differed significantly between the pa-tients with glaucoma and the normal subjects (P =0.0168, Mann Whitney test.36) Thus, age-dependentparameters were examined after age corrections (seebelow). The diagnosis was based on the usual criteria:IOP > 21 mm Hg, visual field defects, and optic discdamage. IOPs were measured by Goldmann applana-tion tonometry. Visual fields were determined with acomputerized static projection perimeter (Octopus[Schlieren, Switzerland] program Gl). The mean de-fect ranged between 4.6 and 28.7 dB (16 ± 6.7 dB,mean ± SD). Glaucomatous disc damage was deter-mined from cup-disc ratios (C/D) and neuroretinalrim (NRR) areas of the optic disc measured from 15color optic-disc photographs.37'38 The average of thevertical and horizontal C/D ratio ranged between 0.49and 0.97 (0.84 ±0.11, mean ± SD) and the NRR arearanged between 0.25 and 1.4 mm2 (0.7 ± 0.37, mean ±SD). Only one eye, the one with the stronger optic-discdamage, was selected for examination.
The following forms of glaucoma were examined:primary (21 cases), juvenile open-angle glaucoma (1case), angle-closure glaucoma (1 case), secondaryopen-angle glaucoma (7 cases [4 pseudoexfoliatonsyndrome, 1 Sturge-Weber syndrome, 1 pigment dis-persion syndrome, 1 after blunt trauma]). The follow-ing treatments were administered: 7 laser trabeculo-plasty, 3 trabeculectomy, 3 YAG-iridotomy, 1 gonio-trepanation. Twenty-one eyes were treated with beta
blockers, 13 eyes with pilocarpine, and 10 eyes withclonidin.
This research followed the tenets of the Declara-tion of Helsinki. All subjects and patients gave theirinformed consent after the nature and possible conse-quences of the study were explained. The research wasapproved by the institutional human experimentationcommittee. The subjects did not suffer from generaldiseases that could involve the eye (e.g., diabetes, se-vere arterial hypertony).
Statistical Analysis
Comparisons between patient groups and normal sub-jects were conducted using Mann-Whitney test36 de-pendencies among physiological parameters, and ageswere assessed using Pearsons Correlation Coeffi-cient.36 Finally, a logistic regression analysis36 was per-formed; all statistical calculations were performed us-ing SPSS/PC 4.01.
There was no need for an age correction of theSTR, but PII values had to be age corrected. First, wedivided all values by the estimated value from the re-gression line of the normal subjects. This procedurenot only adjusts for the age dependency of the values(as the simple difference of observed values and ex-pected values from regression on age would do), it alsotakes into account that deviations from the regressionline increase with age. The resulting quotient then wasmultiplied by the mean value of the normal subjects.This constant factor transforms the values back to theoriginal scale and has no influence on significancetesting. Then an optimal discriminating cutpoint wasidentified for the age-corrected values (see below).After this procedure, the classification "glaucoma"requires greater deviations from the regression linefor lower ages than for higher ones. This is due to thegreater biologic variability for younger normal sub-jects compared with older ones (Fig. 3).
The discrimination between groups was calculatedusing a univariate logistic regression. This model usesthe logistic transformation
probY = In (1 — prob)
Regression analysis is then performed on the valuesofY:
Y = a0 + a, *Xj.
a0 is estimated depending on the size of the glau-coma-normal group, Xj is the value of PII, and al is anestimated coefficient measuring the predictive impor-tance of PII.
RESULTS
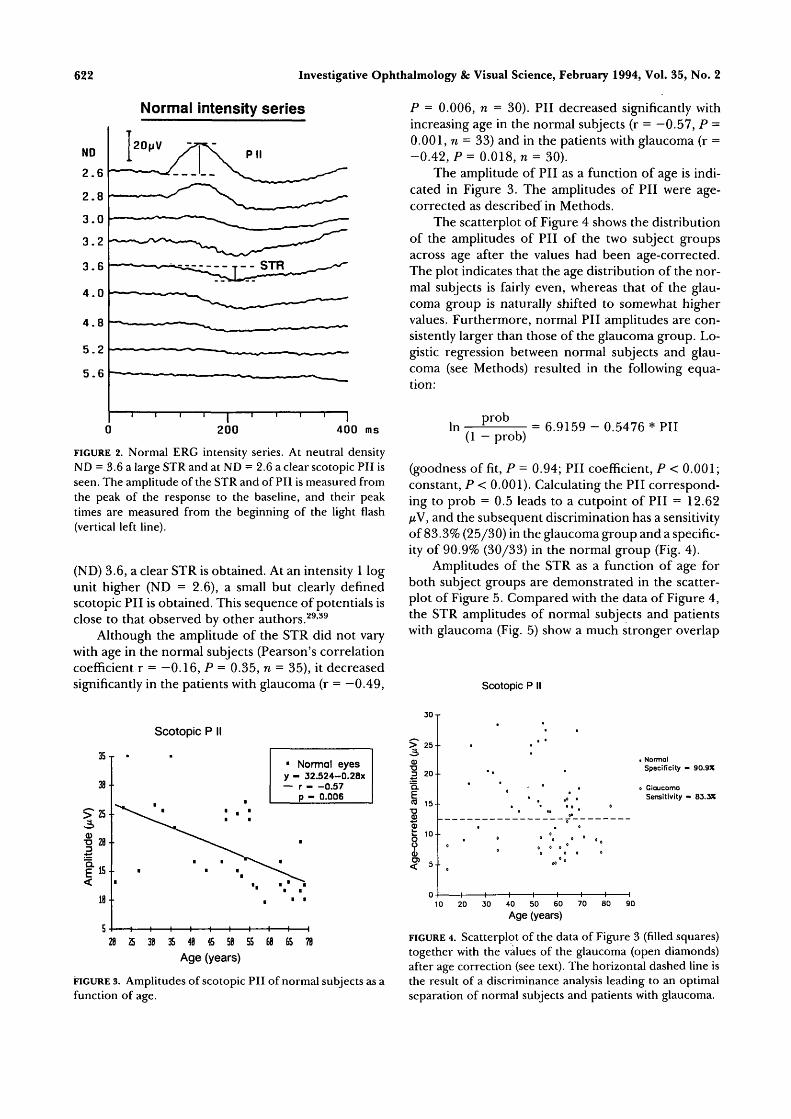
Figure 2 shows ERG recordings obtained from a nor-mal eye for different intensities. At neutral density
622 Investigative Ophthalmology 8c Visual Science, February 1994, Vol. 35, No. 2
Normal intensity series
i400 ms
FIGURE 2. Normal ERG intensity series. At neutral densityND = 3.6 a large STR and at ND = 2.6 a clear scotopic PII isseen. The amplitude of the STR and of PII is measured fromthe peak of the response to the baseline, and their peaktimes are measured from the beginning of the light flash(vertical left line).
(ND) 3.6, a clear STR is obtained. At an intensity 1 logunit higher (ND = 2.6), a small but clearly dennedscotopic PII is obtained. This sequence of potentials isclose to that observed by other authors.29'39
Although the amplitude of the STR did not varywith age in the normal subjects (Pearson's correlationcoefficient r = —0.16, P = 0.35, n = 35), it decreasedsignificantly in the patients with glaucoma (r = —0.49,
P = 0.006, n = 30). PII decreased significantly withincreasing age in the normal subjects (r = —0.57, P =0.001, n = 33) and in the patients with glaucoma (r =-0.42, P= 0.018, n = 30).
The amplitude of PII as a function of age is indi-cated in Figure 3. The amplitudes of PII were age-corrected as described in Methods.
The scatterplot of Figure 4 shows the distributionof the amplitudes of PII of the two subject groupsacross age after the values had been age-corrected.The plot indicates that the age distribution of the nor-mal subjects is fairly even, whereas that of the glau-coma group is naturally shifted to somewhat highervalues. Furthermore, normal PII amplitudes are con-sistently larger than those of the glaucoma group. Lo-gistic regression between normal subjects and glau-coma (see Methods) resulted in the following equa-tion:
In(1 - prob)
= 6.9159 - 0.5476 * PII
(goodness of fit, P = 0.94; PII coefficient, P < 0.001;constant, P < 0.001). Calculating the PII correspond-ing to prob = 0.5 leads to a cutpoint of PII = 12.62/xV, and the subsequent discrimination has a sensitivityof 83.3% (25/30) in the glaucoma group and a specific-ity of 90.9% (30/33) in the normal group (Fig. 4).
Amplitudes of the STR as a function of age forboth subject groups are demonstrated in the scatter-plot of Figure 5. Compared with the data of Figure 4,the STR amplitudes of normal subjects and patientswith glaucoma (Fig. 5) show a much stronger overlap
Scotopic P II
35 T
Scotopic P II
1 Normal eyesy - 32.524-0.28x— r 0.57
p - 0.006
S 38 35 48 45 58 55 68 65 7B
Age (years)
FIGURE 3. Amplitudes of scotopic PII of normal subjects as afunction of age.
> 25--
a>E 20
15--
t 10--
i NormalSpecificity - 90.9X
GlaucomoSensitivity - 83.3%
20 30 40 50 60 70
Age (years)80 90
FIGURE 4. Scatterplot of the data of Figure 3 (filled squares)together with the values of the glaucoma (open diamonds)after age correction (see text). The horizontal dashed line isthe result of a discriminance analysis leading to an optimalseparation of normal subjects and patients with glaucoma.

STR and PII in Glaucoma
STR
9j •
8- . . .• • 0
^ 7 . . 0
4--
3-
0 C» * 3
O O I > O 0
Normal
glaucoma
10 20 30 40 50 60 70 80 90Age (years)
FIGURE 5. Scatterplot of the STR amplitudes as a function ofage for normal subjects (filled squares) and patients withglaucoma (open diamonds).
and, thus, are of less value in discriminating betweenthe two groups.
Figure 6 shows the amplitude histograms of theSTR (A) and of scotopic PII (B) for the two groupsinvestigated. Because the amplitude of the STR didnot depend on age, a correction was not necessary.However, the PII amplitude data in Figure 4 are age-corrected. An inspection of Figure 6 shows that scoto-pic PII in the glaucoma group is clearly smaller. Table1, which tabulates the mean amplitude values and theirstandard deviations, indicates that this difference isstatistically significant (Mann Whitney test, P < 0.0001[36]). The STR of the glaucoma patients is only slightly
623
smaller than in the normal subjects (P = 0.046). Table2 indicates the mean values of the peak times and theirstandard deviations. The peak time of both the STRand the PII is not significantly delayed in the glaucomagroup compared with the normal group.
Further analysis indicated that higher STR valuescorresponded to higher (age corrected) PII values inthe normal group (r = 0.57, P = 0.001). In the glau-coma group, there was a (insignificant) reversal rela-tion between STR and PII values (r = -0.24, P =0.196%, n = 30). Finally, there was no significantcorrelation between the NNR area and the amplitudeof PII in the glaucoma group (r = 0.364, P = 0.095, n= 30) on the one hand and no significant correlationbetween visual acuity and PII amplitude on the other(r = 0.02, P= 0.298, n = 21).
DISCUSSION
The most important finding of the present study is theobservation that in glaucoma, the STR maximum am-plitude is not strongly affected, whereas the "near-threshold" scotopic PII is significantly reduced. Theresults show that the exclusion of wink artefacts (Fig.1) is an important prerequisite. Because the STR is notreduced in optic atrophy (see Introduction), the unaf-fected STR in glaucoma as described in this study isnot surprising although the pathogenesis of this dis-ease is probably different from simple descending op-tic atrophy. Since Sieving33 found a complete loss ofganglion cells in the cat after experimental sectioningof the optic nerve while amacrine cells were present,he suspects that the latter are involved in generating orcontrolling the STR. If this assumption also is correct
A) STR Q) Scotopic P
Glaucoma
Normal
0.75 2.25 3.75 5.25 6.75 8.25 9.75
Amplitude
Q)
- ^ 1 1 1
. ,1,1,1,1,1,2.25 6.75 11.25 15.75 28.25 24.75 29.25
Amplitude
Glaucoma
Normal
FIGURE 6. Amplitude histograms of the STR (A) and of scotopic PII (B) for the two subjectgroups examined.
624 Investigative Ophthalmology & Visual Science, February 1994, Vol. 35, No. 2
TABLE l. Amplitudes and Significances of the STR and ScotopicPI I in Two Groups of Subjects Examined
NormalGlaucoma
TABLE 2.
NormalGlaucoma
n
3530
Peak Times
n
3530
STR (nV)(Mean ± SD)
6.0 ± 1.55.3 ±1.3 P
of the STR and
STR(ms)(Mean ± SD)
186.4 ± 20.9196.8 ± 23.5
= 0.046
the B-Wave
P = 0.08
PII (nV)(Mean ± SD)
18.4 ± 7.29.29 ±3.8 P< 0.001
(Otherwise as Above)
PII (ms)(Mean ± SD)
147.3 ± 14.7140.7 ±17.3 P=0.11
in the human, glaucomatous optic atrophy does notseem to affect the amacrine cells either. Recently,Frishman, Robson, and Du40 have shown that in thecat, the STR may be comprised of more than one com-ponent, one of which may arise from the ganglion cellsand one not. If one component survives optic nervesection or perhaps glaucomatous damage in humans,this would explain the preservation of the STR and thealtered response wave form as observed by Sieving33
after optic atrophy. The present observation also indi-cates that scotopic PII can be sensitive to glaucomadamage, especially when near-threshold intensities areused that are far below the standard flash intensityused for conventional ERG testing.
Figure 2 shows that the amplitude of the STR in-creases with stimulus intensity, reaches a plateau, anddecreases with further rise of the stimulus level be-cause of the interference with increasing PII. This be-havior has been demonstrated before in V-log-I func-tions of the human39 and of the cat and monkey.28
Although the threshold intensity for evoking an STRshows some interindividual variability,39 the intensityused here to study the STR in larger populations isprobably near the amplitude plateau of the response(Fig. 2). The situation is different with the intensityused to evoke scotopic PII. It is well known that theB-wave reaches an amplitude plateau with increasingintensity that can be followed by a response decrease.However, the stimulus used here is at a level where theV-log-I function of PII is at the beginning of its rise.These differences in portion of the operating rangefor STR and B-wave may have implications for glau-coma. If the STR was saturated by the stimulus in nor-mal subjects, it might not appear to be affected whensensitivity is slightly reduced. Furthermore, the STRdid not get bigger, suggesting a selective loss of PIIthat normally interferes with it.
Thus, although recording the STR is of little use inthe diagnosis of glaucoma, the near-threshold scotopicPII is sensitive to glaucoma damage.
Key Words
glaucoma, electroretinogram, scotopic threshold response,PII, B-wave
References1. Leydhecker G. The electroretinogram in glaucoma-
tous eyes. BrJ Ophthalmol. 1950;34:550-554.2. Henkes HE. Electroretinography: An evaluation of
the influence of the retinal and general metabolic con-dition on the electrical response of the retina. Am JOphthalmol. 1957;43:67-81.
3. Francois J. L'electroretinographie dans le glaucome.Ada Ophthalmol. 1953;31:205-218.
4. Straub W. Das Elektroretinogramm: Experimented undklinische Beobachtungen. Stuttgart: Ferdinand EnkeVerlag; 1961.
5. Schmoger E, Zimmer W. Das Elektroretinogramm beiprimarem Glaukom. Klin Mbl Augenheilk. 1965;146:122-123.
6. Karpe G, Wulfing B. The ERG in rapid changes ofocular tension. Ophthalmologica. 1961;142:210-213.
7. MafFei L, Fiorentini A. Electroretinographic re-sponses to alternating gratings before and after sec-tion of the optic nerve. Science. 1981 ;211:953-955.
8. Maffei L, Fiorentini A, Bisti S, Hollander H. PatternERG in the monkey after section of the optic nerve.Exp Brain Res. 1985;59:423-425.
9. Baker CL, Hess RF, Olsen BT, Zrenner E. Currentsource density analysis of linear and non-linear compo-nents of the primate electroretinogram. J Physiol.1988;4O7:155-176.
10. Groneberg A, Teping C. Topodiagnostik von Seh-storungen durch Ableitung retinaler und kortikalerAntworten auf Umkehr-Kontrastmuster. Ber DtschOphthalmol Ges. 1980;77:409-4l7.
11. Harrison JM, O'Connor PS, Young RSL, Kincaid M,Bentley R. The pattern ERG in man following surgicalresection of the optic nerve. Invest Ophthalmol Vis Sci.1987;28:492-499.
12. Papst N, Bopp M, Schnaudigel OE. Pattern electroreti-nogram and visually evoked cortical potentials in glau-coma. Graefe's Arch Clin Exp Ophthalmol. 1984;222:29-33.
STR and PII in Glaucoma 625
13. Trick G. PRRP abnormalities in glaucoma and ocularhypertension. Invest Ophthalmol Vis Sci.1986;27:1730-1736.
14. Wanger P, Persson HE. Pattern-reversal electroretino-grams from normotensive, hypertensive and glauco-matouseyes. Ophthalmologies 1987;195:205-208.
15. Weinstein GW, Arden GB, Hitchings RA, Ryan S,Calthorpe CM, Odom JV. The pattern electroretino-gram (PERG) in ocular hypertension and glaucoma.Arch Ophthalmol. 1988; 106:923-928.
16. Korth M, Horn F, Storck B, Jonas J. The pattern-evoked electroretinogram (PERG): Age-related alter-ations and changes in glaucoma. Graefe's Arch Clin ExpOphthalmol. 1989;227:123-130.
17. Alvis DL. Electroretinographic changes in controlledchronic open-angle glaucoma. Am J Ophthalmol.1966;61:121-131.
18. Lowitzsch K, Welt R. VEP und Elektroretinographiedurch Musterumkehrreizung in der Friihdiagnose desGlaucoma chronicum simplex. Z EEG-EMG. 1991;22:217-223.
19. Bartl G. Das Elektroretinogram und das evozierteSehrindenpotential bei normalen and an Glaukomerkrankten Augen. Graefe's Arch Clin Exp Ophthalmol.1978;207:243-269.
20. Vass C, Menapace R, Gottlob I. Veranderungen desHelligkeits-Elektroretinogramms bei Patienten mitGlaucoma chronicum simplex. Spetrum Augenheilk.1990;4:226-229.
21. Fazio DT, Heckenlively JR, Martin DA, ChristensenRE. The electroretinogram in advanced open-angleglaucoma. Doc Ophthalmol. 1986;63:45-54.
22. Marmor MF, Arden GB, Nilsson SE, Zrenner E. Stan-dard for clinical electroretinography. Arch Ophthal-mol. 1989;107:816-819.
23. Heynen H, Wachtmeister L, Van Norren D. Origin ofthe oscillatory potentials in the primate retina. VisionRes. 1985;25:1365-1373.
24. Gur M., Zeevi YY, Bielik M, Neumann E. Changes inthe oscillatory potentials of the electroretinogram inglaucoma. Curr Eye Res. 1987;6:457-466.
25. Vaegan, Graham SL, Goldberg I, Millar TJ. Selectivereduction of oscillatory potentials and pattern electro-retinograms after retinal ganglion cell damage by dis-ease in humans or by kainic acid toxicity in cats. DocOphthalmol. 1991;77:237-253.
26. Finkelstein D, Gouras P, Hoff M. Human electroreti-
nogram near absolute threshold of vision. Invest Oph-thalmol Vis Sci. 1968;7:214-218.
27. Sieving PA, Frishman LJ, Steinberg RH. Scotopicthreshold response of proximal retina in cat. J Neuro-physiol. 1986;56:1049-1061.
28. Wakabayashi K, Gieser J, Sieving PA. Aspartate separa-tion of the scotopic threshold response (STR) fromthe photo receptor a-wave of the cat and monkey ERG.Invest Ophthalmol Vis Sci. 1988;29:1615-1622.
29. Sieving PA, Wakabayashi K. Comparison of rod thresh-old ERG from monkey, cat and human. Clin Vision Sci.1991;6:171-179.
30. Graham L, Vaegan. High correlation between abso-lute psychophysical threshold and the scotopic thresh-old response to the same stimulus. Br J Ophthalmol.1991;75:603-607.
31. Aylward GW. The scotopic threshold response in dia-betic retinopathy. Eye. 1989;3:626-637.
32. Steinberg RH, Frishman LJ, Sieving PA. Negativecomponents of the electroretinogram from proximalretina and photoreceptor. In: Osborne N, Chader J,eds. Progress in Retinal Research. Oxford: Pergamon;1991:121-160.
33. Sieving PA. Retinal ganglion cell loss does not abolishthe scotopic threshold response (STR) of the cat andhuman ERG. Clin Vision Sci. 1991;6:149-158.
34. Granit R. The components of the retinal action poten-tial in mammals and their relation to the discharge inthe optic nerve./ Physiol. l933;77:207-239.
35. Brown KT, Wiesel N. Analysis of the intraretinal elec-troretinogram in the intact cat eye. / Physiol.1961;158:229-256.
36. Armitage P, Berry G. Statistical Methods in Medical Re-search. Oxford: Blackwell Scientific Publications;1987.
37. Littmann H. Zur Bestimmung der wahren Grosseeines Objektes auf dem Augenhintergrund eines le-benden Auges. Klin Monatsbl Augenheilkd. 1982; 180:286-289.
38. Jonas J. Biomorphometrie des Nervus opticus. Stuttgart:F. Enke Verlag; 1989.
39. Sieving PA, Nino C. Scotopic threshold response(STR) of the human electroretinogram. Invest Ophthal-mol Vis Sci. 1988;29:1608-1614.
40. Frishman LJ, Robson, JG, Du L. Contributions of thepositive and negative scotopic threshold responses tothe scotopic cat ERG. ARVO Abstracts. Invest Ophthal-mol Vis Sci. 1993;34:1273.