Clinical use of OCT in assessing glaucoma progression
13
Clinical Use of OCT in Assessing Glaucoma Progression Jacek Kotowski, MD, Gadi Wollstein, MD, Lindsey S. Folio, BS, Hiroshi Ishikawa, MD, and Joel S. Schuman, MD Department of Ophthalmology, UPMC Eye Center, Eye and Ear Institute, Ophthalmology and Visual Science Research Center, University of Pittsburgh School of Medicine, Pittsburgh, Pennsylvania Abstract Detection of disease progression is an important and challenging component of glaucoma management. Optical coherence tomography (OCT) has proved to be valuable in the detection of glaucomatous damage. With its high resolution and proven measurement reproducibility, OCT has the potential to become an important tool for glaucoma progression detection. This manuscript presents the capabilities of the OCT technology pertinent for detection of progressive glaucomatous damage and provides a review of the current knowledge on the device’s clinical performance. INTRODUCTION Glaucoma is an optic neuropathy characterized by progressive loss of retinal ganglion cells and optic nerve damage that may result in visual field loss and irreversible blindness. 1 The rate of functional and structural progression can be highly variable among subjects. Early identification of progression is of utmost importance because appropriate treatment can slow disease progression and preserve vision. Because damage to the retinal ganglion cells cannot be directly detected in a clinical setting, clinicians have to rely on indirect methods of retinal ganglion cell evaluation. Retinal function can be measured with psychophysical techniques such as standard automated perimetry, short-wavelength automated perimetry, and frequency-doubling technology. 2 Some subjects, however, show structural changes in the optic nerve head and/or retinal nerve fiber layer (RNFL) before any evidence of glaucomatous damage can be detected with automated perimetry. 3,4 Assessment of posterior segment ocular structures is therefore a crucial step in glaucoma diagnosis and progression detection. Clinical practice has shown that identification of progression is often challenging because glaucoma is a slowly progressing disease and its time course is often variable. Moreover, it is often difficult to discriminate between true disease-related changes and measurement variability or natural age-related decreases in visual function. Furthermore, there are no widely accepted gold standard criteria for establishing glaucoma progression. In clinical practice, progression is traditionally assessed by serial evaluation of visual fields and stereo disc photographs. However, it is well established that structural and functional progression often occurs at different times over the course of the disease. Therefore, the agreement between functional and structural progression is often poor. 5,6 Copyright © SLACK Incorporated Address correspondence to Gadi Wollstein, MD, UPMC Eye Center, 203 Lothrop St., Pittsburgh, PA 15213. [email protected]. NIH Public Access Author Manuscript Ophthalmic Surg Lasers Imaging. Author manuscript; available in PMC 2012 July 29. Published in final edited form as: Ophthalmic Surg Lasers Imaging. 2011 July ; 42(0): S6–S14. doi:10.3928/15428877-20110627-01. NIH-PA Author Manuscript NIH-PA Author Manuscript NIH-PA Author Manuscript
Transcript of Clinical use of OCT in assessing glaucoma progression
Clinical Use of OCT in Assessing Glaucoma Progression
Jacek Kotowski, MD, Gadi Wollstein, MD, Lindsey S. Folio, BS, Hiroshi Ishikawa, MD, andJoel S. Schuman, MDDepartment of Ophthalmology, UPMC Eye Center, Eye and Ear Institute, Ophthalmology andVisual Science Research Center, University of Pittsburgh School of Medicine, Pittsburgh,Pennsylvania
AbstractDetection of disease progression is an important and challenging component of glaucomamanagement. Optical coherence tomography (OCT) has proved to be valuable in the detection ofglaucomatous damage. With its high resolution and proven measurement reproducibility, OCT hasthe potential to become an important tool for glaucoma progression detection. This manuscriptpresents the capabilities of the OCT technology pertinent for detection of progressiveglaucomatous damage and provides a review of the current knowledge on the device’s clinicalperformance.
INTRODUCTIONGlaucoma is an optic neuropathy characterized by progressive loss of retinal ganglion cellsand optic nerve damage that may result in visual field loss and irreversible blindness.1 Therate of functional and structural progression can be highly variable among subjects. Earlyidentification of progression is of utmost importance because appropriate treatment can slowdisease progression and preserve vision.
Because damage to the retinal ganglion cells cannot be directly detected in a clinical setting,clinicians have to rely on indirect methods of retinal ganglion cell evaluation. Retinalfunction can be measured with psychophysical techniques such as standard automatedperimetry, short-wavelength automated perimetry, and frequency-doubling technology.2
Some subjects, however, show structural changes in the optic nerve head and/or retinalnerve fiber layer (RNFL) before any evidence of glaucomatous damage can be detected withautomated perimetry.3,4 Assessment of posterior segment ocular structures is therefore acrucial step in glaucoma diagnosis and progression detection.
Clinical practice has shown that identification of progression is often challenging becauseglaucoma is a slowly progressing disease and its time course is often variable. Moreover, itis often difficult to discriminate between true disease-related changes and measurementvariability or natural age-related decreases in visual function. Furthermore, there are nowidely accepted gold standard criteria for establishing glaucoma progression. In clinicalpractice, progression is traditionally assessed by serial evaluation of visual fields and stereodisc photographs. However, it is well established that structural and functional progressionoften occurs at different times over the course of the disease. Therefore, the agreementbetween functional and structural progression is often poor.5,6
Copyright © SLACK Incorporated
Address correspondence to Gadi Wollstein, MD, UPMC Eye Center, 203 Lothrop St., Pittsburgh, PA 15213. [email protected].
NIH Public AccessAuthor ManuscriptOphthalmic Surg Lasers Imaging. Author manuscript; available in PMC 2012 July 29.
Published in final edited form as:Ophthalmic Surg Lasers Imaging. 2011 July ; 42(0): S6–S14. doi:10.3928/15428877-20110627-01.
NIH
-PA Author Manuscript
NIH
-PA Author Manuscript
NIH
-PA Author Manuscript
MEASURING GLAUCOMA PROGRESSIONA variety of strategies to determine glaucoma progression have been used clinically, rangingfrom subjective assessment based on clinical judgment to statistical analyses of manymeasurements collected over time. In this article, we will focus on methods to detectprogression using information provided by OCT.
The statistical approaches used in assessing glaucoma progression can be divided into eventbased and trend based. In event analysis, progression is identified when a follow-upmeasurement exceeds a preestablished threshold for change from baseline. It is assumed thatany change below this threshold is due to natural age-related loss and/or measurementvariability, whereas changes exceeding the threshold represent true progression. Thethreshold for a change can be determined from an individual subject’s variability or fromvariability in a normal reference group. A higher threshold would result in greater specificitybecause only situations with marked change would be detected. However, this would reducethe sensitivity for detecting less dramatic changes. Conversely, setting the threshold to alower level will increase sensitivity while simultaneously reducing specificity. Eventanalysis is intended to identify a gradual change over time that eventually crosses athreshold or to detect an acute event that exceeds a threshold. However, a confirmatory testis always recommended, particularly in the latter case, to prevent an artifactual measurementfrom being labeled as an actual event.
A trend analysis identifies progression by monitoring the behavior of a parameter over time.A regression analysis or mixed effect analysis of a dependent variable (ie, RNFL thickness)is performed on follow-up measurements, providing a rate of progression over time. Thismethod is less sensitive to sudden change and the variability among consecutive testsbecause it is neutralized by the overall rate of change. This method also offers an advantageallowing the extrapolation of the rate of progression, which makes it possible to predict thetime required to reach certain milestones.
PROGRESSION WITH TIME-DOMAIN OCT (TD-OCT)Stratus OCT (Carl Zeiss Meditec, Dublin, CA), the commercially available TD-OCT,produces cross-sectional images at a scanning speed of 400 axial scans per second, with anaxial resolution of 8 to 10 µm and a transverse resolution of approximately 20 µm. Thedevice can acquire a variety of linear and circular scan patterns. The most commonly usedTD-OCT scan for glaucoma evaluation is the “Fast RNFL scan.” This is a 3.4-mm diametercircular scan centered on the optic nerve head. RNFL thickness is automatically determinedand reported as an overall mean, by quadrants, and by clock hours. The macula and opticnerve head are traditionally used as secondary targets for glaucoma diagnosis with TD-OCT.Both regions are scanned using six radial scans equally spaced 30 degrees apart.Quantitative information is provided for the total thickness of the macula and for the opticnerve head structures.
TD-OCT RNFL thickness measurements have been shown to discriminate well betweennormal and glaucomatous eyes.7–11 They have also been shown to have good reproducibilityin detecting both diffuse and localized glaucomatous RNFL defects.12–17 Because of therelatively low intra-test and inter-test variability of peripapillary RNFL thicknessmeasurements, they can be useful for observing patients with glaucoma over time andtherefore are potentially valuable for detecting glaucomatous progression. Based on thepublished data on the repeatability of mean RNFL thickness measurements, any decrease inthickness not exceeding 6.4 to 8 µm can be considered to be within normal limits of test–retest variability with 95% tolerance.14,15,18 Any reproducible decrease in the mean RNFLthickness exceeding this range might indicate progression of the disease. These values
Kotowski et al. Page 2
Ophthalmic Surg Lasers Imaging. Author manuscript; available in PMC 2012 July 29.
NIH
-PA Author Manuscript
NIH
-PA Author Manuscript
NIH
-PA Author Manuscript
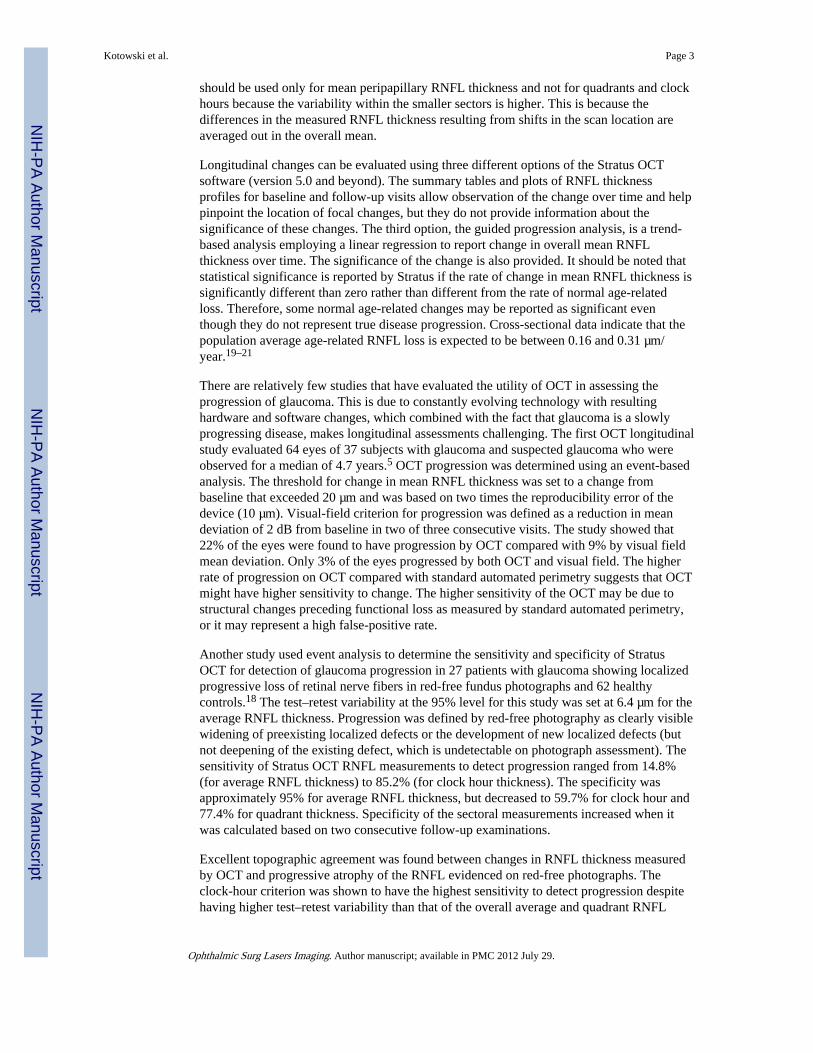
should be used only for mean peripapillary RNFL thickness and not for quadrants and clockhours because the variability within the smaller sectors is higher. This is because thedifferences in the measured RNFL thickness resulting from shifts in the scan location areaveraged out in the overall mean.
Longitudinal changes can be evaluated using three different options of the Stratus OCTsoftware (version 5.0 and beyond). The summary tables and plots of RNFL thicknessprofiles for baseline and follow-up visits allow observation of the change over time and helppinpoint the location of focal changes, but they do not provide information about thesignificance of these changes. The third option, the guided progression analysis, is a trend-based analysis employing a linear regression to report change in overall mean RNFLthickness over time. The significance of the change is also provided. It should be noted thatstatistical significance is reported by Stratus if the rate of change in mean RNFL thickness issignificantly different than zero rather than different from the rate of normal age-relatedloss. Therefore, some normal age-related changes may be reported as significant eventhough they do not represent true disease progression. Cross-sectional data indicate that thepopulation average age-related RNFL loss is expected to be between 0.16 and 0.31 µm/year.19–21
There are relatively few studies that have evaluated the utility of OCT in assessing theprogression of glaucoma. This is due to constantly evolving technology with resultinghardware and software changes, which combined with the fact that glaucoma is a slowlyprogressing disease, makes longitudinal assessments challenging. The first OCT longitudinalstudy evaluated 64 eyes of 37 subjects with glaucoma and suspected glaucoma who wereobserved for a median of 4.7 years.5 OCT progression was determined using an event-basedanalysis. The threshold for change in mean RNFL thickness was set to a change frombaseline that exceeded 20 µm and was based on two times the reproducibility error of thedevice (10 µm). Visual-field criterion for progression was defined as a reduction in meandeviation of 2 dB from baseline in two of three consecutive visits. The study showed that22% of the eyes were found to have progression by OCT compared with 9% by visual fieldmean deviation. Only 3% of the eyes progressed by both OCT and visual field. The higherrate of progression on OCT compared with standard automated perimetry suggests that OCTmight have higher sensitivity to change. The higher sensitivity of the OCT may be due tostructural changes preceding functional loss as measured by standard automated perimetry,or it may represent a high false-positive rate.
Another study used event analysis to determine the sensitivity and specificity of StratusOCT for detection of glaucoma progression in 27 patients with glaucoma showing localizedprogressive loss of retinal nerve fibers in red-free fundus photographs and 62 healthycontrols.18 The test–retest variability at the 95% level for this study was set at 6.4 µm for theaverage RNFL thickness. Progression was defined by red-free photography as clearly visiblewidening of preexisting localized defects or the development of new localized defects (butnot deepening of the existing defect, which is undetectable on photograph assessment). Thesensitivity of Stratus OCT RNFL measurements to detect progression ranged from 14.8%(for average RNFL thickness) to 85.2% (for clock hour thickness). The specificity wasapproximately 95% for average RNFL thickness, but decreased to 59.7% for clock hour and77.4% for quadrant thickness. Specificity of the sectoral measurements increased when itwas calculated based on two consecutive follow-up examinations.
Excellent topographic agreement was found between changes in RNFL thickness measuredby OCT and progressive atrophy of the RNFL evidenced on red-free photographs. Theclock-hour criterion was shown to have the highest sensitivity to detect progression despitehaving higher test–retest variability than that of the overall average and quadrant RNFL
Kotowski et al. Page 3
Ophthalmic Surg Lasers Imaging. Author manuscript; available in PMC 2012 July 29.
NIH
-PA Author Manuscript
NIH
-PA Author Manuscript
NIH
-PA Author Manuscript

thickness measurements. To explain these results, the authors hypothesized that in thesubjects who had expansion of a localized RNFL defect, progression occurred focallywithout a significant effect on average and quadrant RNFL thickness. It should be noted thatthe study results provided information regarding the ability of OCT to detect progressiveRNFL atrophy only in subjects who have localized RNFL defects and not those with diffuseRNFL damage.
A trend-based approach was tested in a study where red-free fundus photography was usedas the reference standard to determine progression.22 The study demonstrated that eyesshowing progression of localized RNFL defects on red-free fundus photographs (76 of atotal of 153 glaucomatous eyes) had significantly higher rates of RNFL loss over time, asmeasured by OCT trend analysis, than eyes that were stable. The rate of progression washighest in affected clock-hours, possibly reflecting the widening of a small, early defect and/or further loss of the nerve fibers within the existing defect. The rates of localized thicknesschange were shown to have higher discriminating ability between progressors and non-progressors than the global RNFL thinning rate, indicating that focal RNFL loss may notalways result in a detectable change in global RNFL thickness. The study resultsunderscored the importance of analyzing both global and sectoral (quadrant and clock-hour)RNFL thicknesses. However, it should be noted that, similar to the previous study,18 thesubjects evaluated had localized defects only; thus, the implications of the results of thisstudy should not be extended to subjects with diffuse RNFL atrophy. The study showed nodifference in baseline RNFL thickness between progressors and non-progressors. This wasin disagreement with previous observations of higher rates of RNFL thinning associatedwith higher baseline RNFL thickness and studies showing that progression defined as RNFLthickness loss is more evident than visual field progression in early glaucoma, whereas theopposite is true in the advanced stages of the disease.23–25
In another study employing a trend-based analysis, it was demonstrated that the guidedprogression analysis included in the latest version of the Stratus OCT was able to detectprogressive RNFL loss and provide the rate of change in RNFL thickness in subjects withglaucoma.23 In this study, 21 and 22 of 116 glaucomatous eyes showed progression asmeasured by guided progression analysis of average RNFL thickness and two adjacent clockhours, respectively. The rate of average RNFL thickness loss was −1.2 to −15.4 µm/year. Ofthe 22 eyes that progressed by guided progression analysis in two adjacent clock hours, 8eyes did not progress by guided progression analysis of average RNFL thickness, againindicating that focal RNFL loss may not always result in a detectable change in globalRNFL thickness. The inferotemporal (7 o’clock) sector was the most frequent location thatshowed progression, suggesting that this location is not only important in discriminatingglaucomatous from healthy eyes10,11,26 but it should also play an important role in detectingglaucomatous progression. The study also showed that at a comparable level of specificity,guided progression analysis of average RNFL thickness and trend analysis of the visual fieldindex had a poor agreement for detection of progression, consistent with the well-recognizedknowledge that the agreement between functional and structural progression is limited.5,6
In the studies described above, the use of TD-OCT was focused on assessment of thechanges in the RNFL thickness. Stratus OCT is also capable of providing reproduciblemeasurements of optic nerve head topography and macular thickness.15,27 The utility ofthese measurements in detecting glaucoma progression was evaluated and compared withRNFL parameters in a cohort of patients with glaucoma and suspected glaucoma.28 Visualfield guided progression analysis and expert assessment of optic disc stereophotographswere used as reference standards to determine progression. The study showed that eyesprogressing by visual field and/or optic disc stereophotographs had significantly higher ratesof RNFL loss over time than the non-progressing eyes. For the global RNFL thickness,
Kotowski et al. Page 4
Ophthalmic Surg Lasers Imaging. Author manuscript; available in PMC 2012 July 29.
NIH
-PA Author Manuscript
NIH
-PA Author Manuscript
NIH
-PA Author Manuscript
mean rate of change was −0.72 µm/year for progressors and 0.14 µm/year for non-progressors. The rates of change were widely variable among the eyes.
RNFL parameters performed well in discriminating eyes that progressed by visual fieldsand/or optic disc stereophotographs from eyes that did not. Consistent with the previousstudies, inferior quadrant RNFL thickness had the best discriminatory performance. TheRNFL parameters performed significantly better than optic nerve head and macularthickness parameters for detection of change. None of the macular thickness parameterswere able to discriminate progressors from non-progressors. The poor sensitivity of the opticnerve head scan to detect small focal changes occurring over time can be partially explainedby the lack of sectoral analysis of the optic nerve head by TD-OCT. Moreover, TD-OCToptic nerve head parameters are obtained using only six radial scans, which necessitatesheavy interpolation between the radial tissue sampling.
A large amount of interpolation between scans is also a likely explanation for the poorperformance of the macular thickness parameters in detecting progression (similarly to theoptic nerve head scan, the macular scan pattern consists of only six radial scans). Moreover,the macular parameters were based on total retinal thickness rather than specific retinallayers that are affected in glaucoma. Previous studies have shown that the glaucomadiagnostic ability of TD-OCT parameters measuring total retinal thickness was found to beinferior to the RNFL thickness parameters,8,9,29–31 and therefore the same is likely to be truefor detection of longitudinal changes.
PROGRESSION WITH SPECTRAL-DOMAIN OCT (SD-OCT)SD-OCT offers higher scanning rates (up to 50,000 axial scans per second) and improvedresolution (axial resolution: 3 to 6 µm, transverse resolution: 20 µm) compared with TD-OCT. These improvements have resulted in the development of novel scanning patterns thatenable the acquisition of three-dimensional data from areas of interest. This allows post-processing of the data in desired locations and enables registration of consecutive images.The substantial increase in SD-OCT scanning speed over TD-OCT makes scans less proneto eye movement artifacts. Image registration minimizes misalignment between consecutiveimages, potentially decreasing the variability in RNFL thickness measurements, which wasone of the main factors limiting the ability to detect true structural changes over time usingTD-OCT. Indeed, recent studies have demonstrated excellent intra-visit and inter-visitmeasurement reproducibility for SD-OCT,32–38 superior to TD-OCT,32,38–40 indicating thisinstrument’s potential utility in monitoring glaucoma progression.
Several studies evaluated the glaucoma diagnostic ability of SD-OCT compared with TD-OCT.39,41–46 The different SD-OCT devices evaluated were found to have a good glaucomadiagnostic ability, but these studies showed no statistically significant difference betweenSD-OCT and TD-OCT. In most of these studies, the subject population had significantglaucomatous damage, making it difficult to evaluate the superiority of one imaging deviceversus another. However, when the diagnostic ability of SD-OCT and TD-OCT to detectfocal RNFL defects was compared in patients with pre-perimetric glaucoma, the study failedto detect a statistically significant difference between the best performing parameters fromeach device.47 It has to be noted that although a new method of acquiring data is used bySD-OCT, peripapillary data for RNFL thickness come from the same location as in TD-OCT (a 3.4-mm diameter peripapillary circle centered on the optic disc). This similaritymakes it easy to compare the data from the two devices, but the potential advantage offeredby three-dimensional volumetric data is not fully being used, thus leading to a similar levelof diagnostic ability. Indeed, some localized RNFL defects were demonstrated on the SD-OCT deviation map and were not evident on TD-OCT.47
Kotowski et al. Page 5
Ophthalmic Surg Lasers Imaging. Author manuscript; available in PMC 2012 July 29.
NIH
-PA Author Manuscript
NIH
-PA Author Manuscript
NIH
-PA Author Manuscript
Several studies are currently underway evaluating the utility of SD-OCT RNFL thicknessmeasurements in detecting glaucoma progression but, considering the relatively recentlaunch time of commercially available SD-OCT devices and the slowly progressive natureof glaucoma, these results are not yet available.
Another advantage of SD-OCT related to the increased resolution and three-dimensionalrendering is the ability to perform precise measurement, segmentation, and mapping of theretinal layers and delineation of the layers affected by glaucoma. For example, RTVue’s(Optovue, Fremont, CA) ganglion cell complex selectively measures the inner retinal layerswithin the macular region that are specifically susceptible to glaucomatous damage. Theganglion cell complex is composed of the macular nerve fiber layer, ganglion cell layer, andinner plexiform layer. Assessment of these layers has been shown to have an improvedability to detect glaucoma compared with using full retinal thickness. Ganglion cell complexdiagnostic accuracy for detecting glaucoma has been shown to be similar to that ofperipapillary RNFL thickness,48–52 making it potentially valuable for monitoring glaucomaprogression. The intra-session and inter-session variability of the ganglion cell complexmeasurements was investigated in a recent study on 37 healthy subjects with ocularhypertension and glaucoma experienced in imaging examinations and 40 screening trialparticipants without such experience.32 The test–retest variability of the ganglion cellcomplex parameters evaluated in this study did not exceed 4.51 µm. This value may serve asreference for setting a threshold for change in future longitudinal studies.
COMMERCIALLY AVAILABLE PROGRESSION SD-OCT SOFTWARESD-OCT devices are manufactured by several companies, but only two machines currentlyoffer progression analysis as part of their commercially available software: Cirrus HD-OCT(Carl Zeiss Meditec, Dublin, CA) and RTVue (Optovue, Fremont, CA). Of these twodevices, only the Cirrus HD-OCT provides statistical analyses for progression detection.Cirrus HD-OCT offers a glaucoma progression algorithm based on both event and trendanalyses. Data sampling of the RNFL is obtained from the 3.4-mm diameter peripapillarycircle. The software also displays RNFL thickness changes from baseline for each pixel inthe scanned area. As mentioned above, this enables the detection of structural changesoutside the confines of the circumpapillary scan, such as a new or expanding wedge defect.Possible or likely RNFL thickness loss is reported if change exceeds the expected test–retestvariability in a single or two consecutive follow-up examinations, respectively. Additionally,linear regression is performed to determine the rate of change, confidence limits, andstatistical significance of the trend. Figure 1 illustrates a case of glaucoma progressiondetected by SD-OCT RNFL thickness maps and profiles along with a significant rate ofRNFL thickness reduction.
The progression analysis offered by the RTVue includes side-by-side RNFL thicknessmeasurements and overlay of the RNFL profiles for the consecutive scans. Similar reportsare also provided for ganglion cell complex thickness along with thickness change plots.Changes are presented in a similar fashion for the ganglion cell complex of the macula.However, a formal statistical analysis of change over time is not currently included in thelatest version of the software for this device (version 6.1). Figure 2 shows an example of theRNFL Change Analysis report showing nasal expansion of peripapillary RNFL defect.Figure 3 is an example of the ganglion cell complex progression analysis report with notableexpansion of superior macular defect.
FUTURE DEVELOPMENTSSeveral studies are currently underway assessing longitudinal RNFL thickness andsegmented macular thickness data using SD-OCT. More sophisticated approaches for optic
Kotowski et al. Page 6
Ophthalmic Surg Lasers Imaging. Author manuscript; available in PMC 2012 July 29.
NIH
-PA Author Manuscript
NIH
-PA Author Manuscript
NIH
-PA Author Manuscript
disc and macular evaluation are also under development. New retinal segmentationalgorithms are being developed and tested by those SDOCT manufacturers who currently donot offer such a capability in their software. These algorithms should soon be incorporatedin the future software releases.
The OCT imaging technology continues to rapidly evolve. Research is focused ondeveloping devices with higher scanning speeds (such as swept-source OCT), higher lateralresolution (OCT with adaptive optics), and devices that account for the optical polarizationproperties of the scanning area (polarization-sensitive OCT). These technologies will offerfurther improvements in resolution and scanning speeds, which should lead to improvedmeasurement reliability and might improve the chances of detecting longitudinal changes.
Future studies will also evaluate the effect of potential confounding factors such as cataractformation and cataract surgery. It has been shown that both TD-OCT and SD-OCT RNFLand retinal thickness measurements are affected by media opacities, but the effect on theability of OCT to detect glaucoma progression remains to be determined.53–56
CONCLUSIONDetection of glaucoma progression remains one of the most challenging aspects in themanagement of the disease. This is due to the slowly progressive and variable nature of thedisease, the inherent measurement variability of devices used in serial assessments, and thelack of a commonly acceptable reference standard that can be used to definitively indicateprogressive glaucomatous change. To date, only a few studies on the application of OCT indetecting glaucoma progression have been published, all of them on TD-OCT. These studiesdemonstrated that TD-OCT is a sensitive measure of glaucoma progression. Analyzing bothoverall average and sectoral RNFL thicknesses is important in maximizing the detection ofprogression. SD-OCT with its increased resolution, image registration capabilities, higherreproducibility, and three-dimensional rendering capabilities offers potential advantagesover TD-OCT. Its application in the detection of glaucoma progression is currently beingevaluated. The limited agreement between functional and structural tests emphasizes theimportance of assessing both structure and function when making clinical decisionsregarding glaucoma progression.
AcknowledgmentsSupported in part by National Institute of Health grants R01-EY13178, and P30-EY08098 (Bethesda, MD), TheEye and Ear Foundation (Pittsburgh, PA), and an unrestricted grant from Research to Prevent Blindness (NewYork, NY).
Dr. Wollstein received research funding from Carl Zeiss Meditec and Optovue. Dr. Schuman received royalties forintellectual property licensed by the Massachusetts Institute of Technology to Carl Zeiss Meditec. The remainingauthors have no financial or proprietary interest in the materials presented herein.
Dr. Schuman did not participate in the editorial review of this manuscript.
REFERENCES1. American Academy of Ophthalmology. Preferred Practice Pattern: Primary Open-Angle Glaucoma.
San Francisco: Author; 2003. p. 1-40.
2. Johnson CA, Samuels SJ. Screening for glaucomatous visual field loss with frequency-doublingperimetry. Invest Ophthalmol Vis Sci. 1997; 38:413–425. [PubMed: 9040475]
3. Sommer A, Katz J, Quigley HA, et al. Clinically detectable nerve fiber atrophy precedes the onset ofglaucomatous field loss. Arch Ophthalmol. 1991; 109:77–83. [PubMed: 1987954]
Kotowski et al. Page 7
Ophthalmic Surg Lasers Imaging. Author manuscript; available in PMC 2012 July 29.
NIH
-PA Author Manuscript
NIH
-PA Author Manuscript
NIH
-PA Author Manuscript
4. Quigley HA, Katz J, Derick RJ, Gilbert D, Sommer A. An evaluation of optic disc and nerve fiberlayer examinations in monitoring progression of early glaucoma damage. Ophthalmology. 1992;99:19–28. [PubMed: 1741133]
5. Wollstein G, Schuman JS, Price LL, et al. Optical coherence tomography longitudinal evaluation ofretinal nerve fiber layer thickness in glaucoma. Arch Ophthalmol. 2005; 123:464–470. [PubMed:15824218]
6. Strouthidis NG, Scott A, Peter NM, Garway-Heath DF. Optic disc and visual field progression inocular hypertensive subjects: detection rates, specificity, and agreement. Invest Ophthalmol Vis Sci.2006; 47:2904–2910. [PubMed: 16799032]
7. Medeiros FA, Zangwill LM, Bowd C, Weinreb RN. Comparison of the GDx VCC scanning laserpolarimeter, HRT II confocal scanning laser ophthalmoscope, and stratus OCT optical coherencetomograph for the detection of glaucoma. Arch Ophthalmol. 2004; 122:827–837. [PubMed:15197057]
8. Wollstein G, Ishikawa H, Wang J, Beaton SA, Schuman JS. Comparison of three optical coherencetomography scanning areas for detection of glaucomatous damage. Am J Ophthalmol. 2005;139:39–43. [PubMed: 15652826]
9. Medeiros FA, Zangwill LM, Bowd C, Vessani RM, Susanna R Jr, Weinreb RN. Evaluation ofretinal nerve fiber layer, optic nerve head, and macular thickness measurements for glaucomadetection using optical coherence tomography. Am J Ophthalmol. 2005; 139:44–55. [PubMed:15652827]
10. Budenz DL, Michael A, Chang RT, McSoley J, Katz J. Sensitivity and specificity of theStratusOCT for perimetric glaucoma. Ophthalmology. 2005; 112:3–9. [PubMed: 15629813]
11. Bowd C, Zangwill LM, Berry CC, et al. Detecting early glaucoma by assessment of retinal nervefiber layer thickness and visual function. Invest Ophthalmol Vis Sci. 2001; 42:1993–2003.[PubMed: 11481263]
12. Blumenthal EZ, Williams JM, Weinreb RN, Girkin CA, Berry CC, Zangwill LM. Reproducibilityof nerve fiber layer thickness measurements by use of optical coherence tomography.Ophthalmology. 2000; 107:2278–2282. [PubMed: 11097610]
13. Budenz DL, Chang RT, Huang X, Knighton RW, Tielsch JM. Reproducibility of retinal nerve fiberthickness measurements using the stratus OCT in normal and glaucomatous eyes. InvestOphthalmol Vis Sci. 2005; 46:2440–2443. [PubMed: 15980233]
14. Budenz DL, Fredette MJ, Feuer WJ, Anderson DR. Reproducibility of peripapillary retinal nervefiber thickness measurements with stratus OCT in glaucomatous eyes. Ophthalmology. 2008;115:661–666. [PubMed: 17706287]
15. Paunescu LA, Schuman JS, Price LL, et al. Reproducibility of nerve fiber thickness, macularthickness, and optic nerve head measurements using StratusOCT. Invest Ophthalmol Vis Sci.2004; 45:1716–1724. [PubMed: 15161831]
16. Schuman JS, Pedut-Kloizman T, Hertzmark E, et al. Reproducibility of nerve fiber layer thicknessmeasurements using optical coherence tomography. Ophthalmology. 1996; 103:1889–1898.[PubMed: 8942887]
17. Gurses-Ozden R, Teng C, Vessani R, Zafar S, Liebmann JM, Ritch R. Macular and retinal nervefiber layer thickness measurement reproducibility using optical coherence tomography (OCT-3). JGlaucoma. 2004; 13:238–244. [PubMed: 15118470]
18. Lee EJ, Kim TW, Park KH, Seong M, Kim H, Kim DM. Ability of Stratus OCT to detectprogressive retinal nerve fiber layer atrophy in glaucoma. Invest Ophthalmol Vis Sci. 2009;50:662–668. [PubMed: 18824734]
19. Budenz DL, Anderson DR, Varma R, et al. Determinants of normal retinal nerve fiber layerthickness measured by Stratus OCT. Ophthalmology. 2007; 114:1046–1052. [PubMed: 17210181]
20. Parikh RS, Parikh SR, Sekhar GC, Prabakaran S, Babu JG, Thomas R. Normal age-related decayof retinal nerve fiber layer thickness. Ophthalmology. 2007; 114:921–926. [PubMed: 17467529]
21. Harwerth RS, Wheat JL, Rangaswamy NV. Age-related losses of retinal ganglion cells and axons.Invest Ophthalmol Vis Sci. 2008; 49:4437–4443. [PubMed: 18539947]
Kotowski et al. Page 8
Ophthalmic Surg Lasers Imaging. Author manuscript; available in PMC 2012 July 29.
NIH
-PA Author Manuscript
NIH
-PA Author Manuscript
NIH
-PA Author Manuscript
22. Lee EJ, Kim TW, Weinreb RN, Park KH, Kim SH, Kim DM. Trend-based analysis of retinal nervefiber layer thickness measured by optical coherence tomography in eyes with localized nerve fiberlayer defects. Invest Ophthalmol Vis Sci. 2011; 52:1138–1144. [PubMed: 21051691]
23. Leung CK, Cheung CY, Weinreb RN, et al. Evaluation of retinal nerve fiber layer progression inglaucoma: a study on optical coherence tomography guided progression analysis. InvestOphthalmol Vis Sci. 2010; 51:217–222. [PubMed: 19684001]
24. Schlottmann PG, De Cilla S, Greenfield DS, Caprioli J, Garway-Heath DF. Relationship betweenvisual field sensitivity and retinal nerve fiber layer thickness as measured by scanning laserpolarimetry. Invest Ophthalmol Vis Sci. 2004; 45:1823–1829. [PubMed: 15161846]
25. Hood DC, Kardon RH. A framework for comparing structural and functional measures ofglaucomatous damage. Prog Retin Eye Res. 2007; 26:688–710. [PubMed: 17889587]
26. Kanamori A, Nakamura M, Escano MF, Seya R, Maeda H, Negi A. Evaluation of theglaucomatous damage on retinal nerve fiber layer thickness measured by optical coherencetomography. Am J Ophthalmol. 2003; 135:513–520. [PubMed: 12654369]
27. Leung CK, Cheung CY, Lin D, Pang CP, Lam DS, Weinreb RN. Longitudinal variability of opticdisc and retinal nerve fiber layer measurements. Invest Ophthalmol Vis Sci. 2008; 49:4886–4892.[PubMed: 18539940]
28. Medeiros FA, Zangwill LM, Alencar LM, et al. Detection of glaucoma progression with stratusOCT retinal nerve fiber layer, optic nerve head, and macular thickness measurements. InvestOphthalmol Vis Sci. 2009; 50:5741–5748. [PubMed: 19815731]
29. Guedes V, Schuman JS, Hertzmark E, et al. Optical coherence tomography measurement ofmacular and nerve fiber layer thickness in normal and glaucomatous human eyes. Ophthalmology.2003; 110:177–189. [PubMed: 12511364]
30. Leung CK, Chan WM, Yung WH, et al. Comparison of macular and peripapillary measurementsfor the detection of glaucoma: an optical coherence tomography study. Ophthalmology. 2005;112:391–400. [PubMed: 15745764]
31. Ojima T, Tanabe T, Hangai M, Yu S, Morishita S, Yoshimura N. Measurement of retinal nervefiber layer thickness and macular volume for glaucoma detection using optical coherencetomography. Jpn J Ophthalmol. 2007; 51:197–203. [PubMed: 17554482]
32. Garas A, Vargha P, Hollo G. Reproducibility of retinal nerve fiber layer and macular thicknessmeasurement with the RTVue-100 optical coherence tomograph. Ophthalmology. 2010; 117:738–746. [PubMed: 20079538]
33. Gonzalez-Garcia AO, Vizzeri G, Bowd C, Medeiros FA, Zangwill LM, Weinreb RN.Reproducibility of RTVue retinal nerve fiber layer thickness and optic disc measurements andagreement with Stratus optical coherence tomography measurements. Am J Ophthalmol. 2009;147:1067–1074. [PubMed: 19268891]
34. Lee SH, Kim SH, Kim TW, Park KH, Kim DM. Reproducibility of retinal nerve fiber thicknessmeasurements using the test-retest function of spectral OCT/SLO in normal and glaucomatouseyes. J Glaucoma. 2010; 19:637–642. [PubMed: 20173650]
35. Li JP, Wang XZ, Fu J, Li SN, Wang NL. Reproducibility of RTVue retinal nerve fiber layerthickness and optic nerve head measurements in normal and glaucoma eyes. Chin Med J (Engl).2010; 123:1898–1903. [PubMed: 20819575]
36. Mwanza JC, Chang RT, Budenz DL, et al. Reproducibility of peripapillary retinal nerve fiber layerthickness and optic nerve head parameters measured with CirrusTM HD-OCT in glaucomatouseyes. Invest Ophthalmol Vis Sci. 2010; 51:5724–5730. [PubMed: 20574014]
37. Menke MN, Knecht P, Sturm V, Dabov S, Funk J. Reproducibility of nerve fiber layer thicknessmeasurements using 3D fourier-domain OCT. Invest Ophthalmol Vis Sci. 2008; 49:5386–5391.[PubMed: 18676630]
38. Schuman JS. Spectral domain optical coherence tomography for glaucoma (an AOS thesis). TransAm Ophthalmol Soc. 2008; 106:426–458. [PubMed: 19277249]
39. Leung CK, Cheung CY, Weinreb RN, et al. Retinal nerve fiber layer imaging with spectral-domainoptical coherence tomography: a variability and diagnostic performance study. Ophthalmology.2009; 116:1257–1263. [PubMed: 19464061]
Kotowski et al. Page 9
Ophthalmic Surg Lasers Imaging. Author manuscript; available in PMC 2012 July 29.
NIH
-PA Author Manuscript
NIH
-PA Author Manuscript
NIH
-PA Author Manuscript
40. Kim JS, Ishikawa H, Sung KR, et al. Retinal nerve fibre layer thickness measurementreproducibility improved with spectral domain optical coherence tomography. Br J Ophthalmol.2009; 93:1057–1063. [PubMed: 19429591]
41. Park SB, Sung KR, Kang SY, Kim KR, Kook MS. Comparison of glaucoma diagnostic capabilitiesof Cirrus HD and Stratus optical coherence tomography. Arch Ophthalmol. 2009; 127:1603–1609.[PubMed: 20008715]
42. Chang RT, Knight OJ, Feuer WJ, Budenz DL. Sensitivity and specificity of time-domain versusspectral-domain optical coherence tomography in diagnosing early to moderate glaucoma.Ophthalmology. 2009; 116:2294–2299. [PubMed: 19800694]
43. Vizzeri G, Balasubramanian M, Bowd C, Weinreb RN, Medeiros FA, Zangwill LM. Spectraldomain-optical coherence tomography to detect localized retinal nerve fiber layer defects inglaucomatous eyes. Opt Express. 2009; 17:4004–4018. [PubMed: 19259242]
44. Moreno-Montanes J, Olmo N, Alvarez A, Garcia N, Zarranz-Ventura J. Cirrus high-definitionoptical coherence tomography compared with Stratus optical coherence tomography in glaucomadiagnosis. Invest Ophthalmol Vis Sci. 2010; 51:335–343. [PubMed: 19737881]
45. Cho JW, Sung KR, Hong JT, Um TW, Kang SY, Kook MS. Detection of glaucoma by spectraldomain-scanning laser ophthalmoscopy/optical coherence tomography (SD-SLO/OCT) and timedomain optical coherence tomography. J Glaucoma. 2011; 20:15–20. [PubMed: 20436370]
46. Sehi M, Grewal DS, Sheets CW, Greenfield DS. Diagnostic ability of Fourier-domain vs time-domain optical coherence tomography for glaucoma detection. Am J Ophthalmol. 2009; 148:597–605. [PubMed: 19589493]
47. Jeoung JW, Park KH. Comparison of Cirrus OCT and Stratus OCT on the ability to detectlocalized retinal nerve fiber layer defects in preperimetric glaucoma. Invest Ophthalmol Vis Sci.2010; 51:938–945. [PubMed: 19797208]
48. Garas A, Vargha P, Hollo G. Diagnostic accuracy of nerve fibre layer, macular thickness and opticdisc measurements made with the RTVue-100 optical coherence tomograph to detect glaucoma.Eye (Lond). 2011; 25:57–65. [PubMed: 20930859]
49. Kim NR, Lee ES, Seong GJ, et al. Comparing the ganglion cell complex and retinal nerve fibrelayer measurements by Fourier domain OCT to detect glaucoma in high myopia. Br J Ophthalmol.[published online ahead of print October 17, 2010].
50. Rao HL, Zangwill LM, Weinreb RN, Sample PA, Alencar LM, Medeiros FA. Comparison ofdifferent spectral domain optical coherence tomography scanning areas for glaucoma diagnosis.Ophthalmology. 2010; 117:1692–1699. [PubMed: 20493529]
51. Tan O, Chopra V, Lu AT, et al. Detection of macular ganglion cell loss in glaucoma by Fourier-domain optical coherence tomography. Ophthalmology. 2009; 116:2305–2314. [PubMed:19744726]
52. Tan O, Li G, Lu AT, Varma R, Huang D. Mapping of macular substructures with opticalcoherence tomography for glaucoma diagnosis. Ophthalmology. 2008; 115:949–956. [PubMed:17981334]
53. van Velthoven ME, van der Linden MH, de Smet MD, Faber DJ, Verbraak FD. Influence ofcataract on optical coherence tomography image quality and retinal thickness. Br J Ophthalmol.2006; 90:1259–1262. [PubMed: 16980644]
54. Savini G, Zanini M, Barboni P. Influence of pupil size and cataract on retinal nerve fiber layerthickness measurements by Stratus OCT. J Glaucoma. 2006; 15:336–340. [PubMed: 16865012]
55. Cheng CS, Natividad MG, Earnest A, et al. Comparison of the influence of cataract and pupil sizeon retinal nerve fibre layer thickness measurements with time domain and spectral domain opticalcoherence tomography. Clin Experiment Ophthalmol. [published online ahead of print November11, 2010].
56. Mwanza JC, Bhorade AM, Sekhon N, et al. Effect of cataract and its removal on signal strengthand peripapillary retinal nerve fiber layer optical coherence tomography measurements. JGlaucoma. 2011; 20:37–43. [PubMed: 20179622]
Kotowski et al. Page 10
Ophthalmic Surg Lasers Imaging. Author manuscript; available in PMC 2012 July 29.
NIH
-PA Author Manuscript
NIH
-PA Author Manuscript
NIH
-PA Author Manuscript

Figure 1.Cirrus Spectral-Domain Optical Coherence Tomography Retinal Nerve Fiber Layer (RNFL)Guided Progression Analysis (GPA) (Carl Zeiss Meditec, Dublin, CA). RNFL ThicknessMaps (top panel) show graduate progression in the inferotemporal region (yellow and redsectors). The inferotemporal progression is also notable in the RNFL Thickness Profiles(red; right panel). Average RNFL Thickness plots (left panel) show statistically significantthinning in the overall, superior and inferior RNFL thickness. OD = right eye; OS = left eye.
Kotowski et al. Page 11
Ophthalmic Surg Lasers Imaging. Author manuscript; available in PMC 2012 July 29.
NIH
-PA Author Manuscript
NIH
-PA Author Manuscript
NIH
-PA Author Manuscript
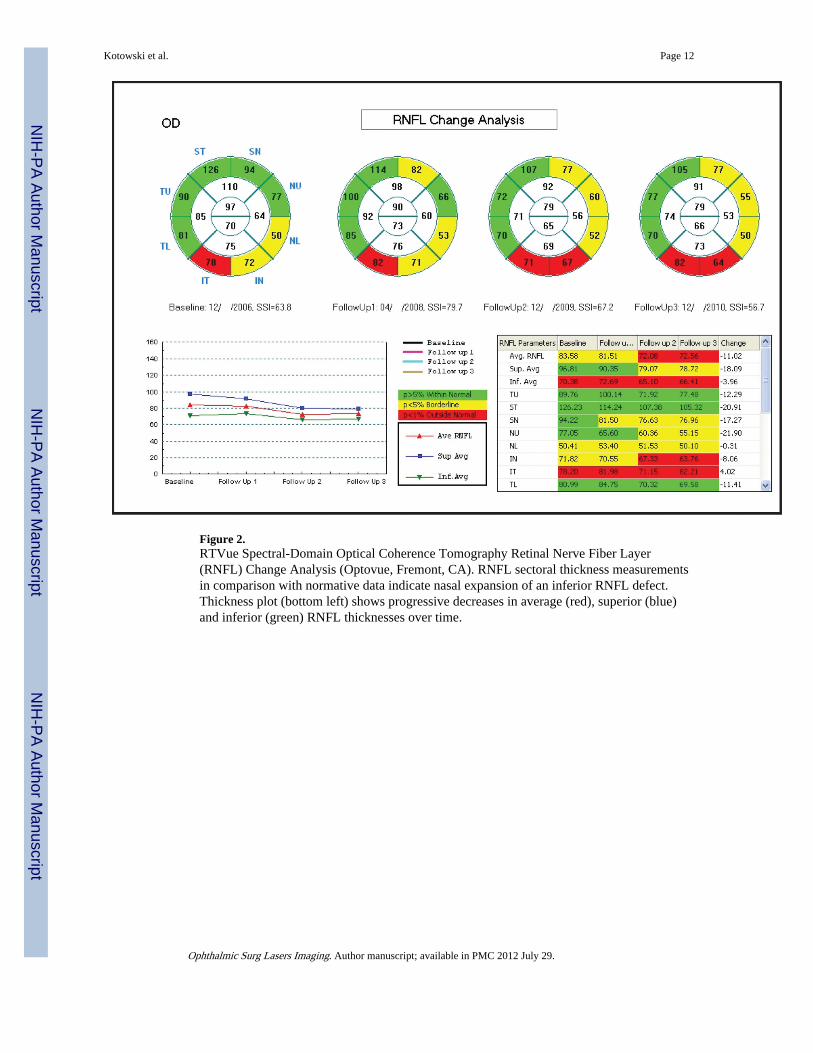
Figure 2.RTVue Spectral-Domain Optical Coherence Tomography Retinal Nerve Fiber Layer(RNFL) Change Analysis (Optovue, Fremont, CA). RNFL sectoral thickness measurementsin comparison with normative data indicate nasal expansion of an inferior RNFL defect.Thickness plot (bottom left) shows progressive decreases in average (red), superior (blue)and inferior (green) RNFL thicknesses over time.
Kotowski et al. Page 12
Ophthalmic Surg Lasers Imaging. Author manuscript; available in PMC 2012 July 29.
NIH
-PA Author Manuscript
NIH
-PA Author Manuscript
NIH
-PA Author Manuscript
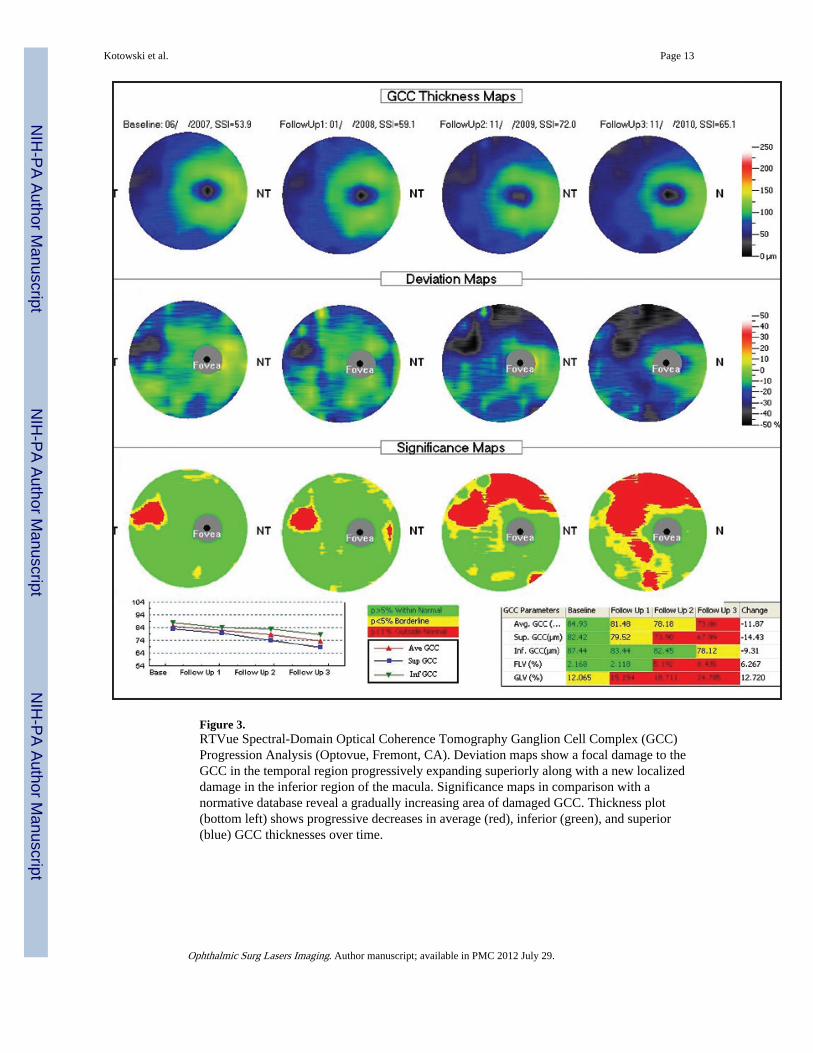
Figure 3.RTVue Spectral-Domain Optical Coherence Tomography Ganglion Cell Complex (GCC)Progression Analysis (Optovue, Fremont, CA). Deviation maps show a focal damage to theGCC in the temporal region progressively expanding superiorly along with a new localizeddamage in the inferior region of the macula. Significance maps in comparison with anormative database reveal a gradually increasing area of damaged GCC. Thickness plot(bottom left) shows progressive decreases in average (red), inferior (green), and superior(blue) GCC thicknesses over time.
Kotowski et al. Page 13
Ophthalmic Surg Lasers Imaging. Author manuscript; available in PMC 2012 July 29.
NIH
-PA Author Manuscript
NIH
-PA Author Manuscript
NIH
-PA Author Manuscript