Electrophysiological Evidence of Semantic Interference in Visual Search

J Comput Neurosci (2011) 31:547–561DOI 10.1007/s10827-011-0322-3
Modelling intrinsic electrophysiological propertiesof ON and OFF retinal ganglion cells
Tatiana Kameneva · Hamish Meffin ·Anthony N. Burkitt
Received: 23 September 2010 / Revised: 11 January 2011 / Accepted: 27 February 2011 / Published online: 23 March 2011© Springer Science+Business Media, LLC 2011
Abstract ON and OFF retinal ganglion cells (RGCs)display differences in their intrinsic electrophysiology:OFF cells maintain spontaneous activity in the absenceof any input, exhibit subthreshold membrane poten-tial oscillations, rebound excitation and burst firing;ON cells require excitatory input to drive their ac-tivity and display none of the aforementioned phe-nomena. The goal of this study was to identify andcharacterize ionic currents that explain these intrinsicelectrophysiological differences between ON and OFFRGCs. A mathematical model of the electrophysiolog-ical properties of ON and OFF RGCs was constructedand validated using published patch-clamp data fromisolated intact mouse retina. The model incorporatesthree ionic currents hypothesized to play a role ingenerating behaviors that are different between ONand OFF RGCs. These currents are persistent Na+,INaP, hyperpolarization-activated, Ih, and low voltageactivated Ca2+, IT, currents. Using computer simula-tions of Hodgkin-Huxley type neuron with a single
Action Editor: Catherine E. Carr
T. Kameneva (B) · H. Meffin · A. N. BurkittDepartment of Electrical Engineering,The University of Melbourne,Bld. 193 room 4.2, VIC 3010, Australiae-mail: [email protected]
H. Meffin · A. N. BurkittNICTA Victoria Research Lab,The University of Melbourne,Lvl 2/ Bldg. 193, VIC 3010, Australia
A. N. BurkittThe Bionic Ear Institute, 384-388 St, East Melbourne,VIC 3002, Australia
compartment model we found two distinct sets of INaP,Ih, IT conductances that correspond to ON and OFFRGCs populations. Simulations indicated that specialproperties of IT explain the differences in intrinsicelectrophysiology between ON and OFF RGCs exam-ined here. The modelling shows that the maximumconductance of IT is higher in OFF than in ON cells,in agreement with recent experimental data.
Keywords Retinal ganglion cells · Modelling ·Electrophysiology · Ionic currents
1 Introduction
Retinal ganglion cells (RGCs) are the sole outputneurons of the retina and consequently determine thenature of visual information transmitted to the centralbrain. ON and OFF RGCs form independent path-ways to the lateral geniculate nucleus of the thalamusand then converge at the level of cortical cells. Thecell types respond in opposite fashions to changes inlight intensity: ON cells increase their spike rate inresponse to light increments, while OFF cells increasetheir spike rate to light decrements. This differentialstimulation increases information transfer to the cortexby providing excitatory signals for both increases anddecreases in light intensity (Hubel and Wiesel 1962). Inaddition, OFF cells can be divided into two types: OFFtransient (OFF T) and OFF sustained (OFF S). Thefirst type is quiet in darkness and has transient spikesat light offset. The second type exhibits spontaneousspikes in darkness and has a sustained component ofspike activity during the light illumination (Murphy andRieke 2006; Pang et al. 2003).

548 J Comput Neurosci (2011) 31:547–561
Different responses of ON and OFF RGCs are par-tially due to the different synaptic inputs from moreperipheral cells in the visual system: the inheritedproperties arise due to synaptic input from ON andOFF bipolar cells, which in turn obtain their responseproperties from different glutamate receptors at thephotoreceptor-bipolar cell synapse.
Differences in response properties of ON and OFFRGCs are also shaped by their intrinsic electrophys-iological properties, although only limited data areavailable (Margolis and Detwiler 2007; Margolis et al.2010, 2008). Margolis and Detwiler (2007) have exam-ined the response of ON and OFF RGCs to current-clamp stimuli in mice when synaptic input was blocked.They found that OFF RGCs show complex mecha-nisms of action potential generation depending on themembrane potential. In particular, OFF cells main-tain spontaneous activity in the absence of any input,exhibit subthreshold membrane potential oscillations,rebound excitation and burst firing. Additionally, theyhave a distinct pattern of the coefficient of variation(CV) of their inter-spike interval as a function of meanmembrane potential. In contrast, ON RGCs requireexcitatory input to drive their activity and display noneof the aforementioned phenomena. These phenomenaare characterized as follows.
Spontaneous activity is the presence of spiking ac-tivity in the absence of any input to the cell. Sub-threshold membrane potential oscillations are rhythmicfluctuations in membrane potential that do not result inaction potentials. Rebound excitation is observed as avolley of action potentials initiated at the terminationof a sustained hyperpolarization. This phenomenon isdetected as an abrupt transition to burst firing in whichseveral action potentials occur rapidly in a group beforereturning back to regular spontaneous activity. Burstfiring is also observed during a negative current in-jection: with the increasing amplitude of the injectedcurrent, OFF cells transit from regular spontaneousactivity to irregular firing, to bursts firing and then tosilence. During this process, the CV of the inter-spikeinterval in OFF cells increases with decreasing levelsof mean membrane potential. The above phenomenain RGCs were studied in Mitra and Miller (2007a, b),Margolis and Detwiler (2007), Stasheff (2008) amongothers.
A number of ionic currents have been consideredas potential mechanisms underlying these differencesin intrinsic electrophysiology of ON and OFF RGCs(Margolis and Detwiler 2007; Margolis et al. 2010,2008). The potential currents include the persistent Na+current, INaP, the low voltage activated (LVA) Ca2+
current, IT, and the hyperpolarization activated mixedcation current, Ih.
INaP was found to contribute to the generation ofspontaneous activity in various types of neurons andto the presence of subthreshold membrane potentialoscillations in medial entorhinal cortical layer II neu-rons (Klink and Alonso 1993). Comparing the strengthof subthreshold oscillations in RGCs before and aftertetrodotoxin application, it has been shown that sub-threshold oscillations in RGCs are sensitive to the levelof Na+ current (Margolis and Detwiler 2007).
The phenomenon of rebound excitation has beeninvestigated in the amphibian retina (Mitra and Miller2007a, b). The termination of a sustained hyperpo-larization leads to the occurrence of a tetrodotoxininsensitive net depolarizing voltage overshoot, whichis composed of two independent components: a smallamplitude overshoot, which follows by the release fromhyperpolarization, and a low threshold calcium spike.Based on pharmacological sensitivities, it was demon-strated that amphibian RGCs possess Ih, which un-derlies the small amplitude overshoot, and IT, whichunderlies the low threshold calcium spike (Mitra andMiller 2007a). The net depolarizing overshoot pro-motes the generation of sodium spikes, which are trig-gered on the upstroke and crest of the overshoot, thuseliciting rebound excitation.
Various models of retinal processing have been pro-posed in the literature (Balya et al. 2002; Daneshvarand Ghassemian 2008; Dokos et al. 2005; Martins et al.2007; Morillasa et al. 2007; Usui et al. 1997; Wei andGuan 2008), from low complexity “black-box” models(Wohrer et al. 2008) to high complexity detailed neu-romorphic models of RGCs (Fohlmeister and Miller1997b). However none of the existing models accountfor the intrinsic electrophysiological differences be-tween ON and OFF RGCs.
Previous models have not examined the role of INaP,Ih or IT in ON and OFF RGCs behavior. As discussedabove, INaP has been implicated in the maintenanceof spontaneous activity and subthreshold oscillationsin layer II cortical neurons. Ih and IT are involvedin rebound excitation in the amphibian retina. Sincethe phenomena of spontaneous activity, subthresholdoscillations and rebound excitation are some of themain differences between ON and OFF RGCs behaviorin mice retina, we have examined the role of INaP, Ih
and IT to account for these differences.We base our model on that of Folhmeister and Miller
(1997a). This model is quantitatively successful in sim-ulating spike frequency behavior and its controllingmechanisms as well as phase plot analysis of the action
J Comput Neurosci (2011) 31:547–561 549
potential shape. The model has been widely used as thebasis for modelling RGCs (Benison et al. 2001; Sikoraet al. 2005). The model is based on five voltage-gatedcurrents that were characterized from earlier voltage-clamp data. It includes a leakage current to match inputresistance between the model and experimental data.
Based on the discussion above, we included modelsof INaP, Ih and IT into the Folhmeister and Miller modelin addition to the currents described in Fohlmeister andMiller (1997a). Due to the scarcity of the experimentalresults, the modelling is primarily based on the experi-mental findings of Margolis and Detwiler (2007). Nonethe less, the model can be well constrained (refer toResults).
2 Methods
To explore the role played by Ih, IT and INaP in the gen-eration of ON and OFF RGC response, the dynamics ofthe ionic currents have been described using Hodgkin-Huxley-type equations (see Model Description). Com-puter simulations of RGC activity were performed inthe NEURON environment (Hines 1993). A subset ofexperimental data (Margolis and Detwiler 2007) wasused to constraint the model (see Model Tuning), an-other subset of the data (Margolis and Detwiler 2007)was used to validate the model (see Model Validation).
2.1 Model description
The RGCs ionic currents were summed using Kirchoff’slaw:
CmdVdt
= gL(V − VL)
+gNam3h(V − VNa) + gCac3(V − VCa)
+ (gKn4 + gK,Aa3hA + gK(Ca)
)(V − VK)
+ghl(V − Vh) + gTm3ThT(V − VT)
+gNaP p(V − VNa) + Istim. (1)
Here V is the membrane potential, Cm is the specific ca-pacitance of the membrane and g is the maximum con-ductance of an ionic current defined by the subscript.Leak, sodium, calcium, delayed rectifier potassium, A-type and Ca-activated potassium currents have dynam-ics the same as in Fohlmeister and Miller (1997a). Thehyperpolarization-activated, LVA calcium and sodiumpersistent currents were modelled as in van Welie etal. (2006), Wang et al. (1991) and Traub et al. (2003),respectively. Istim is an intracellular stimulation current.
Since the data of Margolis and Detwiler (2007) wasobtained under synaptic blockage, we did not includesynaptic currents into the model. Similar to Fohlmeisterand Miller (1997a), the only reversal potential that wasallowed to vary with time was VCa:
VCa(t) = RT2F
ln
( [Ca2+]
e[Ca2+]
i (t)
)
, (2)
where R = 8.314 J/(M·K) is the gas constant, T is tem-perature in Kelvin, F = 9.684 · 104 C/M is the Faradayconstant, [Ca2+]e = 1.8 mM represents the extracellu-lar calcium ion concentration. The intracellular calciumion concentration [Ca2+]i is allowed to vary in responseto ICa (the calcium current, the third term on the rightof (1)) as follows Fohlmeister and Miller (1997a):
d[Ca2+]
i (t)
dt= −3ICa(t)
2Fr−
[Ca2+]
i (t) − [Ca2+]
res
τCa, (3)
where r = 0.1 um is the depth of the shell beneath themembrane for the calcium pump and τCa = 1.5 ms is thetime constant for calcium current. The free intracellularcalcium ions above the residual level, [Ca2+]res = 10−4
mM, are removed from the cell.The conductance of the Ca-activated potassium cur-
rents is modelled as follows:
gK(Ca)(t) = gK(Ca) ·([
Ca2+]i (t)/
(Ca2+)
diss
)2
1 + ([Ca2+]
i (t)/(Ca2+)
diss
)2 , (4)
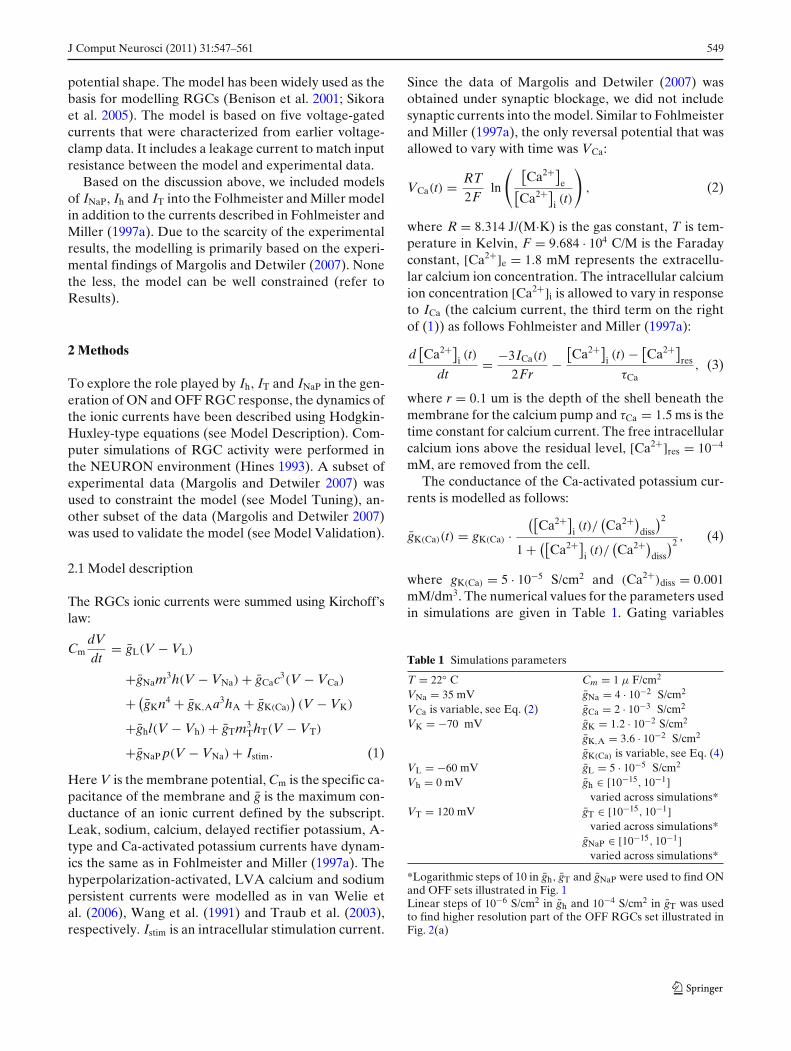
where gK(Ca) = 5 · 10−5 S/cm2 and (Ca2+)diss = 0.001mM/dm3. The numerical values for the parameters usedin simulations are given in Table 1. Gating variables
Table 1 Simulations parameters
T = 22◦ C Cm = 1 μ F/cm2
VNa = 35 mV gNa = 4 · 10−2 S/cm2
VCa is variable, see Eq. (2) gCa = 2 · 10−3 S/cm2
VK = −70 mV gK = 1.2 · 10−2 S/cm2
gK,A = 3.6 · 10−2 S/cm2
gK(Ca) is variable, see Eq. (4)VL = −60 mV gL = 5 · 10−5 S/cm2
Vh = 0 mV gh ∈ [10−15, 10−1]varied across simulations*
VT = 120 mV gT ∈ [10−15, 10−1]varied across simulations*
gNaP ∈ [10−15, 10−1]varied across simulations*
*Logarithmic steps of 10 in gh, gT and gNaP were used to find ONand OFF sets illustrated in Fig. 1Linear steps of 10−6 S/cm2 in gh and 10−4 S/cm2 in gT was usedto find higher resolution part of the OFF RGCs set illustrated inFig. 2(a)

550 J Comput Neurosci (2011) 31:547–561
m, h, c, n, a, hA, l, mT, p of the voltage-gated ionic cur-rents operate according to first-order kinetic equations
dxdt
= −(αx + βx)x + αx,
where x is a gating variable. The inactivation gatingvariable hT for the IT current is modelled as having twoclosed states. The rate of change of hT has the followingsecond-order dynamics
hT = αhT(1 − hT − d) − βhT hT,
where d satisfies
d = βd(1 − hT − d) − αdd.
The expressions for the voltage-dependent rate con-stants are given in Table 2.
The model employed a single-compartment consist-ing of one segment, taken as a cylinder with the di-ameter and length both 25 μm, which is similar toa ganglion cell soma. The standard Euler numericalintegration method with time step 0.025 ms was used inthe simulation. All voltage-dependent parameters wereinitialized using a membrane potential of −65 mV.
2.2 Model tuning
We used a subset of data from Margolis and Detwiler(2007) to constrain the model parameters gh, gT andgNaP (i.e., the maximum conductances of Ih, IT andINaP respectively). The following experimental datawere used for model tuning: the value of the restingmembrane potential (for ON cells) or mean membranepotential during spontaneous activity (for OFF cells);the spike rate of the spontaneous activity (for OFFcells) or the absence of such (for ON cells); the absenceof action potentials during a hyperpolarization step of−20 pA (for ON and OFF cells); presence (for OFFcells) or absence (for ON cells) of burst firing at thetermination of a hyperpolarization step of −20 pA. Acomparison of the model parameter constraints (C1–C4) and experimental data (Margolis and Detwiler2007) are listed in Table 3.
Due to the fact that a limited number of cells weresampled in the study of Margolis and Detwiler (2007),we have explored larger variations in the membranepotential and spiking frequency than that observed inthat study. We have relaxed the model constraints byincreasing the standard deviation in C1 ON, C1 OFFand C2 OFF. This is consistent with the observation,
Table 2 Rate constants forvoltage-gated ion channels(V is measured in mV)
Na+ channel αm = −0.6(V + 30)
e−0.1(V+30) − 1βm = 20e−(V+55)/18
αh = 0.4e−(V+50)/20 βh = 6
1 + e−0.1(V+20)
Ca2+ channel αc = −0.3(V + 13)
e−0.1(V+13) − 1βc = 10e−(V+38)/18
K+ channel αn = −0.02(V + 40)
e−0.1(V+40) − 1βn = 0.4e−(V+50)/80
A channel αa = −0.006(V + 90)
e−0.1(V+90) − 1βa = 0.1e−(V+30)/10
αhA = 0.04e−(V+70)/20 βhA = 0.6
1 + e−0.1(V+40)
h channel αl = e0.08316(V+75) βl = e0.033264(V+75)
T channel αmT = (1.7 + e−(V+28.8)/13.5)−1 βmT = 1 + e−(V+63)/7.8
1.7 + e−(V+28.8)/13.5
αhT = e−(V+160.3)/17.8 βhT = αhT ((0.25+e(V+83.5)/6.3)0.5 − 0.5)
αd = 1 + e(V+37.4)/30
240(0.5 + (0.25 + e(V+83.5)/6.3)0.5)βd = αd(0.25 + e(V+83.5)/6.3)0.5
NaP channel
[V < −40] αp = (0.025 + 0.14e(V+40)/10
(1 + e−(V+48)/10)βp = 1 − (1 + e−(V+48)/10)−1
0.025 + 0.14e(V+40)/10
[V ≥ −40] αp = (0.02 + 0.145e−(V+40)/10
1 + e−(V+48)/10)βp = 1 − (1 + e−(V+48)/10)−1
0.02 + 0.145e−(V+40)/10

J Comput Neurosci (2011) 31:547–561 551
Table 3 Comparison of the simulations parameters constraints (C1–C4) and experimental data
Model constraints Experimental data
ON RGCsC1 ON: Resting membrane potential [−62, −70] mV −65 ± 1 mVC2 ON: Spontaneous activity rate 0 Hz 0 HzC3 ON: During 500 ms stimulus of −20 pA Spike rate 0 Hz Spike rate 0 HzC4 ON: At the termination of 500 ms Spike rate 0 Hz Spike rate 0 Hz
stimulus of −50 pA (model constraint)or −20 pA (experimental data)
OFF RGCsC1 OFF: Membrane potential* [−50, −61] mV −55 ± 1 mVC2 OFF T: Spontaneous activity rate [9, 29] Hz 19 ± 4 HzC2 OFF S: Spontaneous activity rate [34, 54] Hz 44 ± 3 HzC3 OFF: During 500 ms stimulus of −20 pA Spike rate 0 Hz Spike rate 0 HzC4 OFF: At the termination of 500ms Rebound excitation** Rebound excitation
stimulus of −20 pA >60 Hz 60 Hz
* To calculate membrane potential while the cell was spontaneously active, spikes were removed (2ms deleted after 10 V/s threshold)before measuring membrane potential, as per the protocol in Margolis and Detwiler (2007)** Frequency has been calculated over 200 ms after the termination of a hyperpolarization stepDespite the bound >60 Hz, we found that all OFF cells had rebound excitation frequency >80 Hz
that the mean resting membrane potential for ON cellsis −65 mV with standard deviation of 1 mV accordingto Fig. 3(d1) in reference (Margolis and Detwiler 2007),however Fig. 6(a) in reference Margolis and Detwiler(2007) illustrates an example of the ON cell with theresting membrane potential of −61 mV.
To constrain the ON RGCs parameter space further,the absence of burst firing for ON cells at the termi-nation of a hyperpolarization current step (constraintC4 ON) was required for a current step of higheramplitude (−50 pA) than those injected into the cellin the experimental setup (−20 pA) by Margolis andDetwiler (2007).
In C4 OFF the spiking rate during rebound excita-tion was calculated based on a plot for a sample cellin Margolis and Detwiler (2007), therefore the “experi-mental data” value 60 Hz should be taken as indicativerather as a mean value for burst spiking frequency inOFF RGCs.
The maximum conductances gh, gT and gNaP wereallowed to vary, all other parameters for ON and OFFcells were set equal to parameters in Fohlmeister andMiller (1997a); van Welie et al. (2006), Wang et al.(1991), Traub et al. (2003). A search of the para-meter space for gh, gT and gNaP was undertaken byvariable iteration step. Logarithmic steps of 10 S/cm2
in gh, gT and gNaP were used to find ON and OFFsets illustrated in Fig. 1. The explored parameter spacewas from gh = gT = gNaP = 10−15 S/cm2 to gh = gT =gNaP = 10−1 S/cm2. This set contains the range of val-ues that are consistent with experimental data that wehave used to constraint the model. To obtain a greaterresolution in part of the OFF RGCs parameter space
(see Fig. 2(a)) linear steps of 10−6 S/cm2 in gh and 10−4
S/cm2 in gT were used in simulations.
2.3 Model validation
The ability of the model to generalize was tested bycomparing the model outputs to data (Mitra and Miller2007a; Margolis and Detwiler 2007) that was not usedto constrain the model. Comparisons of the validationdata (V) and model outputs are listed in Table 4.
• V1: Subthreshold oscillations in OFF cells. Whena hyperpolarizing current was applied, OFF cellsshould reveal oscillations in the subthresholdregime with an oscillation rate of 2–8 Hz, similar tothe data as shown in Margolis and Detwiler (2007).Within this frequency range, experimental data donot allow differentiate between OFF T and OFF Scells. Only qualitative results are available: OFF Tcells reveal sharp high frequency oscillations, whilesubthreshold oscillation in OFF S cells are slowerand not sharp. The amplitude, frequency and dura-tion of oscillations were compared to experimentaldata. The list of model output constraints for V1 aregiven in Table 4, relative to experimental data.
• V2: Disruption of spontaneous activity reveals burstsin OFF cells. With negative current steps of increas-ing amplitude, OFF cells should exhibit a transitionfrom regular spontaneous activity, to irregular ac-tivity, to bursts firing and then to silence, similar toMargolis and Detwiler (2007).To measure the transition, the CV was checked forthe following. Minimum CV was strictly less than

552 J Comput Neurosci (2011) 31:547–561
Fig. 1 ON and OFF RGCs parameter sets for conductances(gh, gT, gNaP). Logarithmic step size of 10 S/cm2 was used toexplore the parameter space. (a) ON RGCs set. (b) OFF S RGCsset. The sets are found under model constraints C1–4 ON for theON set and C1–4 OFF for the OFF set. See Table 3 for the list of
the constraints. All parameters in the Hodgkin–Huxley schemeare fixed except for gh, gT and gNaP. The parameter space gh ∈[10−15, 1] S/cm2, gT ∈ [10−15, 1] S/cm2, gNaP ∈ [10−15, 1] S/cm2
was explored using logarithmic step size
Fig. 2 A part of the OFF RGCs set and illustrative examples ofthe cells responses to intracellular electrical stimulation. (a) Ahigher resolution plot for gh, gT parameter set, gNaP = 5 · 10−8
S/cm2 is fixed. Linear step used in simulations was 10−6 S/cm2 ingh and 10−4 S/cm2 in gT. Constraints that dictate the boundariesfor the set: the solid line represents the transition from burst firingat the end of hyperpolarization, C4 OFF, (within the set) to noburst firing (outside the set); the dashed line marks the transitionfrom no spiking during −20 pA stimulation current, C3 OFF,(within the set) to the presence of spiking during stimulation(outside the set). The set satisfies the constrain C2 OFF T forgT < 10−3 S/cm2 (light gray, yellow online) and constrain C2
OFF S for gT ≥ 10−3 S/cm2 (dark gray, green online). Refer toTable 3 for the list of constraints. Empty squares show pointssatisfying model validation parameters V1. Solid triangles showpoints satisfying model validation parameters V2, open trianglesshow points satisfying all model validation parameters V2 exceptthat maximum CV ∈ (0.4, 1). Refer to Sections 2.3 and 3.2 formore details. (b) C3 OFF is violated: spikes (top trace) during thehyperpolarizing current step (bottom trace). (c) Both C3 OFF andC4 OFF are obeyed: absence of spikes during a hyperpolarizingcurrent step, C3 OFF, and rebound excitation, C4 OFF, at thetermination of the hyperpolarization current step. The stimula-tion current is shown below the membrane potential

J Comput Neurosci (2011) 31:547–561 553
Table 4 Comparison of themodel outputs (V1–V3) andexperimental data
Model outputs Experimental data
OFF RGCsV1: Subthreshold oscillations
Amplitude [1, 6] mV [3, 4] mVFrequency [1, 9] Hz [2, 8] HzDuration ≥ 10 s >2 sPower spectral density function max amplitude>
2 · mean amplitudeV2: Transition regular→irregular→bursts
Min CV <0.1 0Max CV >1 1.9CV is strictly increasing CV(Istim1 ) > CV(Istim2 )
∀ Istim1 < Istim2 ≤ 0V3: CV of inter-spike interval See V2 above and
description in the text
0.1, which corresponds to regular firing. MaximumCV was strictly more than 1, which correspondsto burst firing. The CV was strictly increasing withincreasing level of hyperpolarization until cell is notspiking. Together these criteria correspond to thetransition from regular to irregular to bursts firingand then to silence.
• V3: Pattern of the CV of inter-spike interval in OFFcells. The CV of the inter-spike interval in OFFcells should increase with increasing levels of hy-perpolarization, similar to Margolis and Detwiler(2007). The coefficient of variation is defined asthe standard deviation of the inter-spike intervaldivided by the mean. It is a common measure ofthe irregularity of spiking, in which a high valueCV reflects high variability and a low value ofCV reflects high regularity. To obtain the CV fordifferent levels of membrane potential, a stimu-lation current was applied: Istim ∈ [−0.008, 0.345]nA. Various linear step sizes in Istim were used insimulations. Minimum step size was 3 · 10−3 nA andmaximum step size was 3 · 10−1 nA. Simulationswere run for following combinations of parameters:gh ∈ [10−10, 6 · 10−6] S/cm2 with a step size of 10−6
S/cm2, gT = 9 · 10−4 S/cm2 and gT = 10−3 S/cm2,gNaP = 5 · 10−8 S/cm2 and gNaP = 5 · 10−6 S/cm2.The combination of conductances gh, gT, gNaP andvarious amplitudes of stimulation current Istim
resulted in 217 different combinations.
We also observed the effects of blockage of Na+,Ih and IT currents, similar to ones reported in Mitraand Miller (2007a) in tiger salamander. ExperimentallyNa+ was blocked with tetrodotoxin (TTX), Ih withcesium chloride (Cs+) and IT was blocked by additionof cobalt chloride (Co2+) to a bath. When Na+ cur-rent is blocked, OFF cells should show a characteristicsag during the hyperpolarization and the termination
of a sustained hyperpolarization should lead to theoccurrence of a tetrodotoxin insensitive net depolar-izing voltage overshoot. When Na+ and Ih currentsare blocked, the sag should be eliminated and a lowthreshold Ca2+ spike should be observed in OFF cellsat the termination of a prolonged hyperpolarization.When Na+ and IT currents are blocked, a characteristicsag and a small amplitude overshoot that follows therelease from hyperpolarization in OFF cells should beobserved.
3 Results
3.1 Model tuning
Using the constraints listed in Table 3, we have foundtwo distinct sets of the parameters (gh, gT, gNaP) thatcorrespond respectively to ON and OFF cells popu-lations. The sets are illustrated in Fig. 1. Figure 1(a)shows the set of conductances corresponding to ONcells and Fig. 1(b) shows the set of conductances cor-responding to OFF cells. The parameter sets for ONand OFF RGCs are mutually exclusive and differ intheir range of gT. Note that the Folhmeister and Millermodel corresponds to the parameter set gh = gT =gNaP = 0 (Fohlmeister and Miller 1997a).
Broadly speaking, the ON set constraints, C1 ON–C4 ON (refer to Table 3), are satisfied for the conduc-tances in the following range: gh ≤ 10−6 S/cm2, gT ≤10−6 S/cm2 and gNaP ≤ 10−6 S/cm2. The set does notcontain any protrusions or troughs. The set is essen-tially a rectangular prism indicating that constraintson gh, gT and gNaP are satisfied independently of oneanother.
The OFF set constraints, C1 OFF–C4 OFF, aresatisfied for conductances in the range: gh ≤ 10−6

554 J Comput Neurosci (2011) 31:547–561
S/cm2, gT ∈ [10−3 − r−, 10−3 + r+] S/cm2 and gNaP ≤10−6 S/cm2, where r−, r+ are relatively small comparedto 10−3 and depend on gh and gNaP, e.g. when gNaP = 5 ·10−8 and gh ∈ [10−6, 1.4 · 10−6], r− = 6 · 10−4, r+ = 2 ·10−4. The OFF cells set for the later values is illustratedin Fig. 2(a), where gNaP is fixed to allow visualizationin a two-dimensional space. The set shown of Fig. 2(a)satisfies the constrain C2 OFF T for gT < 10−3 S/cm2
(light gray, yellow online) and constrain C2 OFF S forgT ≥ 10−3 S/cm2 (dark gray, green online), respectively.Empty squares show points satisfying model valida-tion parameters V1. Solid triangles show points satis-fying model validation parameters V2, open trianglesshow points satisfying all model validation parame-ters V2 except that maximum CV ∈ (0.4, 1). Refer toSections 2.3 and 3.2 for more details.
Examples of the responses of RGCs with conduc-tances from outside and within the set are given inFig. 2(b) and (c). Figure 2(b) (conductances outside theset) illustrates that the constraint C3 OFF is violated:there is spiking activity during the hyperpolarizationstep. In contrast, the sample response in Fig. 2(c) (con-ductances within the set) shows no spiking during thehyperpolarization step. Also shown in Fig. 2(a) are theconstraints that dictated the boundaries of the set. Thesolid line corresponds to the limit of existence of burstfiring at the end of hyperpolarization (C4 OFF), thedashed line corresponds to the limit within which nospiking occurs during a −20 pA stimulation current (C3OFF).
For the given constrained sets of parameters, themodel has RGC responses that closely match the dataof Margolis and Detwiler (2007). Illustrative examplesof the fit between the model and experimental dataare given in Figs. 3 and 4. The values of gh, gT andgNaP in Figs. 3(a), 4(a) (and in Figs. 5(a), 7(a) and (c),8(a) for model validation) are taken from within theconstrained sets.
Figure 3 illustrates that, under the application ofsynaptic blockage, there is no background activity inthe ON cell (C2 ON, see Table 3), while the OFF Tand OFF S cells spike (C2 OFF, refer to Table 3).Figure 3(a) illustrates the result of the simulation,while Fig. 3(b) shows experimental data modified fromMargolis and Detwiler (2007) for comparison. Notethat more regular examples of spontaneous activity inOFF cells than those shown in Fig. 3(b) exist (Margolisand Detwiler 2007).
The model captures the phenomena of rebound ex-citation in OFF RGCs at the termination of a hy-perpolarization current. Figure 4 shows representativeresponses of ON and OFF RGCs to a hyperpolarizingstep current. Figure 4(a) shows the result of simulations
(a)
(b)
S
Fig. 3 Constraints C2 ON and C2 OFF: Absence (ON RGCs)and presence (OFF RGCs) of spontaneous activity. (a) Modelresults: ON RGCs simulation with gh = 5 · 10−8 S/cm2, gT = 5 ·10−7 S/cm2, gNaP = 5 · 10−8 S/cm2; OFF T RGC simulations withgh = 5 · 10−6 S/cm2, gT = 5 · 10−4 S/cm2, gNaP = 5 · 10−8 S/cm2.OFF S RGC simulations with gh = 2 · 10−6 S/cm2, gT = 1.2 · 10−4
S/cm2, gNaP = 5 · 10−8 S/cm2. (b) Experimental results: modifiedfrom Figs. 2 and 4.A3 (Margolis and Detwiler 2007). Refer toTable 3 for the list of constraints
and Fig. 4(b) illustrates experimental data (Margolisand Detwiler 2007) under similar stimulation condi-tions. The Figure illustrates how the model satisfies sev-eral constraints. First, it shows that at the terminationof the hyperpolarizing current there is a burst of spikesin the OFF cell (C4 OFF), while there are no actionpotentials in the ON cell (C4 ON). Refer to Table 3for the model constraints. Second, the absence of actionpotentials during hyperpolarization is observed in bothON and OFF cells (C3 ON and C3 OFF).
In Fig. 4, in order to eliminate spontaneous activityfor the OFF cell, a conditioning step current was givenbefore (−8pA) and after (−8pA) the main stimulus.A similar protocol was used in Margolis and Detwiler(2007).
A smaller amplitude hyperpolarizing current wasused in simulations than the current injected inMargolis and Detwiler (2007) due to the fact that wehave used a single compartment model and our somais a cylinder with the diameter and length of 25 μm.The real cell, on the other hand, forms a dendritictree of up to 300 μm diameter (Fohlmeister and Miller1997b).
3.2 Model validation
To validate the model, its outputs were compared toexperimental data V1–V3 (Mitra and Miller 2007a;

J Comput Neurosci (2011) 31:547–561 555
Fig. 4 Constraints C3 ONand C4 ON, C3 OFF and C4OFF: ON and OFF RGCresponses to ahyperpolarizing step current.The stimulation current isshown below the membranepotential. (a) Model results:ON RGCs simulation withgh = 10−7 S/cm2, gT = 10−7
S/cm2, gNaP = 10−7 S/cm2;OFF T RGCs simulation withgh = 5 · 10−6 S/cm2,gT = 4 · 10−4 S/cm2,gNaP = 5 · 10−8 S/cm2. Theinsert illustrates the responseof the same simulated cell ona longer time-scale under theprotocol similar to Margolisand Detwiler (2007). (b)Experimental results: Fig.6A,B adapted from Margolisand Detwiler (2007). Refer toTable 3 for the list ofconstraints
(a)
(b)
Margolis and Detwiler 2007) that was not used to con-strain the model. Refer to Section 2.3 for the modelvalidation data V1–V3.
Figure 5(a) demonstrates the presence of intrinsicrhythmicity of the subthreshold membrane potential inOFF T RGCs (model validation data V1). Figure 5(b)shows an experimentally measured response of an OFFT and OFF S RGCs to a hyperpolarizing current stepapplied through a somatic patch electrode (Margolis
and Detwiler 2007). In simulation a smaller ampli-tude current than that used in Margolis and Detwiler(2007) was injected since the size of the simulated cellis smaller than the size of the actual cell (refer toSection 3.1 for more details). For values of conduc-tances used in Fig. 5(a), the power spectral densityfunction for membrane potential shows a single largepeak at 1.8 Hz, while experiments show membraneoscillations of 2–8 Hz in OFF cells.
Fig. 5 Model validation V1: subthreshold membrane oscillationsin OFF RGCs. Stimulation current is superimposed and shownbelow membrane potential. (a) Model results: OFF T cell sim-ulations with gh = 5 · 10−6 S/cm2, gT = 5 · 10−4 S/cm2, gNaP =
5 · 10−8 S/cm2 and hyperpolarization current Istim = −13 pA. (b),(c) Experimental results under similar stimulation conditions:Figs. 5.A2 and 5.A3 from Margolis and Detwiler (2007). Referto Section 2.3 for the list of model validation data

556 J Comput Neurosci (2011) 31:547–561
We were unable to detect experimentally observablehigh frequency oscillation shown in Fig. 5(b) for OFF Tcell. Also, slow frequency oscillations were not robust:using 1 pA step size for the amplitude of hyperpolariz-ing current (common experimental constrain), we wereunable to detect oscillations in the most points of theOFF set. For some points in the set the oscillation weredetected only by reducing a step size of applied currentto 0.01 pA, that is difficult to achieve experimentally.In Fig. 2(a) the empty squares show points satisfyingmodel validation parameters V1. For some points sat-isfying constraints for OFF set, we observed dampedoscillations over a period of 2 s. Due to the lack ofexperimental data, it is difficult to judge if oscillationsin Fig. 5 in Margolis and Detwiler (2007) were observedfor longer than 2 s.
The model was also able to reproduce the transitionof OFF RGCs from regular spontaneous activity to ir-regular firing, to bursts firing, to silence under negativecurrent steps of increasing amplitude (model validationdata V2). An illustrative example of this phenomenais shown in Fig. 6(a) and (c). Experimental data undersimilar stimulation conditions are shown in Fig. 6(b)
and (d) that is taken from Margolis and Detwiler (2007)and is given for comparison.
In simulations, all OFF S cells exhibited burstsfiring with the increase level of hyperpolarization, whilesome OFF T did not show this phenomenon. Thisagrees well with experimental data in Margolis andDetwiler (2007), where a smaller percentage of OFF Tcells showed burst firing compared to OFF S cells. InFig. 2(a) the solid triangles show points satisfying modelvalidation parameters V2, while open triangles showpoints satisfying all model validation parameters V2except that maximum CV ∈ (0.4, 1) instead of CV> 1.Points marked by open triangles have response simi-lar to one shown on the second plot from the top inFig. 6(b).
The CV of inter-spike intervals as a function of meanmembrane potential in OFF RGCs is plotted in Fig. 7.The model output (Fig. 7(a)) was able to match Margo-lis and Detwiler’s data (V3; Fig. 7(b)) with good accu-racy. The high values of the CV in OFF RGCs, whichreflect high variability of inter-spike interval, are dueto the irregular and burst firing under negative currentsteps (see V2 above). The data in Fig. 7(a) correspond
(a) (b) (c) (d)
Fig. 6 Model validation V2: OFF cell transition from regularfiring, to irregular firing, to burst firing and then to silence. Thefour traces of the membrane potential (top to bottom) correspondto the responses to intracellular electrical stimulation with thecurrents shown in the bottom plot. (a) Model results: simulationswith gh = 8 · 10−6 S/cm2, gT = 8 · 10−4 S/cm2, gNaP = 5 · 10−8
S/cm2. (c) Model results: simulations with gh = 4 · 10−6 S/cm2,gT = 10−3 S/cm2, gNaP = 5 · 10−8 S/cm2. (b), (d) Experimentalresults: Figs. 4.A2 and 4.A3 adapted from Margolis and Detwiler(2007). The insert shows an enlarged group of spikes underhyperpolarizing step current. Refer to Section 2.3 for the list ofmodel validation data

J Comput Neurosci (2011) 31:547–561 557
(a) (b)
Fig. 7 Model validation V3: the CV of inter-spike intervals inOFF RGCs. (a) Model results. Simulations with following combi-nation of parameters: gh ∈ [10−10, 6 · 10−6] S/cm2, step size 10−6,gT = 9 · 10−4 S/cm2 and gT = 10−3 S/cm2 , gNaP = 5 · 10−8 S/cm2
and gNaP = 5 · 10−6 S/cm2. The mean membrane potential is var-ied by application of stimulation current Istim ∈ [−0.008, 0.345]
nA. Minimum step size in Istim used in simulation was 3 · 10−3
nA, maximum step size was 3 · 10−1 nA. The combination ofconductances gh, gT, gNaP and various amplitudes of stimulationcurrent Istim resulted in 217 different combinations. (b) Experi-mental results: Fig. 4.B3 (Margolis and Detwiler 2007). Refer toSection 2.3 for the list of model validation data
to a sample of different conductances of Ih, IT and INaP
from within the constrained set for OFF RGCs (seeMethods for details). The results of the simulations with
different conductances of Ih, IT and INaP are shown inFig. 7(a). Figure 7(b) and (c) show experimental datafor comparison (Margolis and Detwiler 2007).
(a)
(b)
Fig. 8 The three plots from the left to the right show the effectof blockage of sodium current (left), sodium and Ih currents(middle), sodium and IT currents (right). (a) Model results. Leftplot: Na+ current is blocked. OFF cells show a characteristicsag during the hyperpolarization and the net depolarizing over-shoot (NDO) at the termination of a sustained hyperpolarization.Simulations with gh = 10−5 S/cm2, gT = 5 · 10−4 S/cm2, gNaP =gNa = 0 S/cm2. Middle plot: Na+ and Ih currents are blocked.The sag is eliminated and the low threshold Ca2+ spike (LTCS)is observed in OFF cells at the termination of a prolongedhyperpolarization. Simulations with gh = 0 S/cm2, gT = 5 · 10−4
S/cm2, gNaP = gNa = 0 S/cm2. Right plot: Na+ and IT currentsare blocked. The characteristic sag and the small amplitude over-shoot (referred as non-regenerative overshoot (NRO, Mitra andMiller 2007a, b)) that follows by the release from hyperpolariza-tion in OFF cells are observed. Simulations with gh = 10−5 S/cm2,gT = 0 S/cm2, gNaP = gNa = 0 S/cm2. (b) Experimental results:Fig. 1 adapted from Mitra and Miller (2007a). The inserts showthe shape of the overshoots. Experimentally Na+ was blockedwith tetrodotoxin (TTX), Ih with cesium chloride (Cs+) and ITwas blocked by addition of cobalt chloride (Co2+) to a bath

558 J Comput Neurosci (2011) 31:547–561
We have observed that some points outside OFF setsatisfy model validation parameters, while some pointsinside OFF set do not satisfy them. Therefore, the OFFset can be constrained to be an intersection of twosets: a set satisfying model constraints C1–C4 and aset satisfying validation parameters V1–V3. However,some problems may arise due to errors in trying toextract quantitative description for validation data fromMargolis and Detwiler (2007). For example, the fre-quency of oscillation (validation V1) is 2–8 Hz forOFF cells; it is not clear what frequency range corre-sponds to OFF T cells (it should have faster membranefluctuations) and what frequency range corresponds toOFF S cells (slower membrane fluctuation).
The effects of blockage of Na+, Ih and IT currentsare illustrated in Fig. 8(a) (validation data V4). Ex-perimental results for the amphibian retina (Mitra andMiller 2007a) are given in Fig. 8(b) for comparison.
The effect of only Na+ blockage is shown in theplots on the left in Fig. 8(a) and (b). The Na+ blockagereveals a net depolarizing overshoot which is likelyan underlying generator for post-hyperpolarization re-bound Na+ spiking, since it reaches voltages that aresuprathreshold for Na+ spike generation. The plots onthe left illustrate a characteristic sag at the onset of a hy-perpolarizing current step, similar to Mitra and Miller(2007a). The presence of the Ih current is required forthe sag to be observed, gh = 10−5 S/cm2 was used insimulation.
When in addition to the Na+ blockage, the hyperpo-larization activated current is blocked, a low thresholdcalcium spike component of net depolarizing overshootis observed but the sag that appeared at the onset of thehyperpolarization current pulse is not seen: refer to themiddle plots in Fig. 8(a) and (b).
The effect of the blockage of Na+ and the LVA Ca2+current is shown on the plots on the right of Fig. 8(a)and (b). These plots illustrate a small-amplitude, slowfalling overshoot at the termination of a hyperpolar-ization current step (called non-regenerative overshoot(NRO, Mitra and Miller 2007a)).
To explore the role of LVA Ca2+ current in theintrinsic properties of OFF cells, the frequency of spon-taneous and rebound burst firing is plotted against gT
in Fig. 9(a) and (b). It is shown that the spontaneousand rebound burst spike frequency increases with theincreasing value of the conductance of LVA Ca2+current. It is also shown in Fig. 9(b), that the burstspike frequency depends on the conductance of thehyperpolarization activated current and decreases withthe increasing value of gh. Values of gT, gh and gNaP inFig. 9 are taken to lie within OFF set.
4 6 8 10 12 14
x 104
15
20
25
30
35
40
45
gT [S/cm2]
Spo
ntan
eous
Fre
quen
cy [H
z]
gh = 10 6 [S/cm2]
gh = 4 10 6 [S/cm2]
gh =9 10 6 [S/cm2]
(a)
gNaP
= 5 .
.
.
.
.
.
10 8 [S/cm2]
4 6 8 10 12 14
x 10–4
60
80
100
120
140
gT [S/cm2]
Bur
st F
requ
ecy
[Hz]
gh=10 6 [S/cm2]
gh=4 10 6 [S/cm2]
gh=9 10 6 [S/cm2]
(b)
gNaP
= 5 10 8 [S/cm2]
–
–
–
–
–
–
–
–
–
Fig. 9 The role of LVA Ca2+ current in the intrinsic propertiesof OFF cells. Model results: simulation with gh = 10−6 S/cm2,gh = 4 · 10−5 S/cm2, gh = 9 · 10−6 S/cm2, gT ∈ [4 · 10−4, 14 · 10−4]S/cm2 and gNaP = 5 · 10−8S/cm2. (a) Spontaneous frequency. (b)Rebound burst frequency
4 Discussion
We have presented models of ON and OFF RGCs thatare able to capture many of the intrinsic electrophys-iological behaviours of these neurons as reported inMargolis and Detwiler (2007) and Mitra and Miller(2007a). These include features that distinguish OFFfrom ON RGCs, such as maintained activity in theabsence of synaptic input, rebound excitation and burstfiring. In the model, differences in these behaviours be-tween OFF and ON cells were explained solely in termsof different magnitudes for the LVA Ca2+ current inthe two cell types. ON set constraints are satisfied forgT ≤ 10−6 S/cm2, while OFF set constraints are satisfiedfor gT ≈ 10−3 S/cm2.

J Comput Neurosci (2011) 31:547–561 559
The prediction that OFF RGCs require a compar-atively higher value of the maximum conductance ofthe LVA Ca2+ current was confirmed experimentallywhile we were conducting the present study. Recentdata has shown that while both ON and OFF RGCsexpress high voltage activated Ca2+ channels, only OFFcells also express the LVA Ca2+ channels (Margoliset al. 2010). The results presented here show that manyof the differences in intrinsic electrophysiology of ONand OFF cells can be explained on this basis.
One of the main difference between ON and OFFcells behavior is the presence (in OFF cells) or ab-sence (for ON cells) of rebound excitation. Featuresof rebound excitation were observed in rats (Enget al. 1990), goldfish (Tabata and Ishida 1996), tigersalamanders (Mitra and Miller 2007a, b) and cats RGCs(O’Brien et al. 2002), although the results were not dis-tinguished between ON and OFF cells, except for thedata in mice (Margolis and Detwiler 2007). Reboundfiring may be activated by sustained hyperpolarizationmediated via activation of the metabotropic GABAB
receptor (Mitra and Miller 2007a, b). It was shown thatLVA Ca2+ current plays a pivotal role in the processof generating of rebound excitation (Mitra and Miller2007a, b).
Simulation results from Lee et al. (2003) have shownthat the increased availability of the LVA Ca2+ currentat the termination of hyperpolarization, in combina-tion with concurrent activation of hyperpolarization-activated current, leads to a rebound response and thatthe LVA Ca2+ current is a modulator of the interplaybetween excitation and inhibition in RGCs. However,experimental data shows that rebound firing is not elim-inated by the blockage of hyperpolarization-activatedcurrent (Mitra and Miller 2007a). This correspondswell to our results that suggest that hyperpolarization-activated current is not essential for the phenomenonof rebound excitation.
The existence of the LVA Ca2+ andhyperpolarization-activated currents in RGCs isalso discussed in Henderson and Miller (2007), Leeet al. (2003), O’Brien et al. (2002). Models of thekinetics of the LVA Ca2+ current were proposed inHenderson and Miller (2007) and Lee et al. (2003).The Lee et al. model uses a complicated Markov chainscheme, while the Henderson and Miller model uses aHodgkin-Huxley type scheme similar to the Wang etal. model used here. One difference between the modelused here and the other two models is that in the Wanget al. model the steady state activation and inactioncurves of the LVA Ca2+ current are shifted by 10 mVto the more negative membrane potentials.
The LVA Ca2+ currents are almost inactivatedat resting potential. Thus, an important question iswhether RGCs reach a sustained level of hyperpolar-ization necessary to strongly activate the LVA Ca2+currents under normal light condition is discussed inLee et al. (2003) and Mitra and Miller (2007a). It hasbeen shown that RGCs are buffeted by a constantstream of excitatory and inhibitory inputs and thata sequence of transient hyperpolarizations, mimickingrepetitive inhibitory input, leads to activation of theLVA Ca2+ current in goldfish RGCs (Lee et al. 2003).Recording light responses of turtle RGCs to spots oflight of different diameter and intensity, it was foundthat suitably arranged stimuli hyperpolarize RGCs byas much as 15 mV (Ammermuller and Kolb 1995).
Another difference between ON and OFF RGCsis the presence of burst firing in OFF cells. In thala-mic neurons the LVA Ca2+ current activates high-frequency bursts of Na+ action potentials at thetermination of a hyperpolarization current step of largeamplitude. Short bursts of spikes at a slow rate of 2–4 Hz occur following a hyperpolarizing current of asmaller amplitude (Llinas and Steriade 2006). In thala-mic relay neurons rhythmic burst firing (similar to onesillustrated in Fig. 6(a), third plot from the top) resultsfrom the interaction of the LVA Ca2+ current with thehyperpolarization-activated current (McCormick andPape 1990).
The presence of subthreshold oscillations in OFFRGCs is another striking difference between ONand OFF cells. The presence of intrinsic rhythmicitywhen the cell is maintained at a marginally subthresh-old level can be attributed to voltage-gated channelsfluctuations. While the phenomenon of subthresholdoscillations is studied extensively in other types of neu-rons (Gutfreund et al. 1995; Klink and Alonso 1993;Lampl and Yarom 1997), the nature of these oscillationin RGCs (illustrated in Fig. 5) is not clear.
It is difficult to comment on the expected role ofintrinsic properties in responses of RGCs to light.Stimulus-evoked synaptic input to most neurons is notwell understood. The neural circuits governing the gen-eration of light-evoked action potential are often com-plex and incompletely understood to directly test thecontribution of neuron’s intrinsic properties, networkand stimulus to the variability of the response (Murphyand Rieke 2006).
Our modelling of sodium, calcium, delayed rectifierpotassium, A-type and Ca-activated potassium cur-rents was based on the experimental data from tigersalamander RGCs (Fohlmeister and Miller 1997a).The dynamics of the hyperpolarization-activated, LVA

560 J Comput Neurosci (2011) 31:547–561
calcium and sodium persistent currents are based on thedata from neurons in rat subiculum, rat’s thalamocorti-cal relay neurons and cat’s cortical pyramidal neuronsrespectively (van Welie et al. 2006; Wang et al. 1991 andTraub et al. 2003). The modelling of different intrinsicelectrophysiological properties of ON and OFF RGCsis based on data from wild-type mice (Margolis andDetwiler 2007). While it was shown that the variationin the intrinsic membrane properties are systematicallyrelated to RGC type in cats (classified by alpha, beta,delta, etc. types; not by ON/OFF types) (O’Brien et al.2002), it remains unclear if the differences in intrinsicelectrophysiology between ON and OFF RGCs arepresent in other mammalian and primate retina.
The success with which our model has been able topredict the experimental recordings in RGCs providessupport that this model may form a basis for severalfuture extensions to the current study. We list some ofthese extensions below.
Many intrinsic electrophysiological properties ofRGCs, that we have used for model tuning and vali-dation, also hold for retinal degeneration (rd-1) mice(Margolis et al. 2008). Based on that, our model mayalso provide a good basis for modelling degenerativeretina.
RGCs morphological types differ from one anotherin their intrinsic electropysiology (O’Brien et al. 2002).Our model may serve as a foundation for modellingdifferent morphological types of RGCs.
Our modelling does not include synaptic input toRGCs. In degenerative retina (RD) strong rhythmicsynaptic input drives ongoing oscillatory firing in bothON and OFF RGCs at a frequency of 7–10 Hz in the ab-sence of sensory input. Maintained rhythmic activity isnot synchronized between RGCs and is a characteristicfeature of RD RGCs that is not seen in wildtype retina(Margolis et al. 2008; Stasheff 2008). ON and OFFRD RGCs also have different balance of inhibitoryand excitatory inputs: in ON cells the inward currentis monophasic, while in OFF cells the input current isbiphasic. The effect of the synaptic input remains to beinvestigated in future research.
In this study we have used a single-compartmentHodgkin-Huxley type neuron. Based on the fact thatwe have been able to capture many intrinsic electro-physiological differences between ON and OFF RGCs(including maintained activity in the absence of synap-tic input, rebound excitation and burst firing), a singlecompartment model is sufficient for this study. Extend-ing the model to a more anatomically accurate, multiplecompartment model is hampered by the lack of exper-imental data on the presence of ion channels in RGCsdendrites. Experimental data is somewhat limited but
suggests the following features: the LVA Ca2+ channeldensity on dendrites is five times higher than in soma(Henderson and Miller 2003; Miller et al. 2002); Na+is localized in unmyelinated axons in optic nerve axons(Caldwell et al. 2000); there is a high density sodium-channel bands in the initial segment of axon (Friedet al. 2009).
Acknowledgements The authors wish to thank David Graydenfor stimulating discussions that were of invaluable help in car-rying out this work and Michael Eager for his help with NEU-RON software. This research was supported by the AustralianResearch Council (ARC) through its Special Research Initiative(SRI) in Bionic Vision Science and Technology grant to BionicVision Australia (BVA). The Bionic Ear Institute acknowledgesthe support it receives from the Victorian Government throughits Operational Infrastructure Support Program.
References
Ammermuller, J., & Kolb, H. (1995). The organization of theturtle inner retina. Part I. ON- and OFF-centre pathways.Journal of Comparative Neurology, 358, 1–34.
Balya, D., Roska, B., Roska, T., Frank, S., & Werblin, A. (2002).CNN framework for modeling parallel processing in a mam-malian retina. International Journal Of Circuit Theory andApplications, 30, 363–393.
Benison, G., Keizer, J., Chalupa, L. M., & Robinson, D. W.(2001). Modelling temporal behavior of postnatal cat retinalganglion cells. Journal of Theoretical Biology, 210, 187–199.
Caldwell, J. H., Schaller, K. L., Lasher, R. S., Peles, E., &Levinson, S. R. (2000). Sodium channel Nav 1.6 is localizedat Nodes of Ranvier, Dendrites, and Synapses. Proceedingsof the National Academy of Sciences of the United States ofAmerica, 97, 5616–5620.
Daneshvar, S., & Ghassemian, H. (2008). A feedback retinamodel for improving medical images fusion. In Proc. IEEEEMBS conf. (pp. 4035–4038).
Dokos, S., Suaning, G. J., & Lovell, N. H. (2005). A bidomainmodel of epiretinal stimulation. Ieee Transactions on NeuralSystems and Rehabilitation Engineering, 13, 137–146.
Eng, D. L., Gordon, T. R., Kocsis, J. D., et al. (1990). Current-clamp analysis of a time-dependent rectification in rat opticnerve. Journal of Physiology, 421, 185–202.
Gutfreund, Y., Yarom, Y., & Segev, I., (1995). Subthresholdoscillations and resonant frequency in guinea-pig corticalneurons: Physiology and modelling. Journal of Physiology,483, 621–640.
Fohlmeister, J. F., & Miller, R. F. (1997a). Impulse encodingmenchanisms of ganglion cells in the tiger salamander retina.Journal of Neurophysiology, 78, 1935–1947.
Fohlmeister, J. F., & Miller, R. F. (1997b). Mechanisms by whichcell geometry controls repetitive impulse firing in retinalganglion cells. Journal of Neurophysiology, 78, 1948–1964.
Fried, S. I., Lasker, A. C. W., Desai, N. J., Eddington, D. K.,& Rizzo, J. F. (2009). Third axonal sodium-channel bandsshape the response to electric stimulation in retinal ganglioncells. Journal of Neurophysiolog, 101, 1972–1987.
Henderson, D., & Miller, R. F. (2003). Evidence for low-voltage-activated (LVA) calcium currents in the dendrites of tigersalamander retinal ganglion cells. Visual Neuroscience, 20,141–152.

J Comput Neurosci (2011) 31:547–561 561
Henderson, D., & Miller, R. F. (2007). Low-voltage activatedcalcium currents in ganglion cells of the tiger salamanderretina: Experiment and simulation. Visual Neuroscience, 24,37–51.
Hines, M. (1993). NEURON a program for simulation of nerveequations. In F. Eckman. (Ed.), Neural systems: Analysis andmodeling. Norwell: Kluwer Academic Publishers.
Hubel, D. H., & Wiesel, T. N. (1962). Receptive fields, binocu-lar interaction and functional architecture in the cat’s visualcortex. Journal of Physiology, 160, 106–154.
Klink, R., & Alonso, A. (1993). Ionic mechanisms for the sub-threshold oscillations and differential electroresponsivenessof medial entorhinal cortex layer II neurons. Journal of Neu-rophysiology, 70, 144–157.
Lampl, I., & Yarom, Y. (1997). Subthreshold oscillations and res-onant behavior: Two manifestations of the same mechanism.Journal of Neuroscience, 78, 325–341.
Lee, S. C., Hayashida, Y., & Ishida, A. T. (2003). Availability oflow-threshold Ca current in retinal ganglion cells. Journal ofNeurophysiology, 90, 3888–3901.
Llinas, R. R., & Steriade, M. (2006). Bursting of thalamic neu-rons and states of vigilance. Journal of Neurophysiologgy,95, 3297–3308.
Margolis, D. J., & Detwiler, P. B. (2007). Different mechanismsgenerate maintained activity in ON and OFF retinal gan-glion cells. Journal of Neuroscience, 27(22), 5994–6005.
Margolis, D. J., Gartland, A. J., Euler, T., & Detwiler, P. B.(2010). Dendritic calcium signaling in ON and OFF mouseretinal ganglion cells. Journal of Neuroscience, 30(21), 7127–7138.
Margolis, D. J., Newkirk, G., Euler, T., & Detwiler, P. B.(2008). Functional stability of retinal ganglion cells afterdegeneration-induced changes in synaptic input. Journal ofNeuroscience, 28, 6526–6536.
Martins, S. F., Sousa, L. A., & Martins, J. C. (2007). Additive lo-gistic regression applied to retina modelling. In Proc. IEEEconf. im. proc. (pp. 1437–1440).
McCormick, D. D., & Pape, H. C. (1990). properties ofhyperpolarization-activated cation current and its role inrhythmic oscillation in thalamic relay neurones. Journal ofPhysiology, 431, 192–318.
Miller, R. F., Stenback, K., Henderson, D., & Sikora, M. (2002).How voltage-gated ion channels alter the functional prop-erties of ganglion and amacrine cell dendrites. ArchivesItaliennes de Biologie, 140(4), 347–359.
Mitra, P., & Miller, R. F. (2007). Mechanism underlying reboundexcitation in retinal ganglion cells. Visual Neuroscience, 24,709–731.
Mitra, P., & Miller, R. F. (2007b). Normal and rebound impulsefiring in retinal ganglion cells. Visual Neuroscience, 24, 79–90.
Morillasa, C., Romero, S., Martinez, A., Pelayo, F. J., Ros, E., &Fernandez, E. (2007). A design framework to model retinas.BioSystems, 87, 156–163.
Murphy, G. J., & Rieke, F. (2006). Network variability limitsstimulus-evoked spike timing precision in retinal ganglioncells. Neuron, 52, 511–524.
O’Brien, B. J., Isayama, T., Richardson, R., & Berson, D. M.(2002). Intrinsic physiological properties of cat retinal gan-glion cells. Journal of Physiology, 538(3), 787–802.
Pang, J.-J., Gao, F., & Wu, S. M. (2003). Light-evoked excitatoryand inhibitory synaptic inputs to ON and OFF α ganglioncells in the mouse retina. Journal of Neuroscience, 23(14),6063–6073.
Sikora, M. A., Gottesman, J., & Miller, R. F. (2005). A computa-tional model of the ribbon synapse. Journal of NeuroscienceMethods, 145, 47–61.
Stasheff, S. F. (2008). Emergence of sustained spontaneous hy-peractivity and temporary preservation of OFF responsesin ganglion cells of the retinal degeneration (rd1) mouse.Journal of Physiology, 99, 1408–1421
Tabata, T., & Ishida, A. T. (1996). Transient and sustained depo-larization of retinal ganglion cells by I-h. Journal of Neuro-physiology, 75, 1932–1943.
Traub, R. D., Buhl, E. H., Gloveli, T., & Whittington, M. A.(2003). Fast rhythmic bursting can be induced in layer 2/3cortical neurons by enhancing persistent NaP conductanceor by blocking BK channels. Journal of Neurophysiology, 89,909–921.
Usui, S., Kamiyama, Y., Ogura, T., Ishihara, A., & Hamada, T.(1997). Physiological engineering model of the outer retina.In Proc. IEEE conf. neur. netw. (pp. 2309–2314).
Wang, X.-J., Rinzel, J., & Rogawski, M. (1991). A model ofthe T-type calcium current and the low-threshold spikein thalamic neurons. Journal of Neurophysiology, 66, 839–850.
Wei, H., & Guan, X. D. (2008). The simulation of early visionin biological retina and analysis on its performance. In Proc.cong. image sign. proc. (pp. 413–417).
van Welie, I., Remme, M. W. H., van Hooft, J., & Wadman, W.J. (2006). Different levels of Ih determine distinct temporalintegration in bursting and regular-spiking neurons in ratsubiculum. Journal of Physiology, 576(1), 203–214.
Wohrer, A., Kornprobst, P., & Vieville, T. (2008). From light tospikes: A large-scale retina simulator. In Proc. int. conf. neur.net. (pp. 4562–4570).
Copyright © 2022 FDOKUMEN