Retinal Vessels Segmentation Techniques and Algorithms
31
applied sciences Review Retinal Vessels Segmentation Techniques and Algorithms: A Survey Jasem Almotiri 1, *, Khaled Elleithy 1 and Abdelrahman Elleithy 2 1 Computer Science and Engineering Department, University of Bridgeport, 126 Park Ave, Bridgeport, CT 06604, USA; [email protected] 2 Computer Science Department, William Paterson University, 300 Pompton Rd, Wayne, NJ 07470, USA; [email protected] * Correspondence: [email protected]; Tel.: +1-203-606-0918 Received: 27 December 2017; Accepted: 19 January 2018; Published: 23 January 2018 Abstract: Retinal vessels identification and localization aim to separate the different retinal vasculature structure tissues, either wide or narrow ones, from the fundus image background and other retinal anatomical structures such as optic disc, macula, and abnormal lesions. Retinal vessels identification studies are attracting more and more attention in recent years due to non-invasive fundus imaging and the crucial information contained in vasculature structure which is helpful for the detection and diagnosis of a variety of retinal pathologies included but not limited to: Diabetic Retinopathy (DR), glaucoma, hypertension, and Age-related Macular Degeneration (AMD). With the development of almost two decades, the innovative approaches applying computer-aided techniques for segmenting retinal vessels are becoming more and more crucial and coming closer to routine clinical applications. The purpose of this paper is to provide a comprehensive overview for retinal vessels segmentation techniques. Firstly, a brief introduction to retinal fundus photography and imaging modalities of retinal images is given. Then, the preprocessing operations and the state of the art methods of retinal vessels identification are introduced. Moreover, the evaluation and validation of the results of retinal vessels segmentation are discussed. Finally, an objective assessment is presented and future developments and trends are addressed for retinal vessels identification techniques. Keywords: retinal vessels segmentation; matched filters; fuzzy expert systems; fuzzy c means; machine learning; adaptive thresholding; mathematical morphology; level set; vessel tracking; multi-scaling 1. Introduction Retinal vasculature structure implicates important information helps the ophthalmologist in detecting and diagnosing a variety of retinal pathology such as Retinopathy of Prematurity (RoP), diabetic retinopathy, glaucoma, hypertension, and age-related macular degeneration or in diagnosis of diseases related to brain and heart stocks, which are associated with the abnormal variations in retinal vascular structure. Therefore, changes in retina’s arterioles and venules morphology have a principal diagnostic value. In general, vessels (vessels structure-like) segmentation occupy a remarkable place in medical image segmentation field [1–4]; retinal vessels segmentation belongs to this category where a broad variety of algorithms and methodologies have been developed and implemented for the sake of automatic identification, localization and extraction of retinal vasculature structures [5–10]. In this paper, we have presented a review that covers and categorizes early and recent literature methodologies and techniques, with the major focus on the detection and segmentation of retinal vasculature structures in two-dimensional retinal fundus images. In addition, our review covers the theoretical basis behind each segmentation category as well as the associated advantages and limitations. Appl. Sci. 2018, 8, 155; doi:10.3390/app8020155 www.mdpi.com/journal/applsci
-
Upload
khangminh22 -
Category
Documents
-
view
0 -
download
0
Transcript of Retinal Vessels Segmentation Techniques and Algorithms

applied sciences
Review
Retinal Vessels Segmentation Techniques andAlgorithms: A Survey
Jasem Almotiri 1,*, Khaled Elleithy 1 and Abdelrahman Elleithy 2
1 Computer Science and Engineering Department, University of Bridgeport, 126 Park Ave,Bridgeport, CT 06604, USA; [email protected]
2 Computer Science Department, William Paterson University, 300 Pompton Rd, Wayne, NJ 07470, USA;[email protected]
* Correspondence: [email protected]; Tel.: +1-203-606-0918
Received: 27 December 2017; Accepted: 19 January 2018; Published: 23 January 2018
Abstract: Retinal vessels identification and localization aim to separate the different retinalvasculature structure tissues, either wide or narrow ones, from the fundus image background andother retinal anatomical structures such as optic disc, macula, and abnormal lesions. Retinal vesselsidentification studies are attracting more and more attention in recent years due to non-invasivefundus imaging and the crucial information contained in vasculature structure which is helpful forthe detection and diagnosis of a variety of retinal pathologies included but not limited to: DiabeticRetinopathy (DR), glaucoma, hypertension, and Age-related Macular Degeneration (AMD). With thedevelopment of almost two decades, the innovative approaches applying computer-aided techniquesfor segmenting retinal vessels are becoming more and more crucial and coming closer to routineclinical applications. The purpose of this paper is to provide a comprehensive overview for retinalvessels segmentation techniques. Firstly, a brief introduction to retinal fundus photography andimaging modalities of retinal images is given. Then, the preprocessing operations and the state of theart methods of retinal vessels identification are introduced. Moreover, the evaluation and validation ofthe results of retinal vessels segmentation are discussed. Finally, an objective assessment is presentedand future developments and trends are addressed for retinal vessels identification techniques.
Keywords: retinal vessels segmentation; matched filters; fuzzy expert systems; fuzzy c means;machine learning; adaptive thresholding; mathematical morphology; level set; vessel tracking;multi-scaling
1. Introduction
Retinal vasculature structure implicates important information helps the ophthalmologist indetecting and diagnosing a variety of retinal pathology such as Retinopathy of Prematurity (RoP),diabetic retinopathy, glaucoma, hypertension, and age-related macular degeneration or in diagnosis ofdiseases related to brain and heart stocks, which are associated with the abnormal variations in retinalvascular structure. Therefore, changes in retina’s arterioles and venules morphology have a principaldiagnostic value.
In general, vessels (vessels structure-like) segmentation occupy a remarkable place in medicalimage segmentation field [1–4]; retinal vessels segmentation belongs to this category where a broadvariety of algorithms and methodologies have been developed and implemented for the sake ofautomatic identification, localization and extraction of retinal vasculature structures [5–10]. In thispaper, we have presented a review that covers and categorizes early and recent literature methodologiesand techniques, with the major focus on the detection and segmentation of retinal vasculature structuresin two-dimensional retinal fundus images. In addition, our review covers the theoretical basis behindeach segmentation category as well as the associated advantages and limitations.
Appl. Sci. 2018, 8, 155; doi:10.3390/app8020155 www.mdpi.com/journal/applsci

Appl. Sci. 2018, 8, 155 2 of 31
The remainder of this paper is organized as follows. Section 2 describes the different types ofretinal fundus imaging. The different challenges that faced by researcher during retinal imagessegmentation are elaborated in Section 3. Detailed description of different categories of vesselsegmentation methodologies and algorithms along with theoretical framework is given in Section 4.Finally, Section 5 summarizes the discussion and conclusions of this work.
2. Retinal Fundus Imaging
Retina photography is typically conducted via an optical apparatus called fundus camera,as shown in Figure 1. Reference [11] fundus camera can be viewed as a low power microscopethat specializes in retina fundus imaging, where the retina is illuminated and imaged via the attachedcamera. In particular, fundus camera is designed to capture an image for the interior surface of humaneye, which is composed of major parts, including macula, optic disk, retina and posterior pole [12].
Appl. Sci. 2018, 8, x 2 of 30
vasculature structures in two-dimensional retinal fundus images. In addition, our review covers the theoretical basis behind each segmentation category as well as the associated advantages and limitations.
The remainder of this paper is organized as follows. Section 2 describes the different types of retinal fundus imaging. The different challenges that faced by researcher during retinal images segmentation are elaborated in Section 3. Detailed description of different categories of vessel segmentation methodologies and algorithms along with theoretical framework is given in Section 4. Finally, Section 5 summarizes the discussion and conclusions of this work.
2. Retinal Fundus Imaging
Retina photography is typically conducted via an optical apparatus called fundus camera, as shown in Figure 1. Reference [11] fundus camera can be viewed as a low power microscope that specializes in retina fundus imaging, where the retina is illuminated and imaged via the attached camera. In particular, fundus camera is designed to capture an image for the interior surface of human eye, which is composed of major parts, including macula, optic disk, retina and posterior pole [12].
Figure 1. Retinal fundus camera. Adapted with permission from [12], IEEE, 2007.
Fundus photography can be viewed as a sort of documentation process for the retinal interior structure and retinal neurosensory tissues. The retinal neurosensory tissues convert the optical images reflection, that we see, into electrical signals in the form of pulses sent to our brain where it decoded and understood. Retina photography can be conducted based on the idea that the eye pupil is utilized as both an entrance and exit for the illuminating and imaging light rays that are used by the fundus camera. During the fundus photography, patients’ foreheads are placed against the bar and their chins placed in the chin rest, as shown in Figure 1. After the oculist aligns the fundus camera, the camera shutter is released so a flash light is fired and a two-dimensional picture for retina fundus has been taken [13], as anatomically illustrated in Figure 2.
As shown in Figure 2, the fundus of the human eye is the back portion of the interior of the eye ball. The optic nerve resides at the center of retina, which can be seen as a white area of circular to oval shape and measuring about 3 × 3mm across diameter. The major blood vessels of the retina radiate from the center of the area of optic nerve and then radiate and branched to fill the entire area excepting the fovea zone, which is a blood-vessel free reddish spot with an oval-shaped that lies directly to the left of the optic disc and resides in the center of an area that is known by ophthalmologists as the “macula” region [14]. In General, the photographic process involves grasping the light that reflected off the subject under consideration. In our case, the subject is the fundus of retina. Since the internal room of the eye has no light source of its own, in the retina photography, we need to flash or shine a light into eye room to capture a good photograph. The ocular fundus imaging has three major photography modes, as elaborated in Figure 3:
Figure 1. Retinal fundus camera. Adapted with permission from [12], IEEE, 2007.
Fundus photography can be viewed as a sort of documentation process for the retinal interiorstructure and retinal neurosensory tissues. The retinal neurosensory tissues convert the optical imagesreflection, that we see, into electrical signals in the form of pulses sent to our brain where it decodedand understood. Retina photography can be conducted based on the idea that the eye pupil is utilizedas both an entrance and exit for the illuminating and imaging light rays that are used by the funduscamera. During the fundus photography, patients’ foreheads are placed against the bar and their chinsplaced in the chin rest, as shown in Figure 1. After the oculist aligns the fundus camera, the camerashutter is released so a flash light is fired and a two-dimensional picture for retina fundus has beentaken [13], as anatomically illustrated in Figure 2.
As shown in Figure 2, the fundus of the human eye is the back portion of the interior of the eyeball. The optic nerve resides at the center of retina, which can be seen as a white area of circular to ovalshape and measuring about 3× 3 mm across diameter. The major blood vessels of the retina radiatefrom the center of the area of optic nerve and then radiate and branched to fill the entire area exceptingthe fovea zone, which is a blood-vessel free reddish spot with an oval-shaped that lies directly to theleft of the optic disc and resides in the center of an area that is known by ophthalmologists as the“macula” region [14]. In General, the photographic process involves grasping the light that reflected offthe subject under consideration. In our case, the subject is the fundus of retina. Since the internal roomof the eye has no light source of its own, in the retina photography, we need to flash or shine a lightinto eye room to capture a good photograph. The ocular fundus imaging has three major photographymodes, as elaborated in Figure 3:

Appl. Sci. 2018, 8, 155 3 of 31
1. Full-color Imaging2. Monochromatic (Filtered) Imaging3. Fluorescence Angiogram
Appl. Sci. 2018, 8, x 3 of 30
1. Full-color Imaging 2. Monochromatic (Filtered) Imaging 3. Fluorescence Angiogram
Figure 2. Retina fundus as seen through fundus camera.
(a) (b) (c)
Figure 3. Imaging modes of ocular fundus photography: (a) full color retinal fundus image; (b) monochromatic (filtered) retinal fundus image; and (c) fluorescence angiogram retinal fundus image.
In the case of full-color photography mode, no light-filtration is used and it is totally non-invasive contrary to other modes of fundus imaging. The resultant retina fundus image is a two-dimensional full color image, as illustrated in Figure 3a. On the other hand, if the fundus is imaged via a monochromatic filter or via particular colored illumination, then the fundus photography is called “monochromatic”, as shown in Figure 3b. This type of fundus photography is built based on the idea that the visibility of different structures in a retinal image is enhanced if the spectral range of illumination is changed correspondingly. In other words, instead of using white light of a broad scale of wavelengths, we use a light of a specified wavelength that corresponds to a specific color, for example, a red object in an image would appear lighter if the image is taken through a red filter and it would appear darker if it is taken through green filter. As the white light can be divided into red, green and blue lights, the ocular fundus can be photographed via one of these gradient lights where each light has the capability to enhance the visibility of specific retinal anatomical structures based on their colors. For example, blue filter (filter with blue light) enhances the visibility of the interior
Figure 2. Retina fundus as seen through fundus camera.
Appl. Sci. 2018, 8, x 3 of 30
1. Full-color Imaging 2. Monochromatic (Filtered) Imaging 3. Fluorescence Angiogram
Figure 2. Retina fundus as seen through fundus camera.
(a) (b) (c)
Figure 3. Imaging modes of ocular fundus photography: (a) full color retinal fundus image; (b) monochromatic (filtered) retinal fundus image; and (c) fluorescence angiogram retinal fundus image.
In the case of full-color photography mode, no light-filtration is used and it is totally non-invasive contrary to other modes of fundus imaging. The resultant retina fundus image is a two-dimensional full color image, as illustrated in Figure 3a. On the other hand, if the fundus is imaged via a monochromatic filter or via particular colored illumination, then the fundus photography is called “monochromatic”, as shown in Figure 3b. This type of fundus photography is built based on the idea that the visibility of different structures in a retinal image is enhanced if the spectral range of illumination is changed correspondingly. In other words, instead of using white light of a broad scale of wavelengths, we use a light of a specified wavelength that corresponds to a specific color, for example, a red object in an image would appear lighter if the image is taken through a red filter and it would appear darker if it is taken through green filter. As the white light can be divided into red, green and blue lights, the ocular fundus can be photographed via one of these gradient lights where each light has the capability to enhance the visibility of specific retinal anatomical structures based on their colors. For example, blue filter (filter with blue light) enhances the visibility of the interior
Figure 3. Imaging modes of ocular fundus photography: (a) full color retinal fundus image;(b) monochromatic (filtered) retinal fundus image; and (c) fluorescence angiogram retinal fundus image.
In the case of full-color photography mode, no light-filtration is used and it is totally non-invasivecontrary to other modes of fundus imaging. The resultant retina fundus image is a two-dimensional fullcolor image, as illustrated in Figure 3a. On the other hand, if the fundus is imaged via a monochromaticfilter or via particular colored illumination, then the fundus photography is called “monochromatic”,as shown in Figure 3b. This type of fundus photography is built based on the idea that the visibilityof different structures in a retinal image is enhanced if the spectral range of illumination is changedcorrespondingly. In other words, instead of using white light of a broad scale of wavelengths, we use alight of a specified wavelength that corresponds to a specific color, for example, a red object in an imagewould appear lighter if the image is taken through a red filter and it would appear darker if it is takenthrough green filter. As the white light can be divided into red, green and blue lights, the ocular funduscan be photographed via one of these gradient lights where each light has the capability to enhancethe visibility of specific retinal anatomical structures based on their colors. For example, blue filter

Appl. Sci. 2018, 8, 155 4 of 31
(filter with blue light) enhances the visibility of the interior layers of retina, which in full-color photo(taken by white light) appears almost transparent. On the other hand, we can get the best overall viewof retina fundus and the most enhanced contrast if we use the green filter. Moreover, green filters havethe capability to enhance the visibility of common lesions such as exudates, hemorrhage and drusen.
Another alternative to monochromatic filters is to split the full-color fundus image into its basiccomponents, namely, red, green and blue. It operates similar to colored filters, except we lose theresolution, and is adopted in a variety of retinal vessel identification approaches in the stage of imagepreprocessing framework [15].
Fundus angiography is the most invasive fundus imaging, and involves injecting a tiny amountof fluorescein dye into a vein of patient’s arm; the dye makes its way to the main blood stream leadingto retina vessels, and then the retina fundus is photographed. Originally, the word “angiography”is derived from the Greek words Angeion, which means “vessels”, and “graphien”, which means torecord or to write. Once the sodium-fluorescein has been injected, and reaches retina, the retina fundusis illuminated with a blue light, and then is flashed in a yellow-green color. Later, specialized filtersin the fundus camera allow the fluorescent light to be imaged, leading to high contrast (grey-scaled)retinal vascular structure images, as shown in Figure 3c [16]. Retina angiography is considered thephotography mode that highly revolutionized the ophthalmologists’ ability to understand both retinaphysiology and pathology. Moreover, it is used in the process of diagnosing and treating choroidaldiseases [16]. However, this mode is considered the most invasive one, due to injecting dyes in thehuman veins directly. Thus, as recently reported, it is important to consider the potential risk associatedwith using such mode of retina fundus photography, especially for neonatal people [17].
3. Retinal Image Processing
The oculists scan the retina of patients using fundus camera with high resolution. Accordingly,the situation of retina blood vessels is probed to diagnose retinal diseases. In many cases, it is foundthat the retinal vascular structure has low contrast with regard to their background. Thus, the diagnosisof retinal diseases becomes a hard task, and applying a suitable image segmentation technique becomesa must for highly accurate retinal vascular structure detection, since it leads to accurate diagnosis.Retina vessel identification and extraction faces many challenges that may be outlined as follows.Firstly, the retinal vessels’ widths take a wide range of color intensity range from less than one pixelup to more than five pixels in the retinal image, as shown in Figure 4, which requires an identificationtechnique with high flexibility.
Appl. Sci. 2018, 8, x 4 of 30
layers of retina, which in full-color photo (taken by white light) appears almost transparent. On the other hand, we can get the best overall view of retina fundus and the most enhanced contrast if we use the green filter. Moreover, green filters have the capability to enhance the visibility of common lesions such as exudates, hemorrhage and drusen.
Another alternative to monochromatic filters is to split the full-color fundus image into its basic components, namely, red, green and blue. It operates similar to colored filters, except we lose the resolution, and is adopted in a variety of retinal vessel identification approaches in the stage of image preprocessing framework [15].
Fundus angiography is the most invasive fundus imaging, and involves injecting a tiny amount of fluorescein dye into a vein of patient’s arm; the dye makes its way to the main blood stream leading to retina vessels, and then the retina fundus is photographed. Originally, the word “angiography” is derived from the Greek words Angeion, which means “vessels”, and “graphien”, which means to record or to write. Once the sodium-fluorescein has been injected, and reaches retina, the retina fundus is illuminated with a blue light, and then is flashed in a yellow-green color. Later, specialized filters in the fundus camera allow the fluorescent light to be imaged, leading to high contrast (grey-scaled) retinal vascular structure images, as shown in Figure 3c [16]. Retina angiography is considered the photography mode that highly revolutionized the ophthalmologists’ ability to understand both retina physiology and pathology. Moreover, it is used in the process of diagnosing and treating choroidal diseases [16]. However, this mode is considered the most invasive one, due to injecting dyes in the human veins directly. Thus, as recently reported, it is important to consider the potential risk associated with using such mode of retina fundus photography, especially for neonatal people [17].
3. Retinal Image Processing
The oculists scan the retina of patients using fundus camera with high resolution. Accordingly, the situation of retina blood vessels is probed to diagnose retinal diseases. In many cases, it is found that the retinal vascular structure has low contrast with regard to their background. Thus, the diagnosis of retinal diseases becomes a hard task, and applying a suitable image segmentation technique becomes a must for highly accurate retinal vascular structure detection, since it leads to accurate diagnosis. Retina vessel identification and extraction faces many challenges that may be outlined as follows. Firstly, the retinal vessels’ widths take a wide range of color intensity range from less than one pixel up to more than five pixels in the retinal image, as shown in Figure 4, which requires an identification technique with high flexibility.
Figure 4. Pixel width variation of retinal vessels (in pixels).
Figure 4. Pixel width variation of retinal vessels (in pixels).

Appl. Sci. 2018, 8, 155 5 of 31
To elaborate this challenge, a snippet of MATLAB® code has been developed for sake of greylevels substitution in retinal image; the different grey levels of a raw retinal image have been replacedby color ones, as shown in Figure 5. It can be noted that many retinal vessels, either large or tiny ones,take the same background color intensities. This reveals the broad range of colors that may be takenby the retinal vasculature structure, making the identification process more complicated rather thanthat found in other identification problems.
Appl. Sci. 2018, 8, x 5 of 30
To elaborate this challenge, a snippet of MATLAB® code has been developed for sake of grey levels substitution in retinal image; the different grey levels of a raw retinal image have been replaced by color ones, as shown in Figure 5. It can be noted that many retinal vessels, either large or tiny ones, take the same background color intensities. This reveals the broad range of colors that may be taken by the retinal vasculature structure, making the identification process more complicated rather than that found in other identification problems.
(a) (b)
Figure 5. First challenge of retinal image segmentation: (a) Vessels types distribution on retina surfaces; and (b) different sizes of retinal vessels.
This challenge opens the room for a field of research specialized in detecting and segmenting thin (filamentary) retinal vascular structures, as in [18–25]. Secondly, Vessels identification in pathological retinal images faces a tension between accurate vascular structure extraction and false responses near pathologies (such as hard and soft exudates, hemorrhages, microaneuryms and cotton wool spots) and other nonvascular structures (such as optic disc and fovea region). The retinal blood vasculature is a tree-like structure that disperses across the fundus image surface including pathologies. Thin and filamentary retinal vessels melt in the retinal abnormal regions burden the task of accurate vessel segmentation, as shown in Figure 6.
Figure 6. Effect of retinal lesions on filamentary vessel structures appearance.
In summary, retinal vascular structure, inside either normal or abnormal retina images, has low contrast with respect to the retinal background. Conversely, other retinal anatomical structures have high contrast to other background tissues but with indistinct features in comparison with abnormal structures; optic disc and exudates lesions represent typical examples. All these challenges, in terms of medical image processing, make the classical segmentation techniques such as Sobel operators [26], Prewitt operators [27], gradient operators [28], and Robert and Krish differential operations [29] inefficient
Figure 5. First challenge of retinal image segmentation: (a) Vessels types distribution on retina surfaces;and (b) different sizes of retinal vessels.
This challenge opens the room for a field of research specialized in detecting and segmenting thin(filamentary) retinal vascular structures, as in [18–25]. Secondly, Vessels identification in pathologicalretinal images faces a tension between accurate vascular structure extraction and false responses nearpathologies (such as hard and soft exudates, hemorrhages, microaneuryms and cotton wool spots) andother nonvascular structures (such as optic disc and fovea region). The retinal blood vasculature isa tree-like structure that disperses across the fundus image surface including pathologies. Thin andfilamentary retinal vessels melt in the retinal abnormal regions burden the task of accurate vesselsegmentation, as shown in Figure 6.
Appl. Sci. 2018, 8, x 5 of 30
To elaborate this challenge, a snippet of MATLAB® code has been developed for sake of grey levels substitution in retinal image; the different grey levels of a raw retinal image have been replaced by color ones, as shown in Figure 5. It can be noted that many retinal vessels, either large or tiny ones, take the same background color intensities. This reveals the broad range of colors that may be taken by the retinal vasculature structure, making the identification process more complicated rather than that found in other identification problems.
(a) (b)
Figure 5. First challenge of retinal image segmentation: (a) Vessels types distribution on retina surfaces; and (b) different sizes of retinal vessels.
This challenge opens the room for a field of research specialized in detecting and segmenting thin (filamentary) retinal vascular structures, as in [18–25]. Secondly, Vessels identification in pathological retinal images faces a tension between accurate vascular structure extraction and false responses near pathologies (such as hard and soft exudates, hemorrhages, microaneuryms and cotton wool spots) and other nonvascular structures (such as optic disc and fovea region). The retinal blood vasculature is a tree-like structure that disperses across the fundus image surface including pathologies. Thin and filamentary retinal vessels melt in the retinal abnormal regions burden the task of accurate vessel segmentation, as shown in Figure 6.
Figure 6. Effect of retinal lesions on filamentary vessel structures appearance.
In summary, retinal vascular structure, inside either normal or abnormal retina images, has low contrast with respect to the retinal background. Conversely, other retinal anatomical structures have high contrast to other background tissues but with indistinct features in comparison with abnormal structures; optic disc and exudates lesions represent typical examples. All these challenges, in terms of medical image processing, make the classical segmentation techniques such as Sobel operators [26], Prewitt operators [27], gradient operators [28], and Robert and Krish differential operations [29] inefficient
Figure 6. Effect of retinal lesions on filamentary vessel structures appearance.
In summary, retinal vascular structure, inside either normal or abnormal retina images, has lowcontrast with respect to the retinal background. Conversely, other retinal anatomical structures havehigh contrast to other background tissues but with indistinct features in comparison with abnormalstructures; optic disc and exudates lesions represent typical examples. All these challenges, in terms of

Appl. Sci. 2018, 8, 155 6 of 31
medical image processing, make the classical segmentation techniques such as Sobel operators [26],Prewitt operators [27], gradient operators [28], and Robert and Krish differential operations [29]inefficient and inaccurate. Consequently, various algorithms and methodologies have been developedand implemented for sake of automatic identification, localization and extraction of retinal anatomicalstructures and can be broadly divided into rule-based and machine learning techniques, as elaboratedin Section 4.
4. Retinal Vessels Segmentation Techniques
Generally, regarding segmentation issue, there exist as many methods and algorithms as there arespecific cases and situations. Among them, segmentation tools used for medical purposes in general,and for retinal anatomical structures segmentation in particular. All retinal vessel segmentationmethods share common stages: pre-processing stage, processing stage and post-processing stage. In thisreview, we have categorized the covered papers based on the algorithm or technique used in theprocessing stage, yielding six major categories: (1) kernel-based techniques; (2) vessel-tracking;(3) mathematical morphology-based; (4) multi-scale; (5) model-based; (6) adaptive local thresholding;and (7) machine learning. These categories are also grouped into two major classifications: Rule-basedor Machine learning, as shown in Figure 7 and categorized in Table 1.
Appl. Sci. 2018, 8, x 6 of 30
and inaccurate. Consequently, various algorithms and methodologies have been developed and implemented for sake of automatic identification, localization and extraction of retinal anatomical structures and can be broadly divided into rule-based and machine learning techniques, as elaborated in Section 4.
4. Retinal Vessels Segmentation Techniques
Generally, regarding segmentation issue, there exist as many methods and algorithms as there are specific cases and situations. Among them, segmentation tools used for medical purposes in general, and for retinal anatomical structures segmentation in particular. All retinal vessel segmentation methods share common stages: pre-processing stage, processing stage and post-processing stage. In this review, we have categorized the covered papers based on the algorithm or technique used in the processing stage, yielding six major categories: (1) kernel-based techniques; (2) vessel-tracking; (3) mathematical morphology-based; (4) multi-scale; (5) model-based; (6) adaptive local thresholding; and (7) machine learning. These categories are also grouped into two major classifications: Rule-based or Machine learning, as shown in Figure 7 and categorized in Table 1.
Figure 7. Retinal vessels segmentation techniques.
The category of rule-based techniques follows specific rules in an algorithmic framework, whereas machine learning ones utilize a pre-segmented retinal image (ground truth or gold standard) to form a labeled dataset that can be used in training process. However, any non-image processing specialist, when faced with an image analysis problem, readily apprehends that a one image transformation or a stand-alone image processing technique usually fails. Therefore, Figure 7 depicts this fact, where nested lobes stand for the Hybrid Nature of these techniques. Most image analysis problems are very complicated, especially medical ones, and can be solved in high performance by a hybrid combination of many elementary transformations and techniques. These reasons give arise to the utilization of hybrid techniques in retinal vessels segmentation problems, as proposed in [30–36].
The capability of retinal segmentation algorithm to extract the retinal vasculature structure is evaluated by many metrics. The most common ones are: average True Positive Rate (TPR), average False Positive Rate (FPR), average Sensitivity (recall, TPR), average Specificity (1-FPR), average Accuracy, and average Precision. Sensitivity and specificity represent the most widely used metrics in medical research; the higher the specificity and sensitivity values, the better diagnosis. The sensitivity reflects the capability of the algorithm to detect the vessels’ pixels, whereas the specificity determines the ability of the algorithm to detect non-vessel pixels. Sensitivity and Specificity represent the features
Figure 7. Retinal vessels segmentation techniques.
The category of rule-based techniques follows specific rules in an algorithmic framework, whereasmachine learning ones utilize a pre-segmented retinal image (ground truth or gold standard) to form alabeled dataset that can be used in training process. However, any non-image processing specialist,when faced with an image analysis problem, readily apprehends that a one image transformationor a stand-alone image processing technique usually fails. Therefore, Figure 7 depicts this fact,where nested lobes stand for the Hybrid Nature of these techniques. Most image analysis problemsare very complicated, especially medical ones, and can be solved in high performance by a hybridcombination of many elementary transformations and techniques. These reasons give arise to theutilization of hybrid techniques in retinal vessels segmentation problems, as proposed in [30–36].
The capability of retinal segmentation algorithm to extract the retinal vasculature structure isevaluated by many metrics. The most common ones are: average True Positive Rate (TPR), averageFalse Positive Rate (FPR), average Sensitivity (recall, TPR), average Specificity (1-FPR), average Accuracy,and average Precision. Sensitivity and specificity represent the most widely used metrics in medical

Appl. Sci. 2018, 8, 155 7 of 31
research; the higher the specificity and sensitivity values, the better diagnosis. The sensitivity reflectsthe capability of the algorithm to detect the vessels’ pixels, whereas the specificity determines theability of the algorithm to detect non-vessel pixels. Sensitivity and Specificity represent the features ofthe algorithm and are associated with the accuracy metric in many medical image processing fields,including retinal vessel segmentation [37], as given by the following equations [38]:
Sensitivity (Recall) = TP/(TP + FN) (1)
Speci f icity = TN/(TN + FP) (2)
Accuracy = (TP + TN)/(TP + FN + FP + TN) (3)
Precision = TP/(TP + FP) (4)
where TP is True Positives, FP is False Positives, FN is False Negatives, and TN is True Negatives.On the other hand, many papers use the area under the Receiver Operating Characteristic (ROC)
curve [39,40] to evaluate their works, especially for methods that highly depend on specific parametersduring the segmentation execution. ROC curve is a non-linear function between TPR and FPR values.Optimal area under ROC is 1 for an optimal performance.
Most of retinal vessels segmentation techniques and algorithms use the most popular datasets inthis field: (1) Digital Retinal Image for Vessel Extraction (DRIVE) [41,42]; and (2) Structuring Analysisof the Retina (STARE) [43]. Both datasets are well-considered and popular in the field of retinal vesselssegmentation to the extent that almost every research performance involving vessels segmentationis evaluated via these datasets. The popularity of these datasets is due to the good resolution of theretinal fundus images and to the availability of manually labeled ground truth images prepared bytwo experts. The DRIVE dataset, consisting of 40 retinal images, is evenly divided into a training setand a test set, whereas the STARE dataset consists of 20 images, 10 of which are normal retinal imagesand the other 10 images are abnormal ones. Nevertheless, many researchers use other less commondatasets for validation and performance evaluation, such as: Automated Retinal Image Analyzer(ARIA) dataset [44], DIAbietes RETina Data Base (DIARETDB) dataset [37], Methods for EvaluatingSegmentation and Indexing techniques Dedicated to Retinal (Messidor) dataset [45,46], and HighResolution Fundus (HRF) [47].

Appl. Sci. 2018, 8, 155 8 of 31
Table 1. Categorization of retinal vessel segmentation techniques.
Method Year Image Processing Technique Performance Metric Validation Dataset Technique Category
Chaudhuri et al. [48] 1989 Two-dimensional Gaussianmatched filter - - Kernel-based
Chanwimaluang and Fan [49] 2003 Gaussian matched filter +entropy adaptive thresholding - STARE
Al-Rawi et al. [50] 2007 Gaussian matched filter withmodified parameters ROC 1 DRIVE
Villalobos-Castaldi et al. [51] 2010 Gaussian matched filter +entropy adaptive thresholding Acc 2, Sp 3, Se 4 DRIVE
Zhang et al. [52] 2010 Two kernels: Gaussian + FDOG 5 Acc, FPR 6 DRIVE, STARE
Zhu and Schaefer [53] 2011 Piece-wise Gaussian scaled model - -
Kaur and Sinha [54] 2012 Filter Kernel: Gabor filter ROC DRIVE, STARE
Odstrcilik et al. [47] 2013 Improved t-dimensionalGaussian matched filter. Acc, Sp, Se DRIVE, STARE
Zolfagharnasab et al. [55] 2014 Filter kernel: Caushy ProbabilityDensity Function Acc, FPR DRIVE
Singh et al. [56] 2015 Modified Gaussian matched filter+ Entropy thresholding Acc, Sp, Se DRIVE
Kumar et al. [57] 2016 Filter Kernel: Laplacian ofGaussian Acc, Sp, Se DRIVE, STARE
Singh and Strivastava [58] 2016 Filter kernel: Gumbel ProbabilityDensity Function. Acc, ROC DRIVE, STARE
Chutatape et al. [59] 1998 Vessel tracking by Kalman filterand matched Gaussian - - Vessel tracking
Sofka and Stewar [60] 2006 Vessel tracking by matched filterresponses + confidence (1-Precision) DRIVE, STARE
measures + vessel boundariesmeasure. versus Recall curve
Adel et al. [61] 2009 Bayesian vessel tracking. SMF 7 Simulated
Dataset + 20
Images at
Marseille
University
Wu et al. [62] 2007 Vessel tracking by matched filters+ Hessian matrix. Se, FPR DRIVE, STARE

Appl. Sci. 2018, 8, 155 9 of 31
Table 1. Cont.
Method Year Image Processing Technique Performance Metric Validation Dataset Technique Category
Yedidya and Hartley [63] 2008 Vessel tracking by Kalman filter. TPR 8, FNR 9 DRIVE
Yin et al. [64] 2010 Statistical-based vessel tracing TPR, FPR DRIVE
Li et al. [65] 2013 Vessel tracking byBayesian theory. - -
De et al. [23] 2016 Vessel tracking usingmathematical graph theory. GFPR 10 DRIVE, STARE
Budai et al. [66] 2010 Gaussian pyramid multi-scaling. Acc, Sp, Se DRIVE, STARE Multi-scale
Moghimirad et al. [67] 2010 Multi-scale based on weightedmedialness function. ROC, Acc DRIVE, STARE
Abdallah et al. [68] 2011 Multi-scale based on Anisotropicdiffusion. ROC STARE
Rattathanapad et al. [69] 2012 Multi-scale based on lineprimitives. FPR DRIVE
Kundu and Chatterjee [70] 2012 Morphological AngularScale-space MSE 11 DRIVE Morphological
Based
Frucci et al. [71] 2014 Watershed transform + Contrastand directional Maps. Acc, Precision DRIVE
Jiang et al. [72] 2017 Global thresholding based onmorphological operations. Acc, Execution time DRIVE, STARE
Dizdaro et al. [73] 2012 Level set in terms of initializationand edge detection. Acc, Sp, Se DRIVE Deformable Model
Proposed Dataset
Jin et al. [74]. 2015 Snakes contours Acc, Sp, Se DRIVE
Zhao et al. [31]. 2015 Infinite perimeter active contourwith hybrid region terms. Acc, Sp, Se DRIVE, STARE
Gong et al. [75] 2015 Level set without using localregion area. Acc, Sp, Se DRIVE
Jiang and Mojon [76] 2003 Knowledge-guided localadaptive thresholding TPR, FPR STARE Adaptive Local
Filter response Thresholding
analysis
Akram et al. [77] 2009 Statistical-basedadaptive thresholding. Acc, ROC DRIVE

Appl. Sci. 2018, 8, 155 10 of 31
Table 1. Cont.
Method Year Image Processing Technique Performance Metric Validation Dataset Technique Category
Christodoulidis et al. [78] 2016 Local adaptive thresholdingbased on multi-scale tensor Acc, Sp, Se Erlangen Dataset
voting
Nekovei and Ying [79] 1995 Back propagation ANN 12 Se - Machine Learning
Salem et al. [80] 2006 K-nearest neighbors (KNN) Se, Sp STARE
Xie and Nie [81] 2013 Genetic Algorithm + Fuzzyc-means - DRIVE
Akhavan and Faez [82] 2014 Vessel Tracking + Fuzzy c-means Acc DRIVE, STARE
Emary et al. [83] 2014 Possibilistic version of fuzzyc-means Acc, Sp, Se DRIVE, STARE
Optimized with Cuckoo searchalgorithm
Maji et al. [84] 2015 Hybrid framework of deepANNS and
Gu and Cheng [22] 2015 Iterative Latent classification tree Acc DRIVE, STARE
Sharma and Wasson [85] 2015 Fuzzy Logic Acc DRIVE
Ensemble Learning. Acc DRIVE
Roy et al. [86] 2016 Denoised stackedauto-encoder ANN ROC DRIVE, STARE
Lahiri et al. [87] 2016 Ensemble of two parallel levels of Acc DRIVE
Stacked denoisedauto-encoder ANNS
Maji et al. [88] 2016 Ensemble of 12convolutional ANNs Acc DRIVE
Maninis et al. [24] 2016 Deep Convolutional ANNs. Area under DRIVE, STARE
Recall-Precision
Curve
Liskowski et al. [89] 2016 Deep ANNs ROC, Acc DRIVE, STARE
CHASE [90]
Dasgupta and Singh [91] 2016 Convolutional ANNs ROC, Se, Acc, Sp DRIVE1 ROC: Receiver Operating Characteristics; 2 Acc: Accuracy; 3 Sp: Specificity; 4 Se: Sensitivity; 5 FDOG: First-order Derivative of Gaussian; 6 FPR: False Positive Rate; 7 SMF: SegmentationMatching Factor; 8 TPR: True Negative Rate; 9 FNR: False Negative Rate; 10 GFPR: Geometric False Positive Rate; 11 MSE: Means Square Error; 12 ANN: Artificial Neural Network.

Appl. Sci. 2018, 8, 155 11 of 31
4.1. Kernel-Based Techniques
This type of retinal vessels segmentation depends on the intensities distribution of vessel pixels tobuild a filter kernel, which, in turn, can detect the retinal vasculature structure boundaries. The kernelcan either follow a pre-specified form based on the cross-section profile of retinal vessel, or it can bedeformable according to vessels boundaries especially when they lie in or in neighbor of hemorrhagesand microaneuryms lesions. Most often, kernel-based approaches are used as preprocessing imageenhancement step for other retinal vessels segmentation methodologies, since it enhances the mapfor vessels boundaries. The profile-based kernels use one of various models that have been proposedand implemented in retinal vessels profiling that are built based on the idea that intensity distributionof retinal vessel can describe retinal vessels characteristics which can be turned into maps for vesselsdetection. The basic idea of kernel-based techniques (also called matched filtering-based) techniques is tocompare the pixels’ intensity variations along with the cross-section profile of the retinal vessel with aprefigured template works as a kernel. Therefore, most typical matched filter-based techniques detectretinal vessels by applying a matched filter kernel on the original grey retinal image followed by athresholding step.
Retinal vessel profiling has many applications in the fields of vascular width measurement [92]or in the field of vessels type classification [93]. In the case of vessels detection and extraction, it isused to create the map for process of detection, which paves the way for vessels extraction throughregion growing or filtering based approaches. Generally speaking, retinal vascular matched kernelscan fall in one of two major categories: Gaussian shaped or non-Gaussian shaped [94].
Early work in this direction was performed by Chaudhuri et al. [48], who observed the highsimilarity of the intensity variations of the cross-section profile of the retinal image with a Gaussianfunction, as illustrated in Figure 8.
Appl. Sci. 2018, 8, x 11 of 30
4.1. Kernel-Based Techniques
This type of retinal vessels segmentation depends on the intensities distribution of vessel pixels to build a filter kernel, which, in turn, can detect the retinal vasculature structure boundaries. The kernel can either follow a pre-specified form based on the cross-section profile of retinal vessel, or it can be deformable according to vessels boundaries especially when they lie in or in neighbor of hemorrhages and microaneuryms lesions. Most often, kernel-based approaches are used as preprocessing image enhancement step for other retinal vessels segmentation methodologies, since it enhances the map for vessels boundaries. The profile-based kernels use one of various models that have been proposed and implemented in retinal vessels profiling that are built based on the idea that intensity distribution of retinal vessel can describe retinal vessels characteristics which can be turned into maps for vessels detection. The basic idea of kernel-based techniques (also called matched filtering-based) techniques is to compare the pixels’ intensity variations along with the cross-section profile of the retinal vessel with a prefigured template works as a kernel. Therefore, most typical matched filter-based techniques detect retinal vessels by applying a matched filter kernel on the original grey retinal image followed by a thresholding step.
Retinal vessel profiling has many applications in the fields of vascular width measurement [92] or in the field of vessels type classification [93]. In the case of vessels detection and extraction, it is used to create the map for process of detection, which paves the way for vessels extraction through region growing or filtering based approaches. Generally speaking, retinal vascular matched kernels can fall in one of two major categories: Gaussian shaped or non-Gaussian shaped [94].
Early work in this direction was performed by Chaudhuri et al. [48], who observed the high similarity of the intensity variations of the cross-section profile of the retinal image with a Gaussian function, as illustrated in Figure 8.
Figure 8. Cross-section intensity profile of the region marked by a straight line between point A and point B on retina image.
Since Chaudhuri et al. [48] published his well-known paper that stated the cross section profile of retinal vascular structure has approximate Gaussian shape, matched filters with Gaussian kernels have emerged, and were later reported in the literature for retinal vessel tree detection. According to the fact that the cross section of retinal vessels can be modeled as a Gaussian function, a series of Gaussian shaped filters (different in Gaussian parameters values µ and σ) can be used to match different vessel sizes simply and efficiently. However, matched filters have strong response to both vessels and non-vessels structures, such as red lesions and bright blobs, which results in degradation in the performance in terms of false detection rate. Three important aspects should be taken into
Figure 8. Cross-section intensity profile of the region marked by a straight line between point A andpoint B on retina image.
Since Chaudhuri et al. [48] published his well-known paper that stated the cross section profileof retinal vascular structure has approximate Gaussian shape, matched filters with Gaussian kernelshave emerged, and were later reported in the literature for retinal vessel tree detection. According tothe fact that the cross section of retinal vessels can be modeled as a Gaussian function, a series ofGaussian shaped filters (different in Gaussian parameters values µ and σ) can be used to matchdifferent vessel sizes simply and efficiently. However, matched filters have strong response to both

Appl. Sci. 2018, 8, 155 12 of 31
vessels and non-vessels structures, such as red lesions and bright blobs, which results in degradationin the performance in terms of false detection rate. Three important aspects should be taken intoconsideration through designing a matched filter kernel: (1) limited curvature of retina vascularstructure, where the curvature of vessel segments can be approximated by bell-shape piecewise linearsegments; (2) vessels’ width, as the width of the retinal vessels decreases in a gradual way when onemoves from optical disk towards Fovea region, as shown in Figure 2; and (3) accurate cross-sectionprofile of pixel intensities distribution of the retinal blood vessels [58].
The same idea of Chaudhuri et al. [48] was followed and re-implemented by [56] via DRIVEdataset. The regenerated segmentation results have reported an average accuracy of 0.9387, and 0.9647and 0.6721 for average specificity and average sensitivity, respectively. Zhu and Schaefer [53] proposeda profile kernel-based algorithm for retinal vessel extraction based on profiling the cross-sectionof retinal vessels using piece-wise Gaussian scaled model. Once the profile has been modeled,a phase alignment function based on data obtained from oriented log-Gabor wavelet was applied.After boundary area map of retinal vascular structure has been produced, cross-sections were extractedby following an approach was proposed by same author in [95].
A notable vessel extraction performance has been achieved by Villalobos-Castaldi et al. [51],where matched filter in a conjugation with entropy-based adaptive thresholding algorithm wasemployed. The methodology was applied on DRIVE dataset where it used matched filter in sakeof piecewise linear segments enhancement of the retina vascular structure. Later, a co-occurrencematrix [96] that records the number of transitions between all pairs of grey-retinal levels was capturedwhere the grey-level changes were depicted. Then, the entropy of the image grey levels distribution wasexploited through second-entropy thresholding to segment the background pixels from the foreground(vessels) ones. The time consumed in the process of obtaining vascular structures approximated 3 s,and high detection accuracy was achieved, up to 0.9759, as well as sensitivity and specificity of 0.9648and 0.9480, respectively.
Compared to the performance achieved in [51], Chanwimaluang and Fan [49] followed sameprocedure that was proposed in [51] to extract both the retinal vessel and the optic disk usingSTARE dataset. However, the time consumed approximated 2.5 min per retina image; most ofit was consumed in matched filtering and local entropy thresholding steps. Moreover, it requiredpost-processing steps that were not required by [51] including long filtering stages for isolated pixelremoval. Then, filtering steps were followed by morphological thinning used to identify the retinalvascular intersection/crossovers. on the other hand, the optic disk identification proceeded into twomajor stages: (1) optic disk center identification through maximum local variance detection; and (2) opticdisk boundary identification through snake active contour. Even though the same methodology stepshave been followed by both [49,51], they are extremely different in terms of achieved performance.
Singh et al. [56] have noted the important effect of Gaussian kernel parameters on the subsequentimage processing stages. Singh et al. [56] followed same procedure that was proposed in [49,51]as well. However, the parameters of Gaussian function have been modified in a way that enhances theoverall performance, which reached up to 0.9459 for accuracy, and 0.9721 and 0.6735 for specificity andsensitivity, respectively, using DRIVE dataset in comparison with average ROC area of 0.9352 reportedby Al-Rawi et al. [50] applied on DRIVE dataset, where they used a different set of modifications forGaussian-kernel parameters.
On the same procedure that have been reported in [49,51,56], Kaur and Sinha [54] employedGabor filter instead of Gaussian one in the early stages of vessel extraction. The enhanced vesselswere obtained via banks of 12 different oriented Gabor filters in range of 0 to 170 degree. Gabor-filterbased approach outperforms the Gaussian one in terms of both area under ROC curve and in termsof specificity. The overall achieved sensitivity is less than that achieved by [51,56]. The performanceof [51,56] was evaluated via DRIVE dataset, whereas the performance of [56] was evaluated on bothDRIVE and the challengeable (pathologies bearing) STARE dataset, where it showed a high specificity of96% in the presence of lesions in abnormal retinal images.

Appl. Sci. 2018, 8, 155 13 of 31
Based on the fact that retinal vessels have symmetric Gaussian cross-section profile, while thecross-section profile for the non-vessels is asymmetric, two matched filters, one constructed withsymmetric Gaussian (zero-mean) kernel and the other with first-Order Derivative Of Gaussian (FDOG)kernel, were applied to retina images by Zhang et al. [52]. The response of matched filter thathas Gaussian kernel was used to detect vessels, while the local mean of the response of first-orderderivative of Gaussian kernel was used to establish and adjust a “dynamic threshold”, which, in turn,was used in the thresholding phase that followed the matched filter phase. The proposed techniqueexploits the difference between FDOG kernel responses for both vessels and non-vessels regions(such as bright blobs, lesions, and optic disk) to vary thresholding level according to local mean signal.The experimental results, obtained via both DRIVE and STARE datasets, demonstrated that applyinghybrid matched filtering kernels can reduce the false detection dramatically to less than 0.05 comparedto that inherently generated with Gaussian kernel, even for thin vessels, with average accuracy of0.9510 for normal cases retina images and 0.9439 for pathological ones.
According to techniques reported and discussed above, most conventional matched filters-basedapproaches enhance the performance of matched filter-based methodology by enhancing theperformance of the thresholding techniques rather than improving the matched filter kernel itself.Zolfagharnasab et al. [55], on the other hand, replaced the Gaussian kernel of matched filter by CaushyProbability Density Function (CPDF), and reported an overall accuracy of 0.9170 with 3.5% falsepositive rate via DRIVE dataset.
The inherent zero-crossing property of Laplacian of Gaussian (LoG) filter was exploited in analgorithm proposed by Kumar et al. [57] where two-dimensional matched filters with LoG kernelfunctions are applied to fundus retinal images to detect retinal vasculature structure which are firstlyenhanced by Contrast Limited Adaptive Histogram Equalization (CLAHE) method. The proposedalgorithm achieved average accuracy of 0.9626, and sensitivity and specificity of 0.7006 and 0.9871 viaDRIVE dataset, respectively, and average accuracy of 0.9637, and 0.7675 and 0.9799 for sensitivity andspecificity, respectively, via STARE dataset in comparison with average accuracy of 0.9340 and 0.7060and 0.9693 for sensitivity and specificity respectively on DRIVE dataset achieved by Odstrcilik et al. [47]using improved two dimensional matched filter with two-dimensional Gaussian kernel. The methodwas applied on STARE dataset as well, where it has achieved an overall accuracy of 0.9341, and 0.7847and 0.9512 for sensitivity and specificity, respectively.
Appl. Sci. 2018, 8, x 13 of 30
has Gaussian kernel was used to detect vessels, while the local mean of the response of first-order derivative of Gaussian kernel was used to establish and adjust a “dynamic threshold”, which, in turn, was used in the thresholding phase that followed the matched filter phase. The proposed technique exploits the difference between FDOG kernel responses for both vessels and non-vessels regions (such as bright blobs, lesions, and optic disk) to vary thresholding level according to local mean signal. The experimental results, obtained via both DRIVE and STARE datasets, demonstrated that applying hybrid matched filtering kernels can reduce the false detection dramatically to less than 0.05 compared to that inherently generated with Gaussian kernel, even for thin vessels, with average accuracy of 0.9510 for normal cases retina images and 0.9439 for pathological ones.
According to techniques reported and discussed above, most conventional matched filters-based approaches enhance the performance of matched filter-based methodology by enhancing the performance of the thresholding techniques rather than improving the matched filter kernel itself. Zolfagharnasab et al. [55], on the other hand, replaced the Gaussian kernel of matched filter by Caushy Probability Density Function (CPDF), and reported an overall accuracy of 0.9170 with 3.5% false positive rate via DRIVE dataset.
The inherent zero-crossing property of Laplacian of Gaussian (LoG) filter was exploited in an algorithm proposed by Kumar et al. [57] where two-dimensional matched filters with LoG kernel functions are applied to fundus retinal images to detect retinal vasculature structure which are firstly enhanced by Contrast Limited Adaptive Histogram Equalization (CLAHE) method. The proposed algorithm achieved average accuracy of 0.9626, and sensitivity and specificity of 0.7006 and 0.9871 via DRIVE dataset, respectively, and average accuracy of 0.9637, and 0.7675 and 0.9799 for sensitivity and specificity, respectively, via STARE dataset in comparison with average accuracy of 0.9340 and 0.7060 and 0.9693 for sensitivity and specificity respectively on DRIVE dataset achieved by Odstrcilik et al. [47] using improved two dimensional matched filter with two-dimensional Gaussian kernel. The method was applied on STARE dataset as well, where it has achieved an overall accuracy of 0.9341, and 0.7847 and 0.9512 for sensitivity and specificity, respectively.
Figure 9. Summarized graphical comparison between some of kernel-based methods performance (Accuracy, Sensitivity and Specificity) based on DRIVE dataset.
As a novel matched filter kernel improvement, Singh and Strivastava [58] suggested the Gumbel PDF as a kernel function, where they noted the slight skewness of vessel-cross section profile, which most approximates Gumble PDF with respect to Gaussian and Caushy PDF functions proposed in [48,50]. In the thresholding phase, entropy-based optimal thresholding was used in a companion of
Figure 9. Summarized graphical comparison between some of kernel-based methods performance(Accuracy, Sensitivity and Specificity) based on DRIVE dataset.

Appl. Sci. 2018, 8, 155 14 of 31
As a novel matched filter kernel improvement, Singh and Strivastava [58] suggested the GumbelPDF as a kernel function, where they noted the slight skewness of vessel-cross section profile,which most approximates Gumble PDF with respect to Gaussian and Caushy PDF functions proposedin [48,50]. In the thresholding phase, entropy-based optimal thresholding was used in a companion oflength filtering as post-processing step to remove isolated pixels. The proposed technique showedan improved performance in terms of average detection accuracy of 0.9522 for DRIVE dataset and0.9270 for STARE dataset, and the value of area under ROC curve was 0.9287 and 0.9140 for DRIVEand STARE datasets, respectively.
Since the performance metrics used in reported papers are not common, Figures 9 and 10 illustrategraphical comparisons between some of the reviewed kernel-based methodologies for DRIVE andSTARE datasets based on accuracy, sensitivity and specificity metrics.
Appl. Sci. 2018, 8, x 14 of 30
length filtering as post-processing step to remove isolated pixels. The proposed technique showed an improved performance in terms of average detection accuracy of 0.9522 for DRIVE dataset and 0.9270 for STARE dataset, and the value of area under ROC curve was 0.9287 and 0.9140 for DRIVE and STARE datasets, respectively.
Since the performance metrics used in reported papers are not common, Figures 9 and 10 illustrate graphical comparisons between some of the reviewed kernel-based methodologies for DRIVE and STARE datasets based on accuracy, sensitivity and specificity metrics.
Figure 10. Summarized graphical comparison between some of kernel-based methods performance (Accuracy, Sensitivity and Specificity) based on STARE dataset.
4.2. Vessel Tracking/Tracing Techniques
The heart of vessel tracking algorithms is to trace the ridges of retina fundus image based on a set of starting points. Graphical representation of ridges of retina image can be noticed in Figure 11. Any tracking algorithm involves seeds selection as a preliminary step, where seeds can be defined either manually or automatically. The ridges of vessels are detected by inspecting zero-crossing of the gradient and curvature. However, “clean-limbed” ridges detection need a pre-processing phase involves complicated steps of vessel enhancement for all vessels sizes and orientations. Consequently, one of the major drawbacks of vessel tracking is the extreme dependency on the pre-processing steps that proceed the phase of tracing.
Figure 11. Graphical representation of ridges along retinal vasculature tree.
Figure 10. Summarized graphical comparison between some of kernel-based methods performance(Accuracy, Sensitivity and Specificity) based on STARE dataset.
4.2. Vessel Tracking/Tracing Techniques
The heart of vessel tracking algorithms is to trace the ridges of retina fundus image based on aset of starting points. Graphical representation of ridges of retina image can be noticed in Figure 11.Any tracking algorithm involves seeds selection as a preliminary step, where seeds can be definedeither manually or automatically. The ridges of vessels are detected by inspecting zero-crossing ofthe gradient and curvature. However, “clean-limbed” ridges detection need a pre-processing phaseinvolves complicated steps of vessel enhancement for all vessels sizes and orientations. Consequently,one of the major drawbacks of vessel tracking is the extreme dependency on the pre-processing stepsthat proceed the phase of tracing.
In tracing techniques, it is not an essence for seed points (starting points of tracking process) to belocated at the center of retinal vessels, Chutatape et al. [59], for instance, have extracted seed pointsfrom the circumference of the optic disc, then the centers of vessels were traced using an extendedKalman filter. A semi-ellipse was defined around the optic disk as a searching region for starting pointsof vascular structure, which was later used by [65]. As the candidate pixels locations for next vesseledge points were selected on the semi-ellipse, vessel tracking took place based on Bayesian theory.
Wu et al. [62] proposed a vessel tracking methodology for retinal vasculature structure extractionthat combines Hessian and matched filters and an idea of exploiting the edge information at the vesselsparallel boundaries, which as first proposed by Sofka and Stewar [60] for retinal vessels extraction.Once the contrast between vessels and other retina tissues are enhanced and the information of sizesand the orientations of enhanced vessels are available, the ridges are used to trace vessels via theircenter lines along ridge seeds that were selected automatically. The tracking performance was tested

Appl. Sci. 2018, 8, 155 15 of 31
via DRIVE dataset, where 84.4% of retinal vasculature skeleton was successfully detected with 19.3%false positive rate, and the majority of false tracked vessels were the small ones that the researchersconsidered a subject of further ongoing research.
Appl. Sci. 2018, 8, x 14 of 30
length filtering as post-processing step to remove isolated pixels. The proposed technique showed an improved performance in terms of average detection accuracy of 0.9522 for DRIVE dataset and 0.9270 for STARE dataset, and the value of area under ROC curve was 0.9287 and 0.9140 for DRIVE and STARE datasets, respectively.
Since the performance metrics used in reported papers are not common, Figures 9 and 10 illustrate graphical comparisons between some of the reviewed kernel-based methodologies for DRIVE and STARE datasets based on accuracy, sensitivity and specificity metrics.
Figure 10. Summarized graphical comparison between some of kernel-based methods performance (Accuracy, Sensitivity and Specificity) based on STARE dataset.
4.2. Vessel Tracking/Tracing Techniques
The heart of vessel tracking algorithms is to trace the ridges of retina fundus image based on a set of starting points. Graphical representation of ridges of retina image can be noticed in Figure 11. Any tracking algorithm involves seeds selection as a preliminary step, where seeds can be defined either manually or automatically. The ridges of vessels are detected by inspecting zero-crossing of the gradient and curvature. However, “clean-limbed” ridges detection need a pre-processing phase involves complicated steps of vessel enhancement for all vessels sizes and orientations. Consequently, one of the major drawbacks of vessel tracking is the extreme dependency on the pre-processing steps that proceed the phase of tracing.
Figure 11. Graphical representation of ridges along retinal vasculature tree.
Figure 11. Graphical representation of ridges along retinal vasculature tree.
In contrast to [62], Yedidya and Hartley [63] proposed a tracking methodology trace the retinalvessels centers through Kalman filter, where it has the capability to detect both wide and thin vessels,even in noisy retinal images, by defining a linear model. The proposed model proceeds into fourstages. Firstly, a set of seed points all over the image were found by convolving the whole retina imagewith a set of matched filters at different scales and orientations in aim of finding at least one seed pointat each vessel, which, in turn, remove the need to follow all branches. Secondly, Kalman filter wasused to trace blood vessels’ centers starting from seed points found in the first stage. Thirdly, tracingprocess ceases once the probability of vessel tracing is small for a number of back-to-back moves oronce tracing hit previously segmented vessel. Fourthly, the segmentation results are traced in thecase of tracking failure in less than minimum number of steps. The proposed tracking methodologymanaged to detect retinal vessels with true positive rate reaching up to 85.9% and false negative of8.1% via DRIVE dataset.
Making use of mathematical graph theory, De et al. [23] designed a novel technique to extractthe filamentary retinal structure. Their technique was built based on connecting the tracing problemand the digraph matrix-forest theorem in algebraic graph theory with a primary goal to address thevessel cross-over issue. The proposed technique is composed of two main stages. (1) Segmentationstep: The main skeleton of the retinal vasculature structure is extracted; (2) Tracing step: The first stepis used to construct the digraph representation, which enables tracing task to cast as digraph-basedlabel propagation using Matrix-forest theorem. The proposed technique was used for both retinaland neural tracing where the empirical evaluation of the proposed technique showed high achievableperformance in both cases.
Yin et al. [64] presented a statistical based tracking method as an improved version of a worksuggested by [61]. This method detects edge points iteratively based on a Bayesian approach usinglocal grey levels statistics and continuity properties of blood vessels. Then, it combines the greylevel profile and vessel geometric properties for sake of both accuracy improvement and trackingrobustness. Experiments on both synthetic and real retinal images (DRIVE dataset) showed promisingresults, where the true positive rate was 0.73 and the false positive rate was 0.039. However, due torelatively low attained detection rate (TPR), a deeper evaluation on retinal images is needed to makethe proposed method widely usable for vessel detection technique.

Appl. Sci. 2018, 8, 155 16 of 31
4.3. Mathematical Morphology-Based Techniques
Originally, mathematical morphology belongs to set theory of mathematics science, where it isconsidered an application of lattice theory to spatial structures. Mathematical morphology concerns theshapes that exists inside the image frame instead of pixels’ intensities. That means it ignores the detailsthat regard image content where the pixel intensities are viewed as topographical highs, as shown inFigure 12. Typically, mathematical morphology was used in binary images, and then it extended togrey and colored ones, as a general processing framework, through morphological operators. In termsof mathematical morphology, the image I is represented as a set I ⊆ <2, where foreground pixels arethe members that belong to I, whereas the background ones belong to the complement Ic. The image Iundergoes a transformation by another set known as structuring element. Typically, the morphologicaloperations can be applied to binary images and then can be extended to grey images. Morphologicaloperations can be divided into: erosion, dilation, opening and closing operations. Erosion operation isused to lessen the objects in the image, whereas the dilation one is used to boost them. Morphologicalopenings are used to remove unwanted structures in the image by applying an erosion followed bya dilation, whereas, in the case of morphological closing, some of structures in image are filled ormerged by applying dilation operation followed by erosion one.
Appl. Sci. 2018, 8, x 16 of 30
operators. In terms of mathematical morphology, the image is represented as a set ⊆ ℜ , where foreground pixels are the members that belong to , whereas the background ones belong to the complement . The image undergoes a transformation by another set known as structuring element. Typically, the morphological operations can be applied to binary images and then can be extended to grey images. Morphological operations can be divided into: erosion, dilation, opening and closing operations. Erosion operation is used to lessen the objects in the image, whereas the dilation one is used to boost them. Morphological openings are used to remove unwanted structures in the image by applying an erosion followed by a dilation, whereas, in the case of morphological closing, some of structures in image are filled or merged by applying dilation operation followed by erosion one.
Figure 12. Topographic highs of retinal vessels.
In aim of retinal vessel segmentation, a Morphological Angular Scale-Space (MASS) technique was proposed by [70]. The basic idea of the proposed technique was to rotate a varying length (multiscale) linear structuring element at different angles to determine the connected components and assure the connectivity across vessels where the scale-space is created through the variation in the length of linear structuring elements. Gradual evolution to higher scales lessens the non-vessel like elements out of the processed retinal image, where the extracted information from lower scales is used to build the retinal image of higher scales. At a certain scale (determined by authors experimentally), and using a vessel-ness measure proposed by [97], the method reported a lowest mean square error value of 0.0363, which was averaged over 50 retinal images taken from DRIVE dataset.
In addition to morphological operations, morphological tools are used in retinal vessel segmentation tasks including: gradient, watershed transform, top-hat transform, distance function and geodesic distance. Watershed transform was developed in the framework of mathematical morphology by Digabel and Lantu´ejoul [98]. The principal idea underlying this method was inspired from geography when a landscape is flooded by water, then watersheds appear as dividing lines of the domains of rain falling over the entire region [99]. A watershed-based segmentation algorithm was used by Frucci et al. [71] to segment retinal vasculature structure. The proposed algorithm combines watershed transform and both contrast and directional information extracted from retinal image. First, watershed transform was used to segment the image into multi-regions. Then, a unique grey-level value was assigned to each single region. A contrast value was computed for each region through calculating the difference in grey-level with respect to its adjacent regions. A 9 × 9 window
Figure 12. Topographic highs of retinal vessels.
In aim of retinal vessel segmentation, a Morphological Angular Scale-Space (MASS) technique wasproposed by [70]. The basic idea of the proposed technique was to rotate a varying length (multiscale)linear structuring element at different angles to determine the connected components and assure theconnectivity across vessels where the scale-space is created through the variation in the length of linearstructuring elements. Gradual evolution to higher scales lessens the non-vessel like elements out ofthe processed retinal image, where the extracted information from lower scales is used to build theretinal image of higher scales. At a certain scale (determined by authors experimentally), and using avessel-ness measure proposed by [97], the method reported a lowest mean square error value of 0.0363,which was averaged over 50 retinal images taken from DRIVE dataset.
In addition to morphological operations, morphological tools are used in retinal vesselsegmentation tasks including: gradient, watershed transform, top-hat transform, distance functionand geodesic distance. Watershed transform was developed in the framework of mathematical
Appl. Sci. 2018, 8, 155 17 of 31
morphology by Digabel and Lantu´ejoul [98]. The principal idea underlying this method was inspiredfrom geography when a landscape is flooded by water, then watersheds appear as dividing lines ofthe domains of rain falling over the entire region [99]. A watershed-based segmentation algorithm wasused by Frucci et al. [71] to segment retinal vasculature structure. The proposed algorithm combineswatershed transform and both contrast and directional information extracted from retinal image. First,watershed transform was used to segment the image into multi-regions. Then, a unique grey-levelvalue was assigned to each single region. A contrast value was computed for each region throughcalculating the difference in grey-level with respect to its adjacent regions. A 9× 9 window wasapplied to each pixel to attain the directional map composed of 16 directions. The standard deviationof pixels’ grey levels is aligned along these directions. Then, based on the occurrences of directionswithin watershed region, pixels locating in same region are assigned same direction. Once the contrastand directional maps had been obtained for each watershed region, a precursory segmentation ofretinal vascular structure was acquired where the regions with highest contrast (positive difference)were most likely considered as non-vessel regions. Otherwise, they were considered as vessel ones.The proposed algorithm, developed using DRIVE dataset, and achieved a detection precision of 77%and accuracy of 95%.
Jiang et al. [72] presented a novel work to extract the retinal vasculature structure, by using globalthresholding based on morphological operations. The proposed system was tested via DRIVE andSTARE datasets, and achieved an average accuracy of 95.88% for single dataset test and 95.27% forthe cross-dataset test. In terms of time and computational complexity, the system has been designedto minimize the computing complexity, and processes multiple independent procedures in parallel,thus having an execution time of 1.677 s per each retinal image on CPU platform.
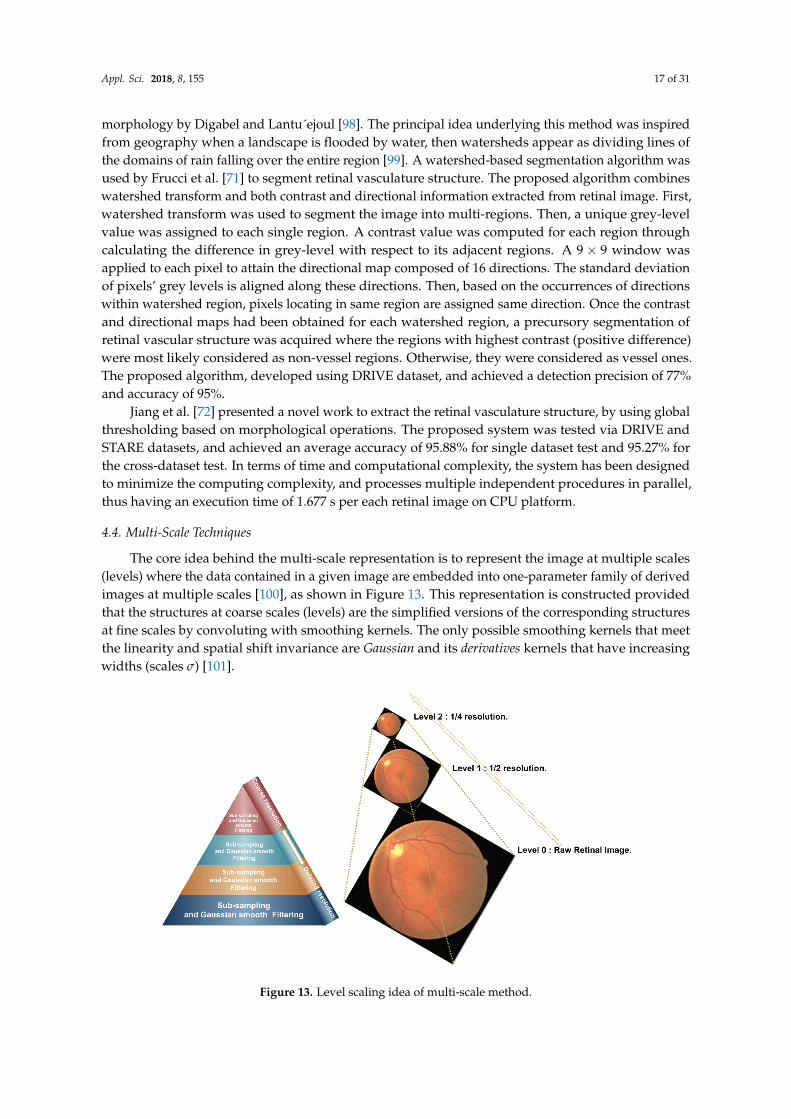
4.4. Multi-Scale Techniques
The core idea behind the multi-scale representation is to represent the image at multiple scales(levels) where the data contained in a given image are embedded into one-parameter family of derivedimages at multiple scales [100], as shown in Figure 13. This representation is constructed providedthat the structures at coarse scales (levels) are the simplified versions of the corresponding structuresat fine scales by convoluting with smoothing kernels. The only possible smoothing kernels that meetthe linearity and spatial shift invariance are Gaussian and its derivatives kernels that have increasingwidths (scales σ) [101].
Appl. Sci. 2018, 8, x 17 of 30
was applied to each pixel to attain the directional map composed of 16 directions. The standard deviation of pixels’ grey levels is aligned along these directions. Then, based on the occurrences of directions within watershed region, pixels locating in same region are assigned same direction. Once the contrast and directional maps had been obtained for each watershed region, a precursory segmentation of retinal vascular structure was acquired where the regions with highest contrast (positive difference) were most likely considered as non-vessel regions. Otherwise, they were considered as vessel ones. The proposed algorithm, developed using DRIVE dataset, and achieved a detection precision of 77% and accuracy of 95%.
Jiang et al. [72] presented a novel work to extract the retinal vasculature structure, by using global thresholding based on morphological operations. The proposed system was tested via DRIVE and STARE datasets, and achieved an average accuracy of 95.88% for single dataset test and 95.27% for the cross-dataset test. In terms of time and computational complexity, the system has been designed to minimize the computing complexity, and processes multiple independent procedures in parallel, thus having an execution time of 1.677 seconds per each retinal image on CPU platform.
4.4. Multi-Scale Techniques
The core idea behind the multi-scale representation is to represent the image at multiple scales (levels) where the data contained in a given image are embedded into one-parameter family of derived images at multiple scales [100], as shown in Figure 13. This representation is constructed provided that the structures at coarse scales (levels) are the simplified versions of the corresponding structures at fine scales by convoluting with smoothing kernels. The only possible smoothing kernels that meet the linearity and spatial shift invariance are Gaussian and its derivatives kernels that have increasing widths (scales ) [101].
Figure 13. Level scaling idea of multi-scale method.
Originally, the scale-space is the framework of the multi-scale image representation [102]; two widely-used types of multi-scale representation are: pyramid [103,104], and Quad-tree [105]. Most retinal vessels segmentation methodologies are built based on the pyramid multi-scale type, where the grey-level data are represented in such a way that combines sampling operations with successive smoothing steps conducted by Gaussian kernels with different scales gives rise to a response that is represented by 2D Hessian matrix [106]. The eigen values of Hessian matrix determine the vessel-likeness which, in turn, result in retinal vasculature structure enhancement. Hessian matrix processing through eigen values analysis aims to obtain the principal directions of vessels where the decomposition of local second order structures in retinal image can be performed in order to attain the direction of the
Figure 13. Level scaling idea of multi-scale method.

Appl. Sci. 2018, 8, 155 18 of 31
Originally, the scale-space is the framework of the multi-scale image representation [102];two widely-used types of multi-scale representation are: pyramid [103,104], and Quad-tree [105].Most retinal vessels segmentation methodologies are built based on the pyramid multi-scale type,where the grey-level data are represented in such a way that combines sampling operations withsuccessive smoothing steps conducted by Gaussian kernels with different scales gives rise to a responsethat is represented by 2D Hessian matrix [106]. The eigen values of Hessian matrix determine thevessel-likeness which, in turn, result in retinal vasculature structure enhancement. Hessian matrixprocessing through eigen values analysis aims to obtain the principal directions of vessels where thedecomposition of local second order structures in retinal image can be performed in order to attainthe direction of the smallest curvature along the retinal vessels [107]. The retinal image size decreasesexponentially with scale level, as illustrated in Figure 13, and, as a consequent, the amount of requiredcomputation too. However, it shows weakness in extracting fixed-size structures such as optic discand non-uniform structures such as retinal lesions. Thus, multiscale approaches can be best suited forstructures that have varying width and length (coarse and fine) in the same image.
A typical multi-scale based technique for retinal vessel segmentation was proposed byBudai et al. [66]. The proposed technique composed of three major phases: (1) Gaussian pyramidgeneration; (2) neighborhood analysis; and (3) images fusion. After the green channel of raw retinalimage was extracted, Gaussian pyramid of resolution hierarchy was generated. The hierarchy iscomposed of three levels (level 0, level 1, and level 2, as shown in Figure 13). The original retinal image(green channel) has the highest resolution (level 0), and the width and height of image begin reducingas we move towards further levels (fine to coarse levels).
In the second phase, for each level, a 3× 3 neighborhood window analysis for each pixel wasanalyzed by calculating Hessian matrix followed by calculation of a couple of eigenvalues λl and λh ofHessian matrix which reflect the scale of lowest curvature λl and the highest one λh in the neighborhoodwindow of the target pixel. Then, the ratio of these values was used to calculate a vessel likenessmeasure Pvessel = 1− λl
λh; the value of Pvessel determines whether target pixel belongs to vessel tree
or not. If Pvessel value is close to one, it means it is most likely a vessel pixel since λl and λh aresimilar to each other. This analysis was applied to each pixel at every scale (level). At the final stage,segmentation results from different levels were undergone binarization using two hysteresis thresholds,then they merged together using pixel-wise OR operation, which yielded the final segmented image.The methodology has achieved an accuracy, specificity, and sensitivity of 93.8%, 97.5% and 65.1% onSTARE dataset, and 94.9%, 96.8% and 75.9% on the DRIVE dataset, respectively.
Abdallah et al. [68] proposed a two-step multi-scale retinal vessel detection algorithm. As afirst step, the noise-corrupted retinal image (grey layer) was denoised against the additive Gaussiannoise by applying a flux based anisotropic diffusion technique; a multi-scale response of multi-levelresolution of retinal image was computed. Then, as a second step, a vessel model was establishedin order to analyze the eigenvalues and the eigenvectors of Hessian matrix for each scale. The finalresult of multi-level analysis represents the pixel-wise maximum of the results obtained over all scales.The proposed algorithm reported area under ROC curve of 0.94514 on STARE dataset.
Rattathanapad et al. [69] presented an algorithm to segment the blood vessel in retinal imagesbased on multilevel line detection and connection of line primitives. Multilevel line detection isused for extracting the retinal vessels at multiple values of Gaussian smoothing parameters. Then,the line primitives that extracted at different scales were merged into one single vessel extraction result.The proposed algorithm was validated using DRIVE dataset where it proved the capability to detectmost of the major part of vessel skeleton with false positives.
A new approach based on a multi-scale method for segmentation of retinal vessel was proposedby Moghimirad et al. [67] where it used weighted Medialness function along with the eigenvaluesof the Hessian matrix. The proposed approach consists of two phases. In the first phase, the medialaxis of retinal vessels was extracted using a two-dimensional Medialness function in multiple scalesand sum of smoothed eigenvalues of the image. The second phase is for vessel reconstruction where

Appl. Sci. 2018, 8, 155 19 of 31
centerline of vessels was extracted and radius of vessels was estimated simultaneously to obtain thefinal segmented results. The proposed approach was validated using DRIVE and STARE datasetswhere it showed high performance in terms of accuracy and area under the ROC curve where it hasachieved accuracy of 0.9659 with area under ROC of 0.9580 via DRIVE dataset and accuracy of 0.9756with area under ROC curve of 0.9678.
4.5. Model-Based Techniques
The concept of deformable model is used to describe a set of computer vision techniques andalgorithms that abstractly model the variability of a certain class of objects in an image (vessels in retinaimage). The most basic versions of these algorithms concern shape variations modeling, where theshape is represented as flexible curve or surface, and is then deformed to match specific instance ofthe object class [108]. The deformation is not an arbitrary process, rather it is performed based on twopowerful theories, Energy Minimization and Curve Evolution, which have roots in physics, geometry andapproximation theories [109]. Deformable models can be divided into two main categories: parametricand geometric ones [110].
4.5.1. Parametric Deformable Models
Parametric deformable modeling, also called snakes or active contours, are parametrized curvesthat depend inherently on particular parameters to be created. The major goal of active contourmodeling is to segment objects in retinal images by fitting the curve to objects’ boundaries in theimage. It is called dynamic contour modeling since it initialized at a place in the neighborhood oftarget object, then the model can evolve dynamically to fit the shape of object by an iterative adaption.The major idea of snakes is to represent a curve via parametric curve; however, since it depends on aparameter to control the movement of curves (when slithering as snakes) during fitting process, it isrigid topologically, namely, it does not have the flexibility required to represent objects composed of avariable number of independent parts [108]. Moreover, another widely-recognized issue associatedwith snake-based segmentation technique is the incapability of snakes to converge to the correct vesseledges in the presence of high level noise or if the vessels were “empty” or have relatively low contrastlevels [74].
A novel segmentation algorithm built on snake contours was developed by Jin et al. [74].The proposed technique consists of three major steps: (1) First, parameter initialization techniquebased on Hessian feature boundaries, where the Hessian feature was used to extract all darker linearstructures in retinal image, and then, the retinal image was divided into (N) segmentation regions (R),based on the seeds of extracted linear structure; (2) Second, each segmentation region R was representedas image through utilizing pixels’ average intensity influence, and then, the snake energy functionwas constructed on this image representation to realize the snake’s locations from the neighborhoodof vessel edges to real ones; (3) Finally, as all model-based methodologies end, a region growingtechnique was used r to get the final vessels’ area, and then, the grown area was post-processed viacontext feature. The proposed methodology, validated on DRIVE dataset, reported a competitiveperformance, reaching up to 95.21% (accuracy), 75.08% (sensitivity), and 96.56% (specificity).
An efficient and effective infinite perimeter active contour model with hybrid region terms forvessel segmentation was proposed by Zhao et al. [31]. The proposed model used hybrid regioninformation of the retinal image, such as the combination of intensity information and local phasebased enhancement map. For its superiority, the local phase based enhancement map was usedto preserve vessel edges, whereas the given information of image intensity guaranteed a correctfeature segmentation. The proposed method was applied to DRIVE and STARE datasets where themethodology achieved sensitivity, specificity and accuracy of 0.780, 0.978 and 0.956, respectively,on STARE, whereas, for DRIVE, the measures are reported to be 0.7420, 0.9820 and 0.9540, respectively.

Appl. Sci. 2018, 8, 155 20 of 31
4.5.2. Geometric Deformable Models
Fast Marching methods and level sets methods are considered numerical techniques devised totrack the propagating interfaces, the starting point for geometric deformable methods comes fromthe evolution analysis of the curves and surfaces, considered interfaces, and was first proposed by themathematician, Sethian [111,112]. Afterwards, Caselles et al. [110] suggested representing the curvedepending on Euclidian distance rather than parameters-dependency by representing a curve as alevel set, which means the contour is represented as zero-level set of an auxiliary distance function ∅.Level sets theory paved the way to represent contours in flexible manner, where it can join or breakapart without the need of reparameterization.
Gong et al. [75] used a novel level set technique does not need level set function initialization,by using local region area descriptor. The proposed technique involves two major steps: (1) a contour Cis found, and then used to divide the entire retinal image into several parts based on whether the pixelposition is inside the contoured area or not; and (2) a clustering algorithm is applied on the sub-regionsthat result from the first step, which, in turn, yield local cluster value, namely, a new region informationused to redefine an energy functional in the first step until the algorithm converges. The second steprepresents key contribution of this paper, since it eliminates the effect of inhomogeneity of retinalimage pixels’ intensities. Moreover, it gives more information about the local intensity informationat level of image pixel, which eliminates the need for level set function re-initialization, considered amajor drawback of level sets-based techniques. The proposed technique was tested on DRIVE datasetand an accuracy of 0.9360, sensitivity of 0.7078 and specificity of 0.9699 are reported.
A novel modification to level set based retinal vessels segmentation was presented byDizdaro et al. [73] in terms of initialization and edge detection phases, which are needed as apre-requirement for level set based techniques. In the initialization phase, the seed points weredetermined by sampling centerlines of vessels based on ridge identification, and then accurateboundaries of the retinal vessel tree are determined through phase map built based on ridge detectiontechnique. The proposed algorithm was tested on both DRIVE dataset and a dataset created by paper’sauthors. The algorithm achieved values of 0.9412, 0.9743, and 0.7181 for accuracy, specificity andsensitivity, respectively, for DRIVE, and 0.9453, 0.9640 and 0.6130, respectively, on the proposed dataset.As a conclusion, both deformable models, either parametric or geometric, share a common problem:both require, as essential step, a set of seed points that are determined either manually or automatically.
4.6. Adaptive Local Thresholding Techniques
Thresholding is considered one of the most well-known, plain and direct methodologies toimage segmentation in general and to medical image segmentation in particular. Whereas the objectsarrangement in the natural scene images looks relatively undistinguishable, the arrangement ofobjects including the organs and tissues in the medical image is usually more discernible. Therefore,thresholding segmentation techniques are used extensively in the research that involves the medicalimage segmentation, where different tissues and organs are represented in different grey levels.Typically, thresholding techniques, in their basic framework, search for a global value (level) thatoptimally maximizes the separation between different classes (different tissues in our case) in theimage. The effectiveness of thresholding with a global level manifests if the objects in the image underconsideration have well-defined areas and if the grey levels can be congregated around values withminimum interference.
Uneven illumination, inferior quality of source material, camera artifacts/distortions, andanatomical objects with multi-classes and hybrid features make the global thresholding for theentire retinal image a major source for segmentation errors. Moreover, since retinal image showssoft transition between different grey levels, uneven illumination or noise distortions, the principalsegmentation errors begin to appear due to pixel-wise approach that adopted by global thresholding,namely, the pixels that have same grey levels (pixel intensity) will be segmented into the sameanatomical object, which is considered a long-standing issue of global thresholding with a single

Appl. Sci. 2018, 8, 155 21 of 31
hard value. To resolve these issues, region-wise thresholding methodologies have been suggestedfor case of retinal vessels identification, developed and implemented via different techniques whichcan be classified into three major categories: statistical, knowledge-based and fuzzy-based adaptivethresholding, as shown in Figure 14.
A novel work by Christodoulidis et al. [78] focused on segmenting small thin vessels throughMulti Scale Tensor Voting (MTVF) scheme, based on the fact that small vessels represent nearly10% of the total surface of vascular network [42] which, in turn, represents the framework ofstatistical-based adaptive thresholding. The proposed technique consists of four major stages:pre-processing; multiscale line detecting vessel enhancement; adaptive thresholding and MTVFprocessing; and post-processing stage. In the pre-processing stage, the green channel of raw retinaimage was extracted. Then, image contrast was enhanced by applying a contrast correction approachproposed by [113]. Dual-tree complex wavelet transform [114] was used to remove noise. Following thepre-processing stage, retinal vessels were enhanced via multi-scale line detection approach proposedby [115]. The output of multi-scale line detector was fed into adaptive thresholding processer to isolatevessels. To obtain various levels of adaptive thresholding, authors have fitted the histogram of MSLDresponse to a simple Gaussian function and modified the optimum global threshold [116] by varyingthe distance from the mean of Gaussian function through following equation:
T = |µGaussian |+ α|σGaussian| (5)
where µGaussian and σGaussian are the mean and standard deviation of the fitted Gaussian function,respectively. Then, various thresholds revealed through experimentally changing α parameter, which isconsidered the heart of adaptive thresholding. Once the adaptive thresholding step has been performed,many smaller vessels separate. Thus, a multi-scale tensor voting framework inspired by [117,118] hasbeen used to reconnect them. In summary, adaptive thresholding was used to extract large- andmedium-sized retinal vessels, while MTVF was used to extract the smallest ones. Finally, as apost-processing step, morphological cleaning was used to remove the non-vasculature componentsremaining after applying adaptive thresholding. The proposed methodology was tested on a recentlyavailable Erlangen dataset [47], where it achieved average accuracy of 94.79%, and 85.06% and 95.82%for sensitivity and specificity, respectively.
Appl. Sci. 2018, 8, x 21 of 30
response to a simple Gaussian function and modified the optimum global threshold [116] by varying the distance from the mean of Gaussian function through following equation: = | | + | | (5)
where and are the mean and standard deviation of the fitted Gaussian function, respectively. Then, various thresholds revealed through experimentally changing parameter, which is considered the heart of adaptive thresholding. Once the adaptive thresholding step has been performed, many smaller vessels separate. Thus, a multi-scale tensor voting framework inspired by [117,118] has been used to reconnect them. In summary, adaptive thresholding was used to extract large- and medium-sized retinal vessels, while MTVF was used to extract the smallest ones. Finally, as a post-processing step, morphological cleaning was used to remove the non-vasculature components remaining after applying adaptive thresholding. The proposed methodology was tested on a recently available Erlangen dataset [47], where it achieved average accuracy of 94.79%, and 85.06% and 95.82% for sensitivity and specificity, respectively.
Figure 14. Adaptive local thresholding taxonomy.
Akram et al. [77] used adaptive thresholding technique to locate and extract retinal vessels automatically. The statistical-based adaptive thresholding was used to create the binary vascular mask by selecting points that isolate vessels from the rest of image. The proposed method has two major phases: pre-processing and adaptive thresholding phases. In the first phase, the monochromatic RGB retinal image was fed into Gabor wavelet filter for vasculature pattern enhancement, specifically for thin and less visible vessels, based on an image analysis technique proposed by [119]. The yielded enhanced retinal image has maximum grey values occur for background whereas pixels belong to vessels have a slightly greater intensity values rather than that belong to background. The proposed technique has been tested using DRIVE dataset, where it achieved an average accuracy of 0.9469 with area under ROC curve approximate value of 0.963.
A knowledge-guided local adaptive thresholding was proposed by Jiang and Mojon [76] where a verification-based multi-thresholding probing scheme was used. In its most basic form, given a binary image results from thresholding process at a threshold level , a classification procedure is used to decide if any region in can be defined as an object. The operation is carried out on a series of different thresholds. The final image segmentation is set by combining different results of different thresholds. In summary, the objects hypotheses in an image are generated by binarization via some hypothetic thresholds, and then, according to a particular classification procedure, the object is accepted or rejected. The classification procedure represents the core of this proposed algorithm, where any piece of information related to object under consideration is incorporated, such as shape, color intensity and contrast. This is why it is called knowledge-guided technique, since, during segmentation, thresholding levels varying according to the knowledge available about the target object.
Figure 14. Adaptive local thresholding taxonomy.
Akram et al. [77] used adaptive thresholding technique to locate and extract retinal vesselsautomatically. The statistical-based adaptive thresholding was used to create the binary vascular maskby selecting points that isolate vessels from the rest of image. The proposed method has two majorphases: pre-processing and adaptive thresholding phases. In the first phase, the monochromatic RGBretinal image was fed into Gabor wavelet filter for vasculature pattern enhancement, specifically forthin and less visible vessels, based on an image analysis technique proposed by [119]. The yielded

Appl. Sci. 2018, 8, 155 22 of 31
enhanced retinal image has maximum grey values occur for background whereas pixels belong tovessels have a slightly greater intensity values rather than that belong to background. The proposedtechnique has been tested using DRIVE dataset, where it achieved an average accuracy of 0.9469 witharea under ROC curve approximate value of 0.963.
A knowledge-guided local adaptive thresholding was proposed by Jiang and Mojon [76] where averification-based multi-thresholding probing scheme was used. In its most basic form, given a binaryimage Ibinary results from thresholding process at a threshold level T, a classification procedure is usedto decide if any region in Ibinary can be defined as an object. The operation is carried out on a series ofdifferent thresholds. The final image segmentation is set by combining different results of differentthresholds. In summary, the objects hypotheses in an image are generated by binarization via somehypothetic thresholds, and then, according to a particular classification procedure, the object is acceptedor rejected. The classification procedure represents the core of this proposed algorithm, where any pieceof information related to object under consideration is incorporated, such as shape, color intensity andcontrast. This is why it is called knowledge-guided technique, since, during segmentation, thresholdinglevels varying according to the knowledge available about the target object.
4.7. Machine Learning Techniques
While pattern recognition has its roots in engineering, machine learning was developed incomputer science [120]. Pattern recognition has become a more well-known and active researchfield since the 1960s [121], and has undergone considerable development for many years, whichyields a variety of paradigms and methods that have important applicability in many fields; retinalvascular structure is such a one. Machine learning algorithms are typically divided into three majorcategories: supervised, unsupervised and reinforcement learning. This categorization is mostly based onthe availability of responses y for input data x. Supervised learning addresses the problems where,for each input x, there is a corresponding observed output y, whereas, in the case of the latter twocategories, this correspondence cannot be found due to the lack of data. Unsupervised learning exploresinteresting patterns in the input data without a need for explicit supervision [122]. Reinforcementlearning assumes that the dynamics of the system under consideration follows a particular class ofmodel [123].
A back propagation artificial neural network vessel classifier was designed by Nekovei andYing [79] to identify the blood vasculature structure in angiogram images. The proposed techniqueuses the raw grey-intensity values of pixels instead of feature extraction. Each pixel in the imageis processed by creating a window around it that covers number of pixels, and then, the raw greyintensities of these pixels are fed into the neural network as input. To cover the entire image, a processof sliding windows, pixel by pixel, takes place. Training dataset consists of manually selected patchsamples of angiogram, where the distribution of vessel and background pixels is kept roughly equalto prevent neural network biasing towards background pixels’ classification. The proposed methodavoids the complexity of feature extraction. Besides, the method achieved vessel detection performanceof 92% on angiograms.
Transfer learning and domain adaptation [124] has been investigated in the field of retinal vesselssegmentation by [86], where a denoised stacked auto-encoder neural network was trained with amplelabeled mini-patches of retinal images taken from DRIVE dataset. DRIVE dataset represents the sourcedomain where the auto-encoder was adapted to deploy on STARE dataset which represent targetdomain. The stacked auto encoder consists of two encoding layers with 400 and 100 nodes per layer,respectively, and is followed by a SoftMax regression layer. Due to power of knowledge transfer, theproposed technique exhibited an accelerated learning performance with area under ROC curve of 0.92.
For an exhaustive detection of fine retinal vessels, Maji et al. [84] designed a hybrid frameworkof deep and ensemble learning, where a Deep Neural Network (DNN) was used for unsupervisedlearning of vesselness via denoising auto-encoder, utilizing sparse trained retinal vascular patches.The learned representation of retinal vasculature patches was used as weights in the deep neural

Appl. Sci. 2018, 8, 155 23 of 31
network, and the response of deep neural network was used in supervised learning process with arandom forest for sake of vasculature tissues identification. The high capability of denoising autoencoder to learn feature representation was furiously exploited. The method was trained and testedvia DRIVE dataset. Although the achieved average accuracy was 0.9327, it is considered marginallyweak in contrast with state of the art approaches; the performance consistency of the method and theability to identify both coarse and fine retinal vascular structures are considered its unique ambience.
Invigorated by the success of [84,86], Lahiri et al. [87] presented an ensemble of two parallellevels of stacked denoised auto-encoder networks. Each kernel is accountable for distinguishing aparticular orientation of vessel. First level of the ensemble is composed by training (n) parallel stackeddenoised autoencoders that have the same architecture, whereas second level is implemented byparallel training of two stacked denoised autoencoders, and the final architecture was fine-tuned untila satisfied accuracy was achieved. The decisions of individual members of the ensemble are combinedby a simple SoftMax classifier. The method proves to be reliable and consistent in addition to highaverage detection accuracy that reached up to 0.953.
Contemporaneous research proposed by Maji et al. [88] uses deep neural network techniqueensemble of twelve convolutional neural networks to distinguish vessel pixels from non-vessel ones.Each convolutional neural network has three convolutional layers; each one was trained separatelyusing a set of 60,000 randomly selected 31× 31× 31-sized patches taken from 20 raw color retinalimages of DRIVE dataset. At the time of deduction, the probabilities of vesselness were producedby each convolutional network in a separate manner. Then, the individual responses were averagedto form the final vesselness probability of each pixel. Although the method did not achieve thehighest detection accuracy (0.9470) among other methods, it exhibited superior performance interms of learning vessel presentation from data because multiple experts represented by ensemble ofconventional networks are more powerful and accurate than one neural network.
Detecting and restoring small foreground retinal filamentary structure was handled by Gu andCheng [22] using an iterative two-step approach built based on Latent Classification Tree (LCT)model. After the confidence map has been constructed, a sufficiently high thresholding was placedon it, yielding a partially segmented image containing the main (thick and long) vessels. Usinglatent classification tree, the remaining low confidence map (filamentary filaments) was obtained.The filamentary structure was re-connected to main filaments (large vessels) via novel matting andcompletion field technique. These steps were performed iteratively until the whole retina surface wasscanned. The proposed method achieved high detection accuracy, up to 97.32% for DRIVE dataset and97.72% for STARE dataset, which is considered an expected result due to the noticeable degradation inthe false positives produced by false detection of fine retinal filaments. The proposed method achievedencouraging performance, and also has a broad range of applications in fields other than retinal vesselsextraction such as 3D magnetic resonance angiography and neural tracing.
A fast and accurate automated segmentation method for retinal and optic disc structures wasproposed by Maninis et al. [24]. Their method uses deep Conventional Neural Networks (CNNs)as supervised segmentation methods. As all neural networks, the layers of CNN were trained in aspecialized manner to address both retrial and optic disc segmentation. The proposed method wasvalidated using DRIVE and STARE dataset for retinal vessel segmentation task where the area underrecall–precision curve reached up to 0.822 for DRIVE dataset and 0.831 for STARE dataset. In contextof CNN-based approaches, remarkable performances have been achieved by Liskowski et al. [89] withsupremum area under curve (AUC) of 0.99 and accuracy of 95.33%, while AUC of 0.974 was achievedby Dasgupta and Singh [91] for automated retinal vessel segmentation.
A novel enhancement applied on the classic K-nearest neighbor (KNN) clustering algorithm forretinal vessel segmentation has been demonstrated by Salem et al. [80]. Each pixel was represented bya feature vector composed of green channel intensity, local maxima of the gradient magnitude and thelocal maxima of the largest eigenvalue. Based on these features, image pixels were clustered using themodified version of KNN without using training set. The segmentation algorithm was evaluated on the

Appl. Sci. 2018, 8, 155 24 of 31
STARE dataset resulting in an average sensitivity and specificity of 77% and 90%, respectively, for threefeature vectors, and 76% and 93%, respectively, using only one feature (maximum eigenvalue) vector.
A fuzzy-based retinal vessel segmentation methodology proposed by Sharma and Wasson [85]used the difference between low-pass filtered and high-pass filtered version of retinal image as inputfor fuzzy-logic based processing. The fuzzy logic consists of different sets of fuzzy rules; each fuzzyrule was built based on different thresholding values. Thresholding values were used to select anddiscard pixel values according to fuzzy rules, which, in turn, led to vessel extraction. The methodologyattained an average accuracy of 95% on DRIVE dataset.
A two-stage combination between vessel tracking and fuzzy logic techniques was proposedby Akhavan and Faez [82]. In the first stage, the centerlines of enhanced retinal image weredetected, while retinal vessels were filled using Fuzzy C-Means (FCM) clustering technique in thesecond stage. The final segmented result was obtained by combining centerlines images with fuzzysegmented images. Centerlines are used as initial points for a FCM-based region growing algorithm.The evaluation of the technique resulted in an average accuracy of 72.52% on DRIVE dataset and77.66% on STARE dataset.
A novel scheme based on combination of genetic algorithm and fuzzy c-means clusteringalgorithm was proposed by Xie and Nie [81]. In pre-processing stage, the green channel of rawretinal image was extracted and enhanced by histogram equalization. Then, the retinal image wasdivided into two major layers: texture layer and smooth layer. Texture layer was directly fed as inputto the processing stage due to the amount of information that contains. The features, containing dataobtained in the first stage, were clustered via fuzzy c-means algorithm in conjunction with geneticalgorithm, where, firstly, the genetic algorithm is used to obtain the approximate solution of theglobal optimal solution; and, secondly, the approximate solution was used as initial value of the fuzzyc-means algorithm. Genetic algorithm eases and enhances the duty of fuzzy c-means in finding theoptimal solution without falling into issue of local detection of optimal solutions.
To overcome the issues related to the objective function of the classic fuzzy c-means classifier,Emary et al. [83] utilized the possibilistic version of fuzzy c-means algorithm optimized by Cuckoosearch algorithm. They used the new clustering methods, possibilistic c-means proposed by [125] andpossibilistic fuzzy c-means proposed by [126]m to establish an optimal version of fuzzy c-means thatwere used accordingly for retinal vessels segmentation. The optimality of the proposed method wasexamined by the heuristic search algorithm Cuckoo Search (CS). The evaluation on the STARE datasetindicated an average accuracy, specificity and sensitivity of 0.94478, 0.987 and 0.586, respectively,whereas, for DRIVE dataset, the measures were 0.938, 0.984 and 0.628, respectively.
5. Discussion and Conclusions
The existing retinal blood vessel segmentation methodologies are categorized, and described inthe last section. We discussed various techniques used in these methodologies for the segmentation ofblood vessels in retinal image and compare performance result of the methods. These methodologieswere evaluated using publicly available datasets. Various retinal vessels segmentation methodologiesfollow similar procedures: each methodology initiates by pre-processing step, where the green layer(or grey) is extracted from the raw color retinal image, and then the contrast of the image is enhanced.Processing step represents the heart of algorithm, where the different techniques categorized in lastsection are used. Finally, in the post-processing step, the initial segmented image undergoes steps ofsmoothing and edge preserving and enhancement.
Regarding retinal segmentation categories shown in Figure 7, there is neither a best techniqueor algorithm to face all performance metrics in high segmentation achievement, nor a bestmathematical scheme to do so. Deciding whether the methodology is best depends on a set of factorsincluding: (1) Achieved accuracy, which in turn, depends on the achieved specificity and sensitivity,where segmentation is considered the best if it achieves the highest possible sensitivity value (or showslow false detection to other retinal structures), while also maintaining the specificity at optimal level.

Appl. Sci. 2018, 8, 155 25 of 31
On the other hand, the optimality of the method increases as detection capability of the method recordshigh performance in pathological retinal images; (2) Time and computational complexity: The time andcomputational power required by the methods tend to be low, as the accuracy has increased tendencyon the condition that high performance of high accuracy has achieved; (3) Robustness: The method isconsidered to be best if it shows robustness against method parameters variation.
The accurate detection and segmentation of the retinal vascular structure forms the backboneof a variety of automated computer aided systems for screening and diagnosis of ophthalmologicand cardiovascular diseases. Even though many promising methodologies have been developed andimplemented, there is still room for research improvement in blood vessel segmentation methodologies,especially for noisy and pathological retinal images outside the limited number of retinal imagesavailable in public datasets. In real-life applications, retinal vessels segmentation systems will notreplace the experts’ role in diagnosis; rather, they will enhance the diagnosis accuracy and reduce theworkload of the ophthalmologists. Therefore, large volume of patients’ images can be processed withhigh diagnosis accuracy and comparable time.
Author Contributions: The work has been primarily conducted by Jasem Almotiri under the supervisionof Khaled Elleithy. Abdelrahman Elleithy provided insightful suggestions to improve this work. Extensivediscussions about the algorithms and techniques presented in this paper were had among the three authors overthe past year.
Conflicts of Interest: The authors declare no conflict of interest.
References
1. Lesage, D.; Angelini, E.D.; Bloch, I.; Funka-Lea, G. A review of 3D vessel lumen segmentation techniques:Models, features and extraction schemes. Med. Image Anal. 2009, 13, 819–845. [CrossRef] [PubMed]
2. Kirbas, C.; Quek, F. A review of vessel extraction techniques and algorithms. ACM Comput. Surv. CSUR2004, 36, 81–121. [CrossRef]
3. Kirbas, C.; Quek, F.K. Vessel extraction techniques and algorithms: A survey. In Proceedings of the the ThirdIEEE symposium on Bioinformatics and Bioengineering, Bethesda, MD, USA, 12 March 2003; pp. 238–245.
4. Suri, J.S.; Liu, K.; Reden, L.; Laxminarayan, S. A review on MR vascular image processing: Skeleton versusnonskeleton approaches: Part II. IEEE Trans. Inf. Technol. Biomed. 2002, 6, 338–350. [CrossRef] [PubMed]
5. Fraz, M.M.; Remagnino, P.; Hoppe, A.; Uyyanonvara, B.; Rudnicka, A.R.; Owen, C.G.; Barman, S.A. Bloodvessel segmentation methodologies in retinal images—A survey. Comput. Methods Program Biomed. 2012, 108,407–433. [CrossRef] [PubMed]
6. Srinidhi, C.L.; Aparna, P.; Rajan, J. Recent Advancements in Retinal Vessel Segmentation. J. Med. Syst. 2017,41, 70. [CrossRef] [PubMed]
7. Dash, J.; Bhoi, N. A Survey on Blood Vessel Detection Methodologies in Retinal Images. In Proceedingsof the 2015 International Conference on Computational Intelligence and Networks, Bhubaneshwar, India,12–13 January 2015; pp. 166–171.
8. Mansour, R. Evolutionary Computing Enriched Computer Aided Diagnosis System For Diabetic Retinopathy:A Survey. IEEE Rev. Biomed. Eng. 2017, 10, 334–349. [CrossRef] [PubMed]
9. Pohankar, N.P.; Wankhade, N.R. Different methods used for extraction of blood vessels from retinal images.In Proceedings of the 2016 World Conference on Futuristic Trends in Research and Innovation for SocialWelfare (Startup Conclave), Coimbatore, India, 29 February–1 March 2016; pp. 1–4.
10. Singh, N.; Kaur, L. A survey on blood vessel segmentation methods in retinal images. In Proceedings ofthe 2015 International Conference on Electronic Design, Computer Networks & Automated Verification(EDCAV), Shillong, India, 29–30 January 2015; pp. 23–28.
11. Kolb, H. Simple Anatomy of the Retina, 2012. Available online: http://webvision.med.utah.edu/book/part-i-foundations/simple-anatomy-of-the-retina/ (accessed on 22 January 2018).
12. Oloumi, F.; Rangayyan, R.M.; Eshghzadeh-Zanjani, P.; Ayres, F. Detection of blood vessels in fundusimages of the retina using gabor wavelets. In Proceedings of the 29th Annual International Conference ofthe IEEE Engineering in Medicine and Biology Society, Lyon, France, 22–26 August 2007; pp. 6451–6454.Available online: http://people.ucalgary.ca/~ranga/enel697/ (accessed on 12 September 2017).

Appl. Sci. 2018, 8, 155 26 of 31
13. Saine, P.J.; Tyler, M.E. Ophthalmic Photography: Retinal Photography, Angiography, and Electronic Imaging;Butterworth-Heinemann: Boston, MA, USA, 2002; Volume 132.
14. Kolb, H. Simple Anatomy of the Retina. In Webvision: The Organization of the Retina and VisualSystem; Kolb, H., Fernandez, E., Nelson, R., Eds.; University of Utah Health Sciences Center:Salt Lake City, UT, USA, 1995. Available online: http://europepmc.org/books/NBK11533;jsessionid=4C8BAD63F75EAD49C21BC65E2AE5F6F3 (accessed on 22 January 2018).
15. Ophthalmic Photographers’ Society. Available online: www.opsweb.org (accessed on 22 January 2018).16. Ng, E.; Acharya, U.R.; Rangayyan, R.M.; Suri, J.S. Ophthalmological Imaging and Applications; CRC Press:
Boca Raton, FL, USA, 2014.17. Patel, S.N.; Klufas, M.A.; Ryan, M.C.; Jonas, K.E.; Ostmo, S.; Martinez-Castellanos, M.A.; Berrocal, A.M.;
Chiang, M.F.; Chan, R.V.P. Color Fundus Photography Versus Fluorescein Angiography in Identificationof the Macular Center and Zone in Retinopathy of Prematurity. Am. J. Ophthalmol. 2015, 159, 950–957.[CrossRef] [PubMed]
18. Orlando, J.I.; Prokofyeva, E.; Blaschko, M.B. A discriminatively trained fully connected conditional randomfield model for blood vessel segmentation in fundus images. IEEE Trans. Biomed. Eng. 2017, 64, 16–27.[CrossRef] [PubMed]
19. Zhang, J.; Dashtbozorg, B.; Bekkers, E.; Pluim, J.P.; Duits, R.; ter Haar Romeny, B.M. Robust retinal vesselsegmentation via locally adaptive derivative frames in orientation scores. IEEE Trans. Med. Imaging 2016, 35,2631–2644. [CrossRef] [PubMed]
20. Abbasi-Sureshjani, S.; Zhang, J.; Duits, R.; ter Haar Romeny, B. Retrieving challenging vessel connections inretinal images by line co-occurrence statistics. Biol. Cybern. 2017, 111, 237–247. [CrossRef] [PubMed]
21. Abbasi-Sureshjani, S.; Favali, M.; Citti, G.; Sarti, A.; ter Haar Romeny, B.M. Curvature integration in a 5Dkernel for extracting vessel connections in retinal images. IEEE Trans. Image Process. 2018, 27, 606–621.[CrossRef] [PubMed]
22. Gu, L.; Cheng, L. Learning to boost filamentary structure segmentation. In Proceedings of the IEEEInternational Conference on Computer Vision, Santiago, Chile, 7–13 December 2015; pp. 639–647.
23. De, J.; Cheng, L.; Zhang, X.; Lin, F.; Li, H.; Ong, K.H.; Yu, W.; Yu, Y.; Ahmed, S. A graph-theoretical approachfor tracing filamentary structures in neuronal and retinal images. IEEE Trans. Med. Imaging 2016, 35, 257–272.[CrossRef] [PubMed]
24. Maninis, K.-K.; Pont-Tuset, J.; Arbeláez, P.; Van Gool, L. Deep retinal image understanding. In InternationalConference on Medical Image Computing and Computer-Assisted Intervention; Springer International Publishing:Berlin/Heidelberg, Germany, 2016; pp. 140–148.
25. Sironi, A.; Lepetit, V.; Fua, P. Projection onto the manifold of elongated structures for accurate extraction.In Proceedings of the IEEE International Conference on Computer Vision, Santiago, Chile, 7–13 December2015; pp. 316–324.
26. Solouma, N.; Youssef, A.-B.M.; Badr, Y.; Kadah, Y.M. Real-time retinal tracking for laser treatment planningand administration. In Medical Imaging 2001: Image Processing; SPIE—The International Society of Optics andPhotonics: Bellingham, WA, USA; pp. 1311–1321.
27. Wang, Y.; Lee, S.C. A fast method for automated detection of blood vessels in retinal images. In Proceedingsof the Conference Record of the Thirty-First Asilomar Conference on Signals, Systems & Computers,Pacific Grove, CA, USA, 2–5 November 1997; pp. 1700–1704.
28. Can, A.; Shen, H.; Turner, J.N.; Tanenbaum, H.L.; Roysam, B. Rapid automated tracing and feature extractionfrom retinal fundus images using direct exploratory algorithms. IEEE Trans. Inf. Technol. Biomed. 1999, 3,125–138. [CrossRef] [PubMed]
29. Li, H.; Chutatape, O. Fundus image features extraction. In Proceedings of the 22nd Annual InternationalConference of the IEEE Engineering in Medicine and Biology Society, Chicago, IL, USA, 23–28 July 2000;pp. 3071–3073.
30. Yang, Y.; Huang, S.; Rao, N. An automatic hybrid method for retinal blood vessel extraction. Int. J. Appl.Math. Comput. Sci. 2008, 18, 399–407. [CrossRef]
31. Zhao, Y.; Rada, L.; Chen, K.; Harding, S.P.; Zheng, Y. Automated vessel segmentation using infinite perimeteractive contour model with hybrid region information with application to retinal images. IEEE Trans.Med. Imaging 2015, 34, 1797–1807. [CrossRef] [PubMed]

Appl. Sci. 2018, 8, 155 27 of 31
32. Yu, H.; Barriga, E.S.; Agurto, C.; Echegaray, S.; Pattichis, M.S.; Bauman, W.; Soliz, P. Fast localization andsegmentation of optic disk in retinal images using directional matched filtering and level sets. IEEE Trans.Inf. Technol. Biomed. 2012, 16, 644–657. [CrossRef] [PubMed]
33. Aibinu, A.M.; Iqbal, M.I.; Shafie, A.A.; Salami, M.J.E.; Nilsson, M. Vascular intersection detection in retinafundus images using a new hybrid approach. Comput. Biol. Med. 2010, 40, 81–89. [CrossRef] [PubMed]
34. Wu, C.-H.; Agam, G.; Stanchev, P. A hybrid filtering approach to retinal vessel segmentation. In Proceedingsof the IEEE International Symposium on Biomedical Imaging: From Nano to Macro, Arlington, VA, USA,12–15 April 2007; pp. 604–607.
35. Siddalingaswamy, P.; Prabhu, K.G. Automatic detection of multiple oriented blood vessels in retinal images.J. Biomed. Sci. Eng. 2010, 3. [CrossRef]
36. Wang, S.; Yin, Y.; Cao, G.; Wei, B.; Zheng, Y.; Yang, G. Hierarchical retinal blood vessel segmentation basedon feature and ensemble learning. Neurocomputing 2015, 149, 708–717. [CrossRef]
37. Kauppi, T.; Kalesnykiene, V.; Kamarainen, J.-K.; Lensu, L.; Sorri, I.; Raninen, A.; Voutilainen, R.; Uusitalo, H.;Kälviäinen, H.; Pietilä, J. The DIARETDB1 Diabetic Retinopathy Database and Evaluation Protocol.In Proceedings of the British Machine Vision Conference 2007, Coventry, UK, 10–13 September 2007; pp. 1–10.
38. Walter, T.; Klein, J.-C.; Massin, P.; Erginay, A. A contribution of image processing to the diagnosis of diabeticretinopathy-detection of exudates in color fundus images of the human retina. IEEE Trans. Med. Imaging2002, 21, 1236–1243. [CrossRef] [PubMed]
39. Hanley, J.A.; McNeil, B.J. The meaning and use of the area under a receiver operating characteristic (ROC)curve. Radiology 1982, 143, 29–36. [CrossRef] [PubMed]
40. Metz, C.E. Receiver operating characteristic analysis: A tool for the quantitative evaluation of observerperformance and imaging systems. J. Am. Coll. Radiol. 2006, 3, 413–422. [CrossRef] [PubMed]
41. Staal, J.; Abràmoff, M.D.; Niemeijer, M.; Viergever, M.A.; Van Ginneken, B. Ridge-based vessel segmentationin color images of the retina. IEEE Trans. Med. Imaging 2004, 23, 501–509. [CrossRef] [PubMed]
42. Niemeijer, M.; Staal, J.; van Ginneken, B.; Loog, M.; Abramoff, M.D. Comparative study of retinal vesselsegmentation methods on a new publicly available database. In Proceedings of the Medical Imaging 2004:Physics of Medical Imaging, San Diego, CA, USA, 15–17 February 2004; pp. 648–656.
43. Hoover, A.; Kouznetsova, V.; Goldbaum, M. Locating blood vessels in retinal images by piecewise thresholdprobing of a matched filter response. IEEE Trans. Med. Imaging 2000, 19, 203–210. [CrossRef] [PubMed]
44. Bankhead, P.; Scholfield, C.N.; McGeown, J.G.; Curtis, T.M. Fast retinal vessel detection and measurementusing wavelets and edge location refinement. PLoS ONE 2012, 7, e32435. [CrossRef] [PubMed]
45. MESSIDOR: Methods for Evaluating Segmentation and Indexing Techniques Dedicated to RetinalOphthalmology, 2004. Available online: http://www.adcis.net/en/Download-Third-Party/Messidor.html(accessed on 22 January 2018).
46. Decencière, E.; Zhang, X.; Cazuguel, G.; Laÿ, B.; Cochener, B.; Trone, C.; Gain, P.; Ordonez, R.; Massin, P.;Erginay, A. Feedback on a publicly distributed image database: The Messidor database. Image Anal. Stereol.2014, 33, 231–234. [CrossRef]
47. Odstrcilik, J.; Kolar, R.; Budai, A.; Hornegger, J.; Jan, J.; Gazarek, J.; Kubena, T.; Cernosek, P.; Svoboda, O.;Angelopoulou, E. Retinal vessel segmentation by improved matched filtering: Evaluation on a newhigh-resolution fundus image database. IET Image Process. 2013, 7, 373–383. [CrossRef]
48. Chaudhuri, S.; Chatterjee, S.; Katz, N.; Nelson, M.; Goldbaum, M. Detection of blood vessels in retinal imagesusing two-dimensional matched filters. IEEE Trans. Med. Imaging 1989, 8, 263–269. [CrossRef] [PubMed]
49. Chanwimaluang, T.; Fan, G. An efficient algorithm for extraction of anatomical structures in retinal images.In Proceedings of the 2003 International Conference on Image Processing (Cat. No.03CH37429), Barcelona,Spain, 14–17 September 2003; Volume 1091, pp. I-1093–I-1096.
50. Al-Rawi, M.; Qutaishat, M.; Arrar, M. An improved matched filter for blood vessel detection of digital retinalimages. Comput. Biol. Med. 2007, 37, 262–267. [CrossRef] [PubMed]
51. Villalobos-Castaldi, F.M.; Felipe-Riverón, E.M.; Sánchez-Fernández, L.P. A fast, efficient and automatedmethod to extract vessels from fundus images. J. Vis. 2010, 13, 263–270. [CrossRef]
52. Zhang, B.; Zhang, L.; Zhang, L.; Karray, F. Retinal vessel extraction by matched filter with first-orderderivative of Gaussian. Comput. Biol. Med. 2010, 40, 438–445. [CrossRef] [PubMed]

Appl. Sci. 2018, 8, 155 28 of 31
53. Zhu, T.; Schaefer, G. Retinal vessel extraction using a piecewise Gaussian scaled model. In Proceedingsof the 2011 Annual International Conference of the IEEE Engineering in Medicine and Biology Society,Boston, MA, USA, 30 August–3 September 2011; pp. 5008–5011.
54. Kaur, J.; Sinha, H. Automated detection of retinal blood vessels in diabetic retinopathy using Gabor filter.Int. J. Comput. Sci. Netw. Secur. 2012, 12, 109.
55. Zolfagharnasab, H.; Naghsh-Nilchi, A.R. Cauchy Based Matched Filter for Retinal Vessels Detection. J. Med.Signals Sens. 2014, 4, 1–9. [PubMed]
56. Singh, N.P.; Kumar, R.; Srivastava, R. Local entropy thresholding based fast retinal vessels segmentation bymodifying matched filter. In Proceedings of the International Conference on Computing, Communication& Automation, Noida, India, 15–16 May 2015; pp. 1166–1170.
57. Kumar, D.; Pramanik, A.; Kar, S.S.; Maity, S.P. Retinal blood vessel segmentation using matched filterand laplacian of gaussian. In Proceedings of the 2016 International Conference on Signal Processing andCommunications (SPCOM), Bangalore, India, 12–15 June 2016; pp. 1–5.
58. Singh, N.P.; Srivastava, R. Retinal blood vessels segmentation by using Gumbel probability distributionfunction based matched filter. Comput. Methods Programs Biomed. 2016, 129, 40–50. [CrossRef] [PubMed]
59. Chutatape, O.; Liu, Z.; Krishnan, S.M. Retinal blood vessel detection and tracking by matched Gaussian andKalman filters. In Proceedings of the the 20th Annual International Conference of the IEEE Engineeringin Medicine and Biology Society, Vol.20 Biomedical Engineering towards the Year 2000 and Beyond(Cat. No.98CH36286), Hong Kong, China, 1 November 1998; Volume 3146, pp. 3144–3149.
60. Sofka, M.; Stewart, C.V. Retinal Vessel Centerline Extraction Using Multiscale Matched Filters, Confidenceand Edge Measures. IEEE Trans. Med. Imaging 2006, 25, 1531–1546. [CrossRef] [PubMed]
61. Adel, M.; Rasigni, M.; Gaidon, T.; Fossati, C.; Bourennane, S. Statistical-based linear vessel structure detectionin medical images. In Proceedings of the 2009 16th IEEE International Conference on Image Processing(ICIP), Cairo, Egypt, 7–10 November 2009; pp. 649–652.
62. Wu, C.H.; Agam, G.; Stanchev, P. A general framework for vessel segmentation in retinal images.In Proceedings of the 2007 International Symposium on Computational Intelligence in Robotics andAutomation, Jacksonville, FL, USA, 20–23 June 2007; pp. 37–42.
63. Yedidya, T.; Hartley, R. Tracking of Blood Vessels in Retinal Images Using Kalman Filter. In Proceedings ofthe 2008 Digital Image Computing: Techniques and Applications, Canberra, Australia, 1–3 December 2008;pp. 52–58.
64. Yin, Y.; Adel, M.; Guillaume, M.; Bourennane, S. A probabilistic based method for tracking vessels in retinalimages. In Proceedings of the 2010 IEEE International Conference on Image Processing, Hong Kong, China,26–29 September 2010; pp. 4081–4084.
65. Li, H.; Zhang, J.; Nie, Q.; Cheng, L. A retinal vessel tracking method based on bayesian theory. In Proceedingsof the 2013 8th IEEE Conference on Industrial Electronics and Applications (ICIEA), Melbourne, Australia,19–21 June 2013; pp. 232–235.
66. Budai, A.; Michelson, G.; Hornegger, J. Multiscale Blood Vessel Segmentation in Retinal Fundus Images.In Proceedings of the Bildverarbeitung für die Medizin, Aachen, Germany, 14–16 March 2010; pp. 261–265.
67. Moghimirad, E.; Rezatofighi, S.H.; Soltanian-Zadeh, H. Multi-scale approach for retinal vessel segmentationusing medialness function. In Proceedings of the 2010 IEEE International Symposium on Biomedical Imaging:From Nano to Macro, Rotterdam, The Netherlands, 14–17 April 2010; pp. 29–32.
68. Abdallah, M.B.; Malek, J.; Krissian, K.; Tourki, R. An automated vessel segmentation of retinal imagesusing multiscale vesselness. In Proceedings of the Eighth International Multi-Conference on Systems,Signals & Devices, Sousse, Tunisia, 22–25 March 2011; pp. 1–6.
69. Rattathanapad, S.; Mittrapiyanuruk, P.; Kaewtrakulpong, P.; Uyyanonvara, B.; Sinthanayothin, C. Vesselextraction in retinal images using multilevel line detection. In Proceedings of the 2012 IEEE-EMBSInternational Conference on Biomedical and Health Informatics, Hong Kong, China, 5–7 January 2012;pp. 345–349.
70. Kundu, A.; Chatterjee, R.K. Retinal vessel segmentation using Morphological Angular Scale-Space.In Proceedings of the 2012 Third International Conference on Emerging Applications of InformationTechnology, Kolkata, India, 30 November–1 December 2012; pp. 316–319.

Appl. Sci. 2018, 8, 155 29 of 31
71. Frucci, M.; Riccio, D.; Baja, G.S.D.; Serino, L. Using Contrast and Directional Information for Retinal VesselsSegmentation. In Proceedings of the 2014 Tenth International Conference on Signal-Image Technology andInternet-Based Systems, Marrakech, Morocco, 23–27 November 2014; pp. 592–597.
72. Jiang, Z.; Yepez, J.; An, S.; Ko, S. Fast, accurate and robust retinal vessel segmentation system.Biocybern. Biomed. Eng. 2017, 37, 412–421. [CrossRef]
73. Dizdaro, B.; Ataer-Cansizoglu, E.; Kalpathy-Cramer, J.; Keck, K.; Chiang, M.F.; Erdogmus, D. Level setsfor retinal vasculature segmentation using seeds from ridges and edges from phase maps. In Proceedingsof the 2012 IEEE International Workshop on Machine Learning for Signal Processing, Santander, Spain,23–26 September 2012; pp. 1–6.
74. Jin, Z.; Zhaohui, T.; Weihua, G.; Jinping, L. Retinal vessel image segmentation based on correlational openactive contours model. In Proceedings of the 2015 Chinese Automation Congress (CAC), Wuhan, China,27–29 November 2015; pp. 993–998.
75. Gongt, H.; Li, Y.; Liu, G.; Wu, W.; Chen, G. A level set method for retina image vessel segmentation based onthe local cluster value via bias correction. In Proceedings of the 2015 8th International Congress on Imageand Signal Processing (CISP), Shenyang, China, 14–16 October 2015; pp. 413–417.
76. Jiang, X.; Mojon, D. Adaptive local thresholding by verification-based multithreshold probing withapplication to vessel detection in retinal images. IEEE Trans. Pattern Anal. Mach. Intell. 2003, 25, 131–137.[CrossRef]
77. Akram, M.U.; Tariq, A.; Khan, S.A. Retinal image blood vessel segmentation. In Proceedings of the 2009International Conference on Information and Communication Technologies, Doha, Qatar, 15–16 August2009; pp. 181–192.
78. Christodoulidis, A.; Hurtut, T.; Tahar, H.B.; Cheriet, F. A multi-scale tensor voting approach for smallretinal vessel segmentation in high resolution fundus images. Comput. Med. Imaging Graph. 2016, 52, 28–43.[CrossRef] [PubMed]
79. Nekovei, R.; Ying, S. Back-propagation network and its configuration for blood vessel detection inangiograms. IEEE Trans. Neural Netw. 1995, 6, 64–72. [CrossRef] [PubMed]
80. Salem, S.A.; Salem, N.M.; Nandi, A.K. Segmentation of retinal blood vessels using a novel clusteringalgorithm. In Proceedings of the 2006 14th European Signal Processing Conference, Florence, Italy,4–8 September 2006; pp. 1–5.
81. Xie, S.; Nie, H. Retinal vascular image segmentation using genetic algorithm Plus FCM clustering.In Proceedings of the 2013 Third International Conference on Intelligent System Design and EngineeringApplications (ISDEA), Hong Kong, China, 16–18 January 2013; pp. 1225–1228.
82. Akhavan, R.; Faez, K. A Novel Retinal Blood Vessel Segmentation Algorithm using Fuzzy segmentation.Int. J. Electr. Comput. Eng. 2014, 4, 561. [CrossRef]
83. Emary, E.; Zawbaa, H.M.; Hassanien, A.E.; Schaefer, G.; Azar, A.T. Retinal vessel segmentation based onpossibilistic fuzzy c-means clustering optimised with cuckoo search. In Proceedings of the 2014 InternationalJoint Conference on Neural Networks (IJCNN), Beijing, China, 6–11 July 2014; pp. 1792–1796.
84. Maji, D.; Santara, A.; Ghosh, S.; Sheet, D.; Mitra, P. Deep neural network and random forest hybridarchitecture for learning to detect retinal vessels in fundus images. In Proceedings of the 2015 37th AnnualInternational Conference of the IEEE Engineering in Medicine and Biology Society (EMBC), Milan, Italy,25–29 August 2015; pp. 3029–3032.
85. Sharma, S.; Wasson, E.V. Retinal Blood Vessel Segmentation Using Fuzzy Logic. J. Netw. Commun.Emerg. Technol. 2015, 4. [CrossRef]
86. Roy, A.G.; Sheet, D. DASA: Domain Adaptation in Stacked Autoencoders using Systematic Dropout.arXiv 2016.
87. Lahiri, A.; Roy, A.G.; Sheet, D.; Biswas, P.K. Deep neural ensemble for retinal vessel segmentationin fundus images towards achieving label-free angiography. In Proceedings of the 2016 38th AnnualInternational Conference of the IEEE Engineering in Medicine and Biology Society (EMBC), Orlando, FL,USA, 16–20 August 2016; pp. 1340–1343.
88. Maji, D.; Santara, A.; Mitra, P.; Sheet, D. Ensemble of deep convolutional neural networks for learning todetect retinal vessels in fundus images. arXiv 2016.
89. Liskowski, P.; Krawiec, K. Segmenting Retinal Blood Vessels With Deep Neural Networks. IEEE Trans.Med. Imaging 2016, 35, 2369–2380. [CrossRef] [PubMed]

Appl. Sci. 2018, 8, 155 30 of 31
90. Fraz, M.M.; Remagnino, P.; Hoppe, A.; Uyyanonvara, B.; Rudnicka, A.R.; Owen, C.G.; Barman, S.A.An ensemble classification-based approach applied to retinal blood vessel segmentation. IEEE Trans.Biomed. Eng. 2012, 59, 2538–2548. [CrossRef] [PubMed]
91. Dasgupta, A.; Singh, S. A Fully Convolutional Neural Network based Structured Prediction ApproachTowards the Retinal Vessel Segmentation. arXiv 2016.
92. Huiqi, L.; Hsu, W.; Mong Li, L.; Tien Yin, W. Automatic grading of retinal vessel caliber. IEEE Trans.Biomed. Eng. 2005, 52, 1352–1355.
93. Yu, H.; Barriga, S.; Agurto, C.; Nemeth, S.; Bauman, W.; Soliz, P. Automated retinal vessel type classificationin color fundus images. Proc. SPIE 2013, 8670. [CrossRef]
94. Ma, Z.; Li, H. Retinal vessel profiling based on four piecewise Gaussian model. In Proceedings of the 2015IEEE International Conference on Digital Signal Processing (DSP), Singapore, 21–24 July 2015; pp. 1094–1097.
95. Zhu, T. Fourier cross-sectional profile for vessel detection on retinal images. Comput. Med. Imaging Graph.2010, 34, 203–212. [CrossRef] [PubMed]
96. Lenskiy, A.A.; Lee, J.S. Rugged terrain segmentation based on salient features. In Proceedings of the ICCAS2010, Gyeonggi-do, Korea, 27–30 October 2010; pp. 1737–1740.
97. Salem, N.M.; Nandi, A.K. Unsupervised Segmentation of Retinal Blood Vessels Using a Single ParameterVesselness Measure. In Proceedings of the 2008 Sixth Indian Conference on Computer Vision,Graphics & Image Processing, Bhubaneswar, India, 16–19 December 2008; pp. 528–534.
98. Roerdink, J.B.; Meijster, A. The watershed transform: Definitions, algorithms and parallelization strategies.Fundam. Inform. 2000, 41, 187–228.
99. Serra, J. Image Analysis and Mathematical Morphology, v. 1; Academic Press: Cambridge, MA, USA, 1982.100. Lindeberg, T. Scale-space theory: A basic tool for analyzing structures at different scales. J. Appl. Stat. 1994,
21, 225–270. [CrossRef]101. Babaud, J.; Witkin, A.P.; Baudin, M.; Duda, R.O. Uniqueness of the Gaussian Kernel for Scale-Space Filtering.
IEEE Trans. Pattern Anal. Mach. Intell. 1986, PAMI-8, 26–33.102. Lindeberg, T. Scale-Space Theory in Computer Vision; Springer Science & Business Media: New York, NY, USA,
2013; Volume 256.103. Burt, P.; Adelson, E. The Laplacian Pyramid as a Compact Image Code. IEEE Trans. Commun. 1983, 31,
532–540. [CrossRef]104. Crowley, J.L.; Parker, A.C. A Representation for Shape Based on Peaks and Ridges in the Difference of
Low-Pass Transform. IEEE Trans. Pattern Anal. Mach. Intell. 1984, PAMI-6, 156–170.105. Klinger, A. Patterns and search statistics. Optim. Methods Stat. 1971, 3, 303–337.106. Tankyevych, O.; Talbot, H.; Dokladal, P. Curvilinear morpho-Hessian filter. In Proceedings of the 2008 5th
IEEE International Symposium on Biomedical Imaging: From Nano to Macro, Paris, France, 14–17 May 2008;pp. 1011–1014.
107. Frangi, A.F.; Niessen, W.J.; Vincken, K.L.; Viergever, M.A. Multiscale vessel enhancement filtering.In International Conference on Medical Image Computing and Computer-Assisted Intervention; Springer:Berlin/Heidelberg, Germany, 1998; pp. 130–137.
108. Albrecht, T.; Lüthi, M.; Vetter, T. Deformable models. Encycl. Biometr. 2015, 337–343.109. McInerney, T.; Terzopoulos, D. Deformable models in medical image analysis: A survey. Med. Image Anal.
1996, 1, 91–108. [CrossRef]110. Caselles, V.; Kimmel, R.; Sapiro, G. Geodesic active contours. Int. J. Comput. Vis. 1997, 22, 61–79. [CrossRef]111. Sethian, J.A. Analysis of Flame Propagation; LBL-14125; Lawrence Berkeley Lab.: Berkeley, CA, USA; p. 139.112. Sethian, J.A. Curvature and the evolution of fronts. Commun. Math. Phys. 1985, 101, 487–499. [CrossRef]113. Foracchia, M.; Grisan, E.; Ruggeri, A. Luminosity and contrast normalization in retinal images.
Med. Image Anal. 2005, 9, 179–190. [CrossRef] [PubMed]114. Kingsbury, N. The dual-tree complex wavelet transform: A new efficient tool for image restoration and
enhancement. In Proceedings of the 9th European Signal Processing Conference (EUSIPCO 1998), Rhodes,Greece, 8–11 September 1998; pp. 1–4.
115. Nguyen, U.T.V.; Bhuiyan, A.; Park, L.A.F.; Ramamohanarao, K. An effective retinal blood vessel segmentationmethod using multi-scale line detection. Pattern Recognit. 2013, 46, 703–715. [CrossRef]
Appl. Sci. 2018, 8, 155 31 of 31
116. Van Antwerpen, G.; Verbeek, P.; Groen, F. Automatic counting of asbestos fibres. In Proceedings of the SignalProcessing III: Theories and Applications: Proceedings of EUSIPCO-86, Third European Signal ProcessingConference, The Hague, The Netherlands, 2–5 September 1986; pp. 891–896.
117. Medioni, G.; Lee, M.-S.; Tang, C.-K. A Computational Framework for Segmentation and Grouping; Elsevier:Holland, The Netherlands, 2000.
118. Medioni, G.; Kang, S.B. Emerging Topics in Computer Vision; Prentice Hall PTR: Upper Saddle River, NJ,USA, 2004.
119. Arneodo, A.; Decoster, N.; Roux, S. A wavelet-based method for multifractal image analysis. I. Methodologyand test applications on isotropic and anisotropic random rough surfaces. Eur. Phys. J. B Condens. MatterComplex Syst. 2000, 15, 567–600. [CrossRef]
120. Bishop, C.M. Pattern Recognition and Machine Learning (Information Science and Statistics); Springer: New York,NY, USA, 2006.
121. Liu, J.; Sun, J.; Wang, S. Pattern recognition: An overview. Int. J. Comput. Sci. Netw. Secur. 2006, 6, 57–61.122. Skolidis, G. Transfer Learning with Gaussian Processes. Ph.D. Thesis, The University of Edinburgh,
Edinburgh, UK, 2012.123. Kochenderfer, M.J. Adaptive Modelling and Planning for Learning Intelligent Behaviour. Ph.D. Thesis,
The University of Edinburgh, Edinburgh, UK, 2006.124. Pan, S.J.; Yang, Q. A Survey on Transfer Learning. IEEE Trans. Knowl. Data Eng. 2010, 22, 1345–1359.
[CrossRef]125. Krishnapuram, R.; Keller, J.M. A possibilistic approach to clustering. IEEE Trans. Fuzzy Syst. 1993, 1, 98–110.
[CrossRef]126. Pal, N.R.; Pal, K.; Keller, J.M.; Bezdek, J.C. A possibilistic fuzzy c-means clustering algorithm. IEEE Trans.
Fuzzy Syst. 2005, 13, 517–530. [CrossRef]
© 2018 by the authors. Licensee MDPI, Basel, Switzerland. This article is an open accessarticle distributed under the terms and conditions of the Creative Commons Attribution(CC BY) license (http://creativecommons.org/licenses/by/4.0/).