Segmentation and quantification of retinal lesions in age-related macular degeneration using...
21
Segmentation and quantification of retinal lesions in age-related macular degeneration using polarization-sensitive optical coherence tomography Bernhard Baumann, Erich Götzinger, Michael Pircher, and Harald Sattmann Medical University of Vienna, Center for Medical Physics and Biomedical Engineering, Währinger Straße 13, A–1090 Vienna, Austria Christopher Schütze, Ferdinand Schlanitz, Christian Ahlers, and Ursula Schmidt-Erfurth Medical University of Vienna, Department of Ophthalmology, Währinger Gürtel 18-20, A–1090 Vienna, Austria Christoph K. Hitzenberger Medical University of Vienna, Center for Medical Physics and Biomedical Engineering, Währinger Straße 13, A–1090 Vienna, Austria Abstract We present polarization-sensitive optical coherence tomography (PS-OCT) for quantitative assessment of retinal pathologies in age-related macular degeneration (AMD). On the basis of the polarization scrambling characteristics of the retinal pigment epithelium, novel segmentation algorithms were developed that allow one to segment pathologic features such as drusen and atrophic zones in dry AMD as well as to determine their dimensions. Results from measurements in the eyes of AMD patients prove the ability of PS-OCT for quantitative imaging based on the retinal features polarizing properties. Repeatability measurements were performed in retinas diagnosed with drusen and geographic atrophy in order to evaluate the performance of the described methods. PS-OCT appears as a promising imaging modality for three-dimensional retinal imaging and ranging with additional contrast based on the structures’ tissue-inherent polarization properties. Keywords optical coherence tomography; polarization sensitive devices; medical imaging; ophthalmology; algorithms; segmentation; age-related macular degeneration 1 Introduction During the last two decades, optical coherence tomography (OCT) evolved as a noncontact technique for imaging transparent and translucent samples with micrometer-scale resolution. 1 OCT is still subject to permanent enhancements in order to increase imaging performance, and a wide range of applications has opened in biomedical imaging. 2 , 3 Mainly in ophthalmology, OCT has emerged as an indispensable tool for diagnosis of eye disease and for monitoring during therapy. 4 Recent advances in terms of sensitivity and imaging speed © 2010 Society of Photo-Optical Instrumentation Engineers. Address all correspondence to: Bernhard Baumann or Christoph Hitzenberger, Medical University of Vienna, Center for Medical Physics and Biomedical Engineering, Währinger Straße 13, A–1090 Vienna, Austria. Tel: 43-1-4277-60728; Fax: 43-1-4277-9607. [email protected] or [email protected].. Europe PMC Funders Group Author Manuscript J Biomed Opt. Author manuscript; available in PMC 2011 February 10. Published in final edited form as: J Biomed Opt. 2010 ; 15(6): 061704. doi:10.1117/1.3499420. Europe PMC Funders Author Manuscripts Europe PMC Funders Author Manuscripts
-
Upload
meduniwien -
Category
Documents
-
view
0 -
download
0
Transcript of Segmentation and quantification of retinal lesions in age-related macular degeneration using...

Segmentation and quantification of retinal lesions in age-relatedmacular degeneration using polarization-sensitive opticalcoherence tomography
Bernhard Baumann , Erich Götzinger , Michael Pircher , and Harald SattmannMedical University of Vienna, Center for Medical Physics and Biomedical Engineering, WähringerStraße 13, A–1090 Vienna, Austria
Christopher Schütze , Ferdinand Schlanitz , Christian Ahlers , and Ursula Schmidt-ErfurthMedical University of Vienna, Department of Ophthalmology, Währinger Gürtel 18-20, A–1090Vienna, Austria
Christoph K. HitzenbergerMedical University of Vienna, Center for Medical Physics and Biomedical Engineering, WähringerStraße 13, A–1090 Vienna, Austria
AbstractWe present polarization-sensitive optical coherence tomography (PS-OCT) for quantitativeassessment of retinal pathologies in age-related macular degeneration (AMD). On the basis of thepolarization scrambling characteristics of the retinal pigment epithelium, novel segmentationalgorithms were developed that allow one to segment pathologic features such as drusen andatrophic zones in dry AMD as well as to determine their dimensions. Results from measurementsin the eyes of AMD patients prove the ability of PS-OCT for quantitative imaging based on theretinal features polarizing properties. Repeatability measurements were performed in retinasdiagnosed with drusen and geographic atrophy in order to evaluate the performance of thedescribed methods. PS-OCT appears as a promising imaging modality for three-dimensionalretinal imaging and ranging with additional contrast based on the structures’ tissue-inherentpolarization properties.
Keywords
optical coherence tomography; polarization sensitive devices; medical imaging; ophthalmology;algorithms; segmentation; age-related macular degeneration
1 Introduction
During the last two decades, optical coherence tomography (OCT) evolved as a noncontacttechnique for imaging transparent and translucent samples with micrometer-scale resolution.1 OCT is still subject to permanent enhancements in order to increase imaging performance,and a wide range of applications has opened in biomedical imaging.2,3 Mainly inophthalmology, OCT has emerged as an indispensable tool for diagnosis of eye disease andfor monitoring during therapy.4 Recent advances in terms of sensitivity and imaging speed
© 2010 Society of Photo-Optical Instrumentation Engineers.
Address all correspondence to: Bernhard Baumann or Christoph Hitzenberger, Medical University of Vienna, Center for MedicalPhysics and Biomedical Engineering, Währinger Straße 13, A–1090 Vienna, Austria. Tel: 43-1-4277-60728; Fax: [email protected] or [email protected]..
Europe PMC Funders GroupAuthor ManuscriptJ Biomed Opt. Author manuscript; available in PMC 2011 February 10.
Published in final edited form as:J Biomed Opt. 2010 ; 15(6): 061704. doi:10.1117/1.3499420.
Europe P
MC
Funders A
uthor Manuscripts
Europe P
MC
Funders A
uthor Manuscripts

using spectral domain (SD) OCT allow one to record three-dimensional (3-D) data setscomprising several tens of thousands of depth profiles within a few seconds.5-7
In clinical routine, apart from 2-D imaging modalities such as fundus photography, scanninglaser ophthalmoscopy, fluorescence angiography, and fundus autofluorescence, OCT is usedfor retinal imaging in three dimensions. Since reviewing and interpretation of large 3-D datasets may be costly in terms of time and effort, several attempts have been made to ease theiranalysis. Anatomical characteristics and parameters such as retinal nerve fiber layerthickness or the macular volume can be determined from OCT data sets recorded in theposterior eye segment. Retrieval of such parameters alleviates the extraction and evaluationof possible pathological changes in ocular structures. Therefore, in recent years,segmentation of features in OCT data sets has gained particular interest.8-15 Most of theapproaches for segmentation of retinal layers are based on reflectivity dissimilarity ofdifferent tissue types. However, while the layered structure of the retina is well ordered inhealthy eyes, it is sometimes hard to differentiate structures solely based on their reflectivityin eyes with retinal disease. Nevertheless, socalled functional extensions of OCT have beenshown to provide additional contrast by being able to record not only reflectivity profiles butalso depth-resolved information about flow velocity, changes in the probe light’swavelength spectrum, or the polarization properties of tissues as in Doppler OCT,spectroscopic OCT, and polarization-sensitive (PS) OCT, respectively.16-20 In the humanretina, birefringent, polarization-preserving, and depolarizing structures can be distinguishedby PS-OCT.21-25 Recently, segmentation of the retinal pigment epithelium (RPE) wasdemonstrated by PS-OCT based on that layer’s—in contrast to most of the other layers—depolarizing character.26 Using this tissue-specific contrast, our group showed the potentialof PS-OCT to image the RPE in patients with age-related macular degeneration (AMD).27,28
AMD is a multifactoral disease that results in progressive vision loss in the central region ofthe retina (i.e., the macula). AMD is the leading cause of blindness and severe vision loss inthe industrialized world’s elderly population.29 In the early stages of the disease, metabolicendproducts accumulate in Bruch’s membrane and build up a hydrophobic barrier betweenthe posterior vascular layers and the RPE and, therewith, the retina. RPE detachments canresult from these deposits, which are called drusen.30
At late stages, AMD is classified as wet (neovascular, exudative) or dry (nonexudative)AMD. The latter branch, which accounts for 80–90% of all diagnosed patients, ischaracterized by sharply delineated areas of severe depigmentation or apparent absence ofthe RPE with a minimum diameter of 175 μm. Wet AMD—although accounting for only 10—20% of all patients—is responsible for 80% of vision loss by AMD.31 It is characterizedby RPE detachments, subretinal or sub-RPE neovascular membranes, scar tissue, subretinalhemorrhages, and related hard exudates (lipids).30
The RPE plays the key role in all types of AMD. In this paper, we demonstrate the potentialof PS-OCT as a tool for not only 3-D high-resolution retinal imaging with additionalcontrast but also for quantitative assessment of retinal disorders in AMD. On the basis of theadditional contrast provided by PS-OCT, software algorithms have been developed forquantification of clinically relevant parameters such as the area and volume of drusen andthe area of atrophic zones in geographic atrophy. After a description of the PS-OCT deviceand the segmentation algorithms in Section 2, results from measurements in patients,including a repeatability analysis, are presented in Section 3 and discussed in Section 4.
Baumann et al. Page 2
J Biomed Opt. Author manuscript; available in PMC 2011 February 10.
Europe P
MC
Funders A
uthor Manuscripts
Europe P
MC
Funders A
uthor Manuscripts
2 Materials and Methods
2.1 PS-OCT Instrument
A spectral domain PS-OCT setup was used for imaging, a scheme of which is shown in Fig.1. A superluminescent diode (Superlum Diodes, Inc.) centered at 839 nm with a FWHMbandwidth of 58 nm was used as a light source. The light was inserted into a Michelsoninterferometer in a vertically polarized state using a bulk optics polarizer. After passing apolarizing beamsplitter (PBS), the light was split into a sample and a reference beam bymeans of a nonpolarizing beamsplitter (BS). In the sample arm, a quarter wave plate (QWP)was used in order to provide circularly polarized light onto the eye. Further sample armoptics included an X-Y galvanometer scanner and a relay of two identical achromat lenses.A probe power of 700 μW on the cornea was used, which is well below the limits drawn byAmerican National Standards Institute (ANSI) and International ElectrotechnicalCommission (IEC).32,33 Half of the light beam returning from the sample arm was againdirected into the source arm. There, its horizontally polarized portion was detected by anavalanche photodiode (APD), in order to be able to record scanning laser ophthalmoscope(SLO) images using the same sample arm optics.
In the reference arm, the beam passed a variable neutral density filter, glass prisms fordispersion compensation, and was reflected by a mirror mounted on a motorized translationstage. Light returning from sample and reference arm, respectively, interfered at thenonpolarizing BS. Note that the QWP present in the reference arm of the original PSinterferometer scheme devised by Hee et al.19 was omitted in our design in order to avoidsaturation of the APD by light returning from the reference mirror. This altered layoutrequired an additional half-wave plate (HWP) oriented at 22.5 deg in the detection arm,which rotated the beam’s polarization state by 45 deg in front of the PBS in the detectionarm, such that equal reference arm power was provided in both orthogonal polarizationchannels. In a software compensation step, this rotation was compensated for by multiplyingthe OCT signals from the two channels with the Jones matrix of a HWP oriented at −45 deg.Now, the previously published method for computing PS-OCT signals could be applied.34
From the interferometer exit, the signals of the two orthogonal polarization channels wereguided to two identical spectrometer units employing diffraction gratings with 1200 lines/mm and achromat lenses (f = 200 mm). The spectral interference signals were read outsimultaneously at two line-scan cameras (e2v AViiVA M2 CL 2014) operating at 20 kHz.Each readout of the two cameras yielded the spectral data necessary to compute not onlyreflectivity but also phase retardation, axis orientation, and Stokes vectors for one depthprofile.
Two operational modes were available for imaging, which were timed and controlled usinga field-programmable gate array (FPGA). For alignment of the eye under investigation, SLOimages and OCT B-scan images were recorded and displayed in an alternate fashion toprovide an overview in three dimentions. SLO and OCT images were recorded in 165 and20 ms, respectively. In the real-time display, each SLO image was followed by four OCTimages. Once the eye was aligned properly, 3-D data sets covering a retinal cube of6.2×6.7×3.3 mm3 (x×y×z) were recorded. One out of three sampling patterns (64×1024,128×512, 256×256) could be selected. For this study, only data sets sampled 128×512 (thatis, 128 B-scans each consisting of 512 A-lines) were used.
The system was used for imaging in the eyes of patients suffering from various oculardiseases. Compliant patients diagnosed with drusen and advanced dry AMD (geographicatrophy), respectively, were selected and imaged for this study. The study protocol was
Baumann et al. Page 3
J Biomed Opt. Author manuscript; available in PMC 2011 February 10.
Europe P
MC
Funders A
uthor Manuscripts
Europe P
MC
Funders A
uthor Manuscripts

approved by the ethics committee of the Medical University of Vienna and followed thetenets of the declaration of Helsinki.
2.2 Degree of Polarization Uniformity
Segmentation of the RPE was performed based on its depolarizing (i.e., polarizationscrambling), character as reported in Ref. 26. For each B-scan, the signals recorded at thetwo exits of the PS-OCT instrument were processed using regular SD-OCT processing,including subtraction of an averaged spectrum, rescaling, numerical dispersioncompensation, and Fourier transform.35 From the resulting signals, I1,2(z) = A1,2(z)exp[iΦ1,2(z)], the Stokes vector S = (I Q U V)T was computed for each image pixel. In orderto gate out noisy pixels, for further processing, only pixels with intensities above a depth-dependent threshold Ithr(z) = Ithr(z = 0 μm) −z·1.7×10⁻³ dB/μm were considered. Ithr(z = 0μm) was set to a value of ~11 dB above a level equal to two standard deviations of theaverage noise amplitude in each A-scan.36
Each of the Stokes vector elements Q, U, and V was normalized by I and then averaged in asliding window sized 8(x)×5(z) pixels (~100×16 μm2). Thereof, the degree of polarizationuniformity (DOPU) was calculated as
(1)
DOPU has a form similar to the degree of polarization known from conventionalpolarization optics. Dependent on the uniformity (or nonuniformity) of the polarizationstates of pixels inside of the respective evaluation window, DOPU values will exhibit valuesin the range from 0 to 1. DOPU values close to 1 will be found in polarization preservingand in birefringent structures whereas polarization scrambling (depolarization) will manifestin lower DOPU values.
Now, from each DOPU B-scan image, depolarizing structures can be derived by segmentingpixels with low DOPU values, that is, pixels with DOPU values below a threshold DOPUthr.Segmentation results may vary, depending on the choice of DOPUthr, and the optimalDOPUthr value can be different, depending on the respective eye and on the image quality.For the results and figures in this paper, a fixed value of 0.8 was chosen for DOPUthr.
Figure 2 shows PS-OCT B-scan images of a human retina in the fovea region of a healthyvolunteer’s left eye. In Fig. 2(a), the reflectivity B-scan image is displayed where healthylayers can be distinguished based on the intensity of backscattered light. The respectiveDOPU image is shown in Fig. 2(b). While most layers—those appearing in reddish color—do not considerably alter the sample beam’s polarization state, polarization-scramblingmanifests in lower DOPU values displayed in green and blue. Note that, due to thecomputation of DOPU by averaging in a sliding evaluation window, the spatial resolution issomewhat reduced in this image. By considering only pixels with low DOPU values,depolarizing structures can be segmented as shown in Fig. 2(c), where low-DOPU-valuedpixels are overlaid in red. In Fig. 2(d), the position of the internal limiting membrane (ILM),which was found by intensity thresholding, is overlaid on the reflectivity image in blue.Furthermore, the position of the pixel with the lowest DOPU value in each A-line (i.e., thepixel exhibiting the highest depolarization), which in the healthy retina is located in theRPE, is displayed in red. A fundus image computed from the OCT data set by axialsummation of the intensity for each A-line is shown in Fig. 2(e), and in Fig. 2(f), a retinalthickness map derived by calculating the axial distance between ILM and RPE position canbe seen. An average refractive index of 1.38 was assumed in the retina.
Baumann et al. Page 4
J Biomed Opt. Author manuscript; available in PMC 2011 February 10.
Europe P
MC
Funders A
uthor Manuscripts
Europe P
MC
Funders A
uthor Manuscripts
2.3 Segmentation of Drusen
Drusen were segmented by first locating the actual position of the RPE by its DOPU value.This line, found by tissue-specific contrast, acts as a “backbone” for the followingcalculation of the position where the RPE should be in a healthy eye. Finally, the drusen aresegmented and quantified by calculating the difference between the actual position and thenormal “should-be” position.
For each B-scan, the starting point of the calculation is the axial position ZRPE(i) of theminimum DOPU value in each A-line, that is, the red line in Fig. 2(d). The index i indicatesthe index of the A-line in the respective B-scan and ZRPE(i) is measured as the distance fromthe zero delay, which is located at the upper border of all shown B-scan images, and ZRPE(i)increases in the posterior direction. First, missing values of ZRPE(i) are interpolated in A-scans, where no pixel is below the threshold DOPUthr. Then, outliers of ZRPE(i) are cut andinterpolated. Outliers are defined as values ZRPE(i), which differ by >33 μm (i.e., 10 pixels)either from the mean of ZRPE(i − 1) and ZRPE(i − 1) or from the mean of ZRPE(i + 1) andZRPE(i + 2), or from both. If ZRPE(i) is an outlier, then ZRPE(i) is replaced by the average ofits four neighbouring values ZRPE(i + m), where m = −2, −1, +1, +2. The subsequentfunction is smoothed using a Savitzky–Golay filter (polynomial order: 3, filter length: 6).
The result of these first steps is a function without gaps or outliers. The followingpart of the computation is an iterative approximation of the normal RPE position. Everyiteration of the loop comprises two steps: In the first step, the output Bj−1 of the previousloop iteration is used as an input. For the first iteration, the input A0(i) = maxi ZRPE(i) ∀i isused. Now,
(2)
where Δzpix is the axial extension of one pixel (~3.2 μm, and optical distance) j [1,175] isthe respective iteration number of the loop. The offset 10Δzpix was chosen to compensatefor flattening effect of the subsequent smoothing step.
The new function A j is used in the following second step to compute the output Bj:
(3)
where a smoothing Savitzky–Golay (SG) filter is represented with a window length of 200using a third-order polynomial. As the loop is iterated 175 times, Bj converges toward asmooth function resembling the normal RPE position. As a final point, B175 + 10Δzpixyields the final function ZNRPE. Here, the off-set 10Δzpix accommodates for an axial shift ofthe smoothed function B175.
Drusen can now be found by computing the difference between actual RPE position ZRPEand normal RPE position ZNRPE for each A-line. In the case of very large drusen ordrusenoid pigment epithelium detachments in retinas appearing heavily bent in the OCT B-scan image, ZNRPE may be displaced in anterior direction (i.e., between the actual positionof Bruch’s membrane and the RPE). This will not affect the calculated drusen area, but thevolume may be underestimated. We observed this effect in confluent drusen with a diameterof ~3 mm. For the results presented in this study, which included patients with drusenclassified as AREDS score 2 and 3, this effect was not apparent.
Baumann et al. Page 5
J Biomed Opt. Author manuscript; available in PMC 2011 February 10.
Europe P
MC
Funders A
uthor Manuscripts
Europe P
MC
Funders A
uthor Manuscripts

2.4 Segmentation of Geographic Atrophy
Using PS-OCT, atrophic zones in dry AMD can be detected by detecting holes in thedepolarizing RPE layer.
In a straightforward manner, one could simply sum the number of depolarizing pixels [i.e.,the red pixels in Fig. 2(c)] for each A-line of a 3-D PS-OCT data set. The resulting thicknessmap of the depolarizing layer now reveals the existence and absence of polarizationscrambling tissue in an en face view.
However, depending on the subject’s pigmentation, depolarization may also be apparent inthe choroid. Signals from this layer usually are rather weak when the probe beam anteriorlyhas to penetrate the highly scattering and absorbing RPE. Contrarily, in eyes withgeographic atrophy, the missing RPE usually results in higher penetration depths(sometimes down to the sclera) and in stronger OCT signals from the choroid. Dependent onthe subject, choroidal tissue exhibits a more or less polarization scrambling character. Insome cases, depolarizing spots with DOPU values as low as those in RPE tissue may benoticeable. If, in such eyes, the number of all depolarizing pixels is integrated over depth inorder to compute a thickness map of the RPE, then polarization scrambling pixels in thechoroid may add to those in the RPE. This can result in mimicking of healthy structures andmasking of RPE defects, if the RPE is absent or thinned as in the case of geographicatrophy.
To prevent from integrating choroidal pixels into computing of the thickness map of thedepolarizing layer, only depolarizing pixels located in a shallow band close to thephotoreceptor layer and Bruch’s membrane should be contributing.
For this purpose, the ILM position is used as a starting point. The initial ILM position issmoothed similar to the RPE position in the previous section by using a third-order
polynomial SG filter with a window length of 200, yielding the function . Now, starting
from positions , hyperintense structures are detected by seeking thefirst pixel with an intensity greater than the threshold computed as the average of themaximum pixel values of each A-line minus 7 dB. Typically, the positions in thephotoreceptor/RPE complex or Bruch’s membrane are detected. Subsequently,discontinuities are interpolated and, similar to the iterative approximation of the normal RPEposition in drusen described above, a smooth function is computed to closely fit to itsposterior border. This resulting smooth function is used as the spine of the evaluation band,which extends 15 Δzpix in the anterior and posterior directions. This width ensures thatdepolarizing spots in the choroid are excluded from the band, yet allowing for smallirregularities of the axial RPE position such as small drusen because they are being found indry AMD.
By summing the number of depolarizing pixels within the evaluation band along each A-line, an RPE thickness map is generated. In order to assess the size of atrophic zones, thethickness map is binarized and smoothed by removing isolated pixels using an erosion filter.In a last step, the algorithm automatically detects patches of connected pixels, which cannow be converted into atrophic areas by scaling them with the known pixel area.
3 Results
3.1 Drusen
Figure 3 shows results from drusen segmentation in a PS-OCT data set recorded in the righteye of a female patient at age 70. Reflectivity B-scan images are shown in Figs. 3(a) and
Baumann et al. Page 6
J Biomed Opt. Author manuscript; available in PMC 2011 February 10.
Europe P
MC
Funders A
uthor Manuscripts
Europe P
MC
Funders A
uthor Manuscripts

3(b). In Figs. 3(c) and 3(d), an overlay of the segmented ILM and RPE as well as of thecomputed normal RPE position is displayed in blue, red, and green color, respectively. Thefundus projection image is shown in Fig. 3(e); the positions of the B-scans shown in Figs.3(a)–3(d) are indicated by red arrows. A retinal thickness map computed as the axialdistance between ILM and segmented actual RPE position is shown in Fig. 3(f), while forthe thickness map in Fig. 3(h), the axial distance between ILM and the approximated normalRPE position were used. In these maps, single pixels exhibiting thickness values of >150pixels (corresponding to a retinal thickness of 350 μm) were linearly interpolated betweenneighboring pixels with values of <350 μm. Finally, a drusen thickness map displaying theaxial deviation of the actual RPE position from the computed normal RPE position is shownin Fig. 3(g). Deviation values of <8 pixels (25.6 μm) were tolerated as small variations ofthe axial DOPUmin-position within the RPE layer and are displayed gray.
From the drusen thickness map [Fig. 3(g)], drusen dimensions can be assessedquantitatively. Namely, their area and volume can be computed from the known area of apixel in the en face image [~12.5(x)×50.2(y) ≈ 630 μm2] and the axial extension of onevoxel (~3.2 μm, optical distance). For the data set shown in Fig. 3, the total area of drusen inthe scanned region of the retina was calculated to be 5.527 mm2 with a volume of 0.188mm3. An average refractive index of 1.38 was assumed for drusen volume computation.
3.2 Geographic Atrophy
Results from applying the segmentation algorithms to the right eye of an 80-year-old femalepatient diagnosed with dry AMD are shown in Fig. 4. In Fig. 4(a), an en face fundus imagecomputed from the 3-D data set is shown. The red arrows indicate the position of thereflectivity B-scans of Figs. 4(b) and 4(c). In Figs. 4(d) and 4(e), an overlay of depolarizingstructures inside and outside of the evaluation band is shown in red and green, respectively.The retinal thickness computed as axial distance between ILM and DOPUmin position ismapped in Fig. 4(f). In the map shown Fig. 4(g), the overall thickness of depolarizing tissue[i.e., red and green pixels in Figs. 4(d) and 4(e)] is displayed, while for the thickness map ofFig. 4(h), only depolarizing pixels within the evaluation band (i.e., the red pixels in the B-scan images) were considered as the depolarizing layer. After processing this image asdescribed in Section 2.4, two atrophic zones, sized 0.570 and 3.841 mm2, were foundautomatically. Zones that were connected to the image border [cf. lower left and right cornerof Fig. 4(j)] were excluded by the algorithm from the calculation of the total area. The totalarea of geographic atrophy was 4.412 mm2 for this data set.
3.3 Repeatability of Assessed Pathology Dimensions
In order to check the repeatability of the areas and volumes determined for drusen andatrophic zones, respectively, repeated measurements during a single visit were performed inseveral patients. Five data sets each, from seven eyes diagnosed with drusen and from fiveeyes diagnosed with geographic atrophy were evaluated. For both the drusen and geographicatrophy data sets, a fixed value of DOPUthr = 0.8 was chosen for RPE segmentation. Forevery eye diagnosed with drusen, the drusen thickness maps were registered and cropped tothe same retinal section using the OCT fundus image and Image J. Then, the area andvolume of drusen were computed and analyzed. In the case of geographic atrophy, only suchatrophic zones were integrated into area calculation that did not exceed the OCT device’sscan area in all of the five maps. For that reason, one atrophic zone was excluded in one ofthe investigated eyes.
Results from repeatability measurements can be found in Tables 1 and 2 as well as in Figs. 5and 6 for drusen, and in Table 3 and Fig. 7 for the evaluation of geographic atrophysegmentation. Drusen areas in the range of 3.225–9.802 mm2 were measured. The average
Baumann et al. Page 7
J Biomed Opt. Author manuscript; available in PMC 2011 February 10.
Europe P
MC
Funders A
uthor Manuscripts
Europe P
MC
Funders A
uthor Manuscripts

area was 5.735 mm2. Measured areas varied by 0.169–0.721 mm2 [standard deviation (sd)]with a mean variation of 0.419 mm2. The coefficient of variation (sd/mean) was in average0.077, ranging from 0.032 to 0.126. For the same eyes, drusen volumes ranging from 0.084to 0.456 mm3 (mean value = 0.211 mm3; mean sd = 0.014 mm3) were observed. Variationsbetween 0.007 and 0.023 mm3 (sd) were computed. The average coefficient of variation wasdetermined to be 0.075 (range: 0.040–0.107).
Segmentation of geographic atrophy yielded areas between 0.620 and 7.788 mm2 (meanvalue = 3.132 mm2, mean sd = 0.326 mm2). The variation of determined areas resulted instandard deviations in the range of 0.056–0.979 mm2 and in coefficients of variationbetween 0.036 and 0.140, with an average of 0.092.
The box plots shown in Figs. 5-7 illustrate the distribution of measured values. The upperand lower edges of the box indicate the 25 and 75% quartile, whereas the whiskers show theminimum and maximum of the measured areas and volumes, respectively. The bar inside thebox represents the median.
4 Discussion
In the results shown in Section 3, the performance of the introduced segmentationalgorithms may be appreciated. Although the method seems to perform well in the eyesshown in Figs. 3 and 4, the repeatability measurements show variability values of 7.7 and7.5% for determined drusen areas and volumes, and a coefficient of variation of 9.2% forareas of geographic atrophy. These variations correspond to 1% (661 pixels) and 0.8% (514pixels) of the total scanned area for drusen area and geographic atrophy segmentation,respectively. In the case of drusen volume assessment, the COV of 7.5% corresponds to0.01% (6702 voxels) of the total scanned volume. We believe that these variations aremainly due to eye motion during the measurement. For the PS-OCT instrument used for thisstudy, it takes roughly 3.3 s to record one 3-D data set. Any fixation instability and(transverse) eye motion during that period will inevitably result in distortion of thereconstructed en face images, such as OCT fundus images, drusen thickness maps, orthickness maps of depolarizing tissue. Hence, any quantitative data, such as areas orvolumes retrieved from these maps, will be affected. In order to increase repeatability evenmore, either transverse eye motion has to be compensated for or acquisition speed has to beincreased. Transverse motion compensation (especially along the slow scanning Y direction)may be achieved for instance by registering the recorded 3-D OCT data to SLO images fromthe same fundus region during postprocessing, because SLO images can be recorded muchfaster than 3-D OCT data sets. A hardware solution for transverse motion compensationwould be using a retinal tracker for stabilizing the probe beam with respect to the retinaunder investigation.37 Recent developments in light source and data-acquisition technologyhave enabled line rates of several 100,000 A-lines per second, which is more than 10 timesthe line rate of the PS-OCT instrument we used, which can further reduce motion artifacts.38,39 However, even the variation of geographic atrophy area determined from ourrepeatability measurements [i.e., ~0.33 mm2 (cf. Table 3)] is still significantly smaller thanthe area growth rate of 1.52 mm2/yr and 4.57 mm2/2yr determined by using FAF and fundusphotography reported in literature.40,41
One advantage of PS-OCT–based segmentation as compared to—clinically eshablished—imaging modalities, such as fundus photography, FAF, or scanning laser polarimetry, is itsability for depth-resolved imaging. Although all of the aforementioned techniques haveproven to be able to image and discriminate pigmented structures, the images will only bethe results of a depth integration. Therefore, signals from structures lying on each other willadd in the resulting image, which can lead to masking or mimicking of pathology as well as
Baumann et al. Page 8
J Biomed Opt. Author manuscript; available in PMC 2011 February 10.
Europe P
MC
Funders A
uthor Manuscripts
Europe P
MC
Funders A
uthor Manuscripts

to misinterpretation of retinal features. In contrast, PS-OCT enables discrimination andlocalization of pigmented structures like the RPE in three dimensions.
It also must be pointed out that, although the area and volume data presented in this papershowed the overall pathology areas and volumes in the respective 3-D data set, the drusenand geographic atrophy maps could also be used to assess the dimensions of single featuressuch as individual druses or atrophic patches.
The results presented in this study were based on two-dimensionally operating segmentationalgorithms; that is, segmentation of the RPE was performed B-scan by B-scan. Evaluation inthree dimensions could even improve segmentation results because they would enable one toapply smaller evaluation kernels for DOPU computation as well as probably even smootherarea and volume assessment in three dimensions. Such further improvements of thesegmentation algorithms might also increase data-evaluation speed. Currently, using a state-of-the-art personal computer (Intel Core 2 Quad processor, 4×2.50 GHz, 4 GB RAM,Windows XP) data evaluation from raw data to saving PS-OCT B-scan images and mapstakes ~1.4 and ~2.3 s per B-scan for segmenting and evaluating drusen and geographicatrophy, respectively (including loading data from a USB hard drive).
5 Conclusion
In this paper, we presented new applications of PS-OCT for segmentation and quantitativeassessment of retinal pathologies in AMD. Area and volume of macular drusen weredetermined as well as areas of atrophic zones in late stage dry AMD. The segmentationalgorithms were based on the polarization scrambling characteristics of the RPE, whichallows distinguishing this layer from other retinal layers. The assessed pathology dimensionsshowed good repeatability and, once again, presented PS-OCT as a versatile method forophthalmic imaging. PS-OCT might be a promising technique for imaging of retinalpathology in everyday ophthalmology.
Acknowledgments
The authors thank Martin Wurm and David Stifter at RECENDT GmbH as well as Christoph Wölfl at the MedicalUniversity of Vienna for their excellent technical support. Financial support by the Austrian Science Fund (FWFGrant No. P19624-B02) and from the European Union project FUN OCT (FP7 HEALTH, Contract No. 201880) isgratefully acknowledged.
References
1. Huang D, Swanson EA, Lin CP, Schuman JS, Stinson WG, Chang W, Hee MR, Flotte T, GregoryK, Puliafito CA, Fujimoto JG. Optical coherence tomography. Science. 1991; 254:1178–1181.[PubMed: 1957169]
2. Drexler, W.; Fujimoto, JG. Optical Coherence Tomography—Technology and Applications.Springer; Berlin: 2008.
3. Fercher AF, Drexler W, Hitzenberger CK, Lasser T. Optical coherence tomography—principles andapplications. Rep. Prog. Phys. 2003; 66:239–303.
4. Drexler W, Fujimoto JG. State-of-the-art retinal optical coherence tomography. Prog. Ret. Eye Res.2008; 27:45–88.
5. Leitgeb RA, Hitzenberger CK, Fercher AF. Performance of Fourier domain vs. time domain opticalcoherence tomography. Opt. Express. 2003; 11:889–894. [PubMed: 19461802]
6. de Boer JF, Cense B, Park BH, Pierce MC, Tearney GJ, Bouma BE. Improved signal to noise ratioin spectral domain compared with time domain optical coherence tomography. Opt. Lett. 2003;28:2067–2069. [PubMed: 14587817]
Baumann et al. Page 9
J Biomed Opt. Author manuscript; available in PMC 2011 February 10.
Europe P
MC
Funders A
uthor Manuscripts
Europe P
MC
Funders A
uthor Manuscripts

7. Choma MA, Sarunic MV, Yang C, Izatt JA. Sensitivity advantage of swept source and Fourierdomain optical coherence tomography. Opt. Express. 2003; 11:2183–2189. [PubMed: 19466106]
8. Koozekanani D, Boyer K, Roberts C. Retinal thickness measurements from optical coherencetomography using a Markov boundary model. IEEE Trans. Med. Imaging. 2001; 20:900–916.[PubMed: 11585207]
9. Ishikawa H, Stein DM, Wollstein G, Beaton S, Fujimoto JG, Schuman JS. Macular segmentationwith optical coherence tomography. Invest. Ophthalmol. Vis. Sci. 2005; 46:2012–2017. [PubMed:15914617]
10. Mujat M, Chan RC, Cense B, Park BH, Joo C, Akkin T, Chen TC, de Boer JF. Retinal nerve fiberlayer thickness map determined from optical coherence tomography images. Opt. Express. 2005;13:9480–9491. [PubMed: 19503151]
11. Szkulmowski M, Wojtkowski M, Sikorski B, Bajraszewski T, Srinivasan VJ, Szkulmowska A,Kaluzny JJ, Fujimoto JG, Kowalczyk A. Analysis of posterior retinal layers in spectral opticalcoherence tomography images of the normal retina and retinal pathologies. J. Biomed. Opt. 2007;12:041207. [PubMed: 17867796]
12. Fernandez DC, Salinas HM, Puliafito CA. Automated detection of retinal layer structures onoptical coherence tomography images. Opt. Express. 2005; 13:10200–10216. [PubMed:19503235]
13. Baroni M, Fortunato P, Torre AL. Towards quantitative analysis of retinal features in opticalcoherence tomography. Med. Eng. Phys. 2007; 29:432–441. [PubMed: 16860587]
14. Fabritius T, Makita S, Miura M, Myllyl̈a R, Yasuno Y. Automated segmentation of the macula byoptical coherence tomography. Opt. Express. 2009; 17:15659–15669. [PubMed: 19724565]
15. Mishra A, Wong A, Bizheva K, Clausi DA. Intra-retinal layer segmentation in optical coherencetomography images. Opt. Express. 2009; 17:23719–23728. [PubMed: 20052083]
16. Wang XJ, Milner TE, Nelson JS. Characterization of fluid flow velocity by optical Dopplertomography. Opt. Lett. 1995; 20:1337–1339. [PubMed: 19859518]
17. Chen Z, Milner TE, Dave D, Nelson JS. Optical Doppler tomographic imaging of fluid flowvelocity in highly scattering media. Opt. Lett. 1997; 22:64–66. [PubMed: 18183104]
18. Morgner U, Drexler W, Kärtner FX, Li XD, Pitris C, Ippen EP, Fujimoto JG. Spectroscopic opticalcoherence tomography. Opt. Lett. 2000; 25:111–113. [PubMed: 18059799]
19. Hee MR, Huang D, Swanson EA, Fujimoto JG. Polarization sensitive low coherence reflectometerfor birefringence characterization and ranging. J. Opt. Soc. Am. B. 1992; 9:903–908.
20. de Boer JF, Milner TE, van Gemert MJC, Nelson JS. Two-dimensional birefringence imaging inbiological tissue by polarization-sensitive optical coherence tomography. Opt. Lett. 1997; 22:934–936. [PubMed: 18185711]
21. Cense B, Chen TC, Hyle Park B, Pierce MC, de Boer JF. Thickness and birefringence of healthyretinal nerve fiber layer tissue measured with polarization-sensitive optical coherence tomography.Invest. Ophthalmol. Vis. Sci. 2004; 45:2606–2612. [PubMed: 15277483]
22. Pircher M, Götzinger E, Leitgeb R, Sattmann H, Findl O, Hitzenberger CK. Imaging ofpolarization properties of human retina in vivo with phase resolved transversal PS-OCT. Opt.Express. 2004; 12:5940–5951. [PubMed: 19488235]
23. Pircher M, Götzinger E, Findl O, Michels S, Geitzenauer W, Leydolt C, Schmidt-Erfurth U,Hitzenberger CK. Human macula investigated in vivo with polarization sensitive optical coherencetomography. Invest. Ophthalmol. Vis. Sci. 2006; 47:5487–5494. [PubMed: 17122140]
24. Yamanari M, Miura M, Makita S, Yatagai T, Yasuno Y. Phase retardation measurement of retinalnerve fiber layer by polarization-sensitive spectral-domain optical coherence tomography andscanning laser polarimetry. J. Biomed Opt. 2008; 13:014013. [PubMed: 18315371]
25. Götzinger E, Pircher M, Baumann B, Ahlers C, Geitzenauer W, Schmidt-Erfurth U, HitzenbergerCK. Three-dimensional polarization sensitive OCT imaging and interactive display of the humanretina. Opt. Express. 2009; 17:4151–4165. [PubMed: 19259252]
26. Götzinger E, Pircher M, Geitzenauer W, Ahlers C, Baumann B, Michels S, Schmidt-Erfurth U,Hitzenberger CK. Retinal pigment epithelium segmentation by polarization sensitive opticalcoherence tomography. Opt. Express. 2008; 16:16410–16422. [PubMed: 18852747]
Baumann et al. Page 10
J Biomed Opt. Author manuscript; available in PMC 2011 February 10.
Europe P
MC
Funders A
uthor Manuscripts
Europe P
MC
Funders A
uthor Manuscripts

27. Ahlers C, Goetzinger E, Pircher M, Golbaz I, Prager F, Schütze C, Baumann B, Hitzenberger C,Schmidt-Erfurth U. Imaging of the retinal pigment epithelium in age-related macular degenerationusing polarization sensitive optical coherence tomography. Invest. Ophthalmol. Vis. Sci. 2009;51:2149–2157. [PubMed: 19797228]
28. Michels S, Pircher M, Geitzenauer W, Simader C, Götzinger E, Findl O, Schmidt-Erfurth U,Hitzenberger CK. Value of polarisation-sensitive optical coherence tomography in diseasesaffecting the retinal pigment epithelium. Br. J. Ophthalmol. 2008; 92:204–209. [PubMed:18227201]
29. Klein R, Klein BE, Linton KL. Prevalence of age-related maculopathy: the Beaver Dam EyeStudy. Ophthalmology. 1992; 99:933–943. [PubMed: 1630784]
30. Bird AC, Bressler NM, Bressler SB, Chisholm IH, Coscas G, Davis MD, de Jong PTVM, KlaverCCW, Klein BEK, Klein R, Mitchell P, Sarks JP, Sarks SH, Soubrane G, Taylor HR, VingerlingJR. An international classification and grading system for age-related maculopathy and age-relatedmacular degeneration. Surv. Ophthalmol. 1995; 39:367–374. [PubMed: 7604360]
31. Schmidt-Erfurth UM, Pruente C. Management of neovascular agerelated macular degeneration.Prog. Ret. Eye Res. 2007; 26:437–451.
32. LIA. American national standard for safe use of lasers, ANSI Z 136.1. Orlando: 2000.
33. InternationaI Electrotechnical Comission. Safety of laser products—Part 1: equipment classicationand requirements, IEC 60825-1. Ed. 2. 2001.
34. Hitzenberger CK, Götzinger E, Sticker M, Pircher M, Fercher AF. Measurement and imaging ofbirefringence and optic axis orientation by phase resolved polarization sensitive optical coherencetomography. Opt. Express. 2001; 9:780–790. [PubMed: 19424315]
35. Wojtkowski M, Srinivasan V, Ko T, Fujimoto J, Kowalczyk A, Duker J. Ultrahigh-resolution,high-speed, Fourier domain optical coherence tomography and methods for dispersioncompensation. Opt. Express. 2004; 12:2404–2422. [PubMed: 19475077]
36. Baumann B, Götzinger E, Pircher M, Hitzenberger CK. Measurement of depolarizationdistribution in the healthy human macula by polarization sensitive OCT. J. Biophoton. 2009;2:426–434.
37. Ferguson RD, Hammer DX, Paunescu LA, Beaton S, Schuman JS. Tracking optical coherencetomography. Opt. Lett. 2004; 29:2139–2141. [PubMed: 15460882]
38. Huber R, Wojtkowski M, Fujimoto JG. Fourier domain mode locking (FDML): a new laseroperating regime and applications for optical coherence tomography. Opt. Express. 2006;14:3225–3237. [PubMed: 19516464]
39. Potsaid B, Gorczynska I, Srinivasan VJ, Chen Y, Jiang J, Cable A, Fujimoto JG. Ultrahigh speedspectral/Fourier domain OCT ophthalmic imaging at 70,000 to 312,500 axial scans per second.Opt. Express. 2008; 16:15149–15169. [PubMed: 18795054]
40. Holz FG, Bindewald-Wittich A, Fleckenstein M, Dreyhaupt J, Scholl HPN, Schmitz-ValckenbergS, Fam-Study Group. Progression of geographic atrophy and impact of fundus autofluorescencepatterns in age-related macular degeneration. Am. J. Ophthalmol. 2007; 143:463–472. [PubMed:17239336]
41. Sunness JS, Gonzalez-Baron J, Applegate CA, Bressler NM, Tian Y, Hawkins B, Barron Y,Bergman A. Enlargement of atrophy and visual acuity loss in the geographic atrophy form of age-related macular degeneration. Ophthalmology. 1999; 106:1768–1779. [PubMed: 10485549]
Baumann et al. Page 11
J Biomed Opt. Author manuscript; available in PMC 2011 February 10.
Europe P
MC
Funders A
uthor Manuscripts
Europe P
MC
Funders A
uthor Manuscripts

Fig. 1.Combined PS-OCT and SLO instrument for clinical imaging. Components: SLD,superluminescent diode; PC, polarization controller; FC, fiber coupler; POL, polarizer; PBS,polarizing beamsplitter; BS, nonpolarizing beamsplitter; QWP, quarter-wave-plate; GS,galvanometer scanner; L, lens; M, mirror; ND, variable neutral density filter; DC, dispersioncompensation; RM, reference mirror; HWP, half-wave plate; DG, diffraction grating; LSC,line-scan camera; and CCTV, camera for pupil observation.
Baumann et al. Page 12
J Biomed Opt. Author manuscript; available in PMC 2011 February 10.
Europe P
MC
Funders A
uthor Manuscripts
Europe P
MC
Funders A
uthor Manuscripts

Fig. 2.PS-OCT images. (a) Reflectivity B-scan image. (b) DOPU B-scan image [color scale:DOPU = 0 (dark blue) to DOPU = 1 (red)]. Pixels with intensities below a certain thresholdare displayed in gray. (c) Overlay of depolarizing pixels on reflectivity image in red. (d)Position of ILM and RPE overlaid on reflectivity image in blue and red, respectively. (e) Enface fundus image reconstructed from 3D OCT data set. (f) Retinal thickness map computedas geometric axial distance between ILM position and RPE position.
Baumann et al. Page 13
J Biomed Opt. Author manuscript; available in PMC 2011 February 10.
Europe P
MC
Funders A
uthor Manuscripts
Europe P
MC
Funders A
uthor Manuscripts
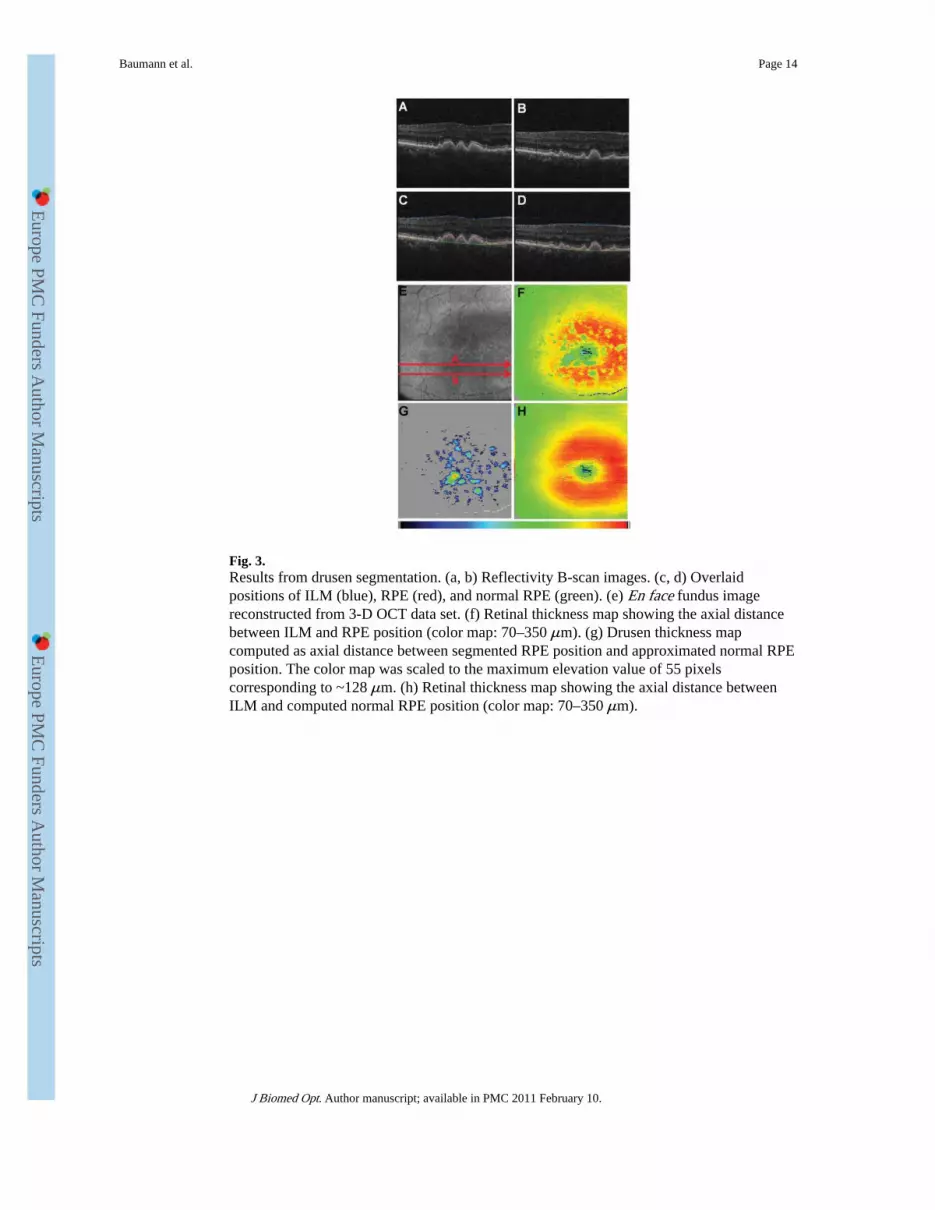
Fig. 3.Results from drusen segmentation. (a, b) Reflectivity B-scan images. (c, d) Overlaidpositions of ILM (blue), RPE (red), and normal RPE (green). (e) En face fundus imagereconstructed from 3-D OCT data set. (f) Retinal thickness map showing the axial distancebetween ILM and RPE position (color map: 70–350 μm). (g) Drusen thickness mapcomputed as axial distance between segmented RPE position and approximated normal RPEposition. The color map was scaled to the maximum elevation value of 55 pixelscorresponding to ~128 μm. (h) Retinal thickness map showing the axial distance betweenILM and computed normal RPE position (color map: 70–350 μm).
Baumann et al. Page 14
J Biomed Opt. Author manuscript; available in PMC 2011 February 10.
Europe P
MC
Funders A
uthor Manuscripts
Europe P
MC
Funders A
uthor Manuscripts
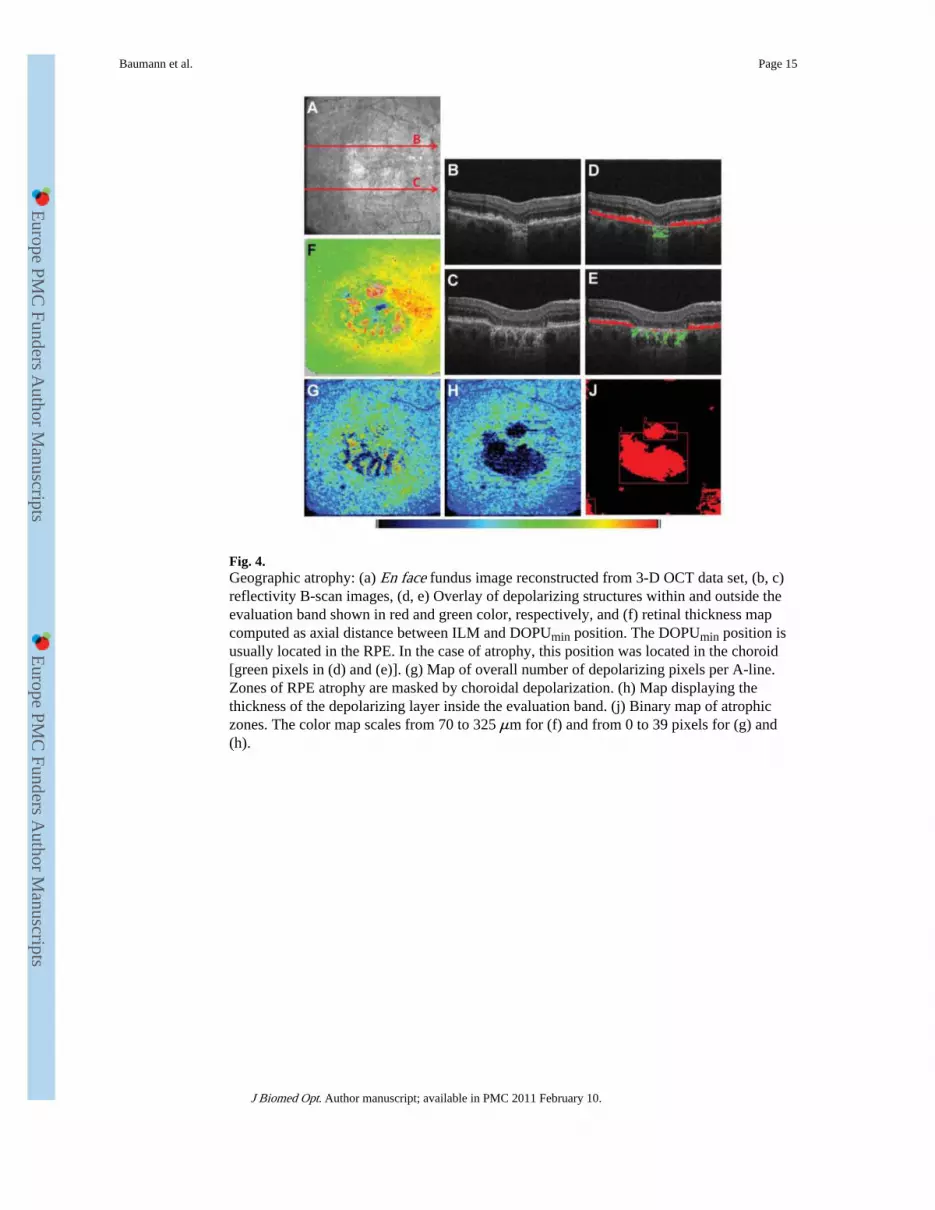
Fig. 4.Geographic atrophy: (a) En face fundus image reconstructed from 3-D OCT data set, (b, c)reflectivity B-scan images, (d, e) Overlay of depolarizing structures within and outside theevaluation band shown in red and green color, respectively, and (f) retinal thickness mapcomputed as axial distance between ILM and DOPUmin position. The DOPUmin position isusually located in the RPE. In the case of atrophy, this position was located in the choroid[green pixels in (d) and (e)]. (g) Map of overall number of depolarizing pixels per A-line.Zones of RPE atrophy are masked by choroidal depolarization. (h) Map displaying thethickness of the depolarizing layer inside the evaluation band. (j) Binary map of atrophiczones. The color map scales from 70 to 325 μm for (f) and from 0 to 39 pixels for (g) and(h).
Baumann et al. Page 15
J Biomed Opt. Author manuscript; available in PMC 2011 February 10.
Europe P
MC
Funders A
uthor Manuscripts
Europe P
MC
Funders A
uthor Manuscripts

Fig. 5.Repeatability of drusen area measurements. (a) For seven eyes, box plots of drusen areameasurements from five repeated measurements are shown. (b) Box plots of relativedeviation of the areas for the same data sets.
Baumann et al. Page 16
J Biomed Opt. Author manuscript; available in PMC 2011 February 10.
Europe P
MC
Funders A
uthor Manuscripts
Europe P
MC
Funders A
uthor Manuscripts
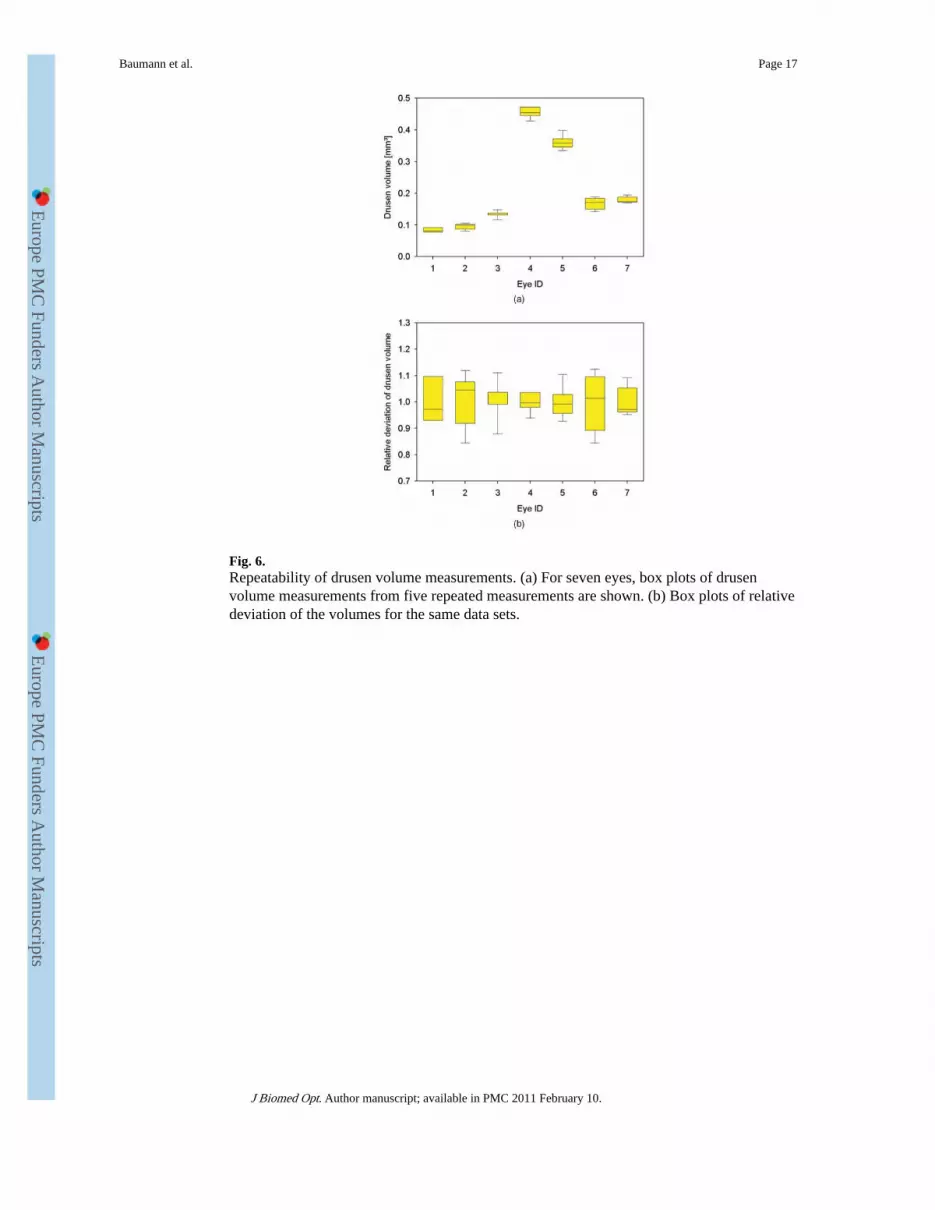
Fig. 6.Repeatability of drusen volume measurements. (a) For seven eyes, box plots of drusenvolume measurements from five repeated measurements are shown. (b) Box plots of relativedeviation of the volumes for the same data sets.
Baumann et al. Page 17
J Biomed Opt. Author manuscript; available in PMC 2011 February 10.
Europe P
MC
Funders A
uthor Manuscripts
Europe P
MC
Funders A
uthor Manuscripts

Fig. 7.Repeatability of area measurements in geographic atrophy. (a) For five eyes, box plots ofgeographic atrophy area measurements from five repeated measurements are shown. (b) Boxplots of relative deviation of the areas for the same data sets.
Baumann et al. Page 18
J Biomed Opt. Author manuscript; available in PMC 2011 February 10.
Europe P
MC
Funders A
uthor Manuscripts
Europe P
MC
Funders A
uthor Manuscripts

Europe P
MC
Funders A
uthor Manuscripts
Europe P
MC
Funders A
uthor Manuscripts
Baumann et al. Page 19
Table 1
Repeatability of drusen area measurements
Eye ID Average area* sd* Coefficient of variation
1 3.225 0.405 0.126
2 3.844 0.240 0.063
3 4.120 0.434 0.105
4 8.251 0.493 0.060
5 9.802 0.721 0.074
6 5.697 0.473 0.083
7 5.207 0.169 0.032
Average 5.735 0.419 0.077
*Average area and standard deviation of determined drusen areas are given in millimeters squared. Average values of all eyes are given in the last
line.
J Biomed Opt. Author manuscript; available in PMC 2011 February 10.

Europe P
MC
Funders A
uthor Manuscripts
Europe P
MC
Funders A
uthor Manuscripts
Baumann et al. Page 20
Table 2
Repeatability of drusen volume measurements
Eye ID Average volume* sd* Coefficient of variation
1 0.084 0.007 0.080
2 0.095 0.009 0.100
3 0.133 0.010 0.076
4 0.456 0.018 0.040
5 0.362 0.023 0.062
6 0.168 0.018 0.107
7 0.179 0.010 0.057
Average 0.211 0.014 0.075
*Average volume and standard deviation of determined drusen volumes are given in cubic millimeters. Average values of all eyes are given in the
last line.
J Biomed Opt. Author manuscript; available in PMC 2011 February 10.

Europe P
MC
Funders A
uthor Manuscripts
Europe P
MC
Funders A
uthor Manuscripts
Baumann et al. Page 21
Table 3
Repeatability of geographic atrophy area measurements
Eye ID Average area* sd* Coefficient of variation
1 2.215 0.157 0.071
2 2.470 0.345 0.140
3 0.620 0.056 0.090
4 7.788 0.979 0.126
5 2.564 0.092 0.036
Average 3.132 0.326 0.092
*Average area and standard deviation of determined areas are given in millimeters squared. Average values of all eyes are given in the last line.
J Biomed Opt. Author manuscript; available in PMC 2011 February 10.