Functional analysis of hepatic FOXO3 signalling in glucose ...
162
Institute of Physiological Chemistry, Ulm University Head of Institute: Prof. Dr. Thomas Wirth Functional analysis of hepatic FOXO3 signalling in glucose and lipid metabolism DISSERTATION Dissertation submitted in partial fulfillment of the requirements for the degree of PhD (Dr. rer. nat) Faculty of Natural Sciences University of Ulm Presented by Sarah Gul From Pakistan 2014
-
Upload
khangminh22 -
Category
Documents
-
view
2 -
download
0
Transcript of Functional analysis of hepatic FOXO3 signalling in glucose ...

Institute of Physiological Chemistry, Ulm University
Head of Institute: Prof. Dr. Thomas Wirth
Functional analysis of hepatic FOXO3signalling in glucose and lipid metabolism
DISSERTATIONDissertation submitted in partial fulfillment of the requirements for the
degree of PhD (Dr. rer. nat)
Faculty of Natural Sciences
University of Ulm
Presented by
Sarah GulFrom Pakistan
2014

Dean: Prof. Dr. Joachim Ankerhold
First reviewer: Prof. Dr. Thomas Wirth
Institute of Physiological Chemistry
Ulm University
Second reviewer: Prof. Dr. Martin Wagner
Centre for Internal Medicine
Ulm University Medical Center
Ulm University
Day doctorate awarded: 19th May 2014

Table of Contents
1
Table of Contents
Table of contents 1
Summary 4
Abbreviations 6
1 Introduction 121.1 Forkhead transcription factors 12
1.1.1 Forkhead box subclass O 12
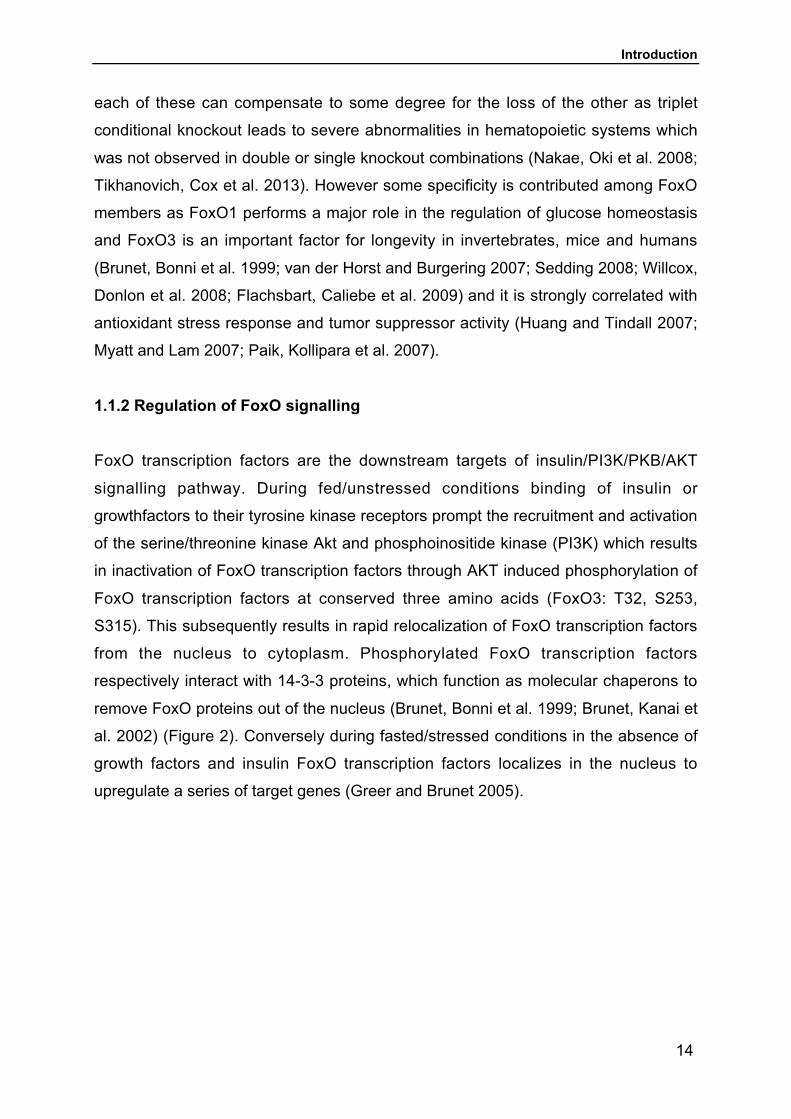
1.1.2 Regulation of FoxO signalling 14
1.2 Role of FoxO transcription factors in metabolism 16
1.2.1 Role of FoxO transcription factors in the liver regulating
glucose homeostasis 17
1.2.2 Role of FoxO transcription factors in lipid metabolism 20
1.2.3 Role of FoxO transcription factors in pancreatic β-cells 21
1.3 Liver is a “complex metabolic” organ 21
1.3.1 Regulation of hepatic glucose production 24
1.3.2 Regulation of transcription factors controlling gluconeogenesis 25
1.3.3 Regulation of hepatic lipid metabolism 28
1.4 Diabetes mellitus 29
1.4.1 Type 2 diabetes mellitus 30
1.4.2 Obesity and type 2 diabetes 32
1.4.3 Factors controlling β-cell mass and type 2 diabetes 34
1.4.4 Molecular mechanism of insulin resistance 34
1.4.5 Genetics of type 2 diabetes 36
1.4.6 Animal models of type 2 diabetes 37
1.5 Metformin 39
1.5.1 Metformin as an anti-hyperglycemic agent 40
1.5.2 Mechanism of metformin action 41
1.6 Aims of the study 45
2 Materials and Methods 462.1. Mice 46
2.1.1 Animal studies 46
2.1.2 Doxycycline administration 46
2.1.3 Metformin administration 46

Table of Contents
2
2.2 Genotyping 47
2.2.1 Isolation of genomic DNA 47
2.2.2 Polymerase chain reaction (PCR) 47
2.3 In Vivo Bioluminescence imaging 48
2.4 Metabolic studies 48
2.4.1 Glucose Tolerance Test (GTT) and Insulin Tolerance Test (ITT) 48
2.4.2 Animal studies 49
2.4.3 Enzyme-linked immunosorbent assay (ELISA) 49
2.5 Protein biochemistry 49
2.5.1 Protein extraction with dignam C buffer 49
2.5.2 Protein concentration measurement by Bradford method 50
2.5.3 In vitro Luciferase reporter gene activity measurement 50
2.5.4 Western blotting 50
2.6 RNA Analysis 52
2.6.1 RNA extraction and cDNA synthesis 52
2.6.2 Gene expression analysis 54
2.7 Histology 54
2.7.1 Liver tissue preparation 54
2.7.2 Immunofluorescence staining of paraffin embedded sections 55
2.7.3 Immunofluorescence image aquisition and processing 56
2.7.4 Quantification of TUNEL staining, Cd45 and Insulin staining 56
2.7.5 Immunohistochemical staining of paraffin embedded sections 56
2.7.6 PAS staining for Glycogen 57
2.8 Statistical analysis 57
2.9 Reagents and Materials 58
2.9.1 General chemicals 58
2.9.2 Buffers and solutions 59
2.9.3 Protein biochemistry materials 60
2.9.4 Histology and microscopy materials 61
2.9.5 Molecular biology materials 61
2.9.6 General laboratory materials 62
3 Laboratoryequipment 62
3.1 General laboratory equipment 62
3.2 Histology and microscopy equipment 63

Table of Contents
3
4 Software 64
3 Results 653.1 Generation of transgenic mice with inducible liver-specific expression of
constitutively active FOXO3 65
3.1.1 Tetracycline regulated expression of a constitutively active FOXO3 allele
driven by the LAP promotor 65
3.2 Perinatal induction of FOXO3CA results in lethal phenotype 66
3.2.1 liver-specific expression of FOXO3CA 66
3.2.2 FOXO3CA activation affects size and structure of hepatocytes and induces
liverdysfunction and metabolic abnormalities 69
3.2.3 FOXO3CA activation in younger animals induces autophagy 72
3.3 FOXO3CA activation in adult animals 73
3.3.1 Expression pattern of FOXO3CA transgene 73
3.3.2 FOXO3CA activation in adult animals is not associated with
growth defect 76
3.3.3 FOXO3CA activation results in altered hepatic morphology 76
3.3.4 FOXO3CA activation induces moderate hepatocyte damage 77
3.3.5 Hepatocellular FOXO3 activation induces metabolic abnormalities 80
3.3.6 Activation of catabolic pathways by expression of constitutively
active FOXO3 82
3.3.7 Continuous expression of constitutively active FOXO3 in the liver induces
loss of gluconeogenic potential 88
3.3.8 FOXO3CA activation in the liver induces subordinate
pancreatic hyperplasia 89
3.4 Metformin normalizes FOXO3-induced distorted glucose
and insulin metabolism 91
3.5. FOXO3-induced activation of global catabolism, hepatocyte atrophy, or
hepatocyte damage were reversed after Metformin administration 96
4 Discussion 1025 References 1166 Appendix 135Declaration 154Acknowledgement 155Curriculum Vitae 156

Summary
4
Summary
Type 2 diabetes mellitus is a complex metabolic disorder characterized by high blood
glucose levels and insulin resistance that occur as a consequence of uncontrolled
gluconeogenesis that is failed to be suppressed by insulin. It is a major worldwide
health care problem affecting the quality of life. The physiological processes
contributing to insulin resistance in type 2 diabetes remain enigmatic. Therefore,
there is a continuous need to identify molecular events responsible for type 2
diabetes and insulin resistance and this could help to discover new targets for the
improvement of anti-diabetic drugs. Currently metformin is the most widely used oral
anti-diabetic drug that inhibits hepatic glucose production, although the underlying
molecular mechanism is not completely understood. FoxO transcription factors
represent key downstream targets of insulin and growth factors regulating energy
metabolism. However the interplay between different FoxO family members in
metabolism is far from being understood. Although it had been suggested that FoxO1
is the major executer for regulation of insulin signalling mediated glucose. In addition
to FoxO1, FoxO3 is also significantly expressed in the liver its contribution to
metabolic regulation has however not been thoroughly analysed. Interestingly FoxO3
genotypes are associated with insulin sensitivity phenotypes and longevity in humans
suggesting that FoxO3 is critical for metabolic control.
Therefore in order to understand the importance of FoxO3 function in the liver in a
time- and cell-type specific manner, we generated transgenic (FoxO3CAHep) mice
that allow the conditional expression of a constitutively active FoxO3 allele. We
crossed transgenic mice carrying the tetracyclin-regulated transactivator (tTA) under
the control of liver-activator protein promoter with transgenic mice bearing a
constitutively active form of the FoxO3 allele (FoxO3CA) controlled by tTA-
responsive promoter.
Here we demonstrate that FoxO3 is a key regulator of hepatic glucose and lipid
metabolism in transgenic mice. FoxO3 activation led to progressive hepatocyte
atrophy in the absence of significant inflammation and apoptosis with moderate
hepatocyte damage. Perinatal activation of FoxO3 results in lethal phenotype and the
transgenic animals survived showed hypoglycemic phenotype with moderate
upregulation of autophagy-associated genes. However, FoxO3 activation in adult
animals showed hyperglycemic, hyperinsulinemic phenotype followed by up-

Summary
5
regulation of gluconeogenesis-associated genes. The elevated blood glucose levels
in transgenic mice are coupled with impaired glucose tolerance and impaired insulin
sensitivity. Furthermore expression of FoxO3CA results in activation of catabolic
pathways in transgenic mice including increased glycogenolysis, inhibition of lipid
synthesis and activation of lipid β-oxidation. Consistently the results from gene
expression profiles indicated up-regulation of genes involved in lipid and glucose
catabolic pathways and down-regulation of anabolic genes as shown previously in
type 2 diabetic subjects. This suggests that FoxO3 activates catabolic pathways to
provide substrates and energy for enhanced gluconeogenesis.
For our surprise the disease progression in transgenic mice showed hypoglycemia,
might be as a consequence of beginning of liver failure or this could be due to high
insulin production by pancreatic β-cells. Indeed the transgenic mice showed
significantly higher insulin levels followed by pancreatic hyperplasia. It is plausible
that the pancreatic hyperplasia in transgenic mice could arise might be due to the
normal compensatory response of pancreas to enhanced insulin secretion or several
other reasons.
Strikingly FoxO3CA-induced metabolic alterations in glucose and lipid metabolism
were completely normalized after metformin treatment in mice expressing
constitutively active FoxO3. Taken together our findings suggest that dysbalanced
FoxO3 activity in the liver results in insulin resistance. Therefore tight regulation of
FoxO3 activity would be very crucial and agents controlling hepatic FoxO3 system
may represent therapeutic tools to prevent type 2 diabetes.

Abbreviations
6
Abbreviations
AMPK Adenosine mono-phosphate (AMP)-activated protein kinase
AMPKα1α2 AMPK alpha1 and alpha 2
Ab Antibody
APS Ammonium persulfate
ADA American Diabetes Association
ApoCIII Apolipoprotein C3
ALT Alanine aminotransferase
ATG1 Autophagy related gene 1
ATG5 Autophagy related gene 5
ATG12 Autophagy related gene 12
AST Aspartate aminotransferase
ALP Alkaline phosphatase
AdipoR1/2 Adiponectin receptor 1 and 2
AMP Adenosine mono-phosphate
ATP Adenosine tri-phosphate
Acc Acetyl-CoA carboxylase
BSA Bovine serum albumin
CA Constitutively active
CD45 cluster of differentiation 45
cDNA Complementary DNA
CPT1α Carnitine palmitoyltransferase 1α
CREB cAMP response element-binding protein
CRTC2 CREB-regulated transcriptional coactivator2
CRE cAMP-response element
CNS Central nervous system
DOX Doxycycline
DNL De novo lipogenesis
DNA Deoxyribonucleicacid
DKO Double knockout
DLKO Akt1 Akt2 knockout
dNTP Deoxynucleotide triphosphate

Abbreviations
7
DTT Dithiothreitol
Dil Dilution
DAPI 4´,6-diamidino-2-phenylindole
ER Endoplasmicreticullum
ERK Extracellular regulated kinase
EDTA Ethylenediamine tetraacetic acid
ELISA Enzyme-linked immunosorbent assay
Echs Enoyl-CoA hydratase
ERK Extracellular signal-regulated kinases
FOXO3CA Constitutively active FOXO3
FTO Fat mass and obesity related gene
FFA Free fatty acid
Fabp5 Fatty acid binding protein 5
Fas Fatty acid synthase
Fbpase Fructose-1,6-biphosphatase
FOXO1ADA Constitutively nuclear mutant FOXO1
G6pc Glucose-6-phosphatase
GTT Glucose tolerance test
Glut2 Glucose transporter
Gck Glucokianse
GEO Gene expression Omnibus
GCKR Glucokinase regulatory protein
GWAS Genome wide association and linkage studies
GLP-1 Glucagon-like-peptide 1
GR Glucocorticoid receptor
GRE Glucocorticoid receptor binding element
Gckr Glucokinase regulatory protein
HPRT Hypoxanthine-guanine phosphoribosyltransferase gene
HbA1c Glycated haemoglobin A1c
HNF Hepatic nuclear factor
HNF4α Hepatic nuclear factor-4α
HEPES 4-(2-hydroxyethyl)-1-piperazineethanesulfonic acid
HGF Hepatocyte growth factor
HFD High fat diet

Abbreviations
8
IR Insulin receptor
ITT Insulin tolerance test
IB Immunoblot
IF Immunofluorscence
IHC Immunohistochemistry
i.p. Intraperitoneally
IKK IκB kinase
Irs1/Irs2KO Insulin receptor substrate1and 2 knockout
IKK2CA IKK2 constitutively active
IKKβ IκB kinase subunit β
IFG Impaired fasting glucose
InsR Insulin receptor
IGT Impaired glucose tolerance
IGFBP1 Insulin like growth factor binding protein 1
IRS1 Insulin receptor substrate-1
IRS2 Insulin receptor substrate-2
JNK c-Jun N-terminal kinases
KLF15 Krüpple-like factor 15
K8/18 Keratin 8/18
LKB1 Liver kinase B1
LKB1-KO Liver kinase B1 knockout
LPCKO Liver parenchymal knockout
Lepr Leptin receptor
LPL Lipoprotein lipase
L-p110αKO Liver-specific deletion of catlytic subunit of PI3K (p110α)
LD Lipid droplets
LAP Liver activator protein
LIRKO Liver-specific insulin receptor knockout mice
LW/BW Liver weight/ Body weight
MTP Microsomal triglyceride transfer protein
MEK1 Mitogen activated protein kinase1
NADPH Nicotinamide adenine dinucleotide phosphate
NFAT Nuclear factor of activated T-cells
OGTT Oral glucose tolerance test

Abbreviations
9
OCT1 Oragnic cation transporter 1
OCT2 Oragnic cation transporter 2
PKB Protein kinase B
P53 Cellular tumor antigen/ Tumor suppressor
PBS Phosphate buffer saline
PCR Polymerase chain reaction
PAGE Polyacryamide gel electrophoresis
rpm Revolutions per minute
Pygl Glycogen phosphorylase
Pepck Phosphoenolpyruvate carboxykinase
Pdk4 Pyruvate dehydogenase kinase 4
PKA Protein kinase A
PI3K Phosphatidylinsositol 3-kinase
PAS Periodic Acid Schiffs
Pdx-1 Pancreatic and duodenal homeobox 1
PIP3 Phosphatidylinositol (3,4,5)-triphosphate
PTEN Phosphatase and tension homologue
Pklr Pyruvate kinase liver
PGC-1α Peroxisome proliferator activated receptor γ coactivator-1α
q-PCR Quantitative realtime-PCR
RLU Relative light units
RNA Ribonucleic acid
RIPA Radio immunoprecipitation assay
RBCs Erthrocytes/ Red blood cells
Rb Rabbit
Rb and P53 Tumor suppressor genes
RT Room temperature
SD Standard deviation
Srebp1 Sterol regulatory element-binding protein 1c
STK11 Serine/Threonine kinase 11
SDS Sodiumdodecylsulfate
SAT Subcutaneous adipose tissue
SOCS Supressors of cytokine signalling proteins
SD Standard deviation

Abbreviations
10
SIRT1 NAD-dependent deacetylase sirtuin 1
STZ Streptozotocin
SHP Small heterodimer partner
SHIP SH2-containing inositol phosphatase 1
SPF Specific pathogen-free
S253 Serine253
S315 Serine315
tTA Tetracycline-responsive transactivator
tetO Tet operator/ tetracyclin response element
T2D Type 2 Diabetes mellitus
TUNEL Terminal deoxynucleotidyl transferase dUTP nick end labeling
TBS Tris buffer saline
TEMED Tetramethyethylenediamine
TNT buffer Tris-Nacl-Tween buffer
TKO Triple knockout
Trb3 Psuedokianse tribble homologue 3
TG Triglycerides
T32 Threonine 32
TAK1 Transforming growth factor (TGF)-β-activated kinase 1
TE Tris-EDTA
TBE Tris-buffer saline
TCA Tricarboxylicacid cycle
UAE United Arab Emirates
UPL Universal probe libraray
UV Ultravoilet irradiation
VLDL Very low density lipoprotein
WHO World Health Organization
WT Wild type
XBP1 X-box binding protein 1
ZFR Zucker fatty rat
ZDR Zucker diabetic rat
µg Microgram
µl Microlitre
7Wk 7-week

Abbreviations
11
9Wk 9-week
6Wk 6-week
5Wk 5-week
(-)Met Without Metformin
(+)Met3D With Metformin 3-days
(+)Met3W With Metformin 3-weeks

Introduction
12
1 Introduction
1.1 Forkhead transcription factors
The family of forkhead box proteins belongs to a major group of transcription factors
present in all eukaryotes. Thus are transcriptional regulators characterized by
conserved DNA-binding domain called “Forkhead box”. Forkhead box is a 110
amino-acid region located in the central portion of molecules and is classified as
winged helix structure. The family of forkhead transcription factors has many
subgroups ranging from (Forkhead Box A-S). An important subgroup of forkhead box
proteins is the FoxO subgroup (Greer and Brunet 2005; Calnan and Brunet 2008).
1.1.1 Forkhead box subclass O
The O branch of the large Forkhead family of transcription factors is highly conserved
evolutionarily and ubiquitously expressed (Huang and Tindall 2007; Calnan and
Brunet 2008). The prototypes of the FoxO family were first described in
Caenorhabditis elegans and drosophila demonstrating the task of FOXO proteins as
the downstream targets of insulin-like signalling involved in the modulation of
longevity and metabolism. Mammals contain four members of the Forkhead family
such as FOXO1, FOXO3, FOXO4 and FOXO6. The FOXO family was initially
described in human tumors as three members of Forkhead family; FOXO1, FOXO3
and FOXO4 were identified at chromosomal translocations in human cancers (Galili,
Davis et al. 1993; Davis, D'Cruz et al. 1994; Parry, Wei et al. 1994; Borkhardt, Repp
et al. 1997). FOXO1, FOXO3, FOXO4 are widely distributed and are expressed in
almost all tissues whereas FOXO6 is largely specific to neurons. FOXO transcription
factors attaches to DNA in the form of monomers on conserved consensus core
recognition motif TTGTTTAC in the nucleus. FOXO transcription factors perform
diversified function by binding to the consensus core recognition motif and promote
the transcriptional activities of genes regulating glucose metabolism, cell cycle arrest,
apoptosis, stress resistance, autophagy, cellular atrophy in response to oxidative
stress and DNA damage (Figure 1) (Hwangbo, Gershman et al. 2004; Kenyon 2010;
Eijkelenboom and Burgering 2013).

Introduction
13
Figure 1: Functions of FoxO transcription factors (Eijkelenboom and Burgering2013). FOXO transcription factors perform diversified functions and hence function as the regulators
for homeostasis during the process of fasting and feeding. FOXO transcription factors get activated in
response to any metabolic stress e.g starvation, growth factor deprivation and oxidative stress. FOXO
transcription factors perform various functions by up-regulating a series of target genes involved in the
regulation of gluconeogenesis, cell-cycle arrest, differentiation, DNA repair, autophagy and apoptosis.
FoxO transcription factors perform overlapping functions and it is still unknown
whether these factors share similar target genes or have different subsets of target
genes. The complexity of FoxO transcription factors is supported by the notion that
mice missing three main FoxO isoforms exhibit different phenotypes. Homozygous
FoxO1 knockout mice are embryonically lethal (Hosaka, Biggs et al. 2004) due to
defective angiogenesis. FoxO3 knockout mice produce premature ovarian failure and
FoxO4 knockout mice are with no obvious phenotype (Paik, Kollipara et al. 2007). It
is also evidenced that FoxO transcription factors perform redundant functions and
Introduction
14
each of these can compensate to some degree for the loss of the other as triplet
conditional knockout leads to severe abnormalities in hematopoietic systems which
was not observed in double or single knockout combinations (Nakae, Oki et al. 2008;
Tikhanovich, Cox et al. 2013). However some specificity is contributed among FoxO
members as FoxO1 performs a major role in the regulation of glucose homeostasis
and FoxO3 is an important factor for longevity in invertebrates, mice and humans
(Brunet, Bonni et al. 1999; van der Horst and Burgering 2007; Sedding 2008; Willcox,
Donlon et al. 2008; Flachsbart, Caliebe et al. 2009) and it is strongly correlated with
antioxidant stress response and tumor suppressor activity (Huang and Tindall 2007;
Myatt and Lam 2007; Paik, Kollipara et al. 2007).
1.1.2 Regulation of FoxO signalling
FoxO transcription factors are the downstream targets of insulin/PI3K/PKB/AKT
signalling pathway. During fed/unstressed conditions binding of insulin or
growthfactors to their tyrosine kinase receptors prompt the recruitment and activation
of the serine/threonine kinase Akt and phosphoinositide kinase (PI3K) which results
in inactivation of FoxO transcription factors through AKT induced phosphorylation of
FoxO transcription factors at conserved three amino acids (FoxO3: T32, S253,
S315). This subsequently results in rapid relocalization of FoxO transcription factors
from the nucleus to cytoplasm. Phosphorylated FoxO transcription factors
respectively interact with 14-3-3 proteins, which function as molecular chaperons to
remove FoxO proteins out of the nucleus (Brunet, Bonni et al. 1999; Brunet, Kanai et
al. 2002) (Figure 2). Conversely during fasted/stressed conditions in the absence of
growth factors and insulin FoxO transcription factors localizes in the nucleus to
upregulate a series of target genes (Greer and Brunet 2005).

Introduction
15
Figure 2: FoxO transcription factors are activated in response to Insulinsignalling pathway adapted from (Greer and Brunet 2005). During feeding/unstressed
conditions activated insulin-signalling results in phophorylation/inactivation and proteosomal
degradation of FOXO transcription factors. FOXO trancription factors are no longer in the nucleus to
regulate their metabolic target genes. In contrast during starved/stressed conditions due to absence of
insulin and growth factors FOXO transcription factors gets activated, move into the nucleus, bind to
their promoters to upregulate the series of metabolic target genes.
Additionally cellular stress conditions can also cause activation of FoxO transcription
factors via AMPK (Greer, Banko et al. 2009), or under oxidative stress conditions via
JNK mediated phosphorylation (Eijkelenboom and Burgering 2013). FoxO
transcription factors are also modulated in response to several post translational
modifications acetylation, ubiquitination and phosphorylation which results in altered
subcellular localization, a modulated transcriptional-regulatory activity and change in
protein stability (Greer and Brunet 2005).

Introduction
16
1.2 Role of FoxO transcription factors in metabolism
FoxO transcription factors are involved in the metabolism regulation through their
effects in various organs such as liver, pancreas, adipose tissue and skeletal muscle.
Alterations in FoxO function in simple organisms affects the process of aging and
lead to metabolic disorders including diabetes. This can be hypothesized from the list
of known target genes which play an important role in metabolism (Table 1) (Barthel,
Schmoll et al. 2005). The role of FoxO proteins in the context of regulating glucose
homeostasis in the liver and pancreas will be discussed in the following sections.
Table 1: Metabolic selected FoxO target genes (Barthel, Schmoll et al. 2005)
Genes FoxO-effect Organ or cell type Metabolic effects ReferencesG6Pase Upregulation Liver, Kidney Increased
gluconeogenesis(Schmoll, Walkeret a l . 2000),(Nakae, Kitamuraet al. 2001)
G6Pasetransporter
Upregulation Liver Increasedgluconeogenesis
(Kallwellis-Opara,Zaho et al. 2003)
PEPCK Upregulation Liver, Kidney Increasedgluconeogenesis
(Nakae, Kitamuraet a l . 2001;Altomonte, Richteret al. 2003), (Hall,Yamasaki et al.2000)
IGFBP-1 Upregulation Liver Inhibition of IGF-1 (Guo, Rena et al.1999; Yeagley,Guo et al. 2001)(Hall, Yamasaki etal. 2000)
PGC-1α Upregulation Liver Increasedgluconeogenesis
(Daitoku,Yamagata et al.2003)
PDK4 Upregulation Muscle, Liver Glucose saving (Furuyama,Kitayama et al.2003).(Kwon,Huang et al. 2004)
LPL Upregulation Muscle Triglycerideclearance, fattyacid metabolism
(Kwon, Huang etal. 2004)
HMG-CoAsynthase
Upregulation Liver K e t o n e b o d yproduction
(Nadal, Marrero etal. 2002)
PDX-1 Downregulation Pancreatic β-cell Inhibition of β -celldifferentiation
Kitamura, T. et al,2002,
P21 Upregulation Adipocyte Inhibition of fat-celldifferentiation
(Nakae, Kitamuraet al. 2003)
AdipoR1/2 Upregulation Liver, Muscle F a t t y a c i doxidation, glucoseuptake
(Tsuchida,Yamauchi et al.2004)

Introduction
17
1.2.1 Role of FoxO trancription factors in the liver regulating Glucosehomeostasis
As outlined above the major role of hepatic FoxO proteins includes the regulation of
gluconeogenesis and among the FoxO subgroup FoxO1 was shown as the major
insulin-regulated transcription factor involved in the modulation of hepatic glucose
production (Nakae, Kitamura et al. 2001; Accili and Arden 2004). It was shown in
mouse models of insulin resistance that FoxO1 transcription factors are deregulated
(Cheng, Guo et al. 2009) consistently gluconeogenic genes glucose-6-phosphatase
(G6pc), phosphoenolpyruvate carboxykinase (Pepck) and pyruvate-dehydrogenase
kinase 4 (Pdk4) are up-regulated during insulin resistance, fasting, type 2 diabetes,
insulin deficiency state and downregulated at postprandial state by insulin (O'Brien
and Granner 1996; O'Brien, Streeper et al. 2001). Accordingly mice with liver-specific
inactivation of FoxO1 showed hypoglycemia, decreased gluconeogenic gene
expression and enhanced glucose tolerance (Matsumoto, Pocai et al. 2007).
Furthermore (Altomonte, Richter et al. 2003) showed that hepatic inhibition of FoxO1
in diabetic mice rescues the diabetic phenotype of insulin resistance by lowering the
gluconeogenic gene expression. Consistently it was shown that targeting FoxO1 in
diet-induced obese mice using antisense oligoneucleotides reduced G-6pc and
Pepck gene expression with improved glucose tolerance and decreased hepatic
glucose production in the liver (Samuel, Choi et al. 2006). In line with these studies
haploinsufficiency of FoxO1 (Nakae, Biggs et al. 2002) in InsR haploinsufficient mice
rescued the loss of insulin sensitivity by reducing the hepatic gluconeogenic gene
expression. Additionally ablation of hepatic FoxO1 in mice lacking the insulin receptor
substrates IRS1 and IRS2 rescues the insulin resistance and hepatic lipid
abnormalities (Matsumoto, Pocai et al. 2007; Dong, Copps et al. 2008). It was further
reported that hepatic deletion of all three FoxO isoforms (FoxO1, FoxO3, FoxO4) in
mice showed more pronounced fasting hypoglycemia, improved glucose tolerance
and enhanced insulin sensitivity (Haeusler, Kaestner et al. 2010; Zhang, Li et al.
2012; Xiong, Tao et al. 2013) (Table 2).

Introduction
18
Table 2: Characteristic metabolic features of hepatic FoxO-null mouse models(Estall 2012)
Genotype(liverspecific)
Background Glycemia Insulin Serumlipids
Hepaticlipids
Ref
Foxo1-/- WTIRSR-/-
IRS1/2-/-
WT + STZdb/db
DecreasedDecreasedDecreasedDecreasedDecreased
––ResistantResistantDepletedResistantb
––DecreasedIncreaseda
Increased––
––Decreased––––––
Zhang et al.2012Mutsomotoetal.2007Dong et al. 2008Haeusler et al.2010Zhang et al.2012
Foxo3-/- WTdb/db
––––
––Resistantb
––––
––––
Zhang et al.2012Zhang et al.2012
Foxo4-/- WT –– –– –– Zhang et al.2012
Foxo1/3-/- WTWTdb/db
DecreasedDecreasedDecreased
DecreasedDecreasedResistantb
NRIncreasedIncreased
NRIncreased––
Haeusler et al.2010Zhang et al.2012Zhang et al.2012
Foxo1/4-/- WT Decreased NR –– NR Zhang et al.2012
Foxo3/4-/- WT –– NR –– NR Zhang et al.2012
Foxo1/3/4-/- WTWTWT + HFDWT
DecreasedNRNRDecreased
DecreasedNRResistantb
NR
NR––IncreasedIncreased
NRIncreasedIncreasedNR
Haeusler et al.2010Tao et al. 2011Tao et al. 2011Zhang et al.2012
HFD, High fat diet; STZ, Streptozotocin; WT, Wild type;__, no significant change; NR, not reported.a with ageb db/db mouse insulin resistance due to obesity.
However, it is important to know that in triple knockout studies the effects achieved
are redundant or in a synergistic manner still remains unknown, as the relative
contributions of individual FoxO proteins were not addressed.
In contrast constitutive activation of FoxO1 in the liver (Zhang, Patil et al. 2006)
results in impaired hepatic glucose production through increased expression of
gluconeogenic genes G-6-pc, Pepck. Additionally, gain-of-function of FoxO1 in the
liver paradoxically increases insulin sensitivity and leads to steatosis (Matsumoto,

Introduction
19
Han et al. 2006). Of interest under certain conditions FoxO1 gain of functions in the
liver results in insulin sensitivity through its increased ability to phophorylate Akt in
Trb3 (Tribbles homologue 3)-dependent or -independent manner (Matsumoto, Han et
al. 2006; Naimi, Gautier et al. 2007). Activation of FoxO1 in insulin resistance states
may improve insulin sensitivity through induction of Irs2 (Ide, Shimano et al. 2004).
Interestingly several mouse models demonstrated that hepatic deletion of insulin
receptor (IR) (Michael, Kulkarni et al. 2000), the p110 a form of PI3K(Sopasakis, Liu
et al. 2010), AKT2 (Cho, Mu et al. 2001) or AKT1 and AKT2 (Lu, Wan et al. 2012)
and IRS1/IRS2 (Dong, Copps et al. 2008) all result in insulin resistance and diabetes.
The ablation of IR, Akt1/Akt2, IRS1/IRS2 lead to constitutive activation of FoxO
transcription factors and as a consequence aberrant gluconeogenesis is observed
(Figure 3).
Figure 3: Knockout mouse models that leads to constitutive activation of FoxOtranscription factors.
FoxO transcription factors also interact with other coactivators and transcription
factors for regulating gucose homeostasis e.g PGC1α, HNF4 and CREB (Herzig,
Long et al. 2001; Yoon, Puigserver et al. 2001; Puigserver, Rhee et al. 2003;
Schilling, Oeser et al. 2006) and deactylases SIRT1 (Frescas, Valenti et al. 2005).

Introduction
20
Several novel mechanisms have also been shown to regulate glucose metabolism
such that interaction of FoxO1 with XBP-1. XBP-1 is the transcription factor involved
in insulin sensitivity and it was evidenced that direct binding of XBP-1 to FoxO1
directs it to the proteosomal degradation (Zhou, Lee et al. 2011). Similarly
glycosylation modifications promote the activation of FoxO transcription factors and
hence cause the upregulation of gluconeogenic target genes (Housley, Udeshi et al.
2009).
1.2.2 Role of FoxO transcription factors in lipid metabolism
FoxO transcription factors play an important role in regulating lipid metabolism. As
shown later the role of glucokinase (GCK) (Figure 5) in assisting lipogenesis it was
shown that constitutive activation of FoxO1 in the liver results in down-regulation of
the glycolytic enzymes pyruvate kinase and glucokinase subsequently and
decreased sterol/lipid synthesis results in reduced concentration of triglycerides in
transgenic mice (Zhang, Patil et al. 2006). In a similar mouse model (Matsumoto,
Han et al. 2006; Qu, Altomonte et al. 2006) enhanced lipogenesis and liversteatosis
was observed. However inhibition of FoxO1 in the liver does not change glucokinase
expression (Altomonte, Richter et al. 2003). It was evidenced that downstream of
insulin signaling SREBP-1c, HNF4 and hypoxia-inducible factor 1 regulate
glucokinase expression in addition to FoxO proteins (Roth, Curth et al. 2004). The
disparity observed in accordance with insulin sensitivity and lipogenesis results from
the feedback loop that increases insulin signalling thereby regulating lipid metabolism
in a FoxO1-independent manner through SREBP-1c. Additionally these differences
could be caused due to variation in experimental models, extent of overexpression,
and the time of judgement on the subject of fasting and feeding (Gross, van den
Heuvel et al. 2008). In addition FoxO1 plays an important insulin-dependent role in
assembly and perseverance of very low-density lipoproteins (VLDL) in circulation.
This effect is attained via transcriptional regulation of ApoCIII and microsomal
triglyceride transfer protein (MTP) that plays a pivotal role in regulating the circulation
of triglycerides during the periods of starvation (Kamagate, Qu et al. 2008). ApoCIII
function as lipoprotein lipase (LPL) inhibitor the enzyme involved in hydrolysis of TG
in VLDL and chylomicrons. FoxO1 increases the transcriptional activity and secretion
of ApoCIII during fasting and thus extends the endurance of VLDL in circulation

Introduction
21
(Altomonte, Cong et al. 2004). Importantly during insulin resistance states, due to
continous activation of FoxO1 results in hypertriglyceridemia and hyperglycemia
(Kim, Zhang et al. 2011). Consistently elevated ApoCIII levels are linked with
impaired hydrolysis and defective clearence of TG culminating in accumulation of TG
and augmenting hypertriglyceridemia (Ito, Azrolan et al. 1990; Shachter 2001).
1.2.3 Role of FoxO transcription factors in pancreatic β-cells
Glucose homeostasis is dependent on genuine beta cell function and on pancreatic
beta cell mass. Among the forkhead transcription factors FoxO1 is predominently
expressed in the pancreas and regulates pancreatic and duodenal homeobox factor-
1 (Pdx-1) (Kitamura, Nakae et al. 2002). It was shown that haploinsufficiency of
FoxO1 restores the insulin sensitivity in insulin resistant Irs2 knockout mice by
increasing β-cell proliferation and restoring Pdx-1 expression (Nakae, Biggs et al.
2002). On the other hand gain-of-function of FoxO1 in the liver and pancreatic β-cells
leads to diabetes owing to combined effect of elevated hepatic glucose production
and altered β-cell compensation due to reduced Pdx-1 expression (Nakae, Biggs et
al. 2002). FoxO1 by inhibiting FoxA2 decreases Pdx-1 expression and β-cell
proliferation (Kitamura, Nakae et al. 2002), FoxA2 is another member of the fork
head family function as positive regulator of Pdx-1 expression (Lee, Sund et al.
2002). During metabolic stress conditions FoxO1 attenuate the replication of β-cells
and neogenesis but maintains the identity and function of β-cells. Conversely in Type
2 diabetes FoxO1 participates in diverse mechanisms including ER, oxidative,
hypoxic stress, inflammation, raised apoptosis, inadequate proliferation,
unconstrained autophagy and dedifferentiation results in β-cell dysfunction (Kitamura
2013). The significance of fine-tuning FoxO1 action in β-cells may provide therapeutic
targets against type 2 diabetes (Buteau and Accili 2007; Kluth, Mirhashemi et al.
2011).
1.3 Liver is a " complex metabolic " organ
Multicellular organisms have developed systematic nutrient storage strategies in
evolution. Controlled by hormones as well as energy sensors and nutrient, the
metabolic system reacts to environmental conditions by storing or utilizing nutrients.

Introduction
22
This system optimizes metabolic balance, e.g. lack of metabolites in glucose
metabolism will stimulate catabolic pathways like glycogenolysis or lipid β-oxidation
(Sun, Miller et al. 2012). The liver is a central organ for metabolic regulation including
glucose homeostasis regulating glucose transport, gluconeogenesis, glycolysis,
glycogenesis, glycogenolysis and integrates both cell-nonautonomous and cell-
autonomous mechanisms to command glucose release into the blood stream (Lin
and Accili 2012). During the postprandial period the elevated levels of plasma
glucose stimulate insulin secretion from pancreatic β-cells. Insulin, after binding to its
receptors on the plasma membrane of liver, muscle, and adipose tissues activates
glycogenesis and glycolysis in liver and muscle simultaneously inhibiting hepatic
glycogenolysis and gluconeogenesis to avert hyperglycemia (Saltiel and Kahn 2001).
Additionally, insulin stimulates the synthesis of triglycerides through de novo
lipogenesis and prompting the mobilization of triglycerides from liver to adipose
tissue. As a consequence blood glucose levels are reduced in the body by the action
of insulin (Jitrapakdee 2012). During starvation, pancreatic α-cells secrete glucagon
in response to low blood glucose levels (Jiang and Zhang 2003) which triggers fat
mobilization from adipose tissue to skeletal muscle for β-oxidation. As a result many
substrates are released which serve as precursor for hepatic gluconeogenesis. In
short-term glycogenolysis and in long-term gluconeogenesis are the sources for
glucose production. The glucose released serves as a fuel for brain and red blood
cells / erthrocytes (RBCs) (Figure 4).

Introduction
23
Figure 4: Effects of Insulin and Glucagon during starvation and feeding
(Jitrapakdee 2012) A. During feeding conditions in response to glucose insulin released from
pancreatic beta cells acts on its target tissues liver and muscles to promote glycolysis and
glycogenesis. Insulin also promotes de novo lipogenesis and mobilization of triglycerides in liver and
adipose tissue. B. In fasting glucagon released from pancreatic alpha cells stimulate fat mobilization
and β -oxidation from adipose tissue to skeletal muscle to provide increased substrates for
glycogenolysis and gluconeogenesis in the liver. The glucose released serves as a fuel for brain and
RBCs. RBC, red blood cell; TG, triglycetides; FFA, free fatty acid; yellow hexagons, glucose; pink
circles, insulin; white circles, triglycerides; green circles, glucagon.
Gluconeogenesis occurs predominantly in the liver and is regulated at the
transcriptional level of key enzymes, like phosphoenolpyruvate carboxykinase
(Pepck) (Hanson and Reshef 1997), glucose-6-phosphatase (G6pc) (Zhang, Patil et
al. 2006), and pyruvate-dehydrogenase kinase 4 (Pdk4). Pdk4 inhibits pyruvate
dehydrogenase by phosphorylation providing pyruvate as gluconeogenic substrates
(Wei, Tao et al. 2011). Two other critical enzymes are pyruvate carboxylase (Pc)
(Utter and Keech 1960) and fructose-1,6-biphosphatase (Fbpase) (O'Brien and
Granner 1996). These enzymes are involved in the direct rapid regulation of hepatic
glucose production.

Introduction
24
1.3.1 Regulation of hepatic glucose production
Glucose after intestinal absorption enters the hepatocytes (Figure 5) (Bechmann,
Hannivoort et al. 2012). Glucose transporter 2 (Glut2) internalises glucose through
the hepatocytes membrane. In hepatocytes, liver glucokinase (GCK) converts
glucose to glucose-6-phosphate (Agius 2008). Mutations in GCK have been
correlated with the pathogenesis of insulin resistance in diabetes (Miller, Anand et al.
1999; Cuesta-Munoz, Tuomi et al. 2010). Glucose-6-phophate is the most critical
intermediate in the regulation of hepatic glucose metabolism, it is degraded during
glycolysis to provide energy and the final product pyruvate is decraboxylated to
acetyle-CoA which enters into intramitochondrial TCA cycle finally linking glucose
and lipid metabolism as acetyle-CoA is the substrate for de novo lipogenesis (DNL).
Furthermore, glucose-6-phosphate can be degraded in the pentose phosphate
pathway shunt further providing the reduction equivalents (NADPH) for DNL.
Figure 5: Regulation on hepatic glucose metabolism (Bechmann, Hannivoort et

Introduction
25
al. 2012). A. The insulin-independent glucose transporter 2 (GLUT-2) pump glucose over the
membrane. Glucokinase regulatory protein (GCKR) induces a confirmational change to export
glucokinase (GCK) in the cytoplasm. Glucokinase then phosphorylate glucose to glucose-6-phosphate
(Glu-6-P). Nuclear receptor signalling and insulin transcriptionally regulate Glucokinase. B. The central
intermediate in hepatic glucose metabolism is glucose-6-phosphate it is degraded in glycolysis to
provide energy in the form of ATP and results in production of pyruvate, which enters into
tricarboxylicacid (TCA) cycle. Glucose-6-phosphate is degraded in pentose phosphate pathway shunt
to provide NADPH a substrate for de novo lipogenesis (DNL). Acetyl-CoA also links glucose and lipid
metabolism and serve as a substrate for DNL.
1.3.2 Regulation of transcription factors controlling gluconeogenesis
In response to hypoglycemic conditions during fasting pancreatic α-cells secrete
glucagon. Activation of glucagon signalling increases cAMP levels, which stimulate
protein kinase A (PKA) activity, and eventually promotes CREB phosphorylation
(Authier and Desbuquois 2008). CREB is critical regulator of the hepatic
gluconeogenic programme in mice (Koo, Flechner et al. 2005). CREB-regulated
transcriptional coactivator 2 (CRTC2 also reffered to as TORC2) (Shaw, Lamia et al.
2005) enters into the nucleus to interact with phospho-CREB and binds to cAMP-
response element (CRE) to regulate the expression of gluconeogenic target genes
like phosphoenolpyruvatecarboxykinase (PEPCK) and glucose-6-phosphatase
(G6Pase) (Mayr and Montminy 2001). During this period another coactivator, the
NAD-dependent deacetylase sirtuin-1 (SIRT1) is activated, which deacetylates
peroxisome proliferator activated receptor γ-1α (PGC-1α) (Nemoto, Fergusson et al.
2005) (Brunet, Sweeney et al. 2004; Rodgers and Puigserver 2007) and FoxO
transcription factors (Frescas, Valenti et al. 2005). PGC-1α interacts with FoxO1 and
with hepatic nuclear factor-4 to regulate the expression of gluconeogenic target
genes (Li, Monks et al. 2007). Additionaly, increased glucocorticoid concentrations
during fasting allows binding of glucocorticoid receptors (GR) to their respective
binding elements (GRE) in the nucleus to regulate the transcription of gluconeogenic
target genes (Schoneveld, Gaemers et al. 2004). On the other hand during feeding
states, insulin signalling gets activated and results in phosphorylation of FoxO and
CRTC2 hence transcriptional inactivation and cytoplasmic exclusion (Brunet 2004).
High levels of insulin also limit SIRT1 activity, which results in PGC-
1α transcriptional inactivation. Transcriptional activities of several hepatic nuclear

Introduction
26
factors (HNFs) are modulated by interaction with the corepressor “small heterodimer
partner (SHP)” (Yamagata, Daitoku et al. 2004) and DAX1 the dosage-sensitive sex
reversal adrenal hypoplasia congenital critical region on the X chromosome gene 1
(DAX-1). Both DAX-1 and SHP function as corepressors and expressed in the liver in
response to fed conditions (Nedumaran, Hong et al. 2009). All these events lead to
transcriptional inactivation and attenuation of hepatic glucose production during
feeding conditions (Figure 6).

Introduction
27
Figure 6: Hepatic transcriptional modulation of gluconeogenic enzymesG6Pase and PEPCK during fasting (A) and Feeding (B) conditions (Jitrapakdee2012)
A. During fasting conditions due to low glucose level pancreatic α-cells release glucagon and
glucocorticoids. The resulting activation of glucagon signalling signals several transcription factors
involved in the regulation of gluconeogesis such as PGC-1a, CREB, CRTC2, FOXO1 to move into the
nucleus and bind to their respective promoters to regulate gluconeogenic enzymes such as glucose-6
-phosphatase (G6Pase) and phosphoenolpyruvatecarboxykinase (PEPCK). B. However, during
feeding conditions insulin released from pancreatic β-cells in response to high glucose levels results in
activation of insulin signalling that inactivate and cause nuclear exclusion of transcription factors such
as FOXO1 and CRTC2 critical for gluconeogenesis. In addition certain other transcription factors
important for glconeogenesis such as hepatic nuclear factors (HNFs) and PGC-1α are modulated by
corepressors such as SHP and DAX-1 resulting in overall inhibition of gluconeogenesis during feeding
conditions.
1.3.3 Regulation of hepatic Lipid metabolism
Fattyacids are metabolized with in the hepatocytes to yield energy serving as a feul
during the process of starvation. Under normal physiologic conditions free fatty acids
(FFA) derived from lipid breakdown in the adipose tissue are taken up by fatty acid
transporters (FATP2 and FATP5) into the hepatocytes under the control of insulin

Introduction
28
signalling and nuclear receptor (Figure 7). Fatty acids are oxidized
intramitochondrially thereby generating acetyl-CoA that enters into the tricarboxylic
acid cycle (TCA). Triglycerides (TAGs) synthesized from denovo lipogenesis are
stored in the form of lipid droplets (LP) or packaged into very low-density lipoprotein
(VLDL) and thus released into blood stream. Depending upon the nutritional status
fatty acids are again released from the lipid droplet by the process of autophagy to
provode energy. (Shibata, Yoshimura et al. 2009; Singh, Kaushik et al. 2009). An
impaired hepatic glucose and lipid metabolism leads to the development of type2
diabetes (Bouche, Serdy et al. 2004).
Figure 7: Hepatic lipid metabolism (Bechmann, Hannivoort et al. 2012)
Under normal physiological conditions fatty acids enter into the hepatocytes and oxidized
intramitochondrially to release energy and acetyl-CoA that enter into TCA cycle. Triglycerides
synthesized are either stored as lipid droplets LP or package into very low-density lipoprotein VLDL.
The LD also serves as a source of feul during caloric restriction and is released by the process of
autophagy.

Introduction
29
1.4 Diabetes mellitus
Diabetes mellitus is represented by high blood glucose levels (Table 3) as a result of
insufficient insulin action for the body´s need. It is a major healthcare problem
because it increases the risk for several other diseases e.g cardiovascular disease,
renal failure, and peripheral neuropathy. As a consequence it places a severe
economic burden on healthcare systems and governments. It is a heterogeneous
disorder with insulin resistance and pancreatic β-cell dysfuntion. (Nolan, Damm et al.
2011; Ashcroft and Rorsman 2012).
Table 3: Diagnostic criteria for diabetes, Imapired fasting glucose (IFG),Impaired glucose tolerance (IGT) (Nolan, Damm et al. 2011)
Diabetes
(WHO and ADA)
IFG and IGT
(WHO)
Prediabetes
(ADA)
HbA 1c ≥6.5% NA ≥ 5.7% and < 6.5%
Fasting plasmaglucose (mmol/L)
≥ 7.0 (≥ 126 mg/dl) IFG ≥ 6.1 and < 7.0 ≥ 5.6 and < 7.0
75g OGTT post-
load plasma
glucose (mmol/L)
2h,≥11.1(≥ 200 mg/dl) IGT 2h ≥ 7.8 and < 11.1 2h ≥ 7.8 and < 11.1
Random glucose
(mmol/L)
≥11.1 (≥ 200 mg/dl) with
classic symptoms
NA NA
Although the diagnostic criteria of World health organization (WHO) and American
diabetes association (ADA) for diabetes are identical, the measures to assess
intermediate hyperglycemia or prediabetes are different. IFG: impaired fasting
glucose, IGT: impaired glucose tolerance, HbA1c: glycated haemoglobin A1c. NA:
not applicable, OGTT: oral glucose tolerance testing.
1.4.1 Type 2 Diabetes mellitus
Type 2 diabetes mellitus is a complex disorder characterized by hyperglycemia, and
altered lipid metabolism caused by β-cell dysfunction (mainly impaired insulin

Introduction
30
secretion) and inactivity, overnutrition, obesity and peripheral insulin resistance
(Nolan, Damm et al. 2011; Ashcroft and Rorsman 2012). Type 2 diabetes accounts
for almost 90% of diabetes cases worldwide. The prevelance of diabetes is higher in
middle-income and upper-middle countries. When people become richer they often
eat more fat-rich and sugar-rich diet and are less physically active. The International
Diabetes Federation in 2011 announced that 336 million people across the world are
suffering from type 2 diabetes and the disease leads to 4.6 million deaths each year.
The highest death rate (more than one million) occurs in China and less than a
million are in India. The highest prevelance of diabetes occurs in Middle East
countries due to their rapid economic development with Qatar having (23%) the
highest prevelance in the world followed by (19%) in United arab emirates (UAE),
Egypt and Saudi Arabia (Scully 2012) (Ashcroft and Rorsman 2012).
Hyperglycemia is an increase of blood sugar levels it occurs as a result of insufficient
insulin production or enough insulin is being produced from pancreatic β-cells but the
body is not making an effective use of insulin followed by insulin resistance and type
2 diabetes. Under insulin resistance conditions insulin production by pancreatic β-
cells increases to meet the high demand resulting in an increase of β-cell mass and
compensatory hyperinsulinemia. The major contributors of insulin resistance and
impaired glucose tolerance are obesity and overweight. Abormalities in hormones
such as impaired insulin secretion, impaired glucagon secretion, reduced secretion of
the incretin glucagon-like-peptide1 (GLP-1), reduced glucose uptake by skeletal
muscle and adipose tissue, and increased concentration of other counter regulatory
hormones promotes insulin resistance and hyperglycemia in type 2 diabetes
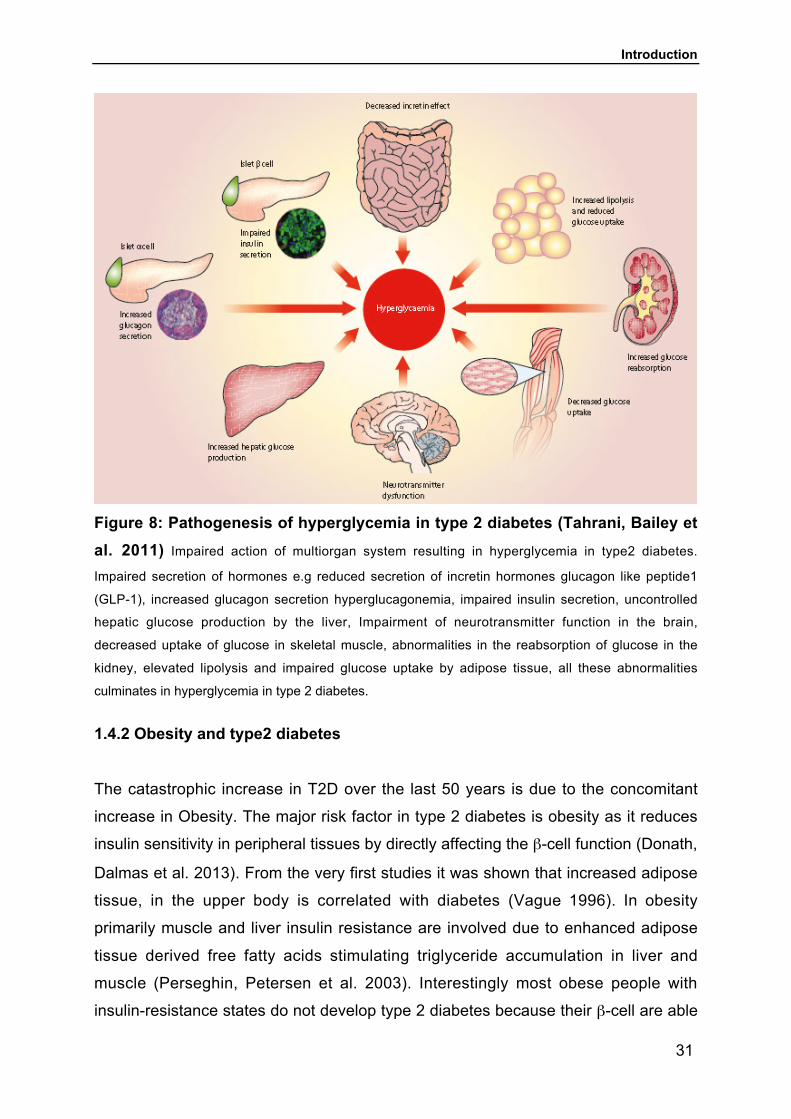
(Tahrani, Bailey et al. 2011) (Figure 8).
Introduction
31
Figure 8: Pathogenesis of hyperglycemia in type 2 diabetes (Tahrani, Bailey etal. 2011) Impaired action of multiorgan system resulting in hyperglycemia in type2 diabetes.
Impaired secretion of hormones e.g reduced secretion of incretin hormones glucagon like peptide1
(GLP-1), increased glucagon secretion hyperglucagonemia, impaired insulin secretion, uncontrolled
hepatic glucose production by the liver, Impairment of neurotransmitter function in the brain,
decreased uptake of glucose in skeletal muscle, abnormalities in the reabsorption of glucose in the
kidney, elevated lipolysis and impaired glucose uptake by adipose tissue, all these abnormalities
culminates in hyperglycemia in type 2 diabetes.
1.4.2 Obesity and type2 diabetes
The catastrophic increase in T2D over the last 50 years is due to the concomitant
increase in Obesity. The major risk factor in type 2 diabetes is obesity as it reduces
insulin sensitivity in peripheral tissues by directly affecting the β-cell function (Donath,
Dalmas et al. 2013). From the very first studies it was shown that increased adipose
tissue, in the upper body is correlated with diabetes (Vague 1996). In obesity
primarily muscle and liver insulin resistance are involved due to enhanced adipose
tissue derived free fatty acids stimulating triglyceride accumulation in liver and
muscle (Perseghin, Petersen et al. 2003). Interestingly most obese people with
insulin-resistance states do not develop type 2 diabetes because their β-cell are able

Introduction
32
to compensate for increase demand of insulin secretion and this is influenced by their
strong genetic constitution (Bergman 2005; Ashcroft and Rorsman 2012). Many
healthy overnourished obese individuals do not develop diabetes they safely deposit
the excess calories to subcutaneous adipose tissue (SAT) rather then to skeletal
muscle, liver, heart and islet β-cell as a result the key organs of the body are not
effected due to following processes including compensation of islet β-cell,
development of minimal insulin resistance and less increase in liver fat (Wajchenberg
2000; Stefan, Kantartzis et al. 2008) (Figure 9). Conversely susceptible
overnourished people develop diverse metabolic defects: inability of β-cell to
compensate for fuel surfeit, hyperadiponectinemia, adipose tissue inflammation,
impaired hepatic glucose production and devlopment of peripheral insulin resistance
(Kahn 2003; Defronzo 2009). A strong interplay between genetics, diabetes and
obesity is evidenced by a report showing that triglyceride emulsion in a non-diabetic
people who had first-degree relatives with T2D showed decrease in insulin secretion
but not in others (Kashyap, Belfort et al. 2003). This showed that genetic differences
become obvious only in the presence of elevated fat.

Introduction
33
Figure 9: Pathways and related complications of type 2 diabetes (Nolan, Dammet al. 2011) .
Additionally several mechanisms such as: tissue inflammation, lipotoxicity (caused by
ectopic lipid accumulation or elevated free fatty acids (FFA), glucotoxicity (caused by
sustained hyperglycemia), oxidative stress (caused by FFA or glucose) and
endoplasmic reticulum stress (ER) have been shown to impair insulin secretion,
induce pancreatic β-cell dysfunction and insulin resistance in type 2 Diabetes (Wilcox
2005) (Donath and Shoelson 2011; Samuel and Shulman 2012).

Introduction
34
1.4.3 Factors controlling β-cell mass and T2D
Several studies points to the reduction of β-cell mass in T2D although there is a
continuous ongoing debate about this controversy and it is also unclear whether T2D
occurs as a result of reduced β-cell mass or it developed as a consequence of
sustained hyperglycemia (Ashcroft and Rorsman 2012). It was also evidenced that
reduced number of β-cell rather than impaired β-cell function are the major
contributors of T2D (Butler, Janson et al. 2003). β-cell mass is also influenced by
long term insulin secretion and certain growth hormones prolactin, placental lactogen
and GLP1 increases β-cell proliferation in addition to glucose stimulated insulin
secretion and insulin gene expression (Nielsen, Galsgaard et al. 2001; MacDonald,
El-Kholy et al. 2002). Importantly on the other hand β-cell hyperplasia in insulin
resistance states driven by liver-derived systemic factors has also been reported (El
Ouaamari, Kawamori et al. 2013). Furthermore the role of betatrophin hormone,
which is primarily expressed in liver and fat induces a dramatic increase in β-cell
proliferation, β-cell expansion and improves glycemic control in mouse models of
insulin resistance (Yi, Park et al. 2013). It is uncertain that how much β-cell mass is
needed for the proper glycemic control nevertheless it was suggested that 40% of β-
cell mass is sufficient for normal glucose homeostasis and it is supported by the
notion that removal of almost half of pancreas has only a small effect on glucose
tolerance (Menge, Tannapfel et al. 2008). This suggests that although β-cell mass
plays some important role in T2D but this is not the only, or even the most pivotal,
factor in T2D (Ashcroft and Rorsman 2012).
1.4.4 Molecular mechanism of Insulin resistance
Disruption of insulin signaling, at different levels of insulin signalling pathways are the
major characteristic of insulin resistance states (Kwon and Pessin 2013). Insulin
resistance at the molecular level can be acquired by either decreased or increased
degradation or decreased transcriptional activities of critical components of insulin
signalling cascade e.g IRS1, IRS2 (Bar, Harrison et al. 1979; Shimomura, Matsuda et
al. 2000; Zhande, Mitchell et al. 2002). It was reported previously that increased
stimulation of SREBP1-c could inhibit transcription of IRS-2 levels (Ide, Shimano et

Introduction
35
al. 2004) suggesting that interaction between signalling components regulate one
another. Serine phosphorylation of insulin receptor and IRS proteins by ERK, PKB
and the oxidative stress kinases JNK and IKKβ can impair their tyrosine kinase (Liu,
Paz et al. 2001) (Gao, Hwang et al. 2002; Hirosumi, Tuncman et al. 2002) activity
and futher association with 14-3-3 proteins cause the removal from the insulin
signalling pathways (Craparo, Freund et al. 1997). Several inhibitory proteins can
interact with components of insulin signalling cascade to produce insulin resistance
such as several inflammatory cytokines induce the suppressors of cytokine signalling
proteins (SOCS) which binds to insulin receptor and attenuate insulin signalling
pathway (Emanuelli, Peraldi et al. 2000; Rui, Yuan et al. 2002) (Figure 10).
Additionally insulin resistance can be due to increase in amount and activities of
phosphotyrosine phosphatases enzymes that normally reverse insulin action e.g
PIP3 phosphatases, PTEN and SHIP (Nakashima, Sharma et al. 2000; Clement,
Krause et al. 2001). Finally the phenotype of insulin resistance depends on the exact
components of affected insulin signalling pathway and the exact tissues in which the
components of insulin signalling are affected (Biddinger and Kahn 2006).
Figure 10: Molecular events that can result in insulin resistance (Biddinger andKahn 2006)

Introduction
36
1.4.5 Genetics of Type 2 Diabetes mellitus (T2DM)
Genome wide association (GWAS) and linkage studies have discovered more than
60 genes correlated with increased risk of type2 diabetes mellitus (Morris, Voight et
al. 2012) (Bonnefond, Froguel et al. 2010; McCarthy 2010; Taneera, Lang et al.
2012). Several studies have shown that many of these genes are important for β-cell
function, β-cell development, regulation of β-cell mass and some are associated with
hepatic glucose production, insulin resistance and predisposition to obesity such as
FTO (fat mass and obesity-related gene). Although it is uncertain how these genes
predispose to full blown diabetes (Bonnefond, Froguel et al. 2010; McCarthy 2010).
The important diabetes suscebtible gene identified is TCF7L2 a transcription factor
(T-cell factor 7 like-2) involved in WNT signalling. It has been shown that the risk
allele for TCF7L2 was associated with altered insulin secretion and improved hepatic
glucose production rate (Lyssenko, Lupi et al. 2007; McCarthy, Rorsman et al. 2013).
Other genes involved in impaired β-cell function include (KCNJ11, TCF7L2, WFS1,
HNF1B, SLC30A8, CDKAL1, IGF2BP2, CDKN2A, CDKN2B, NOTCH2, CAMK1D,
THADA, KCNQ1, MTNR1B, GCKR, GCK, PROX1, SLC2A2, G6PC2, GLIS3,
ADRA2A, and GIPR) and some important genes involved in impaired insulin
senstivity include (PPARG, IRS1, IGF1, FTO, and KLF14) (Nolan, Damm et al. 2011)
(Figure 11).

Introduction
37
Figure 11: Genetic risk factors associated with type 2 diabetes (McCarthy 2010)
1.4.6 Animal models of type 2 diabetes
Several invivo genetic models are greatly useful as they provide new awareness into
the functions of human diseases. Obesity, insulin resistance and type 2 diabetes can
be induced by various diet/nutritional, chemical, surgical agents and knockout or
transgenic approaches (Table 4) (Chatzigeorgiou, Halapas et al. 2009) . The most
characteristic examples of T2DM model include db/db, ob/ob and Zucker fatty rat
(ZFR). The diabetic models db/db and ob/ob mice develop obesity due to autosomal
recessive mutations in leptin and leptin receptors genes that finally leads to diabetes.
While Zucker fatty rats (ZFR) phenotype is associated with hypothalamic defect in
leptin receptor signalling, and particular inbreeding of zucker fatty rat for
hyperglycemia gave birth to zucker diabetic rats (ZDF). Of these models the ob/ob
mouse and zucker fatty rat (ZFR) is characterized by mild to moderate
hyperglycemia, hyperinsulinemia, hyperphagia, obesity and insulin resistance. These
mice do not develop diabetes because of compensatory action of `sturdy´ pancreatic
β-cells capable of maintaining lifelong insulin secreting capacity (Durham and Truett
2006; Srinivasan and Ramarao 2007; Chatzigeorgiou, Halapas et al. 2009). On the
other hand zucker diabetic fatty rats (ZDF) and db/db mouse have pancreatic β-cells

Introduction
38
which are `labile or brittle´ enabling only for a short-term hyperinsulin secretion for
obesity.
Eventually as a result of other environmental and genetic predisposition factors it
induces pressure on pancreatic β-cells for insulin secretion and which ultimaltely
leads to apoptosis, degranulation and overt hyperglycemia. At this stage, the animals
lose their accumulated fat, suffer from ketosis and require lifelong insulin therapy.
This ZDF rat and db/db mouse resemble nearly to type 2 diabetes of humans
(Srinivasan and Ramarao 2007).
Table 4: Animal models of type 2 diabetes (T2D) (Srinivasan and Ramarao2007)
Model category Type 2 diabetic modelsObese Non obese
Spontaneous or geneticallyderived diabetic animals
ob/ob mousedb/db mouseKK mouseKK/Ay mouseNZO mouseNONcNZO10 mouseTSOD mouseM16 mouse
ZDF ratSHR/N-cp ratJCR/LA-cp ratOLETF ratObese rhesus monkey
Cohen diabetic ratGK ratTorri rat Non obese C57BL/6(Akita) mutant mouse
ALS/Lt mouse
II. Diet/nutrition induced diabeticanimals
Sand ratC57/BL 6J mouseSpiny mouse
III. Chemically induced diabeticanimals
GTG treated obese mice
IV. surgical diabetic animals VMH lesioned dietary obesediabetic rat

Introduction
39
V. Transgenic/knock-outdiabetic animals
β3 receptor knockout mouseUncoupling protein (UCP1)knock-out mouse
Low dose ALX or STZ adultrats, mice, etc.Neonatal STZ rat
Par t ia l pancreatectomizedanimals e.g. dog, primate, pig &rats
Transgenic or knockout miceinvolving genes of insulin andinsul in receptor and i tscomponents of downstreaminsulin signalling e.g.
IRS-1, IRS-2, GLUT-4, PTP-1Band othersPPAR-C tissue specific knockoutMouse
Glucokinase or GLUT 2 geneknockout mice
Human islet amyloid
1.5 Metformin
1.5.1 Metformin as an anti-hyperglycemic agent
The most widely recommended drug to treat hyperglycemia in patients with type 2
diabetes is Metformin (1,1-dimethylbiguanide), a derivative of biguanide. According to
the guidelines of American Diabetes Association and European Association of the
Study of Diabetes, Metformin is used as the first line of oral therapy (Adler, Shaw et
al. 2009; Nathan, Buse et al. 2009). Additionally Metformin is also used for treating
several other diseases e.g as cancer preventive drug (Marchesini, Brizi et al. 2001;
Evans, Donnelly et al. 2005; Ben Sahra, Le Marchand-Brustel et al. 2010), in cases
with fatty liver diseases (Nair, Diehl et al. 2004), in pregnancy during gestational
diabetes (Rowan, Hague et al. 2008; Balani, Hyer et al. 2009), and to reduce
macrovascular and microvascular complication in T2D (Hurst and Lee 2003). In
cases with type 2 diabetes metformin is recently being prescribed to at least 120
million people worldwide and the antihyperglycemic effect of metformin works by
lowering the blood glucose concentrations without causing overt hypoglycemia
(Viollet, Guigas et al. 2012). It was shown that metformin is the best insulin sensitizer
in cases of insulin resistance where metformin reduces the fasting plasma insulin

Introduction
40
levels. Metformin improves insulin sensitivity through positive effects on activation of
insulin signalling by increased tyrosine kinase activity and increased insulin receptor
expression (Gunton, Delhanty et al. 2003). It has been shown from animal models
and clinical studies that metformin reduces hepatic glucose production principally by
inhibiting hepatic gluconeogenesis (Cusi, Consoli et al. 1996; Hundal, Krssak et al.
2000; Natali and Ferrannini 2006). Metformin-induced attenuation of hepatic glucose
production is mediated by changes in enzymatic activities and decreased uptake of
gluconeogenic substrates to liver. It is shown in high-fat diet insulin resistant rats that
metformin lowers hepatic gluconeoenesis by inhibiting the activity of glucose-6-
phosphatase (G6pc) (Argaud, Roth et al. 1993; Radziuk, Zhang et al. 1997; Mithieux,
Guignot et al. 2002).
1.5.2 Mechanism of Metformin action
The exact and precise mechanism of hepatic metformin action is a matter of debate
and still unknown. The explanation of such a mechanism is pivotal issue as it may
unveil new targets for the treatment of type 2 diabetes. Metformin at the physiological
pH exist as organic cation acts as a hydrophilic base and can only pass through the
plasma membrane by passive diffusion (Detaille, Guigas et al. 2002; Viollet, Guigas
et al. 2012). The cationic transporters, which are involved in the intracellular
internalization of metformin, are (OCTs). OCT1 transport metformin to the liver and
OCT2 transports metformin to the kidney (Graham, Punt et al. ; Shu, Sheardown et
al. 2007). Metformin is mostly acculmulated in the liver than in any other tissues
(Wilcock and Bailey 1994). The molecular targets and mechanism of Metformin
action was difficult to achieve for several years. It has been shown that multiple
actions of Metformin are associated with activation of AMPK (AMP-activated protein
kinase) (Zhou, Myers et al. 2001). AMPK is serine/threonine protein kinase, which is
phylogenetically conserved among eukaryotes. Under stress condition activation of
AMPK protect the cellular functions. AMPK exists as heterodimeric complexes
comprising a catalytic-α subunit, two regulatory subunits β and γ (Corton, Gillespie et
al. 1994; Viollet, Guigas et al. 2012) (Hardie, Scott et al. 2003; Kahn, Alquier et al.
2005). AMPK is activated under cellular stress conditions, an increased cellular
AMP/ATP ratio or when ATP is depleted (Hardie, Scott et al. 2003; Carling 2004;
Hardie 2004; Viollet, Guigas et al. 2012). AMP promotes the AMPK activation, by

Introduction
41
stimulating phosphorylation at a critical threonine residue (Thr172) of the kinase
domain at catalytic-α subunit. AMPK is activated by upstream kinases such as
serine/threonine kinase 11 (STK11/LKB1) identified as tumor suppressor (Viollet,
Guigas et al. 2009). When AMPK is activated it turn off the anabolic pathways and
triggers the catabolic pathways as a result production of glucose, lipid synthesis and
protein synthesis are inhibited and utilization of glucose and oxidation of fatty acid get
started.
Of notice it was shown that metformin does not directly activate AMPK, the primary
target for metformin are the mitochondria where metformin blocks mitochondrial
respiratory chain at the complex 1, resulting in lower oxidation of NADH, decreased
pumping of protons across the inner mitochondrial membrane leading to lowering of
proton gradient that results in reduced proton-driven synthesis of ATP (Viollet,
Guigas et al. 2012) (Figure 10). Inhibitory effect of metformin through blocking
mitochondrial respiratory chain complex 1 was shown in isolated hepatocytes and
perfused livers from rodents (El-Mir, Nogueira et al. 2000; Owen, Doran et al. 2000).
It was also shown in human primary hepatocytes that metformin firstly targets
complex 1 of mitochondrial respiratory chain resulting in decreased cellular energy
status that activates AMPK (Stephenne, Foretz et al. 2011).

Introduction
42
Figure 12: Metformin target mitochondrial respiratory-chain complex 1 (Viollet,Guigas et al. 2012). Metformin has a positive charge and can pass across the cell membrane by
passive diffusion and internalized with in the hepatocytes with the help of OCT1 transporters in the
liver. Once the drug is with in the liver mitochondria are the primary targets. Metformin selectively
inhibits the complex-1 of the respiratory chain without affecting the other complexes this causes a
decrease in oxidation of NADH, consumption of oxygen rate and resulting in decreasing proton
gradient across the mitochondrial membranes and subsequently it results in lowering proton-driven
synthesis of ATP.
Importance of AMPK activation in antidiabetic effect by metformin was firstly
supported from the study showing that mice lacking hepatic LKB1 were unable to
lower the blood glucose and this also showed that metformin require LKB1 in the liver
to reduce the levels of blood glucose (Shaw, Lamia et al. 2005). Importantly it was
evidenced that LKB1/AMPK signalling regulates phosphorylation and cytoplasmic
translocation of CREB-regulated transcriptional coactivator 2 (CRTC2 also reffered to
as TORC2) (Shaw, Lamia et al. 2005). CREB is critical regulator of hepatic
gluconeogenic programme in mice (Koo, Flechner et al. 2005). TORC2 interact with
CREB to regulate the expression of PGC-1α and gluconeogenic target genes
phosphoenolpyruvatecarboxykinase (PEPCK) and glucose-6-phosphatase (G6Pase).
Introduction
43
AMPK or AMPK related kinases are involved in the phosphorylation of CRTC2 that
results in degradation of complex and hence inhibiting the gluconeogenic programme
(Koo, Flechner et al. 2005; Shaw, Lamia et al. 2005) (Figure 11).
Furthermore metformin induced activation of AMPK results in the upregulation of an
orphan nuclear receptor small heterodimer partner (SHP), which works as a
transcriptional repressor (Kim, Park et al. 2008). SHP represses the transcriptional
activities of FoxO1, hepatocyte nuclear factor 4-α and a number of nuclear receptors
that are involved in regulation of gluconeogenesis (Lu, Makishima et al. 2000; Lee
and Moore 2002; Kim, Kim et al. 2004; Yamagata, Daitoku et al. 2004). In addition
SHP inhibits hepatic gluconeogenic gene expression through interaction with CREB-
CBP complex and CRTC2 (Lee, Seo et al. 2010). Furthermore metformin induced
inhibition of gluconeogenesis is also supported by the role of Krüpple-like factor 15
(KLF15). Krüpple-like factor 15 is highly expressed in the liver and plays an important
role in the regulation of gluconeogenesis in the liver. Previously it was shown that
KLF15 is up-regulated in diabetic mice with increased expression of PEPCK gene in
the liver (Teshigawara, Ogawa et al. 2005; Gray, Wang et al. 2007). Metformin
suppresses the KLF15 gene expression and induces proteosomal degradation by
promoting its ubiquitination (Takashima, Ogawa et al. 2010).
Interestingly it was further showed by recent reports stating that AMPK and LKB1
activities are dispensable for inhibition of gluconeogenesis by metformin (Foretz,
Hebrard et al. 2010). Indeed metformin inhibits the process of gluconeogenesis
independent of AMPK activation through decrease in hepatic energy status (Miller
and Birnbaum 2010). This decrease in energy status by blocking mitochondrial
respiratory chain complex 1 leads to acute inhibition of gluconeogenesis through
allosteric regulation of key enzymes such fructose-1, 6-biphosphatase independent
of gluconeogenic gene expression (Miller and Birnbaum 2010).
Metformin also play a beneficial role in improving the disorders of lipid metabolism. It
was shown previously in leptin deficient ob/ob mice that metformin improves fatty
liver disease (Lin, Yang et al. 2000; Cool, Zinker et al. 2006). Metformin has also
been proved useful in patients suffering from alcoholic steatohepatitis (Marchesini,
Brizi et al. 2001; Nair, Diehl et al. 2004; Raso, Esposito et al. 2009). Metformin-
induced activation of AMPK inactivates acetyle CoA carboxylase (ACC) by
phosphorylation and activates fatty acid oxidation. ACC is the rate-limiting enzyme for
the production of malonyl-CoA, which is important precursor for the synthesis of fatty

Introduction
44
acids and an important inhibitor for mitochondrial fatty acid oxidation (Zhou, Myers et
al. 2001). In addition metformin-induced activation of AMPK inhibits fatty acid
synthesis through regulating sterol regulatory element-binding protein-1c (SREBP1)
gene expression and thereby inhibiting lipogenesis (Li, Xu et al. 2011).
In summary metformin plays an important role in inhibition of gluconeogenic gene
programme via both AMPK-dependent and AMPK-independent mechanism through
controlling several critical regulatory points (Figure 11) (Viollet, Guigas et al. 2012).
Figure 13: Mechanism of metformin action in controlling hepaticgluconeogenesis (Viollet, Guigas et al. 2012). Metformin attenuate the process of
gluconeogenesis either AMPK-dependent or AMPK-independent signalling pathways through
controlling several critical regulatory points.

Introduction
45
1.6 Aims of study
The interplay between different FoxO family members sharing the conserved DNA
binding domain is far from being understood and this may account for the paradoxical
findings described above (Biddinger and Kahn 2006). Importantly, in addition to
FoxO1, FoxO3 is also significanly expressed in the liver, its contribution to metabolic
regulation has however not been thoroughly analysed. Interestingly FoxO3
genotypes are associated with insulin sensitivity phenotypes and longevity in humans
suggesting that FoxO3 is critical for metabolic control (Willcox, Donlon et al. 2008;
Flachsbart, Caliebe et al. 2009; Pawlikowska, Hu et al. 2009). The relative
contribution of individual FoxO proteins has not been addressed the reason behind
this might be experimental approaches (most of which are loss of function studies),
cell type specific functions and the context-and kinetic-specific stimulation, which
might affect the biological outcome of the FoxO signalling system. Therefore a
refined study using a conditional gain-of-functional model should be capable to unveil
the functions of FoxO3 in the liver under physiological conditions. This would also
help to estimate the usefulness of FoxO3 inhibitors in diabetes therapy. To achieve
this goal, firstly this study was designed to establish a mouse model that allows for
conditional regulation, activation of FoxO3 activity specifically in liver-cells. Further,
The morphological, functional, and biochemical consequences of transgene
expression should be investigated. Specifically the following questions will be
addressed in detail:
1. Does liver-specific expression of constitutively active FoxO3 (LAP-tTA x (tetO)7-
FOXO3CA) interfere with metabolic liver functions?
2. What are the consequences of expression of FoxO3CA in regulation of hepatic
glucose and lipid homeostasis?

Material and Methods
46
2 Materials an Methods
2.1 Mice
We crossed mice expressing the tetracycline-responsive transactivator (tTA) under
the control of the rat liver activator protein (LAP) promoter (Sunami, Leithauser et al.
2012) with mice bearing a constitutively active human FOXO3 allele (FOXO3CA)
(Schmidt-Strassburger, Schips et al. 2011; Schips, Wietelmann et al. 2011) under the
control of a tTA-regulated promoter. Studies were performed on a C57BL/6xNMRI
mixed background. FOXO3CAHep mice contain a bidirectional promoter, which
mediates simultaneous expression of FOXO3 and luciferase that was used for in vivo
imaging analysis and in vitro luciferase assays as described (Schmidt-Strassburger,
Schips et al. 2011; Schips, Wietelmann et al. 2011; Sunami, Leithauser et al. 2012).
Mice were kept in a specific pathogen-free (SPF) animal facility at University of Ulm.
Experiments were approved by the state of Baden-Württemberg in Germany.
2.1.1 Doxycycline administration
To avoid embryonic activation of FOXO3CA, all mice received 0.1g/L doxycycline in
1% sucrose in drinking water during pregnancy untill mice were born. Afterwards, the
doxycycline (DOX) (MP Biomedicals Eschwege) was withdrawn to activate the
FOXO3CA expression and the mice were analysed at 4-weeks of age. To avoid the
developmental defects and lethality at the earlier time point of FOXO3CA activation
the animals received Doxycycline 0.1g/L Doxycycline in 1% sucrose in drinking water
untill the newborn animals reached 5-weeks of age and the Doxycycline was
withdrawn after 5-weeks to activate the expression of FOXO3CA and the animals
were analysed at the age of 7-weeks or at 9-weeks.
2.1.2 Metformin administration
Metformin (1,1-Dimetylbiguanide hydrochloride, D150959, Sigma-Aldrich) was orally
administered in drinking water (1.65 g/l). Schedule of metformin administration is
shown in the (Figure 34). For the analysis at the age of 7-weeks, metformin
administration was performed for the last 3 days untill the animals become 7-weeks.

Material and Methods
47
For the analysis at the age of 9-weeks metformin was administered for three weeks
untill the animals become 9-weeks of age. For each experiment mice were fasted for
6 hours prior to the analysis. During 6 hours fasting period mice drink the normal
drinking water.
2.2 Genotyping
2.2.1 Isolation of genomic DNA
Extraction of genomic DNA was made from the tail tips of mice. Tails were incubated
over night at 56°C for digestion with the DNA lysis buffer (733 µl TNES-buffer with 17
µl proteinase K (20 µg/ µl)). Afterwards, 250µl of 6M NaCl was used and
centrifugation was done at 13000 rpm for 10 min at room temperature. The
supernatent was transferred to a fresh eppendorf tube. Genomic DNA was
precipitated by supplying equal volume of isopropanol to the pellet followed by
centrifugation at 13000 rpm for 10 min. DNA pellet was washed with 500 µl of 70%
ethanol, dried for 10 min. Dried DNA was dissolved in 250 µl sterile ampuwa water.
2.2.2 Polymerase chain reaction (PCR)
The transgenes tTA and FOXO3CA were detected by PCR with specific pair of
primers and applying the following recipe,
Reaction mix:
DNA sample: 2 µl
dNTPs 2mM: 3 µl
5x GoTaq buffer: 6 µl
primers 10 µM: 1µl
water: 16.8 µl
Taq 5000 U/ml: 0.2 µl
Primers sequences:
tTA 5´ gctaggtgtagagcagcctacattg
tTA 3´ gtccagatcgaaatcgtctagcgcg
FOXO3-P17 catggagtctgcggccgtctcc
FOXO3-P48 ggtacccggggatcctctagtcag

Material and Methods
48
PCR programmes
2.3 In Vivo Bioluminescence imaging
To determine liver-specific transgene expression, mice were anesthetized by
continous inhalation of 2% vol/vol isoflurane.and injected intraperitoneally with 25 mM
Luciferin (Synchem OHG) (150µg/g body weight). Bioluminescence was monitored 1
minute after injection by the IVIS imaging system Xenogen IVIS 200 System (Caliper
Life Sciences, Hopkinton, MA, USA) as previously described (Schmidt-Strassburger,
Schips et al. 2011; Schips, Wietelmann et al. 2011; Sunami, Leithauser et al. 2012).
2.4 Metabolic studies
2.4.1 Glucose Tolerance Test (GTT) and Insulin Tolerance Test (ITT)
Glucose Tolerance Test (GTT) and Insulin Tolerance Test (ITT) were performed in 7-
week-old animals. For GTT, animals were fasted for 6 hours during fasting animals
were provided with drinking water, After 6 hour fasting the blood glucose was
measured from the tail vein and then injected with glucose (0.75 g / kg body weight)
intraperitoneally (i.p.). Tail vein blood was collected and blood glucose values were
measured with glucometer (One Touch Ultra II, Life Scan) at the indicated time points
PCR LAP.tTA (tetO)7.FOXO3CA
Start 94°C /3 min 94°C /3 min
Cycles 33 cycles 33 cycles
Annealing
Synthesis
Denaturation
94°C /45 sec
62°C /45 sec
72°C /1 min 20 sec
94°C /45 sec
62°C/ 45 sec
72°C /1 min 20 sec
End 72°C 2 min 72°C 2 min

Material and Methods
49
after every 30 minutes for two hours.
For Insulin tolerance test (ITT), the animals were not fasted they were in the random-
fed state and then injected intraperitoneally (i.p.) with insulin (0.75 U / kg body
weight, Actrapid Penfill Novo Nordisk). Blood glucose levels were measured from tail
vein at the indicated time points after every 15 minutes for 1 hour.
2.4.2 Animal studies
Mice were sacrificed via CO2 inhalation, and blood was collected from vena cava
inferior. After brief centrifugation, serum was collected and used for measurement of
alanine and aspartate aminotranferase levels (ALT and AST) as well as bilirubin,
triglycerides, cholesterol, alkaline phosphatase (ALP), were measured by
(Reflotron,Roche). Albumin, pseudocholinesterase, urea, and creatinine levels were
measured by (Technical University of Munich). Blood glucose measurement was
performed immediately after a collection of tail vein blood with glucometer (One
Touch Ultra II, Life Scan).
2.4.3 Enzyme-linked immunosorbent assay (ELISA)
All the ELISA were performed in serum from 6 hour fasted animals with following kits
Kits Catalog number/ Company
Insulin (90080) from Crystal Chem
glycogen (K648-100) from BioVision
β-hydroxybutyrate / ketone bodies (700190) from Cayman chemicals
All the ELISA were performed according to the manufacturers instruction.
2.5 Protein biochemistry
2.5.1 Protein extraction with Dignam C buffer

Material and Methods
50
Mice were sacrificed by the way of CO2 inhalation; tissues were collected for protein
and RNA isolation and rapidly snap frozen in liquid nitrogen. For preparing the
protein extract for SDS-PAGE the liver tissues were incubated in 3-5 volumes of
Dignam C buffer additionally supplemented with 1mM DTT, Roche complete mini
protease inhibitor (1 tablet/10 ml) and finely grinded with the help of tissue lyser
(Tissue lyser Retch, Qiagen, Germany). Afterwards the crude extract was centrifuged
(13000rpm for 30min at 4 °C) and the pellet was discarded. Finally the protein
concentration in the supernatant was determined by a Bradford assay.
2.5.2 Protein concentration measurement by Bradford method
2 µl of protein extracts made with Dignam C buffer was mixed with 100 µl of 150 mM
NaCl and 900 µl of Bradford reagent and vortexed briefly. Optical density of formed
protein/coomassie-brilliantblue complex was measured in photometer at wavelengths
of 595 nm. Protein concentration in extracts was estimated according standard curve
with known concentrations of bovine serum albumin. Protein extracts were shock-
freezed in liquid nitrogen and stored at -80°C.
2.5.3 In vitro Luciferase reporter gene activity measurement
For the exact determination of transgene expression in protein extracts, luciferase
reporter gene activity was measured with the luminometer Lumat LB9507 (Berthold,
Bad Wildbad). For in vitro luciferase assay, 5 µl of protein extract were incubated with
50 µl of luciferase buffer (20 mM Tris, 1.07mM magnesium carbonate, 2.7 mM
magnesium sulfate, 0.1 mM dimethyl sulfoxide (DMSO), 60 mM dithiothreitol (DTT),
1.06mM adenosine triphosphate (ATP), 0.54 mM coenzymeA (CoA), 1 mM luciferin)
and light emission (RLU) was measured over 15 seconds. From mean values of two
measurements the background activity (Dignam C) was subtracted and the obtained
values were normalized to the amount of protein (RLU/ µg).
2.5.4 Western blotting
For SDS-PAGE 20-50 µg of protein were diluted with the Dignam C buffer to a
specific volume and incubated with the appropriate amount of 4x-Laemmli loading
Material and Methods
51
buffer + 5 % β-mercaptoethanol, freshly added for 10 min at 95 °C.
The protein samples were separated on polyacrylamide gels with a 5 %
polyacrylamide stacking gel (with 0.5 M Tris-HCl pH 6.8, 20 % SDS, APS 10%) and a
resolving gel with 8,10,12.5,15 % polyacrylamide depending on the size of the
proteins to detect (with 1.5 M Tris/HCl pH 8.8, 20% SDS, APS 10%). The gels were
run with the electrophoresis system (CBS Scientific Company, California) in a
Tris/glycine/SDS running buffer (25 mM Tris, 192 mM glycine, 0.1% SDS). With the
Trans-Blot-Cell system (CBS Scientific Company, California) the proteins were
transferred to a nitrocellulose membrane (0.45 µm pore size, Whatman), which was
activated with methanol and washed in the blotting buffer (25 mM Tris, 192 mM
glycine, 0.025 % SDS, 20 % methanol).
The membranes are then washed three times with TBS/Tween (0.1 %). Unspecific
protein binding was blocked by incubation with 5 % dry milk powder in TBS/Tween
(0.1 %) for 1 h at RT followed by incubation with primary antibodies (in blocking
solution) overnight at 4° C. After three washes with TBS/Tween the membranes were
incubated with the HRP-coupled secondary antibody (1:5000 in blocking solution) for
1 h at RT. After additional three washes chemiluminescence signals were developed
with ECL (Super Signal West Dura Extended Duration Substrate Thermoscientific)
and detected with X-ray films.
Similarly β-tubulin was detected on the same membrane as a control for equal
loading. The membrane was sometimes reprobed with several antibodies. If old
bands might mask the new bands to detect, the membrane was stripped by
incubation with 0.2 M NaOH for 5 min, followed by thorough washing and new
blocking. The weterns are performed with the following antibodies listed in (Table 5).

Material and Methods
52
Table 5: Antibodies used for immunostaining and immunoblotting
Antigen source Company Cat.no WB dil IF dil IHC dil
FOXO3/FKHRL Rb Santacruz sc-11351 1:1000 1:100 1:100
AKT Rb Cellsignalling 9272 1:1000
T-308phospho-AKT Rb Cellsignalling 4056 1:1000
S-473 phospho-AKT Rb Cell signalling 9271 1:1000
AMPK Rb Cell signalling 2603 1:1000
T172 phospho-AMPK Rb Cell signalling 2535 1:1000
β-Tubulin Abcam Ab6046 1:5000
K8/18 (Ku, Toivola
et al. 2004)
8592 1:100
Insulin Rb Cellsignalling 4590 1:100 1:100
Cd45 Rb Abcam 10558 1:200
Abbreviations: IB Immunoblot, IF immunofluorescence, dil. dilution, Rb rabbit, IHC
2.6 RNA Analysis
2.6.1 RNA extraction and cDNA synthesis
RNA was extracted from liver samples kept in RNAlater (Qiagen) by RNAeasy Mini
Kit (Qiagen), following the manufacturers instruction. Then the RNA was dissolved in
50 µl of DEPC water and the concentration of RNA was measured with the Nanodrop
1000 spectrophotometer (Thermo Scientific). For purity control the ratio of absorption
at 260/280 nm and 260/230 nm was measured. Complementary DNA was generated
from 2 µg of RNA using MMLV reverse transcriptase (Promega) using the
manufacturers instruction. Quantitative real-time PCR was carried out using qPCR
master mix and corresponding universal probe library on Roche LC480 light cycler
system (Roche). Primers are listed in (Table 6). PCRs were performed in triplicates
according to the manufacturer's instructions, with HPRT used as a reference for
relative quantification. Data were corrected for primer efficiency, which was
determined by serial dilution of cDNA.

Material and Methods
53
Table 6 : List of primers used in real time PCR analysis.
Transcript Probe (UPL) L primer R primer
FoxO3 11 cttcaaggataagggcgaca cgactatgcagtgacaggttg
G6PC 19 Tctgtcccggatctaccttg gaaagtttcagccacagcaa
Pdk4 22 Cgcttagtgaacactccttcg cttctgggctcttctcatgg
Pepck1 49 ggagtacccattgagggtatcat gctgagggcttcatagacaag
Igfbp1 66 Ttcagctcccagcatgaag gggctctcagaaagctcatc
Igfbp2 62 gcgggtacctgtgaaaagag cctcagagtggtcgtcatca
Lepr 50 gcacaaggactgaatttccaa ctgatttcttctgaaatgggttc
Pygl 12 Ccagagtgctctaccccaat ccaccacaaagtactcctgtttc
Cpt1α 70 Gactccgctcgctcattc tctgccatcttgagtggtga
Echs 79 Cgggtgagtctctgagtgc ccagagtgctctaccccaat
Acaca 50 Gcctccgtcagctcagatac tttactaggtgcaagccagacat
FAS 19 Gctgctgttggaagtcagc agtgttcgttcctcggagtg
SREBP1 74 ttcctcagactgtaggcaaatct agcctcagtttacccactcct
Acot11 10 Ccatcgtgaataacgccttt ggtacgcctccacacaca
Acss 63 aaatgtgttccaggatacaatgg atcagatatgggctcattttcc
Apom 78 cccagacatgaaaacagacct gagggtgtggtgaccgatt
Aqp7 84 Ggctccagccagaagtca gggccattgtggagttgt
Gckr 53 Gcttcaatccggtgagca tctcctgcatcttctgcatc
Pklr 79 acttagcaaagtctgctttaagtgg tggcacgtctcaggtatcc
Pdk3 7 aagcagatcgagcgctactc ttcacatgcattatcccttcc
Cpt-1b 92 gagtgactggtgggaagaatatg gctgcttgcacatttgtgtt
Fabp5 46 acggctttgaggagtacatga ctcggttttgaccgtgatg

Material and Methods
54
2.6.2 Gene expression analysis
Microarray analyses were performed using 200 ng total RNA as starting material and
5.5 µg ssDNA per hybridization (GeneChip Fluidics Station 450; Affymetrix, Santa
Clara, CA). The total RNAs were amplified and labeled following the Whole
Transcript (WT) Sense Target Labeling Assay (http://www.affymetrix.com). Labeled
ssDNA was hybridized to Mouse Gene 1.0 ST Affymetrix GeneChip arrays
(Affymetrix, Santa Clara, CA). The chips were scanned with an Affymetrix GeneChip
Scanner 3000 and subsequent images were analyzed using Affymetrix® Expression
Console™ Software (Affymetrix).
A transcriptome analyses was performed using BRB-ArrayTools
(http://linus.nci.nih.gov/BRB-ArrayTools.html). Raw feature data were normalized and
log2 intensity expression summary values for each probe set were calculated using
robust multiarray average (RMA, Irizarry et al., 2003).
Filtering: Genes showing minimal variation across the set of arrays were excluded
from the analysis. Genes whose expression differed by at least 1.5 fold from the
median in at least 20% of the arrays were retained.
Class Comparison: We identified genes that were differentially expressed among the
two classes using a 2 sample t-test. Genes were considered statistically significant if
their P value was less than 0.05 and displayed a fold change between the two groups
of at least 1.5 fold.
We used the multivariate permutation test to provide 90% confidence that the false
discovery rate was less than 10%. To identify the most affected biological processes,
as defined by Gene Ontology annotation, we used the GoMINER analysis tool
(Zeeberg et al., 2003) with minor modification. Complete microarray data are
available at Gene Expression Omnibus (GEO accession number: GSE44977
2.7 Histology
2.7.1 Liver tissue preparation
Livers removed from sacrificed animals were weighed and divided into several pieces
that were fixed in 10% formaldehyde for histological/immunohistochemical analysis,

Material and Methods
55
snap frozen in liquid nitrogen for immunofluorescence staining. Livers were
dehydrated in increasing concentration of ethanol and embedded in paraffin
according to standard histological procedures. From the paraffin blocks horizontal
sections with a thickness of 2 µm were cut with a microtome and mounted on slides
(3-1 sections per slide).
For cryosections, the fresh liver tissue was immediately frozen on a plastic cassette
that was cooled on liquid nitrogen with the help of tissue tek. The frozen tissue was
cut with a cryotome (leica) into 4 µm thick sections (1-2 sections per slide) and stored
at –20 °C.
2.7.2 Immunofluorescence staining of paraffin embedded sections
Before staining paraffin sections were incubated for at least 20 minutes then after
incubation deparaffinized with 3x xylene, and rehydrated with ethanol (2x 100 %,
1x90 %, 1x70 %, water), for at least 5 min per bath. Then the slides were boiled for
antigen retrieval for 15-20 min in a pressure cooker in preheated citric acid buffer (10
mM, pH 6.0, with 0.05 % Tween 20).
After cooling for at least 30 min at RT the slides were incubated for 30 min with 0.5 %
Triton X-100 in PBS for full permeabilization. Then the slides were washed three
times for at least 5 min with PBS. For each slide, liver sections were surrounded with
a PAP- pen to create two independent staining compartments per slide.
To prevent unspecific antibody binding, sections were incubated for 1 h at RT with
blocking solution containing 5 % BSA in PBS in a dark humidified chamber. After
removal of the blocking solution the sections were incubated with the primary
antibodies in blocking solution, usually overnight at 4 °C. After three washes with
1xPBS the slides were incubated with the fluorescently labeled secondary antibodies
(dilution 1:500, labeled with Alexa Fluor 488 (green) or 568/594 (red)) in blocking
solution for 1 h at RT, with DAPI (250 ng/ml) for nuclear counterstaining. After two
additional washes with PBS (in dark), the slide were shortly washed with water and
mounted with a coverglass with mowiol as aqueous mounting medium. TUNEL
staining was performed with an in situ TUNEL cell death detection kit (Roche)
following the manufacturer's instructions. Immunofluorescence staining for Insulin on
pancreas sections was done with the same method as described above.
Alexa Fluor-coupled secondary antibodies for immunofluorescence (goat anti-rabbit

Material and Methods
56
A488/A568, donkey anti-rabbit A594, goat anti-mouse A488/A568, donkey anti-
mouse A594, donkey anti-goat A488, goat anti-rat A488) were obtained from Life
Technologies (Molecular Probes, Paisley, UK) and used in a dilution of 1:500.
2.7.3 Immunofluorescence image aquisition and processing
To avoid bleaching of the fluorescent dyes, the slides were stored in the darkness
and analysed within a few days. Images were taken with the Zeiss Axiovert 200M,
with filters for DAPI, FITC/Alexa Fluor 488, DsRed and Texas Red/Alexa Fluor
568/594. All directly compared images were taken at the same session with the Zeiss
Axiovision-software (version 4.8) with the same settings that were separately
adjusted for each channel. After export to jpg files the final adjustment of total
brightness (equally for all directly compared images) and the cutting of relevant
image parts was performed with Adobe Photoshop.
2.7.4 Quantification of TUNEL staining, Cd45 and Insulin staining
For the quantification of Tunel positive cells and Cd45 positive cells, all the images
were taken at the same settings. Images were obtained using Leica CTR5500
microscope. Cell count was performed manually using ImageJ64 software.
The quantification of insulin staining for pancreatic sections was done with Image J64
software. All the images were taken in the same settings. The settings were made in
the software to calculate the total area (including endocrine as well exocrine), size of
islets and number of the islets the results were plotted by calculating the percentage
of endocrine area.
2.7.5 Immunohistochemical staining of paraffin embedded sections
Before staininng paraffin sections were incubated for atleast 20 minutes then after
incubation deparaffinized with 3x xylene, and rehydrated with ethanol (2x 100 %,
1x90 %, 1x80%, 1x70 %, water), for at least 5 min per bath. Then the slides were
boiled for antigen retrieval for 15-20 min in a microwave in preheated citric acid buffer
(10 mM, pH 6.0, with 0.05 % Tween 20). After cooling for at least 30 min at room
temperature the slides were incubated with primary antibody for 1 hour at RT. The

Material and Methods
57
primary antibody was made in blocking solution (0.1% BSA in PBS). The slides were
then washed 3x in PBS for at least 5 minutes. After washing the slides were
incubated with secondary antibody (Dako/Jackson Immunoresearch) for 1hour. The
slides were washed 3x in PBS and after washing the slides were incubated and
finally developed with two drops of AEC (Dako) on each liver section for 20 minutes.
After 20 minutes incubation the slides were again washed in PBS two times and then
immediately transferred in hematoxylin for 10 sec. The slides were then washed for
10 miutes in water bath with continous supply of water. After washing the slides were
mounted with mowiol and left for air-drying at room temperature.
For k8/k18 staining the sections were blocked with 10% goat serum with 1 %BSA
prior to incubation with primary antibody. After incubation with secondary antibody
slides were developed with permanent red dye systems (Dako). The other procedure
is the same as described above. For Immunohistochemistry secondary antibodies
were purchased from Dako/Jackson Immunoresearch and they were applied 50ml on
everysection of slide.
2.7.6 PAS staining for Glycogen
For PAS (Periodic acid Schiffs) staining for glycogen content the sections were
deparaffinized with 3x xylene, and rehydrated with ethanol (2x 100 %, 1x90 %,
1x80%, 1x70 %, water), for at least 5 min per bath. The slides were incubated in
0.5% periodic acid for 5 minutes. The slides were then washed in distilled water two
times for 3 minutes. The slides were then incubated with Schiff´s reagent and
provided high power in the microwave for 45-60 seconds until the colour was
changed to deep magenta. The slides were then washed in the running tap water for
5 minutes. The slides were counterstained in hematoxylin for 3 minutes. Washed in
running tap water and rehydrated with graded ethanol. The slides were mounted with
entellan and left for air-drying. All the pictures for Immunohistochemical staining and
Hematoxyline staining were taken with (Leica CTR5500) microscope.
2.8 Statistical analyses
Data are shown as means ±SD. Statistical significance was determined using a two-
tailed student t-test P<0.05 was considered significant.

Material and Methods
58
2.9 Reagents and Materials
2.9.1 General chemicals
General chemicals (inorganic chemicals, solvents, standard organic salts, acids)
were purchased from Applichem (Darmstadt), Roth (Karlsruhe), Merck (Darmstadt)
and Sigma (Taufkirchen).
Item Company
Acetic acid (glacial) Merck, Germany
Acetic acid Fluka, Switzerland
Acrylamide solution 40% AppliChem, Germany
Agarose Ultrapure, Electrophoresis Grade Gibco BRL , USA
APS Sigma-Aldrich, Germany
b- Mercaptoethanol AppliChem, Germany
Bromphenolblue Carl Bittmann, Switzerland
BSA (Albumin Fraction V) AppliChem, Germany
Calcium chloride Sigma-Aldrich, Germany
Di- sodium-hydrogen phosphate Sigma-Aldrich, Germany
DTT AppliChem, Germany
EDTA– dihydrate AppliChem, Germany
Ethanol (absolute) Sigma-Aldrich, Germany
Glycerol AppliChem, Germany
Glycine AppliChem, Germany
HEPES Gibco BRL , USA
Hydrochloric acid 37% Sigma-Aldrich, Germany
Hydrogen peroxide AppliChem, Germany
Isopropanol Merck, Germany
Methanol Merck, Germany
Magnesium chloride Sigma-Aldrich, Germany
Non-fat dried milk AppliChem, Germany
Potassium chloride Carl Roth GmbH , Germany

Material and Methods
59
Potassium dihydrogen phosphate Merck, Germany
SDS AppliChem, Germany
Sodium chloride AppliChem, Germany
Sodium dihydrogen phosphate Sigma-Aldrich, Germany
Sodium hydroxide, pellets AppliChem, Germany
Sodium orthovanadate Sigma-Aldrich, Germany
TEMED AppliChem, Germany
Tris (ultrapure) AppliChem, Germany
Tween 20 AppliChem, Germany
Urea AppliChem, Germany
2.9.2 Buffers and solutions
TNES-buffer50 mM Tris-HCl (stock 1M pH 7.5)
0.1M EDTA (stock 0.5 M, pH 8.0)
0.1M NaCl
1 % SDS
Proteinase K (Applichem, Darmstadt) 0.45 µg/ µl)
PBS (10x) pH 7.3 87.65 g/l NaCl
2 g/l KCl
11.7 g/l Na2HPO4
2.4 g/l NaH2PO4
TBS(10x) pH 7.624.2 g/l Tris
80g/l NaCl
TBE (10x)121.1 g/l Tris
61.8 g/l hydroboric acid
7.4 g/l EDTA

Material and Methods
60
Dignam C buffer20 mM Hepes (pH 7.9)
25 % glycerol
0.42 M NaCl
1.5 mM MgCl20.2 mM EDTA
1 mM PMSF
1 mM DTT, 1 tablet/10 ml complete mini protease inhibitor (Roche,
Mannheim)
RIPA buffer50 mM Tris-HCl (stock 1M pH 7.4)
150 mM NaCl
1 % Triton X-100
0.5 % sodium desoxycholate
0.1 % SDS
1 mM PMSF, 1 tablet/10 ml complete mini protease inhibitor (Roche,
Mannheim)
Luciferin buffer (for luciferase assay)20 mM Tricin
1.07 mM magnesiumcarbonatehydroxyde
2.67 mM magnesiumsulfate
0.1 mM EDTA
33.3 mM DTT
0.27 mM Coenzyme A
0.47 mM luciferin
0.53 mM ATP
4x Laemmli loading buffer125 mM Tris-HCl (pH 6.8)
20 % SDS
25 % glycerol
bromphenol blue for coloring

Material and Methods
61
(+ 5 % β-mercaptoethanol)
2.9.3 Protein biochemistry materials
5x Bradford reagent (Biorad, München)
PageRuler prestained protein ladder (Fermentas, St. Leon-Rot)
MagicMarkXP Western Protein Standard (Invitrogen, Life Technologies,
Paisley, UK)
Protease inhibitor , Complete-Mini (Roche Diagnostics, Germany)
PVDF membrane Milipore, USA
Whatman paper Invitrogen, USA
2.9.4 Histology and microscopy materials
Cresyl violet (Merck, Darmstadt)
DAPI (Merck, Darmstadt)
Entellan (Merck, Darmstadt)
Mowiol (Merck, Darmstadt)
Paraformaldehyde/PFA (Sigma, Taufkirchen)
PAP-Pen (Sigma, Taufkirchen)
Peel-A-Way disposable embedding molds (Polysciences, Warrington, PA,
USA) Microscopy slides “Superfrost Ultra Plus” (Menzel,
Braunschweig)
Coverglasses 24x50 mm (VWR, Ulm)
2.9.5 Molecular biology materials
1kb plus DNA ladder (Invitrogen, Life Technologies, Paisley, UK)
Agarose Ultrapure, Electrophoresis Grade (Invitrogen, Life Technologies, Paisley,
UK)
Ethidium bromide (Applichem, Taufkirchen)
Taq Poymerase and 5x Green GoTaq Reaction buffer (Promega, Mannheim)
dNTPs (Genaxxon, Ulm)
PCR tubes 0.2 ml (Brand, Wertheim)

Material and Methods
62
Lightcycler 480 Multiwell Plate 96 (Roche, Mannheim)
2.9.6 General laboratory materials
Reaction tubes 1.5/2 ml (Eppendorf, Wesseling-Berzdorf)
15/50 ml High-Clarity Polypropylen Conical Tubes (BD Falcon, San Diego, CA, USA)
5 ml Polystyrene Round Bottom tubes GLKL (Greiner Bio-One, Frickenhausen)
Pipette tips 1-1000 ml (Hightech lab, Warsaw, Poland and Axygen, Union City, CA,
USA)
1/2/5/10/25 ml glass pipettes (Brand, Wertheim)
1ml Sub-Q syringes (BD, Franklin Lakes, NJ, USA)
3 Laboratoryequipment
3.1 General laboratory equipment
Pipettes 0.1-2 µl
2-20 µl
20-200 µl
200-1000 µl (Abimed, Gilson, Brand)
Pipette controller Pipetus (Hirschmann, Eberstadt)
Surgical forcipes and scissors (FST, Heidelberg)
Biofuge Pico 17 (Thermo Scientific, Waltham, MA, USA)
Megafuge 1.0R (Thermo Scientific, Waltham, MA, USA)
Digital Heat Block (VWR, Ulm)
Centrifuge (max.13.000 rpm) / Biofuge A (Heraeus, Germany)
Dryer T5050E (Heraeus, Germany)
Freezer (Liebherr, Germany)
Deep freezer -80°C, Class N / HFU 586 (Heraeus, Germany)
Block thermostat / TCR 100 (Roth AG, Germany)
pH-meter Calimatic 761 (Knick, Berlin)
ice-machine automatic / AF10 (Scotsman, Italy)
Light microscope (Leica, Germany)
Lightcycler 480 (Roche, Germany)

Material and Methods
63
Nanodrop (Peqlab, Germany)
Magnetic stirrer / RCT-BE (Kika Labortechnik, Germany)
Scale Scaltec (Scaltec, Heiligenstadt)
Scale BP-210-S (Sartorius, Göttingen)
Spectrophotometer Genesys 10S UV/VIS (Thermo Scientific, Waltham, MA, USA)
Steam sterilizer H+P (Labortechnick, Germany)
Thermocycler Primus 96 plus (MWG, Ebersberg)
Gel documentation Genosmart (VWR, Ulm)
Vortex Genie-2 / G-560E (Scientific Industries, USA)
Cell culture incubator Hera-Safe (Thermo Scientific, Waltham, MA, USA)
Laminar flow sterile bank (Thermo Scientific, Waltham, MA, USA)
Shaker Polymax 1040 (Heidolph, Schwabach)
Waterbath (B.Braun, Germany)
Power supplies for electrophoresis Desatronic 500/400 (Desaga, Heidelberg)
Agarose gel equipment was constructed by the scientific workshop facilities of Ulm
University
3.2 Histology and microscopy equipment
Microtome Microm HM355S (Thermo Scientific, Waltham, MA, USA)
Cryotome CM1900 (Leica, Wetzlar)
Vibratome VT1200S (Leica, Wetzlar)
Leica CTR 5500 microscope (5x,10x,20,40x)
Microscope Axiovert 200M (Zeiss, Oberkochen):
b/w camera AxioCam MRm
objectives Plan-Apochromat 2.5x, 5x, 10x, 20x, 40x, 63x
UV-lamp X-Cite 120 EXFO (Lumen dynamics, Mississauga, Canada)
Excitation/emission filters for DAPI, FITC/Alexa Fluor 488, DsRed/PE and
Texasred/Alexa Fluor 568/594 (AHF Analysentechnik)
Stereomicroscope SteREO Discovery.V20 (Zeiss, Oberkochen):
RGB camera AxioCam MRc
Objective Achromat S 0.63x

Material and Methods
64
3.3 Software
Microsoft Office X
Adobe Photoshop CS2 V9.0
Adobe Illustrator CS2 V12.0.0
ImageJ64 1.41
Zeiss Axiovision 4.8

Results
65
3 Results
3.1 Generation of transgenic mice with inducible liver-specific expression ofconstitutively active FOXO3
The role of FoxO1 in regulation of hepatic glucose production has been showed
previously in several mouse models (Matsumoto, Han et al. 2006; Zhang, Patil et al.
2006; Matsumoto, Pocai et al. 2007; Lin and Accili 2012). However the interplay
between different FoxO family members sharing the conserved DNA binding domain
is far from being understood. Importantly in addition to FoxO1, FoxO3 is also
significantly expressed in the liver its contribution to metabolic regulation has
however not been thoroughly analysed. Interestingly previous studies have shown
the role of FoxO3 in insulin sensitivity phenotypes and longevity in humans
suggesting that FoxO3 is critical for metabolic control (Willcox, Donlon et al. 2008;
Flachsbart, Caliebe et al. 2009; Pawlikowska, Hu et al. 2009). Therefore the present
study was designed to investigate consequences of FOXO3 function in vivo. For this
purpose, a transgenic mouse model was generated that allows expression of a
mutant (constitutively active) FOXO3 allele specifically in the liver with an inducible
transgene expression system to conditionally modulate FOXO3 activity in
hepatocytes.
3.1.1 Tetracycline regulated expression of a constitutively active FOXO3 alleledriven by the LAP promotor
To activate FoxO3 signaling in the liver a constitutively active allele of FoxO3
(FOXO3-CA) was used in which the three AKT phosphorylation sites (T32, S253,
S315) are mutated to alanine residues keeping the FOXO3 in an activated
confirmation (Schmidt-Strassburger, Schips et al. 2011; Schips, Wietelmann et al.
2011) (Figure 14). We crossed transgenic mice expessing tetracycline-regulated
transactivator (tTA) under the control of LAP promotor which is highly specific for the
liver (Sunami, Leithauser et al. 2012) with mice carrying the FoxO3CA allelle and a
luciferase reporter gene controlled by a bidirectional promotor (luciferase-(tetO)7-
FOXO3-CA) (Figure 15). Tetracyclin transactivator (tTA) binds to tet-operator
elements (tetO)7 and drives the transcription of both the luciferase reporter gene and
the FOXO3-CA transgene. The tTA binding can be blocked by doxycycline (Dox),

Results
66
thereby shutting off transgene expression (Lavon, Goldberg et al. 2000; Sunami,
Leithauser et al. 2012)
Figure 14. Mutated FOXO3 structure in which three AKT phosporylation sitesT32, S253, S315 are mutated to alanine residues.
Figure 15: Tetracycline regulated (“tet-off”) expression system for the liverspecific expression of FOXO3-CA and a luciferase reporter gene.
Animal obtained from breedings (LAP.tTA x (tetO) 7.FOXO3-CA) which contain both
the transgenes are called double transgenic (FoxO3CAHep mice) should express
FOXO3CA in a doxycycline-regulated manner, whereas single transgenic or wild type
littermates should not express FOXO3CA and could be used as controls (Control).
3.2 Perinatal induction of FOXO3CA results in lethal phenotype
3.2.1 liver-specific expression of FOXO3CA
In order to avoid consequences of FoxO3CA expression during embryogenesis,
pregnant mothers were kept under doxycycline in the drinking water to repress
FoxO3 expression. With this setting, FoxO3CAHep were born at the expected
Mendelian ratio. In a first set of experiments doxycycline was removed immediately
after birth and the mice were anlaysed at the age of 4-weeks (Figure16A).

Results
67
Macroscopically the FoxO3CAHep mice at this age appeared very sick, they were
much smaller then their wildtype littermates, and some mice had already died before
the age of 4-weeks (52.94%alive and 47.04 dead) (Figure16B). In vivo luciferase
imaging was performed to determine the specificity of transgene expression by
injection of luciferin (150µg/g body weight) as an indirect measurement of transgene
expression. In vivo imaging confirmed the strongest activity clearly in the liver of
double transgenic animals (Figure 16C).
Transgene expression was further analysed in different organs from FoxO3CAHep
mice by ex vivo luciferase measurement. High luciferase activity was detected only in
the livers of 4-week-old FOXO3CA mice and other peripheral tissues had
nondetectable luciferase activities (Figure 16D). Hepatic expression of FoxO3CA
transgene was further confirmed by immunoblot analysis using antibodies against
FOXO3 and β-Tubulin. The results showed strong expression of FOXO3 band only in
FoxO3CAHep animals and was undetected in liver from control animals (Figure 16E)
Furthermore FoxO3CAHep mice showed a pronounced decrease in liver size and liver
weight even more than the body weight (Figure 16F) and the reduced liver weight to
body weight ratio (LW/BW) was due to reduction in liver size (Figure 16G).

Results
68
Figure 16: FoxO3CAHep mice exhibit a robust, liver-specific transgeneexpressionA. Schedule of Doxycycline treatment. Doxycyline was administered untill birth. After
birth DOX administration is ceased and the animals were analysed at 4-weeks of
age.
B. Macroscopic appearence of FoxO3CAHep mice as compared to their littermate
controls.

Results
69
C. In vivo assessment of transgene expression. Control and double transgenic
(FoxO3CAHep) mice were analysed for luciferase expression using an IVIS system.
The FoxO3CAHep mice were kept with doxycycline (DOX) until birth then DOX
treatment was ceased. Luciferase activity was imaged at the age of 4- weeks.
D.Transgene expression was analysed in different organs from FoxO3CAHep mice by
ex vivo luciferase measurement. High luciferase activity was detected in livers of 4-
week-old mice. Extrahepatic tissues displayed only negligible luciferase activities
(RLU: relative light unit).
E. Western blot analysis of whole liver extracts from 4-week-old control and
FoxO3CAHep mice using antibodies against FOXO3 and β-Tubulin. The latter was
used as a loading control.
F. Liver from FoxO3CAHep mice and control animals. The livers from transgenic
animals were much smaller then their littermate controls.
G. Liver weight, bodyweight and liver weight/body weight ratio from 4-week-old mice
are shown (n=7, data are represented as mean +/-SD).
3.2.2 FOXO3CA activation affects size and structure of hepatocytes andinduces liverdysfunction and metabolic abnormalities
In order to obtain a more detailed insight into the liver structure and morphology,
histological sections stained with hematoxylin and eosin were analysed in detail.
FoxO3CAHep mice showed much smaller hepatocytes as compared to control
animals. Immunohistochemical staining performed with FOXO3 antibody showed the
strong nuclear expression of FOXO3CA in these smaller hepatocytes (Figure 17
A,B).

Results
70
Figure 17: Expression of liver-specific FoxO3CA leads to morphologicalalterations.
A: Paraffin sections stained with hematoxylin and eosin; scale bar: 100 µm.
B: Paraffin sections stained with an antibody specific for FOXO3CA (Brown). Scale
bar: 100µm.
We then analysed the FoxO3CAHep mice with respect to markers of liver damage
serum levels of the liver enzymes alanine aminotranferase (ALT) and aspartate
amino transferase (AST) were elevated in FoxO3CAHep mice (Figure 18A, B). At the
same time, bilirubin levels were increased in FoxO3CAHep mice as compared to
control 4-week-old animals (Figure 18C). These changes in ALT, AST, and bilirubin
reflect a significant extent of liver damage. Furthermore FoxO3CAHep mice have a
moderate reduction in triglyceride (TG) and cholesterol levels (Figure 18D-E) as
reported before due to defective insulin action in the liver (Michael, Kulkarni et al.
2000; Zhang, Patil et al. 2006). Interestingly, FoxO3CAHep mice showed reduction of
blood glucose levels as compared to control animals and were severely

Results
71
hypoglycemic (63.75 ± 4.9 mg/dl vs. 139 ± 11.6 mg/dl, FoxO3CAHep vs. Control,
respectively) (Figure 18F). This could be due to dual role of FoxO transcription
factors in controlling hepatic insulin sensitivity (Matsumoto, Han et al. 2006) or might
be due to some other reasons discussed later.
Figure 18: Expressio of FoxO3CA induces hepatocyte damage and alteredmetabolic parametersA. Alanine aminotransferase (ALT) and B. aspartate aminotransferase (AST) C.bilirubin, D. Serum triglycerides E. Serum Cholesterol F. Blood glucose levels in the
4-week-old control and FoxO3CAHep mice (n=7, data are represented as mean +/-
SD).

Results
72
3.2.3 Expression of FOXO3CA in younger animals induces autophagy
As in a previous study it has already been shown (Schips, Wietelmann et al. 2011)
that the consequences of constitutive activation of FOXO3 in cardiomyocytes induces
reversible cardiac atrophy and autophagy, we reasoned whether in this mouse model
constitutive activation of FoxO3CA in the liver might induce the upregulation of genes
involved in autophagy because the animals at 4-weeks of age were extremely
atrophic. We therefore performed RTqPCR for autophagy-associated genes (Atg1,
Atg12, Atg5). The results showed a moderate upregulation for cell autophagy
associated genes investigated namely Atg1, Atg5, Atg12 (Figure 19).
In summary FoxO3 activation just after birth results in smaller animals with
hypoglycemic phenotype, additionally hepatocyte damage and altered metabolic
parameters was observed. Furthermore FoxO3CAHep mice at the age of 4-weeks
showed moderate upregulation of autophagy associated genes and this may explain
smaller size of hepatocytes and smaller size of liver. Autophagy is the catabolic
process of lysosomal degradation and self-destruction. In FoxO3CAHep mice at the
age of 4-weeks catabolic pathways such as autophagy was activated that might
result in hypoglycemic phenotype or due to some other unknown reasons and also
several other parameters were not listed due to severity of phenotype. The results
from 4-week-old animals prompted us to analyse FoxO3CA activation in adult
animals.

Results
73
Figure 19: FoxO3CAHep shows elevation of various autophagy-associatedgenes.Expression of several autophagy-associated genes determined by RTqPCR. Bars
represent the ratio of gene expression relative to Hprt (n=7).
3.3 FOXO3CA activation in adult animals
3.3.1 Expression pattern of FOXO3CA transgene
In order to analyze FoxO3 function in mature livers, transgene expression was
suppressed until 5-weeks of age by administration of doxycycline (DOX) in the
drinking water. After removal of doxycyline/ induction of transgene expression mice
were analysed at two different time points at the age of 7-weeks (after two weeks of
FOXO3CA activation) and at the age of 9-weeks (after four weeks of FOXO3CA
activation) (Figure 20A). In order to check for the specificity of transgene expression
in vivo imaging was performed both for Control and FoxO3CAHep mice at the age of
7-weeks and at the age of 9-weeks. In vivo imaging again showed strong expression
of the transgene only in the liver specifically in double transgenic FoxO3CAHep mice
(Figure 20B). Importantly, these mice appeared normal. In vitro luciferase assays
were also performed in both 7-week-old and 9-week-old animals. The results
revealed that expression of the transgene reporter luciferase was restricted to the
liver of FoxO3CAHep mice. Extrahepatic tissues displayed only negligible luciferase
activities (Figure 20C).

Results
74
Figure 20: FoxO3CAHep mice reveal a robust, liver-specific transgeneexpression at the age of 7-weeks and 9-weeks.A. Schedule of doxycycline treatment. DOX administration was started from birth
untill 5-weeks of age then DOX administration is ceased and the animals were
analysed at 7-weeks and at 9-weeks after 2-weeks and 4-weeks of FOXO3CA
activation.
B. In vivo assessment of transgene expression. Control and double transgenic
(FoxO3CAHep) mice were analysed for luciferase expression using an IVIS system.
Luciferase activity was imaged at the age of 7-weeks and at the age of 9-weeks.
C. Transgene expression was analysed in different organs from FoxO3CAHep mice by
ex vivo luciferase measurement. High luciferase activity was detected in livers of both
7-week-old and 9-week-old mice. Extrahepatic tissues displayed only negligible
luciferase activities (RLU: relative light unit).

Results
75
In addition, FoxO3 transgene expression was confirmed at the protein level by
performing western blot of whole liver extracts from 7-week-old and 9-week-old mice
with antibodies specifically recognizing FoxO3 protein and β-Tubulin as a loading
control. The results from western blotting showed strong expression of FoxO3 protein
only in FoxO3CAHep mice both at 7-week and 9-week but not in control animals
(Figure 21A). We also checked the hepatic expression of FOXO3CA gene at the
transcriptional level via real time RT-PCR. The results showed FOXO3CA gene was
upregulated in FoxO3CAHep mice both at the age of 7-weeks and 9-weeks. Results
are normalized to expression of hypoxanthine-guanine phosphoribosyl transferase
gene (Hprt). (Figure 21B).
Figure 21: Detection of FoxO3CA transgene at the protein and transcriptionallevel in 7-week and 9-week-old mice.A. Western blot analysis of whole liver extracts from 7-week-old and 9-week control
and FoxO3CAHep mice using antibodies against FOXO3 and β-Tubulin. The latter
was used as a loading control.
B. Hepatic expression of FOXO3CA was determined via real time RT-PCR. Results
are normalized to expression of hypoxanthine-guanine phosphoribosyl transferase
gene (Hprt).
3.3.2 Expression of FOXO3CA in adult animals is not associated with growthdefect

Results
76
As already mentioned, mice with hepatic activation of FOXO3CA at birth resulted in
growth defect. Accordingly we considered enlisting weight parameters in control and
FoxO3CAHep animals at the age of 7-weeks and 9-weeks. We observed that
activation of FoxO3 for 2-weeks and 4-weeks did not result in any obvious growth
defect as the body weight, liver weight and liver weight/ body weight ratios were
normal and the animal appeared active and normal (Figure 22 A,B).
Figure 22: Normal body weight and liver weight characteristics of FoxO3CAHep
mice at the age of 7-week and 9-weeks.A. Body weight, liver weight and liver weight/body weight ratio from 7-week-old mice
are shown (n=7, data are represented as mean +/-SD).
B. Body weight, liver weight and liver weight/body weight ratio from 9-week-old mice
are shown (n=7, data are represented as mean +/-SD).
3.3.3 FOXO3CA activation results in altered hepatic morphology
Active FOXO3 should accumulate in the nucleus and activate FOXO3-dependent
gene expression. We determined FOXO3 expression and localization by
immunohistochemical analysis both in 7-week-old and 9-week-old animals and we
found that FOXO3CA indeed localized in the nucleus. Interestingly, FOXO3CA
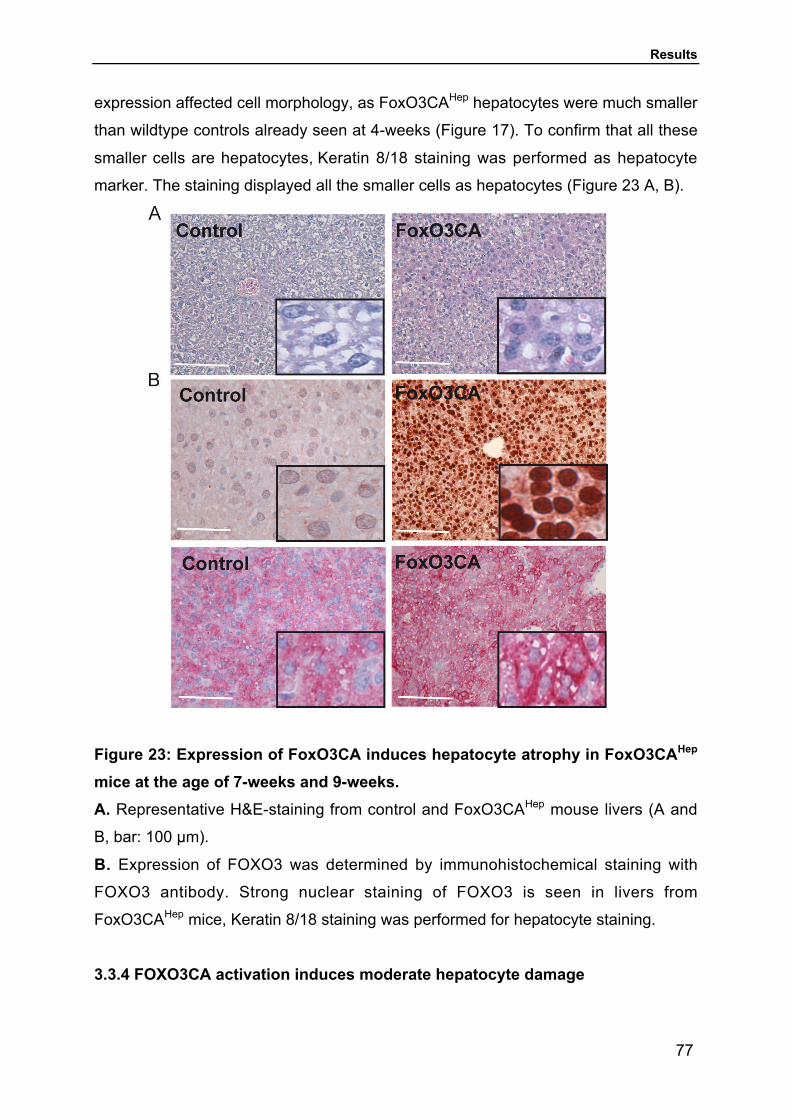
Results
77
expression affected cell morphology, as FoxO3CAHep hepatocytes were much smaller
than wildtype controls already seen at 4-weeks (Figure 17). To confirm that all these
smaller cells are hepatocytes, Keratin 8/18 staining was performed as hepatocyte
marker. The staining displayed all the smaller cells as hepatocytes (Figure 23 A, B).
Figure 23: Expression of FoxO3CA induces hepatocyte atrophy in FoxO3CAHep
mice at the age of 7-weeks and 9-weeks.A. Representative H&E-staining from control and FoxO3CAHep mouse livers (A and
B, bar: 100 µm).
B. Expression of FOXO3 was determined by immunohistochemical staining with
FOXO3 antibody. Strong nuclear staining of FOXO3 is seen in livers from
FoxO3CAHep mice, Keratin 8/18 staining was performed for hepatocyte staining.
3.3.4 FOXO3CA activation induces moderate hepatocyte damage

Results
78
To examine liver functionality after two weeks of FOXO3CA activation the markers for
liver damage and liver dysfunction were assessed from the serum of 7-week-old
control and FoxO3CAHep mice after 6 hour of fasting. The transgenic animals showed
mildly elevated serum alanine aminotransferase (ALT) and aspartate
aminotransferase (AST) levels indicating moderate hepatocyte damage (Figure 24A).
Elevated serum bilirubin levels could indicate hepatocyte dysfunction (Figure 24B).
However, serum albumin and pseudocholinesterase levels, widely accepted
hepatocyte function markers, were not changed (Figure 24C). Alkaline phosphatase
levels were elevated in FoxO3CAHep mice suggesting that hepatocyte function is still
intact, but biliary tract function is impaired (Figure 24D).
Figure 24: FoxO3CAHep show elevated markers of hepatocyte damage andhepatocyte dysfunction.A. Alanine aminotransferase (ALT) and aspartate aminotransferase (AST) B. Bilirubin
C. albumin, pseudocholinesterase, and alkaline phosphatase (ALP) D. levels in the 7-
week-old control and FoxO3CAHep mice (n=7, data are represented as mean +/-SD).
Increased liver enzyme levels would be a consequence of hepatocyte death. Indeed
FOXO3CA expression in murine forebrain had resulted in massive apoptosis of
neuronal progenitors (Schmidt-Strassburger et al., 2012). In order to check for
apoptosis in FoxO3CAHep mice TUNEL assays were performed the staining and

Results
79
TUNEL quantification revealed not significant increased levels of apoptosis in
FoxO3CAHep mice (Figure 25A). We used TAK1-LPCKO liver as positive control as it
was previously reported that TAK1 deficiency mediates hepatocyte cell death
(Bettermann, Vucur et al. 2010). We also performed CD45 staining for inflamation the
results from staining and quantification of CD45 positive cells showed no signs of
inflammation in FoxO3CAHep mice (Figure 25B). We used IKK2CA liver as positive
control for inflammation because it has been shown that over-expression of IKK2
cause liver fibrosis through macrophage-mediated chronic inflamation (Sunami,
Leithauser et al. 2012). Taken together, hepatic FOXO3 expression led to mild
hepatocyte damage independent of inflammation or apoptosis, but hepatocyte
function is largely intact.
Figure 25: Expression of constitutively active FoxO3 does not induce stronginflammation and apoptosis.A. Immunofluorescence TUNEL staining for 7-week-old control and FOXO3CAHep
mice. Liver-specific deletion of TAK1 (Map3k7) mouse liver (Bettermann, Vucur et al.
2010) served as a positive control (bar: 100 µm).
B. Immunohistochemical stainings against CD45 for 7-week-old control and
FOXO3CAHep mice were shown. Liver from over-expression of IKK2 mutant
(Sunami, Leithauser et al. 2012) served as a positive control (bar: 100 µm).

Results
80
3.3.5 Hepatocellular FOXO3 activation induces metabolic abnormalities
After two weeks of transgene activation, FoxO3CAHep mice displayed markedly
elevated fasting blood glucose levels compared to control animals (282.4 ± 22.8
mg/dl vs. 128 ± 4.8 mg/dl, FOXO3CAHep vs. Control, respectively) (Figure 26A).
Elevated blood glucose levels could be a consequence of increased
gluconeogenesis. Consistently, increased hepatic expression of several genes
involved in gluconeogenesis, namely glucose 6 phosphatase (G6pc),
phosphoenolpyruvate carboxykinase (Pepck), and pyruvate dehydrogenase kinase
isoenzyme 4 (Pdk4), was observed (Figure 26B). Furthermore in order to examine
whether hyperglycemic FoxO3CAHep animals were able to tolerate a glucose load
through glucosetolerance test. Glucose tolerance test (GTT) was performed as
mentioned in materials and methods. The results from intraperitoneal glucose
tolerance test performed on FoxO3CAHep mice demonstrated impaired glucose
tolerance (Figure 26C). In order to analyze whether glucose intolerance might be a
consequence of insufficient insulin production, we measured serum insulin levels.
Interestingly, FOXO3CAHep mice showed significantly higher insulin levels (10.01 ±
1.56 ng/ml vs. 1.50 ± 0.82 ng/ml, FoxO3CAHep vs. Control, respectively) (Figure 26D).
In order to further confirm that FoxO3CAHep mice are able to lower glucose in
response to injected insulin insulin tolerance test (ITT) was performed as mentioned
in materials and methods. The results of insulin tolerance test demonstrated that
exogenously administered insulin failed to lower blood glucose level in FOXO3CAHep
mice (Figure 26E) and further showed that FOXO3CAHep mice was extremely
resistant to injected insulin. These data suggest that hepatic FOXO3 affects glucose
homeostasis by regulating gluconeogenesis-associated enzymes and it impairs
hepatic insulin signalling.

Results
81
Figure 26: Overexpression of FoxO3CA induces hyperglycemia,hyperinsulinemia and impaired glucose tolerance as well as insulin sensitivity.A. Serum glucose levels from 7-week-old control and FoxO3CAHep mice after 6 hours
fasting (A- E: n=7, data are represented as mean +/-SD).
B. Up-regulation of gluconeogenesis-associated genes in FoxO3CAHep livers. Results

Results
82
from quantitative real-time PCR experiments are shown. Bars represent the ratio of
the expression of the highlighted genes relative to the hypoxanthine-guanine
phosphoribosyltransferase gene (Hprt).
C. Glucose tolerance test. Blood glucose levels from control and FoxO3CAHep were
measured at the indicated time points after glucose injection. Mice were fasted for 6
hours before performing experiments (*** P<0.001).
D. Serum insulin level from control and FoxO3CAHep mice after 6 hours fasting.
E. Insulin tolerance test. Blood glucose levels control and FoxO3CAHep were
measured after insulin injection (*** P<0.001). Mice were fed ad libitum before
performing the experiments.
3.3.6 Activation of catabolic pathways by expression of constitutively activeFOXO3
FOXO3 transcription factors are involved in regulation of metabolic homeostasis
therefore the observed hyperglycemic metabolic phenotype could be explained by
up-regulation of FOXO3 metabolic target genes. To unveil FOXO3-induced
transcriptional network, we performed microarray analyses using livers from 7-week-
old control (n=4) and FoxO3CAHep (n=4) 6 hours, fasted mice. This analysis revealed
560 up-regulated genes and 421 down-regulated genes in FoxO3CAHep mice
compared to control animals (Appendix Table 1). The data confirmed an increase in
the mRNA levels for several gluconeogenesis-associated enzymes such as pyruvate
dehyrogenase kinase (Pdk4, Pdk3) were upregulated. Pdk4 inhibits pyruvate
dehydrogenase by phosphorylation providing pyruvate as gluconeogenic substrates
(Wei, Tao et al. 2011). A known regulator of glucose and lipid metabolism
peroxisome proliferator activated receptor-γ coactivator-1α (Pparγc1α) was
upregulated. Subsets of genes involved in regulation of glucose homeostasis for
providing energy during the process of starvation were upregulated (Table 7).
Consistently the glycolytic genes such as glucokinase and pyruvate kinase (Gck,
Pklr), were downregulated hepatic glucokinase is an important enzyme linking
glucose and lipid metabolism by catalysing the conversion of glucose to glucose-6-
phosphate, which is an important precursor in support of lipogenesis. In addition, we
observed significant alterations in expression levels of genes involved in lipid
metabolism and other metabolic pathways (Table 8). Consistently due to enhanced

Results
83
activation of lipid catabolic pathways in FoxO3CAHep mice we have observed up-
regulation of genes involved in lipid transport and trafficking several fatty acid binding
proteins (fabp5, fabp7), apolipoprotein M (Apom), phospholipid transporting ATPase
(Atp11) was upregulated. Genes involved in fatty acid synthesis were down-regulated
ATP citrate lyase (Acly), ATP citrate lyase provide a sole fuel for cytoplasmic acetyl-
CoA, fatty acid synthase Fasn, acetylCoA carboxylase (Acc) acetyl-CoA carboxylase-
α which convert acetyl-CoA to malonylCoA which serve as a substrate for
lipogenesis, acetyl-CoA synthase (Acsm1). In line with this genes involved in fatty
acid oxidation were up-regulated carnitine palmitoyltransferase (cpt1b), enoyl-CoA
hydratase/3-hydroxy acyl Coenzyme A dehydrogenase (ehhadh), acetyl-CoA
acetyltransferase (Acot2), acety-CoA dehydrogenase (Acad12). This suggests that
FOXO3 activates catabolic pathways to provide substrates and energy for
gluconeogenesis.
Table 7: Genes involved in glucose metabolismClassification of the main genes that were differentially expressed betweencontrol mice and FoxO3CAHep mice. Relevant up-regulated genes were
categorized into several ontologies. Data are expressed as the mean-fold difference
in gene expression in FoxO3CAHep mouse livers relative to control mouse liver
samples.
Function Gene Symbol Gene name
Fold-changeTransgenic(n=4) vsControl(n=4)
Lepr leptin receptor 29.41Pdk4 pyruvate dehydrogenase kinase, isoenzyme 4 15.38Igfbp1 insulin-l ke growth factor binding protein 1 10.99Akr1b7 aldo-keto reductase family 1, member B7 7.14Igfbp2 insulin-l ke growth factor binding protein 2 4.35
Glucose Irs2 insulin receptor substrate 2 3.23Metabolism Me2 malic enzyme 2, NAD(+)-dependent, mitochondrial 2.38
Hmox1 heme oxygenase (decycling) 1 2.38Leprot leptin receptor overlapping transcript 2.38Aqp7 aquaporin 7 2.08Pgm3 phosphoglucomutase3 2.22Akr1b8 aldo-keto reductase family 1, member B10 gucose metabolism 1.96Pdp1 pyruvate dehydrogenase phosphatase catalytic subunit GM 1.92Pparγc1α peroxisome proliferative activated receptor, gamma, coactivator 1 alpha 1.92Igf1r insulin-l ke growth factor-1 receptor 1.92Gys2 glycogen synthase 2 1.85Pdk3 pyruvate dehydrogenase kinase isoenzyme 3 GM 1.63Pgd phosphogluconate dehydrogenase 1.61Aldh3b1 aldehyde dehydrogenase 3 family, member B1 1.59Pklr Glycolysis (Pyruvate kinase liver) 0.51Igf1 insulin-l ke growth factor 1 0.49Gckr Glucokinase regulatory protein 0.45Gck glucokinase 0.23

Results
84
Table 8: Genes involved in lipid metabolism
Function Gene Symbol Gene name
Fold-changeTransgenic (n=4) vsControl(n=4)
Lipid Metabolism Acmsd amino carboxymuconate semialdehyde decarboxylase 4.17Acot2 acyl-CoA thioesterase 2 4.17Acad12 acyl-Coenzyme A dehydrogenase family, member 12 2.7Cpt1b Carnitine palmitoyltransferase 1b,muscle 2.56Smpd3 Sphingomyelinphosphodieasterase 3 2.43Ehhadh enoyl-Coenzyme A, hydratase/3-hydroxyacyl Coenzyme A dehydrogenase 2.33Ugcg UDP-glucose ceramide glucosyltransferase 2.04Apom apolipoprotein M 2Lipo1 lipase, member O1 2Cerk ceramide kinase 2Pld4 phospholipase D family, member 4 1.89B3galnt1 UDP-GalNAc:betaGlcNAc beta 1,3-galactosaminyltransferase, polypeptide 1 1.82
Galnt7UDP-N-acetyl-alpha-D-galactosamine: polypeptide N-acetylgalactosaminyltransferase 7 1.82
Acsl4 acyl-CoA synthetase long-chain family member 4 1.82Atp11a Phospholipid transporting ATPase 1.78Fabp7 fatty acid binding protein 7 1.78Gltp Glycolipid transfer protein 1.72Pla2g12a phospholipase A2, group XIIA 1.54Fabp5 fatty acid binding protein 5, epidermal 1.53Acsm1 acyl-CoA synthetase medium-chain family member 1 0.66Ldlr low density lipoprotein receptor 0.66Acot11 Acyle-CoA thioesterase11 0.58Acss3 AcetyleCoA synthetase, short chain family member 3 0.36Fasn Fatty Acid synthase 0.42Acacα AcetyleCoA carboxylase alpha 0.55Acly ATP citrate lyase 0.58
The normal action of insulin in the liver is to inhibit glycogenolysis and
gluconeogenesis (Jitrapakdee 2012). It is reported peviously in type 2 diabetic
conditions that 90% of impaired hepatic glucose production occurs by
gluconeogenesis and the rest is supported by glycogenolysis (DeFronzo, Bonadonna
et al. 1992). Therefore in order to further confirm the activation of catabolic pathways
including glycogenolysis liver glycogen content was examined histochemically by
PAS (Periodic Acid Schiffs) staining for liver glycogen. Indeed, FoxO3CAHep mice
have significantly reduced glycogen as compared to control animals. Furthermore the
results from biochemical analysis revealed reduced glycogen in FoxO3CAHep mice as
compared to control animals. Accordingly, glycogen phosphorylase (an enzyme
involved in conversion of glycogen to glucose during glycogenolysis) mRNA
expression levels are up-regulated in FoxO3CAHep mice as compared to control
animals (Figure 27).

Results
85
Figure 27: Increased glycogenolysis in FoxO3CAHep mice.
A.Representative PAS (Periodic Acid Schiffs) stainings from control and FoxO3CAHep
mice (bar: 100 µm).
B. Quantification of hepatic glycogen content.
C . Up-regulation of a glycogen phosphorylase gene (Pygl) in the livers from
FoxO3CAHep mice. Results from RTqPCR experiments are shown. Bars represent
the ratio of the expression relative to Hprt.

Results
86
In addition, serum triglyceride and cholesterol levels were measured from serum of 6
hour fasted FoxO3CAHep and control mice. The results showed fewer triglycerides
and cholesterol in FoxO3CAHep mice compared to control animals (Figure 28A), and
consistently again mRNA expression of lipid anabolic enzymes namely acetyl-CoA
carboxylase (Acc), sterol regulatory element-binding protein 1c (Srebp1), and fatty
acid synthase (Fasn) were reduced (Figure 28B). This might be due to reduced effect
of insulin in the liver to stimulate lipogenesis together with enhanced insulin activity in
extrahepatic tissues to inhibit lipolysis as reported before in liver-specific insulin
receptor knockout mice (Michael, Kulkarni et al. 2000).
Figure 28: FoxO3CAHep mice display decreased lipogenesis.A. Serum triglyceride and cholesterol levels from control and FoxO3CAHep mice.
B. Expression of lipid synthesis-associated genes determined by RTqPCR. Bars
represent the ratio of gene expression relative to Hprt.
In contrast, expression of mRNA levels for lipid catabolic enzymes like carnitine
palmitoyltransferase 1a (Cpt1a) and enoyl-CoA hydratase (Echs1), were upregulated
(Figure 29A). Consistently, serum ketone bodies (β-Hydroxybutyrate), markers for
excessive lipid β-oxidation, were elevated in FoxO3CAHep mice (Figure 29B).

Results
87
Figure 29: Enhanced lipid catabolic pathways in FoxO3CAHep.A. Hepatic mRNA levels for genes involved in lipid catabolic pathway (β-oxidation)
were measured in control and FoxO3CAHep mice. Bars represent the ratio relative to
Hprt.
B. Serum ketone bodies from control and FoxO3CAHep mice.
We also measured serum urea as end product of protein catabolism but observed no
significant difference compared to controls. In addition, serum creatinine levels as
marker of kidney function were not elevated, indicating that the process of protein
catabolism was not significantly activated in FoxO3CAHep mice (Figure 30A).
Figure 30: FoxO3CAHep shows no symptoms of protein catabolism.A. Levels of serum urea as end product during protein catabolism and creatinine as
marker of kidney function from 7-week-old mice are shown (n=7, data are
represented as mean +/-SD).

Results
88
Taken together, activation of hepatic FOXO3 induces catabolic pathways including
glycogenolysis, and β-oxidation of fatty acids, to presumably provide metabolites and
energy required for excessive glucose production.
3.3.7 Continuous expression of constitutively active FOXO3 in the liver inducesloss of gluconeogenic potential
For assessing the disease progression, FOXO3CAHep mice were kept for another 2
weeks. By 9 weeks of age, to our surprise, FOXO3CAHep mice showed fasting
hypoglycemia (70.42 ± 8.3 mg/dl vs. 127.8 ± 4.8 mg/dl, FoxO3CAHep vs. Control,
respectively) rather than hyperglycemia (Figure 31A). This could be due to high
insulin production by pancreatic langerhans β-cells. Indeed, serum insulin level in 9-
week-old FoxO3CAHep mice showed significantly higher insulin levels (8.37 ± 1.63
mg/dl vs. 0.71 ± 0.64 mg/dl, FoxO3CAHep vs. Control, respectively) (Figure 31B).
Figure 31: Expression of FoxO3CA at 9-week results in hypoglycemia andhyperinsulinemia.A. Serum glucose levels from 9-week-old control and FoxO3CAHep mice after 6 hours
fasting (A-B: n=7, data are represented as mean +/-SD).
B. Serum insulin level from control and FoxO3CAHep mice after 6 hours fasting.
However, this is in contrast with our previous finding that high insulin levels in 7-
week-old FoxO3CAHep mice showed fasting hyperglycemia and whereas at 9-weeks
of age the transgenic mice have fasting hypoglycemia. One reason could be that in
FoxO3CAHep mice gluconeogenesis in the liver for glucose production is less active.
To test our hypothesis, as depicted above expression levels of several genes

Results
89
involved in promoting gluconeogenesis were analysed. This revealed that the mRNA
expression of gluconeogenesis-associated genes was reduced/ normalized in 9-
week-old FoxO3CAHep mice compared to 7-week-old mice Figure 26b (Figure 32).
Hepatocytes are major place for insulin clearance and another possibility for fasting
hypoglycemia is that, hepatocytes in liver failure probably are getting not able to
clean up insulin properly as reported previously in liver-specific insulin receptor
knockout mice (Michael, Kulkarni et al. 2000).
Figure 32: FoxO3CAH e p mice at the age of 9-weeks shows normalgluconeogenesis.A. Up-regulation of gluconeogenesis-associated genes in FoxO3CAHep livers in 7-
week-old mice. Results from quantitative real-time PCR experiments are shown. Bars
represent the ratio of the expression of the highlighted genes relative to the
hypoxanthine-guanine phosphoribosyltransferase gene (Hprt).
B. Gluconeogenesis-associated genes in FoxO3CAHep livers in 9-week-old mice.
Results from quantitative real-time PCR experiments are shown. Bars represent the
ratio of the expression of the highlighted genes relative to the hypoxanthine-guanine
phosphoribosyltransferase gene (Hprt).

Results
90
3.3.8 FOXO3CA activation in the liver induces subordinate pancreatichyperplasia
We characterized further the hyperglycemic phenotype at the age of 7-week and
hypoglycemic phenotype at the age of 9-week concerning pancreatic morphology
since the pancreas is the major site of insulin secretion and several mouse models
points to pancreatic hyperplasia in insulin-resistant states (Michael, Kulkarni et al.
2000; El Ouaamari, Kawamori et al. 2013). Interestingly we detected enlarged
pancreatic langerhans islets in 9-week-old FoxO3CAHep mice as compared to control
animals however pancreatic islets were normal structured in 7-week-old animals
(Figure 33A). Insulin immunostaining demonstrated the prescence of enlarged β-cell-
rich islets, which stained strongly for insulin (Figure 33B). Furthermore we quantified
the endocrine area that was significantly more in 9-week-old animals then in 7-week
animals (Figure 33C). Taken together, continuous activation of FoxO3 signalling
leads to initial fasting hyperglycemia and subordinate fasting hypoglycemia, might be
due to less insulin clearance capacity in the liver and more insulin production
capacity in pancreas. However, several other unknown reasons might explain
pancreatic hyperplasia as reported recently the role of liver-derived systemic factors
and critical role of betatrophin hormone inducing pancreatic hyperplasia and
improving glucose tolerance (El Ouaamari, Kawamori et al. 2013; Yi, Park et al.
2013).

Results
91
Figure 33: Pancreatic hyperplasia and increased insulin content in FoxO3CAHep
mice at the age of 9-weeks.A. Representative H&E-staining from control and FoxO3CAHep mouse Pancreas, 9-
week-old mouse has enlarged pancreatic Islets (bar: 100 µm).
B. Immunoflourescence staining for Insulin 9-week-old mouse has larger area for
producing insulin (bar: 100 µm).
C. Quantification of endocrine area from both 9-week-old and 7-week-old mouse
(n=50, data are represented as mean +/-SD).
3.4 Metformin normalizes FOXO3-induced distorted glucose and insulinmetabolism
Metformin (1,1-dimethylbiguanide hydrochloride) is a hypoglycemic agent and one of
the most widely used therapeutics for type 2 diabetes (Stumvoll et al., 1995). The
principal function of metformin is in part to reduce hepatic glucose production and to

Results
92
improve peripheral insulin sensitivity (Stumvoll et al., 1995). Although multiple
hepatocyte pathways affected by metformin have been identified, the precise
mechanism of metformin action still remains elusive. We wanted to determine,
whether metformin administration attenuates FOXO3-induced distorted glucose
homeostasis. We therefore administered metformin for the last 3 days until the
animals become 7 weeks old (Figure 34A), or to see long-term effect of Metformin,
we administered Metformin for 3 weeks (from 6 weeks to 9 weeks old) (Figure 34 B).
Metformin was administered with a concentration of 1.65g/L in normal drinking water
bottles and the quantity of metformin water used was checked and refilled everyday.
Figure 34: Schematic representation for the administration of Metformin
A. Animals were treated with metformin for 3 days before 7-weeks and the animals
were analysed at the age of 7-weeks.
B. Animals were treated with metformin for 3 weeks before 9-weeks and the animals
were analysed at the age of 9-weeks.
We analysed whether 3-days and 3-weeks of metformin treatment affects FOXO3-
induced dysregulation of glucose homeostasis. We first analysed potential effects of
metformin treatment on transgene activity, In vitro Luciferase assays were performed
both after 3-days of metformin treatment and 3-weeks of metformin treatment. The
results showed that luciferase activity was unaffeted in the livers of FoxO3CAHep mice
and extrahepatic tissues displayed negligible luciferase activities (Figure 35A-B).
Furthermore at the molecular level FOXO3 protein expression was also intact in
livers from FoxO3CAHep mice. This showed that metformin treatment has no effect on
transgene activity or FoxO3 protein expression both after 3-days and 3-weeks of
metformin administration (Figure 35C-D).

Results
93
Figure 35: FoxO3CA transgene expression is intact after administration ofmetformin. Metformin treatment has no influence on transgene expression inFoxO3CAHep.A. Transgene expression was analysed in different organs from FoxO3CAHep mice by
ex vivo luciferase measurement after administration of metformin. Luciferase activity
was intact in livers of 7-week-old as well as in 9-week-old mice (RLU: relative light
unit).
B. Western blot analysis of whole liver extracts from control 3days metformin-treated
left and 3-weeks metformin-treated right and FoxO3CAHep mice using antibodies
against FOXO3 and β-Tubulin. The latter was used as a loading control.
Several studies have shown a critical role of metformin in attenuating
gluconeogenesis by lowering hepatic glucose production (Hundal, Krssak et al. 2000;
Natali and Ferrannini 2006). Interestingly, already after 3 days of metformin treatment
FoxO3CAHep mice showed normalization in fasting blood glucose level (Figure 36A).
We asked whether this was due to normalization in gluconeogenesis and indeed
found that several glucogeogenesis-associated genes which were up-regulated in 7-
week-old FoxO3CAHep mice were normalized after short-term Metformin treatment
(Figure 36B).

Results
94
Figure 36: Metformin administration rapidly normalizes FoxO3-induceddistorted glucose level and sustained gluconeogenesis.A. Serum glucose levels from control and FoxO3CAHep mice, either without metformin
treatment (-Met) or treated for 3 days (+Met3D) (A-B: n=7 data are represented as
mean +/- SD).
B. Hepatic mRNA levels for genes involved in gluconeogenesis were measured in
control and FoxO3CAHep mice by RTqPCR. Bars represent the ratio of gene to Hprt
expression.
Furthermore, at the age of 9 weeks, we observed no hypoglycemic phenotype in
FoxO3CAHep mice after 3-weeks of metformin treatment (Figure 37A). In addition,
elevated insulin levels in the both 7-week- and 9-week-old FoxO3CAHep mice, as well
as enlarged endocrine area at the age of 9 weeks, were also all normalized (Figure
37 B-C). Consistently Threonine-308 and Serine-493 positions of AKT were no more
phosphorylated after metformin treatment in FoxO3CAHep mice (Figure 38). Taken
together, Metformin administration normalizes FOXO3-induced defective glucose and
insulin metabolism.

Results
95
Figure 37: Metformin treatment normalizes glucose, insulin and pancreatichyperplasia.A. Normalization of blood glucose after 3-weeks metformin treatment (+)Met3W (n=7
data are represented as mean +/- SD) all the animals were fasted for 6.hours before
analysis.
B. Normalization of serum Insulin after 3 weeks metformin treatment (+)Met3W (n=7
data are represented as mean +/- SD) all the animals were fasted for 6.hours before
analysis.
C. Normal histology of pancreatic islets form FoxO3CAHep mice after 3-weeks
meformin treatment (+) Metformin3W lower panel as compared to pancreatic
hyperplasia without metformin treatment at 9-weeks (-) Metformin upper panel.
In order to find out mechanism for metformin action it has been shown previously in

Results
96
in vivo mouse model with adenosine mono-phosphate (AMP)-activated protein kinase
(AMPK)-defeciency shows no influence on metformin-dependent reduction in blood
glucose levels (Foretz, Hebrard et al. 2010), although Metformin has been suggested
to perform anti-diabetic effect via activation of adenosine mono-phosphate (AMP)-
activated protein kinase (AMPK) (Zhou, Myers et al. 2001). However, it has
previously shown that AMPK phosphorylation of FOXO proteins results in activation
and nuclear accumulation (Greer, Oskoui et al. 2007). In that respect, metformin
would rather worsen than improve the pathology. We nevertheless analyzed state of
AMPK activation as measured by Western blot analysis with antibody recognizing
AMPKα harboring phosphorylated Threonine-172. Activation of FOXO3 resulted in
significant reduction of AMPK phosphorylation (Figure 38). Metformin in our system
did not measurably affect AMPK phosphorylation, suggesting that persistant FOXO3
activation may somehow control AMPK activity and might erace potential metformin-
driven beneficial activation. Taken together, metformin administration normalizes
FOXO3-induced defective glucose and insulin metabolism potentially independent of
AMPK.
Figure 38: Metformin normalizes FoxO3CA driven distorted glucose, lipid,insulin metabolism independent of AMPK activation.Hepatic expression of AKT and phopsho-AKT (threonine-308, T308 and serine 473,

Results
97
S473), AMPKα as well as phospho-AMPKα (threonine-172, T172) was analyzed by
Western blotting. β-Tubulin was used as a loading control.
3.5. FOXO3-induced activation of global catabolism, hepatocyte atrophy, orhepatocyte damage were reversed after Metformin administration
As described before, expression of FoxO3CA led to hepatic damage as well as
hepatocyte atrophy. If glucose metabolism is normalized in FoxO3CAHep mice after
Metformin administration, hepatocytes do not have to undergo autophagy. This
suggested the hypothesis that metformin treatment in FoxO3CAHep mice could induce
histological normalization and normal ALT and AST levels. As expected, there was
no FOXO3-induced elevation of ALT and AST levels in serum after Metformin
administration (Figure 39 A-B).
Figure 39: Metformin treatment results in normalization of hepatocytic damage.A. ALT B. AST levels in mice with 3-days metformin treatment and 3-weeks
metformin treatment the values are compared with mice without any metformin
treatment (n=7 data are represented as mean +/- SD) all the animals were fasted for
6 hours before analysis.
Furthermore, we examined liver histology to ascertain that metformin treatment has
no influence on hepatocyte structure as well as on nuclear localization of FOXO3 and
as we assumed the results displayed that there was no FOXO3 activation-driven
hepatocyte atrophy as previously observed without any metformin treatment in both
7-week- and 9-week-old animals. After Metformin treatment there were no smaller

Results
98
cells, and livers have the homogenous structure and morphology with strong FoxO3
expression (Figure 40).
Figure 40: Metformin treatment has no influence on FoxO3CA nuclearexpression and normalizes hepatocyte atrophy.A. Representative H&E-staining from control and FoxO3CAHep mice livers (A, B the
upper panel, bar: 100 µm). Normalization of liver histology after 3-days and 3-weeks
of metformin treatment.
B. Expression of FOXO3 was determined by immunohistochemical staining (A, B the
lower panel, bar: 100 µm) with FOXO3 antibody. Strong nuclear staining of FOXO3 is
seen in livers from FoxO3CAHep mice, Normalization of liver histology after 3days and

Results
99
3-weeks of metformin treatment.
Normalization in glucose homeostasis after Metformin administration could normalize
general metabolism. To check whether Metformin administration also normalized
mRNA expression not only for gluconeogenesis-associated genes, but also for global
metabolic system, microarray analyses were performed using mRNA of livers from 6
hours fasted, 7-week-old mice without and with metformin treatment for 72 hours.
The results of microarray analysis from 7-week-old animals with 3-days metformin
treatment were compared with the 7-week-old microarray data without any metformin
treatment. We found that 560 genes up-regulated and 421 genes down-regulated in
FoxO3CAHep mice were normalized after metformin treatment (Appendix Table 2).
The data confirmed the normalization of expression levels for genes both in glucose
metabolism, as well as lipid metabolism by metformin as shown in heatmap (Figure
41A) all those genes involved in gluconeogenesis such as Pdk4 which were
upregulated without any metformin treatment were downregulated with metformin
treatment. In contrast the glycolytic genes Gck and pklr, which were downregulated
without any metformin treatment were normalized with metformin treatment. Similarly
genes involved in lipid transport (fabp7, fabp5, Apom) and lipid β-oxidation (Cpt1b,
Acot12), which were upregulated without any metformin treatment, were normalized
with metformin treatment and as expected the genes involved in lipid synthesis
pathways (Acot, Acss), which were downregulated without metformin treatment were
now normalized after metformin treatment (Figure 41A). All those genes were further
confirmed by RTqPCR by using specific primers and the results were shown in log2
bardiagram (Figure 41B). We therefore conclude that metformin immediately targets
FOXO3 activity. However the mechanism how metformin targets FoxO3 still needs
further investigation.

Results
100
Figure 41A: Metformin administration reverses global catabolism induced byFoxO3CA activation.A. Heat-map summary of relative changes in gene expression. The left lane indicates
fold change in FoxO3CAHep mouse liver compared with those of controls. The right

Results
101
lane indicates fold change after administration of metformin in FoxO3CAHep mice
compared with FoxO3CAHep mice without metformin.
Figure 41B: Relative up-regulated and down-regulated gene with and withoutmetformin adminstration.B. From the Affymetrix data, several genes involved in glucose and lipid metabolisms
were analysed by RTqPCR. Bars represent the ratio of gene to Hprt and data are
shown in log2 bar diagram.

Discussion
102
4 Discussion
Type 2 diabetes mellitus and insulin resistance occur as a consequence of
uncontrolled gluconeogenesis that is failed to be suppressed by insulin (Rizza 2010).
It is a major worldwide health care problem affecting the quality of life. The
physiological processes contributing to insulin resistance in type 2 diabetes remain
enigmatic (Pajvani, Shawber et al. 2011). Therefore, there is a continuous need to
identify molecular events responsible for type 2 diabetes and insulin resistance and
this could help to discover new targets for the improvement of antidiabetic drugs.
One of the main signalling pathways involved in the insulin-dependent regulation of
hepatic glucose production is Irs/PI3-K/Akt/FoxO pathway. It has been shown that the
subcellular localization of FoxO transcription factors is controlled by insulin through
Akt-dependent phosphorylation (Nakae, Kitamura et al. 2001; Dong, Copps et al.
2008). The molecular mechanisms that integrate impaired insulin effects to
unconstrained gluconeogenesis in type 2 diabetic subjects remains ill defined.
Although it had been suggested that FoxO1 is the major executer for regulation of
insulin signaling-mediated glucose homeostasis (Gross, van den Heuvel et al. 2008;
van der Vos and Coffer 2011) as FoxO1 has been repeatedly described in regulation
of hepatic glucose production in the liver (Matsumoto, Han et al. 2006; Zhang, Patil et
al. 2006; Matsumoto, Pocai et al. 2007; Zhang, Li et al. 2012). It has been reported in
insulin-resistant mice that reducing or antagonizing hepatic FoxO1 activity markedly
improves insulin sensitivity and glucose tolerance (Altomonte, Richter et al. 2003;
Puigserver, Rhee et al. 2003; Matsumoto, Han et al. 2006; Samuel, Choi et al. 2006;
Matsumoto, Pocai et al. 2007; Dong, Copps et al. 2008). In addition to FoxO1, FoxO3
is also significantly expressed in the liver, its contribution to metabolic regulation has
however not been thoroughly analysed.
In this study we established and analysed a novel gain-of-function model of hepatic
FOXO3 where the constitutively active FOXO3CA transgene is expressed under the
control of the LAP promoter system that is specifically active in hepatocytes (LAP-tTA
x luciferase-(tetO) 7-FOXO3CA). This mouse model offers a defined genetic system to
gain a better understanding for the role of hepatic FOXO3 in regulating glucose
homeostasis and lipid metabolism. Previously it was found that FOXO3 genotypes

Discussion
103
are associated with insulin sensitivity phenotypes and longevity in human, mice and
invertebrates demonstrating that FOXO3 is critical for metabolic control (Willcox,
Donlon et al. 2008; Flachsbart, Caliebe et al. 2009; Pawlikowska, Hu et al. 2009).
Moreover recently various loss-of-function approaches of FoxO1, FoxO3, FoxO4 in
liver have addressed the role of FoxO3 in lipid metabolism (Estall 2012) but the role
of liver-specific gain-of-function of FOXO3 in the context of modulating glucose and
lipid metabolism in a cell type and context dependent manner was not addressed
untill now.
In this study we could demonstrate that constitutively active FoxO3 in the liver
critically affects glucose homeostasis and lipid metabolism. Expression of FoxO3CA
after birth resulted in perinatal lethality of 47% of FoxO3CAHep mice just within 4-
weeks of FoxO3 activation, whereas the rest of 52% FoxO3CAHep mice survived but
showed a smaller and severe hypoglycemic phenotype associated with moderate
upregulation of autophagy associated genes. Interestingly expression of FoxO3CA in
adult animals was sufficient to induce hyperglycemia in FoxO3CAHep mice at the age
of 7-weeks through regulation of gluconeogenesis-associated genes and alteration of
gene expression in glucose and lipid metabolism. Furthermore, we observed
elevated insulin levels as well as impaired glucose tolerance followed by insulin
sensitivity and activation of catabolic pathways including glycogenolysis and lipid
catabolic pathways in the liver. However the disease progression at the age of 9-
weeks in FoxO3CAHep mice was associated with hypoglycemia, hyperinsulinemia and
pancreatic hyperplasia. Strikingly, the anti-diabetic drug metformin completely
normalized glucose, insulin as well as lipid metabolism in FoxO3CAHep mice.
An important role of insulin signalling in regulating glucose homeostasis and systemic
growth has been shown previously in various experimental paradigms (Accili, Drago
et al. 1996; Dong, Park et al. 2006). FoxO transcription factors are the potential
mediators of hepatic gucose production downstream of insulin signalling and
deregulated during insulin resistance conditions (Eijkelenboom and Burgering 2013).
In our mouse model FoxO3CA expression just after birth result in perinatal lethality of
FoxO3CAHep mice with in 4-weeks of FoxO3 activation. The rest of FoxO3CAHep
animal analysed were severely smaller, sick and showed hypoglycemic phenotype. It
was previously reported that liver-specific deletion of Irs1/Irs2 results in

Discussion
104
hyperglycemia, hyperinsulinemia and smaller mice. In this mouse model it was
further evidenced that hepatic deletion of FoxO1 in triple knockout mice (TKO)
reverses the phenotype. This study pointed to the role of FoxO1 in directly regulating
the genes involved in glucose metabolism and indirectly inhibiting growth hormone
regulated genes (Dong, Copps et al. 2008). Additionally the smaller size of liver was
reported in liver-specific insulin receptor knockout (LIRKO)(Michael, Kulkarni et al.
2000) mice and in liver-specific deletion of catalytic subunit of PI3K (p110α) L-
p110α KO mice (Sopasakis, Liu et al. 2010) and was associated with defects in
growth signalling pathways. It is still not known whether FoxO1 and FoxO3 share
similar target genes or upregulate specific genes. In our mouse model it might be
possible that growth-signalling pathways were suppressed due to overactivation of
FoxO3 but this needs further investigation.
However it has been recently reported that expression of FoxO3CA in
cardiomyocytes resulted in a small heart phenotype and this was associated with
cardiomyocyte atrophy and activation of autophagy (Schips et al., 2011). In line with
this finding we also observed moderate upregulation of autophagy-associated genes
(e.g Atg5, Atg12, Atg1) in FoxO3CAHep mice. Additionaly hepatocytes were much
smaller and appeared atrophic in FoxO3CAHep mice. As autophagy is a lysosomal
degradation and self-destruction process, we could assume that the hypoglycemic
phenotype in FoxO3CAHep mice at the age of 4-weeks might be due to activation of
catabolic pathways like autophagy. Due to the severity of the phenotype at the age of
4-weeks in FoxO3CAHep mice most of the parameters could not be investigated and
this prompted us to analyse the animals at adult age.
When FoxO3CAHep mice were analysed at the age of 7-weeks, we observed a
hyperglycemic phenotype due to enhanced gluconeogenesis. This was followed by
hyperinsulinemia, impaired glucose and insulin tolerance, consistent with studies
showing constitutive activation of FoxO1 in the liver (Nakae, Biggs et al. 2002; Qu,
Altomonte et al. 2006; Zhang, Patil et al. 2006). However, our data suggest that the
interplay between different FoxO family members could be critical for the fine-tuning
of glucose metabolism. Previous work demonstrated that expression of a gain-of-
function allele of FoxO1 (FoxO1ADA) in the mouse liver paradoxically induced
hypoglycemia and increased insulin sensitivity through its increased ability to

Discussion
105
phosphorylate Akt in Trb3 (tribbles homologue 3)-dependent or independent manner
(Matsumoto, Han et al. 2006). In addition, deletion of FoxO1 in hepatocytes did not
alter the expression of gluconeogenic enzymes during fasting or after feeding (Lu,
Wan et al. 2012). Finally, additional members of the FoxO family might be involved in
regulating liver glucose homeostasis as hepatic activation of FoxO6 also induces
hyperglycemia in mice (Kim, Perdomo et al. 2011; Kim, Zhang et al. 2013). The
discrepencies observed in these studies with respect to insulin sensitivity might be
due to variation in experimental animal models, level and duration of overexpression,
as well as time of evaluation with respect to feeding versus fasting. Alternatively,
these data might be difficult to understand because different mutated forms of FoxO
may behave differently in unexpected ways. In contrast to these studies synergistic
contributions of FOXO transcription factors was also evidenced (Haeusler, Kaestner
et al. 2010) (Estall 2012; Zhang, Li et al. 2012) (Xiong, Tao et al. 2013) although
peviously no glucose metabolic defects have been outlined in either FoxO3-/- or
FoxO4-/- mice (Hosaka, Biggs et al. 2004). It had been shown that liver-specific
deletion of FoxO1, FoxO3, FoxO4 causes more profound fasting hypoglycemia,
improved insulin sensitivity and enhanced glucose tolerance with reduced plasma
insulin levels and this study presented an important role of FoxO1 for regulating
glucose metabolism and FoxO3 regulating lipid metabolism. However, the authors
claim whether it is achieved in a synergistic or coordinated pattern is still far from
being understood and remains largely open and the relative contributions of
individual FoxO transcription factors was not described. Accordingly, the FoxO3CAHep
mouse model is advantageous and a unique model for studying the metabolic
disease pathogenesis with respect to tissue specific gain-of function of FOXO3 in the
liver.
Our mice show substantial hyperinsulinemia. The normal action of insulin in the liver
involves an inactivation of FoxO transcription factors. However, this pathway is
blunted in our mouse model. Therefore, the hyperglycemic phenotype predominates.
Our data suggest that FoxO3 in hepatocytes could be the central effector
downstream of the insulin receptor/PI3K/Akt axis. This conclusion is supported by the
fact that the FoxO3CAHep mice among the FoxO gain-of-function studies show the
phenotype closest related to the mouse model of hepatic insulin receptor deficiency.
Both the studies are consistent in terms of FoxO3CAHep and liver-specific insulin

Discussion
106
receptor knock out mice (LIRKO) producing hyperglycemia due to increased hepatic
glucose production and increased expression of gluconeogenic target genes G6pc,
Pepck followed by marked hyperinsulinemia, impaired glucose and insulin tolerance.
These effects in LIRKO mice could arise due to deficiency of hepatic insulin signalling
resulting in insulin resistance and diabetes. In our mouse model our phenotype of
FoxO3CAHep mice also mimics several insulin resistance phenotypes such as liver-
specific deletion of Irs1 and Irs2 (DKO-mice) (Dong, Copps et al. 2008), liver-specific
deletion of Akt1 and Akt2 (DLKO) mice (Lu, Wan et al. 2012), and liver-specific
deletion of catalytic subunit of PI3K (p110α) L-p110α KO mice (Sopasakis, Liu et al.
2010) develop hyperglycemia due to unbridled gluconeogenesis, hyperinsulinemia
followed by impaired glucose and impaired insulin tolerance. All these studies points
to defective insulin signalling culminating in insulin resistance and type 2 diabetes.
The metabolic system reacts to environmental conditions by storing or utilizing
nutrients. For example lack of metabolites in the glucose metabolic pathway will
stimulate catabolic pathways like gluconeogenesis, glycogenolysis or lipid β-oxidation
(Sun, Miller et al. 2012). Consistently, in our study we observed that continuous
glucose production by FoxO3CA expression in FoxO3CAHep mice led to inhibition of
lipid synthesis and to activation of glycogenolysis and lipid catabolic pathways. We
saw an inhibition of the fatty acid synthesis pathway and activation of lipid β-oxidation
most likely in order to provide energy and metabolites for gluconeogenesis.
A previous study with over-expression of FoxO1 (FoxO1ADA) in the liver observed
improved insulin sensitivity, lipid accumulation and steatosis in the liver, with reduced
fatty acid oxidation which is quite distinct from our model. The lipid catabolic pathway
was actually inhibited in mice with FoxO1 over-expression (Matsumoto, Han et al.
2006). In this study the increase in insulin sensitivity and lipid accumulation (Aoyama,
Peters et al. 1998) was associated with increase FoxO1 activity to suppress
pseudokinase tribble 3 (Trb3). Trb3 is a modulator of Akt activity and it has been
shown that Trb3 when it binds to Akt and prevents insulin-induced phosphorylation of
Akt (Du, Herzig et al. 2003). The suppression of Trb3 was not dependent on FoxO1
but FoxO1 may interact with the PPARγ coactivator 1α (Pgc1α) a well-known
modulator of Trb3. However, the importance of (Pgc1α) has been previously reported
in disorders of lipid metabolism in the liver in several mouse models (Leone,

Discussion
107
Weinheimer et al. 1999; Hashimoto, Cook et al. 2000). In our mouse model, we
obeserved an increase in lipid and glucose catabolic pathway a possible explanation
might be that critical regulators of glucose and lipid metabolism such as Pgc1α (Li,
Monks et al. 2007) are differently affected in FoxO1 and FoxO3 gain-of-function
models. In line with this using a similar gain-of function model Qu et al. (Qu,
Altomonte et al. 2006) have observed enhanced lipogenesis and liver steatosis due
to increased FoxO1 activity resulted in upregulation of Pgc-1α, fatty acid synthase
and acetyl CoA carboxylase expression. The inconsistency oberved with respect to
improved insulin sensitivity and increased lipogenesis can be due to variation in
experimental animal models and experimental settings. However there are only few
gene expression studies comparing target genes of different FoxO members
(Eijkelenboom and Burgering 2013), and further investigation of specific gene
regulation by individual FoxO members also in the context of lipid metabolism is
required.
We have seen a moderate reduction in triglycerides and cholesterol levels in
FoxO3CAHep mice. In line with this (Zhang, Patil et al. 2006), liver-specific FoxO1
activation has resulted in decreased triglycerides in transgenic mice which were due
to decreased expression of genes involved in glycolysis and lipid synthesis resulting
in reduced triglyceride concentrations in transgenic mice (Zhang, Patil et al. 2006). In
our mouse model in FoxO3CAHep mice we also have observed downregulation of
genes involved in glycolysis, such as glucokinase and pyruvate kinase are
downregulated as well as lipid synthesis genes ascertained by microarray analysis
and quantitative PCR studies. Consistently, the reduced triglycerides in liver-specific
Irs1/ Irs2 knockout mice are associated with decreased SREBP-1c expression (Dong,
Copps et al. 2008). Furthermore the decreased triglycerides in liver-specific deletion
of catalytic subunit of PI3K (p110α) L-p110α KO mice (Sopasakis, Liu et al. 2010)
are also linked to decreased lipogenic gene expression. Another possibility for
reduced triglycerides in FoxO3CAHep mice might be due to a decreased effect of
insulin in the liver to promote triglyceride synthesis coupled with suppression of
extrahepatic lipolysis due to high insulin levels in FoxO3CAHep mice as reported
previously in LIRKO mice (Michael, Kulkarni et al. 2000).

Discussion
108
Additionally, expression of FoxO3CA in the liver led to loss of glycogen storage in
FoxO3CAHep mice, a phenotype also observed in insulin resistant LIRKO mice
(Michael, Kulkarni et al. 2000), liver-specific Irs1/ Irs2 knockout mice (Dong, Copps et
al. 2008) and in liver-specific FoxO1 gain-of-function mice (Qu, Altomonte et al.
2006). The normal action of insulin in the liver is to suppress glycogenolysis and
gluconeogenesis. Loss of glycogen in these studies is associated with impaired
insulin signalling during insulin resistant states. However, it has also been reported in
subjects of type 2 diabetes that the increase in hepatic glucose production occurs by
enhanced gluconeogenesis and enhanced glycogenolysis (DeFronzo, Bonadonna et
al. 1992). Consistently, in our mouse model we have observed an increase in mRNA-
level of glycogen phosphorylase an important enzyme for glycogenolysis showing
that both gluconeogenesis and glycogenolysis are activated to produce more glucose
production in FoxO3CAHep mice as reported recently in diabetic db/db mouse liver
(Zhang, Xu et al. 2013).
Our gene expression profile ascertained by microarray analysis in FoxO3CAHep mice
showed a global metabolic profile with the regulation of several genes involved in
glucose and lipid metabolism. The most upregulated gene was leptin receptor (Lepr).
It has been shown in the liver that proper insulin signalling plays a critical role in
expression and clearence of leptin receptor as well as fine-tuning of leptin action and
leptin homeostasis. The upregulation of Lepr during insulin resistance states was
reported by (Cohen, Kokkotou et al. 2007) in liver-specific insulin receptor knockout
mice LIRKO mice (Michael, Kulkarni et al. 2000). Additionally the increase in leptin
receptor expression was also reported in liver-specific deletion of the catalytic subunit
of PI3K (p110α) L-p110α KO mice (Sopasakis, Liu et al. 2010) and was due to insulin
resistance phenotype. Consistently, in our mouse model we can postulate that
increased expression of Lepr is correlated with insulin resistance in FoxO3CAHep
mice.
In diabetes, the increased rate of hepatic gluconeogenesis has been shown
previously (DeFronzo, Bonadonna et al. 1992; Pilkis and Granner 1992; Samuel and
Shulman 2012). Consistent with the previous reports, genes involved in promoting
hepatic gluconeogenesis such as pyruvate dehydrogenase kinase-4 (Pdk4) were
upregulated and glycolytic genes such as Glucokinase (Gck), and pyruvate kinase

Discussion
109
liver (Pklr) were downregulated as reported before in liver-specific gain-of-function of
FoxO1 and in type 2 diabetic stated in human liver (Pilkis and Granner 1992; Zhang,
Patil et al. 2006). Interestingly genes providing substrates for gluconeogenesis are
increased such as aquaporin7 as shown previously (Zhang, Patil et al. 2006).
Consistently due to enhanced activation of lipid catabolic pathways in FoxO3CAHep
mice we have observed upregulation of genes involved in lipid transport and
trafficking (fabp5, fabp7, Apom, Atp11) and genes involved in fatty acid oxidation
(cpt1b, ehhadh, Acot2, Acad12). Conversly genes involved in fatty acid synthesis
were downregulated (Acly, Fasn, Acc, Acsm1). Moreover our microarray analyses
reveal that the livers from FoxO3CAHep mice are accelerated towards uncontrolled
gluconeogenesis by inhibiting the lipid synthesis pathway and activation of lipid β-
oxidation. Interestingly, our gene expression profiles are very similar to microarray
analysis of recently reported 9-week-old type 2 diabetic db/db mouse liver (Zhang, Xu
et al. 2013).
Interestingly, when we evaluated the disease progression by analysing the
FoxO3CAHep mice at the age of 9-weeks, surprisingly FoxO3CAHep mice showed
fasting hypoglycemia and higher insulin levels. These findings were in contrast to our
previous findings where FoxO3CAHep mice showed fasting hyperglycemia at the age
of 7-weeks. What could be the reason for this unanticipated hypoglycemic response?
It could be due to high insulin secretion from pancreatic β-cells as the insulin levels
were elevated in FoxO3CAHep mice at the age of 9-weeks. Similarly, it was previously
reported in liver-specific LIRKO mouse model that LIRKO mice showed progressive
decline in blood glucose at 6 months of age, LIRKO mice showed fasting
hypoglycemia that resembles the hypoglycemic phenotype of FoxO3CAHep mice at
the age of 9 weeks. The hypoglycemic effect could be due to the development of
acquired liver failure or plausibly imitating the reduced sufficiency of livers for
gluconeogenesis. When FoxO3CAHep mice were analysed for gluconeogenesis they
showed reduced effect of gluconeogenesis. Additionally, another possibility for
fasting hypoglycemia is that it might arise due to less insulin clearence capacity in the
liver as observed in LIRKO mice. Hepatocytes are the major place for insulin
clearence and hepatocytes in liver failure probably are not able to clean up insulin
properly. Furthermore it was reported in human patients that any excess of
endogenous or exogenous insulin could cause hypoglycemia in diabetes (Cryer,

Discussion
110
Davis et al. 2003; De Leon and Stanley 2013).
Strikingly in our mouse model we have demonstrated pancreatic hyperplasia at the
age of 9-weeks in FoxO3CAHep mice and this finding is similar to pancreatic
hyperplasia of insulin-resistant LIRKO mouse model (Michael, Kulkarni et al. 2000). It
could arise as a compensatory mechanism in response to increased insulin levels
and impaired insulin clearence. However, the mechanisms controlling proliferation,
expansion of β-cells and its adaptation to insulin resistance are incompletely defined
although it was evidenced that massive bulk of new β-cells in both rodent and
humans develop by simple self-duplication of preexisting β-cells (Dor, Brown et al.
2004; Teta, Rankin et al. 2007; Meier, Butler et al. 2008). It is known that pancreatic
β-cells preserve the potential to raise their replication rate in reply to physiological
challenges, including hyperglycemia (Alonso, Yokoe et al. 2007), pancreatic injury
(Nir, Melton et al. 2007; Cano, Rulifson et al. 2008) insulin resistance (Bruning,
Winnay et al. 1997; Pick, Clark et al. 1998; Michael, Kulkarni et al. 2000; Kulkarni,
Jhala et al. 2004) and gestation (Parsons, Brelje et al. 1992; Rieck, White et al.
2009). It has been reported that circulating and systemic factors can influence β-cell
mass and replication. Importantly glucose infusion in mice induces β-cell replication
showing glucose itself is a β-cell mitogen (Bonner-Weir, Deery et al. 1989; Bernard,
Thibault et al. 1998; Alonso, Yokoe et al. 2007). In addition to the factors described
above several hormones including prolactin, placental lactogen, insulin, glucagons-
like peptide 1, and glucose-dependent insulinotropic polypeptide also play a critical
role in regulation of β-cell mass (Parsons, Brelje et al. 1992; Bernard, Thibault et al.
1998; Paris, Bernard-Kargar et al. 2003; Drucker 2006; Sachdeva and Stoffers 2009).
The role of circulating islet cell growth factor during insulin resistance condition
independent of obesity and glucose has also been shown in transplanted mice (Flier,
Kulkarni et al. 2001).
Specifically how the liver signals pancreatic β-cells to proliferate is unknown, but
recently using LIRKO mouse model it was demonstrated that non-cell-autonomous,
nonneural, humoral factors causes pancreatic hyperplasia (El Ouaamari, Kawamori
et al. 2013). This study showed that the liver-derived systemic factors trigger human
and mouse β-cell proliferation and further showed that the liver serves as a source for

Discussion
111
β-cell growth factors in response to insulin resistance. In line with this study recently
betatrophin a hormone that controls pancreatic β-cell proliferation and β-cell mass
expansion in insulin resistant mouse model was identified (Yi, Park et al. 2013). This
study critically showed the role of betatrophin produced in mouse liver inducing β-cell
proliferation, β-cell mass expansion and improving glucose tolerance and further
pointing to the therapeutic importance of betatrophin during insulin resistance
conditions. Similarly constitutive activation of mitogen- activated protein kinase / ERK
kinase (MEK-1) in the mouse liver induces pancreatic β-cell replication and enhances
glucose tolerance showing that the increase in hyperinsulinemia and compensatory
pancreatic β-cell mass is multifactorial and requires the central nervous system
(CNS) presenting an inter-organ communication system controlling pancreatic β-cell
proliferation (Imai, Katagiri et al. 2008). Recently the role of hepatocyte growth factor
(HGF) in determining increase in islet cell mass along with hyperinsulinemia in
mouse models of insulin-resistance was reported (Araujo, Oliveira et al. 2012).
However in our mouse model it might be that glucose and insulin itself are potential
candidates for the observed pancreatic hyperplasia as reported before (Bonner-Weir,
Deery et al. 1989; Assmann, Hinault et al. 2009; Assmann, Ueki et al. 2009).
However, we cannot exclude the possibility of liver-derived unknown factors inducing
β-cell hyperplasia or betatrophin like hormone contribution augmenting β-cell
hyperplasia in FoxO3CAHep mice at the age of 9 weeks. Importantly the expression of
betatrophin was not affected in our gene expression analyses. Therefore further
investigation is needed to identify specific β-cell growth factor. Indeed our mouse
model may serve as a tool for identifying yet unknown liver-derived factors/ hormones
augmenting β-cell hyperplasia in insulin resistance states.
Since decades, several types of anti-diabetic drugs have been generated. Among
those, biguanides including phenformin and metformin function by inhibition of
glucose production (Stumvoll, 1995). Especially metformin is currently the most
prescribed drug for type 2 diabetes. In our mouse model metformin administration
completely normalizes glucose level with marked decrease in expression of
gluconeogenic target genes in FoxO3CAHep mice. It has been reported that metformin
primarily functions to decrease hepatic glucose production by attenuating hepatic
gluconeogenesis both in diabetic mouse models (Mithieux, Guignot et al. 2002;

Discussion
112
Shaw, Lamia et al. 2005; Kim, Park et al. 2008; He, Sabet et al. 2009; Hou, Venier et
al. 2010; Tahara, Matsuyama-Yokono et al. 2011) and in humans with type 2
diabetes (Davidson and Peters 1997; Hundal, Krssak et al. 2000; Natali and
Ferrannini 2006). Additionally metformin administration in our mouse model
normalizes insulin levels in FoxO3CAHep mice both at the age of 7-week as well as at
9-weeks. Metformin is the best insulin sensitizer during insulin resistance conditions
and it improves insulin sensitivity due to its positive effects on insulin receptor
tyrosine kinase activity in streptozotosin-induced diabetic rats (Rossetti, DeFronzo et
al. 1990) and it increases the activation of insulin receptor specifically insulin receptor
substrate 2 (Irs2) activation in human liver (Gunton, Delhanty et al. 2003). In our
mouse model we have seen downregulation of Irs2 in gene expression analysis after
metformin treatment and actually the normalization of insulin levels in our mouse
model is associated with normalization of glucose levels after metformin treatment as
evidenced in several studies (Hou, Venier et al. 2010; Martin-Montalvo, Mercken et
al. 2013). We have also seen the normalization of pancreatic islet morphology in
FoxO3CAHep mice at the age of 9-weeks, as it has been already known that
metformin has no immediate effect on the function of pancreatic beta cells. Fasting
and feeding insulin levels are frequently reduced after metformin treatment in patients
and in mice with diabetes showing the normal compensatory response of the
pancreas to enhanced insulin sensitivity (Klip and Leiter 1990; Rossetti, DeFronzo et
al. 1990; DeFronzo, Barzilai et al. 1991; Johnson, Webster et al. 1993; Stumvoll,
Nurjhan et al. 1995; Cusi, Consoli et al. 1996). From these studies it can be inferred
that in our mouse model the normalization of pancreatic islets after metfromin
treatment in FoxO3CAHep mice at the age of 9-weeks is associated with normal
insulin levels and improved insulin sensitivity.
Despite the wide acceptance of metformin as first-line therapy, the molecular
mechanisms of action remain incompletely understood. It was suggested that
metformin reduces glucose levels via activating adenosine mono-phosphate (AMP)-
activated protein kinase (AMPK) and its upstream kinase serine/threonine kinase 11
(STK11) also known as liver kinase B1 (LKB1) both in vivo and in vitro (Zhou, Myers
et al. 2001; Shaw, Lamia et al. 2005; Kim, Park et al. 2008; Lee, Seo et al. 2010).
Interestingly, in vivo mouse models with liver-specific AMPK-deficient mice
(AMPKα1α2-/-) and liver-specific LKB1-deficient mice (Lkb1-KO) show no

Discussion
113
influence on metformin-dependent reduction in blood glucose levels (Foretz, Hebrard
et al. 2010). We also assume that metformin effects in our model were AMPK-
independent. We did not see significant changes of amount and phosphorylation of
AMPK in FoxO3CAHep mice. Furthermore, as AMPK is known to activate FoxO family
members metformin-induced activation of AMPK should actually result in
phosphorylation and activation of FoxO3 (Greer, Oskoui et al. 2007). Therefore it
could be reasonable that AMPK activity is suppressed by active FoxO3. This could
explain why independent of metformin treatment FoxO3CAHep mice displayed lower
AMPK activity. A recent study suggested that metformin suppresses hepatic
glucagon signaling by decreasing production of cyclic AMP and PKA activity in an
AMPK-dependent manner (Miller, Chu et al. 2013). PKA signaling activates the
transcription factor CREB that regulates target gene expression for glucose and lipid
metabolism together with CREB-binding protein (CBP). In addition, metformin was
shown to inactivate CBP by phosphorylation (He, Sabet et al. 2009). Given that CBP
is a general transcription co-regulator, this axis of metformin action might affect
FoxO3-dependent transcription. However, direct effects of metformin on FoxO3
activity are more likely, as modulation of CBP should result in a much more
generalized alteration of gene expression.
Additionally, it has also been reported that metformin-induced activation of AMPK
lowers hepatic gluconeogenesis in livers from B6-Lepob/ob mice through modulation of
orphan nuclear receptor small heterodimer partner (SHP) (Kim, Park et al. 2008). The
role of SHP in repressing the transcriptional activities of hepatic nuclear factor 4-
α (HNF4α), FoxO1 and a variety of nuclear receptors that regulate the gluconeogenic
programme has been reported (Lee and Moore 2002; Kim, Kim et al. 2004;
Yamagata, Daitoku et al. 2004). SHP also interacts with the CREB-CBP complex and
CRTC2 to attenuate gluconeogenic gene expresssion (Lee, Seo et al. 2010). In our
mouse model it is possible that SHP might interact with FoxO3 or other
transcriptional regulators to lower gluconeogenesis. Nevertheless we performed
various experiments to assess the level of SHP activation but we have not found any
striking results one plausibility could be an unknown exciting mechanism to attenuate
distorted glucose and lipid metabolism in FoxO3CAHep mice after metformin treatment
and this mechanism is on the way of further exploration.

Discussion
114
We observed complete normalization in lipid metabolism, as well as hepatocyte
morphology after metformin administration in FoxO3CAHep mice. Metformin-mediated
re-normalization of lipid metabolism is probably a consequence of normalization in
glucose metabolism. Previously it was shown that metformin reverses fatty liver
disease in leptin-deficient ob/ob mice (Lin et al., 2000) and in rat fatty liver induced by
high fat feeding (Gao, Lu et al. 2005; Zhang, Zhang et al. 2006), suggesting that
metformin is beneficial in improving lipid metabolism. In line with this it has also been
recently reported that metformin reduces the fat content of the liver in obese
overweight women (Sanchez-Munoz, Salas-Romero et al. 2013). The gene
expression analysis after metformin treatment in FoxO3CAHep mice showed complete
normalization of all the genes involved in lipid and glucose metabolism. The possible
explanations for normalization of genes after metformin treatment in FoxO3CAHep
mice are correlated with normalization of glucose metabolism. Given that our model
depends on the expression of a transcription factor that was rendered non-
responsive to insulin signalling suggests that this terminal step is crucially targeted by
metformin. In summary, our study provides new insights into the role of FoxO3 in
glucose and lipid metabolism. Furthermore, our data suggest that FoxO3 could be an
immediate target of metformin action.
Conclusions
In the present study we demonstrate that constitutive activation of FoxO3 results in
impaired glucose and lipid metabolism in transgenic mice. FoxO3 activation resulted
in impaired glucose tolerance due to upregulation of gluconeogenic target genes
followed by hyperinsulinemia and impaired insulin sensitivity. Moreover expression of
constitutively active FoxO3 results in activation of catabolic pathways including
glycogenolysis and lipid catabolic pathways in the liver. On the other hand FoxO3
inhibits lipid synthesis pathways. Consistently our gene expression analysis has
identified several genes important for regulation of glucose and lipid catabolic
pathways as reported in type 2 diabetes conditions. However the disease
progression in transgenic mice resulted in hypoglycemia might be as a consequence
of beginning of liver failure, hyperinsulinemia and pancreatic hyperplasia. Strikingly
the administration of metformin rapidly and completely normalizes glucose, insulin as

Discussion
115
well as lipid metabolism in mice expressing constitutively active FoxO3 (Figure 42).
Our findings identify FoxO3 as a critical metabolic regulator and a potential hepatic
target of metformin. Taken together the results obtained from constitutive activation
of FoxO3 in the liver imply that dysbalanced FoxO3 activity in the liver augments
insulin resistance and type 2 diabetes. Therefore tight regulation of FoxO3 activity
would be very crucial and agents controlling hepatic FoxO3 system may represent
therapeutic tools to prevent type 2 diabetes.
Figure 42: Effects of liver-specific FoxO3 activation in FoxO3CAHep mice.Expression of constitutively active FoxO3 leads to hyperglycemia due to up-regulation of
gluconeogenic target genes followed by impaired glucose and insulin tolerance and furthermore
resulted in activation of catabolic pathways including enhanced glycogenolysis and decresed lipid
synthesis. The disease progression in transgenic mice resulted in hypoglycemia, hyperinsulinemia and
pancreatic hyperplasia. The administration of metformin for 3 days and 3 weeks completely normalizes
the distorted glucose and lipid metabolism in FoxO3CAHep mice.

References
116
5 References
Accili, D. and K. C. Arden (2004). "FoxOs at the crossroads of cellular metabolism,
differentiation, and transformation." Cell 117(4): 421-6.
Accili, D., J. Drago, et al. (1996). "Early neonatal death in mice homozygous for a null
allele of the insulin receptor gene." Nat Genet 12(1): 106-9.
Adler, A. I., E. J. Shaw, et al. (2009). "Newer agents for blood glucose control in type
2 diabetes: summary of NICE guidance." BMJ 338: b1668.
Agius, L. (2008). "Glucokinase and molecular aspects of liver glycogen metabolism."
Biochem J 414(1): 1-18.
Alonso, L. C., T. Yokoe, et al. (2007). "Glucose infusion in mice: a new model to
induce beta-cell replication." Diabetes 56(7): 1792-801.
Altomonte, J., L. Cong, et al. (2004). "Foxo1 mediates insulin action on apoC-III and
triglyceride metabolism." J Clin Invest 114(10): 1493-503.
Altomonte, J., A. Richter, et al. (2003). "Inhibition of Foxo1 function is associated with
improved fasting glycemia in diabetic mice." Am J Physiol Endocrinol Metab
285(4): E718-28.
Aoyama, T., J. M. Peters, et al. (1998). "Altered constitutive expression of fatty acid-
metabolizing enzymes in mice lacking the peroxisome proliferator-activated
receptor alpha (PPARalpha)." J Biol Chem 273(10): 5678-84.
Araujo, T. G., A. G. Oliveira, et al. (2012). "Hepatocyte growth factor plays a key role
in insulin resistance-associated compensatory mechanisms." Endocrinology
153(12): 5760-9.
Argaud, D., H. Roth, et al. (1993). "Metformin decreases gluconeogenesis by
enhancing the pyruvate kinase flux in isolated rat hepatocytes." Eur J Biochem
213(3): 1341-8.
Ashcroft, F. M. and P. Rorsman (2012). "Diabetes mellitus and the beta cell: the last
ten years." Cell 148(6): 1160-71.
Assmann, A., C. Hinault, et al. (2009). "Growth factor control of pancreatic islet
regeneration and function." Pediatr Diabetes 10(1): 14-32.
Assmann, A., K. Ueki, et al. (2009). "Glucose effects on beta-cell growth and survival
require activation of insulin receptors and insulin receptor substrate 2." Mol
Cell Biol 29(11): 3219-28.

References
117
Authier, F. and B. Desbuquois (2008). "Glucagon receptors." Cell Mol Life Sci 65(12):
1880-99.
Balani, J., S. L. Hyer, et al. (2009). "Pregnancy outcomes in women with gestational
diabetes treated with metformin or insulin: a case-control study." Diabet Med
26(8): 798-802.
Bar, R. S., L. C. Harrison, et al. (1979). "Regulation of insulin receptors in normal and
abnormal physiology in humans." Adv Intern Med 24: 23-52.
Barthel, A., D. Schmoll, et al. (2005). "FoxO proteins in insulin action and
metabolism." Trends Endocrinol Metab 16(4): 183-9.
Bechmann, L. P., R. A. Hannivoort, et al. (2012). "The interaction of hepatic lipid and
glucose metabolism in liver diseases." J Hepatol 56(4): 952-64.
Ben Sahra, I., Y. Le Marchand-Brustel, et al. (2010). "Metformin in cancer therapy: a
new perspective for an old antidiabetic drug?" Mol Cancer Ther 9(5): 1092-9.
Bergman, R. N. (2005). "Minimal model: perspective from 2005." Horm Res 64 Suppl3: 8-15.
Bernard, C., C. Thibault, et al. (1998). "Pancreatic beta-cell regeneration after 48-h
glucose infusion in mildly diabetic rats is not correlated with functional
improvement." Diabetes 47(7): 1058-65.
Bettermann, K., M. Vucur, et al. (2010). "TAK1 suppresses a NEMO-dependent but
NF-kappaB-independent pathway to liver cancer." Cancer Cell 17(5): 481-96.
Biddinger, S. B. and C. R. Kahn (2006). "From mice to men: insights into the insulin
resistance syndromes." Annu Rev Physiol 68: 123-58.
Bonnefond, A., P. Froguel, et al. (2010). "The emerging genetics of type 2 diabetes."
Trends Mol Med 16(9): 407-16.
Bonner-Weir, S., D. Deery, et al. (1989). "Compensatory growth of pancreatic beta-
cells in adult rats after short-term glucose infusion." Diabetes 38(1): 49-53.
Borkhardt, A., R. Repp, et al. (1997). "Cloning and characterization of AFX, the gene
that fuses to MLL in acute leukemias with a t(X;11)(q13;q23)." Oncogene
14(2): 195-202.
Bouche, C., S. Serdy, et al. (2004). "The cellular fate of glucose and its relevance in
type 2 diabetes." Endocr Rev 25(5): 807-30.
Brunet, A. (2004). "[The multiple roles of FOXO transcription factors]." Med Sci
(Paris) 20(10): 856-9.

References
118
Brunet, A., A. Bonni, et al. (1999). "Akt promotes cell survival by phosphorylating and
inhibiting a Forkhead transcription factor." Cell 96(6): 857-68.
Brunet, A., F. Kanai, et al. (2002). "14-3-3 transits to the nucleus and participates in
dynamic nucleocytoplasmic transport." J Cell Biol 156(5): 817-28.
Brunet, A., L. B. Sweeney, et al. (2004). "Stress-dependent regulation of FOXO
transcription factors by the SIRT1 deacetylase." Science 303(5666): 2011-5.
Bruning, J. C., J. Winnay, et al. (1997). "Development of a novel polygenic model of
NIDDM in mice heterozygous for IR and IRS-1 null alleles." Cell 88(4): 561-72.
Buteau, J. and D. Accili (2007). "Regulation of pancreatic beta-cell function by the
forkhead protein FoxO1." Diabetes Obes Metab 9 Suppl 2: 140-6.
Butler, A. E., J. Janson, et al. (2003). "Beta-cell deficit and increased beta-cell
apoptosis in humans with type 2 diabetes." Diabetes 52(1): 102-10.
Calnan, D. R. and A. Brunet (2008). "The FoxO code." Oncogene 27(16): 2276-88.
Cano, D. A., I. C. Rulifson, et al. (2008). "Regulated beta-cell regeneration in the
adult mouse pancreas." Diabetes 57(4): 958-66.
Carling, D. (2004). "The AMP-activated protein kinase cascade--a unifying system for
energy control." Trends Biochem Sci 29(1): 18-24.
Chatzigeorgiou, A., A. Halapas, et al. (2009). "The use of animal models in the study
of diabetes mellitus." In Vivo 23(2): 245-58.
Cheng, Z., S. Guo, et al. (2009). "Foxo1 integrates insulin signaling with
mitochondrial function in the liver." Nat Med 15(11): 1307-11.
Cho, H., J. Mu, et al. (2001). "Insulin resistance and a diabetes mellitus-like
syndrome in mice lacking the protein kinase Akt2 (PKB beta)." Science
292(5522): 1728-31.
Clement, S., U. Krause, et al. (2001). "The lipid phosphatase SHIP2 controls insulin
sensitivity." Nature 409(6816): 92-7.
Cohen, S. E., E. Kokkotou, et al. (2007). "High circulating leptin receptors with normal
leptin sensitivity in liver-specific insulin receptor knock-out (LIRKO) mice." J
Biol Chem 282(32): 23672-8.
Cool, B., B. Zinker, et al. (2006). "Identification and characterization of a small
molecule AMPK activator that treats key components of type 2 diabetes and
the metabolic syndrome." Cell Metab 3(6): 403-16.
Corton, J. M., J. G. Gillespie, et al. (1994). "Role of the AMP-activated protein kinase
in the cellular stress response." Curr Biol 4(4): 315-24.

References
119
Craparo, A., R. Freund, et al. (1997). "14-3-3 (epsilon) interacts with the insulin-like
growth factor I receptor and insulin receptor substrate I in a phosphoserine-
dependent manner." J Biol Chem 272(17): 11663-9.
Cryer, P. E., S. N. Davis, et al. (2003). "Hypoglycemia in diabetes." Diabetes Care
26(6): 1902-12.
Cuesta-Munoz, A. L., T. Tuomi, et al. (2010). "Clinical heterogeneity in monogenic
diabetes caused by mutations in the glucokinase gene (GCK-MODY)."
Diabetes Care 33(2): 290-2.
Cusi, K., A. Consoli, et al. (1996). "Metabolic effects of metformin on glucose and
lactate metabolism in noninsulin-dependent diabetes mellitus." J Clin
Endocrinol Metab 81(11): 4059-67.
Daitoku, H., K. Yamagata, et al. (2003). "Regulation of PGC-1 promoter activity by
protein kinase B and the forkhead transcription factor FKHR." Diabetes 52(3):
642-9.
Davidson, M. B. and A. L. Peters (1997). "An overview of metformin in the treatment
of type 2 diabetes mellitus." Am J Med 102(1): 99-110.
Davis, R. J., C. M. D'Cruz, et al. (1994). "Fusion of PAX7 to FKHR by the variant
t(1;13)(p36;q14) translocation in alveolar rhabdomyosarcoma." Cancer Res
54(11): 2869-72.
De Leon, D. D. and C. A. Stanley (2013). "Determination of insulin for the diagnosis
of hyperinsulinemic hypoglycemia." Best Pract Res Clin Endocrinol Metab
27(6): 763-9.
Defronzo, R. A. (2009). "Banting Lecture. From the triumvirate to the ominous octet:
a new paradigm for the treatment of type 2 diabetes mellitus." Diabetes 58(4):
773-95.
DeFronzo, R. A., N. Barzilai, et al. (1991). "Mechanism of metformin action in obese
and lean noninsulin-dependent diabetic subjects." J Clin Endocrinol Metab
73(6): 1294-301.
DeFronzo, R. A., R. C. Bonadonna, et al. (1992). "Pathogenesis of NIDDM. A
balanced overview." Diabetes Care 15(3): 318-68.
Detaille, D., B. Guigas, et al. (2002). "Obligatory role of membrane events in the
regulatory effect of metformin on the respiratory chain function." Biochem
Pharmacol 63(7): 1259-72.

References
120
Donath, M. Y., E. Dalmas, et al. (2013). "Inflammation in obesity and diabetes: islet
dysfunction and therapeutic opportunity." Cell Metab 17(6): 860-72.
Donath, M. Y. and S. E. Shoelson (2011). "Type 2 diabetes as an inflammatory
disease." Nat Rev Immunol 11(2): 98-107.
Dong, X., S. Park, et al. (2006). "Irs1 and Irs2 signaling is essential for hepatic
glucose homeostasis and systemic growth." J Clin Invest 116(1): 101-14.
Dong, X. C., K. D. Copps, et al. (2008). "Inactivation of hepatic Foxo1 by insulin
signaling is required for adaptive nutrient homeostasis and endocrine growth
regulation." Cell Metab 8(1): 65-76.
Dor, Y., J. Brown, et al. (2004). "Adult pancreatic beta-cells are formed by self-
duplication rather than stem-cell differentiation." Nature 429(6987): 41-6.
Drucker, D. J. (2006). "The biology of incretin hormones." Cell Metab 3(3): 153-65.
Du, K., S. Herzig, et al. (2003). "TRB3: a tribbles homolog that inhibits Akt/PKB
activation by insulin in liver." Science 300(5625): 1574-7.
Durham, H. A. and G. E. Truett (2006). "Development of insulin resistance and
hyperphagia in Zucker fatty rats." Am J Physiol Regul Integr Comp Physiol
290(3): R652-8.
Eijkelenboom, A. and B. M. Burgering (2013
). "FOXOs: signalling integrators for homeostasis maintenance." Nat Rev Mol Cell
Biol 14(2): 83-97.
El Ouaamari, A., D. Kawamori, et al. (2013). "Liver-derived systemic factors drive
beta cell hyperplasia in insulin-resistant states." Cell Rep 3(2): 401-10.
El-Mir, M. Y., V. Nogueira, et al. (2000). "Dimethylbiguanide inhibits cell respiration
via an indirect effect targeted on the respiratory chain complex I." J Biol Chem
275(1): 223-8.
Emanuelli, B., P. Peraldi, et al. (2000). "SOCS-3 is an insulin-induced negative
regulator of insulin signaling." J Biol Chem 275(21): 15985-91.
Estall, J. L. (2012). "The Foxo family: partners in crime or silent heroes."
Endocrinology 153(2): 549-51.
Evans, J. M., L. A. Donnelly, et al. (2005). "Metformin and reduced risk of cancer in
diabetic patients." BMJ 330(7503): 1304-5.
Flachsbart, F., A. Caliebe, et al. (2009). "Association of FOXO3A variation with
human longevity confirmed in German centenarians." Proc Natl Acad Sci U S
A 106(8): 2700-5.

References
121
Flier, S. N., R. N. Kulkarni, et al. (2001). "Evidence for a circulating islet cell growth
factor in insulin-resistant states." Proc Natl Acad Sci U S A 98(13): 7475-80.
Foretz, M., S. Hebrard, et al. (2010). "Metformin inhibits hepatic gluconeogenesis in
mice independently of the LKB1/AMPK pathway via a decrease in hepatic
energy state." J Clin Invest 120(7): 2355-69.
Frescas, D., L. Valenti, et al. (2005). "Nuclear trapping of the forkhead transcription
factor FoxO1 via Sirt-dependent deacetylation promotes expression of
glucogenetic genes." J Biol Chem 280(21): 20589-95.
Furuyama, T., K. Kitayama, et al. (2003). "Forkhead transcription factor FOXO1
(FKHR)-dependent induction of PDK4 gene expression in skeletal muscle
during energy deprivation." Biochem J 375(Pt 2): 365-71.
Galili, N., R. J. Davis, et al. (1993). "Fusion of a fork head domain gene to PAX3 in
the solid tumour alveolar rhabdomyosarcoma." Nat Genet 5(3): 230-5.
Gao, Z., D. Hwang, et al. (2002). "Serine phosphorylation of insulin receptor
substrate 1 by inhibitor kappa B kinase complex." J Biol Chem 277(50):
48115-21.
Gao, Z. Q., F. E. Lu, et al. (2005). "[Study on therapeutic effects of metformin on rat
fatty livers induced by high fat feeding]." Zhonghua Gan Zang Bing Za Zhi
13(2): 101-4.
Graham, G. G., J. Punt, et al. "Clinical pharmacokinetics of metformin." Clin
Pharmacokinet 50(2): 81-98.
Gray, S., B. Wang, et al. (2007). "Regulation of gluconeogenesis by Kruppel-like
factor 15." Cell Metab 5(4): 305-12.
Greer, E. L., M. R. Banko, et al. (2009). "AMP-activated protein kinase and FoxO
transcription factors in dietary restriction-induced longevity." Ann N Y Acad Sci
1170: 688-92.
Greer, E. L. and A. Brunet (2005). "FOXO transcription factors at the interface
between longevity and tumor suppression." Oncogene 24(50): 7410-25.
Greer, E. L., P. R. Oskoui, et al. (2007). "The energy sensor AMP-activated protein
kinase directly regulates the mammalian FOXO3 transcription factor." J Biol
Chem 282(41): 30107-19.
Gross, D. N., A. P. van den Heuvel, et al. (2008). "The role of FoxO in the regulation
of metabolism." Oncogene 27(16): 2320-36.

References
122
Gunton, J. E., P. J. Delhanty, et al. (2003). "Metformin rapidly increases insulin
receptor activation in human liver and signals preferentially through insulin-
receptor substrate-2." J Clin Endocrinol Metab 88(3): 1323-32.
Guo, S., G. Rena, et al. (1999). "Phosphorylation of serine 256 by protein kinase B
disrupts transactivation by FKHR and mediates effects of insulin on insulin-like
growth factor-binding protein-1 promoter activity through a conserved insulin
response sequence." J Biol Chem 274(24): 17184-92.
Haeusler, R. A., K. H. Kaestner, et al. (2010). "FoxOs function synergistically to
promote glucose production." J Biol Chem 285(46): 35245-8.
Hall, R. K., T. Yamasaki, et al. (2000). "Regulation of phosphoenolpyruvate
carboxykinase and insulin-like growth factor-binding protein-1 gene expression
by insulin. The role of winged helix/forkhead proteins." J Biol Chem 275(39):
30169-75.
Hanson, R. W. and L. Reshef (1997). "Regulation of phosphoenolpyruvate
carboxykinase (GTP) gene expression." Annu Rev Biochem 66: 581-611.
Hardie, D. G. (2004). "The AMP-activated protein kinase pathway--new players
upstream and downstream." J Cell Sci 117(Pt 23): 5479-87.
Hardie, D. G., J. W. Scott, et al. (2003). "Management of cellular energy by the AMP-
activated protein kinase system." FEBS Lett 546(1): 113-20.
Hashimoto, T., W. S. Cook, et al. (2000). "Defect in peroxisome proliferator-activated
receptor alpha-inducible fatty acid oxidation determines the severity of hepatic
steatosis in response to fasting." J Biol Chem 275(37): 28918-28.
He, L., A. Sabet, et al. (2009). "Metformin and insulin suppress hepatic
gluconeogenesis through phosphorylation of CREB binding protein." Cell
137(4): 635-46.
Herzig, S., F. Long, et al. (2001). "CREB regulates hepatic gluconeogenesis through
the coactivator PGC-1." Nature 413(6852): 179-83.
Hirosumi, J., G. Tuncman, et al. (2002). "A central role for JNK in obesity and insulin
resistance." Nature 420(6913): 333-6.
Hosaka, T., W. H. Biggs, 3rd, et al. (2004). "Disruption of forkhead transcription factor
(FOXO) family members in mice reveals their functional diversification." Proc
Natl Acad Sci U S A 101(9): 2975-80.
Hou, M., N. Venier, et al. (2010). "Protective effect of metformin in CD1 mice placed

References
123
on a high carbohydrate-high fat diet." Biochem Biophys Res Commun 397(3):
537-42.
Housley, M. P., N. D. Udeshi, et al. (2009). "A PGC-1alpha-O-GlcNAc transferase
complex regulates FoxO transcription factor activity in response to glucose." J
Biol Chem 284(8): 5148-57.
Huang, H. and D. J. Tindall (2007). "Dynamic FoxO transcription factors." J Cell Sci
120(Pt 15): 2479-87.
Hundal, R. S., M. Krssak, et al. (2000). "Mechanism by which metformin reduces
glucose production in type 2 diabetes." Diabetes 49(12): 2063-9.
Hurst, R. T. and R. W. Lee (2003). "Increased incidence of coronary atherosclerosis
in type 2 diabetes mellitus: mechanisms and management." Ann Intern Med
139(10): 824-34.
Hwangbo, D. S., B. Gershman, et al. (2004). "Drosophila dFOXO controls lifespan
and regulates insulin signalling in brain and fat body." Nature 429(6991): 562-
6.
Ide, T., H. Shimano, et al. (2004). "SREBPs suppress IRS-2-mediated insulin
signalling in the liver." Nat Cell Biol 6(4): 351-7.
Imai, J., H. Katagiri, et al. (2008). "Regulation of pancreatic beta cell mass by
neuronal signals from the liver." Science 322(5905): 1250-4.
Ito, Y., N. Azrolan, et al. (1990). "Hypertriglyceridemia as a result of human apo CIII
gene expression in transgenic mice." Science 249(4970): 790-3.
Jiang, G. and B. B. Zhang (2003). "Glucagon and regulation of glucose metabolism."
Am J Physiol Endocrinol Metab 284(4): E671-8.
Jitrapakdee, S. (2012). "Transcription factors and coactivators controlling nutrient and
hormonal regulation of hepatic gluconeogenesis." Int J Biochem Cell Biol
44(1): 33-45.
Johnson, A. B., J. M. Webster, et al. (1993). "The impact of metformin therapy on
hepatic glucose production and skeletal muscle glycogen synthase activity in
overweight type II diabetic patients." Metabolism 42(9): 1217-22.
Kahn, B. B., T. Alquier, et al. (2005). "AMP-activated protein kinase: ancient energy
gauge provides clues to modern understanding of metabolism." Cell Metab
1(1): 15-25.
Kahn, S. E. (2003). "The relative contributions of insulin resistance and beta-cell

References
124
dysfunction to the pathophysiology of Type 2 diabetes." Diabetologia 46(1): 3-
19.
Kallwellis-Opara, A., X. Zaho, et al. (2003). "Characterization of cis-elements
mediating the stimulation of glucose-6-phosphate transporter promoter activity
by glucocorticoids." Gene 320: 59-66.
Kamagate, A., S. Qu, et al. (2008). "FoxO1 mediates insulin-dependent regulation of
hepatic VLDL production in mice." J Clin Invest 118(6): 2347-64.
Kashyap, S., R. Belfort, et al. (2003). "A sustained increase in plasma free fatty acids
impairs insulin secretion in nondiabetic subjects genetically predisposed to
develop type 2 diabetes." Diabetes 52(10): 2461-74.
Kenyon, C. J. (2010). "The genetics of ageing." Nature 464(7288): 504-12.
Kim, D. H., G. Perdomo, et al. (2011). "FoxO6 integrates insulin signaling with
gluconeogenesis in the liver." Diabetes 60(11): 2763-74.
Kim, D. H., T. Zhang, et al. (2013). "FoxO6 in glucose metabolism (FoxO6)." J
Diabetes 5(3): 233-40.
Kim, D. H., T. Zhang, et al. (2011). "Targeting FoxO1 for hypertriglyceridemia." Curr
Drug Targets 12(9): 1245-55.
Kim, J. Y., H. J. Kim, et al. (2004). "Orphan nuclear receptor small heterodimer
partner represses hepatocyte nuclear factor 3/Foxa transactivation via
inhibition of its DNA binding." Mol Endocrinol 18(12): 2880-94.
Kim, Y. D., K. G. Park, et al. (2008). "Metformin inhibits hepatic gluconeogenesis
through AMP-activated protein kinase-dependent regulation of the orphan
nuclear receptor SHP." Diabetes 57(2): 306-14.
Kitamura, T. (2013). "The role of FOXO1 in beta-cell failure and type 2 diabetes
mellitus." Nat Rev Endocrinol 9(10): 615-23.
Kitamura, T., J. Nakae, et al. (2002). "The forkhead transcription factor Foxo1 links
insulin signaling to Pdx1 regulation of pancreatic beta cell growth." J Clin
Invest 110(12): 1839-47.
Klip, A. and L. A. Leiter (1990). "Cellular mechanism of action of metformin."
Diabetes Care 13(6): 696-704.
Kluth, O., F. Mirhashemi, et al. (2011). "Dissociation of lipotoxicity and glucotoxicity in
a mouse model of obesity associated diabetes: role of forkhead box O1
(FOXO1) in glucose-induced beta cell failure." Diabetologia 54(3): 605-16.

References
125
Koo, S. H., L. Flechner, et al. (2005). "The CREB coactivator TORC2 is a key
regulator of fasting glucose metabolism." Nature 437(7062): 1109-11.
Ku, N. O., D. M. Toivola, et al. (2004). "Studying simple epithelial keratins in cells and
tissues." Methods Cell Biol 78: 489-517.
Kulkarni, R. N., U. S. Jhala, et al. (2004). "PDX-1 haploinsufficiency limits the
compensatory islet hyperplasia that occurs in response to insulin resistance."
J Clin Invest 114(6): 828-36.
Kwon, H. and J. E. Pessin (2013). "Adipokines mediate inflammation and insulin
resistance." Front Endocrinol (Lausanne) 4: 71.
Kwon, H. S., B. Huang, et al. (2004). "Protein kinase B-alpha inhibits human pyruvate
dehydrogenase kinase-4 gene induction by dexamethasone through
inactivation of FOXO transcription factors." Diabetes 53(4): 899-910.
Lavon, I., I. Goldberg, et al. (2000). "High susceptibility to bacterial infection, but no
liver dysfunction, in mice compromised for hepatocyte NF-kappaB activation."
Nat Med 6(5): 573-7.
Lee, C. S., N. J. Sund, et al. (2002). "Foxa2 controls Pdx1 gene expression in
pancreatic beta-cells in vivo." Diabetes 51(8): 2546-51.
Lee, J. M., W. Y. Seo, et al. (2010). "AMPK-dependent repression of hepatic
gluconeogenesis via disruption of CREB.CRTC2 complex by orphan nuclear
receptor small heterodimer partner." J Biol Chem 285(42): 32182-91.
Lee, Y. K. and D. D. Moore (2002). "Dual mechanisms for repression of the
monomeric orphan receptor liver receptor homologous protein-1 by the orphan
small heterodimer partner." J Biol Chem 277(4): 2463-7.
Leone, T. C., C. J. Weinheimer, et al. (1999). "A critical role for the peroxisome
proliferator-activated receptor alpha (PPARalpha) in the cellular fasting
response: the PPARalpha-null mouse as a model of fatty acid oxidation
disorders." Proc Natl Acad Sci U S A 96(13): 7473-8.
Li, X., B. Monks, et al. (2007). "Akt/PKB regulates hepatic metabolism by directly
inhibiting PGC-1alpha transcription coactivator." Nature 447(7147): 1012-6.
Li, Y., S. Xu, et al. (2011). "AMPK phosphorylates and inhibits SREBP activity to
attenuate hepatic steatosis and atherosclerosis in diet-induced insulin-
resistant mice." Cell Metab 13(4): 376-88.
Lin, H. V. and D. Accili (2012). "Hormonal regulation of hepatic glucose production in
health and disease." Cell Metab 14(1): 9-19.

References
126
Lin, H. Z., S. Q. Yang, et al. (2000). "Metformin reverses fatty liver disease in obese,
leptin-deficient mice." Nat Med 6(9): 998-1003.
Liu, Y. F., K. Paz, et al. (2001). "Insulin stimulates PKCzeta -mediated
phosphorylation of insulin receptor substrate-1 (IRS-1). A self-attenuated
mechanism to negatively regulate the function of IRS proteins." J Biol Chem
276(17): 14459-65.
Lu, M., M. Wan, et al. (2012). "Insulin regulates liver metabolism in vivo in the
absence of hepatic Akt and Foxo1." Nat Med 18(3): 388-95.
Lu, T. T., M. Makishima, et al. (2000). "Molecular basis for feedback regulation of bile
acid synthesis by nuclear receptors." Mol Cell 6(3): 507-15.
Lyssenko, V., R. Lupi, et al. (2007). "Mechanisms by which common variants in the
TCF7L2 gene increase risk of type 2 diabetes." J Clin Invest 117(8): 2155-63.
MacDonald, P. E., W. El-Kholy, et al. (2002). "The multiple actions of GLP-1 on the
process of glucose-stimulated insulin secretion." Diabetes 51 Suppl 3: S434-
42.
Marchesini, G., M. Brizi, et al. (2001). "Metformin in non-alcoholic steatohepatitis."
Lancet 358(9285): 893-4.
Martin-Montalvo, A., E. M. Mercken, et al. (2013). "Metformin improves healthspan
and lifespan in mice." Nat Commun 4: 2192.
Matsumoto, M., S. Han, et al. (2006). "Dual role of transcription factor FoxO1 in
controlling hepatic insulin sensitivity and lipid metabolism." J Clin Invest
116(9): 2464-72.
Matsumoto, M., A. Pocai, et al. (2007). "Impaired regulation of hepatic glucose
production in mice lacking the forkhead transcription factor Foxo1 in liver." Cell
Metab 6(3): 208-16.
Mayr, B. and M. Montminy (2001). "Transcriptional regulation by the phosphorylation-
dependent factor CREB." Nat Rev Mol Cell Biol 2(8): 599-609.
McCarthy, M. I. (2010). "Genomics, type 2 diabetes, and obesity." N Engl J Med
363(24): 2339-50.
McCarthy, M. I., P. Rorsman, et al. (2013). "TCF7L2 and diabetes: a tale of two
tissues, and of two species." Cell Metab 17(2): 157-9.
Meier, J. J., A. E. Butler, et al. (2008). "Beta-cell replication is the primary mechanism
subserving the postnatal expansion of beta-cell mass in humans." Diabetes
57(6): 1584-94.

References
127
Menge, B. A., A. Tannapfel, et al. (2008). "Partial pancreatectomy in adult humans
does not provoke beta-cell regeneration." Diabetes 57(1): 142-9.
Michael, M. D., R. N. Kulkarni, et al. (2000). "Loss of insulin signaling in hepatocytes
leads to severe insulin resistance and progressive hepatic dysfunction." Mol
Cell 6(1): 87-97.
Miller, R. A. and M. J. Birnbaum (2010). "An energetic tale of AMPK-independent
effects of metformin." J Clin Invest 120(7): 2267-70.
Miller, R. A., Q. Chu, et al. (2013). "Biguanides suppress hepatic glucagon signalling
by decreasing production of cyclic AMP." Nature 494(7436): 256-60.
Miller, S. P., G. R. Anand, et al. (1999). "Characterization of glucokinase mutations
associated with maturity-onset diabetes of the young type 2 (MODY-2):
different glucokinase defects lead to a common phenotype." Diabetes 48(8):
1645-51.
Mithieux, G., L. Guignot, et al. (2002). "Intrahepatic mechanisms underlying the effect
of metformin in decreasing basal glucose production in rats fed a high-fat diet."
Diabetes 51(1): 139-43.
Morris, A. P., B. F. Voight, et al. (2012). "Large-scale association analysis provides
insights into the genetic architecture and pathophysiology of type 2 diabetes."
Nat Genet 44(9): 981-90.
Myatt, S. S. and E. W. Lam (2007). "The emerging roles of forkhead box (Fox)
proteins in cancer." Nat Rev Cancer 7(11): 847-59.
Nadal, A., P. F. Marrero, et al. (2002). "Down-regulation of the mitochondrial 3-
hydroxy-3-methylglutaryl-CoA synthase gene by insulin: the role of the
forkhead transcription factor FKHRL1." Biochem J 366(Pt 1): 289-97.
Naimi, M., N. Gautier, et al. (2007). "Nuclear forkhead box O1 controls and integrates
key signaling pathways in hepatocytes." Endocrinology 148(5): 2424-34.
Nair, S., A. M. Diehl, et al. (2004). "Metformin in the treatment of non-alcoholic
steatohepatitis: a pilot open label trial." Aliment Pharmacol Ther 20(1): 23-8.
Nakae, J., W. H. Biggs, 3rd, et al. (2002). "Regulation of insulin action and pancreatic
beta-cell function by mutated alleles of the gene encoding forkhead
transcription factor Foxo1." Nat Genet 32(2): 245-53.
Nakae, J., T. Kitamura, et al. (2003). "The forkhead transcription factor Foxo1
regulates adipocyte differentiation." Dev Cell 4(1): 119-29.

References
128
Nakae, J., T. Kitamura, et al. (2001). "The forkhead transcription factor Foxo1 (Fkhr)
confers insulin sensitivity onto glucose-6-phosphatase expression." J Clin
Invest 108(9): 1359-67.
Nakae, J., M. Oki, et al. (2008). "The FoxO transcription factors and metabolic
regulation." FEBS Lett 582(1): 54-67.
Nakashima, N., P. M. Sharma, et al. (2000). "The tumor suppressor PTEN negatively
regulates insulin signaling in 3T3-L1 adipocytes." J Biol Chem 275(17): 12889-
95.
Natali, A. and E. Ferrannini (2006). "Effects of metformin and thiazolidinediones on
suppression of hepatic glucose production and stimulation of glucose uptake
in type 2 diabetes: a systematic review." Diabetologia 49(3): 434-41.
Nathan, D. M., J. B. Buse, et al. (2009). "Medical management of hyperglycemia in
type 2 diabetes: a consensus algorithm for the initiation and adjustment of
therapy: a consensus statement of the American Diabetes Association and the
European Association for the Study of Diabetes." Diabetes Care 32(1): 193-
203.
Nedumaran, B., S. Hong, et al. (2009). "DAX-1 acts as a novel corepressor of orphan
nuclear receptor HNF4alpha and negatively regulates gluconeogenic enzyme
gene expression." J Biol Chem 284(40): 27511-23.
Nemoto, S., M. M. Fergusson, et al. (2005). "SIRT1 functionally interacts with the
metabolic regulator and transcriptional coactivator PGC-1{alpha}." J Biol
Chem 280(16): 16456-60.
Nielsen, J. H., E. D. Galsgaard, et al. (2001). "Regulation of beta-cell mass by
hormones and growth factors." Diabetes 50 Suppl 1: S25-9.
Nir, T., D. A. Melton, et al. (2007). "Recovery from diabetes in mice by beta cell
regeneration." J Clin Invest 117(9): 2553-61.
Nolan, C. J., P. Damm, et al. (2011). "Type 2 diabetes across generations: from
pathophysiology to prevention and management." Lancet 378(9786): 169-81.
O'Brien, R. M. and D. K. Granner (1996). "Regulation of gene expression by insulin."
Physiol Rev 76(4): 1109-61.
O'Brien, R. M., R. S. Streeper, et al. (2001). "Insulin-regulated gene expression."
Biochem Soc Trans 29(Pt 4): 552-8.
Owen, M. R., E. Doran, et al. (2000). "Evidence that metformin exerts its anti-diabetic

References
129
effects through inhibition of complex 1 of the mitochondrial respiratory chain."
Biochem J 348 Pt 3: 607-14.
Paik, J. H., R. Kollipara, et al. (2007). "FoxOs are lineage-restricted redundant tumor
suppressors and regulate endothelial cell homeostasis." Cell 128(2): 309-23.
Pajvani, U. B., C. J. Shawber, et al. (2011). "Inhibition of Notch signaling ameliorates
insulin resistance in a FoxO1-dependent manner." Nat Med 17(8): 961-7.
Paris, M., C. Bernard-Kargar, et al. (2003). "Specific and combined effects of insulin
and glucose on functional pancreatic beta-cell mass in vivo in adult rats."
Endocrinology 144(6): 2717-27.
Parry, P., Y. Wei, et al. (1994). "Cloning and characterization of the t(X;11)
breakpoint from a leukemic cell line identify a new member of the forkhead
gene family." Genes Chromosomes Cancer 11(2): 79-84.
Parsons, J. A., T. C. Brelje, et al. (1992). "Adaptation of islets of Langerhans to
pregnancy: increased islet cell proliferation and insulin secretion correlates
with the onset of placental lactogen secretion." Endocrinology 130(3): 1459-
66.
Pawlikowska, L., D. Hu, et al. (2009). "Association of common genetic variation in the
insulin/IGF1 signaling pathway with human longevity." Aging Cell 8(4): 460-72.
Perseghin, G., K. Petersen, et al. (2003). "Cellular mechanism of insulin resistance:
potential links with inflammation." Int J Obes Relat Metab Disord 27 Suppl 3:
S6-11.
Pick, A., J. Clark, et al. (1998). "Role of apoptosis in failure of beta-cell mass
compensation for insulin resistance and beta-cell defects in the male Zucker
diabetic fatty rat." Diabetes 47(3): 358-64.
Pilkis, S. J. and D. K. Granner (1992). "Molecular physiology of the regulation of
hepatic gluconeogenesis and glycolysis." Annu Rev Physiol 54: 885-909.
Puigserver, P., J. Rhee, et al. (2003). "Insulin-regulated hepatic gluconeogenesis
through FOXO1-PGC-1alpha interaction." Nature 423(6939): 550-5.
Qu, S., J. Altomonte, et al. (2006). "Aberrant Forkhead box O1 function is associated
with impaired hepatic metabolism." Endocrinology 147(12): 5641-52.
Radziuk, J., Z. Zhang, et al. (1997). "Effects of metformin on lactate uptake and
gluconeogenesis in the perfused rat liver." Diabetes 46(9): 1406-13.
Raso, G. M., E. Esposito, et al. (2009). "Comparative therapeutic effects of metformin

References
130
and vitamin E in a model of non-alcoholic steatohepatitis in the young rat." Eur
J Pharmacol 604(1-3): 125-31.
Rieck, S., P. White, et al. (2009). "The transcriptional response of the islet to
pregnancy in mice." Mol Endocrinol 23(10): 1702-12.
Rizza, R. A. (2010). "Pathogenesis of fasting and postprandial hyperglycemia in type
2 diabetes: implications for therapy." Diabetes 59(11): 2697-707.
Rodgers, J. T. and P. Puigserver (2007). "Fasting-dependent glucose and lipid
metabolic response through hepatic sirtuin 1." Proc Natl Acad Sci U S A
104(31): 12861-6.
Rossetti, L., R. A. DeFronzo, et al. (1990). "Effect of metformin treatment on insulin
action in diabetic rats: in vivo and in vitro correlations." Metabolism 39(4): 425-
35.
Roth, U., K. Curth, et al. (2004). "The transcription factors HIF-1 and HNF-4 and the
coactivator p300 are involved in insulin-regulated glucokinase gene
expression via the phosphatidylinositol 3-kinase/protein kinase B pathway." J
Biol Chem 279(4): 2623-31.
Rowan, J. A., W. M. Hague, et al. (2008). "Metformin versus insulin for the treatment
of gestational diabetes." N Engl J Med 358(19): 2003-15.
Rui, L., M. Yuan, et al. (2002). "SOCS-1 and SOCS-3 block insulin signaling by
ubiquitin-mediated degradation of IRS1 and IRS2." J Biol Chem 277(44):
42394-8.
Sachdeva, M. M. and D. A. Stoffers (2009). "Minireview: Meeting the demand for
insulin: molecular mechanisms of adaptive postnatal beta-cell mass
expansion." Mol Endocrinol 23(6): 747-58.
Saltiel, A. R. and C. R. Kahn (2001). "Insulin signalling and the regulation of glucose
and lipid metabolism." Nature 414(6865): 799-806.
Samuel, V. T., C. S. Choi, et al. (2006). "Targeting foxo1 in mice using antisense
oligonucleotide improves hepatic and peripheral insulin action." Diabetes
55(7): 2042-50.
Samuel, V. T. and G. I. Shulman (2012). "Mechanisms for insulin resistance:
common threads and missing links." Cell 148(5): 852-71.
Sanchez-Munoz, V., R. Salas-Romero, et al. (2013). "[Decrease of liver fat content
by aerobic exercise or metformin therapy in overweight or obese women]."
Rev Invest Clin 65(4): 307-17.

References
131
Schilling, M. M., J. K. Oeser, et al. (2006). "Gluconeogenesis: re-evaluating the
FOXO1-PGC-1alpha connection." Nature 443(7111): E10-1.
Schips, T. G., A. Wietelmann, et al. (2011
). "FoxO3 induces reversible cardiac atrophy and autophagy in a transgenic mouse
model." Cardiovasc Res 91(4): 587-97.
Schmidt-Strassburger, U., T. G. Schips, et al. (2011). "Expression of constitutively
active FoxO3 in murine forebrain leads to a loss of neural progenitors."
FASEB J 26(12): 4990-5001.
Schmoll, D., K. S. Walker, et al. (2000). "Regulation of glucose-6-phosphatase gene
expression by protein kinase Balpha and the forkhead transcription factor
FKHR. Evidence for insulin response unit-dependent and -independent effects
of insulin on promoter activity." J Biol Chem 275(46): 36324-33.
Schoneveld, O. J., I. C. Gaemers, et al. (2004). "Mechanisms of glucocorticoid
signalling." Biochim Biophys Acta 1680(2): 114-28.
Sedding, D. G. (2008). "FoxO transcription factors in oxidative stress response and
ageing--a new fork on the way to longevity?" Biol Chem 389(3): 279-83.
Shachter, N. S. (2001). "Apolipoproteins C-I and C-III as important modulators of
lipoprotein metabolism." Curr Opin Lipidol 12(3): 297-304.
Shaw, R. J., K. A. Lamia, et al. (2005). "The kinase LKB1 mediates glucose
homeostasis in liver and therapeutic effects of metformin." Science 310(5754):
1642-6.
Shibata, M., K. Yoshimura, et al. (2009). "The MAP1-LC3 conjugation system is
involved in lipid droplet formation." Biochem Biophys Res Commun 382(2):
419-23.
Shimomura, I., M. Matsuda, et al. (2000). "Decreased IRS-2 and increased SREBP-
1c lead to mixed insulin resistance and sensitivity in livers of lipodystrophic
and ob/ob mice." Mol Cell 6(1): 77-86.
Shu, Y., S. A. Sheardown, et al. (2007). "Effect of genetic variation in the organic
cation transporter 1 (OCT1) on metformin action." J Clin Invest 117(5): 1422-
31.
Singh, R., S. Kaushik, et al. (2009). "Autophagy regulates lipid metabolism." Nature
458(7242): 1131-5.
Sopasakis, V. R., P. Liu, et al. (2010). "Specific roles of the p110alpha isoform of

References
132
phosphatidylinsositol 3-kinase in hepatic insulin signaling and metabolic
regulation." Cell Metab 11(3): 220-30.
Srinivasan, K. and P. Ramarao (2007). "Animal models in type 2 diabetes research:
an overview." Indian J Med Res 125(3): 451-72.
Stefan, N., K. Kantartzis, et al. (2008). "Identification and characterization of
metabolically benign obesity in humans." Arch Intern Med 168(15): 1609-16.
Stephenne, X., M. Foretz, et al. (2011). "Metformin activates AMP-activated protein
kinase in primary human hepatocytes by decreasing cellular energy status."
Diabetologia 54(12): 3101-10.
Stumvoll, M., N. Nurjhan, et al. (1995). "Metabolic effects of metformin in non-insulin-
dependent diabetes mellitus." N Engl J Med 333(9): 550-4.
Sun, Z., R. A. Miller, et al. (2012). "Hepatic Hdac3 promotes gluconeogenesis by
repressing lipid synthesis and sequestration." Nat Med 18(6): 934-42.
Sunami, Y., F. Leithauser, et al. (2012). "Hepatic activation of IKK/NFkappaB
signaling induces liver fibrosis via macrophage-mediated chronic
inflammation." Hepatology 56(3): 1117-28.
Tahara, A., A. Matsuyama-Yokono, et al. (2011). "Effects of antidiabetic drugs in
high-fat diet and streptozotocin-nicotinamide-induced type 2 diabetic mice."
Eur J Pharmacol 655(1-3): 108-16.
Tahrani, A. A., C. J. Bailey, et al. (2011). "Management of type 2 diabetes: new and
future developments in treatment." Lancet 378(9786): 182-97.
Takashima, M., W. Ogawa, et al. (2010). "Role of KLF15 in regulation of hepatic
gluconeogenesis and metformin action." Diabetes 59(7): 1608-15.
Taneera, J., S. Lang, et al. (2012). "A systems genetics approach identifies genes
and pathways for type 2 diabetes in human islets." Cell Metab 16(1): 122-34.
Teshigawara, K., W. Ogawa, et al. (2005). "Role of Kruppel-like factor 15 in PEPCK
gene expression in the liver." Biochem Biophys Res Commun 327(3): 920-6.
Teta, M., M. M. Rankin, et al. (2007). "Growth and regeneration of adult beta cells
does not involve specialized progenitors." Dev Cell 12(5): 817-26.
Tikhanovich, I., J. Cox, et al. (2013). "Forkhead box class O transcription factors in
liver function and disease." J Gastroenterol Hepatol 28 Suppl 1: 125-31.
Tsuchida, A., T. Yamauchi, et al. (2004). "Insulin/Foxo1 pathway regulates
expression levels of adiponectin receptors and adiponectin sensitivity." J Biol
Chem 279(29): 30817-22.

References
133
Utter, M. F. and D. B. Keech (1960). "Formation of oxaloacetate from pyruvate and
carbon dioxide." J Biol Chem 235: PC17-8.
Vague, J. (1996). "The degree of masculine differentiation of obesities: a factor
determining predisposition to diabetes, atherosclerosis, gout, and uric
calculous disease. 1956." Obes Res 4(2): 204-12.
van der Horst, A. and B. M. Burgering (2007). "Stressing the role of FoxO proteins in
lifespan and disease." Nat Rev Mol Cell Biol 8(6): 440-50.
van der Vos, K. E. and P. J. Coffer (2011). "The extending network of FOXO
transcriptional target genes." Antioxid Redox Signal 14(4): 579-92.
Viollet, B., B. Guigas, et al. (2009). "AMP-activated protein kinase in the regulation of
hepatic energy metabolism: from physiology to therapeutic perspectives." Acta
Physiol (Oxf) 196(1): 81-98.
Viollet, B., B. Guigas, et al. (2012). "Cellular and molecular mechanisms of
metformin: an overview." Clin Sci (Lond) 122(6): 253-70.
Wajchenberg, B. L. (2000). "Subcutaneous and visceral adipose tissue: their relation
to the metabolic syndrome." Endocr Rev 21(6): 697-738.
Wei, D., R. Tao, et al. (2011). "Feedback regulation of hepatic gluconeogenesis
through modulation of SHP/Nr0b2 gene expression by Sirt1 and FoxO1." Am J
Physiol Endocrinol Metab 300(2): E312-20.
Wilcock, C. and C. J. Bailey (1994). "Accumulation of metformin by tissues of the
normal and diabetic mouse." Xenobiotica 24(1): 49-57.
Wilcox, G. (2005). "Insulin and insulin resistance." Clin Biochem Rev 26(2): 19-39.
Willcox, B. J., T. A. Donlon, et al. (2008). "FOXO3A genotype is strongly associated
with human longevity." Proc Natl Acad Sci U S A 105(37): 13987-92.
Xiong, X., R. Tao, et al. (2013). "Deletion of hepatic FoxO1/3/4 genes in mice
significantly impacts on glucose metabolism through downregulation of
gluconeogenesis and upregulation of glycolysis." PLoS One 8(8): e74340.
Yamagata, K., H. Daitoku, et al. (2004). "Bile acids regulate gluconeogenic gene
expression via small heterodimer partner-mediated repression of hepatocyte
nuclear factor 4 and Foxo1." J Biol Chem 279(22): 23158-65.
Yeagley, D., S. Guo, et al. (2001). "Gene- and activation-specific mechanisms for
insulin inhibition of basal and glucocorticoid-induced insulin-like growth factor
binding protein-1 and phosphoenolpyruvate carboxykinase transcription. Roles

References
134
of forkhead and insulin response sequences." J Biol Chem 276(36): 33705-10.
Yi, P., J. S. Park, et al. (2013). "Betatrophin: a hormone that controls pancreatic beta
cell proliferation." Cell 153(4): 747-58.
Yoon, J. C., P. Puigserver, et al. (2001). "Control of hepatic gluconeogenesis through
the transcriptional coactivator PGC-1." Nature 413(6852): 131-8.
Zhande, R., J. J. Mitchell, et al. (2002). "Molecular mechanism of insulin-induced
degradation of insulin receptor substrate 1." Mol Cell Biol 22(4): 1016-26.
Zhang, D. M., G. Y. Zhang, et al. (2006). "[Therapeutic effects of insulin-sensitizing
drugs on nonalcoholic fatty liver disease: experiment with rats]." Zhonghua Yi
Xue Za Zhi 86(18): 1279-83.
Zhang, F., X. Xu, et al. (2013). "Gene expression profile analysis of type 2 diabetic
mouse liver." PLoS One 8(3): e57766.
Zhang, K., L. Li, et al. (2012). "Hepatic suppression of Foxo1 and Foxo3 causes
hypoglycemia and hyperlipidemia in mice." Endocrinology 153(2): 631-46.
Zhang, W., S. Patil, et al. (2006). "FoxO1 regulates multiple metabolic pathways in
the liver: effects on gluconeogenic, glycolytic, and lipogenic gene expression."
J Biol Chem 281(15): 10105-17.
Zhou, G., R. Myers, et al. (2001). "Role of AMP-activated protein kinase in
mechanism of metformin action." J Clin Invest 108(8): 1167-74.
Zhou, Y., J. Lee, et al. (2011). "Regulation of glucose homeostasis through a XBP-1-
FoxO1 interaction." Nat Med 17(3): 356-65.


Declaration
154
DeclarationI hereby confirm that I have made the work independently and without using any
sources or aids other than those stated. In each individual case, I have clearly
identified the source of the passages that are taken word for word or paraphrased
from other works.
Ulm,
Sarah Gul

Acknowledgement
155
AcknowledgementI would like to thank Prof. Dr. Thomas Wirth for giving me the opportunity to work on
this project under his supervision, for his keen interest, and fruitful discussions on this
project and his great support even in personal matters.
I would like to express my gratitude to Dr. Yoshiaki Sunami for his supervision, skilful
guidance, practical help, for his informative discussions and speacial thanks for
preparing the manuscript and arranging further cooperations on this project.
I am also thankful to Dr. Pavel Strnad for his informative discussions and suggestions
on this project.
I would like to express my gratitude to Prof. Dr. Bernhard Böhm for his interest, nice
suggestions and informative discussions on this project.
I am thankful to Dr. Karl Lenhard Rudolph for his keen interest and useful
discussions on this project.
It’s a pleasure to thank Dr. Frank Leithaüser and other staff members of Pathology
department for analysing and processing the histology from the animals related to
this project.
I am also thankful to Dr. Karl-Heinz Holzmann for the help with gene expression
microarray experiments.
I am also thankful to Melanie Gerstlauer and Nina Ushmorov for the excellent
technical assistance.
I do appreciate Dr. Katja Fiedler for her kind help in various issues in the lab. I am
also very thankful to the former and present members of the Institute of Physiological
Chemistry for their help and special thanks to Hansgeorg Glöckler for his help in
computer issues.
I am thankful to my friends Ayesha Maqbool, Heba Hamed Salem, Gandhari Maity for
being cooperative and helpful in various issues.
My heartfelt gratitude is reserved for my beloved parents and my in-laws for allowing
me to complete this educational carrier and for their continuous support, great care
and encouragement through out my studies. Lastly, but perhaps most importantly I
am thankful to my caring and loving husband Dr. Muazzam Ali Khan Khattak for his
great support, his patience and his encouragement during this time. A very special
thanks to my little son Mohammad Zaween a nice companion during the last year of

Acknowledgement
156
my P. hD studies. I do appreciate all those who remembered me in their prayers.
Curriculum Vitae
157
Curriculum Vitae
Personal Information
Name: Sarah Gul
Date of Birth: 28-08-1982
Place of Birth: Peshawar-Pakistan
Nationality: Pakistani
Gender: Female
Address: Institute of Physiological Chemistry
Albert-Einstein-Allee 11
D-89081
Ulm, Germany
Telephone: +49 (0) 731 (500) 33834
+49 (0) 731 (500) 23263
Email: [email protected]
Qualification:08/2009 – to date PhD Student at Institute of Physiological Chemistry,
University of Ulm. Member of the International Graduate
School in Molecular Medicine Ulm, Germany.
Supervisor: Prof. Dr. Thomas Wirth
Thesis: “Functional analysis of hepatic FOXO3 signalling
in glucose and lipid metabolism ”
2004 – 2006 Master of Philosophy (M. Phil)
(Molecular biology/Biochemistry)
Quaid-e-Azam University (QAU)
Islamabad, Pakistan
Thesis: "Iron-Regulated Outer Membrane Protein Profiles
of Pasteurella multocida”. Research done under Vaccine
Quality control section in National Veterinary Laboratories

Curriculum Vitae
158
(NVL) National agricultural research centre (NARC)
Islamabad, Pakistan
2002 – 2004 Master of Science (M. Sc)
(Molecular biology/Biochemistry)
Quaid-e-Azam University (QAU)
Islamabad, Pakistan
2000 – 2002 Bachelor of Science (B. Sc)
Botany/Zoology /Chemistry
Punjab University, Pakistan
1998 – 2000 Higher Secondary School (HSSC) (F. Sc)
Biology/Physics/Chemistry
PAF Intermediate college, Rawalpindi, Pakistan
1996 – 1998 Matriculation (Secondary School)
Biology/Physics/Chemistry
PAF Intermediate college, Rawalpindi, Pakistan
Publications:
S Gul, KH Holzmann, F Leithäuser, H Maier, M Vogel, T Luedde, B Boehm, P
Strnad, Y Sunami, T Wirth. Metformin reverses FOXO3-induced hyperactivation of
hepatic gluconeogenesis and catabolic pathways (Submitted).
Y Sunami, F Leithäuser, S Gul, K Fiedler, N Güldiken, S Espenlaub, KH Holzmann,
N Hipp, A Sindrilaru, T Luedde, B Baumann, S Wissel, F Kreppel, M Schneider, KS
Kochanek, S Kochanek, P Strnad, and T Wirth. Hepatic activation of IKK/NFκB
signaling induces liver fibrosis via macrophage-mediated chronic inflammation.
Hepatology. 2012 Sep;56(3):1117-28. doi: 10.1002/hep.25711. Epub 2012 Jul 10.
Posters:
S Gul , KH Holzmann , F Leithäuser, H Maier , B Böhm, P Strnad, Y Sunami, T
Wirth. FOXO3 regulates hepatic glucose production.
Poster presented by Dr. Yoshiaki Sunami in Zeitschrift für Gastroenterologie meeting,

Curriculum Vitae
159
Hannover, Germany, January 2013
S Gul , KH Holzmann , F Leithäuser, H Maier , B Böhm, P Strnad, Y Sunami, T
Wirth. FOXO3 regulates hepatic glucose production.
Poster presented by Dr. Yoshiaki Sunami in Europeon association for the study of
liver diseases EASL, Amsterdam. The Netherlands, April 2013
S Gul, KH Holzmann, F Leithäuser, H Maier, M Vogel, T Luedde, B Böhm, P Strnad,
Y Sunami, T Wirth. Metformin reverses FOXO3-induced hyperactivation of hepatic
gluconeogenesis and catabolic pathways.
Poster presented by Dr. Yoshiaki Sunami in European association for the study of
diabetes in 49th EASD virtual meeting. Barcelona, Spain September 2013
S Gul , KH Holzmann , F Leithäuser, H Maier , B Böhm, P Strnad, Y Sunami, T
Wirth. Hepatic activation of FOXO3 induces initial hyperglycemia and subordinate
hypoglycemia and pancreatic β-cell proliferation.
Poster presented in Europeon association for the study of liver diseases EASL
Barcelona, Spain April 2012
S Gul , KH Holzmann , F Leithäuser, H Maier , B Böhm, P Strnad, Y Sunami, T
Wirth. Activation of FoxO3a in the liver induces hypoglycemia and metabolic
dysfunction.
Poster presented in American Association for the study of Liver diseases AASLD San
Francisco, California, USA November 2011
S Gul , F Leithäuser, H Maier , P Strnad, Y Sunami, T Wirth. Activation of FoxO3a in
the liver induces hypoglycemia and metabolic dysfunction.
Poster presented in DGVS spring conference Complications of liver diseases, Berlin,
Germany May 2011
S Gul , F Leithäuser, H Maier , P Strnad, Y Sunami, T Wirth. Characterization of
FOXO3a function in the liver.
Poster presented in Retreat, Signalling pathways in development and regeneration,
Günzberg, Germany June 2010

Curriculum Vitae
160
Meeting/Conferences:
04/2012: Europeon association for the study of liver diseases (EASL)
Barcelona, Spain
11/ 2011: American Association for the study of Liver diseases (AASLD)
Sanfrancisco, California, USA
05/2011: DGVS spring conference 2011 Complications of liver diseases
Berlin, Germany