Förster resonance energy transfer imaging in vivo with approximated radiative transfer equation
15
Förster Resonance Energy Transfer imaging in vivo with approximated Radiative Transfer Equation Vadim Y. Soloviev 1,* , James McGinty 2 , Daniel W. Stuckey 3 , Romain Laine 2 , Marzena Wylezinska-Arridge 3 , Dominic J. Wells 4 , Alessandro Sardini 3 , Joseph V. Hajnal 3 , Paul M.W. French 2 , and Simon R. Arridge 1 1 Departments of Computer Science, University College London, Gower Street, London WC1E 6BT, United Kingdom 2 Photonics Group, Department of Physics, Imperial College London, London SW7 2AZ, United Kingdom 3 MRC Clinical Science Centre, Imperial College Faculty of Medicine, Hammersmith Hospital Campus, Du Cane Road, London W12 0NN, United Kingdom 4 Department of Veterinary Basic Sciences, The Royal Veterinary College, London NW1 0TU, United Kingdom Abstract We describe a new light transport model that we have applied to 3-D image reconstruction of in vivo fluorescence lifetime tomography data applied to read out Förster Resonance Energy Transfer in mice. The model is an approximation to the Radiative Transfer Equation and combines light diffusion and rays optics. This approximation is well adopted to wide-field time-gated intensity based data acquisition. Reconstructed image data are presented and compared with results obtained by using the Telegraph Equation approximation. The new approach provides improved recovery of absorption and scattering parameters while returning similar values for the fluorescence parameters. 1. Introduction We have recently reported [1] the demonstration of tomographic fluorescence lifetime imaging (FLIM) in vivo to read out of Förster Resonance Energy Transfer (FRET) [2, 3] in live mice, combining diffuse optical tomography [4, 5] with fluorescence lifetime imaging (FLIM) [6-11]. By implementing wide-field time-gated image data acquisition of excitation radiation and fluorescence excited by ultrashort laser pulses in a tomographic imaging system [12-16] and applying an image reconstruction algorithm based on the Telegraph Equation (TE), we could recover the three dimensional spatial distribution of fluorescence quantum yield and lifetime throughout a specimen. In this work we continue our development of 3D FLIM tomography for reading out FRET of biomolecualr interactions in live mice by introducing a new technique for tomographic image reconstruction of weakly scattering samples that utilises a novel, computationally inexpensive, approximation to the Radiative Transfer Equation (RTE) that replaces the TE. The performance of these two light transport models are compared for experimental data acquired from fluorescence protiens © 2011 Optical Society of America * [email protected]. OCIS codes: 290.0290, 290.7050, 170.0170, 170.3010 Europe PMC Funders Group Author Manuscript Appl Opt. Author manuscript; available in PMC 2012 November 08. Published in final edited form as: Appl Opt. 2011 December 20; 50(36): 6583–6590. Europe PMC Funders Author Manuscripts Europe PMC Funders Author Manuscripts
Transcript of Förster resonance energy transfer imaging in vivo with approximated radiative transfer equation

Förster Resonance Energy Transfer imaging in vivo withapproximated Radiative Transfer Equation
Vadim Y. Soloviev1,*, James McGinty2, Daniel W. Stuckey3, Romain Laine2, MarzenaWylezinska-Arridge3, Dominic J. Wells4, Alessandro Sardini3, Joseph V. Hajnal3, Paul M.W.French2, and Simon R. Arridge1
1Departments of Computer Science, University College London, Gower Street, London WC1E6BT, United Kingdom2Photonics Group, Department of Physics, Imperial College London, London SW7 2AZ, UnitedKingdom3MRC Clinical Science Centre, Imperial College Faculty of Medicine, Hammersmith HospitalCampus, Du Cane Road, London W12 0NN, United Kingdom4Department of Veterinary Basic Sciences, The Royal Veterinary College, London NW1 0TU,United Kingdom
AbstractWe describe a new light transport model that we have applied to 3-D image reconstruction of invivo fluorescence lifetime tomography data applied to read out Förster Resonance EnergyTransfer in mice. The model is an approximation to the Radiative Transfer Equation and combineslight diffusion and rays optics. This approximation is well adopted to wide-field time-gatedintensity based data acquisition. Reconstructed image data are presented and compared withresults obtained by using the Telegraph Equation approximation. The new approach providesimproved recovery of absorption and scattering parameters while returning similar values for thefluorescence parameters.
1. IntroductionWe have recently reported [1] the demonstration of tomographic fluorescence lifetimeimaging (FLIM) in vivo to read out of Förster Resonance Energy Transfer (FRET) [2, 3] inlive mice, combining diffuse optical tomography [4, 5] with fluorescence lifetime imaging(FLIM) [6-11]. By implementing wide-field time-gated image data acquisition of excitationradiation and fluorescence excited by ultrashort laser pulses in a tomographic imagingsystem [12-16] and applying an image reconstruction algorithm based on the TelegraphEquation (TE), we could recover the three dimensional spatial distribution of fluorescencequantum yield and lifetime throughout a specimen. In this work we continue ourdevelopment of 3D FLIM tomography for reading out FRET of biomolecualr interactions inlive mice by introducing a new technique for tomographic image reconstruction of weaklyscattering samples that utilises a novel, computationally inexpensive, approximation to theRadiative Transfer Equation (RTE) that replaces the TE. The performance of these two lighttransport models are compared for experimental data acquired from fluorescence protiens
© 2011 Optical Society of America*[email protected].
OCIS codes: 290.0290, 290.7050, 170.0170, 170.3010
Europe PMC Funders GroupAuthor ManuscriptAppl Opt. Author manuscript; available in PMC 2012 November 08.
Published in final edited form as:Appl Opt. 2011 December 20; 50(36): 6583–6590.
Europe PM
C Funders A
uthor Manuscripts
Europe PM
C Funders A
uthor Manuscripts

expressed in mouse legs [1]. Briefly, the hind leg anterior tibialis muscle of live mice weretransfected by electroporation and in vivo time-resolved images of the donor (eGFP)fluorescence were acquired using a wide-field time-gated imaging system incorporating agated image intensifier. The mouse legs were transfected with either free donor expressed inthe presence of free acceptor (mCherry) or with a tandem FRET construct (eGFP-mCherry)in which the donor was directly linked to acceptor. While the use of the TE successfullydistinguished the FRET and non FRET samples, the reconstruction of the optical propertieswas less succesful.
The TE is a variant of the diffusion Approximation (DA), which is a statistical description ofphoton transport that does not consider the propagation of light according to geometricoptics since it assumes that all photons are scattered from their original ballistic trajectories.Unfortunately the DA is not a good approximation for small highly scattering objects whosesize is comparable to the photon’s mean free path length and, therefore from which photonshave a finite probability to leave without any scattering or absorption events. We believethat realistic light transport models for such small scattering objects should take account ofboth photon diffusion and rectilinear light propagation. These properties are described by theRTE [17] but the numerical solution of the RTE is highly challenging with prohibitivecomputational overheads for most applications. In this paper we suggest a new,compuationally inexpensive approximation to the RTE that combines elements of lightdiffusion and ray optics.
Including light propagation along rays into the light transport model is important forinterpretation of images taken by the CCD camera. Images are formed from the energy ofabsorbed photons by pixels of the CCD array within the camera’s exposure time. Photonsreach the CCD array propagating along rays leaving the surface of a scattering object. Thus,the intensity of light rays per pixel area and per exposure time gives the absorbed energy bya pixel of the CCD array. Absorbed energy is further transformed into an image. Therefore,the time-gating technique relies on intensity-based measurements. The DA, for instance,describes the energy density of radiation, which is proportional to the first moment of theintensity [18]. Previously, we utilized the method of Schwarzschild-Schuster [17] for animage’s transformation from intensity measurements to energy density measurements [19].However, this method has its limitations. A model describing the intensity of light ratherthan its moments has a much broader range of applicability.
The image reconstruction algorithm is derived by employing a variational framework in theFourier domain. It combines the backprojection algorithm, which is a well adoptedreconstruction technique in Computerized Tomography (CT), and diffusive inverse imaging.It is well suited for wide-field time-gated intensity based detection. Cartesian meshes areconstructed from shadowgrams taken of mouse legs with a voxel edge matching the CCDcamera’s pixel size.
The paper is organized as follows. Mathematical and computational details are described inthe next section, where the first subsection is devoted to the direct problem of light transport,while the second subsection describes the image reconstruction approach. Experimentaldetails and mesh construction procedure are outlined in Section 3. In the last section wecompare reconstruction results based on the suggested model with results obtained by usingthe TE.
Soloviev et al. Page 2
Appl Opt. Author manuscript; available in PMC 2012 November 08.
Europe PM
C Funders A
uthor Manuscripts
Europe PM
C Funders A
uthor Manuscripts
2. Methodology2.A. Direct problem
Light transport in scattering media is modelled by the RTE [17]. Although the RTE providesan almost complete and very general description of the light scattering phenomenon, from apractical point of view, it is too complex and numerically expensive. Computationaloverheads of numerical solution of the RTE are undesirable in the context of the inverseproblem. In this subsection we consider an inexpensive approximation to the RTE, which isapplicable to small highly scattered objects. Our method is based on the telegraph equationapproximation and takes into account the probability of the quantum exit of a photon fromthe medium in a given direction directly [20,21].
To avoid introduction of additional unknown parameters we assume an isotropic scatteringin the medium. This can be justified by introducing an effective scattering coefficient bymaking the scattering photon’s mean path longer. Then, the RTE in the Fourier domain (ω)can be written in the form of the first order partial differential equation:
(1)
In Eq. (1): I is the intensity of light, is the attenuation coefficient, which is given by, where μ is the transport coefficient, and c is the speed of light. The transport
coefficient is reciprocal to the mean path length of a photon in the medium and representsthe sum of the scattering coefficient, μs, and the absorption coefficient, μa. The vector s isthe unit vector in a given direction. In the source term, Eq. (1), u denotes the averageintensity
(2)
In order to treat Eq. (1) as a first order partial differential equation the average integratedintensity, u, must be supplied self-consistently with the RTE. In highly scattering media thisquantity is computed by solving the telegraph equation (TE) [18], which results from thefirst two moments of the RTE. That is, multiplication of Eq. (1) by 1 and by s andconsequent integration over whole solid angle leads to the Helmholtz equation, which is theFourier image of the TE:
(3)
where the Helmholtz differential operator is given by:
the diffusion coefficient κ is expressed in terms of the attenuation coefficient as:
(4)
In the source term u0 represents the average intensity of the direct excitation radiation I0(s),which satisfies the equation
(5)
Soloviev et al. Page 3
Appl Opt. Author manuscript; available in PMC 2012 November 08.
Europe PM
C Funders A
uthor Manuscripts
Europe PM
C Funders A
uthor Manuscripts

where q0 is the amplitude and r0 is the location of a laser source, which injects excitationphotons into the medium in the direction s0. Thus, the direct excitation radiation is given by:
(6)
which represents an attenuated laser’s ray entering the scattering domain.
Because the variation of the refractive index in the medium is neglected, the source location,r0, and the observation point, r, are connected by a line r = r0 +sl. Computationally it isbeneficial to compute the intensity of radiation leaving the scattering object by integratingfrom the observation point. Therefore, the general solution of the RTE (Eq. (1)) at theobservation point r is provided in the following form:
(7)
where lmax denotes the maximum distance of a ray’s path contributing to the intensity. Theexponent in Eq. (7) is proportional to the probability for a photon to exit the medium along swithout scattering and absorption events. This probability is integrated with the sourcedistribution along a ray’s path resulting in the observed intensity. In our experiments noballistic photons were observed and therefore terms containing I0 (r, s0) are neglected in Eq.(7).
Fluorescent light transport is analogous to excitation. Usually fluorescence is considered as are-emission of the excitation radiation, which was absorbed by a fluorophore. However, inaccordance with our approximation it can be viewed as the resonantly scattered excitationradiation. The resonant scattering by fluorescent particles is isotropic and accompanied byStokes shift. The transport of such scattered excitation radiation is governed by the equation:
(8)
where
(9)
In Eqs. (9) η denotes the quantum yield and τ is the lifetime, which characterize afluorophore’s response to the excitation radiation. The quantum yield is understood here as afraction of two energies: the energy of re-emitted fluorescent photons, hνfNf, over theenergy of absorbed excitation photons, hνeNe, where νf and νe are frequencies offluorescent and excitation electromagnetic radiations, respectively, Nf and Ne are numbersof re-emitted fluorescent and absorbed excitation photons, correspondingly, and h is thePlanck constant.
Next, we assume that fluorescent intensity propagating toward each pixel of the CCDcamera results from coherently influenced waves resonantly scattered by the fluorescentparticles in a voxel of the domain, which is larger than several central Fresnel zones [22,23].This assumption implies rectilinear propagation of the fluorescent light in accordance withHuygens’ Principle. Therefore, we have:
Soloviev et al. Page 4
Appl Opt. Author manuscript; available in PMC 2012 November 08.
Europe PM
C Funders A
uthor Manuscripts
Europe PM
C Funders A
uthor Manuscripts

(10)
Multiply scattered fluorescent intensity, I′, satisfies the equation:
(11)
where u′ is the fluorescence average intensity, which is defined analogously to Eq. (2) andsatisfies the Helmholtz equation:
(12)
Therefore, the fluorescence intensity in the direction s is approximated by:
(13)
In contrast to Eq. (7) the direct fluorescent radiation is included into the expression of theobserved fluorescence intensity providing the possibility to consider fluorescent targetslocated near the boundary.
2.B. Inverse problem: variational frameworkThe image reconstruction algorithm is based on minimization of an appropriate costfunctional [24]. The cost functional is constructed from i) the error norm (the objectivefunction), which is the L2-norm of difference between measured and computed intensities onthe surface of an scattering object, ii) the Lagrangian terms and iii) the regularization term.Minimization of the cost functional is performed in the Fourier domain due to its simplicityin contrast to the time domain minimization. Measured excitation and fluorescent intensitieswere transformed into the Fourier domain by applying the Fast Fourier Transform (FFT).The first variation of the cost functional results in a system of partial differential equations.The solution of this system is used for iterative reconstruction of optical and fluorescentparameters. Equations are solved on a Cartesian mesh by utilizing the Finite Volumenumerical scheme [25,26] and the ray tracing technique [27]. Although in our experimentalsetup relative positions of the laser source and the CCD camera are fixed, while the objectunder study is rotated, computationally we rotate source positions and the CCD camera inthe opposite direction. Then, the variational problem is formulated as a minimizationproblem of the following cost functional:
(14)
In Eq. (14) the error norm is given as:
(15)
where IE and IF are experimentally recorded excitation and fluorescent intensities,respectively. The functions ς(ω), χ(r) and ξ(s) are introduced for the sake of convenience.Thus, assuming collimated intensity measurements, we define:
Soloviev et al. Page 5
Appl Opt. Author manuscript; available in PMC 2012 November 08.
Europe PM
C Funders A
uthor Manuscripts
Europe PM
C Funders A
uthor Manuscripts

(16)
where sn represents the direction of light rays comming to the CCD array, and N is thenumber of source-camera positions. Similarly, the functions χ(r) and ς(ω) representsampling in space and frequency:
(17)
where M is the number of pixels of an image; L denotes the number of samples in theFourier domain (ω); the vector rm denotes the surface points visible by the CCD camera.
The factor ap is the pixel area and therefore gives the total visible area. The formof ε is chosen in order to simplify a variational procedure. Thus, the function χ(r) allowsone to replace a sum over surface points visible by the CCD camera with a volume integral.Analogously, the function ς(ω) replaces a sum over samples in the Fourier domain with anintegral.
Lagrangian terms are introduced as:
(18)
(19)
In Eqs. (18-19) denotes the inner product in L2; J and J′ are the adjoint excitation andfluorescent intensities, respectively; and ψ and ψ′ are adjoint excitation and fluorescentaverage intensities, correspondingly.
Then, we define a vector of four unknowns at every point of the scattering domain as:
(20)
and introduce the regularization term:
(21)
In Eq. (21) αj are Tikhonov’s regularization parameters, and , where k denotesthe iteration number starting from the initial guess k = 0.
The reconstruction algorithm results from equating the first variation to zero:
(22)
Variation of functions JE, JF, ψ, ψ′ recovers Eqs. (1,8,11,3,12).Variations of I and I′ resultin equations satisfied by adjoint intensities:
(23)
Soloviev et al. Page 6
Appl Opt. Author manuscript; available in PMC 2012 November 08.
Europe PM
C Funders A
uthor Manuscripts
Europe PM
C Funders A
uthor Manuscripts
(24)
Note that −sn = n, where n is the outward normal to the CCD array. Therefore, adjointintensities propagate from the camera. Between an object and the camera, free spacepropagation is assumed. Variations of u′ and u give:
(25)
(26)
where asterisk denotes complex conjugate quantities. Finally, variations of the vector ofparameters × lead to the following system:
(27)
where j = 1, 2, 3, 4, and
(28)
(29)
(30)
(31)
In numerical implementation of the scheme dimensionless variables are introduced as
, where are typical values of parameters, and are dimensionless variables ofthe order of O(1). Because holds, a few small terms in Eqs. (28-29) areneglected.
3. Experimental Details3.A. FRET construct preparation and image acquisition
This new approach to reconstruction of time-gated tomogrphic fluorescence imaging datawas applied to the experimental data acquired for reference [1]. Briefly, this data wasacquired by imaging two mice with right hind legs co-transfected by electroporation withplasmids for enhanced Green Fluorescence Protein (eGFP) and mCherry fluorescentproteins that were expressed separately and two mice with legs transfected with plasmidsencoding an (eGFP-mCHerry) FRET construct in which eGFP (donor) was coupled tomCherry (acceptor) by a short peptide flexible linker. This transfection by electroporationprimarily targets the tibialis anterior (TA) muscle but may include some of the surroundingmuscles in the anterior lateral quandrant of the leg. For imaging the anaesthetized mice werepositioned on a motorised rotation stage with the target leg held under tension approximately
Soloviev et al. Page 7
Appl Opt. Author manuscript; available in PMC 2012 November 08.
Europe PM
C Funders A
uthor Manuscripts
Europe PM
C Funders A
uthor Manuscripts

along the axis of rotation. The excitation beam was selected from an ultrafst supercontinuumsource to have a central wavelength of 480 nm and bandwidth 40 nm. This was was focusedonto the surface of the leg and adjusted laterally such that the excitation spot (diameter ~ 0.5mm) was approximately centered on the rotation axis. The excitation and fluorescenceradiation emerging from the leg was imaged onto a time-gated optical image intensifiersynchronised to the excitation source and read out by a CCD camera with intensifier’s gate-width set to 1 ns. The excitation and fluorescence radiation was sampled over a 10 ns rangeat 250 ps intervals and this acquisition procedure was repeated for each of 12 angularorientations of the mouse leg (~ 30° separation) and for two vertical illumination positions.For each image set, the different positions of the excitation spot were recorded to providethe source positions for subsequent tomographic image reconstruction. Following opticalacquisition the mouse was euthanized by terminal anesthetic overdose. The leg was thenembedded in 1% agarose (Sigma) and imaged separately using MRI. More information onthe acquisition of the experimental data can be found in ref. [1].
3.B. Mesh constructionComputational meshes of mice legs were constructed from their shadows (shadowgrams)taken by the same CCD camera, which was used for wide-field time-gating imageacquisition. Shadowgrams were acquired at 1° angular steps. They were treated as Radontransforms of completely opaque objects. Then, the filtered backprojection algorithm wasapplied providing stacks of 2D slices. These stacks were stored in 3D arrays and segmentedwith help of the Perona-Malik method [28]. Figure 1 show constructed meshes. The voxelsize of the resulting Cartesian meshes corresponds to a pixel size of the CCD camera. Thetotal number of computational voxels varies from 300,000 to 500,000 depending on leg size.Although the meshes are quite dense, solution of the Helmholtz equation with consequentray integration takes no more that a few minutes depending on the mesh size. For instance,solution of the Helmholtz equation takes about 75 seconds by using the Finite Volumenumerical discretization scheme and the Conjugate Gradient method and the Siddonalgorithm takes less that 3 seconds for mesh containing approximately 300,000 voxels on a2.16 GHz processor.
4. Results and DiscussionsReconstruction results of four legs are presented in Figure 2. First and third rows ((a)-(e) and(k)-(o)) show reconstruction of optical and fluorescent parameters of two control mouse legstransfected with unlinked eGFP and mCherry. Second and fourth rows ((f)-(j) and (p)-(t))present mouse legs transfected with FRET construct. The first column shows meshes of fourmouse legs. Meshes are cut at heights where slices are taken. At these heights the legs wereexpressing fluorophore and, therefore, slices contain highest contrast in the parameterreconstructions. The second column presents reconstruction of the absorption coefficient,μa, while the third column displays the scattering coefficient, μs, in mm−1. Reconstructedquantum yield, η, and lifetime, τ, are displayed in the fourth and fifth columns. The lifetimeis given in nanoseconds (ns). The maximum values of reconstructed lifetimes are 2.97 and2.54 for control mice legs, and 2.0 and 1.86 for legs transfected with FRET construct.Reference values obtained from cytocol preparations of lifetimes are approximately 2.61 nsfor unlinked eGFP and 2.13 ns for eGFP linked with mCherry [1]. Therefore,reconstructions demonstrate a consistent lifetime contrast for FRETing and non-FRETingcases. Reconstructed quantum yield, however, does not present such contrast. Reconstructedvalues of the yield vary within (0.6, 0.8) interval. Moreover, accuracy in lifetimereconstruction indicates that the error in reconstructed values can reach 15-20% or more.Inaccuracy of reconstruction of fluorescent parameters is mostly attributed to the ill-posed
Soloviev et al. Page 8
Appl Opt. Author manuscript; available in PMC 2012 November 08.
Europe PM
C Funders A
uthor Manuscripts
Europe PM
C Funders A
uthor Manuscripts

nature of the inverse problem and autofluorescence present in the visible part of the lightspectrum (480 nm).
Imaging in the visible part of the light spectrum presents other difficulties. The relativelyhigh absorption coefficient precludes imaging of larger parts of an animal body. Indeed,reconstruction maps of optical parameters indicate quite high absorption of about 0.1 mm−1
for tissue and higher values for bones. Furthermore, strong absorption results in lower signalto noise ratio. Nevertheless, localization of bones (tibia) are relatively accurate. Figure 3shows absorption and scattering coefficients merged with slices obtained by post mortemMagnetic Resonance Imaging (MRI) without changing position by embedding the mouse legin agar gel. Bone’s localization is slightly shifted only for the first mouse leg as a result ofinaccuracy of the mesh construction procedure.
4.A. The telegraph equation approximationIt is instructive to compare the results presented above against the TE-based reconstruction.Modifications made to the scheme in order to use it with the TE are simple ones. Thus, thelight transport is described by Eqs. (3,12) only. In the functional , Eq. (14), the term ,Eq. (18), is dropped and the error norm ε is replaced with:
where uE, u, uF and u′ are excitation and fluorescent average intensities on the surface oflight scattering objects. The functions uE and uF are computed from experimentallymeasured intensities IE and IF, respectively. For conversion of intensities to averageintensities the method of Schwarzschild-Schuster [17] was applied in a way described earlier[19]. In the reconstruction algorithm Eqs. (23-26) are replaced with two Helmholtzequations for adjoint average integrated intensities, ψ and ψ′, [19] and all terms containingI, I′, J and J′ are dropped in Eqs. (28-31).
Reconstruction of optical and fluorescent parameters of four mouse legs are shown in Figure4. The layout of the Figure is the same as in Figure 2. The last two columns, where the yieldand lifetime are shown, indicate that the TE model provides very similar reconstructions offluorescence parameters. On the other hand, reconstructions of optical parameters revealdifferences. First of all, only slices (g) and (h) indicate relatively correct location of a bone.On the other slices reconstructions of optical parameters are failed. Failure of recoveringoptical parameters is a direct consequence of i) low signal to noise ratio present in thevisible part of the light spectrum, ii) the ill-posed nature of the inverse problem, and iii)image mapping procedure. Thus, the conversion procedure according to the Schwarzschild-Schuster method implies optically homogeneous medium near the boundary in addition tothe assumption of smoothness of the boundary. Presence of an absorber and /or scatterernear the boundary results in inaccuracy of the image conversion procedure.
5. SummaryWe described a new technology for in vivo imaging of Förster Resonance Energy Transferin mice that employs optical tomography and FLIM. A novel light transport model wasintroduced and developed. Our model combines the Telegraph Equation approximation withrays optics. This approximation is well adopted to intensity based measurements of smallscattering objects, which is used in wide-field time gated data acquisition. Reconstructionresults were compared against results obtained by using the Telegraph Equationapproximation. Comparison indicates noticeable improvement in recovering of optical
Soloviev et al. Page 9
Appl Opt. Author manuscript; available in PMC 2012 November 08.
Europe PM
C Funders A
uthor Manuscripts
Europe PM
C Funders A
uthor Manuscripts
parameters in favor of the suggested approach, while reconstruction of fluorescentparameters show similar results.
AcknowledgmentsThis work was supported by the Wellcome Trust Technology Development grant 086114.
References1. McGinty J, Stuckey DW, Soloviev VY, Laine R, Wylezinska-Arridge M, Wells DJ, Arridge SR,
French PMW, Hajnal JV, Sardini A. In vivo fluorescence lifetime tomography of a FRET probeexpressed in mouse. Biomed. Opt. Express. 2011; 2:1907–1917. [PubMed: 21750768]
2. Lakowicz, JR. Principles of Fluorescence Spectroscopy. Plenum Press; New York: 1999.
3. Andrews DL, Bradshaw DS. Virtual photons, dipole fields and energy transfer: a quantumelectrodynamical approach. Eur. J. Phys. 2004; 25:845–858.
4. Arridge SR, Schotland J. Optical tomography: forward and inverse problems. Inverse Probl. 2009;25:123010, 59pp.
5. Ntziachristos V. Fluorescence molecular imaging. Annu. Rev. Biomed. Eng. 2006; 8:1–33.[PubMed: 16834550]
6. O’Leary MA, Boas DA, Li XD, Chance B, Yodh AG. Fluorescence lifetime imaging in turbidmedia. Opt. Lett. 1996; 21:158–160. [PubMed: 19865337]
7. Kumar ATN, Skoch J, Bacskai BJ, Boas DA, Dunn AK. Fluorescence-lifetime-based tomographyfor turbid media. Opt. Lett. 2005; 30:3347–3349. [PubMed: 16389827]
8. Kumar ATN, Raymond SB, Boverman G, Boas DA, Bacskai BJ. Time resolved fluorescencetomography of turbid media based on lifetime contrast. Opt. Express. 2006; 14:12255–12270. http://www.opticsexpress.org. [PubMed: 19529654]
9. Nothdurft RE, Patwardhan SV, Akers W, Ye Y, Achilefu S, Culver JP. In vivo fluorescence lifetimetomography. J. Biomed. Opt. 2009; 14:024004. [PubMed: 19405734]
10. Gaind V, Webb KJ, Kularatne S, Bouman CA. Towards in vivo imaging of intramolecularfluorescence resonance energy transfer parameters. J. Opt. Soc. Am. A. 2009; 26:1805–1813.
11. Gaind V, Kularatne S, Low PS, Webb KJ. Deep-tissue imaging of intramolecular fluorescenceresonance energy-transfer parameters. Opt. Lett. 2010; 35:1314–1316. [PubMed: 20436553]
12. Dunsby C, Lanigan PMP, McGinty J, Elson DS, Requejo-Isidro J, Munro I, Galletly N, McCann F,Treanor B, Onfelt B, Davis DM, Neil MAA, French PMW. An electronically tuneable ultrafastlaser source applied to fluorescence imaging and fluorescence lifetime imaging microscopy. J.Phys. D.: Appl. Phys. 2004; 37:3296–3303.
13. McGinty J, Requejo-Isidro J, Munro I, Talbot CB, Kellett PA, Hares JD, Dunsby C, Neil MAA,French PMW. Signal-to-noise characterization of time-gated intensifiers used for wide-field time-domain FLIM. J. Phys D.: Appl Phys. 2009; 42:135103–135112.
14. Soloviev VY, Tahir KB, McGinty J, Elson DS, Neil MAA, French PMW, Arridge SR.Fluorescence lifetime imaging by using time gated data acquisition. Appl. Opt. 2007; 46:7384–7391. [PubMed: 17952172]
15. Soloviev VY, McGinty J, Tahir KB, Neil MAA, Sardini A, Hajnal JV, Arridge SR, French PMW.Fluorescence lifetime tomography of live cells expressing enhanced green fluorescent proteinembedded in a scattering medium exhibiting background autofluorescence. Opt. Lett. 2007;32:2034–2036. [PubMed: 17632634]
16. McGinty J, Soloviev VY, Tahir KB, Laine R, Stuckey DW, Hajnal JV, Sardini A, French PMW,Arridge SR. Three-dimensional imaging of Förster resonance energy transfer in heterogeneousturbid media by tomographic fluorescent lifetime imaging. Opt. Lett. 2009; 34:2772–2774.[PubMed: 19756100]
17. Sobolev, VV. A Treatise on Radiative Transfer. D. Van Nostrand Company, Inc; Princeton: 1963.
18. Arridge SR. Optical tomography in medical imaging. Inverse Probl. 1999; 15:R41–R93.
Soloviev et al. Page 10
Appl Opt. Author manuscript; available in PMC 2012 November 08.
Europe PM
C Funders A
uthor Manuscripts
Europe PM
C Funders A
uthor Manuscripts

19. Soloviev VY, D’Andrea C, Mohan PS, Valentini G, Cubeddu R, Arridge SR. Fluorescence lifetimeoptical tomography with discontinuous Galerkin discretisation scheme. Biomed. Opt. Express.2010:998–1013. [PubMed: 21258525]
20. Soloviev VY, Arridge SR. Optical Tomography in weakly scattering media in the presence ofhighly scattering inclusions. Biomed. Opt. Express. 2011; 2:440–451. [PubMed: 21412450]
21. Soloviev VY, Arridge SR. Fluorescence Lifetime Optical Tomography in weakly scattering mediain the presence of highly scattering inclusions. J. Opt. Soc. Am. A. 2011; 28 to appear.
22. van de Hulst, HC. Light Scattering by Small Particles. Dover Publications, Inc.; New York: 1981.
23. Born, M.; Wolf, E. Principles of Optics. Pergamon Press; Oxford: 1968.
24. Nocedal, J.; Wright, SJ. Numerical Optimization. Springer-Verlag Inc.; New York: 1999.
25. Soloviev VY, Krasnosselskaia LV. Dynamically adaptive mesh refinement technique for imagereconstruction in optical tomography. Appl. Opt. 2006; 45:2828–2837. [PubMed: 16633437]
26. Soloviev VY. Mesh adaptation technique for Fourier-domain fluorescence lifetime imaging. Med.Phys. 2006; 33:4176–4183. [PubMed: 17153396]
27. Siddon RL. Fast calculation of the exact radiological path for a threedimensional CT array. Med.Phys. 1985; 12:252–255. [PubMed: 4000088]
28. Perona P, Malik J. Scale-Space and Edge Detection Using Anisotropic. IEEE. 1990; 12:629–639.
Soloviev et al. Page 11
Appl Opt. Author manuscript; available in PMC 2012 November 08.
Europe PM
C Funders A
uthor Manuscripts
Europe PM
C Funders A
uthor Manuscripts

Figure 1.Meshes of four mouse legs used in experiments. Legs (a) and (c) were transfected withunlinked eGFP and mCherry fluorophores (control mice). Legs (b) and (d) were transfectedwith FRET-construct, in which eGFP and mCherry are coupled by a flexible linker.
Soloviev et al. Page 12
Appl Opt. Author manuscript; available in PMC 2012 November 08.
Europe PM
C Funders A
uthor Manuscripts
Europe PM
C Funders A
uthor Manuscripts

Figure 2.Reconstruction results using the approximated radiative transfer model. The first columndisplay meshes of four legs with cuts at heights where slices are taken. The first and thirdrows show reconstruction of parameters of legs transfected with unlinked eGFP andmCherry. The second and third rows display parameters of legs transfected with FRETconstruct. The second and third columns show the absorption and scattering coefficients inmm−1. The fourth and fifth columns display the quantum yield and lifetime reconstructions.The lifetime is given in nanoseconds.
Soloviev et al. Page 13
Appl Opt. Author manuscript; available in PMC 2012 November 08.
Europe PM
C Funders A
uthor Manuscripts
Europe PM
C Funders A
uthor Manuscripts

Figure 3.Reconstructed absorption and scattering coefficients overlayed with MRI slices. The firstrow (a-d) shows absorption coefficients for four mouse legs. The second row (e-h) showsscattering coefficients. Red indicates peak values.
Soloviev et al. Page 14
Appl Opt. Author manuscript; available in PMC 2012 November 08.
Europe PM
C Funders A
uthor Manuscripts
Europe PM
C Funders A
uthor Manuscripts
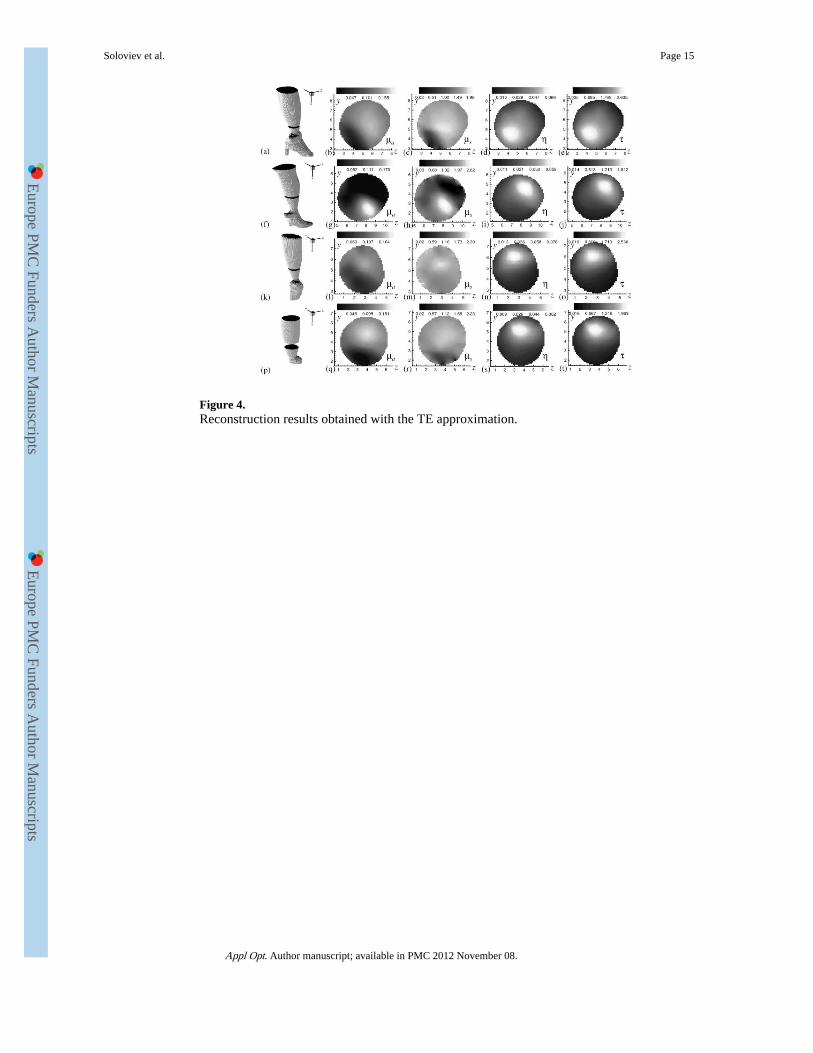
Figure 4.Reconstruction results obtained with the TE approximation.
Soloviev et al. Page 15
Appl Opt. Author manuscript; available in PMC 2012 November 08.
Europe PM
C Funders A
uthor Manuscripts
Europe PM
C Funders A
uthor Manuscripts