Comparison of full-sky polarization and radiance observations to radiative transfer simulations...
12
Comparison of full-sky polarization and radiance observations to radiative transfer simulations which employ AERONET products Nathan J. Pust, * Andrew R. Dahlberg, Michael J. Thomas, Joseph A. Shaw Department of Electrical and Computer Engineering, 610 Cobleigh Hall, Montana State University, Bozeman, Montana 59717, USA * [email protected] Abstract: Visible-band and near infrared polarization and radiance images measured with a ground-based full-sky polarimeter are compared against a successive orders of scattering (SOS) radiative transfer model for 2009 summer cloud-free days in Bozeman, Montana, USA. The polarimeter measures radiance and polarization in 10-nm bands centered at 450 nm, 490 nm, 530 nm, 630 nm, and 700 nm. AERONET products are used to represent aerosols in the SOS model, while MISR satellite BRF products are used for the surface reflectance. While model results generally agree well with observation, the simulated degree of polarization is typically higher than observed data. Potential sources of this difference may include cloud contamination and/or underestimation of the AERONET-retrieved aerosol real refractive index. Problems with the retrieved parameters are not unexpected given the low aerosol optical depth range (0.025 to 0.17 at 500 nm) during the study and the corresponding difficulties that these conditions pose to the AERONET inversion algorithm. © 2011 Optical Society of America OCIS codes: (110.5405) Polarimetric imaging; (010.1310) Atmospheric scattering; (010.5620) Radiative transfer; (010.1110) Aerosols. References and links 1. M. Chin, R. A. Kahn, and S. E. Schwartz, CCSP 2009: Atmospheric Aerosol Properties and Climate Impacts, A Report by the U.S. Climate Change Science (NASA, Washington, D.C., USA 2009). 2. B. N. Holben, T. F. Eck, I. Slutsker, D. Tanre, J. P. Buis, A. Setzer, E. Vermote, J. A. Reagan, Y. J. Kaufman, T. Nakajima, F. Lavenu, I. Jankowiak, and A. Smirnov, “AERONET—A Federated Instrument Network and Data Archive for Aerosol Characterization,” Remote Sens. Environ. 66(1), 1–16 (1998). 3. D. J. Diner, J. C. Beckert, T. H. Reilly, C. J. Bruegge, J. E. Conel, R. A. Kahn, J. V. Martonchik, T. P. Ackerman, R. Davies, S. A. W. Gerstl, H. R. Gordon, J. P. Muller, R. B. Myneni, P. J. Sellers, B. Pinty, and M. M. Verstraete, “Multi-angle Imaging SpectroRadiometer (MISR) instrument description and experiment overview,” IEEE Trans. Geosci. Rem. Sens. 36(4), 1072–1087 (1998). 4. L. A. Remer, Y. J. Kaufman, D. Tanré, S. Mattoo, D. A. Chu, J. V. Martins, R. R. Li, C. Ichoku, R. C. Levy, R. G. Kleidman, T. F. Eck, E. Vermote, and B. N. Holben, “The MODIS Aerosol Algorithm, Products, and Validation,” J. Atmos. Sci. 62(4), 947–973 (2005). 5. M. I. Mishchenko, B. Cairns, G. Kopp, C. F. Schueler, B. A. Fafaul, J. E. Hansen, R. J. Hooker, T. Itchkawich, H. B. Maring, and L. D. Travis, “Accurate monitoring of terrestrial aerosols and total solar irradiance: Introducing the Glory mission,” Bul. Amer. Met. Soc. 88(5), 677–691 (2007). 6. Z. Li, P. Goloub, O. Dubovik, L. Blarel, W. Zhang, T. Podvin, A. Sinyuk, M. Sorokin, H. Chen, B. Holben, D. Tanre, M. Canini, and J.-P. Buis, “Improvements for ground-based remote sensing of atmospheric aerosol properties by additional polarimetric measurements,” J. Quan. Spect. Rad. Trans. 110(17), 1954–1961 (2009). 7. J. L. Deuzé, F. M. Bréon, C. Devaux, P. Goloub, M. Herman, B. Lafrance, F. Maignan, A. Marchand, F. Nadal, G. Perry, and D. Tanré, “Remote sensing of aerosols over land surfaces from POLDER-ADEOS-1 polarized measurements,” J. Geophys. Lett. 106(D5), 4913–4926 (2001). 8. E. Boesche, P. Stammes, T. Ruhtz, R. Preusker, and J. Fischer, “Effect of aerosol microphysical properties on polarization of skylight: sensitivity study and measurements,” Appl. Opt. 45(34), 8790–8805 (2006). 9. N. J. Pust and J. A. Shaw, “Dual-field imaging polarimeter using liquid crystal variable retarders,” Appl. Opt. 45(22), 5470–5478 (2006). #149825 - $15.00 USD Received 24 Jun 2011; revised 1 Aug 2011; accepted 2 Aug 2011; published 8 Sep 2011 (C) 2011 OSA 12 September 2011 / Vol. 19, No. 19 / OPTICS EXPRESS 18602
-
Upload
independent -
Category
Documents
-
view
3 -
download
0
Transcript of Comparison of full-sky polarization and radiance observations to radiative transfer simulations...

Comparison of full-sky polarization and
radiance observations to radiative transfer
simulations which employ AERONET products
Nathan J. Pust,* Andrew R. Dahlberg, Michael J. Thomas, Joseph A. Shaw
Department of Electrical and Computer Engineering, 610 Cobleigh Hall,
Montana State University, Bozeman, Montana 59717, USA *[email protected]
Abstract: Visible-band and near infrared polarization and radiance images
measured with a ground-based full-sky polarimeter are compared against a
successive orders of scattering (SOS) radiative transfer model for 2009
summer cloud-free days in Bozeman, Montana, USA. The polarimeter
measures radiance and polarization in 10-nm bands centered at 450 nm, 490
nm, 530 nm, 630 nm, and 700 nm. AERONET products are used to
represent aerosols in the SOS model, while MISR satellite BRF products
are used for the surface reflectance. While model results generally agree
well with observation, the simulated degree of polarization is typically
higher than observed data. Potential sources of this difference may include
cloud contamination and/or underestimation of the AERONET-retrieved
aerosol real refractive index. Problems with the retrieved parameters are not
unexpected given the low aerosol optical depth range (0.025 to 0.17 at 500
nm) during the study and the corresponding difficulties that these conditions
pose to the AERONET inversion algorithm.
© 2011 Optical Society of America
OCIS codes: (110.5405) Polarimetric imaging; (010.1310) Atmospheric scattering; (010.5620)
Radiative transfer; (010.1110) Aerosols.
References and links
1. M. Chin, R. A. Kahn, and S. E. Schwartz, CCSP 2009: Atmospheric Aerosol Properties and Climate Impacts, A
Report by the U.S. Climate Change Science (NASA, Washington, D.C., USA 2009).
2. B. N. Holben, T. F. Eck, I. Slutsker, D. Tanre, J. P. Buis, A. Setzer, E. Vermote, J. A. Reagan, Y. J. Kaufman, T.
Nakajima, F. Lavenu, I. Jankowiak, and A. Smirnov, “AERONET—A Federated Instrument Network and Data
Archive for Aerosol Characterization,” Remote Sens. Environ. 66(1), 1–16 (1998).
3. D. J. Diner, J. C. Beckert, T. H. Reilly, C. J. Bruegge, J. E. Conel, R. A. Kahn, J. V. Martonchik, T. P.
Ackerman, R. Davies, S. A. W. Gerstl, H. R. Gordon, J. P. Muller, R. B. Myneni, P. J. Sellers, B. Pinty, and M.
M. Verstraete, “Multi-angle Imaging SpectroRadiometer (MISR) instrument description and experiment
overview,” IEEE Trans. Geosci. Rem. Sens. 36(4), 1072–1087 (1998).
4. L. A. Remer, Y. J. Kaufman, D. Tanré, S. Mattoo, D. A. Chu, J. V. Martins, R. R. Li, C. Ichoku, R. C. Levy, R.
G. Kleidman, T. F. Eck, E. Vermote, and B. N. Holben, “The MODIS Aerosol Algorithm, Products, and
Validation,” J. Atmos. Sci. 62(4), 947–973 (2005).
5. M. I. Mishchenko, B. Cairns, G. Kopp, C. F. Schueler, B. A. Fafaul, J. E. Hansen, R. J. Hooker, T. Itchkawich,
H. B. Maring, and L. D. Travis, “Accurate monitoring of terrestrial aerosols and total solar irradiance:
Introducing the Glory mission,” Bul. Amer. Met. Soc. 88(5), 677–691 (2007).
6. Z. Li, P. Goloub, O. Dubovik, L. Blarel, W. Zhang, T. Podvin, A. Sinyuk, M. Sorokin, H. Chen, B. Holben, D.
Tanre, M. Canini, and J.-P. Buis, “Improvements for ground-based remote sensing of atmospheric aerosol
properties by additional polarimetric measurements,” J. Quan. Spect. Rad. Trans. 110(17), 1954–1961 (2009).
7. J. L. Deuzé, F. M. Bréon, C. Devaux, P. Goloub, M. Herman, B. Lafrance, F. Maignan, A. Marchand, F. Nadal,
G. Perry, and D. Tanré, “Remote sensing of aerosols over land surfaces from POLDER-ADEOS-1 polarized
measurements,” J. Geophys. Lett. 106(D5), 4913–4926 (2001).
8. E. Boesche, P. Stammes, T. Ruhtz, R. Preusker, and J. Fischer, “Effect of aerosol microphysical properties on
polarization of skylight: sensitivity study and measurements,” Appl. Opt. 45(34), 8790–8805 (2006).
9. N. J. Pust and J. A. Shaw, “Dual-field imaging polarimeter using liquid crystal variable retarders,” Appl. Opt.
45(22), 5470–5478 (2006).
#149825 - $15.00 USD Received 24 Jun 2011; revised 1 Aug 2011; accepted 2 Aug 2011; published 8 Sep 2011(C) 2011 OSA 12 September 2011 / Vol. 19, No. 19 / OPTICS EXPRESS 18602
10. N. J. Pust and J. A. Shaw, “Digital all-sky polarization imaging of partly cloudy skies,” Appl. Opt. 47(34),
H190–H198 (2008).
11. N. J. Pust, “Full Sky Imaging Polarimetry for Initial Polarized MODTRAN Validation,” PhD Thesis, Montana
State University (2007).
12. N. J. Pust and J. A. Shaw, “Comparison of Skylight Polarization Measurements and MODTRAN-P
Calculations,” J. Appl. Remote Sens. 5(1), 053529 (2011).
13. J. Lenoble, M. Herman, J. L. Deuzé, B. Lafrance, R. Santer, and D. Tanré, “A successive order of scattering code
for solving the vector equation of transfer in the earth's atmosphere with aerosols,” J. Quant. Spect. Rad. Trans.
107(3), 479–507 (2007).
14. O. Dubovik and M. D. King, “A flexible inversion algorithm for retrieval of aerosol optical properties from Sun
and sky radiance measurements,” J. Geophys Lett. 105(D16), 20673–20696 (2000).
15. A. Sinyuk, O. Dubovik, B. Holben, T. F. Eck, F. M. Breon, J. Martonchik, R. Kahn, D. J. Diner, E. F. Vermote,
J. C. Roger, T. Lapyonok, and I. Slutsker, “Simultaneous retrieval of aerosol and surface properties from a
combination of AERONET and satellite data,” Remote Sens. Environ. 107(1-2), 90–108 (2007).
16. O. Dubovik, A. Sinyuk, T. Lapyonok, B. N. Holben, M. Mishchenko, P. Yang, T. F. Eck, H. Volten, O. Munoz,
B. Veihelmann, W. J. van der Zande, J. F. Leon, M. Sorokin, and I. Slutsker, “Application of spheroid models to
account for aerosol particle nonsphericity in sensing of desert dust,” J. Geophys. Lett. 111(D11), D11208 (2006).
17. Z. Li, P. Goloub, C. Devaux, X. Gu, J. L. Deuze, Y. Qiao, and F. Zhao, “Retrieval of aerosol optical and physical
properties from ground-based spectral, multi-angular, and polarized sun-photometer measurements,” Remote
Sens. Environ. 101(4), 519–533 (2006).
18. M. Van Weele, T. J. Martin, M. Blumthaler, C. Brogniez, P. N. den Outer, O. Engelsen, J. Lenoble, B. Mayer, G.
Pfister, A. Ruggaber, B. Walravens, P. Weihs, B. G. Gardiner, D. Gillotay, D. Haferl, A. Kylling, G. Seckmeyer,
and W. M. F. Wauben, “From model intercomparison toward benchmark UV spectra for six real atmospheric
cases,” J. Geophys. Lett. 105(D4), 4915–4925 (2000).
19. “AERONET Inversion Products,”
“http://aeronet.gsfc.nasa.gov/new_web/Documents/Inversion_products_V2.pdf”
http://aeronet.gsfc.nasa.gov/new_web/Documents/Inversion_products_V2.pdf.
20. A. Berk, G. P. Anderson, P. K. Acharya, L. S. Bernstein, L. Muratov, J. Lee, M. Fox, S. M. Adler-Golden, J. H.
Chetwynd, M. L. Hoke, R. B. Lockwood, J. A. Gardner, T. W. Cooley, C. C. Borel, P. E. Lewis, and E. P.
Shettle, “MODTRAN5: 2006 Update,” in Proceedings of the SPIE 6233, 508–515 (2006).
21. A. R. Dahlberg, N. J. Pust, and J. A. Shaw, “Effects of surface reflectance on skylight polarization
measurements,” Opt. Express 19(17), 16008-16021 (2011).
22. D. J. Diner, J. V. Martonchik, C. Borel, S. A. W. Gerstl, H. R. Gordon, Y. Knyazikhin, R. Myneni, B. Pinty, and
M. M. Verstraete, “MISR. Level 2 Surface Retrieval Algorithm Theoretical Basis,”
“http://eospso.gsfc.nasa.gov/eos_homepage/for_scientists/atbd/docs/MISR/ATB_L2Surface43.pdf”
http://eospso.gsfc.nasa.gov/eos_homepage/for_scientists/atbd/docs/MISR/ATB_L2Surface43.pdf.
23. H. Rahman, B. Pinty, and M. M. Verstraete, “Coupled surface-atmosphere reflectance (CSAR) model. 2:
Semiempirical surface model usable with NOAA advanced very high resolution radiometer data,” J. Geophys.
Lett. 98(D11), 20791–20801 (1993).
24. F. Nadal and F. M. Breon, “Parameterization of surface polarized reflectance derived from POLDER spaceborne
measurements,” IEEE Trans. Geosci. Rem. Sens. 37(3), 1709–1718 (1999).
25. E. Boesche, P. Stammes, R. Preusker, R. Bennartz, W. Knap, and J. Fischer, “Polarization of skylight in the
O(2)A band: effects of aerosol properties,” Appl. Opt. 47(19), 3467–3480 (2008).
26. J. Zeng, Q. Han, and J. Wang, “High-spectral resolution simulation of polarization of skylight: Sensitivity to
aerosol vertical profile,” Geo. Res. Lett. 35, L20801 (2008).
27. O. Dubovik, A. Smirnov, B. N. Holben, M. D. King, Y. J. Kaufman, T. F. Eck, and I. Slutsker, “Accuracy
assessments of aerosol optical properties retrieved from AERONET sun and sky-radiance measurements,” J.
Geophys. Lett. 105(D8), 9791–9806 (2000).
1. Introduction
Over the last decade, important progress has been made toward a better understanding of the
radiative effects of aerosols on climate [1]. To develop a more accurate aerosol climatology,
several surface-based [2] and satellite-based optical remote sensing platforms (e.g. [3] and
[4]) have been deployed. Despite these advances, it is increasingly apparent that more highly
constrained aerosol retrievals require the addition of polarization information to the current
radiance-only methods [5–8]. The performance improvement gained by including polarization
in retrievals owes to its higher sensitivity to select aerosol properties [8]. This sensitivity also
enables sky polarization measurements to be used to independently verify the accuracy of
retrieved aerosol parameters from radiance-only methods.
In the past few years, we have developed a full-sky polarimetric imager [9–12]. In this
study, we compare measurements of full-sky polarization against a polarized (vector)
#149825 - $15.00 USD Received 24 Jun 2011; revised 1 Aug 2011; accepted 2 Aug 2011; published 8 Sep 2011(C) 2011 OSA 12 September 2011 / Vol. 19, No. 19 / OPTICS EXPRESS 18603

successive order of scattering (SOS) radiative transfer model [13] which uses aerosol products
from the Aerosol Robotic Network (AERONET) [2]. Since AERONET does not currently
measure polarization (at most stations) and consequently does not use polarization in its
aerosol retrievals, the accuracy of AERONET aerosol parameters can be indirectly assessed
by comparing sky polarization observations with results from radiative transfer simulations
which employ AERONET products. If the retrieved aerosol parameters from AERONET
accurately represent the aerosols, the polarization simulated using these parameters is
expected to agree with the observed polarization. In this paper, we discuss comparisons
between a radiative transfer model which uses AERONET aerosol products and observations
from a full-sky polarimeter.
1.1 Visible and NIR full-sky polarization and radiance measurements
The observation data reported here is generated by a visible, near-infrared (VNIR) imaging
polarimeter that was developed for studying both sky polarization and ground-based object
polarization signatures [9–12]. The polarimeter is capable of switching between two fields of
view—a wide-angle fisheye for imaging the full sky (used exclusively here) and a narrow-
angle telephoto for imaging smaller objects. At the time of study, the instrument operated in
five 10-nm bands centered at 450 nm, 490 nm, 530 nm, 630 nm, and 700 nm. Two liquid
crystal variable retarders (LCVRs) are used to electronically vary the retardance seen by
incoming light so that a full Stokes image is measured in less than a few tenths of a second.
(Intensity images from the camera are inverted by a calibration matrix to form the 4-element
Stokes images.) Quick acquisition allows reliable measurements in partly cloudy skies
without polarization artifacts that would arise if the clouds were to move between frames.
This imager obtains polarized sky measurements with uncertainty less than (usually much less
than) ± 3% in the degree of linear polarization (DoLP).
All observations here are for seven cloud-free days in late August and September 2009 in
Bozeman, Montana, USA.
1.2 AERONET
The Aerosol Robotic Network (AERONET) of solar radiometers measures direct solar
irradiance and sky radiance across the globe [2]. These measurements are used to calculate
aerosol optical depth from direct solar irradiance measurements and to derive aerosol
properties, such as size distribution, refractive index, and single scatter albedo, from a sky
radiance inversion scheme [14]. We used aerosol products provided from our AERONET
instrument (which is co-located with the polarimeter) to represent aerosols in the radiative
transfer model.
1.3 Successive orders of scattering (SOS) radiative transfer model
The successive orders of scattering (SOS) radiative transfer model [13] used in this study has
been used extensively by previous investigators (e.g [15–17].) and has been compared
successfully to other models [18]. The derivative of the model that we acquired from
AERONET had been slightly modified for their purposes. We further modified the model to
allow direct incorporation of MISR land surface BRF products (see section 2.3).
#149825 - $15.00 USD Received 24 Jun 2011; revised 1 Aug 2011; accepted 2 Aug 2011; published 8 Sep 2011(C) 2011 OSA 12 September 2011 / Vol. 19, No. 19 / OPTICS EXPRESS 18604

Instrument Calculation Parameter
AERONET
Radiance Polarization
SOS Model
AERONET
Inversion
Size distribution
Refractive index
Radiance PolarizationRadiance
MSU Polarimeter
Mie Code
T-matrix Table
Scattering phase
matrix
Molecular
Optical Depth
MISR
Surface albedo
BRF
Sun zenith angle
Aerosol
Optical Depth
Aerosol
single scatter albedo
MODTRAN
Molecular
single scatter albedo
Fig. 1. Overview of the radiance and polarization comparison methodology.
2. Setting up the comparison
Figure 1 shows the methods used to make the comparisons discussed here: model vs.
polarimeter polarization, model vs. polarimeter radiance, and AERONET vs. polarimeter
radiance. The validity of the model results used in the comparisons depends heavily on the
accuracy of the model parameters. The parameters that most influence the modeled sky
radiance and polarization are the aerosol and molecular optical depths, the aerosol and
molecular single scatter albedos, the aerosol scattering phase matrix, and the surface
reflectance parameters. The methods for generating and including these variables into the
SOS model are discussed in the following sections.
2.1 Aerosol scattering and absorption
AERONET products provided all aerosol properties included in the SOS radiative transfer
model. Since polarimeter observation wavelengths and measurement times did not always
correspond directly to associated AERONET values, AERONET parameters were linearly
interpolated in wavelength and time to match the polarimeter. This interpolation was applied
to aerosol optical depths, size distributions, and complex refractive indices. (The model used
the “direct sun” aerosol optical depth measurements, as opposed to the retrieval-derived
aerosol optical depth.) Similarly, phase functions and single-scatter albedos (SSA) provided
by AERONET were not always available at the polarimeter wavelengths. Furthermore, the
full aerosol scattering phase matrix–as opposed to the phase function provided by
AERONET–was needed for the polarized radiative transfer model. At each polarimeter
wavelength, a Mie code and T-matrix kernel lookup table provided by AERONET [16] were
used to generate these parameters directly from the interpolated size distribution, sphericity,
and complex refractive index. For AERONET size distributions below 100% sphericity, the
parameters were handled in a consistent manner to AERONET. That is, the parameters were
calculated for a mixture of spherical particles and spheroid particles with a fixed shape (aspect
ratio) distribution–the same spheroid shape distribution used in the AERONET operational
algorithm [16,19].
The aerosols were assumed to have a vertical extinction distribution described by a
Gaussian centered on a 2 km height and were otherwise assumed to be homogenous
throughout the column. (Physically realizable modifications to this vertical distribution did
not appreciably affect the model results.)
#149825 - $15.00 USD Received 24 Jun 2011; revised 1 Aug 2011; accepted 2 Aug 2011; published 8 Sep 2011(C) 2011 OSA 12 September 2011 / Vol. 19, No. 19 / OPTICS EXPRESS 18605
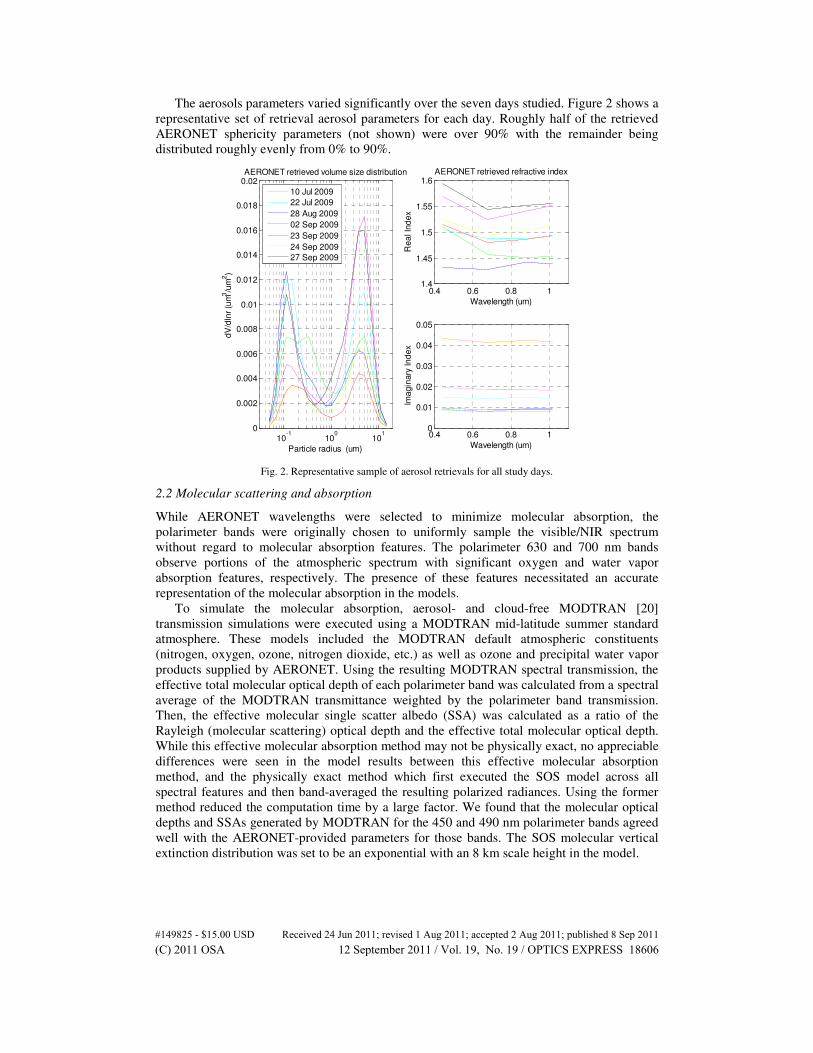
The aerosols parameters varied significantly over the seven days studied. Figure 2 shows a
representative set of retrieval aerosol parameters for each day. Roughly half of the retrieved
AERONET sphericity parameters (not shown) were over 90% with the remainder being
distributed roughly evenly from 0% to 90%.
10-1
100
101
0
0.002
0.004
0.006
0.008
0.01
0.012
0.014
0.016
0.018
0.02AERONET retrieved volume size distribution
Particle radius (um)
dV
/dln
r (u
m3/u
m2)
0.4 0.6 0.8 11.4
1.45
1.5
1.55
1.6AERONET retrieved refractive index
Wavelength (um)
Re
al In
de
x
0.4 0.6 0.8 10
0.01
0.02
0.03
0.04
0.05
Wavelength (um)
Ima
gin
ary
In
de
x
10 Jul 2009
22 Jul 2009
28 Aug 2009
02 Sep 2009
23 Sep 2009
24 Sep 2009
27 Sep 2009
Fig. 2. Representative sample of aerosol retrievals for all study days.
2.2 Molecular scattering and absorption
While AERONET wavelengths were selected to minimize molecular absorption, the
polarimeter bands were originally chosen to uniformly sample the visible/NIR spectrum
without regard to molecular absorption features. The polarimeter 630 and 700 nm bands
observe portions of the atmospheric spectrum with significant oxygen and water vapor
absorption features, respectively. The presence of these features necessitated an accurate
representation of the molecular absorption in the models.
To simulate the molecular absorption, aerosol- and cloud-free MODTRAN [20]
transmission simulations were executed using a MODTRAN mid-latitude summer standard
atmosphere. These models included the MODTRAN default atmospheric constituents
(nitrogen, oxygen, ozone, nitrogen dioxide, etc.) as well as ozone and precipital water vapor
products supplied by AERONET. Using the resulting MODTRAN spectral transmission, the
effective total molecular optical depth of each polarimeter band was calculated from a spectral
average of the MODTRAN transmittance weighted by the polarimeter band transmission.
Then, the effective molecular single scatter albedo (SSA) was calculated as a ratio of the
Rayleigh (molecular scattering) optical depth and the effective total molecular optical depth.
While this effective molecular absorption method may not be physically exact, no appreciable
differences were seen in the model results between this effective molecular absorption
method, and the physically exact method which first executed the SOS model across all
spectral features and then band-averaged the resulting polarized radiances. Using the former
method reduced the computation time by a large factor. We found that the molecular optical
depths and SSAs generated by MODTRAN for the 450 and 490 nm polarimeter bands agreed
well with the AERONET-provided parameters for those bands. The SOS molecular vertical
extinction distribution was set to be an exponential with an 8 km scale height in the model.
#149825 - $15.00 USD Received 24 Jun 2011; revised 1 Aug 2011; accepted 2 Aug 2011; published 8 Sep 2011(C) 2011 OSA 12 September 2011 / Vol. 19, No. 19 / OPTICS EXPRESS 18606

2.3 Surface reflection
Multiple scattering of surface-reflected light from aerosols and molecules greatly reduces the
DoLP (while increasing the radiance) observed in ground-based sky measurements [21].
Therefore, accurate surface reflectance parameters are needed for valid simulations. To fulfill
this need, we modified the SOS code to directly incorporate BRF model parameters from the
MISR satellite land surface product [22]. MISR provides BRF parameters for a modified
version of the RPV (Rahman-Pinty-Verstraete) model [23]. (The SOS code as provided to us
by AERONET implemented the standard RPV model.)
The SOS model simulates a homogenous surface. Since an individual pixel in a MISR
image is not expected to properly represent an entire area, we calculated an effective BRF
model for the 50 km radius area surrounding Bozeman as follows. Using the MISR BRF
model parameters, the BRF values for every possible source and view angle geometry at
every pixel were calculated. Then, the BRF values were averaged across all pixels according
to geometry. The averaged BRF data were then fit to an effective MRPV model. The effective
model was calculated for all bands in each MISR product available for the Bozeman 2009
summer. Finally, the effective MRPV model parameters were linearly interpolated to the
polarimeter both spectrally and temporally before inclusion in the SOS model. (This method
was also repeated for an 8 km radius area, but the SOS simulation results were not
significantly different from the 50 km case.)
The SOS model allowed specification of the polarized surface using the Nadal and Breon
model parameters [24]. Since the area surrounding Bozeman is largely forested, we tried the
“high NDVI forest” parameters specified in the table on pg. 1715 of [24], but the model
results were not significantly different from the case where a completely unpolarized surface
was defined.
Fig. 3. Excerpt from a time lapse (Media 1) of observation and model comparisons for 02 Sept
2009, Bozeman, Montana, USA. The RGB composite images were formed from the 450, 530,
and 630 nm images. Error and degree of linear polarization (DoLP) images are shown only for
the 450 nm band. Radiance error is defined as (observed - modeled)/observed. The arc with a
centered-disk is an automated sun occulter. The Babinet (above the sun) and Brewster (below
the sun) neutral points are seen in both the observed and modeled DoLP.
#149825 - $15.00 USD Received 24 Jun 2011; revised 1 Aug 2011; accepted 2 Aug 2011; published 8 Sep 2011(C) 2011 OSA 12 September 2011 / Vol. 19, No. 19 / OPTICS EXPRESS 18607

3. Comparison results and discussion
3.1 Full sky time lapse comparisons
For each polarimeter observation, sky radiance and polarization values were simulated by the
SOS model for a sparse grid of zenith and azimuth angles that covered the entire sky. Using
two-dimensional interpolation, values for the remaining sky were generated. For comparison
purposes, these simulated data were projected identically to the polarimeter fisheye
projection. An example of both the observed data and the projected simulation data is shown
in Fig. 3. As the animation in Fig. 3 (Media 1) shows, the polarimeter and the model typically
agree well, although some biases do exist.
3.2 Maximum degree of polarization comparisons
The maximum degree of linear polarization (DoLP) and its associated minimum sky radiance
were selected as the parameters of interest for the comparison. (The sky region with minimum
radiance is near the region with the maximum DoLP.) We have found that differences
between the model DoLP and the observation DoLP across the entire sky are typically well
correlated with maximum DoLP differences. If the DoLP maxima agree, the DoLPs in the
remaining sky regions also generally agree. Figure 4 shows comparisons of the observations
and the models for these two parameters. Data shown are for times when the polarimeter
observations and the AERONET retrievals were within 10 minutes of each other.
0 0.2 0.4 0.6 0.8 10
0.2
0.4
0.6
0.8
1
Polarimeter
SO
S M
ode
l
Maximum DoLP: 450 nm
0 0.2 0.4 0.6 0.8 10
0.2
0.4
0.6
0.8
1
Polarimeter
SO
S M
ode
lMaximum DoLP: 490 nm
0 0.2 0.4 0.6 0.8 10
0.2
0.4
0.6
0.8
1
Polarimeter
SO
S M
od
el
Maximum DoLP: 630 nm
0 0.2 0.4 0.6 0.8 10
0.2
0.4
0.6
0.8
1
Polarimeter
SO
S M
od
el
Maximum DoLP: 700 nm
Fig. 4. Comparison of the observation and model maximum degree of polarization (DoLP) for
times when the polarimeter measurement and AERONET retrieval were within 10 minutes of
each other. 530 nm results (not shown) are very similar to the 450 and 490 nm results.
Polarimeter error bars are shown which vary from ± 0.03 for fully polarized light to ± 0.003 for
unpolarized light.
Figure 4 shows that the model maximum DoLP is generally higher than the measured
DoLP for these data. For the shorter wavelengths, this difference is typically not greater than
the data variability. Also, the modeled minimum sky radiance is typically lower than observed
(Fig. 5). Some error in the minimum sky radiance is expected since comparisons of the
polarimeter and CIMEL radiances exhibit similar differences (see Appendix 1). The
differences are at least partially attributable to systematic radiance errors in the calibration
standards used for each individual instrument. In the case of CIMEL calibration errors, these
#149825 - $15.00 USD Received 24 Jun 2011; revised 1 Aug 2011; accepted 2 Aug 2011; published 8 Sep 2011(C) 2011 OSA 12 September 2011 / Vol. 19, No. 19 / OPTICS EXPRESS 18608

errors would affect the retrieved aerosol parameters (and therefore the sky models) due to the
aerosol model parameters being derived from the source CIMEL radiances. Therefore,
radiance differences between the polarimeter and the model would be expected without
preference to the source of the error. That is, radiance differences would exist whether the
CIMEL or the polarimeter is the major cause of the radiance error. While radiance errors may
be blamed, at least in part, on systematic errors in the instrument calibrations, polarization
differences of the magnitude seen here are much higher than previous polarimeter error
characterizations [11]. A more critical analysis of potential error sources follows.
0 2 4 60
2
4
6
Polarimeter
SO
S M
odel
Minimum Sky Radiance: 450 nm
0 2 4 60
2
4
6
Polarimeter
SO
S M
odel
Minimum Sky Radiance: 490 nm
0 2 4 60
2
4
6
Polarimeter
SO
S M
od
el
Minimum Sky Radiance: 630 nm
0 2 4 60
2
4
6
Polarimeter
SO
S M
od
el
Minimum Sky Radiance: 700 nm
Fig. 5. Same as Fig. 4 but for minimum sky radiance. Radiance units are uW/(cm2*Sr). Since
radiance errors are not characterized for the polarimeter and the polarimeter is calibrated with a
similar method to the AERONET radiometers, error bars that reflect the ± 5% error advertised
by AERONET [14] are shown for reference.
3.3 Potential sources of comparison differences
For all wavelengths, the modeled DoLP tends to be higher than observation while the radiance
tends to be lower. One potential explanation for this behavior is thin cloud contamination. In
our experience, thin clouds will reduce the DoLP significantly. This effect is most pronounced
in the maximum DoLP sky regions and at longer wavelengths. Thin clouds also increase the
sky radiance. This may explain the higher observed radiances and lower observed DoLPs.
Since we would not expect cloud contaminations to be present in all observations (and
AERONET quality control seeks to eliminate them), contaminations would be manifested as a
one-sided variability in the scatter plot that both reduces the DoLP and increases the radiance
for select observations. If correct, this hypothesis explains why a significant fraction of the
scatter points in the visible bands are within error bars for both the radiance and the
polarization (Figs. 4 and 5), while many are not.
For the 630 and 700 nm bands, the polarization differences between the model and the
polarimeter are more extreme than the shorter wavelengths. While cloud contamination
affects the longer wavelengths more severely, the occurrence of large polarization differences
only in the bands with significant molecular absorption warrants special examination. Several
issues must be considered.
First, light from wavelengths with large molecular absorption features have increased
polarization when compared to adjacent bands that lack molecular absorption [25,26].
#149825 - $15.00 USD Received 24 Jun 2011; revised 1 Aug 2011; accepted 2 Aug 2011; published 8 Sep 2011(C) 2011 OSA 12 September 2011 / Vol. 19, No. 19 / OPTICS EXPRESS 18609

Therefore, overestimation of the molecular absorption will cause an overestimated DoLP in
the model. The higher simulated DoLP (with respect to the observed quantity) may indicate
that the molecular absorption included in the model is overestimated. For the 630 nm and 700
nm bands, the primary absorbing molecules are oxygen and water vapor, respectively. We
expect that the MODTRAN oxygen model used is accurate since oxygen is a uniformly mixed
and temporally consistent atmospheric gas. In contrast, water vapor is temporally variable. To
account for this variability, we included AERONET-produced precipital water vapor (pwv)
products into the MODTRAN model. We have compared pwv values retrieved by AERONET
to values retrieved by a local SUOMINET station and found that the two instruments
generally agree quite well. Therefore, we have no reason to suspect that the molecular
absorption included in the model is overestimated.
Second, while we are confident in the ability of the SOS model to simulate situations with
low molecular absorption, we are uncertain to what degree the model has been tested in
spectral regions with high molecular absorption.
Third, the spectral-weighted average of the molecular optical depth that we use depends
greatly on the accuracy of the filter transmission profiles and the accurate representation of
the fine absorption features by MODTRAN. In these highly structured absorption complexes,
small errors in the filter profiles or absorption features may cause errors in the weighted
molecular optical depth and molecular SSA. These issues make interpretation of results in the
absorption bands difficult.
Finally, polarization in these longer wavelength bands may be more sensitive to errors in
the model aerosol parameters because the portion of the radiance coming from the aerosols as
opposed to the molecules is higher compared to the shorter wavelengths. This effect results
from both the higher molecular absorption in these bands and the lower Rayleigh optical
depth at the longer wavelengths. Thus, enhanced differences in these bands could be the result
of aerosol parameter errors. The potential for aerosol parameter errors becomes more apparent
when the atmospheric conditions are considered. For all measurements taken in this study, the
500-nm aerosol optical depth ranged between 0.025 and 0.17. (In the absence of summer
forest fires, Bozeman generally has a very clean atmosphere.) These low aerosol optical
depths are in a range where AERONET radiance inversions encounter difficulties properly
retrieving the aerosol parameters, especially the complex refractive index and single-scatter
albedo [27]. While the overall agreement of the comparisons here suggest that the retrieved
parameters are at least reasonable in this aerosol optical depth range, we suspect that some
biases may be introduced into the individual microphysical properties. (It is noted that the
results were not significantly different if only retrievals with high sphericity (> 90%) were
isolated for comparison.) Previous investigators have discussed conditions that may cause
biases in the retrieved real refractive index [6,15,16]. Some of the comparison differences
shown here may indicate that real refractive index biases exist in this AERONET data set. We
test the possibility of this scenario in the next section.
3.4 Maximum DoLP comparisons with artificially increased real refractive index
While real refractive index biases are only one of several potential error sources, we
investigated whether a refractive index bias could realistically account for the differences seen
between the observations and the models. To test the sensitivity of the model to a potential
bias, we introduced an artificial 5% increase to the AERONET real refractive index before
calculating the aerosol scattering phase matrix and aerosol SSA included in the model. (Note
that we continued to use the AERONET “direct sun” aerosol optical depths, so the model
aerosol optical depth was not altered by this increase.) The magnitude of this increase was
chosen arbitrarily. Figures 6 and 7 (which are similar to Figs. 4 and 5) show the results from
the models with the artificially enhanced real refractive index when compared to the observed
data.
#149825 - $15.00 USD Received 24 Jun 2011; revised 1 Aug 2011; accepted 2 Aug 2011; published 8 Sep 2011(C) 2011 OSA 12 September 2011 / Vol. 19, No. 19 / OPTICS EXPRESS 18610

0 0.2 0.4 0.6 0.8 10
0.2
0.4
0.6
0.8
1
Polarimeter
SO
S M
ode
l
Maximum DoLP: 450 nm
0 0.2 0.4 0.6 0.8 10
0.2
0.4
0.6
0.8
1
Polarimeter
SO
S M
ode
l
Maximum DoLP: 490 nm
0 0.2 0.4 0.6 0.8 10
0.2
0.4
0.6
0.8
1
Polarimeter
SO
S M
od
el
Maximum DoLP: 630 nm
0 0.2 0.4 0.6 0.8 10
0.2
0.4
0.6
0.8
1
Polarimeter
SO
S M
od
el
Maximum DoLP: 700 nm
Fig. 6. Same as results from Fig. 4, but for models with the AERONET real refractive index
artificially increased by 5%.
0 2 4 60
2
4
6
Polarimeter
SO
S M
od
el
Minimum Sky Radiance: 450 nm
0 2 4 60
2
4
6
Polarimeter
SO
S M
od
el
Minimum Sky Radiance: 490 nm
0 2 4 60
2
4
6
Polarimeter
SO
S M
od
el
Minimum Sky Radiance: 630 nm
0 2 4 60
2
4
6
Polarimeter
SO
S M
od
el
Minimum Sky Radiance: 700 nm
Fig. 7. Same as results from Fig. 5, but for models with the AERONET real refractive index
artificially increased by 5%.
For both the radiance and the polarization comparisons, the agreement between the
observation and the model is much better with the real refractive index adjustment. The mean
absolute DoLP difference over all data points improved from 0.047 to 0.02, while the mean
absolute radiance difference improved from 8.5% to 5.4%. This agreement is also exhibited in
the full sky images (not shown). While these results do not necessarily confirm a bias in the
AERONET real refractive index for this data set–as other sources of error may exist–they do
show that the possibility of a real refractive index error cannot be eliminated. They are also
consistent with previous results which show (1) that polarization is very sensitive to changes
in the real refractive index [8] and (2) that the intensity-only AERONET algorithm will
sometimes underestimate the real refractive index for fine and mixed mode particles [6].
#149825 - $15.00 USD Received 24 Jun 2011; revised 1 Aug 2011; accepted 2 Aug 2011; published 8 Sep 2011(C) 2011 OSA 12 September 2011 / Vol. 19, No. 19 / OPTICS EXPRESS 18611
It is important to note that the better agreement obtained from artificially increasing the
real refractive index is specific to this data set and should not be interpreted to apply to all
AERONET data. Our purpose here is only to show the potential for a real refractive index
bias. Also, further adjustments could be made to the real refractive index on a per wavelength
basis until agreement is ideal, but manipulating the aerosol parameters to this degree would
only show the sensitivity of polarization to real refractive index, not indicate the true real
refractive index. Results from artificially increasing an isolated parameter (as done here) are
not indicative of inversion behavior. Inversions retrieve all aerosol microphysical parameters
(size distribution, sphericity, complex refractive index, etc.) simultaneously. An inversion that
included the polarization with the radiance would most likely generate both size distributions
and refractive indices that differed from radiance-only retrieved values for this data set.
Therefore, our artificially adjusted real refractive index may be overcompensating for errors
in other aerosol parameters and the exact value of our adjustment may not be meaningful.
4. Conclusion
We have shown polarization and radiance observations compared with results from radiative
transfer model simulations which include aerosol parameters generated by AERONET. While
the models generally agree well with the observations, some differences exist. Several
potential error sources in the models were identified. Large molecular absorption features in
some bands (630 and 700 nm) complicate the interpretation of the results. While several
sources of error may exist, simulations suggest that the real part of the refractive index may be
underestimated for the aerosol data set in question. This conclusion is not unwarranted given
the low aerosol conditions over the course of the observations and the corresponding
difficulties that these conditions pose to the AERONET inversion algorithm.
Recently, we moved the 630 and 700 nm polarimeter bands to 675 and 780 nm,
respectively, to reduce the difficulties encountered with interpreting data in highly structured
molecular absorption bands. In future studies, we should be able to better assess model vs.
observation differences.
These results are consistent with previous results which have shown that the addition of
polarimetric information to aerosol inversions better constrains the parameters, especially the
retrieved real refractive index [5–8]. It is noted, however, that multiple scattering from
sources outside the field of view (like clouds and the surface) will reduce the sky DoLP
significantly [21]. Out-of-field clouds could be problematic for almucantar retrievals that
utilize polarization, because they reduce the sky polarization. This reduced polarization could
be falsely interpreted as an artificially large aerosol real refractive index. In this study, the full
sky polarimetric imager allowed us to select data where the full sky was completely free of
clouds from horizon to horizon. A radiometer which only scans the almucantar and the
principal plane would not allow the user this advantage. Therefore, it may be more vulnerable
to these problems. Still, quality control algorithms (including almucantar symmetry tests) may
be able to eliminate most of these problems. Furthermore, the imager method has its own
inherit disadvantages as it requires a more complex calibration, and a second imager may be
needed for the NIR wavelengths (which are needed for the inversion). Additional research in
these areas is necessary.
Appendix 1. AERONET vs. polarimeter radiance comparisons
Both the AERONET CIMEL instrument and the polarimeter produce radiance data products.
The polarimeter measures the full sky, while the CIMEL measures sky radiances in the solar
almucantar and principal plane. The similarity of these radiance products provides an
opportunity for an indirect calibration crosscheck. While direct comparisons can be made for
the 450 and 500 nm bands of the two instruments, other bands can only be compared by
interpolating the radiance between the bands. This approach is useful only if the inherent
limitations of interpolation between spectra with molecular absorption bands are considered.
#149825 - $15.00 USD Received 24 Jun 2011; revised 1 Aug 2011; accepted 2 Aug 2011; published 8 Sep 2011(C) 2011 OSA 12 September 2011 / Vol. 19, No. 19 / OPTICS EXPRESS 18612
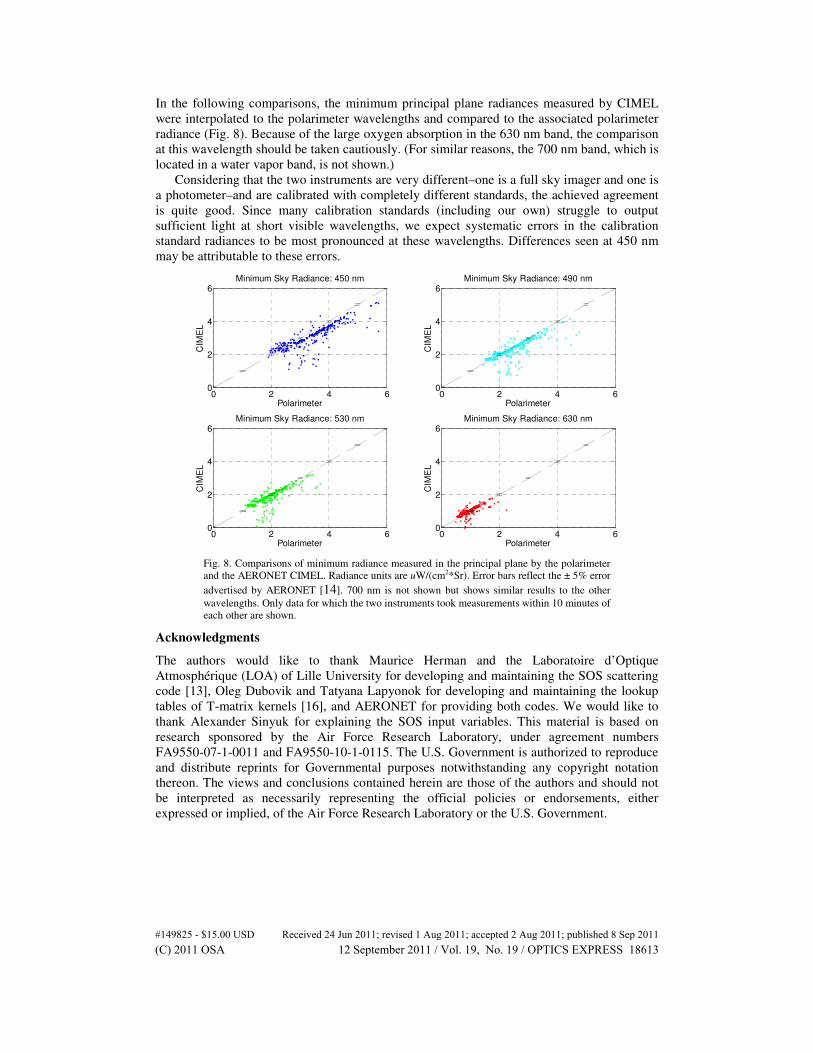
In the following comparisons, the minimum principal plane radiances measured by CIMEL
were interpolated to the polarimeter wavelengths and compared to the associated polarimeter
radiance (Fig. 8). Because of the large oxygen absorption in the 630 nm band, the comparison
at this wavelength should be taken cautiously. (For similar reasons, the 700 nm band, which is
located in a water vapor band, is not shown.)
Considering that the two instruments are very different–one is a full sky imager and one is
a photometer–and are calibrated with completely different standards, the achieved agreement
is quite good. Since many calibration standards (including our own) struggle to output
sufficient light at short visible wavelengths, we expect systematic errors in the calibration
standard radiances to be most pronounced at these wavelengths. Differences seen at 450 nm
may be attributable to these errors.
0 2 4 60
2
4
6
Polarimeter
CIM
EL
Minimum Sky Radiance: 450 nm
0 2 4 60
2
4
6
Polarimeter
CIM
EL
Minimum Sky Radiance: 490 nm
0 2 4 60
2
4
6
Polarimeter
CIM
EL
Minimum Sky Radiance: 530 nm
0 2 4 60
2
4
6
Polarimeter
CIM
EL
Minimum Sky Radiance: 630 nm
Fig. 8. Comparisons of minimum radiance measured in the principal plane by the polarimeter
and the AERONET CIMEL. Radiance units are uW/(cm2*Sr). Error bars reflect the ± 5% error
advertised by AERONET [14]. 700 nm is not shown but shows similar results to the other
wavelengths. Only data for which the two instruments took measurements within 10 minutes of
each other are shown.
Acknowledgments
The authors would like to thank Maurice Herman and the Laboratoire d’Optique
Atmosphérique (LOA) of Lille University for developing and maintaining the SOS scattering
code [13], Oleg Dubovik and Tatyana Lapyonok for developing and maintaining the lookup
tables of T-matrix kernels [16], and AERONET for providing both codes. We would like to
thank Alexander Sinyuk for explaining the SOS input variables. This material is based on
research sponsored by the Air Force Research Laboratory, under agreement numbers
FA9550-07-1-0011 and FA9550-10-1-0115. The U.S. Government is authorized to reproduce
and distribute reprints for Governmental purposes notwithstanding any copyright notation
thereon. The views and conclusions contained herein are those of the authors and should not
be interpreted as necessarily representing the official policies or endorsements, either
expressed or implied, of the Air Force Research Laboratory or the U.S. Government.
#149825 - $15.00 USD Received 24 Jun 2011; revised 1 Aug 2011; accepted 2 Aug 2011; published 8 Sep 2011(C) 2011 OSA 12 September 2011 / Vol. 19, No. 19 / OPTICS EXPRESS 18613