
TOURISM EMPLOY ENT AND RESIDENTS' ATTITUDES IN ...
172
TOURISM EMPLOY�ENT AND RESIDENTS' ATTITUDES IN RAROTONGA, COOK ISLANDS A THESIS SUBMITTED TO THE GRADUATE DIVIS·ION UNIVERSITY OF HAWAII HI PARTIAL FULF ILLMENT OF THE REQUIREMENTS FOR THE DEGREE OF MASTER IN URBAN AND REGIONAL PLANNING AUGUST 1982 by Pamela Takiora Ingram Pryor Thesis Coittee: Tom Dine 11 John C. Holmstrom Chuck Gee
-
Upload
khangminh22 -
Category
Documents
-
view
2 -
download
0
Transcript of TOURISM EMPLOY ENT AND RESIDENTS' ATTITUDES IN ...

TOURISM EMPLOY�ENT AND RESIDENTS' ATTITUDES
IN RAROTONGA, COOK ISLANDS
A THESIS SUBMITTED TO THE GRADUATE DIVIS·ION UNIVERSITY OF HAWAII HI PARTIAL FULF ILLMENT
OF THE REQUIREMENTS FOR THE DEGREE OF
MASTER
IN URBAN AND REGIONAL PLANNING
AUGUST 1982
by
Pamela Takiora Ingram Pryor
Thesis Co1T1Tiittee:
Tom Dine 11 John C. Holmstrom
Chuck Gee

i i
We certify that we h ave read this thesis and that in our opinion
it is satisfactory in scope and quality as a thesis f or the degree
of Master in Urban and Regional Planning.
THESIS COMMITTEE
.
- JS&2 -� {/i.ua -� �-

i i i
ACKNOWLEDGMENTS
Many people gave me assistance in the preparation reserach,
analysis and writing stages of this thesis. I would like to thank
the Honorable Iaveta Short, Mini?ter of Tourism of the Cook Islands;
Tern� Okotai, General Manager of the Tourist Authority, and the whole
Tourist Authority Board for their time and support. Prime Minister
Sir Thomas Davis has given me much encouragement and ,members of the
Cook Islands Statistics Office, especially_ Andrew. Turua gave me
invaluable help. Others in Rarotonga who were helpful are George
Ellis, George Cowan, �armen Temata, Don Hunter, Marie Melvin.
In Hawaii I would like to thank Tom Dinell, John Holmstrom and
Chuck Gee for their persistence and patience. Norman Okamura, John
Knox, Renee Heyuni, Barbara Awa also generously gave their time and
guidance.
All of this would not have· been possible without the
understanding of my husband, Tap, and children, Paka and Kamaki.

TABLE OF CONTENTS
ACKNOWLEDGMENTS .
TABLE OF CONTENTS
LIST OF TABLES .
LIST OF FIGURES
CHAPTER 1:
CHAPTER 2:
PURPOSE AND OVERVIEW
1. 1
l. 2
1.3
1.4
1.5
1.6
1. 7
1.8
Introduction . . . . Purpose and Utility of the Study Research Methodology . The Cook Islands . . The Economy . . . .
Climate . . . . . .
Population Dynamics Land Tenure and Political History
THE RAROTONGA TOURIST INDUSTRY
2.1 The Role of Government . . .
2.2 Visitor Arrivals . . . . .
2.3 Seasonality and Length of Stay
. ' .
2.4 Tourist Transportation and Accomodation 2.5 Ownership of Hotels and Motels . .
CHAPTER 3: .
TOURISM'S CONTRIBUTION TO EMPLOYMENT
3.1 Features of Tourism Employment .
3.2 Objectives and Survey Methodology 3.3 Results of Survey . . . . . . . .
3.4 Students' and Residents' Attitudes Toward Employment in the Industry
iv
i i i
iv
vi
xi
1
1
9
9
10
11
16
17
19
23
23
27
30
31
41
45
45
52
54
67

v
CHAPTER 4: RESIDENTS' ATTITUDES TOWARD TOURISM AND TOURISTS . . . . . . . . . 77
4 .1 Background . . . . . . 77
4.2 Survey Design and Methodology 83
4.3 Analysis and Results of the Household Survey . . . . 86
4.4 Findings . . . 87
4.5 Analysis· and Results of the High School Survey 112
4.6 Results of Leadership Intervi e\-JS 115
CHAPTER 5: CONCLUSION . . . . . . . . . . 122
5. l Introduction . . . . 122
5.2 Review of Principal Patterns 123
5.3 Cultural Considerations . . . 127
5.4 Monitoring Growth and Further Research 130
5.5 Recommendations 133
APPENDIX 139
B IBL I OGRA PHY 155

vi
LIST OF TABLES
Table Page
2
3
4
5
6
7
8
9
10
11
Value of Exports by Commodity in Agricultural Sector 15
Only, Cook Islands, 1971 Through 1977.
Visitor Arrivals by Nationality, Rarotonga, Cook Islands, 1975 Through 1978.
Central Pacific Region, Number of Tourist Units by Country, 1976 and 1977.
Number of Visitors by Country in the Central· Pacific Region, 1976 and 1977.
Number of Hotels/Motels, Rooms, and Visitors Rarotonga, Cook Islands, 1971-1978.
Number of Rooms, Beds and Rates by Visitor Accommodations Facility, Rarotonga, Cook Islands - 1979.
Ownership of Hotels/Motels, Rarotonga, Cook Islands - 1978
.
Ownership Distribution of Tourism Facilities Other than Accommoda tion, Rarotonga, Cook Is 1 ands - 19 7 8
Tourism Employment Showing Occupations, Rarotonga, Cook Islands - 1978.
Primary Tourism Employment, Rarotonga, Cook Islands - 1978
Economically Active Population (By Occupation and Sex), Rarotonga, Cook Islands - 1979
28
34
35
36
38
43
44
55
57
58

vii
Table
12 Total Primary Tourism Employment by Sex, 59
Rarotonga, Cook Islands - 1978
.13 Primary Employment - Hotel/Motel, Distribution 59
by Age, Rarotonga, Cook Islands - 1978
14 Total Part-Time Tourism Employment by Nationality 61
and Sex, Rarotonga, �ook Islands - 1978
15 Primary Employment - Hotel/Motel, Distribution 63
by Nationality and Occupation, Rarotonga, Cook Islands - 1978
16 Total Primary Tourism Employment by Nationality 64
Rarotonga, Cook Islands - 1978
17 Foreign Hotel Employees Showing Age, Nationality 65
and Salary, Rarotonga, Cook Islands - 1978
18 Primary Tourism Employment of Cook Islanders, 66
Distribution by Hotel/Motel and Salary/Wage, Rarotonga, Cook Islands - 1978
19 Air Transportation Employees, Nationality and 68
Salaries, Rarotonga, Cook Islands - 1978
20 Air Transportation Employees Occupation, 69
Nationality and Sex, R�rotonga, Cook Islands - 1978
21 Airport Operations Salaries Analysis for 70
Non-Nationals, Rarotonga, Cook Islands - 1978
· 22 Airport Operations, Cook Island Employees Salaries 71
and Sex Distributions, Rarotonga, Cook Islands - 1978
23 Students Wanting Careers in Hotels/Motels, 73
Rarotonga, Cook Islands - 1977

Table
24
25
26
27
28
29
30
31
32
33
34
Students Wanting Careers in Other Tourism Related Induitries, Rarotonga, Cook Islands - 1977
Students Wanting Careers in Tourism Related Industry ( Other than Hotel/Motel, Rarotonga, Cook Islands - 1977
Number of Respondents by Village of Residence, Survey of Houeholds, Rarotonga, Cook Islands -June 1977
Number of Respondents by Sex, Survey of Households, Rarotonga, Cook Islands - June 1977
Number of Respondents by Age Group, Survey of Households, Rarotonga, Cook Islands - June 1977
Number of Respondents by Educational Level, Survey of Households» Rarotonga, Cook Islands -June 1977
Number of Respondents by Nationality, Survey of Hous eholds, Rarotonga, Cook Islands - June 1977
Number of Respondents by Place of Birth, Survey of Hous eholds, Rarotonga, Cook Islands - June 1977
Number of Respondents by Length of Residence in Rarotonga, Survey of Households, Rarotonga, Cook Islands - June 1977
Employment of Respondents, Survey of Households, Rarotonga, Cook Islands - June 1977.
Income of Res idents, Survey of Households, Rarotonga, Cook Islands - June 1977
viii
Page
74
74
84
88
88
89
89
90
90
91
91

ix
Table Page
35 Residents• Attitudes Toward Airport Construction, 93
Survey of Households, Rarotonga, Cook Islands -June 1977
36 Residents• Attitudes Toward Future Hotels, Survey 93
of Households, Rarotonga, Cook Islands - June 1977
37 Residents• Attitudes Toward Construction of New 94
Hotel, Survey of Households, Rarotonga, Cook Islands - June 1977
38 Residents• Attitudes Toward Tourism, Survey 95
of Households, Rarotonga, Cook Islands -June 1977
39 Residents• Attitudes Toward Ownership of 97
Hotels/Motels, Survey of Households, Rarotonga , Cook Islands - June 1977
40 Residents' Attitudes Toward Further Tourism 97
Develop ment, Survey of Households, Rarotonga, Cook Islands - June 1977
4 1 The Most Important Development Projects in the 98 Cook Islands Over the Last 10 Years as Perc eived by Residents, Survey of Households, Rarotonga, Cook Islands - June 1977
.
42 Desired Future Volume of Tourists, Survey of 100
Households, Rarotonga, Cook Islands - June 1977
43 Attitudes Toward Present Volume of Tourists, l 00
Survey of Households, Rarotonga, Cook Islands -June 1977
44 Reasons for More Tourists, Survey of Households l 01
Rarotonga , Cook Islands - June 1977

Table
45 Reasons for No More Tourists, Survey of Househo 1 ds, 102
Rarotonga, Cook Islands - June 1977
46 Residents' 11Knm-1ledge11 of Rarotongan Hotel Ownership, 104
Survey of Households, Rarotonga, Cook Islands -June 1977
47 Residents' Knowledge of Government Policy, Survey 104
of Households, Rarotonga, Cook Islands - June 1977
48 Frequency of Contact with Tourists, Survey of 105
Households, Rarotonga, Cook Islands - June 1977
49 Frequency of Use of Hotel Facilities, Survey of 107
Households, Rarotonga, Cook Islands - June 1977
50 Residents' Perception of a Tourist, Survey of 108
Households, Rarotonga, Cook Islands - June 1977
51 Attitudes Toward Present Government Tourism 110
Policy, Survey of Households, Rarotonga, Cook Islands - June 1977
52 Attitudes Toward Government Policy of Controlled 110
Tourism, Survey of Households, Rarotonga, Cook Islands - June 1977
53 Residents' Perception of Government's Role in 111
Future Tourism Development, Survey of Households, Rarotonga, Cook Islands - June 1977
54 High School Students' Attitudes Toward Tourism, 114
Survey of Tereora College, Rarotonga, Cook Islands -1977
x

Figure
l
2
3
4
5
LIST OF FIGURE.S
Map of the Cook Islands
Map of Rarotonga Island
Traditional Social Organization, Rarotonga, Cook Islands
Process of Policy-Making and Implementation: Tourism
Average Room Occupancies for Trailways (40 Rooms) and Rarotongan Hotels (103 Rooms), Rarotonga� Cook Islands, 1977-1978 Financial Year
xi
Page
12
13
21
26
39
1.1 Introduction
CHAPTER 1
PURPOSE AND OVERVIEW
To what extent should the Cook Islands encourage tourism as a
means to economic development? Small in land area and population,
large in the geographic distribution of its sixteen islands, this
quasi-independent nation is confronted by the clas�ic .problem of
island people everywhere: how to generate adequate economic
strength in contemporary terms without sacrificing social, cultural,
and environmental values.
The question at first seems unanswerab 1 e because of the mix of
political and philosophical considerations involved. Even so,
pressured by real concern, extensive discussion of the issues has
occupied island people and tourism industry advocates for a long
time, especially since the advent of jet travel twenty years ago.
Perhaps because of the almost completely qualitative character of
such dialogue, no good guidelines or solutions have as yet emerged.
Since World War II, tourism has developed world-wide into a
formidable industry which in 1978 generated US$50 billion in
international revenues. {OECD 1979} In recent years tourism and
travel have made major contributions to national economic growth,
employment and infrastructure development in both developed and

developing countries. In the United States tourism is recognized as
one of the major industries generating substantial revenues, and
providing more than four million jobs. (Herrmann 1978) In Hawaii,
a mecca for Pacific tourism, it is the primary source of outside
income.
It is the only major industry which, for the foreseeable future, shows a potential of creating a substantial number of jobs for our young people entering the 1 ab or force and for outside rs migrating here at an expected rate of 8 ,000 a year, whatever the economic conditions. (Chaplin 1978:Al5)
National tourism organizations and international agencies have
researched the flow of visitors, length of stay, origin of visitors,
seasonality, accommodation requirements and occupancy rates, and
transportation requirements. However, the sociological and
philosophical nature of tourism and its effects on the people
involved remains a relatively new research field. People living in
tourist areas who Smith (1977) calls 11hosts11 and the tourists who
become their temporary 11guests" are relatively unstudied as people,
although some of the guests' characteristics are known. The history
of the anthropological approach to the analysis of tourism is short,
with Nunez publishing the first article in 1963. The first national
symposium was held in Mexico City in 1974 in conjunction with the
meetings of the American Anthropological Association. The purpose
of the Symposium was to legitimatize the study of tourism as an
academic subdiscipline. {Smith 1977) Since then other symposia
have produced a growing body of literature, i ndi ca ting a growing
2

3
concern among social scientists and governments about the impact of
tourism on destination area residents. (·Finney & Watson 1975, Ross
& Farrell 1976)
Greenwood (1970) completed the first in-depth study of the
impact of tourism on a community in Basque, Spain. He found that
tourism had an impact on agriculture, resulting in a loss of
resource control by the residents. McKean (1977) argued that,
although socio-economic change caused in part by tourism is taking
place in Bali, tourism "may in fact strengthen t.he process of
conserving, reforming and recreating certain traditions" on that
island. {Ibid:94) Cohen (1972) has attempted to devise a general
theoretical approach to the sociological aspects of international
tourism; he gives a detailed typology of tourists on the basis of
their relationship to the tourist business establishment and the
host country.
The question of the costs and benefits of tourism has frequently
been discussed. le Fevre ( 1975b) po'fnted out that tourism p 1 anni ng
has concentrated on marketing and physical employment, while
ignoring how to include the local economy in construction and
servicing of tourism facilities. These indirect benefits are of
more realistic concern to the host country than the direct benefits
which will accrue more to the two major, foreign sectors of
tourism--the airlines and the major hotels. Planning is needed in
order to ensure that the growth of tourism fits in with the

4
structure of the economy as a who 1 e. The 11 spin-offs 11 of the growth
of tourism in developing countries, such as development of domestic
food production, must be planned and implemented. The main indirect
benefit of tourism could be the removal of market size constraints
on local industries giving them an opportunity to develop on an
economic scale.
Kloke (1975) provides some economic background to assist in the
evaluation of the tourist industry's potential role in the South
Pacific. Subsistence agriculture is still an important economic
activity in many Pacific Islands, although the importance is
difficult to measure because cash is not involved. However, Kloke
reports that in 1953, 23% of the national income of Fiji was
produced by the subsistence sector; in Western Samoa in 1958 the
estimate was 50% and in the Cook Islands in 1964 it was 26%.
{Ibid.) In addition, the amount of export agriculture has grown.
Crops like copra, sugar (especially in Fiji) and tropical fruits and
vegetables play an important role in island economies. Three other
sources of foreign exchange important in South Pacific economies are
aid and subsidies from other governments, remittances from nationals
living abroad and tourism. These sources help to finance the
deficit in balance of payments caused by a higher volume of imports
over exports. This imbalance of trade is a serious problem in most
South Paci fie economies. (Ibid.) Kloke argues that tourism is an
industry that has the potential to provide employment for a growing
urban labor force to contribute to diversification of island
economies and to supply needed foreign exchange. However,

participation of the local labor force is essential to maximize the
benefits to the local economy, for if foreign labor is brought in,
the benefits to the local economy will be reduced.
5
In addition to the economic effects of tourism, the industry can
have a substantial effect on the social, cultural, political, and
environmental structures of an- isl and corrmuni ty. Fox ( 1975) points
out that while there is a need to assess the social impact of
tourism on island communities, very little reliable research has
been done. He maintained that this would be one of the greatest
challenges for tourism researchers in the future.
A study of Hawaii investigated one dimension of the cost of
tourism growth--crime. The researchers found that tourism indeed
generate a disproportion ate amount of crime, thus imposing a burden
on resident i a 1 taxpayers. (Fujii and Mak 1977)
In an effort to understand the process of community development
and change, a study of the North Kohala corrrnunity on the island of
Hawaii was undertaken in 1971. This community had relied on the
sugar industry as its main economic activity until the sugar company
announced in 1970 that plantation operations would close in 1973.
The development of· a new major resort hotel nearby, among other
events, provided new employment opportunities for the community.
The study found that incomes generated by tourism were about 19'.t
lower than those generated by sugar plantation employment. Also, it
was found that tourism increased the costs of certain goods and
services, notably housing and shoreline recreation and employed more

6
women than men. One of the recommendations of the study was a mixed
economy of agriculture and tourism in order to "soften negative
economic pressures." (State of Hawaii, DPED 1972:119)
In the Cook Islands, the area covered by this study, the
environmental impact of tourism accommodation has been reported as
significant. Okotai ( 1977} found that tourist accorrmodation has its
greatest environmental impact on the natural coastal resources, an
area already under stress as a result of past and present use by the
1 ocal population. He recommends that any future tourism development .
must take into account the impact of tourists on the coastal
landstrip and adjacent water environment. Also, other tourist
activities on the coast should be carefully managed to avoid social
conflicts between hosts and guests.
In 1974 the airport on Rarotonga, Cook Islands, was enlarged by
the government of New Zeal an� to accommodate jet traffic served by
Air New Zealand. In June, 1977, the first major hotel was opened on
Rarotonga, jointly owned by Air New Zealand, the Cook Islands
Government and the New Zealand Tourist Hotel Corporation. The hotel
added 150 rooms and the jet service brought 15,000 visitors in
1977. With these two steps accomplished, it was certain that
jet-age tourism had been established and that it would in time
grow. It seemed to be a critical time to ask the residents about
their attitudes toward tourism, perhaps the last time when these
attitudes could be measured before further growth and involvement
woulct affect the answers. Therefore, in the summer of 1977, the

7
researcher interviewed a sample of the households on Rarotonga and a
separate sample of high school students.
The issues were numerous. What did people living in a small
Pacific community really think about thousands of visitors coming to
their island. Did they eagerly approve of the industry or just
consider it the only viable form of economic development? Would
they like to work in a tourism related job? Would they invest in
tourism? Probably one of the most important issues then and now is
whether the Cook Islands should depend on tourism, for economic
development and, if so, to what extent. In order to evaluate the
merits of this approach, it was necessary to assess tourism's
contribution to employment in Rarotonga at that time. In addition,
it was necessary to know whether people wanted to work in tourism
jobs. What were the attitudes of local people toward tourism? What
were the attitudes of local people toward tourists?
If the role of tourism in the Cook Island's economy is going to
increase then it would be desirable to pursue policies which
increase the participation of local people in employment and
investment opportunities. For example, local people must be trained
for the higher paying decision-making jobs and this should be an
important part of any agreement with hotel operators. Another
example is the provision for participation of landowners and other
local people in tourism ventures.
In order to increase the acceptability or attractiveness of
employment in the tourism- industry, it is necessary to demonstrate

8
that there is a real opportunity for development. Another way to
achieve this is to familiarize local people with the industry
through visits and education.
It is important to assess what the attitudes of residents are
toward tourists and tourism. If research shows these to be
positive, then how can this ·desirable state be preserved? Some
options are to keep growth small, educate visitors on local customs
and lifestyles, estabish criteria to select types of visitors
desired and create an awareness of tourism and tourists among local
people.
If it is decided to freeze tourism at its present level (close
to 18,000 in 1980), then it might still be desirable to improve
employment and investment opportunities for local people. However,
if the decision is to increase tourism, then it is important to
monitor ef\ects of growth using data collected as a base line and to
initiate further research to determine policies which would yield
the desired results.
· To obtain sufficient information to initiate such a
decision-making process, the original 1977 surveys were designed to
allow repetition in subsequent years. In parallel, a series of
interviews were scheduled in order to record the opinions of people
in leadership roles. These separate approaches, combined with
analysis and discussion, represent the first of a series of surveys
designed to ioonitor the social and economic impacts of tourism on
the Cook Islands.

1.2 Purpose and Utility of the Study
The purposes of this study are three-fold:
1. to provide a descriptive analysis of tourism
employment in Rarotonga at this time and assess
residents' attitudes (both household heads and high
school students) toward tourism employment;
2. to describe residents' attitudes toward tourism and
tourists as people; and
3. to discuss the need and methods for monitori�g t.ourism
growth and further research.
9
The study is intended to be useful as a basis for public policy � .
consideration and recommendations. The description of tourism
employment will give policy makers in the Cook Islands a clearer
picture of employment patterns in the il'.ldustry and will allow them
to evaluate tourism employment in terms of the Cook Islands Tourist
Authority's (CITA) ·goals and policies for tourism development. The
description of residents' attitudes toward tourism will allow policy
makers to ev a 1 ua te the soc i a 1 goa 1 s of the government. The
student's views on future employment in the industry will assist the
policy makers in planning for tourism training and education.
1.3 Research Methodology
Three research methods were used to obtain the data for this
study: 1 ibrary research, surveys, and personal interviews. Because
of the unavailability of much of the necessary data, they were
10
collected for: the first time in the field. The. five main sources
were:
1. Pub 1 i shed and unpub 1 i shed ma teri a 1 avai 1ab1 e in
1 i brari es, government reports and documents, and from
other sources.
2. A survey conducted by the researcher in July 1978 of
managers of all hotels/motels and other tourism
related industries which yielded data on nationality
of employees, wages (wherever possible), ,part-time
work and other information.
3. A household survey conducted by the researcher in June
1977 which Qathered data on attitudes toward tourism
and employment, tourists, and other characteristics of
tourism development.
4. A survey conducted by the researcher in June/July 1977
of high school students in their last and
second-to-last years of high ·school. As the household
survey recorded attitudes of adults only, it was
decided to determine the attitudes of youth to give
another perspective.
5. Interviews with persons in leadership positions within
the community conducted in July 1978.
These methods will be described in more detail in later sections.
1.4. The Cook Islands
In order to understand the implications of the study, it is
11
necessary to be acquainted with the country, its economy, climate,
population dynamics, land tenure and history.
The Cook Islands consist of an archipelago of fifteen islands
which total eighty'-eight square miles in land area scattered over
1.2 million square miles of the Pacific Ocean. (Figure 1) The
islands can be divided into the northern group, which are all coral
atolls, and the southern group, which are a mixture of atoll,
volcanic and raised coral islands. The northern group is very
isolated, served only by unscheduled ships calling, but -the capital
island, Rarotonga (Figure 2), has enjoyed scheduled air service with
other countries in the Pacific since 1974.
1.5 The Economy:
The estimate of tile Cook Islands Gross Domestic Product (GDP)
was NZ$3.748 million for the fiscal year 1963/1964 (Kolff in Stace
1966). The GDP for 1970 at producer's prices was NZ$8.3 million,
and by 1977 the GDP was estimated at NZ$16.371 million. (C.I.
Statistical Bulletin 1978)
Government Revenues for 1976/1977 amounted to NZ$11.591 million
and increased to NZ$13 million in the financial year 1977/1978.
Meanwhile, government expenditures were NZ$10.8 million and NZ$13.3
million for the same years respectively. (Cook Islands Statistical
Abstract 1979)
The total value of imports for the year 1977 was NZ$17.497
mill ion while exports totalled only NZ$2.386 mill ion, indicating an .

FIGURE 1. Map of the Cook Islands
16S• W 16o•w I '
I
12
•Penrhyn
10• s ---------'", ----------• Rakahanga ---------�
i • Monihiki • Pukapuka
I •Nassau
•
•Suworrow
•Palmerston
Aitutaki • •Manuoe
Takuteo • eMitioro 2o•s -------+--------------+- • � 1 Atiu • Mauke
0
0
100
100 200
200 300miles
300 400 kilometres Approximate Scale
• Rarotonga
I · • Mangaia
16<)• w MM!

.
. • .
. .
: �
. .
N
FIGURE 2. Map of Rarotonga Island
. .
. . .
\ ' . . . .
\ \ . .
.··
• .. ....
......... . . .. ... � 1\64�, ..
�� .. J J ....
2:;;;,;�·····
0
··---�-!i'lf .•
13
.·
·--.................... ..
l 3 � KILOMCTU:l

14
excess of NZ$15.lll million in trade deficits. (Ibid.) New Zealand
provides a subsidy to the Cook Island·s which amounted to NZ$6
million for the 1978/1979 fiscal year out of a total budget of NZ$13
million. In addition, grants in foreign aid for specific projects,
such as infrastructure development, are also received from New
Zealand and Australia. Apart fr,om these financial grants, the main
sources of government revenue are import duties, export produce tax,
income and welfare tax, sales tax and overseas stamp sales. In
addition, Cook Islanders living in New Zealand remi� approximately
NZ$2 million a year to the islands. (Liew 19?7)
Trade is conducted largely with New Zealand which supplies over
80% of imports. However, New Zealand provides the Cook Islands with
an allocation of overseas exchange which makes imports from other
countries possible.
The agricultural sector has traditionally been the main economic
activity in the Cook Islands. It has been the major revenue earner
and employer of labor. The exports of the Southern Group are citrus
fruits, both fresh and processed, canned pineapples and bananas.
Copra is the chief export of the Northern Group. In 1971 the values
of exports from the agricultural sector amounted to NZ$1,402,700 and
increased to NZ$7,095,740 in 1974. By 1977 this figure had declined
to NZ$1,633,400. (Table 1.) The main destination of exports is New
Zealand.
Primary production is dependent on world markets; therefore, the
value of exports has tended to fluctuate from year to year, with a

Table 1 -- Value of Exports by Commodity in Agricultural Sector Only Cook Islands
1971 Through 1977 (OOO's <Anitted)
Commodity 1971 1972 1973 1974 1975 1976
Fresh Fruit & Vegetables 441.1 123.7 242.25 136.54 59.5 201.34
Preserved Fruit & Fruit Juices 819.6 1113.99 1506.9 6669.7 1675.4 1110.5
Copra 142.0 78.0 65.0 299.5 187.4 106.0
TOTAL 1402.7 1315.69 1814.15 7095.74 1922.3 1417.84
Source: Cook Islands Quarterly Statistical Bulletin No. 4, 1977.
1977
83.0
1301.5
248.9
1633.4
__,
<.n

16
peak in 1974 and a downward trend ever since. Since tourism became
a viable industry. after the opening of the international airport in
1974, it is becoming a major growth component. The need for
positive growth in primary production is more critical than ever if
the economy is not to become dependent primarily on tourism. It is
estimated by the CITA that the tourist industry's export earnings,
based on spending for accommodations. meals. transport, sightseeing,
liquor, entertainment, shopping and incidentals, for the year 1976
was NZ$2,324,000. They also estimated that in 1976� 39% of each
visitor dollar was remitted back overseas (leakage) leaving 61% in
the Cook Islands as net export earnings, totalling an estimated
NZ$1,417 1000. (CITA Annual Report ·1977)
Although it is a policy of the government that tourism should be
of secondary importance to agriculture,
• • • without the same level of profitability in both sectors, there is a strong possibility that tourism wi 11 draw the scarce resources of 1 abor and government revenue that could ultimately be better used in agriculture. (Liew 1977:13)
l .6 Climate
Rarotonga has a tropical climate with discernable warm and cool
periods, having an equal length of six months each. The cooler
months from May to October are drier, with lower rainfall,
·temperatures. and humidity. and the warm season runs from November
to April. Although the mean maximum temperature only varies from

17
24.9° to 29.1°c, the mean minimum temperature drops to 18.4°C.
The cool season is most attractive to Australians and New
Zealanders wishing to escape the southern winter. The warm season
could be attractive to Northern American visitors during the
northern winter.
As climate plays an important part in the success of any tourism
industry, it should be noted that although statistical averages show
that the cooler months have lower rainfall and temperatures and
would therefore be the best climate months for tour.ists, the year
1977 was an exception, where rainfall ten times higher than the
average was expe1�ienced for the month of July. The cool season of
1978 was similar, indicating that there may be some climatic change
which could produce dissatisfied visitors.
1.7 Populatjon Dynamics
While the annual growth rate of the population of the Cook
Islands continued to increase from 1902 (the year the first regular
census of population was conducted) to a high of 2.061. in 1971, by
1976 this trend had reversed itself to a non-growth situation of
-3.19%. This was due to increased emigration attributable to easier
jet travel following the opening of the airport in 1974, and
decreased birth rate attributable to improved birth control
methods. In addition, the crude birth rate and the rate of natural
increase of population has been declining. (Cook Islands Census
1976)

18
Significant changes have al so been observed fo the distribution
of population amongst the islands during· the last two decades. In
1951, 40.1% of the total population was living in Rarotonga with
59.9% living in th.e outer islands. Since then, urban drift has
raised the population of Rarotonga to 54.1% of the total in 1976.
The dependency ratio, i.e., .the ratio of the population of the
non-ymrking age group to the population of the working age group,
was 95.0% in 1951, reaching a peak of 123.4% in 1966. The ratio
decreased steadily to 115.6% in 1976. This high dependency ratio
creates a burden on the economy in the short tenn.. {Cook Islands
Census, 1976)
The populations projected by the Cook Islands Statistics Office
for 1976 ranged from 20,529 to 23,049, but the population actually
dropped from 21,323 in 1971 to 18,128 in 1976. Cook Islanders are
New Zealand citizens and can move freely between the Cook Islands
and New Zealand, making population projections almost meaningless.
"The sudden loss of population has dis.torted all the norms necessary
for mathematical projections.". {Ibid., p. 18) However, development
activities in the Cook Islands and negative economic conditions in
New Zealand. may reverse the direction of migration so that the
growth of population is assumed to be moderate "with ups and downs
in between 10% of 20,000." {Ibid., p. 20)
The total population of the Cook Islands in 1976 was 18,128 of
which 9,294 (or 51.3%) were males and 8,834 (or 48.7%) were
females. Rarotonga, the capital island has a population of 9,802 or

19
54.a of the total and Aitutaki has 2,423. Of the total population,
91.5'.t were Cook Islands Maori, 3.5'.t were Europeans, while the rest
were mixtures of Cook Islands Maori and other nationalities. Of the
heads of families, 74.6% were married and 81.9% of the heads of
household were male.
1.8 Land Tenure and Political History
At the root of all land transactions is the principle that no
person can buy or sell land in the Cook Islands. Rights are passed
on through descent in lineages and land can only be alienated by the
lineages granting leases to non-members.
Land tenure, like other characteristics of a society, can be
affected by economic change brought about by tourism development.
Throughout hi story the Paci fie Isl ands have continually altered and
amended their land tenure systems, as a result of political, social
or economic change. Such change· in itself is not novel to society.
Rapid change, however, creates impacts that are not easily absorbed
by the affected society. In the process of modernization, change is
usually rapid, and in the case of tourism the impacts on the society
are profound.
In the Cook Islands, as in many Pacific societies, a person's
rights to use of the land is determined by descent. Land tenure can
be defined as
• • • the system of relationships between men in respect to land, a means of mediating man's total relationship to his environment. It is a system

of patterns of behavior that controls a society's use of its environmental resources. (Crocombe 1974:9)
20
In Rarotonga, the way in which society organizes itself socially was
and still is important in determining land use rights. The system
of social organization that existed at the time of European contact
is outlined by Crocombe (1964:25-32) and is shown in Figure 3.
Although many elements of this traditional system are still
applicable to Rarotonga today, the system has been modified to
accommodate some social changes.
At the time of European contact the island of Rarotonga was
organized in three tribal areas (Vaka). Each tribe had a high chief
(Ariki) with his subchiefs {Mataiapo) and lesser chiefs
(Rangatira). Although the members of the "Bounty" crew are said to
have discovered Rarotonga in 1789, it was not until 1827 that the
first mission was established there. This early contact period was
dominated by missionaries, followed by whalers and traders. Britain
declared the Southern Cook Islands a British Protectorate in 1898 in
response to rumors of French interest and in 1901 New Zealand
annexed the Cook Islands. (Crocombe 1964, Morrell 1960) After
annexation, the islands were administered by a New Zealand Resident
Commissioner until August 4, 1964, when the islands attained full
internal self-government under a new Constitution. Under this
arrangement, the Mew Zeal and Government has responsibility for
defense and external affairs, but the islands are internally
self-governing. At the advent of self-government, the Cook Islands

FIGURE 3 -- Traditional Social Organization R arotonga, Cook Islands
NAME OF HEAD DESCENT GROUP
ARI KI VAKA (High Chief). (Tri be)
MATAIAPO NGATI (Chief of Major (Major Lineage)
Lineage)
RANGATIRA, KOMONO NGATI (Chief of Minor
Lineage) (Minor Lineage)
KA ITO NGA TI (Head of Branch of (Branch of Minor
Mi nor Li n�age) Lineage)
METUA UANGA (Head of Household) (Extended Family)
UNGA PUNA (Corrmoner) (Nuclear Family)
Source; Crocombe, R.G. Land Tenure in the Cook Islands, 1964
21

22
Party was elected with a majority to form the first Cabinet under
the leadership of Sir Albert Henry, a charismatic Cook Islander who
had spent many years in New Zealand working with labor unions. Sir
Albert was Premier of the country for 13 years until he was ousted
in the election of 1978.
The Cook Islands Constitution did not provide for absentee
voters. There were many Cook Islanders resident in New Zealand who
were qualified as voters, but in order to vote they had to fly to
Rarotonga. This led to the charter of aircraft by both politcal
parties to fly their supporters to Rarotonga to cast their votes.
With the assistance of fly-in votes from New Zealand, Henry's party
actually won the March elections; however, further investigation of
the election results by the Electoral Court disallowed these votes
because of charges of conspiracy, bribery and misuse of public
monies. In.a landmark decision the Court on July 24, 1978, declared
these fly-in votes to be invalid so the then opposition Democratic
Party was duly elected. This was the first time in British
Commonwealth history that an electoral court's decision has caused a
change in government. The Democratic Party under the leadership of
the Prime Minister, Sir Thomas Davis, has administered the country
since that time. In the case of tourism, it has not changed the
policies initiated by the previous government.

•,
23
CHAPTER 2
THE R AROTONGA TOURIST INDUSTRY
2.1 The Role of Government
The beginning of the tourist industry in Rarotonga dates from
May 1968 when representatives of the New Zealand Tourist and
Publicity Department and Air New Zealand, at the request of the Cook
Islands Government and the Cook Islands Tourist Devel�pment Council,
prepared a report on which the future development of the tourist
industry has been based. One of the most important recommendations
contained in this report was that a Cook Islands Tourist Development
Authority be set up to plan for an integrated, efficient and
economical tourist industry. ( Ref. Tourist & Publicity Dept. of New
Zealand, 1968) This recommendation was adopted. The Tourist
Authority Act of October, 1968 provides for the establishment of "an
Authority to encourage the development of and administer the tourist
industry and to define the functions and powers of the Authority."
( Tourist Authority Act, 1968(1 )}
The goals and policies of the Cook Islands Tourist Authority as
stated by the Authority are:
Economic:
1. To develop and promote a tourist industry which will provide a catalyst to further economic deve 1 opment.

2. To utilize tourism as a means of ra1s1ng the standard of living and improving the quality of life of the people through increased employment and other economic benefits.
3. To ensure the widest distribution of economic benefits to local residents as opposed to the concentration of such into the hands of a few or largely foreign investors.
Social and Cultural:
l • To uti 1 i ze tourism as an incentive to make us become aware of who and what we are in terms of our culture, customs and traditions by:
Revitalizing and fostering our heritage and language as living elements which $trengthen our national identify; and
Exlpoiti ng the opportunities offered to rekindle and perpetuate our tradi ti ona 1
skills, arts and organizations.
2. To harmonize tourism development with maintaining the rel axed way of life unique to the Cook Islands.
3. To minimize the economic and social disparities and conflicts which may arise within the community by:
Creating a community awareness of the implications and impact of tourism; and
Creating a climate of self-help and equipping indigenous people to take advantage of the economic and social opportunities that will arise. (Cook Islands Tourist Authority, Philosophy, Goals and Poli�ies, 1974)
24
The Cook Islands Tourist Authority (CITA) was chartered to
handle promotion, licensing, regulation and control of all
accommodation and restaurants in the Cook Islands. CITA has a Board
consisting of the FinanciQl Secretary of the Cook Islands government

25
and five other irembers appointed by the Minister. of Tourism. The
Board is responsible for 1 icens i ng, ·maintaining standards of
accorrmodation and restaurants and discharging other responsibilities
defined under the Act. Figure 4 outlines the decision-making
process for these matters under the Act. Policy proposals must be
referred to the Board through t�e Minister of Tourism before they
can be submitted to the Legislative Assembly. (Liew 1977) In
addition to the governmental body, the private sector involved in
tourism formed the Cook Islands Visitors Association. in 1975 which
attempts to promote tourism and interact with the CITA for the
mutual benefit of the industry. However, their role and
contribution to the decision-making process has been limited and for
the most part has led to frustration and ineffectiveness on the part
of the Visitors Association.
The CITA also operates two trading facilities, the Banana Court
in Rarotonga, which is a bar/nightclub, and the Rapae Motel. which
is the only visitor accommodation facility on Aitutaki. Profits
from these commercial activities provide funds for CITA acti vi ti es,
supplementing the annual grant from the legislature of NZ$80,000 in
1976/1977 which increased to NZ$123,000 in 1977/1978. The tITA
controls all of its own financial affairs. Total revenues for
1976/1977 were NZ$344,400 and total expenditures were NZ$318,900.
New Zealand Government Aid provides for the employment costs of the
General Manager and has assisted in financing a new promotional
movie, a tourism facilities plan, and refurbishment of offices.
( CITA)

FIGURE 4.
PROCESS OF POLICY-MAKING AND IMPLEMENTATION : TOURISM
DEBATE/PASSED.+--���---,� LAW
SUBMISSION -- - COMMENT\(' DRAFT PROPOSALS
-- E'�E_C!l(l_N!, _ -7 MINISTER OF
TOURISM
REFERRAL__� ------
SUBMISSIONS
TOURIST : AUTHORITY I ACKNOwL EDGEMENTl'""PLEMENTAT!O,N
@M'MOO) �TORS
��I ATION
Source: Liew 1977
· SOCIAL
AND PHYSICAL
ENVIRONMENT
N
O"I

27
2.2 Visitor Arrivals
Until the opening of the international airport in 1974, the
number of visitors to Rarotonga was negligible. A 11 visitor11 is a
person who intends to leave the Cook Islands within 31 days from the
date of arrival. [This is the definition used by the Cook Islands
Statistics Office.] From 1966·through 1970, the total numbered only
2,016 visitors. After the commencement of jet service, the total
increased from l,776 in 1973 to 6,477 in 1974. The year 1975 shows
an increase of 59% over the previous year in visitor arrivals, for a .
total of 10,962. The next significant rise in visitor arrivals was
the year 1977, after the opening of the Rarotongan Hotel, an
increase of 58% over the previous year for a total of 14,584.
(Table 2)
The breakdown of visitor arrivals by country of origin for 1975
shows an unusual pattern. Although New Zealanders made up the
largest group of visitors ( 46.6%·), the greatest increase of visitors
from any one country was recorded by the French/Tahitians. (Liew
1977) In the period 1966-1970 they made up only 4% of the total
figure, but by 1975 their proportion had increased to 19.3%.
However, since that· year their numbers have been decreasing from a
high of l ,783 in 1975 to only 766 in 1977. The majority of
Tahitians that came to Rarotonga .,.,iere in tere (traditional social)
parties and many of them took advantage of the cheaper and better
mediccl and dental services available in Rarotonga. However, most
of them were housed and fed by relatives or at government expense in

Nationality
u.s.A
Australia
European
Cook Islands Maori
French
New Zealand
Others
TOTAL
Table 2 -- Visitor Arrivals by Nationality Rarotonga, Cook Islands
1975 Through 1978
1975 1976 1977 1978
361 404 890 1,805
327 327 1·,121 1,040
448 347 705 879
. 2,021 1,019 2,629 3,880
1,783 994 766 475
3,816 4,491 7,473 8,216
423 853 1,000 1,618
10,962 8,435 14,584 17,913
1979
1'231
525
962
*
526
9,490
l,023
13,757
* Not separated from New Zealanders in the most receot statistics. ** Total to September only.
1980
1,914
631
l·,212
*
1,441
9,135
1,184
15,517**
Source: Cook Islands Quarterly Stati stical Bulletin, 1977, 1978, 1979, 1980.
N co

29
community centers and did not use tourist accommodations.
The number of Cook Islanders living in New Zealand who return to
visit their friends and relatives increased from 2,021 in 1975 to
2,629 in 1977 with a decrease in 1976 to 1,019. These visitors do
not use tourist accommodations and it would be misleading to include
these figures and the totals for French/Tahitians in any projections
for accommodation and restaurant growth. At the present time, the
CITA does include these visitors in their totals, thus distorting
visitor volumes.
The greatest numbers of visitors for the years 1975 to 1977 have
been Mew Zealanders. Their numbers have increased from 3,816 in
1975 to 7,473 in 1977 showing a growth rate of 51%.
Also, a substantial growth in total visitors from the United
States, Australia, Britain and other countries can be observed in
Table 2. In 1978 the volume increased to a high of 17,913 (Table 2)
with an increase in the number of visitors from the United States,
New Zealand and returning Cook Islanders.
The CITA projected total of 20,000 visitors in 1980 with 15,517
reported for the first three quarters of 1980. It was projected
that 150 addi ti ona 1· hote 1 rooms would be necessary to accommodate
this volume. However, occupancy rates have been low, except for
seasonally high periods. Although the government agreed not to
issue any more hotel licenses until the 11Rarotonga11 Hotel became
profitable, it may have to reassess this position. As a first step
in this direction, the CITA commissioned a study by planners and

30
architects in New Zealand to evaluate the additional needs of
tourists and to establish guidelines for the future development of
the industry. The study was to determine what additional
tourism-related facilities should be provided and to identify
existing facilities that should be further developed or modified on
the islands of Rarotonga and Aitutaki. Their report, just recently
released, makes recommendations on overall goals for the future of
the tourism industry and suggests objectives and policies which
might assist in achieving these goals. (JASMAD 1978)
The consultants recorrnnend a cautious approach to growth in
tourist faci 1 iti es. Increased emphasis on the management of
existing resources through promotion of off-peak periods and a
limited expansion of accorrunodation was proposed.
2.3 Seasonality and Length of Stay
As in rrost tou·rism centers, visitor arrivals are seasonal. The
peak season is from May until August, which coincides with New
Zealand school holidays in May and August and surrrner vacation for
travelers from the northern hemisphere. Another peak period is
December and January during the Christmas holidays. The highest
number of visitors in one. given month was 2,200 in December 1977.
However, again ohe must be cautious in interpreting this figure as
this is a period when many Cook Islanders return to visit relatives.
This pattern indicates low visitor periods from February to May
and August to December._ According to Liew (1977) if the North

31
.American market is to be encouraged to ease this low occupancy
period, the Cook Islands tourist industry· must promote travel to the
islands during the American winter months in order to maintain year
round capacity. Also, promotion of summer holidays in the Cook
Islands during the Australian and New Zealand summers should be
carried out. In addition, . off-peak package holidays and
enc9uragement of conventions could help to solve the off-peak
seasons. (Liew 1977)
Length of stay in the Cook Islands tends to vary with the season
and purpose of the visit. For holidays, the. average length of stay
is 12.26 days in the third quarter of the year but only 6.96 days in
the fourth quarter of 1975. (Li e'i'J 1977) The average 1 ength of stay
for 1976 was 10 days. (CITA 1976) However, the 11Rarotongan11
Hotel's average length of stay figure for the financial year ending
March 1978 is only 3.53 days. Clearly these figures must be
computed again to give a more reliable figure. The CITA estimates
that the average 1976 visitor expendi.ture per person was NZ$227 and
the total visitor expenditures was NZ$2,250,000. (Ibid.)
2.4 Touris� Transportation and Accommodation
There are now two domestic airlines within the Cook Islands with
air links between Rarotonga, Aitutaki, Mitiaro, Mauke, Atiu and
Mangaia. These airstrips are relatively new and have considerably
improved transportation and communications among the isl ands of the
southern group. The two airlines are Cook Islands Airways, owned

32
jointly by Air New Zealand and the Cook Islands Governr.ient, and Air
Rarotonga, a small privately owned commuter airline established in
1978. The fleets of both airlines are limited, consisting of two
Norman Isl anders and one Cessna respectively. Schedules are al so
limited.
As the main ioode of tourist transportation within the Pacific is
air transport, the current air-networks both reflect and determine
the visitor grov1th potential for any Pacific destinations. (Peters,
1969) Rarotonga has the least advantageous position ip terms of air . .
connections in relationship to tloumea, Nadi, Pago Pago, Papeete and
Honolulu, due to the relative distance and isolation from the four
origin centers, Brisbane, Sydney, Auckland and Los Angeles. (Liew
1977)
At present there are seven i ncomi rig i nterna ti ona l flights to
Rarotonga each week; five of these are Air New Zealand's O.C.81s,
one is their o.c.10·, and one is a flight by Polynesian Airlines from
Western Samoa. The total seating capacity per week is 814.
Additional O.C.10 flights are operated to cater for seasonal peak
periods (such as Christmas holidays), but the full potential of this
aircraft cannot be realized as the runway is not long enough to
allow for full payloads to ·be carried. The Cook Islands Government
has agreed to ari · extension of the runway and, subject to 1 anding
right agreements, the Cook Islands could become more directly
accessible to tourists from North and South America and Australia.
(JASMAD 1979)

33
Tourist accommodation in the Central Pacific· Region as a whole
has been increasing steadily over the last ten years. Improved and
new air routes and air fares have contributed to this expansion and
in some countries this has been substantial. Some places such as
Fiji (3,316) and French Polynesia (l ,900) have large numbers of
tourist units, other smaller countries like the Cook Islands,
American Samoa and Tonga have less than 300 units each. (1976
figures) Ha\\laii is in a category of its own with over 44,000
units. (See Table 3) Correspondingly, the number of visitors
varies from a little over 8,000 in American Samoa and the Cook
Islands in 1976 to over 3 million in Hawaii. (Table 4) However,
the Cook Islands an_d American Samoa show a great increase in
tourists with a growth rate of 58% and 450% respectively from 1976
to 1977. This was due in part to the opening of the new resort
hotel in Rarotonga and to improved airline schedules.
In 1971 there were only f our hotels and motels with a total of
38 rooms in Rarotonga and a total of only 979 visitors. (Table 5)
By 1978 there were 13 hotels and motels with 282 rooms and
approximately 15,000 visitors, showing a growth rate of 30% in the
number of .tourist accommodations and 150% in the number of
visitors. However, facilities for tourists on Rarotonga are still
limited. There is only one large international standard resort
hotel, the "Rarotongan" with 151 rooms. Another hotel has 40
rooms. In addition, there are eleven small motels ranging in size
from two rooms to four rooms, giving a total room count of 282.

"
Table 3 -- Central Pacific Region Number of Tourist Units by Country
1976 anq 1977
Country 1976
American Samoa 195
Cook Islands 149
Fiji 3,316
French Polynesia 1,900 {projected)
Hawaii (United States) 44,093
Tonga 170
Western Samoa n.a.*
*n.a. = not available.
Source: Reid-Ross, unpublished data.
34
1977
202
252
3,316
n.a.*
' 46,048
260
300

Table 4 -- Number of Visitors by Country in the Central Pacific Region
1976 and 1977
Country 1976
American Samoa 8,266
Cook Islands 8,435
Fiji 168,665
1977
37 ,872
14,584
173,019
Hawaii (United States) 3,220,151 3,400,000
Tonga 52,312a 55,ooob
Western Samoa 26,563 28,012
a. Of this total, only 9,312 are "air visitors" who use accomodations; the remainder are "c r uise ship visitors."
b. Of this total only 11,000 are "air visitors."
Source: Reid-Ross, unpublished data. Cook Islands Statistical Bulletin.
35

Year
1971
1972
1973
1974
1975
1976
1977.
1978
Source:
Table 5 -- Number of Hotels/Motels, Rooms, and Visitors
Rarotonga, Cook Islands 1971 - 1978
Number of Number of Number of Hotels/Motels Rooms Visitors
4 38 979
4 35 1,032
7 65 1,.776
9 93 6,477
10 103 9, 114
13 115 9,898
13 211 14,728
14 282 17 '193
Cook Islands T�urist Authority.
36

37
(Table 6) The 11Rarotongan11 has the most facilities and amenities
with three bars, hm restaurants, a shop, a convention room and
recreational facilities. It is owned jointly by the New Zealand
Tourist Hotel Corporation, Air New Zealand, and the Cook Islands
Government.
Although occupancy rates for all hotels and motels are not
available, the average room occupancies for the two larger
establishments, the Rarotongan Hotel and Trailways Hotel are
av�ilable through March 1978. The Rarotongan's first month of
operation was May of 1977. It is apparent that the highest
occupancy rates, approximately 72% to 87% correspond with the peak
visitor arrival period. (Figure 5) However, the trough periods
show a low of 40% for December 1978. Harris, Kerr Forster & Co.
{1960, p. 10) generally recognize a 70% occupancy level as one below
which earnings are depressed and unacceptably high charges must be .
levied to maintain profitability.
P1anning and deve1opment of future accommodation are presently
under review, as previously stated. The 1979 JASMAD report, just
released, recommends another hotel on Rarotonga located in the main
town of Avarua with 100 rooms, a swimming pool and conference
facilities. The next resort hotel is recommended to be located at
Matavera, a more rural setting at the opposite side of the island
from the 11Rarotongan,11 and it is proposed that this should include a
nine-hole golf course.

Table 6 -- Number of Rooms, Beds and Rates by Visitor Accommodations Facility
Rarotonga, Cook Island$ - 1979
Fae i1 i ty Number Number of Rooms of Beds
Ace Motel 5 10
Arii Bungalows 3 6
Arorangi Beach Hotel 20 40
Arorangi Lodges n.a.* n.a.*
Edgewater Motel 24 48
Kii Kii Motel 12 24
Little Polynesian Motel 9 18
Moana Beach Motel 3 6
Orange Grove Motel 2 4
Puaikura Reef Lodges 4 16
Punamaia Motel 6 12
Rarotonga Resort Hotel 154 211
Trai 1 ways Hote 1 40 80
TOTAL 282 531
*n.a. = not available
Source: Cook Islands Tourist Authority.
38
Rates NZ$
$14-16
16-20
21-29
n.a.*
18-28
15-20
16-22
16-20
12-14
20-30
16-20
30-45
19-24

FIGURE 5.
90
80
RAROTONGA - AVERAGE ROOM OCCUPANCIES FOR
TRAILWAYS and RAROTONGAN HOTELS
(40 and 103 rooms respectively) 1977 - �978 Financial Year
70 ,__
60
50
10
-
-
April May ..lne July Aug Sept Oct Nov Dec Jan Feb March 1!m MONTHS 1978
Scuce : Derived from :ntonnatioo supplied by Trailways and Rarotongan Hotels • JAS-14.D 1978 Note: (1) April 19n occupancy for lfailways only as May 1m was the Rarotongan Hotel's first full
month of operation _ (2) Rarotoogan Hotel figures are adjusted ID correspond with ltailway Hote!S 4 or 5 week mooths
39

40
It is felt by CITA that there is an over-abu.ndance of units in
the small motel category (Liew 1977) and· further motel development
will be restricted to the following types of development (in order
of priority):
l. Expansion of existing motels to achieve a more
economically viable seal� of operation;
2. New projects initiated by local Cook Islanders and
residents; and
3. New projects initiated by non-residents in p�rtnership
with Cook Islanders having substantial. financial
interest in the project.
CITA stresses the need to control physical planning and location
of future hotel development. They would like to designate and
develop planned resort regions where hotels and motels are grouped
in close proximity to each other. The aim is to prevent scattered
location of facilities in order to protect the limited physical
assets of Rarotonga, especially beaches, and to be able to provide
for infrastructure more economically. (Ibid.) It is explicitly
stated that "no further development should be encouraged or
permitted outside such designated hotel zones." (CITA 1974:5.7)
The new hotels recommended by the consultants appear to be in
conflict with this policy. It appears that one of the criterion for
locating the next resort hotel at Matavera is the availability of
sufficient land for a golf course. An intensive study of

41
agricultural use of land on the whole island was done by the
consultants and they felt that this would be the development site
that would least affect the most productive agricultural lands.
(JASMAD 1978) The whole question of land use is a very delicate
subject in the Cook Isl ands. It should be noted that there is no
zoning and government has yet to impose contro 1 s over 1 and use.
There is much opposition to land use controls by government as this
has always been the prerogative of the chiefs and members of the
lineages. Any proposal for controls would meet with heavy
opposition at the present time.
No plans have yet been made for the development of tourist
acti vi ti es in the outer isl ands except for Ai tutak i. However, one
motel already exists on each of the islands of Aitutaki, Atiu and
Mitiaro and the recent report recommends that urgent attention
should first be paid to improving the existing motel on Aitutaki
before considering further accommodations for that island. A stated
policy of CITA is " . • • to promote increased economic activity in the
outer islands as a means of stemming excessive migration." (CITA
1 974: 5 .8)
2.5 Ownership of Hotels a�d Motels
In spite of a policy that states that one of its long-term goals
is to "ensure the widest distribution of economic benefits to local
residents as opposed to the concentration of such into the hands of

42
a few or largely foreign investors" {CITA 1974:2)., an assessment of
ownership of accommodation facilities indicates a different result.
CITA also has a development strategy that will
• • . minimize excessive foreign investment control as well as to ensure a wider distribution of investment opportunities {amount) to Cook Islands residents, the Zealand/Cook Islands hotel joint venture is to be utilized as the means of providing the bulk of accommodation needs." {CITA 1974:4)
The distribution of ownership of hotels and motels on Rarotonga
shows that only five establishments of the total of thirteen are
100% owned by Cook Islanders. {Table 7) These. are the small
motels, ranging from two to a maximum of twelve rooms. The four
large hotels are owned by foreigners, primarily New Zealanders and
Australians. The one large resort hotel has partial Cook Island
ownership, with one-third being held by the government. It was
i�tially proposed.that part of this shareholding would be offered to
Cook Islanders as an investment but as yet this has not been done.
With the recent change in government it is questionable whether this
plan will be initiated.
Ownership of other tourism-related businesses shows a more
encouraging .situation. Of the gift shops, duty-free shops, tourism
clothing shops, and restaurant/bars, only two {duty-free shops) have
majority foreign ownership. However, of the six transportation and
tour companies, only one is owned 100% by Cook Islanders, the
remaining five having majority foreign ownership. {Table 8)

43
Table 7 -- Ownership of Hotels/Motels Rarotonga, Cook Islands -1978
Name
Ace Motel
Arii B ungalows
Arorangi Beach Hotel
Arorangi Lodges
Edgewater
Kii Kii Motel
Little Polynesian Motel
Moana Beach Motel
Orange Grove Motel
Puaikura Reef Lodges
Punamaia
Rarotongan Resort Hotel
Trai lways Hotel
Source: Public Records.
Number of Rooms
5
·3
20
24
12
9
3
2
4
12
154
40
Ownership
100% Foreign (New Zealand)
100% Cook Islands
100% Foreign (Australian)
100% Cook Islands
100% Foreign (�ustralian)
100% Cook Islands
100% Cook Islands
501/50% New Zealand/Cook Islands
100% Cook Islands
100% Cook Islands
100% Foreign (Australian)
66.66% Foreign (New Zealand) 33% Cook Islands
100% Foreign (New Zealand)

Table 8 -- Ownership Distribution of Tourism Facilities Other than Accommodation
Rarotonga, Cook Islands - 1978
Transportation & Tour Companies
Gift Shops
Duty-Free Shops
Tourism Clothing Shops
Restaurants/Bars
Source: Public Records.
Joint Venture (Majority Foreign Owned)
5
0
2
0
0
100'.t Cook Islanders
1
3
6
.3
3
44

CHAPTER 3
TOURISM'S CONTRIBUTION TO EMPLOYMENT
3.1 Features of Tourism Employment
45
The development of a tourism industry is often promoted in a
developing country as one of the best ways of providing much needed
employment for local people. Furthermore, employing local people in
the industry, it is maintained, is one of the impor;tant ways for
intercultural exchange to take place between residents and the
visitor.
There are several categories of employment in tourism: primary,
secondary, and tertiary. Primary employment includes those persons
working in establishments that are directly supported by visitor
expenditures; secondary employment includes those persons employed
in support industries where employment is generated by visitor
expenditures; and tertiary employment includes employment created by
th.e special needs of the visitor. The airport personnel,
transportation employees and hotel workers are usually the first
contact that a visitor has with the people of a country. In
addition, the jobs created by the industry idealistically allow the
local people to improve their skills and education, find satisfying
work, earn a good income, and generally improve their standard of
living. Where tourism development accomplishes this, it certainly
is a desirable fonn of economic development. However, there has

46
been some indication that tourism development does not always create
the best employment opportunities for local people.
The tourist or visitor industry is one that demands services for
the visitor. These services can be divided into several major
categories including transportation, lodging, food and beverage,
merchandising, recreation and. entertainment, and repairs and
maintenance. In addition there are indirect services which support
the industry operators. Although short term in nature, another form
of tourism-generated employment is the construc,tion industry
concerned with hote 1 , restaurant and other tourism f ac i 1 i ty
development. (Kenney, 1977}
The effect of the_ tourism industry on employment can be analyzed
on at least two general levels: the number and type of jobs created
and the labor-intensiveness of the industry per dollar invested.
(Ibid.} The focus of this study wi 11 be on the number and type of
jobs created but it is also important to pay some attention to the
labor-intensity issue.
The several categories of employment that are generated by
tourism are:
1. Pri.mary Hotel Employment: This includes all employees working in hotels whether they be managers, accountants, cooks/chefs, receptionists, dining room workers, gardeners and maintenance ·workers, housekeeping, and others employed directly by visitor hotel expenditure.
2. Primary Employment Other than Hotel Employment: This includes travel agents, transportation companies, tour

guides, gift shop employees, entertainers, craftsmen, laborers, and others who are employed directly by the visitor industry other than hotels.
3. Secondary Employment: This is indirect employment and includes employment generated by support industries other than direct employee industries. This would include laundry services, food suppliers, maintenance for equipment, recreational equipment and supplies.
4. Tertiary Employment: These are other jobs created by the indirect needs of the visitor and the employees and would include teachers, doctors, retail workers.
47
This study will describe tourism employment in Rarotonga in
terms of categories l and 2, primary hotel employmer.it and primary
employment other than hotel.
Several studies of tourism employment have been completed in
recent years. Samy's case study of employment patterns in one
resort hotel in Fiji demonstrates how mass tourism affects the
division of labor in the host country. He found that employment of
local people in the industry was minimal and based on racial
prejudice and stereotypes, allowing indigenees to be employed only
in the menial jobs. (Samy 1972)
According to Samy, the tourist industry in Fiji has suffered
much criticism. Especially prevalent is the feeling that tourism
does not economically benefit the people of Fiji nearly as much as
is claimed by the gover·nment. In addition, concern has been
expressed for the way in which 11 • • • tourism exploits, dehumanizes and
dislocates local life, as well as developing envy and resentment in
the local population.11 (Samy 1975)
Robineau (1974) found· that a similar situation exists in Tahiti

48
where the lo.cal people hold only the lowest employment positions.
He calls for a "unique Polynesian tourism formula" that could serve
both the needs of the tourists and involve the Tahitian people in
investment and higher-paying jobs.
Merrill (1974) did an analysis of hotel employment in Hawaii,
taking into consideration the number of employees per hotel room,
sex, age, head of household, part-time ratio, wages and several
other characteristics. He found that in five of the six hotels
surveyed , the sex distribution was 53.3% fema.le. (Merrill
1974:147) This was one of the most significant factors affecting
both the nature of hotel employment and the effects of this
employment on the CO!l)ITIUnity. Females were found to be dominant in
the housekeeping departments and front office, while males dominated
management and maintenance departments, with both males and females
participating equally in the accounting and food and beverage
service departments. Age was also an interesting variable,
indicating that hotel employment attracted the young male in his
early twenties who then moved on to another occupation. The female
profile showed a frequency of females in their early twenties,
tapering off between 25 and 35 years of age, then an increase
between 35 and 55. (Ibid .)
The State of Hawaii in its State Tourism Study (1977) assessed
tourism employment in the state. The purpose of the Manpower
Element of this study was to collect and analyze data regarding
employment in the visitor industry, employees and training programs

in the industry.
kind of jobs in
49
The three major components were an analysis of the
the visitor industry; the characteristics of
employees working in the industry; and an inventory of training and
educational programs that are available to current employees and
others seeking employment in the industry. In addition, a manpower
simulation model was designed to provide information on the future
level of employment in the visitor industry by detailed occupational
classifications for the state as a function of alternate scenarios,
which were designed in part to take into account the .numbers and
types of visitors that visit the state and future government
policy. (OPED, 1978)
The employment profiles disaggregated total employment in a
given industry into standard occupational classifications as used by
the U.S. Department of Commerce, Bureau of the Census. The major
occupational classifications used in constructing the profiles
included: professional, technical and kindred; managers and
officials; sales workers; operative; service workers; clerical
workers; and laborers.
A manpower survey was conducted to gather data on age, sex,
marital status, number and age of dependents, citizenship, length
of residence, location and· type of housing, education, compensation,
additional jobs, attitude towards job and future expectations. A
sample was drawn from hotel employees and employees of other visitor
related industries and interviews were conducted with individual
employees in person or by telephone. The total number of employees

50
interviewed was 993. Preliminary estimates of the number of
individuals directly employed in the 'industry is approximately
65,000 persons. Using this figure, the survey sampled approximately
1.5% of the visitor industry employees. (Ibid.)
The results show a profile of the employees in the aggregated
visitor industry. Fifty-eight ,percent of all employees in the
indystry are female. This is in contrast with the male-female ratio
for the whole economically active population which is primarily male
(59%). (Ibid.) There is a slightly higher proportion of single
people employed in the visitor industry than in the total labor
force. Ethnically, Caucasians represent the largest percentage of
visitor industry emp1oyees (31%) and Japanese account for 20% of
tourism employees. Fifty percent of the industry employees are
below the age of 30, and 29% are under the age of 25. This
indicates that the industry .employees are young compared with the
total labor force. However, the industry employees are better
educated than the total labor force. Those holding full-time jobs
represent 77% of total industry employees, and the median weekly
income category for the average visitor industry employee is
$126-$175 p�r week. (This figure is not known for the total
employees in the State and a comparison was made on the basis of
annual household income where median household income for the
visitor industry was $14,000 per year, while the same figure for the
whole State was $15,770). (Ibid.) Fifty-eight percent of all
industry employees fell into or below the $126 - $175 per week

51
category. (OPED, 1977)
In a survey of tourism employment in Guam, it was found that the
industry employs a total of 5,816 persons, including 5,219 on a
full-time basis and 597 on a part-time basis. (Warner 1978) Of the
total number of employees, 4,728 were U.S. citizens and permanent
residents and 1,088 (or 19%) were non-immigrant aliens. The total
represented 32% of the 18,100 employees in private employment.
(Ibid.) The study also gathered data on payrolls, taxes and total
investment. It did not, however, consider the ,sex., age and
nationality distributions or the wage and salary ranges.
The island of Guam in the northern Pacific, with a population of
105,000, has been developing a tourism industry over the last 10
years. Visitor arrivals totalled 201,344 in 1976 and were expected
to reach 285 ,000 in 1978. At the present tirr.e Guam has only two
substantial "basic" industries, the U.S. military and tourism.
Another employer is the Government of Guam. In 1970, 6.4% of the
total population was employed by the government. The researchers
found that the visitor industry was directly and/or indirectly
responsible for approximately 7,000 private and public jobs, or 22%
of the total employment on Guam, based on an employment multiplier
0 f 1. 18. (Ibid. , p. 60)
Le Fevre (19i5) estimated that employment created as a result of
the expansion of the tourist industry in Rarotonga would be 985
jobs, with the largest single increase projected to be in the
wholesale, retail, hotel and restaurant sectors. He calculated that

52
a total of 202 beds (the figure projected for 1976) would provide
employment for 350 people, or approximately 1.7 persons per hotel
room. However, he does not specify whether this is primary direct
employment only or whether this figure includes indirect employment
also. He also predicted that the number of skilled people would not
exceed 25 persons, with most emp 1 oyment opportunities to be at the
lower income and unskilled worker level. (Le Fevre, 1975)
Concern was expressed over the rapid increase of migration of
Cocik Islanders to New Zealand after the opening of the international
airport. Tourism employr.ient was looked upon as one possible way to
halt this migrati_9n by providing better paying jobs. Le Fevre
suggested that on the negative side of the "Economic Balance Sheet, 11
competition for scarce skilled labor between the tourism and
agricultural sectors or tourism and· government service might
develop. (Ibid.) Since Le Fevre's pioneering and original work, no
further studies of tourism employment in Rarotonga have been done
until this time.
3.2 Objectives and Survey Methodology
The primary objective of this study is to assess the manpower
situation in the visitor -Industry by collecting and analyzing data
regarding employment. Specifically, certain characteristics are
investigated including types of occupations, sex, age, the part-time
ratio, nationality of employees, salaries and wages, seasonality,
and students' and residents' attitudes toward employment in the

53
tourist industry.
Since very little data exist on tourism employment in
Rarotonga, it was decided to investigate several possible sources
fo·r the data required.
1. Research into several publications and unpublished
material revealed some data on general employment on
the island.
2. A survey conducted by the researcher in June 1977 of
managers of all hotels/motels and other
tourism-related industries provided some of the needed
data. The respondents for this survey were all
managers of industries in direct hotel employment, and
direct employment other than hotel. This was done by
a process of personal interviews. The size of the
total population was 36.
3. A survey of the total high school population of
students in their 1 ast and second to 1 ast years of
school was also conducted by the researcher in June
1977. A questionnaire was used to collect data on
students' attitudes toward future employment in the
industry, skills, training, and other important data
to be used elsewhere. This was administered by
teachers in the classroom after a pre-test.
(Appendix) The total population of the sample was 116.

4. Interviews were held with tourism officials, including
hotel managers, the general manager of the CITA, and
the Minister of Tourism to determine skills required
and the availability of training and education. These
were done in August of 1978.
3.3 Results of the Study
54
During July 1977 and August 1978 a survey of all tourism-related
businesses on Rarotonga was carried out by the researcher. Personal
interviews with the managers of all hotels, motels and other
related industries were conducted using a simple questionnaire
{Appendix I) and a loose guide. A total of 36 establishments were
interviewed with a 100% response rate. All were most cooperative
and willingly participated, except for the laundry which refused to
participate in the survey.
A classification of all establishments follows:
I. Primary Hotel Employment: This included 10 hotels and
motels and the different occupations within this
sector. {Table 9)
II. Primary Employment other than Hotel Employment: This
included ground transportation companies and airport
operations, food and beverage establishments {other
than hotel), merchandising companies, and the national
tourist organization, the CITA. {Table 9)
It was found that tourism employed a total of 464 persons on a

Table 9 - Tourism Employment Showing Occupations Rarotonga, Cook Islands - 1978
1. Primary Hotel/Motel Employment
Administration Accounts Management Trainees Reception/Front Office Tour/Activities Desk Store Band Gift Shop Maintenance/Industria l Hairdresser Porter/Security Dining Room Bars Garden Kitchen Housekeeping Chefs/Cooks
2. Primary Employment Other Than Hotel/Motel
Travel Agencies Transportation Gift Shop Employees/Craftsmen Entertainers Duty Free Shops Restaurants/Bars Air Transportation National Tourist Organization
Source: Empl9yment Survey
55

56
full-time basis and 26 on a part-time basis. The majority of the
employees worked in the accorrmodation and air transportation sectors
(approximately 78%) with merchandising employing 12% of the total.
(Table 10) Tourism employed 13% of the total economically active
population of Ra rotonga, while the government emp 1 oyed l , 627 or 46%
of the total. (Statistical Abstract 1979) (Table 11) On the other
hand, agriculture and fishing employed only 7% of the economically
active population. It should be noted that this figure should be
higher because of the number of subsistence agricultural workers who .
are not included in this figure.
The study revealed employment patterns of the tourism industry
in Rarotonga and these will be considered next.
Sex: It has been found in other areas that an important
character of the hotel industry is that it provides a larger
population of jobs for women than other industries. Merrill (1974) .
and Samy (1972) found this to be· true in their studies of hotels in
Hawaii and Fiji respectively. This study collected data not only
fr:-om the hotel industry, but al so in primary employment other than
hotel. In the total industry as a whole, more males (281) than
females (183) are employed, although in hotels and motels only the
opposite is true, thus supporting the findings in Hawaii and Fiji.
However, it should be noted that the difference is not great. Out
of a total of 197 persons employed in the hotel and motel sectors,
81 were males and 116 were females. (Table 12) Thus, it is
apparent that the industry as a whole contributes largely to the

I.
I I.
Table 10 - Primary Tourism Employment Rarot onga, Cook Islands - 1978
Primary Employment Full-Time
Accorrmodation 197
(Hotel & Motel)
Other:
Transportation & 25
Travel Agencies
Air Transportation (Including Airport Operations)
165
Food & Beverage 14
(Other Than Hotel)
Merchandising 58
National Tourist Organization 5
TOTAL 464
Source: Employment Survey
57
Part-Time
16
9
l
26
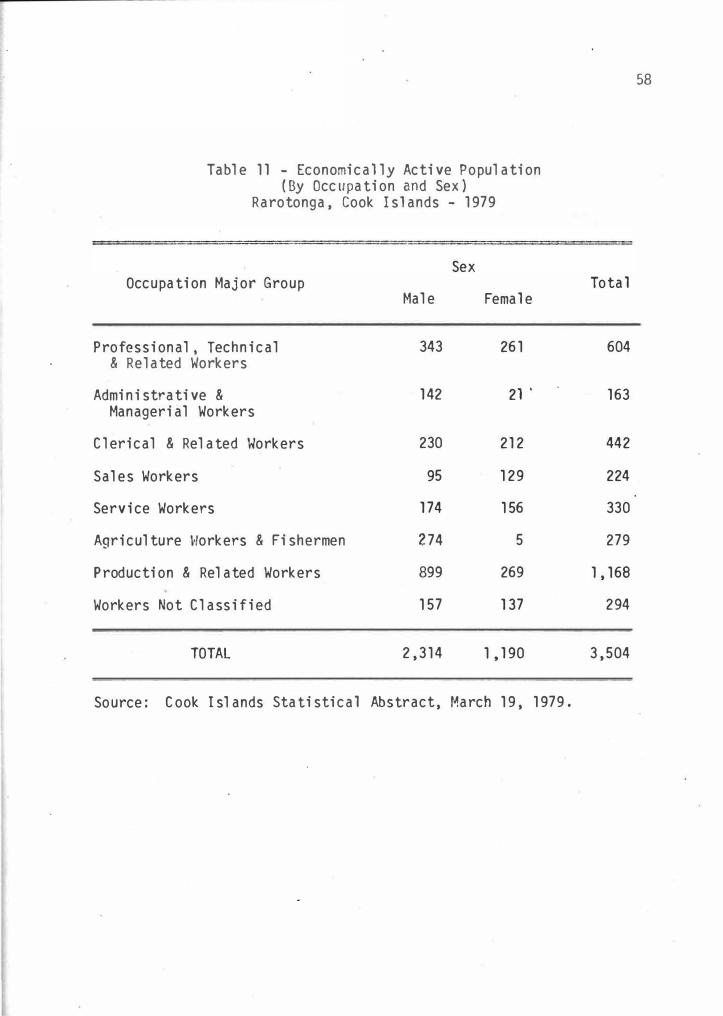
Table 11 - Economically Active Population (By Occupation and Sex}
Rarotonga, Cook Islands - 1979
Sex Occupation Major Group
Male Female
Professional, Technical 343 261 & Related Workers
Administrative & 142 21 . Managerial Workers
Clerical & Related Workers 230 212
Sales Workers 95 129
Service Workers 174 156
Agriculture Workers & Fishermen 274 5
Production & Related Workers 899 269
Workers Not Classified 157 137
TOTAL 2,314 1 ,190
Source: Cook Isl ands Statistical Abstract, March 19, 1979.
58
Total
604
163
442
224
330
279
1,168
294
3,504

-
Hote 1 s
Table 12 -- Total Primary Tourism Employment by Sex Rarotonga, Cook Islands - 1978
Facility Male Female
and Motels 81 116
Other (Air & Ground transportation, 200 67
Source:
Food & Beverage, Merchandising, �Jational Tourist Organization, Airport Operations)
TOTAL 281 183
Employment Survey
Table 13 -- Pri mary Employment - Hotel/Motel Distribution by Age
Rarotonga, Cook Islands - 1978
Under 20-35 36-50
59
Total
197
267
464
Facility 20 Years Years Years Total
Hotel A 35 73 18 126
Hotel B 3 21 8 32
Hotel c 15 10 21
TOTAL 38 120 39 197
Source: Employment Survey.

60
main household income earner; i.e., the male.
Age: Merrill's study in Hawaii (1974) demonstrated that age is
also a significant factor in hotel employment. In Hawaii, young
males and females in their early twenties are predominant as are
females in the middle age group. In Rarotonga, the majority of
hotel and motel employees are in the 20-35 year age group (61%)
(Table 13) with a sma 11 er number in the under 20 year group ( 19%}
and 39 persons in the 36-50 year group (21%}. Data on age for the
"Other" category {air and ground transportation, .merchandising,
travel agencies, etc.} were not available.
Part-time Workers: In Hawaii the part-time worker is defined as
a person employed for less than 80 hours a month. (Kenney, 1977}
It was found that part-tir.ie jobs comprised 20% of all hotel jobs on
the neighbor islands of Hawaii. (Ibid.} In Rarotonga part-time
employment is not of major significance with only 27 people employed
on this basis and only in the·accommodation and airline sectors.
More females than males are employed on a part-time basis· and are
mqstly Cook Islanders. (Table 14)
Nationality and Salaries: It was found by Samy (1972} and
Robineau (1974) that ethnic background or nationality was a very
important factor in job distribution in hotels in Fiji and Tahiti
{respectively}. Non-nationals usually held the higher skilled,
better paying occupations while the nationals were employed in
unskilled, lower-paying positions. The same pattern exists in
Rarotonga in the hotels and motels where expatriates occupy the

-
Table 14
Nationality
Cook Islanders
New Zealanders
Sex
Male
Female
Source: Employment
Total Part-Time Primary Tourism Employment By Nationality and Sex
Rarotonga, Cook Islands - 1978
Hotels/ Motels Airlines Total
15 11 26
1 1
27
4 2 6
12 11 23
29
Survey.
61

62
administration, accounts, gift shop, and chef/coqk positions, while
tHe Cook Islanders occupy the dining room, housekeeping, kitchen,
porter/security, and reception positions. {Table 15) However, of
the total industry, the great majority of employees are Cook
Islanders (383 or 83%), while non-nationals make up only 81 or 17%
of the total. (Table 16) The salaries also reflect a disparity.
In the major hotel, where the majority of non-nationals are employed
in New Zea 1 and to fi 11 top pos i ti ans, they are hi red on a New
Zealand salary scale which is considerably higher .than the Cook
Island scale. The salaries for this group range from tJZ$5,000 to
NZ$14,000 and in addition special allowance is made for housing and
moving expenses. (Table 17)
Cook Islanders are employed on a local wage scale which ranges
from $1,352 to $5,720. It must be pointed out, however, that all
e·mployees in the hotels were paid above the minimum wage of 65 cents
per hour in 1977. {Table 18)
In Hawaii the general level of tourist industry wages \'tas found
to be lower than all other major industries. (OPED 1972, p. 80)
This does not appear to be the case in Rarotonga. Many wages and
salaries are based on the public service equivalents and others· are
based on the minimum wage. It was difficult to collect firm data on
wages from the ground transportation and travel agencies,
merchandising, and food and beverage (other than hotel)
establishments as they were reluctant to part with this
informa tion . However, the air7ines show a sa7ary range of NZ$13,000

Table 15 -- Primary Employment - Hotel/Motel Distribution by �Jationality & Occupation
Rarotonga, Cook Islands - 1978
Cook New Occupation Isl anders Zealanders Other
Administration 4 9 l
Accounts 1
Management Trainees 2
Reception/Front Office 15 1
Tour/Activities Desk 1 1
Stores 2 --
Bank 3
Gift Shop l
Maintenan ce/Industrial 5 l
Hairdresser 1
Porter/Se curity 14
Dining Room 36 1 1
Bars 11 1
Garden 7
Kitchen 14
Housekeeping 36 1
Chefs/Cooks 6 1 5
SUB-TOTAL 157 16 9
Sma 11 Mote 1 s 13 2
TOTAL 170 16 11
Source: Employment Survey
63
Total
14
1
2
16
2
2
3
1
6
1
14
38
12
7
14
37
12
182
15
197

Table 16 -- Total Primary Tourism Emplyment b y Na ti on al i ty
Rarotonga, Cook Islands - 1978
Na tiona 1 i ty
Cook Islanders
New Zealanders
Other
TOTAL
Source: Employment Survey
Total
.
383
63
18
464
64

--
65
Table 17 -- Foreign Hotel Employees Showing Age, Nationality and Salary
Rarotonga, Cook Islands - 1978
Age Nationality Salary Range
35 New Zealand NZ$ 10 ,500
26 New Zealand 8,500
32 New Zealand 8,000
24 New Zealand 5,000
50 British 14,000
32 Scotti sh 10,500
34 German 10,000
24 German 10,000
28 British 10 ,000
29 Finnish 7,500
37 Australian 8,000
24 New Zeal and 7,000
27 Swiss 7,000
30 New Zeal and 9,000
31 British 5,500
Source: Employment Survey

Hotel Hotel A B
10 --
56 16
21 3
9 2
7 --
1 --
5 1
1 2
2 --
1 --
6
Table 18 -- Primary Tourism Employment of Cook Islanders · Distribution by Hotel/Motel and Salary/Wage
Rarotonga, Cook Islands - 1978
Hotel Small c Motels Totals Weekly Earnings*
-- 4 14 $ 26 - 30**
10 1 83 31 - 40
-- - 24 41 - 50
1 - 12 51 - 60
-- - 7 61 - 70
1 - 2 71 - 80
2 - 8 81 - 90
-- - 3 91 - l 00
-- - 2 101 - 110
111 - 120
-- - 1 121 - 130
.4 16*** 26***
Annual Earnings
$ 1,352 - 1,560
1,612 - 2,080
2,132 - 2,600
2,652 - 3,120
3, 172 - 3,640
3,692 - 4,160
4,212 - 4,680
4,732 - 5,200
5,252 - 5,720
5,772 - 6,240
6,292 - 6,760
* The normal pay· period in the Cook Islands is weekly in the private sector and fortnightly in government. .
** Minimum wage on Rarotonga is $.65/hour, or $26/week, or $1 ,352/year. *** Information on the income of these employees was not available.
Source: Employment Survey
O"I
O"I
. ,
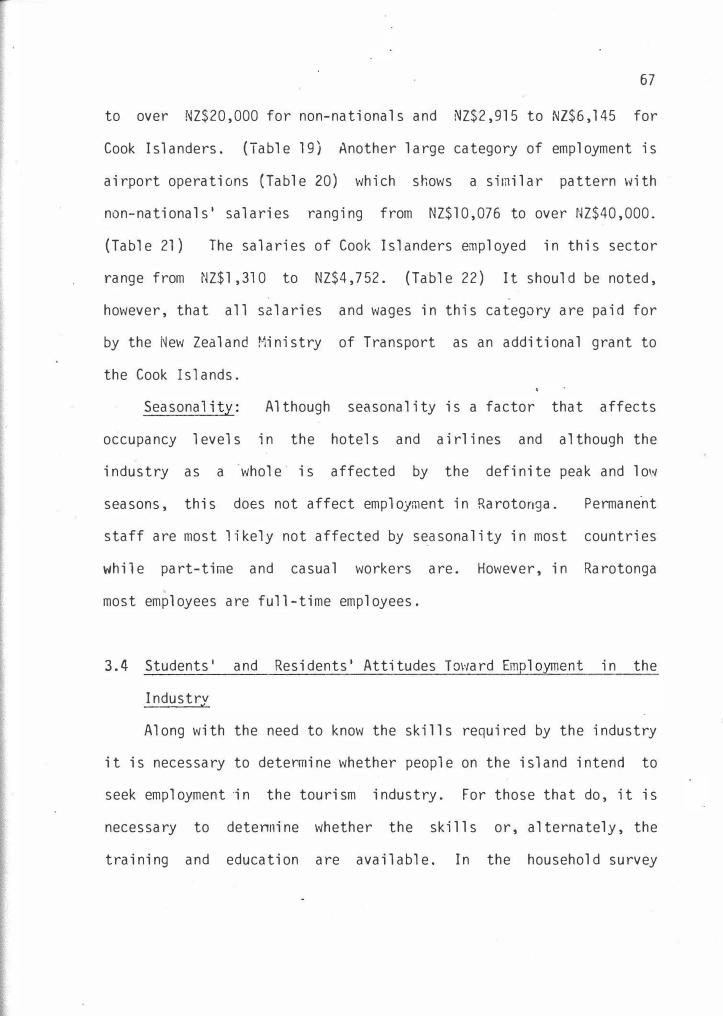
67
to over NZ$20,000 for non-nationals and NZ$2,915 to NZ$6,145 for
Cook Islanders. (Table 19) Another large category of employment is
airport operations (Table 20) which shows a similar pattern with
non-nationals' salaries ranging from NZ$10,076 to over NZ$40,000.
(Table 21) The salaries of Cook Islanders employed in this sector
range from NZ$1 ,310 to NZ$4,752. (Table 22) It should be noted,
however, that all salaries and wages in this category are paid for
by the New Zealand Ministry of Transport as an additional grant to
the Cook Islands.
Sea sona 1 ity:
occupancy levels
industry as a
Although seasonality is a factor that affects
in the hotels and airlines and although the
whole· is affected by the definite peak and low
does not affect employment in Rarotonga. Permane.nt seasons, this
staff are most 1 i kely not affected by se_asona 1 ity in most countries
while part-time and casual workers are. However, in Rarotonga
most employees are full-time employees.
3.4 Students' and Residents' Attitudes Toward Employment in the
Industrv
Along with the need to know the skills required by the industry
it is necessary to detenTline whether people on the island intend to
seek employment ·in the tourism industry. For those that do, it is
necessary to detenTline whether the skills or, alternately, the
training and education are available. In the household survey

Table 19 -- Air Transportation Employees Nationality and Salaries
Rarotonga, Cook Islands - 1978
Number of Employees Nationality Annual
12 Cook Island $ 1,620 -(11 part-time)
1 Cook Island 2,915 .
-
14 Cook Island 3,455 -
5 Cook Island 4,640 -
SUBTOTAL 32
16 New Zealand 13,000 -
TOTAL 48
Source: Employment Survey
68
Salary
2,915
3,455
4,640
6, 145
20,000+

Table 20 -- Air Transportation Employees Occupation, Nationality and Sex Rarotonga, Cook Islands - 1978
Number Sex Occupation of
Employees Male Female
Administration 2 1 1
Accounts 2 1 1
Management Trainees 1 1
Passenger Services 4 4
Passenger Sales & 3 1 2.
Reservation
Cargo Services 3 3
A.i rcra ft General 9 9
Handling
Engineering 6 6
Pi lots 4 4
Airport Services l 1
TOTAL 35 30 5
Source: Employment Survey
69
Nationality
Other New Zealand
Cook Island New Zealand
Cook Island
Cook Island New Zealand
Cook Island Mew Zealand
Cook Island New Zealand
Cook Island
Cook Island New Zealand
New Zealand
New Zealand

-
Number
1
1
1
1
1
1
1
1
1
1
1
1
1
1
l
1
1
2
Table 21 Airport Operations Salaries Analysis for Non-Nationals
Rarotonga, Cook Islands - 1978
Salary A 11 owance O ccupation Per Annum Per Annum
Stores Officer 6,751 3,325
Reb. Flight Ser_vice Officer 10 ,218
Assistant Administrator 7,458 3,325
Flight Service Officer 9'100 3,747
Senior Communications 10,554 4 ,·239· Officer
Flight Service Officer 8,555 6,655
OIC Meteorological Officer 9 '113 6,602
Electrical Foreman 7,465 8,667
Mechanical Overseer 7,465 8,702
Administrative Officer 9,755 6,602
Station Rescue Fire 8,646 8,910 Officer
Deputy Rescue Fire Officer 7,654 9,914
Superintendent Mechanical 9,755 8,610 Electrician
Technician 9,310 9,614
Airport Manager 12,507 7,247
Works Super.i ntendent 10,423 9,614
Telecommunications 11 ,570 9,614 Technical Officer
Telecommunications 19,782 20,232 Technical Officer
Source: Employment Survey.
70
Total
10 ,076
10,218
10,783
12,847
14,793
15,210
15,715
16�132
16,167
16,357
17,556
17,568
18,365
18,924
19,754
20,037
21'184
40,014

Male
20
5
6
3
52
9
4
99
Table 22 - Airport Operations Cook Island Employees Salaries and Sex Distributions
Rarotonga, Cook Islands - 1978
Female Total Annual Salary Range
3 23 $ 1,310 1,458
5 1,560 - 1,620 .
6 1,664 - 1,893
l 4 2,080 - 2,517
3 55 2,704 - 3,240
9 3,300 - 4,320
4 4,428 - 4,752
7 106
Source: Employme nt Survey.
71

72
carried out by the researcher, residents were asked whether they
presently worked in the tourism industry.· The response showed that
12% of respondents in the sample worked in the industry. Of the 88%
of people who did not work in the industry, 36'.t (or 42 people)
stated that they would like to work in the industry. However, the
majority (76 or 64%) stated that. they would not like to work in the
ind1:.1stry.
In the survey of high school students administered by the
researcher, only 34% of the total population indic�ted that they
would like to work in hotels or motels, whil� 47'.t Sqid they were not
interested, and 19% said they didn't know.
Of those who sai? 11yes" (39 students), 21'.t (8) wanted a job as
hotel manager or receptionist, 15'.t wanted a job as a cook or chef,
and another 15'.t \'/anted a job as waitress or waiter. (Table 23)
When asked if they would like to get a job in other
tourism-related industries, 69'.t said 11yes11, 21% said 11no11, with 10'.t
11don1t knows11• (Table 24) Of the 69% who wanted this type of
employment, 73% (or 58) said they preferred to work for Air New
Zealand while 8'.t want to work in travel agencies, 6% in musical
groups and 5.1'.t in the Tourist Authority. (Table 25)
Approximately 40% felt that they would have enough training for
the tourism job when they left school, 35% felt they would not have
enough training, while 25'.t didn't know.
The ski 11 s re qui red in hate l service jobs have been found to be
quite low. (Jones 1970) However, some high-level, better paying
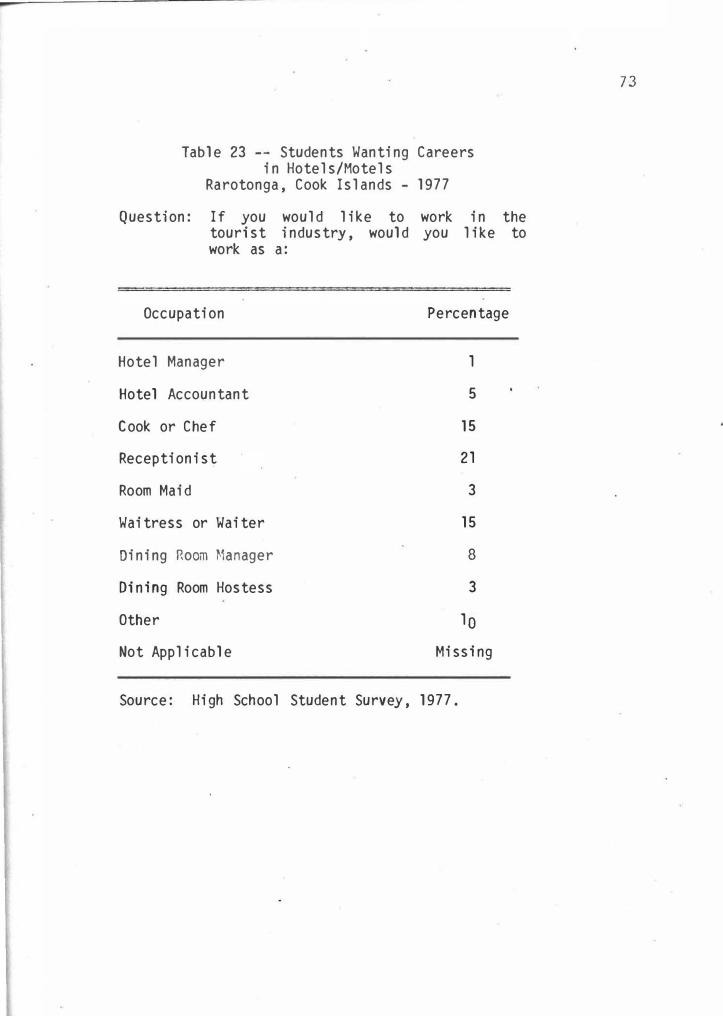
Table 23 -- Students Wanting Careers in Hotels/Motels
Rarotonga, Cook Islands - 1977
Question: If you would like to work in the tourist industry, would you like to work as a:
Occupation Percentage
Hotel Manager 1
Hotel Accountant 5
Cook or Chef 15
Receptionist 21
Room Maid 3
Waitress or Waiter 15
Dining Room Manager 8
Dining Room Hostess 3
Other 10
Not Applicable Missing
Source: High School Student Survey, 1977.
73

Table 24 -- Students Wanting Careers in Other Tourism Related Industries
Rarotonga, Cook Islands - 1977
Response Percentage
Yes
No
Don't Know
69
21
10
TOTAL 100
Source: High School Student Survey, 1977.
Table 25 -- Students Wanting Careers in Tourism Related Industry (Other Than Hotel/Motel }
Rarotonga, Cook Islands - 1977
Tourism Related Industry Percentage
Air New Zealand 73
Travel Agency 8
Musical Groups 6
To·ur Gui des 3
Duty-Free Shops l
Tourist Authority 5
Other 4
Source: High School Student Survey, 1977.
74

75
jobs require higher education and experience and .it is important to
determine whether these skills are readi·ly available in Rarotonga,
and if not, whether sufficient training and education for tourism
employment exists. The questionnaire collecting data on tourism
employment asked that employers indicate what their training needs
were. In all cases this section went unanswered. This does not
necessarily indicate that training is sufficient and is not needed.
In fact, the large establishments, such as the major hotel and
airline, conduct their own training programs in-hou�e. They find
this is more effective than sending peop� e to �ew Zealand for
training al though the hotel has sent two management trainees away
for experience in the Tourist Hotel Corporation chain of hotels in
New Zealand and the airline also has one management trainee in New
Zealand.
It is apparent that the issue of "who benefits most" in terms of
employment in the tourism industry in Rarotonga is a complex one.
It has been seen that Le Fevre projected that a to ta 1 of 202
rooms would provide employment for 350 people or approximately 1.7
persons per hotel room. In fact, this survey shows that there are a
total of 282 rooms employing a total of 464 people on a full-time
basis, or 1.6 persons per hotel room. However, this figure does not
take into account the imbalance in level of position and salary in
relationship to nationality. The pattern of high salaried positions
being occupied by expatriates and local people occupying the lower
paid positions persists. It is obvious that training and the supply

-
76
of skilled or trained local people does not exist in Rarotonga and
only minimal efforts have been made in this direction.
Tourism expansion has created greater opportunity for local
entrepreneurs and several new businesses have developed as a
result. Souvenir and handicraft stores, small motels, taxi and bus
transportation companies, travel agencies, and clothing stores have
been started and have provided an opportunity for local people to
benefit from tourism.
In terms of attitudes toward future emplo,xmen.t, tourism
employment is not regarded as very desirable. The majority of
respondents of the household survey stated they would not like to
work in the industry while only 39 students wanted to work in hotels
and motels. However, 58 students want to work for Air New Zealand.
The Cook Islands Government Policy toward tourism employment is
stated as:
1. It sha 11 be an undertaking on the part of the hotel and tourism related operators to ensure that rapid localization of jobs and positions take place and in particular an in-house programme of training be implemented to occupy management positions.
2. In addition to the above, the Tourist Authority is to undertake a con ti n�i ng manpower training programme in service, supervisory and management positions. Such a . programme is to be undertaken in conjunction and cooperation with hotels and overseas agencies.... (Ross and Farrell, 1975, p. 32}

77
CHAPTER 4
RESIDENTS' ATTITUDES TOWARD TOURISM AND TOURISTS
4.1 Background
It is just as important for pol icy makers to understand how the
residents feel toward tourism if! general and towards employment in
the. industry as it is to understand the employment patterns of
tourism in the society for which they are making policy. Policy
makers must be concerned with residents' attitudes �oward tourists
themselves for a very pragmatic reason: this is pr.obably the most
important factor in determining the success of an area as a resort
destination for travelers. If the residents's attitudes and
behavior are positive toward visitors, visitors will probably return
as well as convey to others a sense of their favorable experiences. . .
However, if the visitors go home with a negative experience due to
residents 1 attitudes and behavior then the tourism des ti nation area
will suffer. Policy makers must also be concerned with the
resident's well-being, in th�ir acceptance of the tourism industry
as a means of raising their standard of living and participating in
the develop�ent in a positive and well-balanced manner. If visitors
are satisfied and residents content, then the tourism development is
a success.
In traditional Polynesian societies there are inflexible
attitudes that act as a constraint on development and change. Where
the ·traditional attitudes persist while social and economic change

7.8
is taking place, traditional constraints may be eliminated and the
socially well-balanced society upset. It is, therefore, important
to record the attitudes of society members in order to understand
the effect of a development, for example, tourism, on members of
that society.
The two best-known tools .for obtaining attitudinal information
are the interview survey and the questionnaire. Both are direct
methods of attitude measurement because the information elicited
usually consists of self-reports about the respondent's beliefs,
feelings and intentions. (Lemon 1973)
"Survey research is probably the best known and most widely used
research method in the social sciences today." (Babbie 1973:1)
However, although survey research has been used frequently in
obtaining many different kinds of data, no survey can fully satisfy
the theoretical ideals of scientific inquiry. Consequently, every
survey is a series of compromises between the ideal and the
possible. The goal of the researcher is to make the best possible
cqmpromises. "Perfect surveys may not be possible, but good surveys
can and should be done." (Ibid.)
One of the first attitudinal surveys appeared in 1880, conducted
by Karl Marx. He mailed out 25,000 questionnaires to French workers
to determine the extent of exploitation by employers. (Ibid.)
Since then, attitudinal surveys have frequently been used to collect
data on the political, economic, and social characteristics of a
population.

79
"Attitude is one of the most ubiquitous of all the terms used in
social science." (Lemon 1973:1) It i's a concept that has no
generally accepted definition. This is a major reason why it has
proven so attractive to the researcher. The individual researcher
can tailor the term to suit his or her own purposes. Another
advantage of the use of attitude measurement is that it can be
app1ied at many different levels of analysis, from the "micro"
laboratory situation to the "macro" social level of a society.
"Where the social scientist is concerned with. more complex
societies, particularly those undergoing some form of social change,
attitude studies are more important." (Lemon 1973:7) This
situation can be contrasted with traditional, rather isolated
societies where anthropologists concentrate their efforts in
describing social structural variables rather than attitudes.
It is also necessary to look at the relationship between values,
beliefs and attitudes. The term "beliefs" embraces a set of
concepts by which people interpret the world. Ideals and beliefs
are fixed in structures of culture, habit and life style,
manifesting themselves in behavioral displays of attitudes. (Bluhm
1974) "Beliefs" refer to the images which people carry around in
their heads about how the world is actually structured and how it
operates in relation to the world in general. "Values," which are
conceptions of authority and purpose, referring to what "ought" to
be, contrast with "beliefs" which designate what "is,11 or what

·.
SD
people take to be reality around them. (Ibid.) Attitudes, then,
are the behavioral demonstration of values and beliefs.
Definition of the relationship between 11values11 and attitudes
has been attempted several times. One such attempt dis ti ngui shed
the two by stating that value referred to a very broad attitude.
(Allport 1937) Eysenck (1954} carried this further, claiming that
values involve a number of attitudes and, in addition, that ideology
involves a number of values.
The relationship between attitude measure and behavior is .
crucial. Lemon (1973) argues that although discrepancies between
attitude measure and behavior do exist, this provides
. • • no grounds for the conclusion that traditional methods of attitude measurement are invalid. Nor on the other hand would I wish to make any special claim that they are valid, merely that these discrepancies al one pro vi de no grounds for drawing this conclusion. (Ibid.:239)
He further argues that the function of attitude measurement is, in
fact, to measure attitudes, not behavior, and it is only when these
11atti tudes are manifested in overt behavior should we expect to
obtain correspondence. 11 (Ibid.)
While attitudinal studies are common tools used for
psychological, political, and social studies, their use in tourism
research has been primarily for assessing visitor reactions to the
visitor facilities at a given location. Recently, however, some
attention has been given to the use of attitudinal research to
discover the attitudes of local residents toward visitors and the

-----
81
industry as a whole.
One of the first studies was prepared for the Visitor Industry
Education Council (VIEC) in Honolulu, Hawaii, in May 1975.
(Research Associates, 1975) In reaction to a growing negative
public attitude toward the tourism industry in Hawaii, the VIEC
initiated an intensive television education campaign to inform the
co1T11J1unity about contributions tourism was making to the economy of
Hawaii. Six weeks after the VIEC television campaign had commenced,
a research study was conducted among registered vot�rs on Oahu to
determine attitudes toward the visitor indµstry and the level of
recall of the commercials. Key findings of the study indicate
that: 1) the advertising campaign had high impact; 2) many voters
had ambivalent attitudes toward the visitor industry; and 3)
residents under 30 were considerably more negative in attitude than
older residents. Of special interest was the fact that support of
industry growth was not unanimous. A third of the voters felt that
growth should be encouraged, but the inost prevalent feeling was that
the industry should be maintained at its present size. Fifteen
percent felt the industry was too large and should be cut back. A
key concern. among those opposed to the industry1s growth was its
effect on the natural resources, beauty and land use of Hawaii.
(Research Associates, 1975)
Another study carried out in 1978 measured the attitudes of
residents in Honolulu toward visitors as people. (Knox, 1978) The
purposes of the study were: (1) to gain an initial assessment of

82
the level of resident "Aloha Spirit" (friendliness toward tourists)
and (2) to begin to explore psychological factors which affect
resident "Aloha Spirit. Some of the results pertinent to this study
were as fo 11 ows:
Beliefs and perceptions about tourists: A minority of
the sample felt that tourists did not affect them
persona 11 y. Of those who thought tourists affected them
personally, positive benefits cited were usually economic,
while negative attitudes usually involved crowding or
environmental degradation.
Residents' emotions about tourists: Residents
expressed stronger positive feelings toward tourists than
negative fee 1 i ngs.
Opinions about growth of the tourism industry: Oahu
residents were sp 1 it as to whether the number of tourists
should keep growing on Oahu, but a slight majority favored
continued growth on the Neighbor Islands. (Ibid.)
A survey of residents' attitudes toward tourism and tourists was
also administered on the island of Guam in a report commissioned by
the Guam Visitors' Bureau. (Warner, 1978) The results showed that
most local residents knev1 ·surprisingly little about Guam's visitor
industry in spite of widespread publicity about the number of
visitors per year and the importance of tourism to Guam's economy.
This was the case even though most is 1 and residents had a highly

83
favorable attitude toward tourism and the Guam Visitor's Bureau had
just completed an intensive television education program similar to
that of the VIEC in Honolulu. The residents supported the growth of
the tourism industry with 82% of the respondents expressing the
senti ment that they would 1 ike to see more tourists come to Guam. A
1 arge majority ( 83%) thought the government of Guam should do more
to promote tourism. (Warner, 1978}
4.2 Survey Design and Methodology
Three methods were used in the present study to obtain the data
needed to determine residents' attitudes toward tourists as people
and tourism in general.
l. A household survey: This was conducted by the researcher in
June 1977 to gather data on attitudes toward tourism growth,
employment, tourists, size of household, age distribution, marital
status, income, ethnic composition of household and level of
education. The population for the survey was the households on the
island of Rarotonga. A random sample was selected to include
�espondents from each of Rarotonga's villages to ensure a good
geographic distribution. (Table 26} The total number of households
was 1,350, and a sample size of n = 157 was selected to give a 12%
sample. A four-digit number was selected from Table l (Snedecor and
Cochran, 1967}, then the first 157 four-digit numbers that did not
exceed 1,350 were selected. The sample consisted of the units that
carried these numbers in the listing of the household population
Table 26 -- Number of Respondents by Village of Residence, Survey of Households, Rarotonga, Cook Islands - June 1977
No. of Village Respondents
Tu pap-Pue 18·
Takuvaine 18
Tutak imoa 8
Rua tong a 11
Avatiu 11
Ni kao, Tepuka, Panama 10
Arorangi 30
Titikaveka 18
Ngatangiia 9
Matavera 6
TOTAL 139
Source: Household Survey, 1977.
84

85
determined by the Statistics Office. The Cook Islands Government
Statistics Office was most helpful in aiding in the selection of the
sample. The definition of a household was that used by the Cook
Islands Census.
The basic instrument of data collection was a questionnaire
administered by an interviewer to one respondent in each household,
preferably the head of the household, or his/her spouse, or any
informed adult in the household. A pilot test was conducted during
the preparation stage of the research. A total of 139 valid
questionnaires, out of 157, were obtained, giving a final sample of
10'.t.
Interviewers \'.iere recruited from the Sta ti sti cs Office and they
worked with regular monitoring by the researcher. {The researcher
conducted 15'.t of the interviews herself.) All of the interviewers
selected had worked on the census which was conducted six months
earlier. Training sessions were conducted to be sure the
questionnaires were administered correctly.
2. Survey of high school students: This survey also gathered
data on students' attitudes toward tourism in general and toward
tourists. Some of the same questions were asked. The total
population was 116, namely· all students in their last and second to
last years of school. The questionnaires were administered by the
soci a 1 science teachers during c 1 ass. The researcher gave a series
of lectures to each class on tourism in the Pacific after they had

86
responded and answered questions. This was a lively and interesting
exercise.
3. Leadership interviews: The researcher found that after
selecting a random sample from the community for the household
survey, persons in leadership roles were under-represented in the
sample. It was, therefore, felt that a separate set of interviev1s
with persons in leadership positions would enhance the understanding
of residents' attitudes toward tourism. This technique involved
selection of informants on the basis of leadership po,sitions within
the community. (Savatsaki and Freilich, 1977) Seidler (1974) used
ten informants and found this leadership interview approach to be
reliable. Another study using this method (Campbell, 1955) had a .9
reliability in comparison with a large-scale sample survey.
Six informants were selected. They were interviewed using a
standardized open-ended questionnaire. Each informant was asked to
give his/her views on tourism gr·owth and employment. In discussion
with the informants who were initially selected to represent
government, the Tourist Authority Board, traditional leaders, local
business, and religious organizations, each was asked to name other
people whom he/she thought were important leaders in the community
who might also have informed views on tourism. It turned out that
there was general consensus on the informants chosen.
4.3 Analysis and Results of the Household Survey
The first task in analyzing these data was to determine the

.....
87
basic distributional characteristics of each of the variables. This
was done using the Statistical Package for the· Social Sciences
(SPSS), which is an integrated system of computer programs designed
for the analysis of social science data.
Simple frequency distributions of both the independent and
dependent variables were presented and cross-tabulations of selected
variables were analyzed.
4.4 Findings
Demogr�phic: Although the selection of the household sample was
random, close to 85% of the respondents were males with only 15%
females. (Table 27) .Distribution by age (Table 28) shows that the
sample produced a fairly even distribution of age groups. Tab1e 29
indicates that over 53% of the sample had attended primary school,
while 17% attended high school, and only 9% had attended university.
Nearly 80% of the respondents were Cook Islands Maoris (Table
30), 84% were born in the Cook Islands (Table 31) , and over 81% had
lived in Rarotonga for 11 years or more, indicating a fairly stable
population. (Table 32)
Of the respondents, 45% were working in private business while
25% worked for government (Table 33) . The income di?tribution of
the respondents was fairly even, with 27% earning up to $30 a week,
22% earning $31 to $60, and 28% earned over $61 per week (Table 34) .
Attitudes toward Tourism: Respondents were asked whether or not
they approved of the construction of the airport. An overwhelming .

Sex
Male
Female
Table 27 -- Number of Respondents by Sex Survey of Households
Rarotonga, Cook Islands - June 1977
Number Percentage
TOTAL
118
21
139
85
15
100
Source: Household Survey, 1977
Age
Table 28 - Number of Respondents by Age Group Survey of Households
Rarotonga, Cook Islands - June 1977
Nµmber Percentage
21 - 35 Years 40 29
36 - 50 53 38
51 - 55 36 25
56 and Over 7 5
Unknown 3 3
TOTAL 139 100
Source: Household Survey, 1977.
88
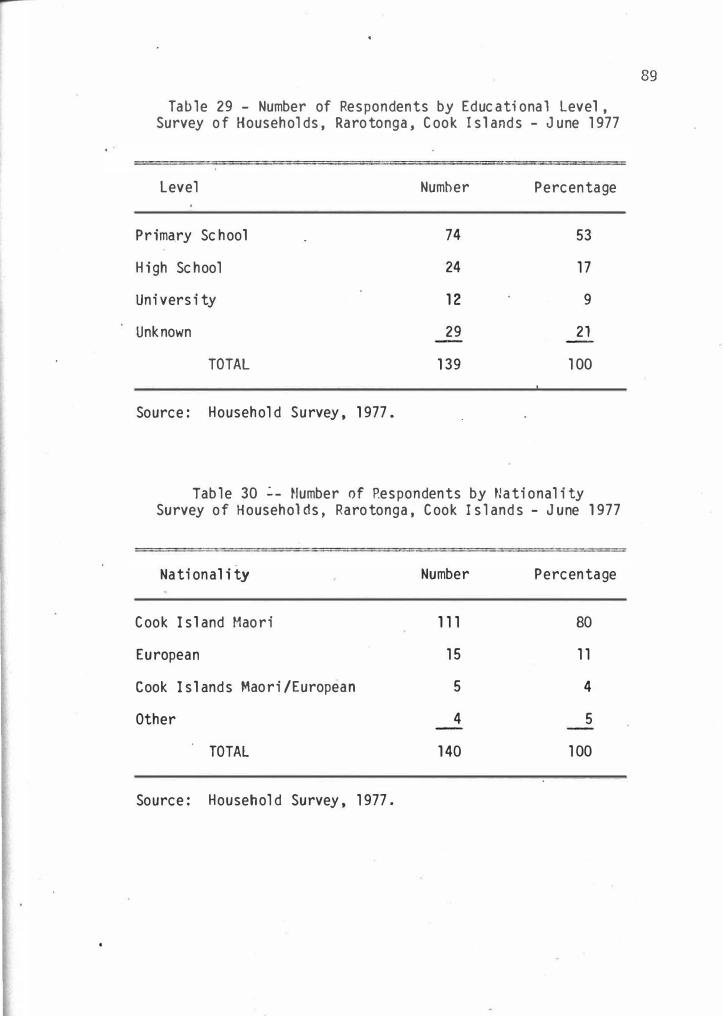
-
Table 29 - Number of Respondents by Educational Level, Survey of Households, Rarotonga, Cook Islands - June 1977
Level Number Percentage
Primary School 74 53
High School 24 17
University 12 9
Unknown 29 21
TOTAL 139 100
Source: Household Survey, 1977.
Table 30 .:._ Mumber of Respondents by Nationality Survey of Households, Rarotonga, Cook Islands - June 1977
Nati on al i ty Number Percentage
Cook Island Maori 111 80
European 15 11
Cook Islands Maori/European 5 4
Other 4 5
TOTAL 140 100
Source: Household Survey, 1977.
89
Tabl e 31 - - Number of Respond ents by P lace of Birth Survey of Households
Rarotonga, Cook Islands - June 1977
Place of Birth Number
Cook Islands 117
New Zealand 7
Other Commonwealth Countries 7
Other Pacific Islands 4
United States 1
TOTAL 136
Source: Household Survey, 1977.
Table 32 -- Number of Respondents by Length of Residence in Rarotonga
Survey of Households Rarotonga, Cook Islands - June 1977
Number of Years
0 - 10 years
11
21
31
40
- 20 years
- 30 years
- 40 years
and over
TOTAL
Source: Household
Number
22
27
28
17
41
135
Survey, 1977.
Percentag e
84
5
5
4
2
100
Percentag e
16
19
20
12
33
100
90
Table 33 -- Employment of Respondents Survey of Households
Rarotonga, Cook Islands - June 1977
Categories of Employment
Number Percentage
Private Business
Government
Other
Unknown
TOTAL
Source: Household Survey, 1977.
63
35
12
Table 34 -- Income of Residents Survey of Households
Rarot onga, Cook Islands - June, 1977
Weekly Income
NZ $ 0 - 31
31 - 60
61 and over
Unknown
TOTAL
Source: Household Survey, 1977.
Number
37
31
38
45
25
9
21
100
Percentage
27
22
28
33
100
91

--
92
majority (91%) stated that they approved of the airport (Table 35),
though this does not necessarily mean . that they approve of the
airport for tourism purposes. Many residents would surely view this
new facility' as improved transportation to overseas destinations for
themselves and their families.
Responses to question No. 18 indicate that 26% would like to see
more hotels built on Rarotonga in the future, 36% feel that the
present number of existing hotels is sufficient and 28% would like
to see fewer hotels. (Table 36) The majority feel that the
existing tourist accommodation facilities are sufficient.
Question 40 asked whether or not residents approved of
construction of the new "Rarotongan Hotel 11 which· had just recently
opened. A large majority (74'.t) approved of the hotel while only 9%
di sapprovect, and 17% responded "Don 1 t Know. 11 (Tab 1 e 37).
Questions 28 ·and 29 indicate that the primary reason residents
approve of tourism are economic--because it generates "more money on
the island" (31%). Residents also -believe that tourism provides
better markets for local produce or handicrafts (69%) and that it
provides more jobs (72%). (Table 38)
Residents also think that tourism promotes more crime (20'.t),
increases the cost of living (21%), destroys the environment (13%),
and causes hea 1th problems. (Table 38)
Question Number 21 asked respondents to express their feelings
about the ownership of hotels, motels and other tourist facilities
Table 35 -- Residents' Attitudes Toward Airport Construction Survey of Households
Rarotonga, Cook Islands - June 1977
Response Number Percentage
Approve 125 91
Disapprove 3 2
Don't Know 9 7
TOTAL 139 100
Source: Household Survey, 1977.
Table 36 -- Residents' Attitudes Toward Future Hotels Survey of Households
Rarotonga, Cook Islands - June 1977
Hotels Number Percentage
More Hotels 35 26
Same as Now 48 36
Less Hotels 38 28
Don't Know 14 10
TOTAL 135 100
Source: Household Survey, 1977.
93

--
Table 37 -- Residents' Attitudes Toward Construction of New Hotel
Survey of Households Rarotonga, Cook Islands - June 1977
· Response Number Percentage
A pprove 100 74
Disapprove 12 9
Don't Know 24 17
TOTAL 136 100
Source: Household Survey, 1977.
94

---
Table 38 - - Residents' Attitudes Toward Tourism, Survey of Households
Rarotonga, Cook Islands - June 1977
POSITIVE
More money on the island More jobs Better markets for local produce
and handicrafts Promotes better understanding of
other people More opportunity for local business Revives local culture Better paying jobs More things to do and see or buy Other Don't Know
NEGATIVE
Increases cost of living More outside businesses and investors More health proble�s Harms local culture Promotes more crime Introduces new ideas and ways Destroys the environment Lose our friendliness Menial Jobs
Source: Household Survey, 1977.
Yes (%)
73.9 72.4 68.4
55.6
54 .1 48.9 43.3 37.3
3.0 2.3
68.7 57.5 54. l 46.3 46.3 43.3 41.8 28.6 23. l
95
Feel Strongly
(%)
30.9 14.5 17.3
7.3
6.4 4.5 7.3 0.9 0.9 8. 2 .
21. 1
8.8 10.6
4.4 19.5 2.7
13.3 5.3

96
on Rarotonga today. The majority (43%} stated that there was too
much outside ownership of these facilities, 17% thought the
ownership balance was "just right", 13% felt it "doesn't matter,"
an� a large group (27%} was "not sure." (Table 39)
The majority of residents (43%} thought that a joint venture
approach should be used to further develop tourism, 35% thought that
government should spend more money, and 18% thought private
enterprise should take leadership in this development. (Table 40}
In an attempt to determine whether tourism was a priority '
development, residents were asked the open-ended question: "Would
you tell me what you feel have been the most important development
projects in the Cook Islands in the last ten years?" The responses
indicate that tourism is the most important development project
(32%). The development of neighbor island airports, \'1hich can be
construed as tourism related, is perceived as another important
project ( 13%}. New housing was· al so considered to be an important
development (11%). (Table 41)
Attitudes toward Tourists: Several questions were designed to
assess the ·attitudes of residents toward tourists as people, in
addition to attitudes toward tourism as an industry.
Residents were asked if they wanted more or less tourists to
visit Rarotonga. A majority expressed the desire to have less
tourists (34%), while 31% wanted more tourists. However, 27%

-
Table 39 - - Residents' Attitudes Toward t .nership of Hotels/Motels
Survey of Households Rarotonga, Cook Islands - June 1977
Response Number Percentage
Too much outside ownership 59
Just right 24
Doesn't matter 18
Not sure
Source:
37
TOTAL 138
Household Survey, 1977.
Table 40 -- Residents' Attitudes Toward Further Tourism Development
Survey of ouseh�lds Rarotonga, Cook Islands - June 1977
43
17
13
27
100
Sectors that Should Spend More Money to Further
Develop Tourism Number Percentage
Government
Private Enterprise
Joint Venture
Don't Know or Other
TOTAL
Source: Household Survey, 1977.
44
23
55
5
127
35
18
43
4
100
97

-
Table 41 - - The Most Important Development Projects ·in the Cooks Islands Over the Last 10 Years as
Perceived by Residents, Surve of Househol ds, Rarotonga, Cook Islands - June 1977
Most Important Development Project
Tourism
Neighbor Island Airports
New Housing
Wa ter Supply
Agri cul tu re
Other
Source: Household Survey, 1977.
Percentage
32
13
11
4
7
33
100
98

thought the present volume was acceptable. (Table 42)
99
Residents were asked whether or not they thought there were too
many tourists visiting Rarotonga at the present tirre. The majority
thought the volume was "Just right" (39%}, while 32% thought there
were too many tourists. Only 18% felt there were not enough.
(Table 43) This response supports the responses to the previous
question.
When asked "Why would you like more tourists to come ? 11, 55'.t gave
economic reasons; for example, "more money for the ,Cool< Isl ands, 11
"better markets," "tourists are rich. 11 A significant number (37%},
however, stated that they "didn't know." (Table 44}
In response to Question 15(b}, "Why would you not like more
tourists to come?", the majority or 41% stated social and
environmental reasons for not wanting more tourists while 21%
expressed cultural reasons. Again, a large number (22%} stated they
"didn't know" why they had a negative response to this question.
(Table 45}
"Knowledge" Questions: Two questions were designed to determine
factual "knowledge" of Cook Islands tourism, based on information
widely publicized by the media.
Question 19 asked residents if they knew who owned the
Rarotongan Hotel. The majority (60'.t) stated "no, 11 while only 40%
indicated "yes. 11 (Table 46)

Table 42 -- Desired Future Volume of Tourists Survey of Households
Rarotonga, Cook Islands - June f977
Desired Future Volume Number Percentage
More Tourists 42 31
Less Tourists 46 34
The Same 36 27
Don't Know 15 8
TOTAL 139 100
Source: Household Survey, 1977.
Table 43 Attitudes Toward Present Volume of Tourists, Survey of Households
Rarotonga, Cook Islands - June 1977
Attitudes Toward Present Volume Number Percentage
Too Many 44 32
Not Enough 25 18
Just Right 54 39
Don't Know 16 11
TOTAL 139 100
Source: Household Survey, 1977.
100

-
Table 44 -- Reasons for More Tourists, Survey of Households
Rarotonga, Cook Islands - June 1977
Reason Percentage
Economic Reasons (e.g., more money for the Cook Islands, better markets, tourists are rich etc.)
Social Reasons (e.g., like more tourists, see more people, etc.)
Other
Don't Know
TOTAL
Note: Collapsed responses.
Source: Household Survey, 1977.
55
3
6
37
100
l 01

Table 45 -- Reasons for No More Tourists, Survey of Households
Rarotonga, Cook Islands - June 1977
Reasons
Social & Environmental Reasons (e.g., exploit land and people, island too small, bad influences, more population, no food, more crime, health problems, spoil environment, etc.)
Cultural Reasons (e.g., spoils culture, spoils customs, culture change, etc.)
Economic Reasons (e.g., inflation, etc.)
Other
Don't Know
Source: Household Survey, 1977.
102
Percentage
41
21
7
9
22
100

-
103
Another question (30) asked if residents knew that the
government had a policy of "controlled11 ·tourism. The response to
this was 11no11 (56'.t), while only 43% stated "yes." (Table 47)
The responses to both these questions indicate that residents
knew surprisingly little about the Cook Islands visitor industry in
spite of widespread publicity through the radio and newspaper about
the.ownership of the Rarotongan Hotel and the government pol icy of
"controlled11 tourism.
Contact with Tourists and Use of Tourism .Facilities: One of the
factors that may affect attitudes of residents toward tourists and
tourism is the frequericy of contact with visitors and the frequency
of use of tourism facilities.
Question 16 asked residents how often they came into contact
with or met a tourist. The majority (50%) stated that their contact
with tourists was 11 infrequent,11 while 19% stated they came into
contact with tourists 11 every day11 and 15% stated 11every week."
(Table 48) Although the majority stated their contact with tourists
was "infrequent," there appears to be some relationsip between
frequency of contact and their attitudes that there are too many
tourists. This appears to suggest that persona 1 contact, rather
than perceived economic identity or interest, is more influential in
shaping Cook Islanders' attitudes about having more tourists.
Another variable ("Do you work in the tourist industry?) had too few

Table 46 -- Residents' "Knowledge" of Rarotongan Hotel Ownership, Survey of Households,
Rarotonga, Cook Islands - June 1977
Response
Yes
No
TOTAL
Source: Household Survey, 1977.
Number
53
81
134
Percentage
40
60
100
Table 47 Reiidents' Knowledge of Government Policy,
Response
Yes
No
Survey of Households Rarotonga, Cook Islands - June 1977
TOTAL
Number
57
75
133
Source: Household Survey, 1977.
Percentage
43
57
100
104

Table 48 -- Frequency of Contact with Tourists, Survey of Households
Rarotonga, Cook Islands - June, 1977
Frequency Number Percentage
Every Day 26 1 9
Every Week 21 15
Infrequently 68 50
Not At All 22 16
TOTAL 137 100
Source: Household Survey, 1 977.
105

106
(16} positive responses to make this variable meaningful. There is
a·possibility of a misconception in mean·ing or definition, and the
importance of the rel ati onshi p between frequency of contact and too
many tourists must remain a tentative hypothesis until there is more
and better research on ·those who perceive themselves to be in
"tourism jobs."
In response to Question 25 ("Do you often go to a hotel for
entertainment, drinks, or dinner?"}, the majority of residents (55%}
stated "No," while 45% stated 11Yes.11 (Table 49) This variable
appears to have some relationship with per.sons' a:ttitudes that a
tourist is a person on a limited budget, a person who is friendly,
and interested in the Cook Islands. (Table 50)
It is evident by the responses to Questions 16 and 25 that the
residents did not have frequent contact with tourists. In addition,
a· majority did n·ot patronize tourism facilities. It would appear
that those who do so, do not interact very much with the visitors.
It can be assumed that they frequent ·tourism facilities to interact
with other local residents.
Perceived Role of Government in the Tourism Industry: Several
questions were designed to assess what residents perceive the role
of government in the tourism industry to be.
Question 31 asked residents whether they felt that the present
government policy controlling the growth of tourism was the right

-
Table 49 Frequency of Use of Hotel Facilit ies
Response
Yes
No
Survey of Households Rarotonga, Cook Islands - June 1977
TOTAL
Number
62
76
138
Source: Household Survey, 1977.
Percentage
45
55
100
l 07

Table 50 -- Residents' Feelings about Tourists, Survey of Households
Rarotonga, Cook Islands - June 1977
Perception of a Tourist
Person with plenty of money
Person with some money but on a limited budget
Person who is rude and unfriendly
Person who is friendly and easy to approach
Person who is hard to please
Person who is easily pleased
Person who is genuinely interested in people and the Cook Islands
Person who is only interested in what he wants to do or know
Person who is noisy, loud and boisterous
Person who is quiet, responsible and shows respect
Person whom you would like to help anytime
Person who should be left alone
Source: Household Survey, 1977.
Yes
41.0
38.8
3.7
59.0
5.2
31.3
59.0
17.2
3.0
56.7
39.6
9.7
108
No
59.0
61.2
96.3
41.0
94.8
68.7
41.0
82.8
97 .0
43.3
60.4
90.3

--
109
thing or the wrong thing to do. The majority thought it was the
11right thing 11 (54%), only 6% thought it was the 1\'lrong thing,11 while
a large group (40%} said they 11don 't know.11 (Table 51)
Curiously, in another question with slightly different wording
{Question 32: "Do you feel that the growth of tourism should be
controlled by Government or not?11}, an overwhelming majority (82%}
felt that the government should control tourism growth, while only
7% stated government should not control tourism 9rowth, and only 11%
11didn1t know.11 (Table 52)
Question 23 asked residents whether they thought government
should give incentive, guidance and support to local people so that
they could invest in tourism. As might be expected, the
overwhelming majority stated 11yes 11 (89%), while only 10% stated
11no.11 (Table 53}
The respondents who answered 11Yes 11 in Question 23 were asked a
further question (24): 11Should government give support to local
people through technical advice, legal advice, financial advice, or
restricting foreign investment?11 The residents stated that
financial advice from government was important {63%) while 40%
stated that technical advice from government was desirable, 38%
wanted legal advice from government, and 31% stated that government
should restrict foreign investment.
It is evident from the above responses that residents of
Rarotonga think that the role of government in tourism growth should

Table 51 -- Attitudes Toward Present Government Tourism Policy, Survey of Households Rarotonga, Cook Islands - June 1977
Response Number Percentage
Right Thing 69 54
Wrong Thing 8 6
Don't Know 52 40
TOTAL 129 100
Source: Household Survey, 1977.
Table 52 -- Attitudes Toward Government Policy of Contro
.lled Tourism, Survey of Households,
Rarotonga, Cook Islands - June 1977
Response Number Percentage
Controlled 112 82
Not Controlled 9 7
Don't Know 15 11
TOTAL 136 100
Source: Household Survey, 1977.
110

-
Table 53 -- Residents' Perception of Government's Role In Future T ourism Development, Survey of Households,
Rarotonga, Cook Islands - June 1977
Response
Yes
N o
Don't Know
TOTAL
S ource: Household Survey, 1977. ·
Number
116
13
2
131
Percentage
89
10
l
100
111

-
112
be substantial.
4.5 Analysis and Results of the High School Survey
This section describes the results of a high school survey that
was conducted by the researcher at Tereora College in Rarotonga,
Cook Islands, in July, 1977. The survey was designed to assess the
attitudes of high school students in the last two years of school,
Form V and VI (or the equivalent of Grades 11 and 12 in the American
system) to\'lard tourism development, employment a�d traditional
values in Rarotonga.
Demographics: The mean (or average) age of the students was 17
years. Of the total of 116 respondents, 41 (or 35'.t) were males and
75 (or 65%) were females.
Attitudes Toward Tourists, Tourism and Growth: The majority of
respondents (79%) stated that thei� contact with tourists was
infrequent, meaning they came into contact with, talked to, or met a
tourist less than once a week.
Nearly 60% of the students thought of a tourist as a guest in
Rarotonga, as compared with 29'.t who consider them as "foreigners."
Alroost 52'.t stated that the current volume of tourists in Rarotonga
(approximately 10,000 per annum) was acceptable, while 26'.t wanted
fewer tourists and only 17'.t wanted more. This was reinforced by

113
responses to Question 7 where 66'.t stated that the number of tourists
then was "just right;" 24'.t said there were "too many, 11 and 5'.t said
there were "not enough.11
The profile of a "tourist" as perceived by a high school student
is a person who is genuinely interested in the Cook Islands, has
plenty of money and is friendly and easy to approach. (Tab 1 e 54)
.Approximately 67'.t thought that the new Rarotongan Hotel is a
good thing for the Cook Islands but of the total respondents, only
29% would like to see more hotels and motels built on Rarotonga and
57'.t did not want more hotels.
The majority, or 68'.t, thought that tourism was good for the Cook
Islands, while 19'.t di�agreed, and 13'.t "didn't know."
An overwhel ming 89'.t thought the growth of tourism should be
controlled by the government.
An overwhelming majority (93'.t) thought that the airport was a
good thing for the Cook Is 1 ands, and 90% thought the airstrips on
the outer islands were also good.
Table 55 indicates what .students feel are the positive things
about tourism. Twenty-four percent felt that tourism produces more
money on the island, that it promotes better understanding of other
people (21%), that it introduces new ideas and ways (13%), that it
revives local culture (12%), and that it creates more jobs (11'.t).
Table 55 also indicates the negative aspects of tourism.
Students felt that tourism destroys the environment (23'.t), that it

Table 54 -- High School Students Attitudes Toward Tourism, Survey of Tereora College
Rarotonga, Cook Islands - 1977*
Feel
114
Yes (%) Strongl y
GOOD THINGS
Promotes better understanding of other people
More money on the island Introduces new ideas and ways More jobs Better markets for local produce and
handicrafts Revives local culture More things to do and see, or buy Better paying jobs More opportunity for local business Other
BAD THINGS
Destroys the environment Promotes more crime Increases cost of living Harms local culture More health problems More outside businesses and investors Introduces new ideas and ways Lose our friendliness Menial jobs Other
*N = 116
Source: Survey of Tereora College, July 1977.
52 .6 50.0 43.1 31.0
30.2 27.6 25.9 19.0 19.0
3.4
50.0 48.3 42.2 33.6 33.6 31.9 28.4 25.0
2.6 1.7
(%)
20.8 23.6 13.2 11. 3
2.8 12.3
6.6 4.7 3.8 0.9
22.9 21.0 11 .4
9.5 14.3
4.8 10.5
4.8 1.0

115
promotes rrore crime (21%), that it creates more health problems
(14%}, and that it increases the cost of living.
Nearly 54'.t thought tourism should be strongly promoted since it
was the fastest way to provide jobs for the people, even if they
became more dependent on tourism, while 4 7% disagreed. However,
only 29% wanted more hotels so there appears to be some ambivalence
about tourism growth.
The majority, or 68%, thought that Cook Isl ands would have a
better standard of living in the future because of .tourism, while
32% disagreed.
Emigration: Almost 58% of the students wanted to emigrate to
New Zealand after finishing high school, 26% didn't want to
emigrate, while 16% were not sure. Of the 58% who wanted to
emigrate, 76% wanted to go for more education, 19% for work and 3%
to visit friends and relatives.
Of the 76% who wanted more education, 35% wanted to go to
university, 24% wanted medical training, 14% wanted business
training, and 8% wanted to go to teachers training college.
4.6 Results of Leadership Interviews
As outlined in the methodology section of this chapter, the
researcher found that the household sample did not represent the
persor.s in leadership positions in the community. Leadership

116
interviews were conducted in July, 1978. A total of 11 people were
interviewed using an open-ended questionnaire and an informal
discussion format. The persons included two religious leaders, two
political leaders, seven members of the Tourist Authority Board
(TAB) and one traditional leader who was also a member of the TAB.
Of the remaining members of the Board, five were also members of the
PubJic Service, two were representatives of the tourism industry,
and one was a woman.
Future Tourism Development and Growth: Whil_e most leaders
believed there was a great potential for future tourism development
and growth, only one of the political leaders felt that the
potential for growth was not as great as some people expected. He
noted that the potential for future development was "limited unless
policy changes radically to give good incentives for capital
investment." He felt the main limiting factors were: the cost and
availability of land, and the lack of skilled labor and the need to
employ qualified local people. He noted that another limiting
factor was the social/cultural impact of tourism, explaining that
this would remain an important constraint, though difficult to
assess because the effects were intangible and fraught with
subjective interpretations.
The other political leader stated that tourism growth should be
1 imi ted by the number of motel opera tors with 3 to 10 rooms. He

117
felt that distribution of the benefits to the small operators should
be encouraged and that greater encouragement should be given to
local people to invest.
All agreed that the opening of the airport and cheaper fares
mean that tourism would become a major industry in Rarotonga.
One of the members of the TAB felt that Rarotonga was not a
popular destination and that growth was limited. Another member
felt that tourism should have slow development. Another member of
the Board stated that the industry was "going ahead. in leaps and
bounds" and that growth \'toul d increase. He al so stated that
Rarotonga had enough accommodations to meet the increased fl ow and
was cautious about licensing more.
Tourism Development in the Outer Islands: Tremendous physical
constraints, such as air transportation, water supply, electricity
and accommodation, make outer island development difficult in the
opinion of one person. He felt that the outer islands had little
potential for tourism. Another political leader felt that the
Island Councils of the islands should determine whether or not they
should develop tourism. Two members of the TAB indicated that with
the present facilities the· outer islands would only be suitable for
people who were prepared to "rough it." Another member stated that
more visitors should be encouraged to visit the outer islands as
this would assist the economies of these islands. He felt that if

118
facilities existed, people would go to visit. He also felt that the
National Development Bank should finance these types of
accommodations in the outer islands. A religious leader noted that
because of the small populations existing on the outer islands,
tourism development must be on a small scale.
Perceived Impact of the Present Number of Hotels and Visitors on
Rarotonga and Future Projections: A religious leader stated that:
"Tourists are generally very demanding people. The volume of '
visitors and hotels on Rarotonga at present must have helped the
economy but has made hospitality no longer a spontaneous gift that
is natural to the Cook Islanders -- hospitality in Rarotonga is fast
becoming cold business." Both he and his colleague also felt that
there should be no more hotels, motels or visitors.
A political leader felt that the industry could be expanded to a
maximum of 30,000 visitors. He anticipated that this would be a
tolerable volume. He also felt that the present accommodation plan
must be allowed to consolidate and that development should be
diversified to include agriculture and local processing of crops.
This would be an as·sociated tourism development because new markets
would open up within the tourism industry.
A member of the TAB felt that al though there was a need for
another resort hotel on Rarotonga, other hotels and motels should be
enjoying an occupancy rate of 75% or better before another resort is

---
119
built. Another member of the board felt that there should be no
more tourists for the "i ndefi ni te future�"
Another politician stated there should be no more large hotels;
however, there should be no restrictions on small, locally-owned
hotels. Another member of the TAB stated that from an economic
standpoint more visitors and Q.ccommodations were needed. A fellovi
member agreed with this but felt that occupancy rates were important
considerations.
Role of Government in Tourism Development: A religious leader
stated that the role of government was 11to make sure that the
business side of t9Urism does not dominate and eventually throttle
the natural gifts of Cook Islanders' hospitality." Another
religious leader stated that government must be responsible in
finding a "balance" which will enable the Cook Islands to gain
something from tourism and at the same time preserve the culture and
"style" of the islands.
A political leader felt that government should be concerned with
the redistribution of benefits to local people. He also felt that
it should be involved in more planning and regulation and make
grants for restoration of historic sites. He thought that
government should not be involved in commercial ventures. His
colleague stated that government's role should be to make policy
decisions that affect the economic and social makeup of the

12 0
community. An important aspect of this \'IOUld be ensuring that local
participation was encouraged. He also felt that government should
not be involved in commercial ventures and strongly felt that
private enterprise should take the lead role in development wherever
possible. This view was emphasized by other respondents also.
Role of the Church: A religious leader stated that the best
role for the church was to "keep reminding all those connected \'lith
tourism that the Polynesian way of life is a gift of God ·that should
not be commercialized but should always respect the dignity of the
Polynesian." Another stated that the influence of the churches can
be important in the image the tourists get from the local population
in terms of friendship and interaction.
Most leaders interviewed believed that tourism had affected or
influenced Cook Islanders' life style. One TAB member felt that
tourism itself had not affected the life style. He felt that
education and modern technology had greater impacts. He saw tourism
as one way to understand others' viewpoints and share with others.
Another felt that tourism had made Cook Islanders' life-style more
sophisticated, made other life-styles more accessible, and had
served as a catalyst to re-evaluating the strength of traditions in
modern day 1 i fe.
Another TAB member felt that tourism had contributed to the

121
increase in the cost of living, and yet another felt that tourism
has hastened the breakdown and decay of traditional systems.
Another rrember stated that tourism could encourage a cultural
revival which could be beneficial. He saw tourism as part of the
process of change which could not be stopped. He felt that previous
non-action had allowed isolation and preservation and felt that the
islands now had an opportunity to control their destiny with an
awareness of what mistakes other countries had made.
Another TAB member stated that tourism had revi Vl?d the cul tu re
in terms of dance, music, wood-carving and handicraft. More young
people are now involved in traditional handicrafts than fifteen
years ago. A cottage industry based on handicrafts had been created
by tourism. One of the real problems was alcohol. Ninety percent
of the absenteeism amongst staff could be attributed to alcohol.
The two religious leaders' attitudes are expressed by the
f ollowing statement: "Tourism means money which means materialism.
The increasing abuse of alcohol and the increasing crime rate cannot
be blamed entirely on tourism, but it is one of the contributing
factors to the present aff1 uence which breeds these social
problems. The Church abhors such an increase in social disorder."

5. 1 Introduction
CHAPTER 5
CONCLUSION
122
The preceding three chapt�rs describe tourism in the Cook
Isl�nds, analyze tourism's contribution to employment, and report on
the results of three surveys seeking to document the attitudes of
residents towards tourism in 1977. This final chapter focuses on
patterns which could provide guidance in furth�r studies and
contribute to the decisions of planners and policy makers in the
Cook Islands communit� and government.
The facts and data document some obvious patterns. First, there
was rapid growth in tourism en Rarotonga between 1973 and 1977.
Second, the resulting visjtor industry contributes jobs and
job-related economic benefits to the community. Third, a majority
of the residents and community leaders perceive the industry to be
more favorable and beneficial to their way of life than
unfavorable. Fourth, resident attitudes support only modest growth
of the industry and reflect an awareness that much greater or inore
rapid growth somehow represents a threat to their preferred way of
life. Fifth, expatriates and foreign investors were getting the
best employment, best salaries, most equity and largest opportunity
for profitable returns.

12 3
It is appropriate here to examine the five issues separately.
Each review will include an analysis of the issue, first objectively
to determine whether more study is needed, and then subjectively to
help extract guidelines for policy makers. From these analyses,
several short conclusions and recommendations will emerge.
5.2 Review of Principal Patterns
Growth
In Chapter Two, it was noted that the tota) visitors in
Rarotonga increased by a factor of 3. 5 in 1974 up from 1973 then
more than doubled again by 1977, finally peaking in 1978 at nearly
18,000 visitors annually.
It was also noted that in 1975, the Cook Islands Tourist
Authority projected a potential 20,000 visitors for 1980. The trend
was certainly supportive of this projection at the ti me the surveys
were made. However, by 1979 the increases in world oil prices were
beginning to have an adverse effect on airline passenger fares. One
result was that the total visitors were 13,757 in 1979 down from
17 ,913 in 1978. It cannot be forecasted with any real assurance
whether this decrease is a temporary or pennanent trend.
Nevertheless, as we proceed with this analysis it is important to
bear in mind that voluntary constraints to growth were the major
issue then. It was not anticipated at that time that an involuntary
constraint to growth might develop.

124
Economic Contribution
In 1975 employment opportunities from· tourism industry expansion
i ad been projected at 350 persons, including 25 skilled workers.
:ds study reveals that there were in fact 464 persons employed full
time and 26 part-time. This was an impressive gain, equal in fact
to one-third of the work force employed by the government .
. It is apparent that the tourist industry as a whole employs 1.5
times as many males as females and that more than 60% of all those
employed were in the 20-35 year age bracket with only .about 20% over
that age.
Over 80% of all those employed were Cook Islanders whose salary
ranged from NZ$1,300 _to NZ$5,700 while 20% of the positions were
held by expatriates whose range of sa 1 ary was MZ$5 ,000 to
NZ$14,000. Since for the most part the expatriates held the higher
skilled positions, intensive training and career development for the
Cook Islands people could have a measurable impact on the retention
and distribution of wages and salaries in the local economy. It
would also seem that especially active female participation in this
training is warranted. Because of the general youth of the work
force both .receptivity to training and long-term value from the
investment can be expected.
Just over a third of those surveyed in households and in high
school expressed a desire to work in the tourist industry. A third
more in high school felt the need for more training before entering
the ·industry. In any case, tourism employment was not regarded as

125
very desirable. It would appear that some promotion of both the
benefits and the status of employment coupled with training to
improve that status could be undertaken.
Attitudes Toward the Effects of the Industry and Its Growth
The household survey, the survey of high school students and the
1 eadershi p interviews presented somewhat different viewpoints, but
with generally the same picture as if one viewed a computer image,
turning it to look at it from several angles.
The household sample, with largely male respondents, clearly
approved of the economic benefits that result from a viable tourism
industry. The opportunities for better paying jobs and for markets
for local produce and handicrafts were endorsed. These same
respondents were strongly supportive of tourism as a source of more
money for the island economy. However, they were less certain about
the merit of enlarging the indu.stry; indeed a substantial majority
wanted it smaller or at least to remain at status quo. This
hesitation to endorse expansion appeared to result from a fear that
cost of living increases would erode the obvious benefits. The
potential of an increase in crime was also a concern. Competition
from the outside, destruction of the environment and the possibility
of increased health problems were other constraints on their general
optimism.
The student respondents, who were largely female, with an
average age of seventeen, appear to be about evenly divided in their

126
support for tourism and their concern for any bad. effects. Like the
adults, they welcomed more money in the economy but their commitment
to this point was half as strong as the adults. However, they
showed twice as much interest in the potential of tourism to promote
better understanding of other people.
As typical students, they showed a greater concern for the
potential of negative impacts on the environment, in fact again
twice the concern of the adults. They also felt that crime would
increase. The possibility of increased markets, bett.er paying jobs
or new business opportunities was understandably .of very little
interest compared with the adults while they were consistently more
aware of a threat to the cul tu re. Such obvious differences between
the wage earners and those who are still at school says much about
the pragmatic nature of attitudes.
Interviews with both religious leaders and politicians were
conducted in order to get the viewpoint of those who were then
currently invol ved in decision mak irig. Al though the opinions of
these moralists and pragmatists together did not lend themselves to
statistical analysis, their responses did, nevertheless, appear to
be compatible with the results of these two surveys. Without
exception they took moderate positions on the merit of growth and on
the benefits and drawbacks of the industry to the community. Even
those who saw subs tan ti al opportunity for growth of the industry
thought that there should be a period of consolidation before it was
allowed or encouraged to grow. Stated simplistically, the moralists

127
wanted to protect the way of 1 i fe while the pragmatists wanted to
see a greater distribution of the benefits.
The image that emerges then is a set of attitudes that might
have been anticipated in any healthy and educated community. While
not fil 1 ed with surprises or reve 1 ations, it has the very rewarding
advantage of being the residents' image of their own community.
The fact that the tourist industry is currently not growing
seems to be fortuitous, taken in the light of the 1977 attitudes and
concerns. While there may be opportunities in the coming decade to
double today's visitor total, there would seem to be no great
urgency to do so, other than for purely economic considerations
relating to the gross national product. This may, therefore, be an
ideal time to maximize the values of the existing industry until
beneficial results lead to a change in attitudes. If this were done
soon, a popular demand to increase the growth of the industry might
emerge.
5.3 Cultural Considerations
In any analysis of tourism, it is important to consider the
impacts of tourism growth and other forms of development on the
unique social and cultural ·life-style of the Cook Islands.
In Rarotonga, over the last 20 years, there has been a revival
of cultural awareness. The development of the arts, whether it be
song, dance or the crafts, has truly been significant. Meanwhile,
traditional use of the Maori language has remained strong. Land and

128
inheritance rights have, if anything, been strengthened by
development. This is an encouraging situation and the outlook for
the 19801s is promising. However, tourism is a two-sided coin for
cultural development. Useful for its own value, the coin has a good
face and a bad one. As Cook Islanders look ahead to the next
decade, as they peer anxiously at their cultural future, they should
not. take the risk of merely flipping that coin. They should and
must decide which side will be face up.
As has been shown, in its pioneer years in Rarotooga tourism was
largely welcomed and thought to be .more beneficial than
detrimental. At the same time, substantial growth was not advocated
even by those who hoped to make their careers with employment in the
industry. In a study of tourism in Bali, Philip tt!<:Kean calls
attention to the "ironic theme" that, while modernization is
occurring, tourists expect the perpetuation of ancient traditions,
especially in the performing and sculptural arts, and would not
visit in large numbers if Bali became thoroughly modernized. Both
conservatism and economic necessity will encourage carvers,
musicians and dancers to have the funds for modernization. (McKean
1977:100) McKean calls this process "cultural involution" and goes
on to point out that the younger Ba 1 i nese 11fi nd their identity to be
sharply framed by the mirror that tourism held up to them. (It) has
1 ed many of them to ce 1 ebrate their own tr a di ti ons with continued
vitality."
Who is this tourist who holds a mirror to the residents? In

129
Rarotonga, he or she is perceived as having an ample budget, but is
neither rude nor unfriendly, as being easy to· please and probably
genuinely interested in our people and our islands. The tourist is
quite responsible and deserving of help. The tourist is both a
foreigner and a guest.
Does the presence of the tourist harm the culture? Perhaps to a
degree this is true but studies elsewhere and attitudes of residents
in this study suggest otherwise.
to stretch our vision beyond
To understand why, we are required
our stereotype of · the sunburnt
pleasure-seekers gawking about with cameras. As an exercise at
least, it is possible to perceive in the tourists the quest that we
all share--to see and understand the world, the profound human
desire to know others with the attendant possibility that we may
come to know ourselves.
Nunez ( 1963) points out that the alteration of one culture by
another has always been a fact of existence. "In this century
virtually no community is immune from outside contact and the
tourist is more ( common ) than any other kind of representative of
our cultures." He suggests that we must resist the temptation to
view indigenous people as unable to adapt to and assimilate a
changing world. On the contrary, in Bali, in Rarotonga, and in
numerous other visitor destination areas, the growing indication is
that such contact may selectively strengthen local traditions.
One tends to talk about culture mostly in terms of song, dance,
sculpture and other arts. What is often overlooked is that culture

130
is a total way of life, including, among other ·things, an econmic
structure. Each society has an econ.omic structure which is
constantly changing. Few Pacific economies are isolated enough to
be unaffected by world economic events. Most have elements of
western economic structures as wel 1 as very strong Paci fie
elements. In most Pacific Islands, the valuable economic resources
are. the peop 1 e, the 1 and and the sea. With a few exceptions, the
control of these resources is still held by the indigenous people.
This control is the key to cultural survival. Economic integrity
means cultural integrity. As long as major decisions are made by
Pacific Islanders themselves, self-determination and cultural and
economic integrity wiJl be maintained. We will make our mistakes in
making decisions and we will take responsibility for them, but they
will not be someone else's mistakes made on our behalf. The
economic traditions of the past may not remain intact, but they will
evolve in a dynamic way, the Pacific Way. Priorities within the two
frames may not have to be mutually exclusive; there may be, and
usually is, a way in which both cultural and economic frames can be
mutually beneficial.
5.4 Monitoring Growth and Further Research
The employment and residents' attitude surveys have now given
the Cook Islands' tourism industry a base for future research in
social and economic impact analysis. It may be the first time that
it has been possible to establish a baseline against which change in

social and economic conditions can be measured in the future.
Fortunately, we also have a baseline· for environmental impact
analysis as a result of research conducted in 1976. Although the
survey results have made it possible to determine the pulse of the
residents' attitudes toward tourism in 1977, the information gained
is only a partial diagnosis. It will be necessary to repeat the
surveys four to five years later to determine what changes have
occurred.
Unquestionably, the factors of familiarity with,
visitors, job
experience, environmental impact, and just mere pass�ge of time will
change conditions that exist among the residents, the visitors, and
the complex infrastructure that makes visitors in large numbers
possible. It is essential that these relationships be continually
examined as they are of extreme importance to the future of our Cook
I'sl ands way of 1 i fe.
Establishing a Social Profile
"Profiling is the process of describing the initial conditions
of an impact situation. It provides baseline social data of the
impact area from which the magnitude and intensity of changes,
induced and incidental, can then be estimated." (Finsterbusch &
Wolf 1977:153) Establishing a social profile constitutes a measure
of social con di ti ons prior to the time that effects of an
intervention are felt by the community affected. The categories
formed for the social profi 1 e will be the same as those used for

13·2
later impact assessment.
There are several techniques that can be used for social
profiling. One case study used leadership interviews, census data
and a local community planning survey which illustrates a
multi-method approach to social profiling. (White 1977) Another
technique is to use leadership surveys only. (Savatski & Freilich
1977) Another approach is the use of computerized data banks for
social profiling. (Aidala 1977) Still another technique is to
employ a quality of life production model in which var.ious economic,
political, environmental and social concerns are interrelated
inputs. (Liu 1977}
In this study a combination of leadership interviews, survey
research and census data was used to establish a social profile for
Rarotonga to provide baseline social data prior to the time that the
effects of large-scale tourism are felt. It is important that these
data be recorded in order to provide a base for measurement of
changes in the future that might take place as a result of tourism
development.
growth of
This provides information to policy makers so that the
tourism can be monitored in accordance with the
perceptions and attitudes of the Cook I sland people. It is in the
best interests of the people, the government and the touris�
industry that this be done, in order to avoid some of the pitfalls
of the industry in other locations.
Studies of this type have been done in the past. Anderson et
al. {1972} completed a -socio-economic profile of the island of
133
Kauai. Savatski and Freilich (1977) compared .the social change
potentials due to impending physical change in four communities.
The soci a 1 characteristics of these towns were compared through
leadership-generated community social profiles.
The social profile established by this study allows for the
assessment of the impacts of tourism four to five years 1 a ter.
Imp�ct assessment in this instance means evaluating a project or
policy in order to forecast its impact in the future.
Impact assessment can be in terms of economic, en�ironmental, or
social aspects. In many cases impacts are i�terrela:ted. Evaluation
of economic and environmental impacts of a policy or project is
genera.lly well understood, and the methods of doing this are fairly
sophisticated and well defined. However, social impact studies are
not so common nor well understood, and for this reason have not been
implemented. One of the bas_ic problems with social impact studies
is that it is difficult to measure some of the social indicators,
such as people's attitudes and feelings. However, people are
affected by a project or po 1 icy, and therefore it is important to
define what these impacts are and who are most affected by them.
5.5 Recommendations
After considering all the data, six recommendations emerge:
(1) The best efforts of the Cook Islands Tourist Authority and
Air New Zealand should now be devoted to maximize the values of the

134
existing industry. Activities should include increased management
training overseas, public education for a greater awareness of the
costs and benefits of tourisM, and additional concern for the
quality of the visitor experience, especially with reference to
contact with local people.
(2) The industry should recognize that the decrease in visitors
in 1979 and the levelling off in 1980 makes the projected total of
20,000 visitors a limited and important market. The visitors should
be surveyed to seek a full understanding of their e?<peri enc es and
how they feel they are treated. This survey should also determine
what they think their involvement with the residents and environment
should be. These surveys,along with surveys of residents• attitudes,
will go a long way to taking the pulse of the industry and
monitoring its heart.
(3) Existing tourism infrastructure and facilities on Rarotonga
are quite substantial for the size of the island and community. If
their use is to be maximized , then the industry must develop
further. This means developing markets for the off-season months of
the year so that faci 1 i ti es are used year round. Other strategies
include increasing neighbor island accommodation and air service,
building a fine golf course on Rarotonga, cultivating new markets
while continuing to promote existing markets, and refining services
and facilities, including medical care, banking, sports, exhibits
and shopping. The government should, however, adopt a po 1 icy of

135
slm>J gro!t1th,
visitors, a
including
1 evel that
setting a limit of no more than 30,000
can be accommodated utilizing existing
infrastructur9 and facilities.
(4) If the new target of 30�000 visitors for 1990 is agreed
upon and implemented by government, the surveys conducted as part of
this study should be repeated twice during the next nine years to
provide data for assessing impacts of tourism developments. The
resultant monitoring of resident attitudes will allow leaders to
implement a growth strategy cognizant of public attit4de�.
(5) While implementing this slow growth policy, the government
should examine the possibility of developing a culturally sensitive
strategy for tourism growth in the Cook Islands. Such a strategy
would make possible both the preservation and development of Cook
Islands culture and lifestyles. It is . crucial that those eMployed
in tourism development be encouraged to participate in detennining
how the communit� will interact with its visitors. In addition,
private business entrepreneurs, members of the Cook Islands Tourist
Authority, civil servants, and members of public bodies, including
village councils and religious authorities, should be encouraged to
work together in designing a type of tourism which is culturally
acceptable and economically feasible.
(6) The Cook Islands are a
Pacific. Other islands may well
small group of islands in the
be interested and willing to

136
undertake similar studies in their own countrie� and territories.
In most cases, where tourism is not well developed, such as in
Western Samoa, �Jiue, Tonga Vanuatu, the Solomons, Tuvalu, Kiribati,
the Northern Marianas and Papua New Guinea, these countries could
greatly benefit from such ·a study. It will allow decision makers to
establish baseline data in order to monitor future growth. In other
countries such as Fiji, Guam and French Polynesia, where a
substantial industry already exists, attitudinal and social impact
studies will allow decision makers to measure the pulse of .
residents' attitudes and evaluate the costs and benefits of
tourism. In these latter three countries and territories, the
industry is facing this issue with some concern.
It could be possible to implement these studies on approximately
the same schedule as that proposed for the Cook Isl ands. A sma 11
focal team of researchers could be trained to accomplish the field
work in each location, while computer analysis and summary reviews
could be accomplished following the pattern established by the
present study. Such a multiple approach might provide more than
multiple results; it might have the additional benefit of giving
binocular or in-depth vision into any one of the communities
studied, including a better understanding of what is happening
during the same period in the Cook Islands. The regional benefits
for long-range planning could be tremendous.
These are the questions that all those involved in tourism must '

137
ask themselves often: Where do we want to go? What should the
visitor industry offer ten years hence? Aside from any commercial
success, what benefits will tourism have contributed to the
community in which we live? What are the costs of commercial
success? Will we be satisfied in the future with decisions we make
now? The residents must be careful not to sell out themselves and
their islands to the world community. Their national beauty and
indigenous ways of life is what the visitor wants to see and share.
They cannot "beautify" their islands and emphasize �he .parts of a
way of life that the visitor might find more attractive at the
expense of other aspects of their culture. They must simply be
themselves.
The role of research in tourism development in the Pacific in
social and economic impact analysis is critical. Impact analysis is
a relatively recent phenomenon and the methodologies and models are
not well developed. But we must start somewhere, and we must devise
concepts and terminologies that are appropriate and relevant to the
Pacific Islands context. Assessment and monitoring of residents'
attitudes and employment patterns in any community is a beginning.
There is much more that can be done, and these crude tools can be
·refined.
We must invoi ve the community in the decision making process.
We must ask them what they want in terms of tourism development, and
we rrust make decisions that reflect the thinking of the community.

138
We are fortunate to have a community that is positive toward tourism
at the present time in Rarotonga and we must ensure that this
continues. The success of the industry probably depends on it;
continuance of the Cook Island quality of life certainly does.

139
APPENDIX

•
Area:
Station:
H.H. No:
RECOPJ>n:o SCHEDULE " '
COOK ISLANDS -
A STUDY OF TH:E SOCIAL A.t:D ECOHOJ.:I C
!?(PACT OF TOURISM
ON THE RAROTOJWA COrJ>lU?:ITY
constucted jointly by:
The Statistics Office, Central Planning Bureau,
with
Pamela Takiora Ingram Pryor,
The Cook Islands Tourist Au�hority, and
Cook. Island Library and Museum Society
140
COl\FID:El:TIAL
Rarotonga.
June, 1977

.( 1)
141
GD;ERAL rns�UCTICNS
(a ) This survey is a part of a study to provide information for future tourism
poricy deci:.:ion�. The information to be collected will be treated stri ctly
confi�entially ani your answers will be known to no one, as you are not
required to put your name or the name of any merr.ber of your family ( Household
(b) The particul�rs requested in this �estionnair� are expected to be S'l.:.pplied
and recorded by the � of the household. In his absence a k.nowledi;eable
person will record the particulars on behalf of the he;.d o:' the ho1.lsehoB . •
(c) The success of the study depenqs entirely on the aup�ly of correct
inforn.ation. So the respot.aent is requested to record correct ir.fo:nr.�tion
a.nd complete all the questions and not to leave any entrJ blank.
(d ) The members of the household will include ·all the persons who ate together
and slept in the house the previous night and those temporary absente es
who normally live in the house.

(2)
1. Please re.:i.d the note (pQ€e 3) and then record tr.e required particularo of �·our:ielf and :i.11 the members of your
housohold in the following table. Karee of the 11 e:r.br!ro of the hou::eholtl 1:eed not be wri ttcn. Only your rel::. ti onshi p
with each of the �embers is to be �entioned. -
Helationchip Highest Name of J!ame of the l!ours Heekly to the Place lnol of the post office/ahop/ worked calary/ head of Sex Age of Marital
cducntion Race Relit,"ion held or entabl i ohments/ during the wai;c the r/F yro Birth Status
attained type of hotel etc where last week received l1ouochold activity working
(k) () ) (aJ (b) {c) ( d ) (e) ( f ) (g) (h) ( i ) ( . ;)
-
I .p. N

(3)
143
NO'l'Es Instructions below refer to �be Question 1 on r:it;e 2.
Col. (a)
Col. (b )
Col. ( c )
Col. (d)
Col. ( e)
Col. (f )
Col. (g)
Col. · (h )
Col. ( i)
Col. (.�)
Mention all the members of the household specifying as 1 head'
hie or her spouse, hi� or her son, dau&hter etc.
Reccrd '?.1' for male, and 'F' for female.
Record age in completed years. Less than one year as '0'.
Record the name of the Island if born in the Cook Islands, or ncune cf the country if born abroad.
Record. ·�;y.�• for persona never married, ·��· for persons now married, 'ii' for persons whose husband or wife died and 'D' for persons who have been divorced or se?ar�ted.
Record for children less than 6 years 'Pre-echo.ol'; for school/ college going children, the class attending; and for those not attending scbool/col:ege, the last class attended or the hig!�est degree obtained.
Record 1 CI }jaori' or 'EU.rope an' or 'CI Maori/lliropean, or 'CI Maori/Polynesia' as the case may be. For others mention the race. l f the racial origins of all the members of the household are tl�e B81!1e1 mention the race of the "head of the household" ancl "then put(" )for all the other members.
Record 'CICC' 'RC' 'LDS' 'S!lA' etc. as the case mdy be. If the religious beliefs of the members of the household are the same, record the religion 'of. the he;...d and put (") for all the other members. Non-br�tised children will have �arenfs relit;"ion.
Mention the name of the post, specifying as 'clerk', 'shop assiDtar.t' 'hotel cook', 1maid111director', 'labourer' etc. Self €r.1ploymer.t
which does not provide any pa;yment need not be mentioned.
Name the office as 'Statistics .Office', 'Public Works', a.nd ehops :is 'CITC', 'UIT' etc and hotel as 'Rarotongan', 'Trailw�s' etc.
Cole (k) and (1) self explanatory.

-
2. i'le3Se �Ord t he particulilrs Of 7our cr..ilciren wto are away !':-om �ha ::ook !$la.r.da.
Relat1onshi o Y.ari tal ?l;.ce/Count� ?eriod or �·f)e o!' �o the Su �e Status where 0one ta ere J.Cti V: t: 8�
tead st:i.y 'io1�
I
(a} ?'lea.a• :nention b.ow lll&Q)' ;reun y(IU. �ve lived. in R.1roto�a.
Tears
(b) List other pl:.ces :JOU lived. ')efo� collll.n6 to �rotonp and tl:.e n\ll!iber of 7e:i.r� you l�ved in each ,1a.ce.
I
I::i:
IV
v
V1
4. Do you �t "JOUX !louse or i2 it your own?
(a) Rsnt
(b) Own
{c) Other (give de-t:J.ila ')e.J.ow}
144

(5)
5. If you answered (b), disregard this fiUestion.
145
If the house is not owned by you, please record the nasr.e of the owner of the house:
(a)
and the name of the o�me�� of the l<-::·: the hout;e is on:
(b)
6. Ple�se tick th� appropriate box to indicate whc decides the following activities of the ho�sehold.
(a) How much is spent on food each week:
0 Head 0 Spouse 0 No control
(b) How the money will be spent on other things:
D Head D Spouse 0 No control
(c) If the family will go to church:
0 Head . D Spouse 0 No control
(d) Ensure discipline of the ctildren ag�inst serious wrong doin�s:
D Head l_J Spouse
(e) Other important decisions of the tou�er.old:
D Head Q Spouse
0 No control
D No control
7. Do the members of the household obey and respect the guardianship of the head of the household as before? (s<l\Y 10 ye�rs before):
D AS before D Less th�n before
D Not at all

(6)
8. ?leue :nention the cilur<::i, clubs, &roups, .;;al:".e!l1 or o !her �!i•1itie11 :nenberv of your t.ousenol� ·;:ia.rt:i.cl;;a.te �n.
•!-'.embers Of �· Sex A.c.ti vi t7 ::.Ou.rs ;:>er
Household we ale
-
I
I
• �'.ent1an only ti:• relaticn-.hip u befoNI
9. Ple.ase :11er.tion ':he JOb (it a.ny), done �y ;;ou be:f'or'! t�e ;:>r'!cent or.e.
!;..1.i'te or t!le Name o! tbe office/ shop/ !lu:i:ber
Uirploj'l!lc"t j)OS't held or est a.blulur.ent s/ of :rea.rs t;rpe c:f' !lot al etc ·.1here ·•or>< ed. a.:: ti vi. !7 './O�:.:l6
-
146
(7) 147
10. Do you have o.r: �.nvestmen� in any-of the fcl lowing tourism industry?
D Yes o�:o If Yes, ple�e tick the appropriate bo:.:.
Capi t3.l Inve�tment fy�e of
Whclly Partly industry
owned owned Total Ca.pi t.:il
Inve!:ltr.:ent b:,r JO':. if sha:-ed
Hotel
Y.otel .
Restaur3J'lt
Transport
Duty free shop
�tert<linrnent .
Travel f>f;ency
Other ( specify )

(8) 148
�CUP.I sr J:::"TELCF�:::::T
�ATT!Tl�:::� ;u;J P:::?.C:::::P�C!'. CF LCCAL PEC?LE TC'.·:;._"'t'9S VISJTCRS A!r!) TCU�IS!·'.
11. Wc...ild you tell r.:c ·tthcl.t you fe·�lhavt: �ccn the rr.oct ir.-;portant develcprr.en: prcject� in t!:e Ccok IslunJs ir. the last ten year::.?
12. Do you apprcve or disapprove of the constrt:.ct�on of the new airport?
D Approve . 1
D Di.sapprcve 2
D Don'� Y....now 3
13. Would you w�nt �ore touristr to come to Raroto�g� ?r less tourists?
D ;.Jere tourists ,
D LP.SS tou·:ists 2
D '.!.'he same 3
D Tum' t k.r.ow 4
14. Do you think there are too many tot:.rists co�ing to Rarotonga �ow?
D D D D
':'co ma�
!: ot .. enough '
Just right
Don't know
15. Why would you like more tourists to come?
1
.2
3
4
OR, wlzy would you not like more tourists to come?
16. How often do you come into contact with, or meet
D Every day 1
D Every week 2
D Infrequently 3
D !.ot at all 4
a ·tourist?

(9)
149
17. '!)o you lock upon a tourist as a foreigner or a guest in our country?
D Foreigner
D Guest
0 Inell fferent
0 Don't know
1
2
3
4
18. Would you like to sen ,rnor�.hotels built on Rarotor-6a in the future?
20.
D ?fore hotel ;;; 1
D Sarne as at present 2
D Les s hotels 3
D Don't know 4
Do you kr.ow who owns the new Ra.rotongan Hotel ?
D Yes D !·;o
The propcrtior: of eha.rcholdiI"g in the new
0 '�:.r New Zeal�d �
D �iew -Zealand Coverr.r::ent Touri st Hotel Corporat ion 1
":,)
D Cook Isl a.nda Government 1 -:s-
Do you like the above sr.aring arra::gement?
0 Like
D Dislike
D Don't know
1
2
3
hotel is:
21. What are your feelings about the ownership of hotels, motels and other tourist facilities on Rarotonga today?
0 Too much out:.:ide ow:.ersbip 1
D Just right 2
D Doesn't matter who owns ....
3 �:-.em
D Not sure 4
22. If you feel there is too much outsi de ownership, how would you prefer to see it?
D
8
Joint ventu=e with outside ownership
�ore local ownership
Doesr.'t matter
1
2
3

150
23. De you think government should give incentive, guidance and suppo::-t
to local people so they can invest in tourism?
0 Yes 0 Ko
24. If Yes, should go vernment give support to local people throue;h
D Technical advice
0 Legal advice
D Financial support
c=.J Restricting foreign investment
25. Do you often go to a hotel for entertainment, drinks, or dinner?
O Yes
26. If your ans·,,er to the above ia Yes, tick the releva.'lt boxes
0 Entertainment
D '!:>inner
D Lunch
D �inks
27. If you don't go tick the appropria�e boxes
0 Uot interested
c:J Too expensive
I:J Against religious beliefs
0 Transportation problem
28. Which of the following describ e what you see or feel are good or � things about tourism in the Cook Islands lW\'/? Tick the appropriate boxes.
GOOD THINGS BAD THINGS
D More jobs D Menial jobs
D netter.paying jobs D Increases cost of living.
D More money on the Island D Harms local cult�re
D Better markets for local D Promotes more crime produce or handCrafts
D Revives local culture D Lose our friendliness
D More things to do and see, D More· outside businesses or buy and investors

( 11)
28. ( ccntd)
0
D
�ore op;:orturut:r for local bus1neaa 111� inveatmar.ts
?::-omotea better u::.�ersta.n.ilng of other ;ieopls
D
D
Destroys the anvirocment
Int:"Oduces :iew ideJ.S "-lid .,,a:ra
0 Y.ore !:.ee.ltb ;iroblea:a
Otha:' ------------ Other �------�-
29. lhueh of the above "i;ood,. �d "bad" tlung11 would :rou !eel 0011t sti'Q�l7 &bout?
Cood. thinc1
;o. Jo you oo.,, :!:.e .;everr.r.:ent hu a. ;>o:!.:.ey of controlled tou.nsm?
Dru )1. Do 7au. feel that :he ;i:-eaent goverr.m.ut ;:olicy of cont rolli� the bl"Q'olth
of :ourism �a :he :-:g::t thir.g or the \olf'Oll€; :tung to d.o?
D :li &ht t !:i.:ig D ·,1rong ) ur-.& D Jon' t. :C.ow
)2. Do you fed t:.at the �wth of tourism shocld be cont:-oll ed by Cove:"!"..tr.ent or not?
D Cont:-oll�
0 ?:ot contI'Ql lad D Don't bow
2 )
33. An ;rou 'ltOr;dng in the toUl'lat i::dustry? (liotala/l<otela, '!'?-3.vel �enciea, !>.it7 free sho�s, Sandicra.fta etc )
0 !ea O :ro
(:t.) !! :iot, 1tOuld ;;ou like :o ·�orlt �:l the tou:: at industry?
tJ Yea O ::o
)4. If �ore !:.ctala are built on Rarotong:i 40uld you li�e :o see :he� scattered �round :be :alan� or confi:ied :o a �ew ;>l�ces?
D Scat�end 0 Confineci
0 ::On 't !a:ow 2
151

(12) 152
35. Choose from the following alternatives t hose which express your feelings about future to.l!:l developmer.t? Tick the appropriate bcxes.
0 On beaches D LarE;e hotel
D Inland D :;mall hotel
D On hills D Island design
D �:ul ti-storey buildings , D !:on-Island design
D Singl�storey buil dirl€;S
36. .�eeping in 1r.ind .,.;hat yo'J. have indicated in 34 and 35 above, doe<: the
location, size c:.ml design of hotels and r.:otele: me3.Sure i;p to your expectations or not?
£ 1·'.easure up 1
Don't measure up 2
D ?&rtly 1:1easure up 3
D ')On' t know 4
37. \n:.ich of the foll owing Favct:rable and Un:.:i.vourable factors which \-�ould b� i�port.'.lnt to a tourist, do you see as rr.ost characteristic of Rarotonga now? Tick the appropriate boxes.
Favourable Fact ors
D Good Climate
D 3eautiful 1;atural Scenery
D ::nil din�s, churches etc
D Food
D Comfortable accommodation
D Wam, friendly people
D i�ttracti ve cus·toms, way of life
D �otic environment
D Reasonable prices
0 fl:any things to do and . see
D New, unspoilt place
D Good shopping
D D
D
D
D D D
D D
D
Unfavourable F'<lctors
Lnpleasant climate
Littered beaches and public places
Cnsanitary conditions in public places
High prices for food, lodging etc
Rude, unfriendly people
Complicated Entry and departure procedures
High cost of fare
Too commercial
Hot enough to do and see
Problems with language

( 13) 153
38. Which of the following sectors should spend more money to further develop tourism? Tick the a ppropriate box.
0 Government
D Private enterprise
[:J Joint venture
39. How do you feel about a tourist? Tick the appropriate boxes.
0 D 0 D D D D
D .D D D
D
Person with plenty of money
Person with some money but on a limited budget
Person who is rude a.nd unfriendly
Person who ic friendly and easy to approach
Ferson who is hard to please
Person who is easily pleased
Person who is gen�inely interested in people and the Cook Islands
Person who is only interested in wha.:t he wants to do or know
Person who is noisy, loud and boisterous
Person whG is qui.et, responsible and shpws respect
Person whom you would like to help anytime
Person who should be left alone

( 14) 154
Now one final question. Do you mind telling me from this table below which income gro�p the household income fell into last weeic?
� Up to $20 1
Over $20, up to $30 2
Over $30 up to $40 3
Over $40 up to $50 4
Over $50 Up to $60 5
Over $60 up to $70 6
Over $70 up to $80 7
Over $80 up to $90 8
Over $90 up to $100 9
Over $100 up to $150 1 0
Over $150 11
·Don't know 12
Refused 13

155
BIBLIOGRAPHY
Aidala, J.V., Jr. Computer-Assisted Social Profiling: Some Uses of Computerized Data Banks in Social Impact Assessment, in K. Finsterbusch and C. · P. Wolff (eds.), Methodology of Social Impact Assessment. Pennsylvania: Dowden, Hutch inson & Ross, 1977.
Allport, G. W. Personality: A Psychological Interpretation. New . York: H. Holt and Company, 1937.
Anderson, et al., Social Profile of Kauai, 1972.
Babbie, Earl R. Survey Research Methods, California: ·Wadsworth Publishing Co., Inc., 1973.
Bluhn, W. T. Ideologies and Attitudes: Modern Political Culture. Englewood Cliffs, New Jersey: Prentice-Hall, 1974.
Bryden, John M. Tour.ism and Developnrnent: A Case Study of the Commonwealth Carribbean. Cambridge University Press, 1973.
Cant, R. G. Tourism in Queenstown, an Invitation to Dialogue, Department of Geography, University of Canterbury, Christ-Church� New Zealand, 1978.
Chaplin, G. "Island's Tourism Role: A Key Creator of Jobs." Honolulu Advertiser, December 5, 1978.
Cohen, Erik. "Toward a Sociology of International Tourism," Social Research 39(1), 1972.
. "Who is a Tourist? A Conceptual Clarification," ------Sociological Review 22(4), 1974.
Cook Islands Government. Cook Islands Census of Population and Housing, 1976. Statistics Office, Central Planning Bureau, Rarotonga, 1977.
Cook Islands Tourist Authority Act, 1968.
Cook Islands Tourist Authority, Annual Report, Rarotonga, March 31, 1977.

156
Philosoe_hy, G�als and Policies for Industry Development and Organizational Structure, Objectives and Functions, Tourist Authority, 1974.
. Quarterly Statistical Bulletin, October to December, --�,9�7 � 4�,�S- t-a-tist 1cs Office, Central Plannfng Bureau, Rarotonga.
. Cook Islands Statistical Abstract. Statistics Office, Central Planning Bureau, Rarotonga, Cook Islands, 1979.
Cook Islands Legislative Assembly. Papers and Bills Presented, 1972. Cook Islands Tourist Authority, Annual Report, 1971.
Cook, J.G. An Assessment of the Effects of the Tourist Industr� the Econ� of the Cook Isl ands, 1969.
Cowan, G. "Cultural Impact of Tourism with Particular Reference to the Cook Islands," in B.R. Finney and K.A. Watson, eds., A New Kind of Sugar, Culture Learning Institute, Hawaii: East West Center Press, 1975.
Crocombe, R. G. Land Tenure in the Cook Islands. Australia: Oxford University Press, 1964.
, {ed.). Land Tenure in the Pacific, 1971. -------
Crouch, R. T. The Effects of Fa'a Samoa on Tourism and the Effects of Tourism on Fa'a Samoa. Paper pr-esented at East-l�est Center, TOI Workshop, February, 1975.
Edelman, Klauss M.F. "Major Problems of Tourism in Developing Countries," Annals of Tourism Research 3(1):33-43, 1975.
Environmental Research Ltd. Report on the Tourist Potential in the Cook Islands, Auckland, New Zealand, 1969.
Fairbairn, I. J. "Pacific Island Economies," Journal of the Polynesian Society, March, 1971.
Finney, B. R. and K. A. Watson, {eds.) A New Kind of Suga�, Cultural Learning Institute, Hawaii: East-West Center Press, 1975.
Finsterbusch, K. ·and K. C. P. Wolf (eds). Impact Assessment. Pennsylvania: 1977.
Methodology of Social Dowden, Hutchinson, Ross,
Floyd, C.M. Review.
Phxsical Plannina in the Cook Islands: Preliminary United Nations A visory Team, Suva, Fiji, 1973.

157
Force, R. W. and Brenda Bishop (eds.). The Impact of Urban Centers in the Pacific. Papers from the Theme Symposium of-Uie-Second Inter-Cong-ress of the Pacific Scienc� Association, University of Guam, May 20-25, 1973.
Fox, M. ''The Social Impact of Tourism -- A Challenge to Researchers and Planners," in B.R. Finney and K.S. Watson, eds., A Ne\'>' Kind of Sugar, Hawaii: East-West Center Press, 1975.
Franklin, Billy J. and Harold W. Osborne (eds.). Research Methods: Issues and Insights. California: Wadsworth Publishing Co., Inc • , 1971 .
Frey, V. The Impact of Mass Tourism on a Rural Community in the Swiss Alps. Michigan: University Microfilms International, ...... , 9"'""7...,6.--.-
--'--
Friedl, J. "Benefits of Fragmentation in the Traditional Society: A Case from the Swiss Alps," Human Organization 32:29-36, 1973.
Fujii, E. T. and J. Mak. An Assessment of the Costs of Economic Growth: Crime and Tour1 sm in Hawaii. UnpubTiSllecr-paper, �H-0-no� l� u�l�u- ,�,�9-7�7 - .������������
Fujii, E.T., J. Mak & E. Nishimura. Tourism and Crime, Tourism Research Project: Occasional Paper No. 2, University of Hawaii, Honolulu, Hawaii, 1978.
Greenwood, D.J. Agriculture, Industrialization and Tourism: The Economics of Modern Basque Farming, Michigan: University Microfilms International, 1970.
. "Tourism as an Agent of Change," Ethnology --'='""'5(�1 �, )-:-80--- 91 , 197 0 •
Guam, Government of. Guam's Visitor Industry -- An Economic Assessment, Economic Planning Division, Bureau of Planning, Agana, Guam, 1977.
Guam, Government of. The Agana Urban Region Planning Project. Department of Land Management, Division of Planning, Agana, Guam.
Harrell, James N. Bridging the Cultural Gap: Tahiti, ·A Management Case Study. New York: Cornell University, 1973.
Harris, Kerr, Forster & Co. and Belt Collins & Associates. Program of Tourist Development for French Polynesia, 1970.

158
Hawaii Visitors Bureau. Annual Research Report. Honolulu, Hawaii 1976.
Herrmann, C. C. Research for National Tourism Policy Formulation. Unpublished paper presented to the Sixth PATA Travel Research Seminar, Honolulu, Hav-1aii, 1978.
Inder, S. (ed.). Pacific Islands Year Book, 13th Edition. Australia: Pacific Publications, 1978.
Jafari, J. Role of Tourism on Socio-Economic Transformation of Developing Countries. M.A. Thesis, Cornell University, 1973.
JASMAD (with Boffa Jackman & Associates). Government of the Cook I s 1 ands Report on Tour i s m Re 1 a
�t�e_ d __ F _a c_1_· ·_1 i_t_i_e_s_:.., __ R a_r_o_t_o_n_..g'-a _
_ &
Aitutaki, Auchland, New Zealand, 1978.
Kloke, C. "South Pacific Economies and Tourism," in B. R. Finney and K. A. Watson, eds., A Nev-1 Kind of Sugar, Hawaii: East-West Center Press, 1975.
Knox, J. M. Classification of Hawaii Residents' Attitudes Toward Tourists and Tourism, Tourism Research Project: Occasional Paper No. l, University of Hawaii, Honolulu, Hawaii, 1979.
Research Priorities in Hawaii and the Pacific: An Overview, Tourism Research Project: Occasional Paper No. 3, Un·iversity of Hawaii, Honolulu, Ha1·iaii, 1979.
Tourism Research Priorities in Hawaii and the Pacific (Vol. I: Survey Results). Tourism Research Project: Occasional Paper No. 4, University of Hawaii, Honolulu, Hawaii, 1979.
Tourism Research Priorities in Hawaii and the Pacific (Volume II: Project: Occasional Honolulu, Hawaii, 1979.
Technical Comemnts). Tourism Paper No. 5, University of
Research Hawaii,
Kolff Economic and Financial Stocktaking and Development, Planning Survey for the Government of the Cook Isl ands. Legislative Assembly Paper, Rarotonga, 1967.
Krueckeberg, D. A. & A. L. Silvers. �'.ban Planning Analysis: Methods and Models. New York: John Wiley & Sons, 1974.
Lefevre, T. "Rarotonga Airport: A Preliminary View of the Possible Balance Sheet," in B. R. Finney and K. A. Watson, eds., A New Kind of Sugar, Hawaii: East-West Center Press, 1975 (a).

159
"Who Gets What from Tourists?" in B. R. Finney and K.A. Watson, eds., A New Kind of Sugar, Hawaii: East-West Center Press, 1975(b).
Lemon, N. Attitudes and Their Measurement. London: Bats ford, 1973.
Liew, Y. M. Implication of Tourism for the Cook I slands. Unpub-lished Honor's Thesis, University of Otago, Dunedin, New Zeal and, 1977.
Liu, B. "A Quality of Life Production Model for Project Impact Assessment," in K. Finsterbusch & C. P. Wolff, Methodoloqy of Social ImP.act Assessment. Pennsylvania: DOloJden, Hutchinson &
Ross, 1977.
Mackey, Roger M. The Assessment of Social and Cultural ChangP.: The Case of Tourism and Ecological Psycholog_y in -the Soutti __ _ Paeific. Masters Thesis, U111vers1ty oTRaiia11�nolulu, Hawaii, 197�
McKean, P.F. "Towards a Theoretical Analysis of Tourism: Dualism and Cultural Involution in Bali, in V. L. Hosts and Guests, Pennsylvania: University of Press, 1977 .
Economic Smith, ed.,
Pennsylvania
Nie, N. H., C.H. Hull, J.G. Jenkins, K. Steinbrenner, and D.M. Benf. Statistical Package for the Social Sciences, 2nd Edition. New York: McGraw-Hilf Book Co., 197 .
New Zealand Government. Tourism and the Environment. Department of Lands and Survey, Wellington, New Zealand, 1978.
Report of the Tourism Advisory Council to the Minister of Tourism. Honorable H. R. Lapwood, �Jellrngton, New Zeal and, 1978.
New South Wales Department of Tourism. Mid-North Coast Resident Attitudes Survey, New South Wales, Australia, 1976.
Nunez, T. A. "Tourism, Tradition and Acculturation: Weekendismo in a Mexican Village," Ethnology 2(3):347-52, 1963.
Okotai, T. The Potential Impact of Tourism on the Coastal Resources of Rarotonga� Unpublished thesis, University of Canterbury, New Zealand, 1977.
Organization for Economic Cooperation & Development. Tourism Policy and International Tourism in OECD Member Countries, 1979.

160
Polansky, N.A. (ed.). Social Work Research Meth__ods for the t�elping Professions (Revised Edition). Chicago: University of Chicago Press ;-1915.
Pacific Islands Tourism Conference Proceedings. Sponsored by PIDC, Agana, Guam, 1973.
Parker, Lance V. Tourism in the Small Community: A Cross-Cultural Analysis of Development Change. Ph.D. Dissertation, University OTlJregon, f974.
Peters, M. International Tourism. England: Hutchinson of London, 1969.
PIDC Honolulu. The Pacific \�ay: Proceed�s of Pacific Islands Tourism Conference. Pacific Islands Tourism Conference, Pago Pago�
Research Associates. A Study of Current Voter Attitudes Toward the Visitor Industry. -vTSitor Industry Education Council, Honolulu, Hawaii, 1975 .
Robineau, Claude. 11The Tahitian Economy and Tourism," in B.R. Finney and K. A. Watson (eds.), A New Kind of Sugar. Ha1<1aii: East-West Center Press, 1975.
Samy, J. Crumbs from the Table? The Workers' Share in Tourism, in B. R. Finney and K. Watson (eds:), A New Kind of Sugar. Hawaii: East West Center Press, 1975 •
• Employment in the Social Industry: A Case Study. �is, University of the South Pacific, Suva, Fiji, 1972.
Savatski, P.O. & E. 0. Freilich. "Leadership Generated Social Profiles," in K. Finsterbusch and C. P. Wolff (eds), Methodoloqr
of Social Impact Assessment. Pennsylvania: Dow den, Hutchinson & Ross, 19
Selltiz, C. L. S. Wrightsman and S. W. Cook. Research Methods in Social Relations (3rd Edition). New York: Holt, Rinehart &
Winston, 1976.
Smith, V. L. (ed.). Hosts and Guests: The Anthropology of Tourism. Pennsylvania: University of Pennsylvania Press, Inc., 1977.
Snedecor, G. W. and W. G. Cochran. Statistical Methods, 6th Edition. Ames: Iowa State University Press, 1967.

State of Hawaii. State Tourism Study: Manpower. Department of Planning and Economic Development, Honolulu, Ha\vaii, 1978.
161
State of Hawaii. What Hawaii's People Think of the Tourist Industry. Department of Planning and Economic Development, Honolufu, Hawaii, 1975.
Tourist and Publicity Department of New Zealand and Air New Zealand. Tourist Development, Rarotonga, Cook Islands, 1968.
Tupouniua, S., R. Crocombe & C. Slatter (eds.). The Pacific Way. Fiji: South Pacific Social Sciences Association, 1975.
Wah'ab, S., L. J. Crampon, and L.M. Rothfield. Tourism Marketing. London: Tourism International Press, 1976.
Warner, D.C. A Decade of Tourism: The S ocio-Economic Impact of Guam's Visitor Industry, 1967-1977. Unpublished manuscript. Agana, Guam, 1978.
Weiss, C. H. Evaluation Research -- Methods of Assessing Pro�ram Effectiveness. New Jersey: Prentice-Hall Inc�, 1972.
Wolbrink & Associate�, Inc. Physical Standards for Tourism Development. Prepared for PIDC.