Influence of the wind field on the radiance of a marine shallow: evidence from the Caspian Sea*...
19
Influence of the wind field on the radiance of a marine shallow: evidence from the Caspian Sea* doi:10.5697/oc.54-4.655 OCEANOLOGIA, 54 (4), 2012. pp. 655 – 673. C Copyright by Polish Academy of Sciences, Institute of Oceanology, 2012. KEYWORDS Caspian Sea SeaWiFS Radiance Sediments Resuspension Genrik S. Karabashev ⋆ Marina A. Evdoshenko 1 P. P. Shirshov Institute of Oceanology of the Russian Academy of Sciences (IO RAS), 36, Nahimovski prospect, Moscow, Russia, 117997; e-mail: [email protected] ⋆ corresponding author Received 25 June 2012, revised 3 September 2012, accepted 1 October 2012. Abstract The influence of the near-water wind field on the radiance of a marine shallow was studied on the basis of daily SeaWiFS ocean colour scanner data and QuickScat scatterometer wind data collected from 1999 to 2004 in the southern Caspian Sea, where the deep basin borders a vast shallow west of the shore of meridional extent. It was found that radiance distributions, clustered by wind rhumbs, exhibited different long-term mean patterns for winds of opposing directions: within the shallow’s boundaries, the radiances were about twice as high for winds having an offshore component with reference to the onshore wind conditions. The zonal profile of radiance across the shallow resembled a closed loop whose upper and * This work was supported by the Russian Foundation for Basic Research, grants 08- 05-00298a, 12-05-00441a. The paper was presented at the VI International conference ‘Current Problems in Optics of Natural Waters’, St. Petersburg, Russia, September 6–10, 2011. The complete text of the paper is available at http://www.iopan.gda.pl/oceanologia/
Transcript of Influence of the wind field on the radiance of a marine shallow: evidence from the Caspian Sea*...

Influence of the wind
field on the radiance
of a marine shallow:
evidence from the
Caspian Sea*
doi:10.5697/oc.54-4.655OCEANOLOGIA, 54 (4), 2012.
pp. 655–673.
©C Copyright by
Polish Academy of Sciences,
Institute of Oceanology,
2012.
KEYWORDS
Caspian SeaSeaWiFSRadianceSediments
Resuspension
Genrik S. Karabashev⋆
Marina A. Evdoshenko
1 P. P. Shirshov Institute of Oceanologyof the Russian Academy of Sciences (IO RAS),36, Nahimovski prospect, Moscow, Russia, 117997;
e-mail: [email protected]
⋆corresponding author
Received 25 June 2012, revised 3 September 2012, accepted 1 October 2012.
Abstract
The influence of the near-water wind field on the radiance of a marine shallow wasstudied on the basis of daily SeaWiFS ocean colour scanner data and QuickScatscatterometer wind data collected from 1999 to 2004 in the southern Caspian Sea,where the deep basin borders a vast shallow west of the shore of meridional extent.It was found that radiance distributions, clustered by wind rhumbs, exhibiteddifferent long-term mean patterns for winds of opposing directions: within theshallow’s boundaries, the radiances were about twice as high for winds havingan offshore component with reference to the onshore wind conditions. The zonalprofile of radiance across the shallow resembled a closed loop whose upper and
* This work was supported by the Russian Foundation for Basic Research, grants 08-05-00298a, 12-05-00441a. The paper was presented at the VI International conference‘Current Problems in Optics of Natural Waters’, St. Petersburg, Russia, September 6–10,2011.
The complete text of the paper is available at http://www.iopan.gda.pl/oceanologia/

656 G. S. Karabashev, M. A. Evdoshenko
lower branches corresponded to the offshore and onshore winds respectively. Theloop was the most pronounced at sites with 10–15 m of water for any wavelengthof light, including the red region. On the basis of specific features of thestudy area, we attributed this pattern to sunlight backscattered from bottomsediments resuspended by bottom compensation currents induced by the offshorewinds.
1. Introduction
Optical shallowness implies that the water-leaving radiance Lwn ofa basin depends both on the optical properties of the water body and on thelight backscattered from its bed and/or from bottom sediments resuspendedby bottom currents. The latter factors hamper the retrieval of chlorophyllfrom Lwn measured in shallow basins but they can be useful for the remotesensing of near-bottom water flows (Karabashev et al. 2009).
The thickness of the layer from which radiance originates
Zor(λ) = 1/Kd(λ) , (1)
where Kd(λ) is the coefficient of daylight attenuation in water at a wave-length λ (Gordon & McCluney 1975). Kd at λ = 470 nm ranges from
0.02 m−1 in oligotrophic waters to 1 m−1 or higher in ultra-eutrophicocean areas or inland seas. Hence, an optically shallow aquatic area canbe as deep as 50 m. The remote sensing of such areas has been goingon for decades since the beginning of global satellite observations in themicrowave, IR and visible ranges. The near-bottom effects can be directlymonitored exclusively in the visible since the IR and microwave signalsoriginate at the air-water interface. There are a number of studies dedicatedto bottom reflectance and the underwater light field in the context of remote
sensing (Boss & Zaneveld 2003, Mobley & Sundman 2003, Kopelevichet al. 2007, and others) but we failed to find experimental evidence forthe contribution of light, backscattered by resuspended sediments, tothe distribution of radiance in large marine shallows, although sedimentresuspension is frequent there and has attracted the attention of manyresearchers (Demers et al. 1987, Arfi et al. 1993, Booth et al. 2000, Schefferet al. 2003, and others).
The aim of our study was to come to a tentative conclusion whethera consistent relationship exists between winds of diverse directions andthe distribution of the water-leaving radiance in a shallow aquatic areaextending for tens of kilometres and more. A further objective of this workwas to find out whether the reflectance of the resuspended sediments couldbe strong enough to dominate the bottom reflectance.

Influence of the wind field on the radiance of a marine shallow . . . 657
2. Approach, materials and methods
The sea surface layer takes only a few hours to adjust to abrupt changesin wind strength and direction, whereas satellite images are obtainedonce a day at best. Considerable uncertainty therefore exists concerningthe wind field configuration that shapes the distribution of optically-significant seawater admixtures at the instant of flight of a satellite colourscanner. Plausible wind field inhomogeneity is another cause of possiblemisinterpretation of the relationship between wind conditions and radiancedistributions in the satellite images when these are compared on an everydaybasis.
We have assumed that these difficulties can be at least partly bypassedif we cluster the images of a shallow area by wind directions at the instantsof the survey and use the mean radiance distribution of a cluster to findfeatures characteristic of respective wind conditions. Presumably, theaveraging of a well-populated cluster of radiance distributions will resultin a mean radiance distribution whose features are more closely related tothe respective wind direction thanks to the random nature of the aboveuncertainty.
Our approach implies the use of the red radiance Lwnred at λ> 650 nmand the reference radiance Lwnref at wavelengths of the ‘transparencywindow’ (from about 470 nm in the open ocean to 560 nm and more inthe least transparent waters (Jerlov 1976)) as guides for distinguishing theeffects of the backscattering of light from the resuspended bottom sedimentsand from the interface between the sea bed and the water thickness (bottomreflectance). The water itself absorbs red light to such an extent that theorigination layer of the red water-leaving radiance is universally no morethan 2–3 m thick (Figure 1). Hence, at sites with more than 3 m of water,the bottom reflectance contributes nothing to Lwnred although the latterremains sensitive to resuspended bottom sediments penetrating the near-surface layer. In other words, the 3 m depth is a universal threshold ofred radiance sensitivity to bottom reflection (Figure 1), and the similarityof the horizontal distributions of Lwnred and Lwnref over the shallow areapoints to a particularly strong resuspension of bottom sediments, becauseZor for Lwnref delimits a much thicker surface layer than Zor for Lwnred does(Lwnref/Lwnred criterion).We chose a shallow in the south-eastern Caspian Sea as the study area
(Figure 2) because it has the features of a desired natural model: (1) thewaters of the South Caspian basin, flowing across the shallow, are fairlytransparent (Simonov & Altman 1992), which facilitates observations ofresuspension effects; (2) the bed of the shallow is mainly free of sea grassand consists of bare sand, silt and other light-coloured sediments that are

658 G. S. Karabashev, M. A. Evdoshenko
400 450 500 550 600 650 70018
16
14
12
10
8
6
4
2
0
wavelength [nm]
Zor
-1[m
]
IIIII1357
= 0.06 mKd-1
Kd-1= 0.4 m
Figure 1. Wavelength dependence of the thickness of the radiance originationlayer Zor according to (1) and Jerlov’s optical water types II and III (ocean waters)and 1–7 (coastal waters) (Table XXVII in Jerlov 1976). The asterisks indicate Zor
at minimum and maximum Kd(490) characteristic of the study area (Figure 2)according to monthly mean distributions computed from MODIS-Aqua data forApril–September at http://disc.sci.gsfc.nasa.gov/giovanni/
detachable from the sea floor by quite moderate water motions; (3) digitalbottom topography of the Caspian Sea is available online at http://caspi.ru/HTML/025/02/Caspy-30-10.zip (Figure 2b); (4) the shallow extends forabout 200 km in latitude and from 40–50 to 110–120 km in longitude andis clearly delimited by the shore line in the east and by an underwaterprecipice to the west of the 20–30 m depth contours (Figure 2b); (5) onlya few rivers with a minor discharge rate enter the south-eastern CaspianSea, which minimizes the occurrence of externally supplied sediments;(6) the bottom relief is fairly smooth at sites of plausible sedimentresuspension (depth range up to 15–20 m, Figure 2b); (7) the south-easternCaspian Sea is a region where sunny weather prevails.
Our approach implies the use of a long-term data set of the Sea-viewingWide Field-of-view Sensor (SeaWiFS), since it is equipped with a sun-glintavoidance facility. Use has been made of archived water-leaving radiancedistributions at wavelengths 412, 443, 490, 510, 555 and 670 nm as standard

Influence of the wind field on the radiance of a marine shallow . . . 659
0 16 32 48 64 80 96 112128144160176192208224
Y
47o 48 49 50 51 52 53 54o o o o o o o
l Eongitude
47
46
45
44
43
42
41
40
39
38
37
o
o
o
o
o
o
o
o
o
o
o
lati
tude
Na
X
240
224
208
192
176
160
144
128
112
96
80
64
48
32
16
0
b
Figure 2. Location of the study area (heavy-line rectangle) in the Caspian Sea(a) and isobaths of the bottom relief of the area in metres relative to the 27 m sealevel plotted from http://caspi.ru/HTML/025/02/Caspy-30-10.zip (b). X and Y[km], are the distances in longitude and latitude from 51◦30′E, 36◦30′N
level L2 products with pixel size 1.1× 1.1 km, collected during the NASAglobal ocean mission in the 1999–2004.
The second data set involves the daily estimates of the near-waterbefore-noon wind vectors obtained at 15′ spacing with the scatterometerQuickScat in 1999–2004 and available at http://poet.jpl.nasa.gov. Werestricted ourselves to eight wind velocity directions with the followingdesignations and mean azimuths ϕi: S-N, ϕ1 = 0◦; SW-NE, ϕ2 = 45◦; W-E, ϕ3 = 90◦; NW-SE, ϕ4 = 135◦; N-S, ϕ5 = 180◦; NE-SW, ϕ6 = 225◦; E-W,ϕ7 = 270◦; SE-NW, ϕ8 = 315◦. Any wind vector in the range ϕi ± 22
◦30′
was assigned to the i-th direction.
The SeaWiFS and QuickScat data and the bottom bathymetry weredisplayed for every year day (YD) as superimposed maps of the testing area(Figure 2). The data of a YD were regarded as acceptable if (a) the validwind estimates made up at least 50% of their possible number within thetesting area; (b) V > 3 m s−1, where V is the wind speed averaged overthe testing area; (c) there were no mesoscale radiance extrema extendingover the area (for instance, occasional east-bound plumes from the nearestriver mouths crossing the 20–30 m isobaths). We neglected the YDs withwind vectors not exhibiting any dominant direction. The wind data for

660 G. S. Karabashev, M. A. Evdoshenko
selected YDs were clustered by the above azimuths ϕ1−8, and respectivesubsets of radiance data, similar to the wind clusters in the YDs involved,were composed for subsequent analysis. Selection of YDs by wind featuresresulted in severe shrinking of data. The data volume was additionallyreduced when passing from wind clusters to the radiance ones, since thewind data were much more regular than the sea surface images in the visible.The geographical coordinates of the pixels of the images were converted
into linear ones relative to 51◦30′E, 36◦30′N (Figure 2). The pixel radiancesof every cluster were averaged over the period from 1999 to 2004 in 4× 4 kmbins after the removal of outliers based on the three sigma rule. In thecase of well-populated clusters, a high statistical significance was typicalof the averaged binned radiances Lwnav(λ) because they were calculatedfrom samples of 200–300 members. The averaging resulted in geographicallyidentical tables of Lwnav for λ= 412, 443, 490, 510, 555 and 670 nm for eachof the eight clusters. These tables were used for visualizing the spatialbehaviour of the spectral radiances.
3. Results
The information obtainable from a comparison of radiance distributionsof winds from different directions depends on the cluster population. In ourcase, the number of members Ni of the i-th cluster at wind azimuths ϕ1...8
varied as 4, 2, 33, 13, 11, 14, 34 and 5. The most and equally populatedclusters (N3 = 33, ϕ3 = 90◦) and (N7 = 34, ϕ7 = 270◦) correspond to eventsassociated with the onshore and offshore winds (Figure 2b).Onshore and offshore winds. Figure 3 displays the spatial behaviour
of radiances in the blue, green and red (λ= 443, 555, and 670 nm). Forbetter comparability, we expressed the mean radiance Lwnb of a bin ata given wavelength as a fraction of radiance range, common to the offshoreand onshore conditions:
Lwnb% = 100Lwnav − Lmin
wnav
Lmaxwnav − Lmin
wnav
, (2)
where Lmaxwnav and Lmin
wnav are the maximum and minimum radiances of clustersϕ3 = 90◦ and ϕ7 = 270. The radiance of the shallow in Figure 3 substantiallyexceeds that of the South Caspian basin at any wavelength regardless ofwinds, but radiance distributions within the shallow’s limits exhibit explicitdependences on wind direction and spectral range. The maximum Lwnb
is located east of the 5 m depth contour. Under the offshore conditions(Figure 3, (a)–(c)), the maximum Lwnb occurs closer to the shore, shiftssouthwards and occupies a smaller area when passing from the blue spectralrange to the red one. The same takes place in the case of onshore winds
Influence of the wind field on the radiance of a marine shallow . . . 661
32 64 96 128 160 192 224
X [km]
32 64 96 128 160 192 224
X [km]
0 32 64 96 128 160 192 224
X [km]
224
192
160
128
96
64
32
0
Y[k
m]
224
192
160
128
96
64
32
0
Y[k
m]
a b c
d e f
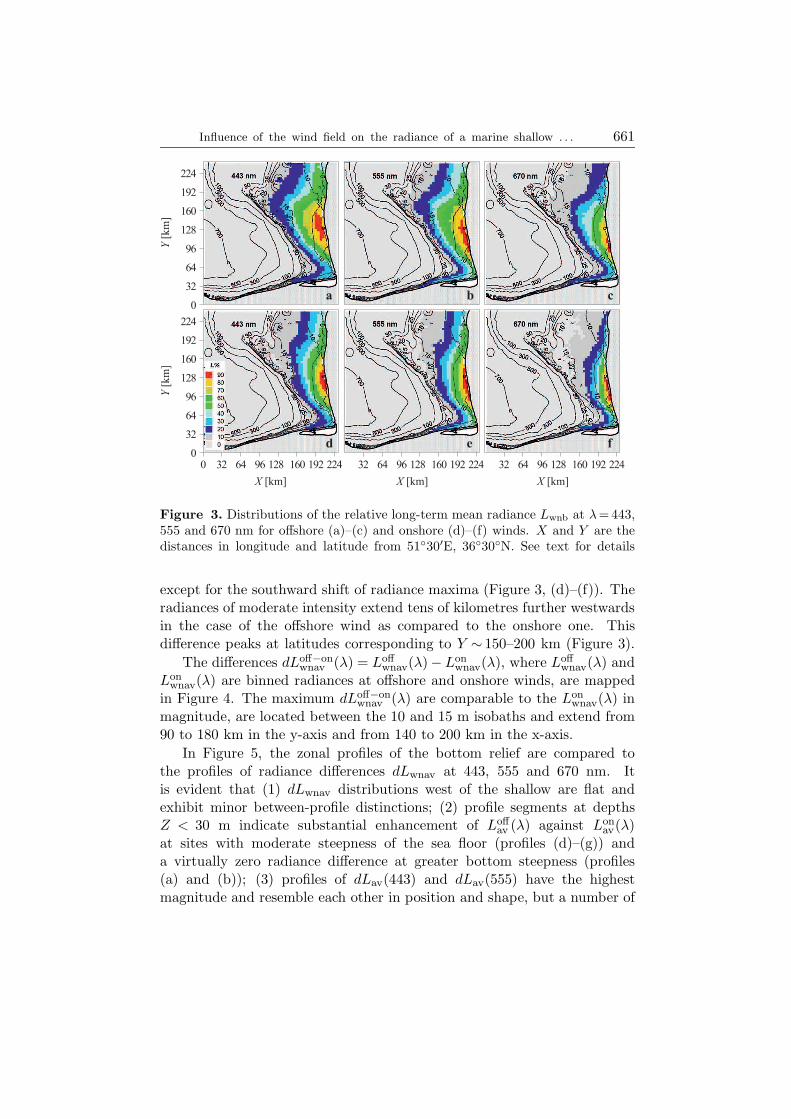
Figure 3. Distributions of the relative long-term mean radiance Lwnb at λ= 443,555 and 670 nm for offshore (a)–(c) and onshore (d)–(f) winds. X and Y are thedistances in longitude and latitude from 51◦30′E, 36◦30◦N. See text for details
except for the southward shift of radiance maxima (Figure 3, (d)–(f)). Theradiances of moderate intensity extend tens of kilometres further westwardsin the case of the offshore wind as compared to the onshore one. Thisdifference peaks at latitudes corresponding to Y ∼ 150–200 km (Figure 3).
The differences dLoff−onwnav (λ) = Loff
wnav(λ)−Lonwnav(λ), where Loff
wnav(λ) andLon
wnav(λ) are binned radiances at offshore and onshore winds, are mappedin Figure 4. The maximum dLoff−on
wnav (λ) are comparable to the Lonwnav(λ) in
magnitude, are located between the 10 and 15 m isobaths and extend from90 to 180 km in the y-axis and from 140 to 200 km in the x-axis.
In Figure 5, the zonal profiles of the bottom relief are compared tothe profiles of radiance differences dLwnav at 443, 555 and 670 nm. Itis evident that (1) dLwnav distributions west of the shallow are flat andexhibit minor between-profile distinctions; (2) profile segments at depthsZ < 30 m indicate substantial enhancement of Loff
av (λ) against Lonav(λ)
at sites with moderate steepness of the sea floor (profiles (d)–(g)) anda virtually zero radiance difference at greater bottom steepness (profiles(a) and (b)); (3) profiles of dLav(443) and dLav(555) have the highestmagnitude and resemble each other in position and shape, but a number of

662 G. S. Karabashev, M. A. Evdoshenko
32 64 96 128 160 192 224
X [km]
32 64 96 128 160 192 224
X [km]
0 32 64 96 128 160 192 224
X [km]
224
192
160
128
96
64
32
0
Y[k
m]
a b c
Figure 4. Distributions of the differences dLwnav(λ) in the long-term meanoffshore and onshore radiances at 443 (a), 555 (b) and 670 (c) nm. X and Yare the distances in longitude and latitude from 51◦30′E, 36◦30′N. See text fordetails
dLav(670) profiles appear to be shifted eastwards and differ in shape fromthe corresponding radiance profiles at shorter wavelengths (d)–(f).
The profiles of Loffav and Lon
av in Figure 6 demonstrate the following trend:the onshore radiance slightly exceeds the offshore radiance in the deep-waterpart of the middle and northern testing area; an inverse relation betweenthem occurs at the western boundary of the shallow; further east, Loff
av
grows faster than Lonav but the latter overtakes the former in the vicinity
of the coastline. As a result, the summary radiance progression in thepresence of easterly and westerly winds looks like a closed loop, whoselower and upper branches correspond to the onshore and offshore events.The eastern intersections of the branches occur at sites of less than a fewmetres of water, where the insufficient accuracy of the bottom topographymodel prevents a stricter association of intersections with bottom features.The higher-sensitivity profiles in Figure 6 (dashed) indicate that westernintersections occurred at Z > 30 m if r <= 160 km but occurred at siteswith 14–30 m of water in profiles at r > 160 km distinguished by roughnessof bottom relief in the west of the shallow. In some cases the depth andradiance profiles show conformity in their shape: the two-step structuresof the offshore branch of the radiance loop and of the bottom profile inFigure 6f appear to be a manifestation of such conformity. However, themore intricate relationships of these profiles outnumber the situations ofstraightforward interpretability.
Non-zonal winds. The distributions of radiances Lwnav(555) andLwnav(670) at ϕ = 180◦ and ϕ = 0◦, blowing parallel to the shore,demonstrate that both radiances gradually attenuate with distance fromthe shore (Figure 7, (a)–(d)) as in the case of zonal winds. At the same

Influence of the wind field on the radiance of a marine shallow . . . 663
dLB,E
30
20
10
0
0.0
0.6
1.2
1.8
2.4
-0.2
0.0
0.2
0.4
0.6
0.8dLF
Z[m
]
E
dLB,E
30
20
10
0
0.0
0.6
1.2
1.8
2.4
-0.2
0.0
0.2
0.4
0.6
0.8dLF
Z[m
]
dLB,E
30
20
10
0
0.0
0.6
1.2
1.8
2.4
-0.2
0.0
0.2
0.4
0.6
0.8dLF
Z[m
]
dLB,E
30
20
10
0
0.0
0.6
1.2
1.8
2.4
-0.2
0.0
0.2
0.4
0.6
0.8dLF
Z[m
]
dLB,E
30
20
10
0
0.0
0.6
1.2
1.8
2.4
-0.2
0.0
0.2
0.4
0.6
0.8dLF
Z[m
]
dLB,E
30
20
10
0
0.0
0.6
1.2
1.8
2.4
-0.2
0.0
0.2
0.4
0.6
0.8dLF
Z[m
]
dLB,E
30
20
10
0
0.0
0.6
1.2
1.8
2.4
-0.2
0.0
0.2
0.4
0.6
0.8dLF
Z[m
]
dLB,E
30
20
10
0
0.0
0.6
1.2
1.8
2.4
-0.2
0.0
0.2
0.4
0.6
0.8dLF
Z[m
]
dLB,E
30
20
10
0
0.0
0.6
1.2
1.8
2.4
-0.2
0.0
0.2
0.4
0.6
0.8dLF
Z[m
]
dLB,E
30
20
10
0
0.0
0.6
1.2
1.8
2.4
-0.2
0.0
0.2
0.4
0.6
0.8dLF
Z[m
]
0 50 100 150 200
X [km]
0 50 100 150 200
X [km]
443 nm (B)555 nm (E)670 nm (F)
i j
g
e
c
a
h
f
d
b
r = 208 km r = 224 km
r = 176 km
r = 144 km
r = 112 km
r = 80 km
r = 192 km
r = 160 km
r = 128 km
r = 96 km
Figure 5. Zonal profiles of bottom relief Z [m], (filled contours) and radiancedifferences dLwnav(443) (blue, index B), dLwnav(555) (green, index E) anddLwnav(670) (red, index F) at latitudes corresponding to Y from 80 to 224 km.r is the distance of profiles (a)–(j) from 36◦30′N (see Figure 2b)

664 G. S. Karabashev, M. A. Evdoshenko
L
30
20
10
010
8
6
4
2
00.0
0.4
0.8
1 2.
1.6
2 0.
Z[m
]
r = 208 km
L
30
20
10
010
8
6
4
2
00.0
0.4
0.8
1 2.
1.6
2 0.
Z[m
]
r = 224 km
L
30
20
10
010
8
6
4
2
00.0
0.4
0.8
1 2.
1.6
2 0.
Z[m
]
r = 176 km
L
30
20
10
010
8
6
4
2
00.0
0.4
0.8
1 2.
1.6
2 0.
Z[m
]
r = 144 km
L
30
20
10
010
8
6
4
2
00.0
0.4
0.8
1 2.
1.6
2 0.
Z[m
]
r = 112 km
L
30
20
10
010
8
6
4
2
00.0
0.4
0.8
1 2.
1.6
2 0.
Z[m
]
r = 80 km
L
30
20
10
010
8
6
4
2
00.0
0.4
0.8
1 2.
1.6
2 0.
Z[m
]
r = 192 km
L
30
20
10
010
8
6
4
2
00.0
0.4
0.8
1 2.
1.6
2 0.
Z[m
]
r = 160 km
L
30
20
10
010
8
6
4
2
00.0
0.4
0.8
1 2.
1.6
2 0.
Z[m
]
r = 128 km
L
30
20
10
010
8
6
4
2
00.0
0.4
0.8
1 2.
1.6
2 0.
Z[m
]
r = 96 km
0 50 100 150 200
X [km]
0 50 100 150 200
X [km]
i j
g
e
c
a
h
f
d
b
Figure 6. Zonal profiles of bottom relief Z [m], (filled contours) and full-range(0–10µW sr−1 cm−2 nm−1) profiles of the offshore Loff
wnav(555) (orange, solid) and
onshore Lonwnav(555) (blue, solid) radiances at latitudes corresponding to Y from
80 to 224 km. r is the distance of profiles (a)–(j) from 51◦30′E, 36◦30′N (seeFigure 2b). The respective dashed curves represent the same profiles in the range0–2 µW sr−1 cm−2 nm−1

Influence of the wind field on the radiance of a marine shallow . . . 665
time, a northward shift of these patterns at ϕ = 0◦ relative to the patternsat ϕ = 180◦ is distinguishable (compare (a) and (c) with (b) and (d)in Figure 7). The underpopulated radiance cluster at ϕ = 0◦ is inferiorin reliability as against the 11-member cluster at ϕ = 180◦. We haverandomly subdivided the latter into three subclusters of five memberseach so that any subcluster is comparable to the ϕ = 0◦ cluster in thepopulation. Presumably, the authenticity of the above shift may be regardedas satisfactory if a radiance profile from the ϕ = 0◦ data exhibits a maximumshift northwards with reference to any of the ϕ = 180◦ subclusters. Themeridional profiles of radiances Lwnav(555) and Lwnav(670) ((e) and (f) inFigure 7) confirm this supposition. Notice that the profiles of Lwnav(555)and Lwnav(670) for both wind directions peak within the segment of virtuallyconstant depth Z = 11.1 ± 0.2 m (Figure 7).
0 50 100 150 200
X [km]
200
150
100
50
0
Y[k
m]
0 50 100 150 200
X [km]
25 20 15 10 5 0
0 2 4 6 8 10250
200
150
100
50
Y[k
m]
Lav
e
Zm
0 0.5 1 1.5 2 2.5
Lav
250
200
150
100
50
Y[k
m]
25 20 15 10 5 0
f
Zm
N-S (1)N-S (2)N-S (3)S-N
X [km] X [km]
200
150
100
50
0
Y[k
m]
0 50 100 150 200 0 50 100 150 200
N-S (1)N-S (2)N-S (3)S-Nc d
a b
Figure 7. Maps of the study area’s bottom relief (depth contours) anddistributions of radiances Lwnav(555) and Lwnav(670) for winds of ϕ = 0◦ ((a)and (c)) and ϕ = 180◦ ((b) and (d)) and meridional profiles of Lwnav(555) (e) andLwnav(670) (f) for the same radiances at X = 180 km and for winds of ϕ = 0◦ (S-N,red) and ϕ = 180◦ (N-S, blue). X and Y are the distances in longitude and latitudefrom 51◦30′E, 36◦30′N. For details, see text

666 G. S. Karabashev, M. A. Evdoshenko
32 64 96 128 160 192 224
X [km]
32 64 96 128 160 192 224
X [km]
0 32 64 96 128 160 192 224
X [km]
224
192
160
128
96
64
32
0
Y[k
m]
224
192
160
128
96
64
32
0
Y[k
m]
a b c
d e f
Figure 8. The distributions of the relative mean radiance Lwnb% at λ = 555 nmfor winds of different directions (arrows). X and Y are the distances in longitudeand latitude from 51◦30′E, 36◦30′N. For details, see text
All the radiance distributions for winds of different directions aregiven in Figures 8 and 9, except for the distributions of the two leastpopulated clusters. We consider the radiances at wavelength 555 and 670 nmalone since distributions of Lwnav at shorter wavelengths are close to thepattern at 555 nm. For the sake of comparability, we have used (2) toexpress Lwnav as a fraction of the radiance range Lmax
wnav − Lminwnav, common
to all of the wind directions at a given wavelength. They exhibit thefollowing: 1) the maximum 8.30< Lmax
wnav(555)< 10.41 µW sr−1 cm−2 nm−1
and 2.34< Lmaxwnav(670)< 3.20µW sr
−1 cm−2 nm−1 occurred in the middle ofthe eastern coastal zone close to the shore line regardless of wind direction;
2) the radiance distributions appear pressed against the shore for winds withan onshore component ((b) and (c) in Figures 8 and 9) but they appear tobe extended downwind by 10–15 km if there is an offshore wind component((e) and (f) in Figures 8 and 9); 3) for one and the same wind involvingan offshore component, the green radiance Lwnav(555) spreads westwardsfurther than the red radiance Lwnav(670) of the same relative magnitudedoes; 4) winds blowing parallel to the shore result in a meridional ratherthan a zonal radiance displacement ((a) and (d) in Figures 8 and 9).

Influence of the wind field on the radiance of a marine shallow . . . 667
32 64 96 128 160 192 224
X [km]
32 64 96 128 160 192 224
X [km]
0 32 64 96 128 160 192 224
X [km]
224
192
160
128
96
64
32
0
Y[k
m]
224
192
160
128
96
64
32
0
Y[k
m]
a b c
d e f
Figure 9. The distributions of the relative mean radiance Lwnb% at λ = 670 nmfor winds of different directions (arrows). X and Y are the distances in longitudeand latitude from 51◦30′E, 36◦30′N. For details, see text
4. Discussion
We found that the estimates of the long-term average normalizedradiance of this marine shallow varied to the first significant figure in themiddle of the shallow and was spatially redistributed in the direction ofmoderate long-term average winds, which is manifested as a radiance loopeffect for on- and offshore winds. Nothing of this sort happened in the deep-water area only a few km west of the shallow’s offshore boundary. Thesepatterns are therefore inherent to the shallow. On the basis of the opticalshallowness concept, we examined the sea surface, water-bottom interfaceand water thickness as conceivable contributors to this effect.
Sea surface. As far as surface waves are concerned, a recent computa-tion for wind speeds as high as 20 m s−1 showed that ‘. . . the transmittanceof the (whitecap-free) air-water interface is nearly identical (within 0.01)to that for a flat interface’ (Gordon 2005). The whitecaps are equallyprobable on both sides of the shallow’s offshore boundary (Figure 2), whichis inconsistent with the fact that the radiance loop occurred exclusivelywithin the shallow’s perimeter. The natural anharmonicity of surface wavesmay result in a perceptible asymmetry of surface reflectance for opposite

668 G. S. Karabashev, M. A. Evdoshenko
winds. Hypothetically, this mechanism explains the systematic positivebias of Lon
wnav(555) with reference to beyond the shallow, but this bias ismuch lower than the difference between the branches of the loop inside theshallow (Figure 6). Most likely, the radiance loop effect cannot be attributedto surface wave effects.
Bottom reflectance. Based on the Lwnref/Lwnred criterion, thewavelength dependence of Zor (Figure 1) and the similarity of distributionsof the long- and shortwave radiances for winds of similar directions(Figures 3–9), we infer that bottom reflection contributed nothing to theradiance loop effect that took place within the shallow in Figure 2 at siteswith more than 5 m of water. In the context of the present work, thisinference makes it needless to discuss the reflectance of the shallow’s water-bottom interface.
Water thickness. The term ‘normalized’ suggests that Lwn of a deepbasin depends exclusively on the backscattering and absorption of light inwater (Gordon et al. 1988):
Lwn(λ) ∼bp(λ)
bp(λ) + a(λ), (3)
where bp(λ) and a(λ) are the backscattering and absorption coefficients ofseawater. Where bp(λ) is concerned, suspended particulate matter (SPM)is the only constituent of light scatterers that matters when dealing withwaters of inland seas (specifically, the Caspian Sea), relatively rich in SPM.Any changes in wind conditions resulted in variations of Lwn(λ) within theshallow. They were positive with respect to the much lower and quasi-constant Lwn(λ) of the neighbouring deep basin. This is also true forLwn(670), which is not influenced by coloured dissolved organic matter(CDOM), the main factor of the variability of a(λ) in natural waters. Theirrelevance of bottom- and surface-related factors to the radiance loop effectand other evidence necessitates focusing on the sources that can supplybackscattering sediments to the water of the shallow.
There are a number of active mud volcanoes within the shallow’sboundaries (Pautov 1959 (ed.)). The largest of them are the Ul’skiy Bank(38◦27′N, 52◦5′E) and the Griazny Vulkan Bank (38◦08′N, 52◦33′E). Whenselecting the images of the testing area for the present study, we found onlya few images of the shallow that bear evidence of local radiance maximaappearing to be plausible manifestations of volcanic activity. Such maximawere too insignificant in size and rate of occurrence to affect the long-termradiance distributions.
As is well known, an offshore wind induces coastal water upwelling thatbrings nutrients into the basin’s upper layer, thus creating conditions for

Influence of the wind field on the radiance of a marine shallow . . . 669
the blooming of phytoplankton with a consequent increase in SPM contentin the water. This succession of processes takes several days to produce an
excessive sediment concentration. Our approach involves the use of radianceand wind data for one and the same YD, thanks to which the results of dataprocessing cannot be contaminated by the consequences of wind-induced
upwelling events, even though they actually did take place.
Uncorrected satellite images of the Caspian Sea show jet-like structures,which are regarded as carriers of dust from the Central Asian deserts.
This dust fallout can enhance Lwn estimates. The standard atmosphericcorrection algorithm of colour scanner missions removes the fallout effectsfrom the normalized water-leaving radiance. The low and virtually constant
Lwn just west of the testing area for any winds in our figures confirm thealgorithm’s efficiency.
So, there are no grounds for believing that the redistribution of radiance
fields within the shallow for moderate winds from different directionswas due to factors other than the wind-induced resuspension of bottomsediments. The close resemblance of the distributions of red and shortwave
radiances for winds of any direction, including the offshore wind, indicatesthat the resuspension mechanism fills the water column with resuspended
particles up to the near-surface layer. The maximum estimates of radiancedifference dLwnav(λ) for opposing winds gravitated towards the middle of theshallow with the most gentle bottom slope between the 10 and 15 m isobaths
(Figure 4). This and other facts point to the dependence of resuspensionefficiency on the wind direction and to the non-uniform distribution of
resuspension efficiency over the shallow under a steady wind.
The issue of resuspension efficiency is a typical interdisciplinary problemthat involves such lines of inquiry as mesoscale water dynamics, waterdensity stratification, inherent optical properties of water, size spectrum
and properties of particles of bottom sediments, the nature of the bottomsubstrate ranging from sand and mud to a canopy of macrophytes, the
impact of bioturbation on the bottom sediments strength etc. This is beyondthe scope of the present work. The published evidence, concerning the waterdynamics, sedimentology, meteorology and other branches of oceanology
for the southern Caspian Sea, is far from matching the long-term satelliteobservations in volume and regularity. Therefore we have to rely on common
knowledge of shallow water conditions when discussing the offshore-onshoreradiance loop mechanism.
In the east, the offshore and onshore branches of the loop tend to crossmainly between the 5 m depth contour and the shoreline (Figure 5). There is
some uncertainty regarding the location of their crossings with respect to thetrue local depth due to the insufficient accuracy of the bottom topography

670 G. S. Karabashev, M. A. Evdoshenko
model, sea level instability, and inadequate spatial resolution of radiancedata in the near-shore space. In any case, the latter comprises the surf
zone. Its radiance peaks during onshore winds when the bottom reflectanceradiance is added to the radiance of the water column enhanced by the
backscattering of particles resuspended by wave-breaking. The surf zoneis virtually free of wave-breaking during offshore winds and, therefore, the
dominance of the onshore radiance over the offshore one in the close vicinity
of the shoreline is a quite predictable event.
The contribution of bottom reflection to the red radiance vanishes at
depths Z > 3 m, whereas green radiance can be contributed to by bottomreflection in much deeper waters ((1) and Figure 1). These considerations
agree well with the fact that maximum Lmaxwnav(λ) gravitated to the eastern
shores of the testing area regardless of wind direction (Figure 3) and that
the maxima of profiles dLav(670) tend to be shifted shorewards as comparedto similar maxima at shorter wavelengths (Figure 5).
The largest positive differences dLof onwnav in the blue, green and red
occurred at depths 10 < Z < 15 m ((d)–(f) in Figure 5). The spectral-different dLof on
wnav changed concurrently in the zonal direction and occupied
one and the same profile segments, where the bottom depth is largeenough to prevent the wave-breaking resuspension mechanism. Hence, the
difference in sediment resuspension, induced by opposing winds, has to bethe only cause of the dLof on
wnav (670) peak. Evidently, the same is true for
dLof onwnav (555) and dLof on
wnav (443), although these radiances can be enhanced bythe background wind-independent backscattering and by bottom reflection
at 10 < Z < 15m at the water transparencies typical of the southern CaspianSea. The background component vanishes when passing from the offshore
and onshore radiances to their difference. Most probably, the same is true asregards the bottom reflection: to our knowledge, non-sinusoidal sand ripples
are the only conceivable factor in the directional dependence of bottomreflectance, but we failed to find any evidence of such ripples in the study
area. Hence, specific features of resuspension mechanisms for offshore andonshore winds determine the occurrence of the radiance loops and peaks of
dLof onwnav (λ) at sites with more than 10 m of water.
The resuspension mechanisms in shallows are closely associated withcross-shelf water transport, which has been subjected to intensive field
experimental studies in the last 10 years (Lentz 2001, Lentz & Chapman2004, Kirincich et al. 2005, and others). They refined earlier views going
back to Ekman’s theory of boundary layer dynamics. Among other things,it is acknowledged that onshore flows in the interior and bottom boundary
layers along with coastal upwelling take place in order to compensatefor the wind-driven offshore flow in the surface layer. As follows from

Influence of the wind field on the radiance of a marine shallow . . . 671
observations (Lentz & Chapman 2004, Kirincich et al. 2005), the upwellingextends seawards no more than 10 km when the bottom slope geometry iscomparable to that shown in Figure 2b.In this case, a sediment particle, just detached from the bottom by the
compensation flow, starts to move shorewards in the bottom boundary layerand gradually surfaces as a result of turbulent mixing. As soon as it arrivesin the surface layer, the particle moves downwind and can occur to the westof the site of detachment if particle’s sinking speed is fairly slow. Under anonshore wind, the same particle moves continuously shorewards from thedetachment site.
Another cause of radiance looping in the zonal profile is the fact that thebottom-to-surface distance is much shorter on the source side of the offshorewind-driven current than in the case of the onshore wind. The shorter thisdistance, the more probable the occurrence of a resuspended particle at thetop of the layer from which the water-leaving radiance originates.
It is hardly possible to directly apply our findings to other shallows inseas and oceans because of the local specificity of this one in the Caspian Sea.Nevertheless, the pattern of a radiance loop due to equally strong winds ofopposing directions appears more or less universal. This is because bottominclination is typical of coastal shallows, and the crossing of upper and lowerbranches of the loop is unavoidable at the shallow’s boundary where thedependence of radiance on sediments, resuspended by compensation flow,becomes negligible compared to other factors giving rise to radiance.
5. Conclusion
The wind-induced resuspension of bottom sediments is the most im-portant factor of water-leaving radiance enhancement, inherent to marineshallows, judging in terms of the area affected by the radiance loop effect.In terms of the magnitude of the enhancement, the leading role belongsto the bottom reflectance at sites where waters are fairly transparent andthe most shallow. Backscattering of resuspended particles develops at theexpense of bottom reflection because a cloud of particles in the water shadesthe bottom. Thus, the strengthening of resuspension results in a reducedcontribution of bottom reflectance into the radiance of a marine shallow.Both effects have to be accounted for when retrieving concentrations ofchlorophyll, suspended matter and other constituents of shallow waters fromremotely sensed radiance.There are examples of successful accounting for bottom reflectance when
retrieving the chlorophyll concentration (Cannizzaro & Carder 2006), butaccounting for wind-induced resuspension is a more challenging problem.Non-averaged sea surface images of a shallow are usually rich in the

672 G. S. Karabashev, M. A. Evdoshenko
footprints of meso- and submesoscale processes, which are due to a varietyof forcings and mask the manifestations of resuspension. The two-folddiscrepancy between the long-term average Loff
wnav(λ) and Lonwnav(λ) indicates
the probability of a broader range of ‘instantaneous’ radiances in dailyimages of a shallow and gives an idea of the errors in deriving waterconstituents from normalized radiance without regard for the resuspensionof bottom sediments. The latter is a multistage process whose stages varytemporally and spatially. This list is far from complete. To overcome these
difficulties, it may be reasonable to confine the use of satellite data to imagesof a shallow obtained at wind speeds below 3 m s−1. A comprehensivenumerical model for resuspension with data assimilation capability seemsto be the most appropriate solution. Further interdisciplinary studies ofrelevant processes and phenomena are needed to ensure the feasibility of
the model approach.
Acknowledgements
The ocean colour data used in this study were produced by the SeaWiFSProject at the Goddard Space Flight Centre. The use of this data isin accord with the SeaWiFS Research Data Use Terms and Conditions
Agreement.
The authors are grateful to the anonymous reviewers for their helpful
comments.
References
Arfi R., Guiral D., Bouvy M., 1993,Wind induced resuspension in a shallow tropicallagoon, Estuar. Coast. Shelf Sci., 36 (6), 587–604, http://dx.doi.org/10.1006/ecss.1993.1036.
Booth J.G., Miller R. L., McKee B.A., Leathers R.A., 2000,Wind-induced bottomsediment resuspension in a microtidal coastal environment, Cont. Shelf Res.,20 (7), 785–806, http://dx.doi.org/10.1016/S0278-4343(00)00002-9.
Boss E., Zaneveld J.R., 2003, The effect of bottom substrate on inherent opticalproperties: evidence of biogeochemical processes, Limnol. Oceanogr., 48 (1,pt. 2), 346–354, http://dx.doi.org/10.4319/lo.2003.48.1 part 2.0346.
Cannizzaro J. P., Carder K. L., 2006, Estimating chlorophyll a concentrations fromremote-sensing reflectance in optically shallow waters, Remote Sens. Environ.,101 (1), 13–24, http://dx.doi.org/10.1016/j.rse.2005.12.002.
Demers S., Terriault J.-C., Bourget E., Bah A., 1987, Resuspension in theshallow sublittoral zone of a microtidal environment: wind influence, Limnol.Oceanogr., 32 (2), 327–339, http://dx.doi.org/10.4319/lo.1987.32.2.0327.

Influence of the wind field on the radiance of a marine shallow . . . 673
Gordon H.R., 2005, Normalized water-leaving radiance: revisiting the influence ofsurface roughness, Appl. Optics, 44 (2), 241–245, http://dx.doi.org/10.1364/AO.44.000241.
Gordon H.R., McCluney W.R., 1975, Estimation of the depth of sunlightpenetration in the sea for remote sensing, Appl. Optics, 14 (2), 413–416,http://dx.doi.org/10.1364/AO.14.000413.
Gordon H.R., Brown O.B., Evans R.H., Brown J.W., Smith R.C., Baker K. S.,Clark D.K., 1988, A semianalytic radiance model of ocean color, J. Geophys.Res., 93 (D9), 10909–10924, http://dx.doi.org/10.1029/JD093iD09p10909.
Jerlov N.G., 1976, Marine optics, Elsevier, Amsterdam, 231 pp.
Karabashev G. S., Evdoshenko M.A., Sheberstov S.V., 2009, Indication ofbottom transport in shallow marine regions based on the data of satelliteocean colour scanners, Oceanology, 49 (1), 22–30, http://dx.doi.org/10.1134/S0001437009010032.
Kopelevich O.V., Burenkov V. I., Sheberstov S.V., Shibalkova A.P., TerechovaA.A., Vazyulya S.V., 2007, Influence of the bottom reflection on balance ofsolar photosynthetically active radiation, [in:] Current problems in Optics ofNatural Waters (ONW’2007), 4th Int. Conf. 11–15 Sept. 1993, IAP RAS,Nizhny Novgorod, 94–98.
Kirincich A.R., Barth J.A., Grantham B.A., Menge B.A., LubchenkoJ., 2005, Wind-driven inner-shelf circulation off central Oregon duringsummer, J. Geophys. Res., 110, C10S03, 17 pp., http://dx.doi.org/10.1029/2004JC002611.
Lentz S. J., 2001, The influence of stratification on the wind-driven cross-shelf circulation over the North Carolina shelf, J. Physical Oceanogra-phy, 31 (9), 2749–2760, http://dx.doi.org/10.1175/1520-0485(2001)031<2749:TIOSOT>2.0.CO;2.
Lentz S. J., Chapman D. C., 2004, The importance of nonlinear cross-shelfmomentum flux during wind-driven coastal upwelling, J. Phys. Oceanogr.,34 (11), 2444–2457, http://dx.doi.org/10.1175/JPO2644.1.
Mobley C.D., Sundman L.K., 2003, Effects of optically shallow bottoms onupwelling radiances: inhomogeneous and sloping bottoms, Limnol. Oceanogr.,48 (1, pt. 2), 329–336, http://dx.doi.org/10.4319/lo.2003.48.1 part 2.0329.
Pautov Y.V. (ed.), 1959, Sailing directions in the Caspian Sea, HydrographyService, Leningrad, 274 pp., (in Russian).
Scheffer M., Portielje R., Zambrano L., 2003, Fish facilitates wave resuspension ofsediments, Limnol. Oceanogr., 48 (5), 1920–1926, http://dx.doi.org/10.4319/lo.2003.48.5.1920.
Simonov A. I., Altman E.N., 1992, Turbidity, transparency, and colour of the water,[in:] The seas of Russia. Hydrometeorology and hydrochemistry of the Seas.VI: The Caspian Sea. Issue 1: Hydrometeorological conditions, Terziev F. S.,Kosareva A.N. & A.A. Kerimova (eds.), Gidrometeoizdat, St. Petersburg,178–186, (in Russian).