Spectral UV Measurements of Global Irradiance, Solar Radiance, and Actinic Flux in New Zealand:...
15
BLUMTHALER ET AL. Spectral UY Measurements of Global Irradiance, Solar Radiance, and Actinic Flux in New Zealand: Intercomparison between Instruments and Model Calculations MARIO BLUMTHALER, BARBARA SCHALLHART, AND MICHAEL SCHWARZMANN Division for Biomedical Physics, Innsbruck Medical University, Innsbruck, Austria RICHARD MCKENZIE, PAUL JOHNSTON, MICHAEL KOTKAMP, AND HISAKO SHIONA National Institute of Water and Atmospheric Research (NIWA), Lauder, Central Otago, New Zealand (Manuscript received 7 June 2007, in final form 15 October 2007) ABSTRACT Presented here are the results of a short but intense measurement campaign at Lauder, New Zealand, in which spectral irradiance from instruments operated by the National Institute of Water and Atmospheric Research (NIWA) and Austria/Innsbruck (ATI) were traced to different irradiance standards and com- pared. The observed spectral differences for global irradiance were relatively small (<5%) and were consistent with those expected from observed differences in the radiation standards used by each group. Actinic fluxes measured by both groups were also intercompared and found to agree at the 10% level. The ATI instrument had the additional capability of measuring solar direct beam irradiance and sky radiances. These provided the first series of sky radiance measurements at this pristine Network for the Detection of Atmospheric Composition Change (NDACC) site. The polarization of sky radiance results were compared with estimates from a radiative transfer model without any aerosols and was found to be up to 25% smaller. Total ozone values derived from Total Ozone Mapping Spectrometer (TOMS), Dobson measurements by NIWA, spectral direct sun measurements by ATI, and spectral global irradiance measurements by NIWA agreed generally within 2%-3%. 1. Introduction The National Institute of Water and Atmospheric Research's (NIWA's) atmospheric research site at Lauder, New Zealand (45.04'S, 169.68°E, 370 m), is important because it is one of very few Southern Hemi- sphere sites with long-term quality-assured measure- ments of UV radiation. The site is the Southern Hemi- sphere charter site of the Network for the Detection of Atmospheric Composition Change [NDACC, formerly known as the Network for the Detection of Strato- spheric Change (NDSC)], and as such, it is well equipped with state-of-the-art instruments to monitor the composition and transmission of the atmosphere. Data from the UV spectrometers at Lauder comply with the exacting requirements of the NDACC (McKenzie et al. 1997). Important results from this site Corresponding author address: Mario Blumthaler, Division for Biomedical Physics, Innsbruck Medical University, Muellerstr. 44 A-6020, Innsbruck, Austria. E-mail: [email protected] include 1) the finding that UV irradiance there is ap- proximately 40% larger than at corresponding latitudes in the Northern Hemisphere (McKenzie et al. 2006; Seckmeyer et al. 1995; Seckmeyer and McKenzie 1992); 2) an observed increase in UV over the 1980s and 1990s in response to ozone loss, and a subsequent leveling off or decline in UV since then (Bais et al. 2007; McKenzie et al. 1999); and 3) accurate agreement with satellite- derived UV, which is more accurate than at more pol- luted sites (McKenzie et al. 2001). Other measurements at Lauder and elsewhere in New Zealand have shown that despite its very low aerosol extinctions, there is evidence of reduction in global irradiance prior to the mid-1980s, henceforth followed by an increase [i.e., a period of "dimming," followed by a period of "bright- ening"; Liley (2006)]. In view of these important find- ings, it is desirable to regularly evaluate the perfor- mance of the instrumentation at this site against other independent measurements. Although NIWA instru- ments have regularly been involved in intercompari- sons and found to perform well (Bais et al. 2001; Wuttke et al. 2006), the last such campaign at the DOI: 10.1175/2007YTECHA1035.1 © 2008 American Meteorological Society - 945 JUNE 2008
-
Upload
independent -
Category
Documents
-
view
1 -
download
0
Transcript of Spectral UV Measurements of Global Irradiance, Solar Radiance, and Actinic Flux in New Zealand:...

BLUMTHALER ET AL.
Spectral UY Measurements of Global Irradiance, Solar Radiance, and Actinic Flux inNew Zealand: Intercomparison between Instruments and Model Calculations
MARIO BLUMTHALER, BARBARA SCHALLHART, AND MICHAEL SCHWARZMANN
Division for Biomedical Physics, Innsbruck Medical University, Innsbruck, Austria
RICHARD MCKENZIE, PAUL JOHNSTON, MICHAEL KOTKAMP, AND HISAKO SHIONA
National Institute of Water and Atmospheric Research (NIWA), Lauder, Central Otago, New Zealand
(Manuscript received 7 June 2007, in final form 15 October 2007)
ABSTRACT
Presented here are the results of a short but intense measurement campaign at Lauder, New Zealand, in
which spectral irradiance from instruments operated by the National Institute of Water and AtmosphericResearch (NIWA) and Austria/Innsbruck (ATI) were traced to different irradiance standards and com-
pared. The observed spectral differences for global irradiance were relatively small (<5%) and wereconsistent with those expected from observed differences in the radiation standards used by each group.
Actinic fluxes measured by both groups were also intercompared and found to agree at the 10% level. TheATI instrument had the additional capability of measuring solar direct beam irradiance and sky radiances.
These provided the first series of sky radiance measurements at this pristine Network for the Detection ofAtmospheric Composition Change (NDACC) site. The polarization of sky radiance results were comparedwith estimates from a radiative transfer model without any aerosols and was found to be up to 25% smaller.
Total ozone values derived from Total Ozone Mapping Spectrometer (TOMS), Dobson measurements by
NIWA, spectral direct sun measurements by ATI, and spectral global irradiance measurements by NIWAagreed generally within 2%-3%.
1. Introduction
The National Institute of Water and AtmosphericResearch's (NIWA's) atmospheric research site atLauder, New Zealand (45.04'S, 169.68°E, 370 m), isimportant because it is one of very few Southern Hemi-sphere sites with long-term quality-assured measure-ments of UV radiation. The site is the Southern Hemi-sphere charter site of the Network for the Detection ofAtmospheric Composition Change [NDACC, formerlyknown as the Network for the Detection of Strato-spheric Change (NDSC)], and as such, it is wellequipped with state-of-the-art instruments to monitorthe composition and transmission of the atmosphere.Data from the UV spectrometers at Lauder complywith the exacting requirements of the NDACC(McKenzie et al. 1997). Important results from this site
Corresponding author address: Mario Blumthaler, Division for
Biomedical Physics, Innsbruck Medical University, Muellerstr. 44A-6020, Innsbruck, Austria.E-mail: [email protected]
include 1) the finding that UV irradiance there is ap-proximately 40% larger than at corresponding latitudesin the Northern Hemisphere (McKenzie et al. 2006;Seckmeyer et al. 1995; Seckmeyer and McKenzie 1992);2) an observed increase in UV over the 1980s and 1990sin response to ozone loss, and a subsequent leveling offor decline in UV since then (Bais et al. 2007; McKenzieet al. 1999); and 3) accurate agreement with satellite-derived UV, which is more accurate than at more pol-luted sites (McKenzie et al. 2001). Other measurementsat Lauder and elsewhere in New Zealand have shownthat despite its very low aerosol extinctions, there isevidence of reduction in global irradiance prior to themid-1980s, henceforth followed by an increase [i.e., aperiod of "dimming," followed by a period of "bright-ening"; Liley (2006)]. In view of these important find-ings, it is desirable to regularly evaluate the perfor-mance of the instrumentation at this site against otherindependent measurements. Although NIWA instru-ments have regularly been involved in intercompari-sons and found to perform well (Bais et al. 2001;Wuttke et al. 2006), the last such campaign at the
DOI: 10.1175/2007YTECHA1035.1
© 2008 American Meteorological Society -
945JUNE 2008

JOURNAL OF ATMOSPHERIC AND OCEANIC TECHNOLOGY
Lauder site was more than 10 yr ago, in the summer of1993 (McKenzie et al. 1993). The purpose of this studyis twofold. The first aim is to cross-correlate spectralUV measurements of the NIWA instruments withthose from an independent instrument with calibrationstraceable to a different standards laboratory. The sec-ond aim is to measure the distribution of sky radianceto verify model calculations under pristine conditions ata relatively low altitude and to better quantify the mag-nitude of possible errors in cosine corrections that arisefrom the simplistic assumption that the sky radiance ishomogenous in the UV region. The measurements de-scribed below were undertaken between 22 Februaryand 3 March 2004 when the spectrometer system be-longing to ATI (this abbreviation was used for the in-strument of Austria/Innsbruck in several previous cam-paigns) operated alongside NIWA's UV spectrometersat Lauder. Unfortunately, the weather was rather un-settled through most of the period. However, sufficientdata were collected to achieve the aims of the study.
2. Materials and methods
a. ATI spectral measurements
The spectral measurements of ATI were carried outwith a commercial Bentham DTM300 double mono-chromator spectroradiometer, which was modified bycustom-made extensions in several ways to allow themeasurement of global irradiance, actinic flux, directirradiance, sky radiance, and polarization of sky radi-ance. The instrument is equipped with two sets of ho-lographic gratings, 1200 and 2400 lines per millimeter,which can be changed automatically under softwarecontrol. The entrance and exit slits were set to a widthof 0.42 mm, resulting in an almost triangular optical slitfunction with 0.48-nm full width at half maximum(FWHM), when used in combination with the gratingwith 2400 lines per millimeter. This was the case formeasurements of direct sun, sky radiance, and sky po-larization. For measurements of global irradiance andactinic flux, the grating with 1200 lines per millimeterwas used, resulting in 0.96-nm FWHM. The monochro-mator's wavelength setting was regularly checkedagainst the Fraunhofer structure of the solar spectrum(Huber et al. 1993); therefore, the wavelength uncer-tainty of the spectral measurements can be quantifiedto be less than 0.03 nm.
At the exit slit of the spectroradiometer, a side-window photomultiplier is mounted, which is operatedat about 600 V. At each wavelength setting, the mea-surement time (average of 1-MHz 14-bit samples) isautomatically adjusted between 2 s at very low signallevels down to 20 ms at high signals. A five-stage de-
cadal amplifier allows a large dynamic range. Thewhole spectroradiometer system is fitted in a box,which is temperature controlled to about 0.1'C.
The spectroradiometer has two entrance ports (withidentical slits), which can be selected with a "swing-away mirror." At each port, a quartz fiber is attachedwith a length of about 5 m. One fiber is Y shaped, inwhich one end is connected to the global input optics,and the other to the one for actinic flux. Both inputoptics are equipped with a shutter that opens and closesthe entrance of the fiber. With this setup, either radia-tion quantity can be measured within a few seconds ateach wavelength setting, thus minimizing the effect ofchanging clouds on the ratio between the two radiationfluxes. Unfortunately, during the campaign in NewZealand, one of the magnetic shutters stopped workingproperly after a few days, so that only a few synchro-nous measurements of global irradiance and actinic fluxcould be carried out. The angular response of the globalentrance optics is optimized by a special shape, so thatthe resulting cosine error is less than about 2% forzenith angles smaller than 75* (Schreder et al. 1998). Inaddition, the entrance optics are heated, so that thetemperature of the Teflon diffuser is always aboveabout 20', which was found to be a critical temperaturefor changes in transmission of Teflon (Ylianttila andSchreder 2005). The entrance optics for the actinic fluxhave a 2-pi angular response (produced by Metcon,Inc.; R. Schmitt 2004, personal communication; infor-mation online at http://www.metcon-us.com), whichwas tested in the laboratory to be close to ideal. Anydeviations were estimated to give <3% uncertainty forthe 2-pi actinic flux. Only the downwelling actinic fluxwas measured.
The second fiber (connected to the second entranceport) leads to a small telescope, which is mounted on acustom-made sun-tracking device. This allows position-ing of the optics at the sun or at any point on the sky.The telescope, which has a 25-mm quartz lens of 100-mm focal length and with appropriate baffles, was usedto limit the field of view to a well-defined aperture ofabout 1.5' FWHM. For direct sun measurements, a1-mm-thick piece of Teflon is positioned in the focalplane to reduce the intensity. In front of the lens, alinear sheet polarizer can be mounted manually, whichcan be rotated by a stepping motor under control of thecustom-made measurement software. The polarizerwas especially selected to allow a good transmission inthe UV-wavelength range as well.
From the high-resolution spectral measurements ofdirect solar irradiance, the actual values for total atmo-spheric ozone and spectral aerosol optical depth weredetermined (Huber et al. 1995).
946 VOLUME 25
BLUMTHALER ET AL.
Radiance measurements were carried out for 60 di-rections in the solar principal plane (defined as the ver-tical plane through the sun and through the zenith) andin the almucantar (defined as the horizontal plane atthe elevation of the sun, scanned in the direction of thesun's movement). At each position on the sky, fourmeasurements were taken, with orientations of the po-larizer at 0', 450, 90' and 1350, relative to the vertical,which needed about 15 min. The scans were made forthe wavelengths 310, 350, and 450 nm, consecutively.
b. NIWA spectral measurements
The spectral measurements of NIWA were carriedout with two modified double monochromators: oneconfigured to measure irradiance, and the other config-ured to measure actinic flux. These instruments are partof the NDACC suite of measurements at Lauder. Innormal operations, scans are taken at 50 steps in solarzenith angle (SZA) and at 15-min intervals for a 2-hperiod centered at local noon. For this campaign, scanswere undertaken at 10-min intervals to match the fre-quency of scans of the ATI instruments. However, thescan rates were not adjusted to match the ATI andoperated in their normal modes, as described below.This has the advantage of the system performance be-ing assessed against independent instruments undernormal operating conditions. The disadvantage is that itcomplicates the comparison under cloudy conditionswhen radiation fields are rapidly changing. Such condi-tions prevailed during most of the campaign, so it wasnecessary to interpolate data using the high-temporal-resolution broadband data, as described below.
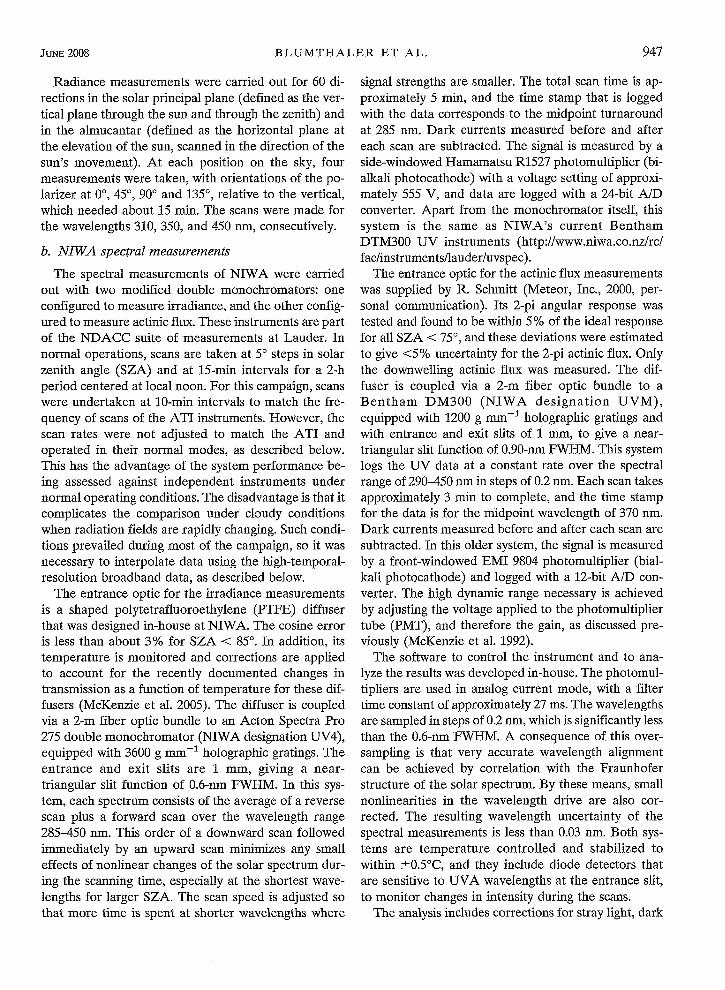
The entrance optic for the irradiance measurementsis a shaped polytetrafluoroethylene (PTFE) diffuserthat was designed in-house at NIWA. The cosine erroris less than about 3% for SZA < 85'. In addition, itstemperature is monitored and corrections are appliedto account for the recently documented changes intransmission as a function of temperature for these dif-fusers (McKenzie et al. 2005). The diffuser is coupledvia a 2-m fiber optic bundle to an Acton Spectra Pro275 double monochromator (NIWA designation UV4),equipped with 3600 g mm-1 holographic gratings. Theentrance and exit slits are 1 mm, giving a near-triangular slit function of 0.6-nm FWIHM. In this sys-tem, each spectrum consists of the average of a reversescan plus a forward scan over the wavelength range285-450 nm. This order of a downward scan followedimmediately by an upward scan minimizes any smalleffects of nonlinear changes of the solar spectrum dur-ing the scanning time, especially at the shortest wave-lengths for larger SZA. The scan speed is adjusted sothat more time is spent at shorter wavelengths where
signal strengths are smaller. The total scan time is ap-proximately 5 min, and the time stamp that is loggedwith the data corresponds to the midpoint turnaroundat 285 nm. Dark currents measured before and aftereach scan are subtracted. The signal is measured by aside-windowed Hamamatsu R1527 photomultiplier (bi-alkali photocathode) with a voltage setting of approxi-mately 555 V, and data are logged with a 24-bit A/Dconverter. Apart from the monochromator itself, thissystem is the same as NIWA's current BenthamDTM300 UV instruments (http://www.niwa.co.nz/rc/fac/instruments/lauder/uvspec).
The entrance optic for the actinic flux measurementswas supplied by R. Schmitt (Meteor, Inc., 2000, per-sonal communication). Its 2-pi angular response wastested and found to be within 5% of the ideal responsefor all SZA < 750, and these deviations were estimatedto give <5% uncertainty for the 2-pi actinic flux. Onlythe downwelling actinic flux was measured. The dif-fuser is coupled via a 2-m fiber optic bundle to aBentham DM300 (NIWA designation UVM),equipped with 1200 g mm-1 holographic gratings andwith entrance and exit slits of 1 mm, to give a near-triangular slit function of 0.90-nm FWHM. This systemlogs the UV data at a constant rate over the spectralrange of 290-450 nm in steps of 0.2 nm. Each scan takesapproximately 3 min to complete, and the time stampfor the data is for the midpoint wavelength of 370 nm.Dark currents measured before and after each scan aresubtracted. In this older system, the signal is measuredby a front-windowed EMI 9804 photomultiplier (bial-kali photocathode) and logged with a 12-bit A/D con-verter. The high dynamic range necessary is achievedby adjusting the voltage applied to the photomultipliertube (PMT), and therefore the gain, as discussed pre-viously (McKenzie et al. 1992).
The software to control the instrument and to ana-lyze the results was developed in-house. The photomul-tipliers are used in analog current mode, with a filtertime constant of approximately 27 ms. The wavelengthsare sampled in steps of 0.2 nm, which is significantly lessthan the 0.6-nm FWHM. A consequence of this over-sampling is that very accurate wavelength alignmentcan be achieved by correlation with the Fraunhoferstructure of the solar spectrum. By these means, smallnonlinearities in the wavelength drive are also cor-rected. The resulting wavelength uncertainty of thespectral measurements is less than 0.03 rin. Both sys-tems are temperature controlled and stabilized towithin t0.50 C, and they include diode detectors thatare sensitive to UVA wavelengths at the entrance slit,to monitor changes in intensity during the scans.
The analysis includes corrections for stray light, dark
947JurNE 2008

JOURNAL OF ATMOSPHERIC AND OCEANIC TECHNOLOGY
current, nonlinearities in the wavelength drive, and de-partures from the ideal angular response. Outputs,which are traceable to the National Institute of Stan-dards and Technology (NIST), include spectral irradi-ance or actinic flux, biologically weighted irradiance(such as erythemally weighted irradiance). or chemicalphotolysis rates [such as J(NO2) and J(0 3)]. Addition-ally, ozone retrievals can be made by using the algo-rithm described by Stamnes et al. (1991). Software hasalso been developed to estimate irradiance from theactinic flux measurements and actinic flux from the ir-radiance measurements. These algorithms use modelcalculations to apportion diffuse and direct radiation.The following two assumptions are made in these algo-rithms: first, when the UVA transmission is less than0.5, it is assumed that all radiation is diffuse, second, thediffuse radiation field is assumed to be isotropic.
c. Broadband data
Broadband UV irradiance and photolysis rate datawere available at 1-min intervals from NIWA and ATIsensors. Here, we used data from the ATI instrumentsto minimize cloud effects. These comprised pyranom-eters for total solar radiation (300-3000 nm), for UJVAradiation (315-400 nm), and for erythemally weightedUV irradiance. The data from these detectors wereused for quality control of the measurement of globalspectral irradiance. The corresponding spectral inte-grals agreed with the broadband data during the wholecampaign within a few percent. without any significantlong-term drift. These broadband data were also usedfor interpolating the spectral measurements betweenthe two instruments of NIWA and ATI. Because duringeach scan of the ATI instrument the broadband detec-tors were sampled every second, the variability due tochanging conditions of cloudiness could be quantifiedand applied to the interpolated data.
3. Results
a. Comparison between lamps
Absolute radiometric calibration of the two spectro-radiometers is achieved by reference to 1000-W FELlamps. In the past there have been large divergences inthe irradiance scales maintained in different countries.These differences sometimes exceed 4% in the UV re-gion (Walker et al. 1991) and can be the limiting factorfor comparison between different groups. In this study,the measurements by the NIWA group are traceable tothe irradiance scale maintained by NIST in the UnitedStates (lamp F726 and F666), whereas the measure-ments from the ATI group are traceable to the irradi-
ance scale maintained by Physikalisch-TechnischeBundesananstalt (PTB) in Germany (lamp F1353). Theirradiance scales were assessed by measuring the irra-diance from all three lamps with the NIWA spectrom-eter and calculating the resulting instrument calibrationfactors using the lamp irradiance provided by the re-spective calibration laboratories. The results comparingthe measured irradiance ratios between lamps F1353/F666 and F726/F666 measured with the NIWA spec-trometer and the calibration factors for the UV4 instru-ment, derived from all three lamps, are shown in Fig. 1.The ratios of these k factors vary between 0.99 and 1.01with some spectral structure. The largest discrepancies(-1%) are due to slightly larger emissions from alumi-num imperfections in the ATI lamp near 308 and 390rnn. The differences between the lamps from the twocalibration laboratories are on the same order as thedifferences from two lamps from the same calibrationlaboratory. Differences between the NIWA lamp(F666. to NIST) and the ATI lamp (F1353, to PTB)calibration could explain only -1% of the difference inerythemally weighted UV. The smaller calibration fac-tor from the ATI lamp would result in slightly largerirradiances.
From this we conclude that the laboratory calibrationof the standard lamps agree within the stated uncer-tainty limits of the calibration laboratories. These smalldifferences are consistent with the expected variabilitywhen using FEL lamps as transfer standards (Harrisonet al. 2000) and with differences between the NIST andPTB scales that have been reported recently (Wool-liams et al. 2006).
b. Comparison of spectral irradiance
NIWA data were increased by up to 2% to correctfor the temperature dependence of the Teflon diffuser,taking into account that calibrations are performed at adifferent temperature than solar measurements. Notemperature correction was necessary for the ATI dif-fuser because it is heated to about 20'C. The ATIanalysis also includes a correction for the shape of thediffuser, which affects the measurement of the distancebetween the lamp and the diffuser during calibrations(Gr6bner and Blumthaler 2007). This resulted in a1.5% decrease of data. Although it is likely that a simi-lar correction is necessary for the NIWA data, it has notyet been applied because of difficulties in determiningthe position of the entrance aperture with sufficientprecision, but this work is in progress.
As noted earlier, spectral scans were not synchro-nized because we wanted to test the performance undernormal operating conditions. However, because of theunsettled weather conditions, there were few periods
948 VOLUME 25

BLUMTHALER ET AL.
300 320 340 360 380 400 420 440Wavelength (nm)
949
0.030
0.028
0.026
S0.024
0.022
•- 0.020
L 0.018
.' 0.016
g 0.014
FIG. 1. Comparison of lamp calibrations for lamps F1353, F726, and F666. (left axis) Thesmooth lines are the calibration factors (k factors) for the UV4 instrument derived from eachlamp using the lamp calibration data supplied, which can be traced to PTB and NIST, respec-tively. (right axis) The noisier black and gray lines show the ratio of the calibration factorsfrom the F726IF666 NIST lamps and the F1353/F666 lamps (PTB/NIST), respectively.
when the conditions were sufficiently stable to allow ameaningful spectral comparison between the instru-ments. Figure 2 shows one example of irradiance andtheir ratios with respect to the ATI measurements. Inthis example, the spectra were taken on day 56 (day ofthe year) near noon [1215 New Zealand standard time(NZST); SZA = 36.60]. The plot includes ratios of irra-
100.0000
10.0000
Co
E
e1
1.0000
0.1000
0.0100
0.0010
0.0001 L280
diance calculated with the Tropospheric Ultraviolet-Visible (TUV) radiative transfer model (Madronichand Flocke 1998) for the input parameters as discussedbelow. It also includes the ratios of irradiance deducedfrom the measurements of actinic flux with the UVMspectrometer system described above. Much of thescatter is due to mismatches between the spectral reso-
1.2
+ 4+o x -- 1.1
o X,+0"
t oo• 1.0o
300 320 340 360 380 400 420 440Wavelength (nm)
FIG. 2. (left axis) Spectrum of global irradiance from ATI spectrometer, and (right axis) ratioswith respect to the ATI instrument. Day 56, 1215 NZST, SZA = 36.6'; ozone = 285 DU.
JuNE 2008
1.03
1.02
1.01
01.00 C
0.99
0.98
0.97
0.012
280

JOURNAL OF ATMOSPHERIC AND OCEANIC TECHNOLOGY
z
z
O=
58DAY OF YEAR VUfq
1.1
.05 + + 4
,.+~-~ -,,+ 4~ + .,+.-,- 4+ + +
4-+- -,-' - - -•+._- + + -4+ +
.4 + 4
0.95 j- . . ..
+
0 1 2 3 4 5 6 7IV4NDiEX
z
FIG. 3. Comparison of erythemally weighted global irradiance (UV index) during the cam-paign period. (top left axis) The black line is the UV Index as measured at 1-min intervals by
the ATI broadband pyranometer, and the gray lines near the bottom show the correspondingstd devs for each measurement. (right axis) The asterisks above give the ratios of ATI/NIWAfor the periods when the pyranometer variance was low enough (5% of the signal) to pass theinterpolation criterion. (bottom) These same ratios as a function of the UV index.
lution of the spectrometers and the model. The scatteris slightly larger for the UV4 instrument because its slitfunction is the narrowest (0.6-nm FWHM). The mean
ratios with respect to ATI are 1.006 ± 0.200, 0.993 -0.124, and 1.027 ± 0.092 for the TUV model, the UV4spectrometer, and the UVM actinic flux spectrometer,
respectively. The similar agreement between the UV4and UVM instruments shows that for these conditions,at least (11% cloud cover mainly near the horizons,
with the sun not obscured by clouds), the conversionfrom spectral actinic flux to spectral irradiance is accu-rate.
The retrieved ozone amount was 287. 286, and 287
DU from the UV4, UVM, and ATI spectrometers, re-spectively. The corresponding erythemally weighted ir-radiance was 19.5, 19.2, and 19.3 PW cm-2.
c. Comparison of erythemally weighted irradiance
The results of the comparison of erythemallyweighted irradiance are shown in Fig. 3. Here, we ex-
press the irradiance in terms of the UV index (UVI =0.4 UVEy measured in ILW cm- 2). The criterion foracceptance here was that the variance of the pyranom-eter signal was less than 5% of the mean for measure-ments over the period of interpolation. For the 62 datapoints that satisfied our acceptance criterion, the meanratio between the two instruments was 1.00, with a stan-dard deviation of 0.027. For the calculation of theseratios, a specific interpolation was applied, becausedata were not measured synchronously and weatherconditions were generally variable with rapidly chang-ing cloud conditions: the interpolation is based on the
temporal changes, as measured with broadband detec-
VoLu?,iE 25950

BLUMTHALER ET AL.
TABLE 1. Summary of ozone and corresponding peak UVI retrievals during the campaign. The ozone data from TOMS are from thesatellite overpass; data from ATI are from measured direct sun spectra; and data from NIWA are from measured global spectra.Dobson data are restricted to direct-sun measurements. The peak UVI is the TOMS UV data product and is measured from the NIWAUV4 spectrometer.
Ozone (DU) Peak UVI
NIWA TOMS ATI direct NIWA global TOMS NIWADay 2004 SZA deg Dobson overpass sun spectra spectra calculation measured
54 35.1 270 261 - - 5.2 -
55 35.4 - 306 - 310 5.6 -56 35.7 281 278 287 287 8.0 8.057 36.0 264 262 271 269 8.8 8.058 36.4 257 247 - 260 7.6 5.859 36.8 - 282 - 277 3.1 5.260 37.2 - 275 - 268 5.2 4.161 37.6 274 268 275 274 6.8 5.662 37.9 288 287 - 270 4.0 -
tors (total irradiance and erythemally weighted UV ir-radiance). The mean and standard deviations of thesedata were available over 1-min intervals. If the varia-tion was too high during the measurement times of bothspectroradiometers, this data point was not used forcomparison- otherwise, the relative variability of theerythemal detector was applied to the spectral inte-grals. Thus, the scatter of the interpolated points wasreduced significantly, while a significant number of datapoints were still included. There is no systematic devia-tion within the dataset. The ratios are independent ofboth the SZA and the absolute value of the signal. Onlythe random scatter increases somewhat for very smallsignals (below I UVI), because the weather conditionswere the worst when the UVI was low, resulting inincreased interpolation uncertainty.
d. Comparisons with model calculations andsatellite-derived values
Retrievals of total column ozone amounts are avail-able from both instruments. A summary of these as wellas corresponding peak-UVI retrievals are given inTable 1. Results derived from satellite are also pro-vided in Table 1.
Generally, the ozone retrievals from the spectrom-eters in this study showed good agreement with theindependent measurements by the NIWA Dobson in-strument (Bodeker et al. 2001) and from the TotalOzone Mapping Spectrometer (TOMS). On day 62, thevalue retrieved from the NIWA spectrometer was 6%less than that from the Dobson or overpass data, butotherwise the agreement was well within the expected2%-3% absolute uncertainties of the reference Dobsoninstruments (Basher 1982).
The peak UVI is taken from the TOMS UV dataproduct and from the NIWA UV4 spectrometer.
The only cloudless day of the campaign was day 57.The peak-UVI values on this day, calculated with theTUV radiative transfer model (Madronich and Flocke1998), are shown in Table 2, for various estimates ofozone and aerosol conditions.
The aerosol conditions [i.e., the Angstrom coeffi-cients (a, 03) and the single scattering albedo coj foreach model run are defined as follows:
UVI(1): a = 1.3, 03 = 0.015, co,, 0.9 (pristine);UVI(2): a = 1.3, 3 = 0.05, co = 0.98 (clean);UVI(3): a = 1.3,/3 = 0.05, os - 0.90 (near clean);
andUVI(4): a = 1.3, 03 = 0.1, wo, - 0.9 (polluted).
The calculated UVI value that is most consistent withthe known input parameters (ozone = 269 DU, a = 1.2,/3 = 0.02; see discussion below) is UVI = 8.5. This resultis consistent with the satellite-derived values (UVI =8.8). The measured values from the two NIWA instru-ments was UVI = 8.0. This is about 5% less than themodel-calculated value, but would be in better agree-ment with the model if the ozone had been at the upperlimit of its uncertainty range or if the single scatteringalbedo of the aerosols were smaller (i.e., aerosols moreabsorbing) than the assumed value of 0.98. Unfortu-
TABLE 2. Values of UVI calculated on day 57 at noon (SZA =36.0°) with the TUV radiative transfer model (Madronich andFlocke 1998) for various assumed model inputs.
Ozone UVI(1) UVI(2) UVI(3) UVI(4)(DU) pristine clean near clean polluted
260 8.9 8.9 8.6 8.3265 8.7 8.7 8.4 8.1270 8.5 8.5 8.2 7.9275 8.3 8.3 8.1 7.8280 8.2 8.1 7.9 7.6
951JuNE 2008

JOURNAL OF ATMOSPHERIC AND OCEANIC TECHNOLOGY
2
0
0
55 56 57 58DAY OF YEAR [UTC]
59 60 61
FiG. 4. Ratios of measured and calculated photolysis rates for periods with stable UV.
nately, the ATI instrument was operating in a differentmode, making sky radiance measurements (see below)during this period. However, the close agreement be-tween the NIWA and ATI instruments at other timesgives confidence that it would also be in agreement withthese model results and satellite retrievals.
4. Comparison of measured actinic flux
The spectral actinic flux measured by each systemwas used to calculate the photolysis rates of ozone andnitrogen dioxide according to the following reactions:
03 + hv(A\ < 310 nm) -> 02 + 0('D),
which has photolysis rate J[O('D)],
N02 + hv(,k < 420 rnm) - NO + 0,
which has photolysis rate J(NO,).
Here, the photolysis rate (V) is defined as
J = fF(l)o-(ýA),() dA,
where F(k) is the actinic flux and tOL) and x(k) are theabsorption cross sections and quantum yields for pho-todissociation, respectively (Molina and Molina 1986;Harder et al. 1997; DeMore et al. 1997).
In each case, the photolysis rates for ozone J[O('D)]and for nitrogen dioxide J(NO 2) were calculated usingthe same cross sections and quantum yields. These twointegrals succinctly summarize the performance of thespectrometers, because J[O('D)] is dominated by
UV-B radiation, whereas J(N0 2) is dominated byUV-A radiation. The results are shown in Fig. 4 (opencircles). For both quantities, the photolysis rates mea-sured by the ATI system were higher than those mea-sured by the NIWA system. For J[O('D)], the ratioATI/NIWA is about 1.11 - 0.04; and in the case ofJ(NO2), the ratio ATI/NIWA is about 1.08 ±t 0.05.Here, the differences are significantly higher than forthe irradiances discussed previously, but the results arestill promising because these measurements are rela-tively new and fewer intercomparisons of these quan-tities are available. Possible reasons for the differencesinclude differences in angular response, which have notbeen accounted for, and uncertainties in the preciselocation of the entrance aperture.
5. Comparison of measured and calculated actinicflux
Photolysis rates were calculated from spectral globalirradiance measurements of ATI using an algorithm de-veloped by Schallhart et al. (2004). The calculated rateswere compared with photolysis rates directly measuredby ATI: ratios of calculated and measured photolysisrates are 0.94 _ 0.04 for J[O('D)] and 0.95 ± 0.05 forJ(NO2). This level of agreement is somewhat worsethan at other measurement sites (Schallhart et al. 2004).However, it may be affected by the relative small num-ber of data points.
Ratios of calculated photolysis rates by ATI andmeasured photolysis rates by NIWA are 1.03 ± 0.05 for
0.4 ATI-calc/NIWA-meas
1.15 -O..0 0 ATI-meas/NIWA-reas
1.05- - - I_+ 0
0.95
0.9 _ , I , , , ,55 56 57 58 59 60 61
4 ATI-calc/NIWA-meas1.15 - - 0 ATI-meas/NIWA-meas
1.1 0 C
1.05-- --- --+.
0.95
no II
952 VOLUME 25

BLUMTHALER ET AL.
0
0
55 56 57 58DAY OF YEAR [UTC]
. NIWA-ca1c/NIWA--eas
444
J ......
59 60 61
FIG. 5. Ratios of measured and calculated photolysis rates for the NIWA instrument forperiods with stable UV.
J[O('D)] and 1.01 ± 0.05 for J(NO2). The ratios ofphotolysis rates measured by each instrument (ATI/NIWA; Fig. 4, circles) are closer to unity than the ratiosfor measured/model comparison (Fig. 4, crosses). Thiscould possibly indicate that the ATI measurements areslightly high. But, on the other hand, a comparison ofthe calibration of the actinic entrance optics of ATI inthe laboratory in Innsbruck before and after the cam-paign in New Zealand showed agreement on the 2%level. Thus, it is not clear how this difference for theratio "calculated by ATI/measured by ATI" on the or-der of about 5% can be explained.
The corresponding measured/calculated ratios forthe photolysis rates from the NIWA algorithm gener-ally give values close to one (Fig. 5), but the scatter ishigher (10%-20%) and there are groups of data with aratio of about 1.3. These groupings are probably due tothe bimodal way in which clouds are treated in thisalgorithm. If the calculated transmission is less than acertain threshold (T- < 0.5), the algorithm assumes thatthe sun is obscured and that the radiation field is com-pletely diffuse and isotropic. If the transmission isabove the threshold, the diffuse and direct componentsare treated separately, with their ratio being estimatedusing a radiative transfer model.
6. Direct sun measurements
With the ATI spectroradiometer, spectral scans ofthe direct solar irradiance were carried out during time
periods when the sun was not obscured by clouds. Dur-ing the whole campaign of 8 full-measurement daysthis was possible only on 3 days (days 56, 57, and 61).Then, from the direct sun spectra, the total ozoneamount and the aerosol optical depth as a function ofwavelength were calculated. Total ozone varied be-tween 287 and 271 DU, which are about 5 DU higherthan those measured with the Dobson instrumentoperated at the measurement site. This correspondsto the known uncertainty of the method of deriva-tion of ozone from absolute direct sun spectra and isa consequence of unknown details as temperatureprofile, vertical distribution, and absorption cross sec-tions.
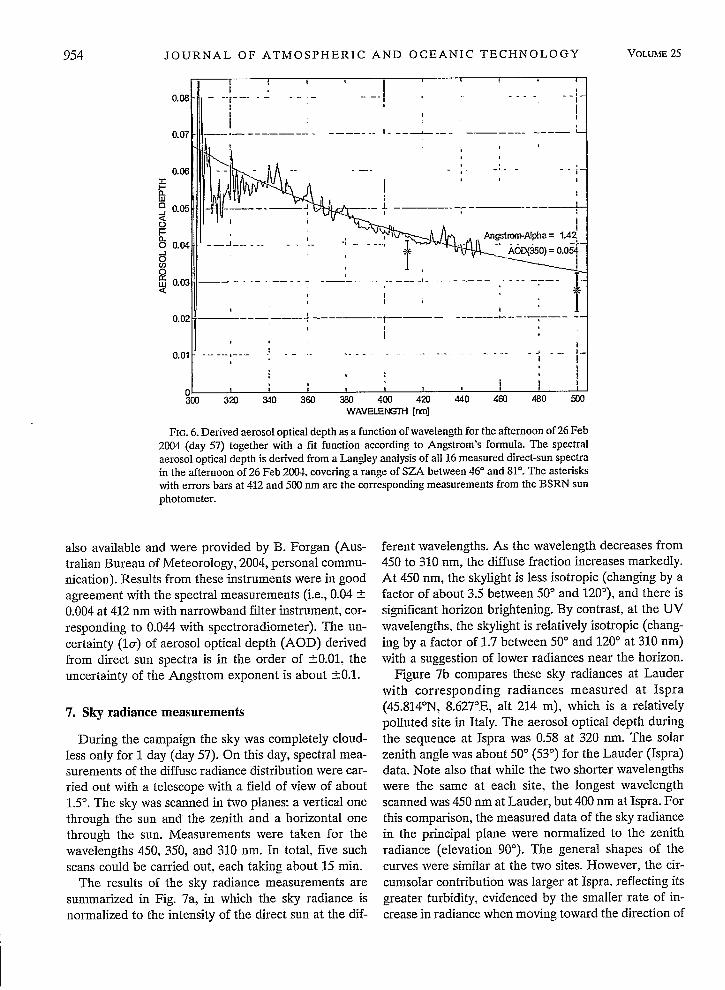
The derived aerosol optical depth and its wavelengthdependence on 26 February 2004 (day 57) are shown inFig. 6. On this day, the wavelength dependence of theaerosol extinction (a) was 1.42. The optical depth at 350nm was 0.054, so the deduced optical depth at 1 Lm (03)is about 0.01. Throughout the campaign the aerosol op-tical depth at 350 nm varied between 0.04 and 0.09 andthe Angstrom exponent derived for the wavelengthrange 320 to 450 nm varied between 1.0 and 1.5. Thecorresponding optical depths at 1 ttm (P3) thereforeranged from less than 0.01 to about 0.02. This meansthat during the campaign the amount of aerosols was aslow, as is typical for this site (Liley 2006). Independentmeasurements with narrowband sun photometers,which are permanently located at the site as part of theBaseline Surface Radiation Network (BSRN), were
1.4
1
.... . -- .. 4 NIWA-ca:c/N:WA--ea s
4-*.. . .. . . -. . .. .-. .1.2 - .-...
'i4
- - *i +A ... -- - _: .'4-+
, -
T
55 56 57 58 59 60 61
0.8
1.4
1.2
1
0.8
953JuNF_2008
3
JOURNAL OF ATMOSPHERIC AND OCEANIC TECHNOLOGY
0.08!
0.07V1i. -
0.1
F-
0.1tU
F-0 0.1_jI--
0ci)
LLJ 0.1
0.02
0.01
300 320 340 360 380 400 420 440 460WAVELENGTH [rim]
480 500
FIG. 6. Derived aerosol optical depth as a function of wavelength for the afternoon of 26 Feb
2004 (day 57) together with a fit function according to Angstrom's formula. The spectral
aerosol optical depth is derived from a Langley analysis of all 16 measured direct-sun spectrain the afternoon of 26 Feb 2004. covering a range of SZA between 46' and 81'. The asteriskswith errors bars at 412 and 500 nm are the corresponding measurements from the BSRN sunphotometer.
also available and were provided by B. Forgan (Aus-tralian Bureau of Meteorology, 2004, personal commu-nication). Results from these instruments were in goodagreement with the spectral measurements (i.e., 0.04 t0.004 at 412 nm with narrowband filter instrument, cor-responding to 0.044 with spectroradiometer). The un-certainty (Io-) of aerosol optical depth (AOD) derivedfrom direct sun spectra is in the order of ±0.01, theuncertainty of the Angstrom exponent is about ±0.1.
7. Sky radiance measurements
During the campaign the sky was completely cloud-less only for 1 day (day 57). On this day, spectral mea-surements of the diffuse radiance distribution were car-ried out with a telescope with a field of view of about1.50. The sky was scanned in two planes: a vertical onethrough the sun and the zenith and a horizontal onethrough the sun. Measurements were taken for thewavelengths 450, 350, and 310 nm. In total, five suchscans could be carried out, each taking about 15 min.
The results of the sky radiance measurements aresummarized in Fig. 7a, in which the sky radiance isnormalized to the intensity of the direct sun at the dif-
ferent wavelengths. As the wavelength decreases from450 to 310 un, the diffuse fraction increases markedly.At 450 rmn. the skylight is less isotropic (changing by afactor of about 3.5 between 50' and 120'), and there issignificant horizon brightening. By contrast, at the UVwavelengths, the skylight is relatively isotropic (chang-ing by a factor of 1.7 between 500 and 1200 at 310 mn)with a suggestion of lower radiances near the horizon.
Figure 7b compares these sky radiances at Lauderwith corresponding radiances measured at Ispra(45.814'N, 8.627°E, alt 214 m), which is a relativelypolluted site in Italy. The aerosol optical depth duringthe sequence at Ispra was 0.58 at 320 un. The solarzenith angle was about 500 (530) for the Lauder (Ispra)data. Note also that while the two shorter wavelengthswere the same at each site, the longest wavelengthscanned was 450 nm at Lauder, but 400 nm at Ispra. Forthis comparison, the measured data of the sky radiancein the principal plane were normalized to the zenithradiance (elevation 90'). The general shapes of thecurves were similar at the two sites. However, the cir-cumsolar contribution was larger at Ispra, reflecting itsgreater turbidity, evidenced by the smaller rate of in-crease in radiance when moving toward the direction of
-M Angstr...pha= 1.4* 1*'. AD(350) =0.054'
S-
-- -- I--- -
I I01 1 1
VoLuNm 25954

BLUMTHALER ET AL.
(a) 3.t:x
3-
2.5--
2
o1.5
0.5[
00
(b)
7-
6-
0 4
£3
0
4--
w
8
S0
.U'
3-
S2.5-
o 2--
ii.
z0
20 40 60 80 100 120 140 160ELEVATION I-]
lauder, ,3 1 30n
-. spra, IT, 350 nm_m" • • I I I
I• .. 4 i i I IS.. . -p....---•--•.- -• --- -. -... "-- ---- --------.... • -'--,"-:----
20 40 60 80 100 120 140 160 1ELEVATION [r]
20 40 60 80 100 120 140 160ELEVATION r]
180
180
FIG. 7. (a) Sky radiances normalized to the irradiance of the direct sun throughthe vertical plane containing the sun at three wavelengths as a function of elevationangle (angle measured from the horizon at the side of the sun). The scan was takenon day 57 at about 1010 NZST with SZA=50'. (b) Comparison between Lauderand Ispra. The three plots show the radiances at Lauder (450, 350, 310 nm) andIspra (400, 350, and 310 am), normalized to the zenith sky radiance. Note that thelongest wavelengths (top) were not identical. There are also slight differences in theSZA of the scans.
955JuNE 2008
ELEVATION P]
-Lauder, NZ, 450 rnma--- -:Espra, IT, 400 nm
I ___ ___
__ I __ _. . . • .. .... - - . i - . . - - r --!-'. . ..
Lauder, HZ 310 7m-- -ispra, 37, 310 nm
-IFN . ..i. ...,......i....... ........ ....

JOURNAL OF ATMOSPHERIC AND OCEANIC TECHNOLOGY
0.7
0.4 1 1["_ __~~~0.5 1
0.4--- 1-1I,-0.3 T +
+ +* 01 ~
++\++__ _____ _____ _____
1 20 40 60 80 100ELEVATION r]
120 140 160 180
FIG. 8. The degree of polarization at 350 rm as a function of elevation angle (angle mea-sured from the horizon at the side of the sun) for the conditions shown in Fig. 6. The solid lineis a model calculation, and the asterisks are the measured values.
the sun. The horizon brightening was more pronouncedat Lauder, as a consequence of less attenuation by aero-sols.
After each measurement of sky radiance, the polar-ization of diffuse sky radiance was also measured. Forthis purpose, a polarization filter was put in front of thesky radiance optics and at each point on the sky thispolarization filter was rotated 4 times by 45'. Fromthese measurements, the degree and the direction ofpolarization in the two planes on the sky for the threewavelengths 450, 350, and 310 nm could be derived.These measurements are compared with model calcu-lations with the libRadtran model (Mayer and Kylling2005), assuming an aerosol-free atmosphere. In Fig. 8.qualitatively, the general features are well reproducedby the model. The agreement between modeled andmeasured polarizations is satisfactory for elevationangles close to the solar elevation angle (SZA about450). However, there appears to be a small step in theimmediate vicinity on either side of the sun (aroundelevation angle 50'), probably caused by the small dif-ference in time between the measurements. The agree-ment becomes poorer when the elevation angle in-creases toward the zenith, and especially when the an-gular distance from the sun approaches 90'. For theseangles, the measured polarization is only -80% of thatcalculated. The difference cannot be explained by the
small amount of aerosols present. At the moment, noexplanation for this difference between measurementand modeling can be given. A new version of the modelfor calculating polarization effects including aerosols isin preparation, and this might possibly reduce the dif-ferences.
8. Conclusions
During a campaign at Lauder. New Zealand, spectralsolar radiation fluxes were compared over 7 days be-tween two completely independently calibrated spec-troradiometer systems. Individual measurements ofglobal irradiance showed differences of less than 5%,whereas the spectrally averaged ratio was almost ex-actly matching. Also, the average ratio (62 data points)of erythemally weighted irradiance was almost per-fectly at 1.0 with a standard deviation of 2.7%. Thisvery good result is also in agreement with the compari-son of the two calibration lamps. which agreed on the1% level. For actinic flux, the agreement between thetwo systems was not as good, with deviations of about10% for the photolysis rate for ozone and about 7% fornitrogen dioxide. This might indicate that the absolutecalibration and the angular response of this type of de-tector are not yet fully characterized. The derivation ofactinic flux from global irradiance showed for different
z0
(L0
0~ulOily0
0
956 VOLUME 25

BLUMTHALER ET AL.
methods agreement better than 10%, which is expectedfrom the uncertainties of the individual methods. Thequality of the calibration of spectral direct sun measure-ments was proven indirectly by comparing the derivedaerosol optical depth with measurements from standardinstruments used within the Baseline Surface RadiationNetwork. When the aerosol optical depth at 350 nm wasabout 0.054, which is typical for the very clean air at themeasurement site at Lauder, the difference betweenthe results of the two methods was less than 0.01. Thisis a very satisfying result, justifying the usage of thederived values of aerosol optical depth in radiativetransfer calculations to compare the measurementswith results of the model calculations.
Measurements of sky radiance under situations withhigh and low amounts of aerosols show at the pollutedsite less pronounced brightening of the horizon andrelative higher levels near the sun (up to about 40' fromthe position of the sun). The additional measurementsof polarization of sky radiance provide a unique oppor-tunity to verify model calculations under pristine con-ditions at a relatively low altitude, where polarization isdominated by Rayleigh scattering and only marginallyaffected by aerosols.
REFERENCES
Bais, A. F., and Coauthors, 2001: SUSPEN intercomparison ofultraviolet spectroradiometers. J. Geophys. Res., 106, 12 509-12526.
-, and Coauthors, 2007: Surface ultraviolet radiation: Past,present, and future. WMO Scientific Assessment of OzoneDepletion: 2006, World Meteorological Organization, GlobalOzone Research and Monitoring Project-Rep. No. 55, 58pp.
Basher, R. E., 1982: Review of the Dobson spectrophotometerand its accuracy. World Meteorological Organization, GlobalOzone Research and Monitoring Project-Rep. No. 13, 90pp-
Bodeker, G. E., J. C. Scott, K. Kreher, and R. L. McKenzie, 2001:Global ozone trends in potential vorticity coordinates usingTOMS and GOME intercompared against the Dobson net-work: 1978-1998. J. Geophys. Res., 106, 23 029-23 042.
DeMore, W. B., and Coauthors, 1997: Chemical kinetics and pho-tochemical data for use in stratospheric modeling: Evaluationnumber 12. JPL Publication 97-4, NASA Panel for DataEvaluation, 278 pp.
Gr6ibner, J., and M. Blumthaler, 2007: Experimental determina-tion of the reference plane of shaped diffusers by solar ultra-violet measurements. Opt. Lett., 32, 80-82.
Harder, J. W., J. W. Brault, P. V. Johnston, and G. H. Mount,1997: Temperature dependent NO 2 cross sections at highspectral resolution. J. Geophys. Res., 102, 3861-3879.
Harrison, N. J., N. J. Woolliams, and N. P. Fox, 2000: Evaluationof spectral irradiance transfer standards. Metrologia, 37, 453-456.
Huber, M., M. Blumthaler, and W. Ambach, 1993: A method fordetermining the wavelength shift for measurements of solar
UV radiation. Atmospheric Radiation, K. H. Stamnes, Ed.(SPIE Proceedings, Vol. 2049), 354-357.
-, -. - , and J. Staehelin, 1995: Total atmospheric ozonedetermined from spectral measurements of direct solar UVirradiance. Geophys. Res. Lett., 22, 53-56.
Liley, J. B., 2006: Global dimming, clouds and aerosols. UV Ra-diation and Its Effects: An Update, Royal Society of NewZealand, Misc. Series 68, 14-15.
Madronich, S., and S. Flocke, 1998: The role of solar radiation inatmospheric chemistry. Handbook of Environmental Chem-istry, P. Boule, Ed., Springer-Verlag, 1-26.
Mayer, B., and A. Kylling, 2005: Technical note: The libRadtransoftware package for radiative transfer calculations-Description and examples of use. Atmos. Chem. Phys., 5,1855-1877.
McKenzie, R. L., P. V. Johnston, M. Kotkamp, A. Bittar, andJ. D. Hamlin, 1992: Solar ultraviolet spectroradiometry inNew Zealand: Instrumentation and sample results from 1990.Appl. Opt., 31, 6501-6509.
-- , M. Kotkamp, G. Seckmeyer, R. Erb, C. R. Roy, H. P. Gies,and S. J. Toomey, 1993: First Southern Hemisphere inter-comparison of measured solar UV spectra. Geophys. Res.Lett., 20, 2223-2226.
-, P. V. Johnston, and G. Seckmeyer, 1997: UV spectro-radiometry in the network for the detection of stratosphericchange (NDSC). Solar Ultraviolet Radiation: Modelling, Mea-surements and Effects, C. S. Zerefos and A. F. Bais, Eds.,Springer-Verlag, 279-287.
-, B. J. Connor, and G. E. Bodeker, 1999: Increased summer-time UV observed in New Zealand in response to ozone loss.Science, 285, 1709-1711.
-- , G. Seckmeyer, A. F. Bais, J. B. Kerr, and S. Madronich,2001: Satellite retrievals of erythemal UV dose comparedwith ground-based measurements at northern and southernmidlatitudes. J. Geophys. Res., 106, 24 051-24 062.
-, J. Badosa, M. Kotkamp, and P. V. Johnston, 2005: Effects ofthe temperature dependence in PTFE diffusers on observedUV irradiances. Geophys. Res. Lett., 32, L06808, doi:10.1029/2004GL022268.
-, G. E. Bodeker, G. Scott, and J. Slusser, 2006: Geographicaldifferences in erythemally-weighted UV measured at mid-latitude USDA sites. Photochem. Photobiol. Sci., 5,343-352.
Molina, L. T., and M. J. Molina, 1986: Absolute absorption crosssections of ozone in the 185- to 350-nm wavelength range. J.Geophys. Res., 91, 14 501-14 508.
Schallhart, B., A. Huber, and M. Blumthaler, 2004: Semi-empirical method for the conversion of spectral UV globalirradiance data into actinic flux. Atmos. Environ., 38, 4341-4346.
Schreder, J. G., M. Blumthaler, and M. Huber, 1998: Design of aninput optic for solar UV-measurements. Protection againstthe Hazards of UVR, Internet Photochemistry and Photobi-ology. [Available online at http:/iwww.photobiology.com/UVR98/schreder/index.htm.j
Seckmeyer, G., and R. L. McKenzie, 1992: Increased ultravioletradiation in New Zealand (45°S) relative to Germany (48°N).Nature, 359, 135-137.
--- , and Coauthors, 1995: Geographical differences in the UVmeasured by intercompared spectroradiometers. Geophys.Res. Lett., 22, 1889-1892.
Stamnes, K., J. Slusser, and M. Bowen, 1991: Derivation of total
JUNE 2008 957

JOURNAL OF ATMOSPHERIC AND OCEANIC TECHNOLOGY
ozone abundance and cloud effects from spectral irradiancemeasurements. AppL Opt., 30, 4418-4426.
Walker, J. H., R. D. Saunders, J. K. Jackson, and K. D. Mielenz,1991: Results of a CCPR intercomparison of spectral irradi-ance measurements by national laboratories. J. Res. Natl.Inst. Stand. TechnoL, 96, 647-668.
Woolliams, E. R., N. P. Fox. M. G. Cox. P.M. Harris, and N. J.Harrison, 2006: The CCPR K1-A key comparison of spec-
tral irradiance from 250 am to 2500 nm: Measurements.analysis and results. Metrologia, 43, S98-S104.
Wuttke, S., G. Bernhard, J. C. Ehramjian, R. McKenzie, P.Johnston, M. O'Neill, and G. Seckmeyer. 2006: New spec-trometers complying with the NDSC standards. J. Atnos.Oceanic TechnoL, 23, 241-251.
Ylianttila, L.. and J. Schreder, 2005: Temperature effects on PTFEdiffusers. J. Opt. Mater., 27, 1811-1814.
958 VOLUME 25

COPYRIGHT INFORMATION
TITLE: Spectral UV Measurements of Global Irradiance, SolarRadiance, and Actinic Flux in New Zealand:Intercomparison between Instruments and ModelCalculations
SOURCE: J Atmos Ocean Tech 25 no6 Je 2008
The magazine publisher is the copyright holder of this article and itis reproduced with permission. Further reproduction of the article inviolation of the copyright is prohibited.